the Creative Commons Attribution 4.0 License.
the Creative Commons Attribution 4.0 License.
 | 16 Aug 2023
Spectral dependence of birch and pine pollen optical properties using a synergy of lidar instruments
Ari Leskinen
Ville Vakkari
Ewan O'Connor
Minttu Tuononen
Pekko Tuominen
Samuli Laukkanen
Linnea Toiviainen
Annika Saarto
Xiaoxia Shang
Petri Tiitta
Mika Komppula
Active remote sensors equipped with the capability to detect polarization, a shape-relevant parameter, are essential to aerosol particle identification in the vertical domain. Most commonly, the linear particle depolarization ratio has been available at the shorter wavelengths of 355 and/or 532 nm. Recently, linear particle depolarization ratios at longer wavelengths (910, 1064, and 1565 nm) have emerged in lidar aerosol research. In this study, a synergy of three lidars, namely a PollyXT lidar, a Vaisala CL61 ceilometer, and a HALO Photonics StreamLine Pro Doppler lidar, as well as in situ aerosol and pollen observations have been utilized to investigate the spectral dependence of birch and pine pollen particles. We found that, regardless of the pollen type, the linear particle depolarization ratio was subject to the amount of pollen and its relative contribution to the aerosol mixture in the air. More specifically, during birch pollination, characteristic linear particle depolarization ratios of 5 ± 2 % (355 nm), 28 ± 6 % (532 nm), 23 ± 6 % (910 nm), and 33 ± 4 % (1565 nm) were retrieved at the pollen layer. Regarding the pine-dominant period, characteristic linear particle depolarization ratios of 6 ± 2 %, 43 ± 11 %, 22 ± 6 %, and 26 ± 3 % were determined at wavelengths of 355, 532, 910, and 1565 nm, respectively. For birch, the linear particle depolarization ratio at 1565 nm was the highest, followed by the 532 and 910 nm wavelengths, respectively. A sharp decrease at 355 nm was evident for birch pollen. For pine pollen, a maximum at the 532 nm wavelength was observed. There was no significant change in the linear particle depolarization ratio at 910 nm for the pollen types considered in this study. Given the low concentration of pollen in the air, the inclusion of the longer wavelengths (910 and 1565 nm) for the detection of birch and pine can be beneficial due to their sensitivity to trace large aerosol particles.
- Article
(2711 KB) - Full-text XML
- BibTeX
- EndNote


Pollen, a major mass contributor of atmospheric primary bioaerosols during pollination at the higher latitudes of the Northern Hemisphere (Manninen et al., 2014; Williams and Després, 2017), is closely associated with allergic diseases (Kitinoja et al., 2020). The ongoing allergic disease increment in the population (Pawankar et al., 2008) is projected to further double by 2040–2060 in Europe alone (Lake et al., 2018), pacing pollen as one of the most important consequences of climate change for human health (Beggs, 2015). Alteration of pollen season timing and load is not only triggering allergy-related symptoms but can also potentially alter the climate. Although the direct radiative effect of pollen is likely small at the global scale due to the low particle number concentration (Löndahl, 2014), its indirect effect is potentially relevant. Several studies have demonstrated that pollen is moderately hygroscopic, acting as cloud condensation nuclei (CCN) under very low supersaturation (Pope, 2010; Griffiths et al., 2012; Prisle et al., 2019; Mikhailov et al., 2019). Pope (2010) suggested that intact pollen grains act as giant CCNs in cloud processing. In a laboratory study, Steiner et al. (2015) hypothesized that sub-micron sub-pollen particles (SPPs) are more likely to contribute to cloud processing compared with intact pollen grains. They concluded that SPPs can be a global CCN contributor depending on their concentration. Using an atmospheric pollen grain rupture model, Wozniak et al. (2018) simulated an approximate 30 % suppression of seasonal precipitation in the presence of SPPs under clean continental aerosol conditions. In addition to their CCN activity, intact pollen grains and pollen grain fragments are effective ice nuclei (IN), with the ability to form ice crystals at warm subfreezing temperatures (Diehl et al., 2001, 2002; Pummer et al., 2012; Hader et al., 2014; Dreischmeier et al., 2017; Gute et al., 2020; Burkart et al., 2021). Consequently, monitoring the pollen concentration and its distribution in the atmosphere is essential.
Continuous monitoring of pollen near ground level is usually performed using Hirst-type volumetric air samplers (Buters et al., 2018). Although, these instruments serve as the reference system in pollen monitoring, they cannot fulfil the high demand for real-time or near-real-time information, and they are very labour-intensive. Promising novel instrumentation has emerged in pollen detection and has enabled the automated and continuous monitoring of pollen. These techniques utilize either image recognition (Sauvageat et al., 2020; Oteros et al., 2020) or the fluorescence spectra (Crouzy et al., 2016; Saito et al., 2018; Richardson et al., 2019). However, systematic information on the vertical distribution and optical properties of pollen is not possible using most of the aforementioned approaches. Inclusion of the vertical information is not only essential for aerosol identification algorithms but also for model verification and assimilation studies.
Lidars have been increasingly utilized to study pollen optical properties, as the non-spherical shape of pollen induces strong laser depolarization. The first evidence of the capability of lidar to sense pollen dates back to 2008: Sassen (2008) reported a linear particle depolarization ratio (PDR) of 30 % at a wavelength of 694 nm in plumes of paper birch (Betula papyrifera) in Alaska, USA. Noh et al. (2013a, b) studied the diurnal variability and the vertical distribution of pollen, coupling higher PDR values to higher pollen number concentrations around noon. Using a micro pulse lidar at 532 nm, Sicard et al. (2016) observed a diurnal mean (hourly maxima) PDR of 14 (33) % in a mixture of plane (Platanus), pine (Pinus), and cypress (Cupressaceae) pollen in Barcelona, Spain. In recent studies, multi-wavelength high-power lidars have shed further light on pollen optical properties. Using the Raman lidar technique, Bohlmann et al. (2019) retrieved mean lidar ratios (LRs) of 45 ± 7 sr (355 nm) and 55 ± 16 sr (532 nm) in aerosol layers with birch presence in Finland. It became evident that, in order to characterize the pure pollen optical properties, the contribution of other aerosol types has to be constrained as well. To this end, Shang et al. (2020, 2022) proposed a methodology to estimate the pollen PDR using the backscatter-related Ångström exponent (BÅE), assuming that pollen particles induce a BÅE of 0 ± 0.5 due to their large size. They estimated the PDRs of pure pollen particles at 532 nm to be 24 ± 4 % and 36 ± 1 % for silver birch (Betula pendula) and Scots pine (Pinus sylvestris), respectively. No significant wavelength dependence in the LR was observed at wavelengths of 355 or 532 nm, with values ranging between 55 and 70 sr. The spectral dependence of the pollen PDR was reported in the recent work of Bohlmann et al. (2021). Using a synergy of a multi-wavelength lidar and a Doppler lidar, a strong decrease in the PDR at 355 nm was observed compared with the longer wavelengths of 532 and 1565 nm, marking the importance of two (or more) polarization wavelengths for pollen identification. Veselovskii et al. (2021, 2023) demonstrated that a combination of the PDR and fluorescence spectra can be utilized in aerosol classification schemes to distinguish bioaerosols. As far as laboratory-based pollen optical properties are concerned, Cao et al. (2010) measured the PDR of various pollen types at four wavelengths (355, 532, 1064, and 1570 nm). They showed that each pollen type has a specific signature, and this can be used to distinguish bioaerosols in the atmosphere. The latest studies of Cholleton et al. (2022a, b) concluded that a difference in the scattering angle of just 2.5∘ (from 177.5 to 180∘) induces a substantial relative error in the pollen PDR that ranges from 20 % to 40 %.
To this end, the majority of atmospheric lidar studies have reported the observed PDR for a narrow range of pollen concentrations and/or mixtures of different pollen types, focusing mainly on case studies. As the value of the PDR in the presence of non-spherical or inhomogeneous particles depends on the amount of particles, the complexity of the particle shape (including its orientation), and the particle size relative to the wavelength, its value can greatly fluctuate depending on the aerosol population. Therefore, both the amount and the relative share of pollen compared with the rest of the aerosols in the volume have to be considered. In this study, 2 years of pollen observations, 1 year with an exceptionally high pollen concentration and 1 year with a moderate one, were utilized to constrain the characteristic optical properties of birch (Betula) and Scots pine (Pinus sylvestris). We present the wavelength dependence of the aforementioned pollen types considering co-located observations from three lidar instruments, namely, a PollyXT lidar, a CL61 ceilometer, and a HALO Photonics Streamline Pro Doppler lidar, all equipped with polarization capability. Combined with in situ pollen and aerosol observations, the characteristic pollen PDR and equivalent BÅE for each pollen type were determined.
Two field campaigns were conducted during 2021 and 2022 at the forest site of Vehmasmäki (Kuopio), Finland (62∘44′ N, 27∘33′ E; 190 m above sea level). The rural station is surrounded by broad-leaved and coniferous trees. Birch (Betula), Scots pine (Pinus sylvestris), alder (Alnus), nettle (Urtica), and Norway spruce (Picea abies) are the dominant pollen types; nonetheless, their concentration can greatly vary from one year to another. On site, a multi-wavelength PollyXT lidar, a Vaisala CL61 ceilometer, a HALO Photonics Streamline Pro Doppler lidar, and various in situ instruments for aerosol characterization as well as meteorological quantities from a 318 m tall mast were available. Furthermore, a Hirst-type volumetric air sampler was deployed to measure the concentration of pollen during the pollination period, which usually lasts from March to August, each year.
2.1 The PollyXT lidar
The multi-wavelength PollyXT lidar (Engelmann et al., 2016) enables the determination of the particle backscatter coefficient at three wavelengths (355, 532, and 1064 nm) and the volume depolarization ratio (VDR) and PDR at two wavelengths (355 and 532 nm). Additionally, extinction coefficients at 355 and 532 nm are available during night-time using the Raman technique. Using the 407 nm Raman-shifted wavelength, water vapour mixing ratio profiles can be also retrieved during dark hours (Filioglou et al., 2017). Apart from the far-field telescope, PollyXT features a near-field unit retaining full overlap at about 120 m. Data are recorded with a vertical resolution of 7.5 m and a temporal resolution of 30 s. Further details on the instrument, its operating principle, and uncertainties can be found in Baars et al. (2012) and Engelmann et al. (2016).
2.2 The Vaisala CL61 ceilometer
The Vaisala CL61 ceilometer uses a pulsed laser diode at 910.55 nm to emit light towards the atmosphere. The single-channel lidar uses an alternating polarizing sheet filter which enables the retrieval of the attenuated backscatter coefficient and VDR/PDR. Full overlap is obtained at about 300 m. Profiles are available at a temporal resolution of 5 s (for the attenuated backscatter coefficient) and 10 s (for the VDR) and a vertical resolution of 4.8 m.
2.3 The HALO Photonics StreamLine Pro Doppler lidar
The HALO Photonics StreamLine Pro Doppler lidar (Pearson et al., 2009) operates at a 1565 nm wavelength. The lidar can retrieve information down to 90 m a.g.l. (above ground level). It is equipped with a cross-polar receiver channel, enabling the determination of the PDR at the same wavelength (Vakkari et al., 2021). The lidar has a vertical resolution of 30 m. Further operating specifications can be found in Vakkari et al. (2021).
2.4 Hirst-type volumetric air sampler
Sampling of airborne pollen was performed at 4 m a.g.l. using a Hirst-type volumetric air sampler (Hirst, 1952). The instrument samples air with a flow rate of 10 L min−1. Aerosol particles impact onto a sticky tape mounted on a rotating drum with a 7 d cycle; the tape is later divided into 24 h segments and analysed offline using light microscopy on 48 randomized fields with 400× magnification. An accuracy of 2 h is obtained with this sampling and analysis methodology. The main sources of error for this instrument are variations in flow rate, the counting method, and the different mounting media. Although these sources have been addressed and constrained, a recent study has shown that discrepancies between samplers are about 16 % when the pollen concentration is above 10 grains m−3 and further increases for lower pollen concentrations (Adamov et al., 2021).
2.5 Aerosol in situ observations
Samples for measuring the aerosol particle size distribution were taken at 5 m a.g.l. and delivered via a stainless-steel line (3 m long, 8 mm inner diameter) to a NanoScan scanning mobility particle sizer (NS; Model 3910) and an optical particle sizer (OPS; Model 3330), both manufactured by TSI Incorporated. The respective inlet flow and measurement particle size range were 0.8 L min−1 and 10–420 nm (mobility diameter) with 13 size bins for the NS, whereas they were 1.0 L min−1 and 0.3–10 µm (optical diameter) with 16 size bins for the OPS. The time resolution for both instruments was 1 min.
Moreover, the black carbon (BC) concentration and aerosol light scattering coefficient were measured with a Magee Scientific Aethalometer (AE; Model AE-31) and a TSI nephelometer (NM; Model 3563), respectively. The AE outputs the BC concentration at seven wavelengths between 370 and 950 nm, which can be then converted to aerosol absorption coefficients. The NM outputs the aerosol scattering coefficient at wavelengths of 450, 550, and 700 nm. The time resolution for both instruments is 5 min. Regarding the NM data analyses, a correction for the truncation error using the no-cut regime was applied, as in Anderson and Ogren (1998). The AE data were corrected for filter loading and multiple scattering, following the methodology of Leskinen et al. (2020), using a long-term average correction factor of 4.75 at 880 nm for the multiple scattering at the Vehmasmäki station.
2.6 Methodology
Considering that the Hirst-type volumetric air sampler presents the coarsest temporal resolution, observations from all other instruments were temporally averaged to match the 2 h resolution of the pollen sampler. In this study, we argue that the PDR can fluctuate depending on the amount of pollen and other aerosols in the aerosol mixture. In order to calculate the share of pollen to other aerosols, we have converted the pollen and aerosol number concentration derived from the pollen sampler and in situ instruments to particulate matter (PM). The mass is a more comparable quantity for the lidar technique than the number concentration. For the conversion of the pollen particles from the pollen sampler, particle diameters of 25 and 75 µm and particle densities of 0.8 and 0.4 g cm−3 were considered for birch and pine pollen, respectively (Gregory, 1973).
To calculate the share of other aerosols in the aerosol mixture, the mass concentration of particles with a diameter of 10 µm or less (PM10) was estimated using the in situ aerosol observations. In order to so do, the NS and OPS aerosol size distributions were combined. The last two bins of the NS aerosol size distribution and the first bin of the OPS aerosol size distribution were neglected due to observed inaccuracies in the data. The optical diameters applied in the OPS, calibrated with polystyrene latex particles with a refractive index of 1.59–0.00i, were converted to geometric mean volume equivalent diameters following the procedure in Alas et al. (2019) and by using a long-term average refractive index of 1.46–0.009i at the Vehmasmäki station. This long-term average was obtained from matching Mie-calculated scattering and absorption coefficients to those measured with the NM and AE instruments. The measured number aerosol size distributions were then converted to volume aerosol size distributions assuming that all particles are spherical. The individual volume aerosol size distributions from NS and OPS instruments were then combined to one. The values for the missing size bins in the merging region between the NS and OPS instruments were calculated by fitting a lognormal size distribution to each measured size distribution. The final volume size distribution, which had 31 size bins, was then multiplied by a size-independent particle density of 1.6 g cm−3 and integrated between 0.01 and 10 µm in order to estimate the mass concentration of PM10.
Regarding the retrieval of the optical profiles from the PollyXT lidar, the backward Klett inversion (Klett, 1981) was applied to the 2 h temporally averaged signals. Unless otherwise indicated by the Raman retrieval, LRs between 55 and 65 sr were utilized (Bohlmann et al., 2019; Shang et al., 2020). Considering the near-field capability and the vertical smoothing, profiles down to 400 m a.g.l. were considered. Below this height, all retrieved optical properties were assumed constant and equal to the value at 400 m. This was necessary in order not to bias the mean optical properties of the first layer, which is presumed to contain the pollen particles. Note that, due to an overlap issue in the 355 nm far-range channel, reliable profiles at this wavelength for the PDR were limited to 800 m a.g.l. To ensure high-quality PDR retrievals, the instrument performs the Δ90∘ calibration method (Freudenthaler, 2016) three times a day; therefore, calibration factors were readily available. To correlate the vertically retrieved lidar optical properties to surface observations, we computed the mean lidar aerosol optical properties of the first detected layer. The geometrical boundaries of the first layer expanded from the surface all the way up to the top of the boundary layer (BL). In order to detect the upper boundary of the BL, the derivative of the range-corrected signal at 1064 nm was considered (Menut et al., 1999). The inflection point (second derivative is zero) indicated the BL top. Within this layer, the variation in optical properties may largely fluctuate. This is subject to the aerosol amount, type, and distribution as well as the height of the BL. In order to reduce the uncertainty introduced by these factors at the top of the geometrical layer, we have removed height bins with a value lower than 25 % from the mean value of the layer. This feature was mainly present at the shorter wavelengths towards the top of the BL, in which the optical properties were effectively changing.
A similar procedure was followed for the retrieval of the optical profiles from CL61 ceilometer. The forward Klett inversion (Wiegner and Gasteiger, 2015) was applied to the 2 h temporally averaged signals using a constant LR of 60 sr. In this way, the retrieval is possible under low-cloud conditions, broadening the applicability of the lidar to retrieve aerosol information within the BL. The stratocumulus cloud technique was used to determine the value of the calibration factor and its inter-annual variability (O'Connor et al., 2004; Hopkin et al., 2019). The Finnish Meteorological Institute operates five CL61 units, and tests have shown that the factory calibration is within 15 % with respect to accuracy. Two out of five CL61 instruments located above 65∘ N latitude exhibit an inter-annual discrepancy of 3 %–5 % from the factory calibration. Further discrepancies at the southern stations, including the one in this study, may emerge from the water vapour amount or/and a range of possible multiple-scattering factors bound to the selection of the cloud cases themselves. Therefore, both a water vapour correction and an adequate calibration correction applied to the signals. For the water vapour correction, the methodology described in the study of Wiegner and Gasteiger (2015) was applied. Regarding the calculation of the PDR, a theoretical molecular depolarization value of 0.0036 was utilized (Behrendt and Nakamura, 2002). As a reference, a 100 % departure from the theoretical value (Burton et al., 2015) introduced a 3 % increase in the PDR. This uncertainty was included on top of the reported PDR variability for birch and pine. Profiles below 200 m a.g.l. were considered constant to the value at 200 m.
Lastly, vertically pointing data from HALO Doppler lidar were post-processed following Vakkari et al. (2019). Similar to previous studies on the aerosol PDR using HALO Doppler lidars, bleed-through of the internal polarizer was estimated from liquid cloud base observations as 0.011 ± 0.005, which is very close to the previous values of 0.016 and 0.013 for this system (Vakkari et al., 2021; Bohlmann et al., 2019). The PDR at 1565 nm was corrected for the bleed-through following Vakkari et al. (2021). Moreover, attenuated backscatter at 1565 nm was calculated from the post-processed, 2 h averaged co-polar signal-to-noise-ratio following Vakkari et al. (2021). Profiles below 100 m a.g.l. were considered constant.
Using the automatically detected BL from PollyXT, the layer mean intensive optical properties of the BÅE and PDR from all three lidars were calculated and further connected to surface pollen and PM10 concentrations. The percentage share of PM10 in the aerosol mixture was calculated as follows: 100 ⋅ PM10 (PM10 + PMpollen). For each pollen type, cases with a share of a specific pollen type that was greater than or equal to 90 % compared with the rest of the pollen types were considered to ensure that the effect of that specific pollen alone was studied.
The year 2021 was exceptional in terms of the airborne pollen concentration in many areas of Finland (European Aeroallergen Network, EAN, pollen database). At the Kuopio pollen monitoring site (62∘8′ N, 27∘63′ E; 98 m a.s.l.), which is in close proximity to Vehmasmäki station and has an extended pollen monitoring dataset, the total accumulated birch pollen reached the second highest count of the continuous 43-year-long airborne pollen monitoring history. The yearly variation in the airborne pine pollen concentration at this site is less pronounced, but the pine concentration was higher than average during 2021. Pollen monitoring at Vehmasmäki station has been available since 2016. Figure 1 shows the pollen concentration of birch and pine for the 2 consecutive years, 2021 and 2022, at Vehmasmäki station. It can be observed that the pollination season and pollen amount fluctuate from year to year. Specifically, intense pollination started a week later in 2022 compared with 2021, regardless of the pollen type. Diurnal variation in birch and pine is also visible, with the pollen concentration normally peaking during local noon following the increase in the BL height. The maximum pollen concentration for birch and pine ever recorded at this site is 64 380 and 14 550 particles m−3, respectively. For birch, this maximum concentration occurred during 2021, whereas the highest amount (10 570 particles m−3) for pine in this same year was relatively close to the all-time maximum. As a reference, considering the combined Kuopio–Vehmasmäki pollen dataset, birch and pine pollen concentrations of less than 6000 and 3500 particles m−3, respectively, are observed at the site 95 % of the time.
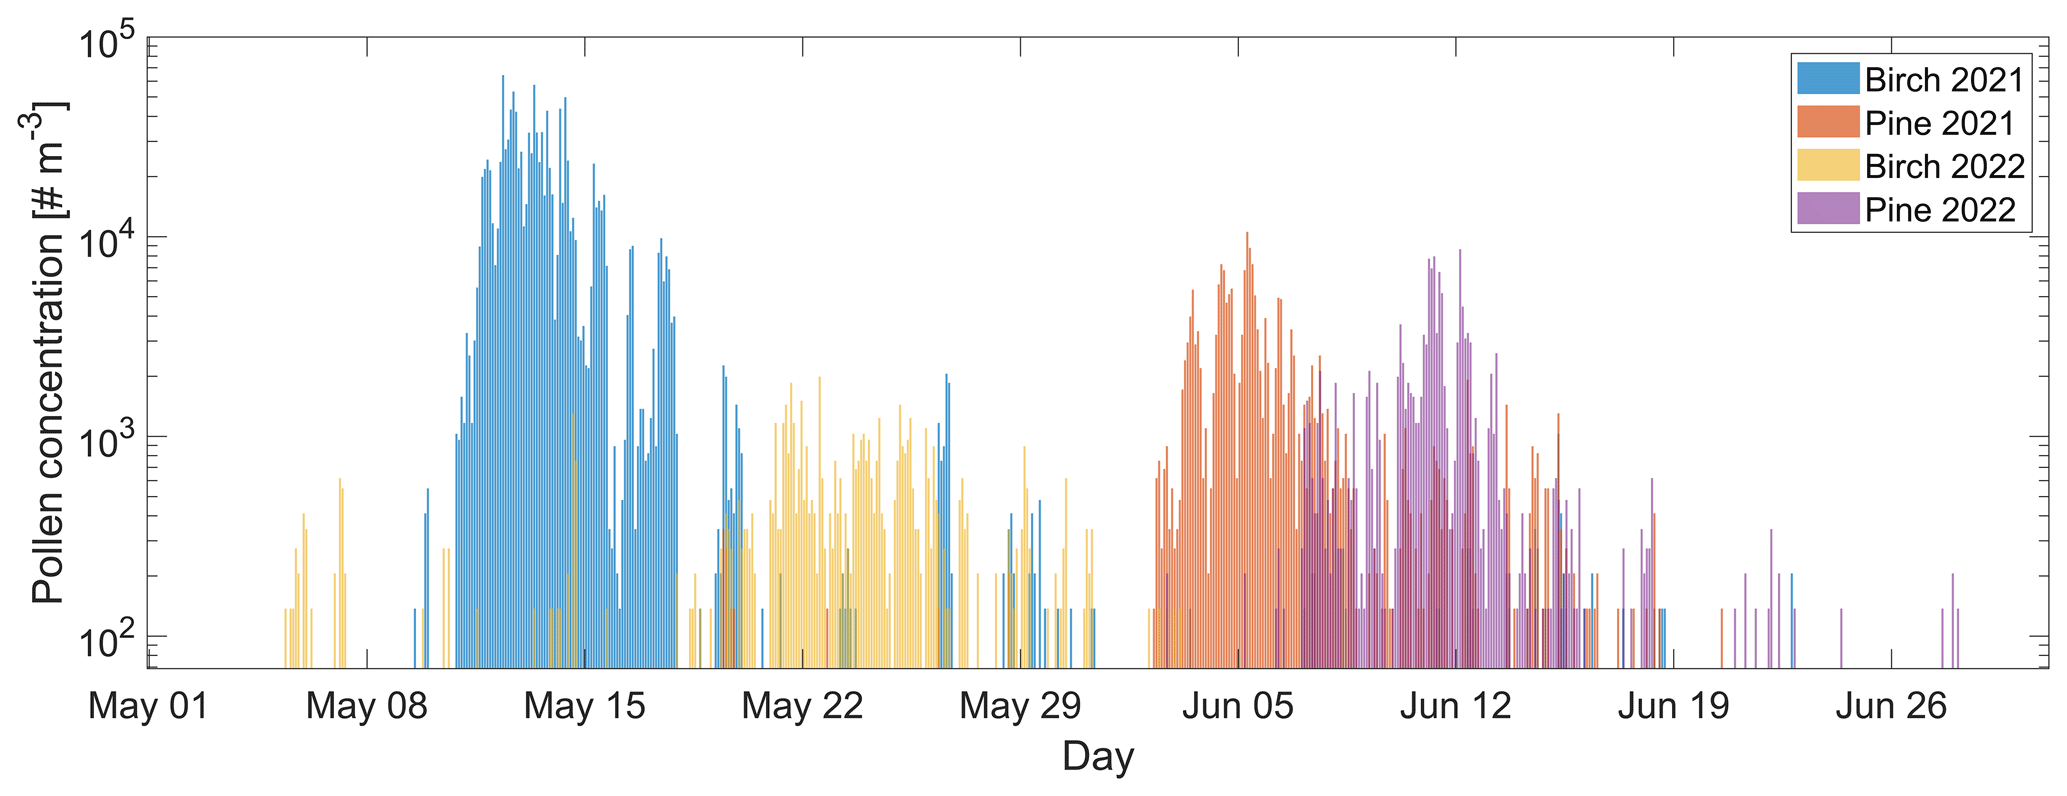
Figure 1Time series of the birch and pine pollen concentration measured by the Hirst-type air sampler at 4 m a.g.l. for the years 2021 and 2022 at Vehmasmäki station in Finland.
3.1 Pollen optical properties
The PM concentration and pollen types were linked to layer optical properties considering the first atmospheric layer as retrieved from the lidar observations (see Sect. 2.6). The top height of the first layer ranged between 660 and 2900 m, and it was subject to the evolution of the BL.
Birch
An example case of the methodology is shown in Fig. 2 during high-birch-pollination conditions on 12 May 2021. Figure 2 illustrates the concentration of pollen summarized as birch and other pollen types measured at 4 m a.g.l. by the Hirst-type air sampler (Fig. 2a), the range-corrected signal at 1064 nm (Fig. 2b), and the intensive and extensive lidar optical properties (Fig. 2c–e), considering time-averaged profiles from 11:00 to 13:00 UTC (shaded area in Fig. 2b). Supporting information regarding the presence of smoke and mineral dust particles is summarized in Fig. 3. During the day, the pollen concentration remained at high levels, and birch pollen was the dominant type with little to no presence of other pollen types. Regarding the presence of other aerosol types, the BC concentration increased towards the end of the day, indicating the presence of smoke particles. The minor presence of mineral dust particles was also hinted at by some of the dust models towards the second half of the day. The top of the BL reached as high as 1.65 km during the day, showing a clear signature in the particle backscatter profiles as well (Fig. 2c). An LR of 55 (60 sr) at 355 (532, 910, and 1064 nm) was used for the Klett inversion. Regardless of the wavelength, the particle backscatter coefficient showed minimal discrepancy within the BL, suggesting well-mixed conditions. Towards the top of the BL, the particle backscatter coefficient at 532 nm was larger than at 355 nm, resulting in a slightly negative BÅE, a feature that has previously been seen in the presence of mineral dust aerosol particles (Veselovskii et al., 2016). Considering the data in the grey shaded area (first geometrical layer), optical layer mean values of 0.15 ± 0.23, 0.19 ± 0.04, and 0.51 ± 0.01 were calculated for the BÅE355–532, BÅE532–910, and BÅE532–1064, respectively. Furthermore, little discrepancy can be seen in the PDR profiles at the two longer wavelengths of 910 and 1565 nm. This is not the case with the PDR532 profile, in which the value decreases with increasing height. It is presumed that the concentration of pollen decreases with height and, thus, the influence of background aerosol increases. As the longer wavelengths of 910 and 1565 nm are more sensitive to large aerosol particles, the depolarization ratio does not decrease with height. The opposite is valid for the 355 and 532 nm wavelengths, which are more sensitive to small aerosol particles. Because of this, the PDR532 values in the upper end of the signal considerably decreased and are, therefore, not considered for the calculation of the layer mean values (see Sect. 2.6). A layer mean value of 4 ± 1 %, 29 ± 4 %, 24 ± 1 %, and 36 ± 1 % was retrieved for the PDR at 355, 532, 910, and 1565 nm, respectively.
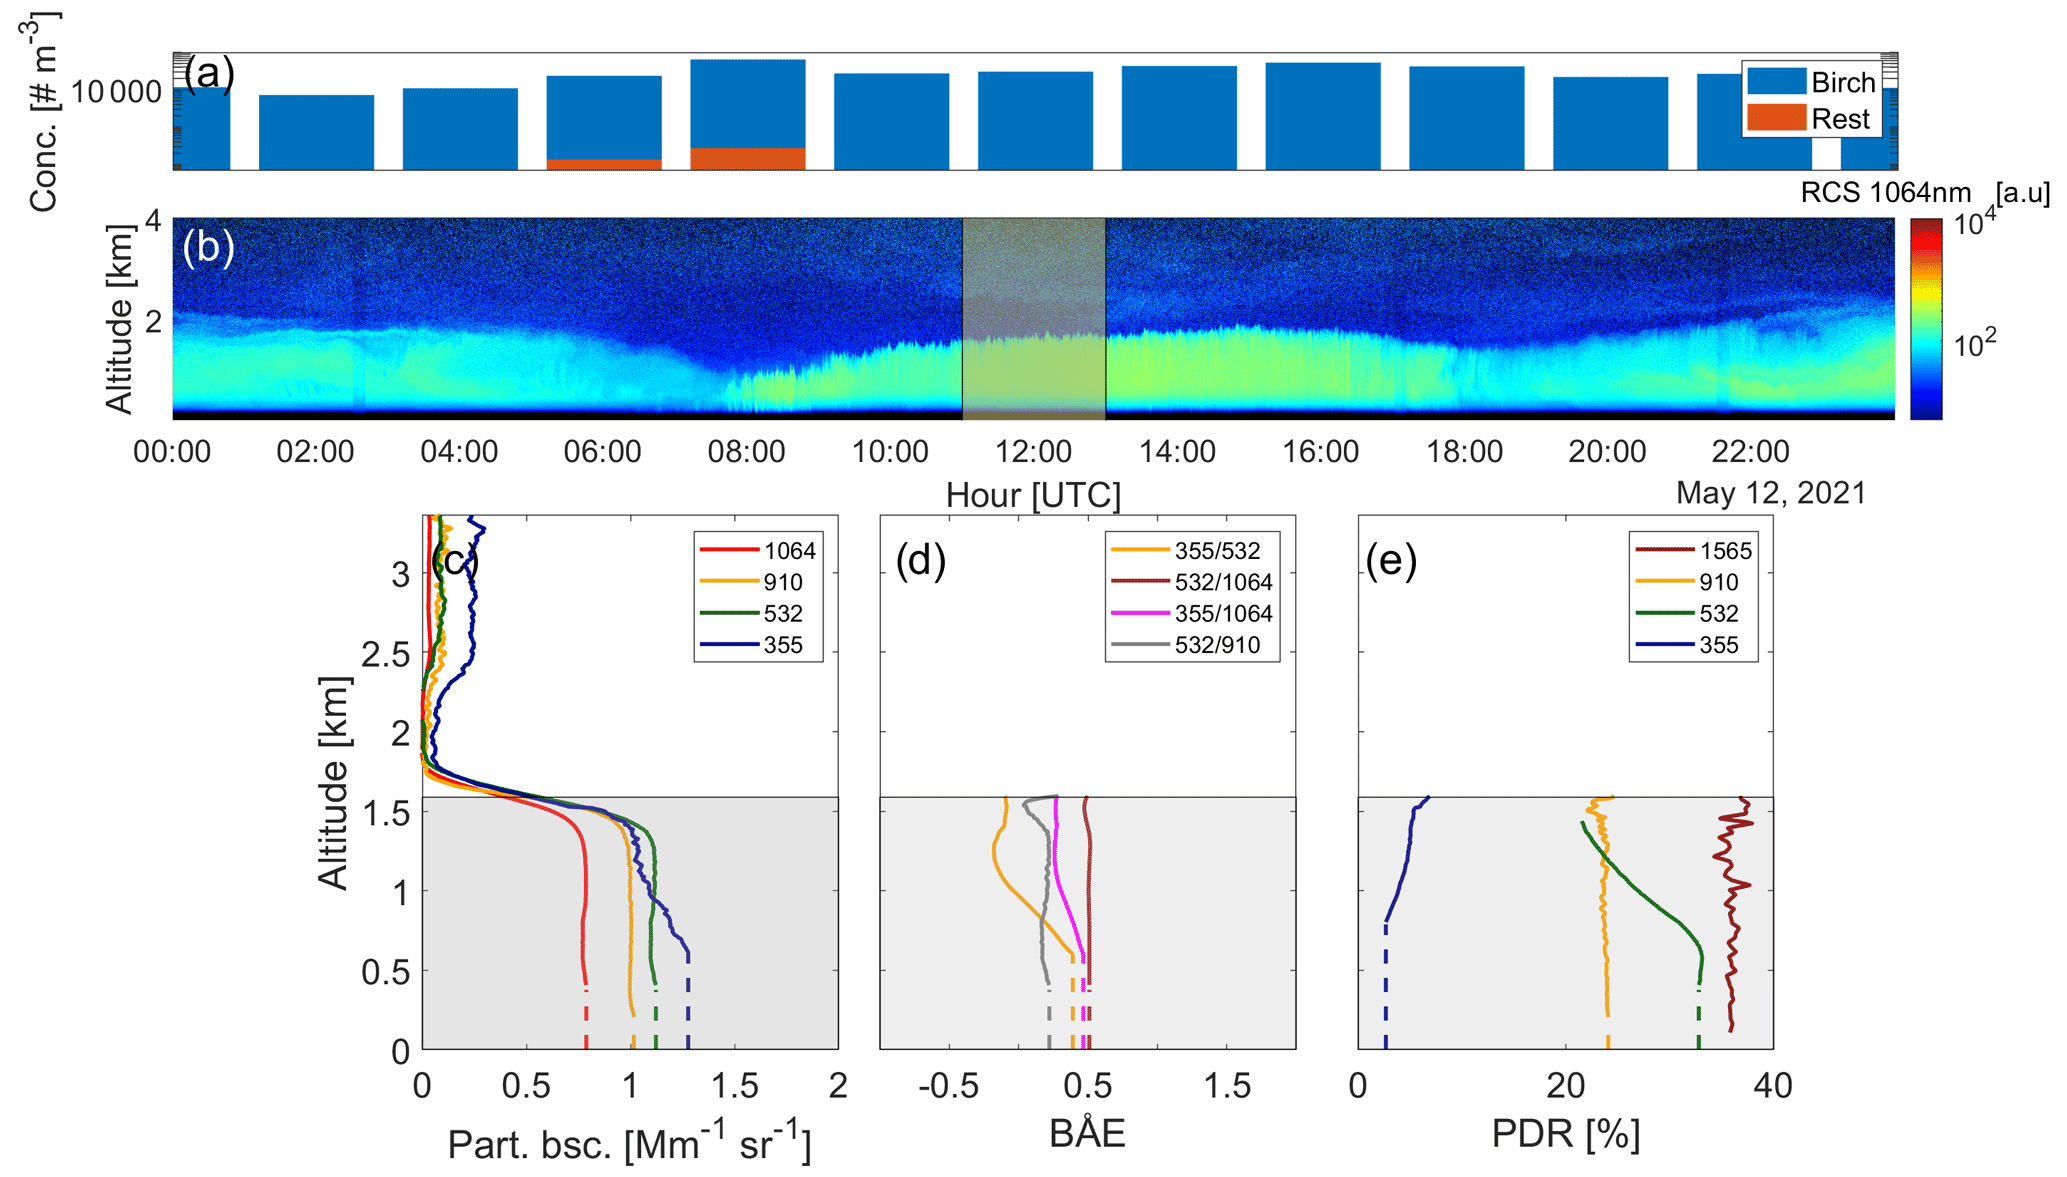
Figure 2Overview of the 12 May 2021. (a) Pollen concentration measured by the Hirst-type air sampler at 4 m a.g.l. (b) Range-corrected signal (RCS) at 1064 nm. The shaded area in panel (b) indicates the time range considered for the Klett inversion shown below. Profiles of (c) particle backscatter coefficients at 355, 532, 910, and 1064 nm; (d) BÅE at various combinations; and (e) PDR at 355, 532, 910, and 1565 nm are shown. The first geometrical layer in panels (c)–(e) is marked in grey.
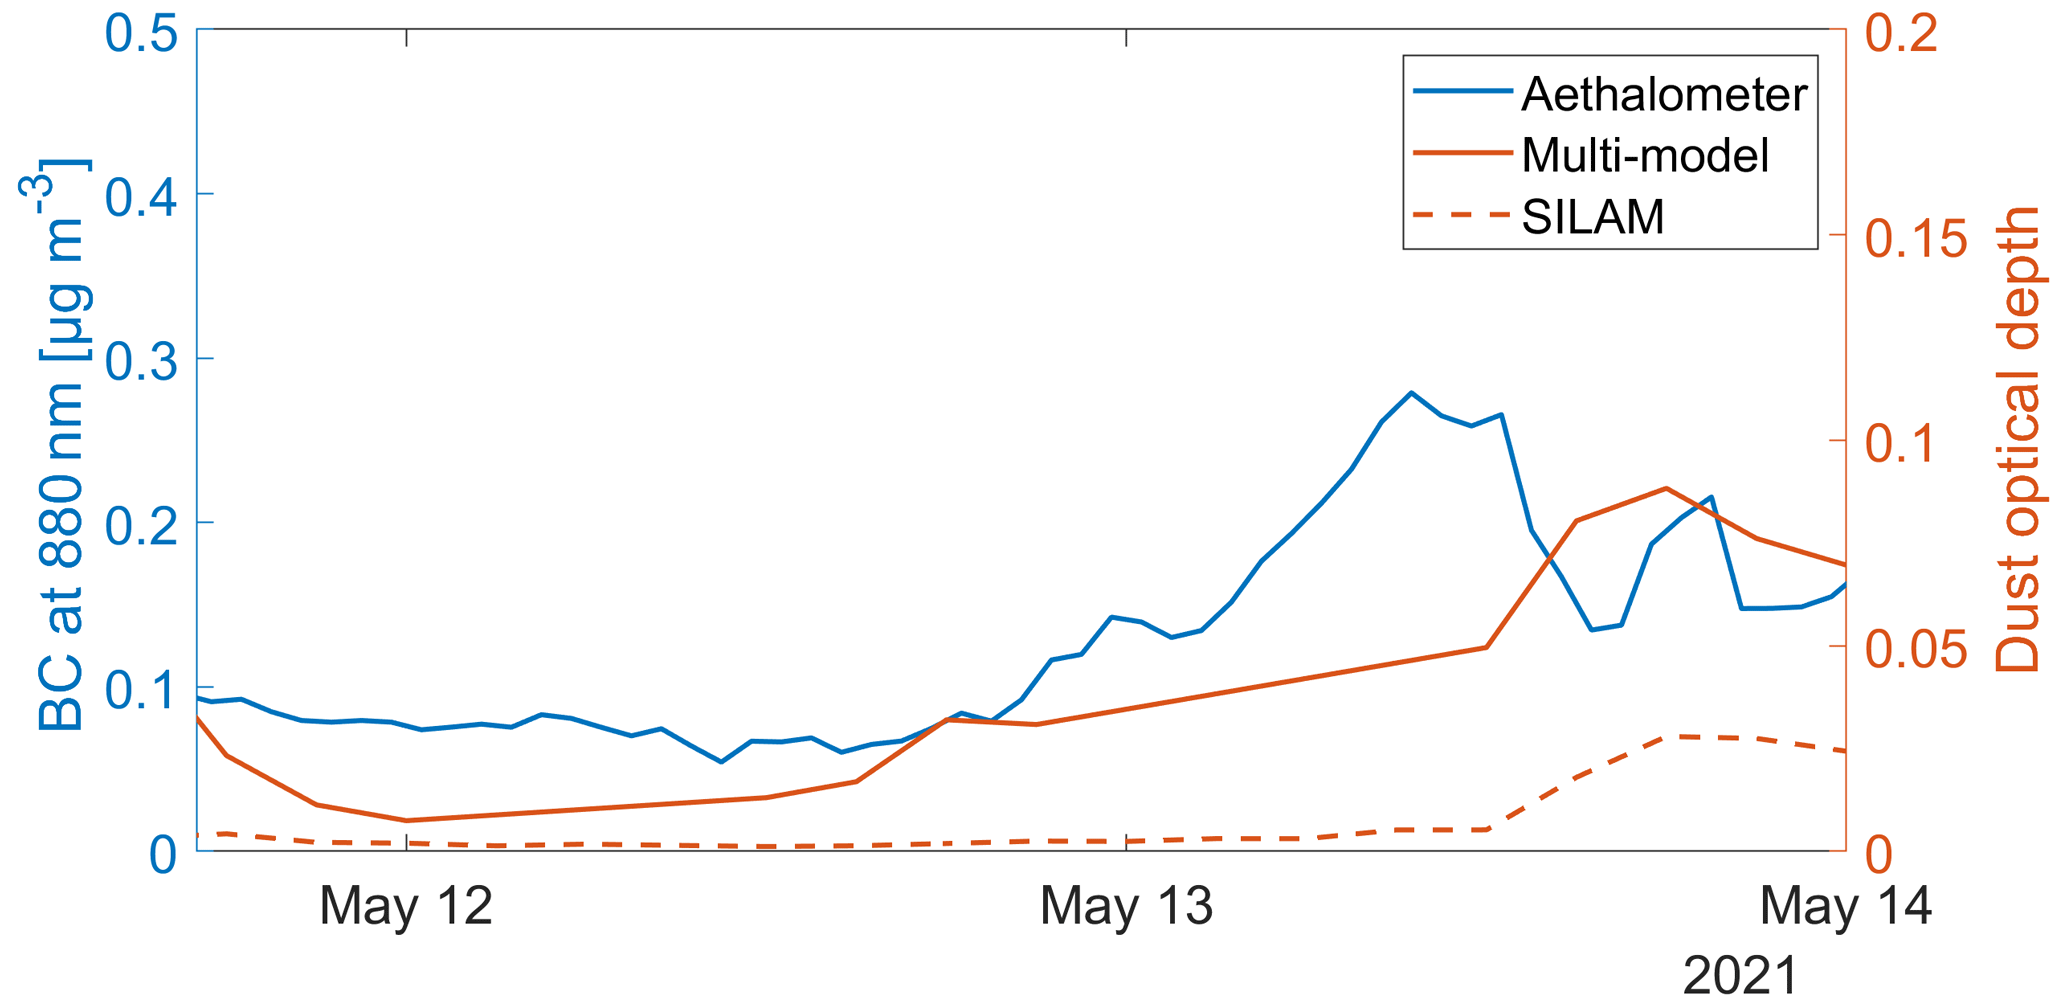
Figure 3Left axis: on-site aerosol black carbon (BC) concentration from the AE31 Aethalometer between 11 and 13 May 2021. The 880 nm wavelength was used for the BC concentration. Right axis: corresponding modelled dust optical depth provided by the WMO Barcelona Dust Regional Center (multi-model and System for Integrated modeLling of Atmospheric coMposition, SILAM, options are shown for comparison).
A total of 102 cases (individual layers) were considered during 2021 and 2022 for the exploration of the pollen optical properties. Figure 4 demonstrates the layer mean PDR in relation to the birch pollen concentration for all available wavelengths. The colour indicates the percentage share of PM10 to PM10 plus PMbirch. The size of the marker shows the mean relative humidity (RH) at 26 m a.g.l. The RH fluctuated between 22 % and 95 %, covering a considerable range of values. At 26 m a.g.l., wind gusts of up to 13 m s−1 prevailed. Considering all cases, a mean PM10 concentration of 15 ± 13 µg m−3 (range of 2–78 µg m−3) was obtained. Focusing on the two longest wavelengths, it is evident that the pollen concentration (contribution of other aerosols) is positively (negatively) correlated to the PDR. The higher pollen concentration and lower contribution of other aerosols resulted in a higher PDR in the pollen layer. Considering all cases with a variable birch contribution to the aerosol mixture, a mean PDR of 4 ± 2 %, 16 ± 6 %, 13 ± 8 %, and 18 ± 8 % at wavelengths of 355, 532, 910, and 1565 nm was estimated, respectively. There were a few points in the high-birch-concentration region (more than 20 000 particles m−3) with relatively lower PDR values. These cases mainly occurred on 12 May 2021 (at 08:00 UTC and from 20:00 to 22:00 UTC) and 13 May 2021 (from 04:00 to 18:00 UTC), as opposed to the higher-PDR cases which were observed during the night of 11 May 2021 (from 18:00 to 22:00 UTC) and on 12 May 2021 (at 06:00 UTC and from 10:00 to 18:00 UTC). The low-PDR cases featured a higher share of PM10, with a mean PM10 concentration of 38 ± 20 µg m−3 compared with 18 ± 4 µg m−3 for higher-PDR cases, and slightly higher mean RH values (40 ± 13 % as opposed to 36 ± 12 %). To further support the analysis, Fig. 3 demonstrates that the BC concentration was up to 3 times higher during the low-PDR times compared with other times (during which the BC concentration was around 0.1 µg m−3), marking the presence of smoke aerosol particles from forest fires. At the same time, the modelled dust optical depth hinted at the long-range transport of mineral dust. Therefore, the lower PDR values in the high-concentration region stemmed from a mixture of pollen, dust, and smoke aerosol particles.
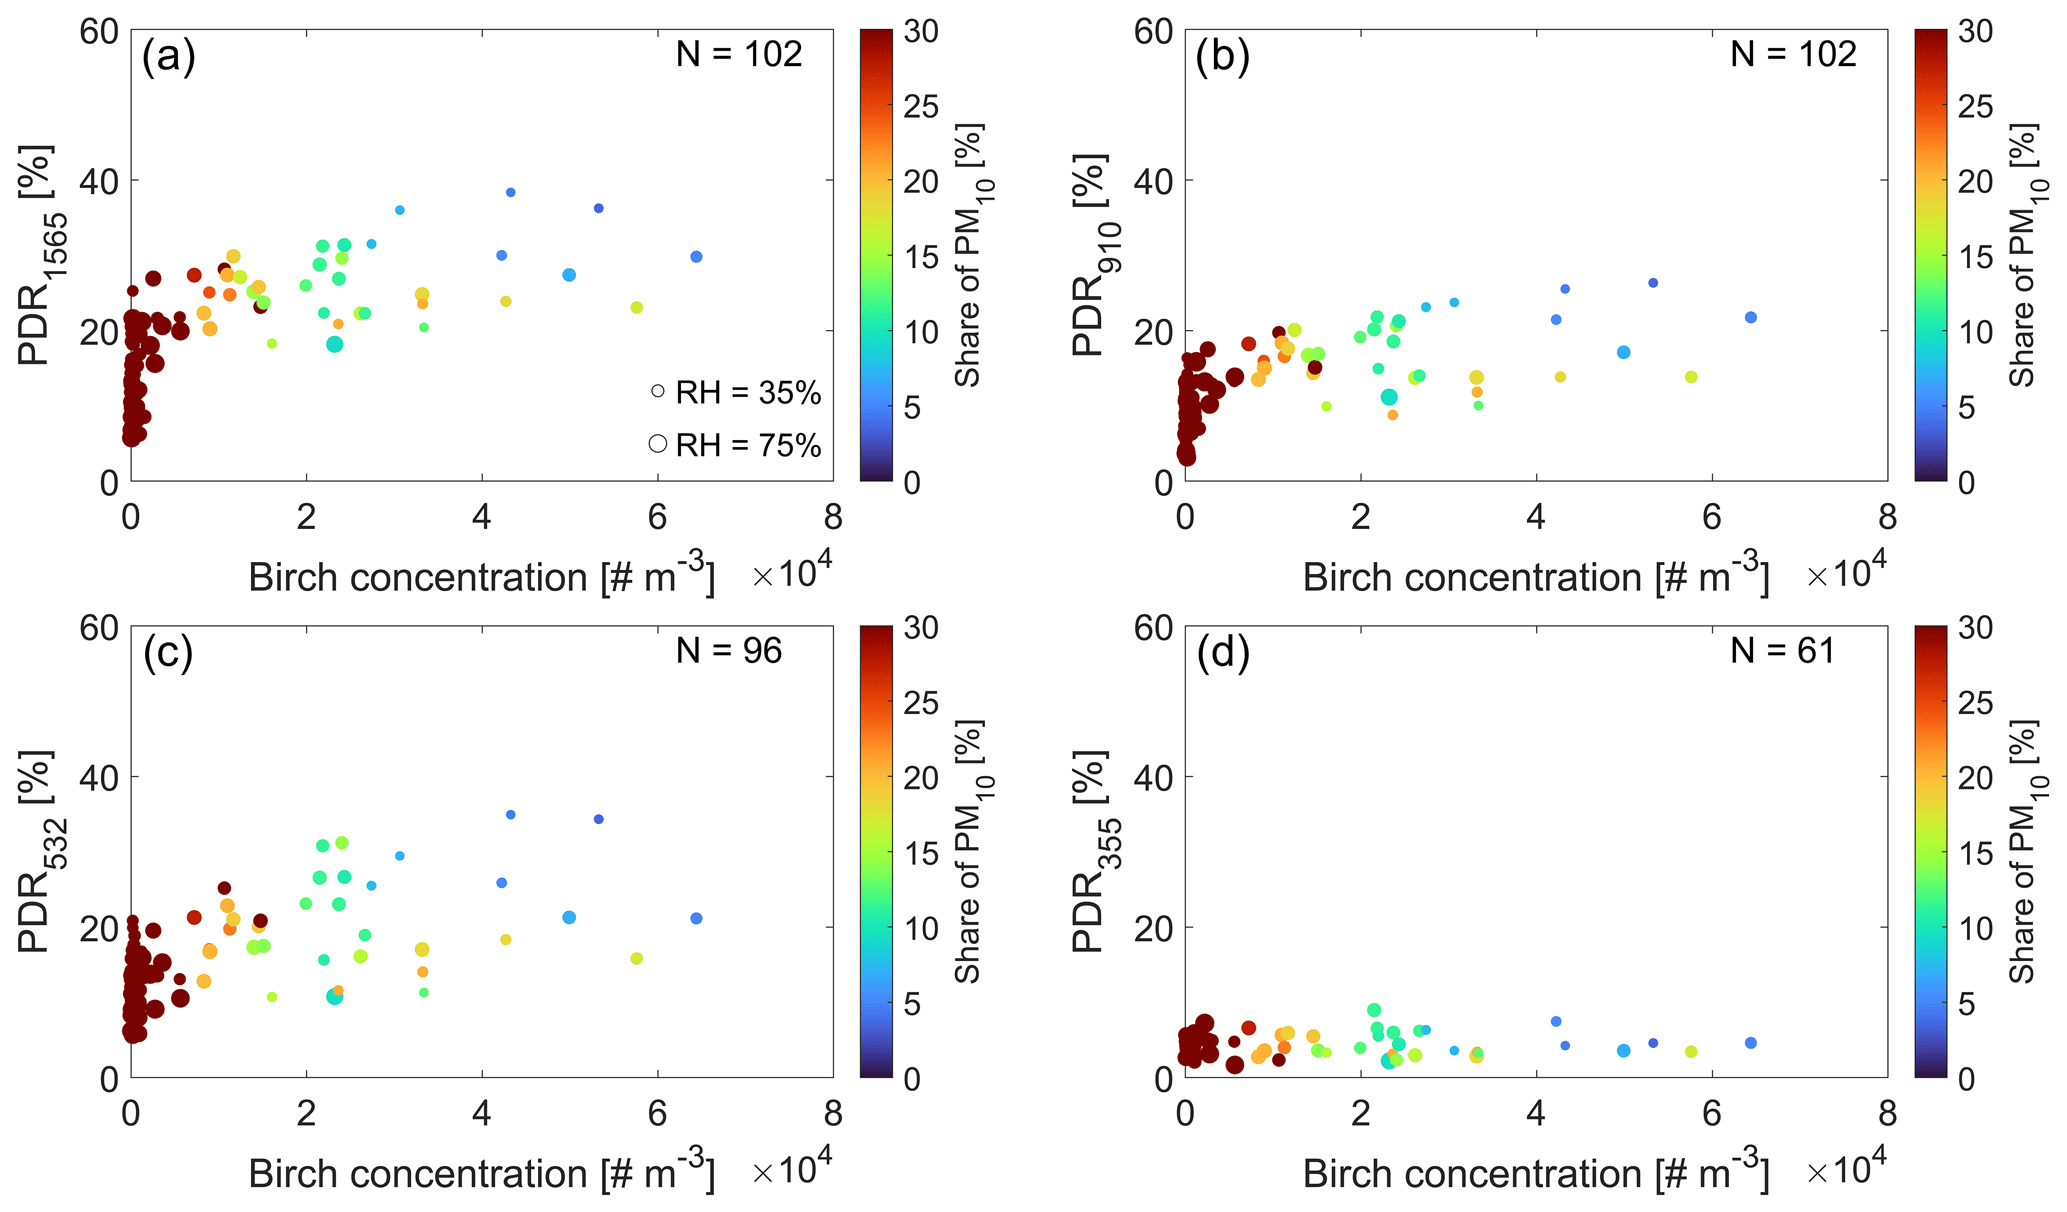
Figure 4Wavelength dependence of the PDR at (a) 1565 nm, (b) 910 nm, (c) 532 nm, and (d) 355 nm on the birch pollen concentration. The size of the circles indicates the RH at 26 m a.g.l. The colour of the circles corresponds to the share of PM10 in the PM10 plus PMbirch sum. The number in the top right corner corresponds to the number of layers considered at each wavelength.
In order to retrieve the characteristic optical properties of birch pollen, cases with the lowest PM10 share contribution (less than 10 %) to the aerosol mixture were considered. The 10 % limit was a compromise in order to ensure a meaningful number of cases for the calculation of birch pollen optical properties. A mean (range of) birch PDR of 5 ± 2 % (4–8), 28 ± 6 % (21–35), 23 ± 6 % (17–26), and 33 ± 4 % (27–38) at wavelengths of 355, 532, 910, and 1565 nm was estimated, respectively. This subset of seven cases had a BÅE355–532, BÅE532–910, and BÅE532–1064 of 0.37 ± 0.63, 0.16 ± 0.20, and 0.54 ± 0.41, respectively. In this subset, the share of birch pollen compared with the rest of the pollen types ranged between 99.5 % and 100 %, and no pine nor spruce pollen was present. The values indicate rather large aerosol particles and are aligned with the hypothesis used in Shang et al. (2020) for pollen. Figure 5 summarizes the spectral dependence of the birch PDR from this study and literature values. Although most of the studies have been conducted in a controlled laboratory environment using purchased pollen grains, we concluded a similar wavelength dependence using naturally occurring pollen under ambient conditions. The related findings are comparable, as the total of the seven cases considered for the retrieval of the birch PDR was found under dry conditions scoring a RH of 29 ± 9 %. This RH range is similar to those reported in the laboratory studies. Nevertheless, whether the PDR values refer to intact pollen grains, ruptured pollen, or ruptured pollen fragments is unclear. Ruptured pollen has an altered shape compared with intact and hydrated pollen grains. Furthermore, smaller fragments of ruptured pollen are also non-spherical, which can potentially affect the PDR. In the presence of water, intact pollen can rupture to produce fragments with diameters smaller than 2.5 µm (Mampage et al., 2022), although other pollen-extracted material has been found at sizes smaller than 10 µm (Burkart et al., 2021). Hence, this effect is expected to be more profound at the shorter wavelengths, which are more sensitive to smaller aerosol particles compared with longer wavelengths. From the pollen characterization perspective, there is a sharp increase from a wavelength of 355 to 532 nm. Further, PDR values decrease slightly at 910 nm before increasing again towards the longest wavelength at 1565 nm. The discrepancy in the birch PDR between this study and the studies of Bohlmann et al. (2019, 2021) and Shang et al. (2020, 2022) can be attributed to the consideration of the amount, hydration, and share of pollen and other aerosol particles in the mixture.
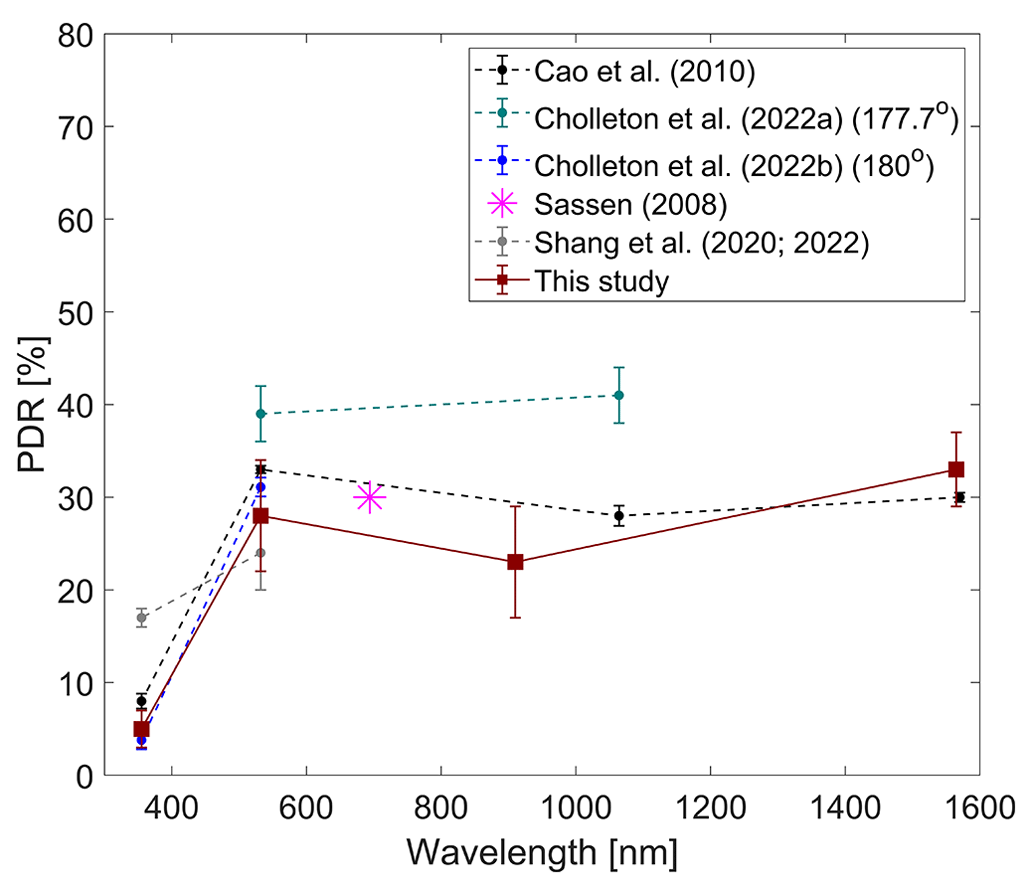
Figure 5Spectral dependence of the birch pollen PDR. Error bars represent the standard deviation. Note that the Sassen (2008) and Cao et al. (2010) studies refer to Betula papyrifera, the Cholleton et al. (2022a, b) studies were realized at two different back-scattering angles, and the Shang et al. (2020, 2022) studies refer to the projected birch (Betula) PDR assuming a BÅE of zero.
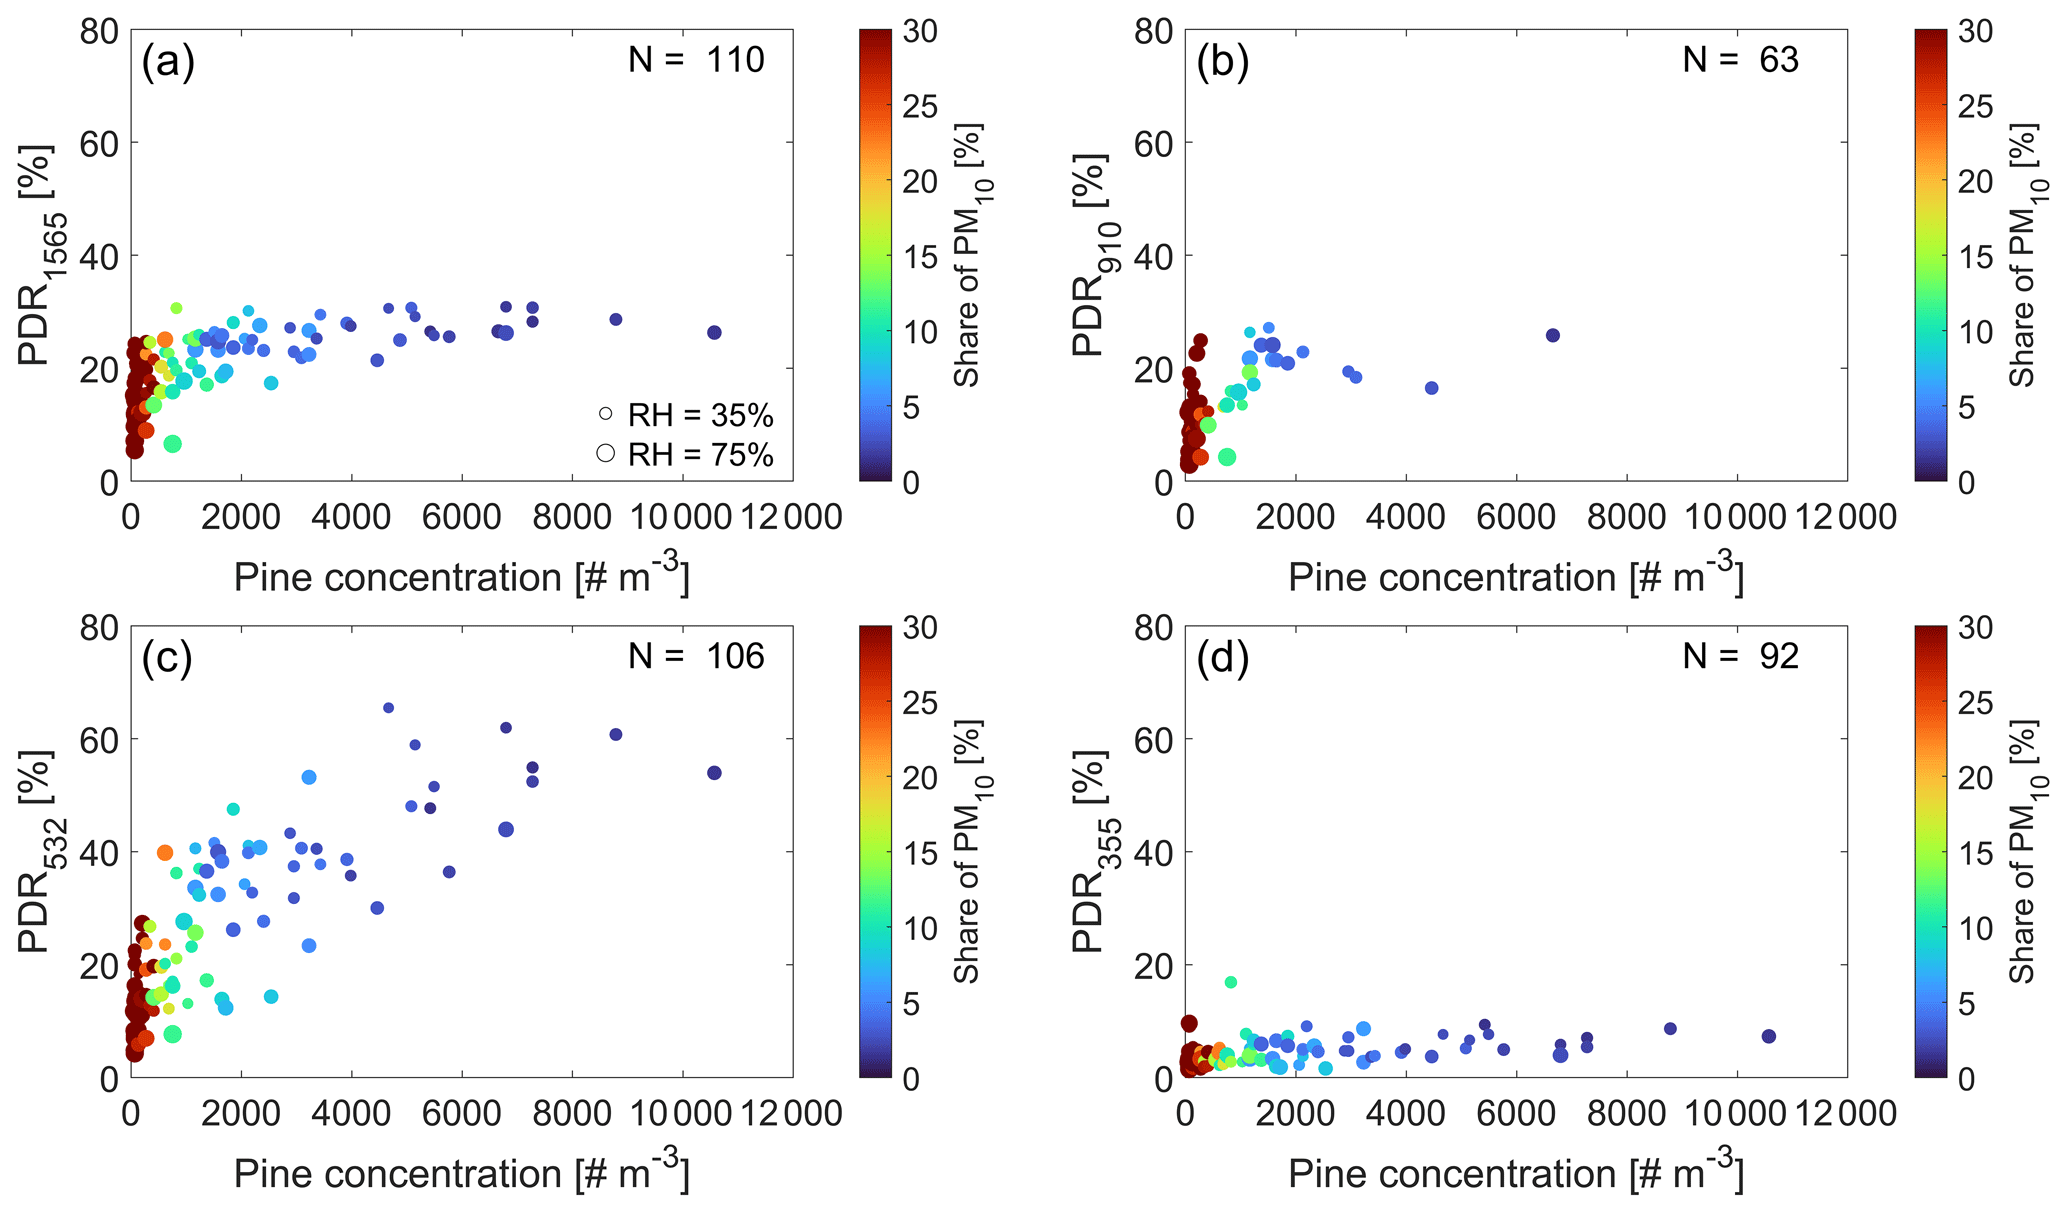
Figure 6Wavelength dependence of the PDR at (a) 1565 nm, (b) 910 nm, (c) 532 nm, and (d) 355 nm on the pine pollen concentration. The size of the circles indicates the RH at 26 m a.g.l. The colour of the circles corresponds to the share of PM10 in the PM10 plus PMpine sum. The number in the top right corner corresponds to the number of layers considered at each wavelength.
Pine
Likewise, Fig. 6 presents equivalent cases for pine pollen. In total, 110 individual layers were considered. Note that the CL61 instrument was not operational for the full pine period and, thus, has a lower number of cases. The RH ranged between 25 % and 97 %, and wind gusts of up to 9.5 m s−1 were measured at 26 m a.g.l. Considering all cases, a mean PM10 concentration of 12 ± 6 µg m−3 (range of 4–42 µg m−3) and a mean PDR of 4 ± 2 %, 25 ± 15 %, 14 ± 9 %, and 21 ± 6 % were obtained at wavelengths of 355, 532, 910, and 1565 nm, respectively. Regarding the PDR, higher mean layer values were apparent for the 355 and 532 nm wavelengths compared with birch pollen, whereas the PDR1565 presented lower values compared with birch pollen. The PDR910 had comparable values to birch. It can be observed that the longer wavelengths reached a plateau above a certain pine pollen concentration. At the same time, there was a wide discrepancy in the values at PDR532 which almost monotonically increased with an increasing pine concentration. The PDR532 peaked during high-pine-concentration cases, resulting in values as high as 66 %. Previously, Bohlmann et al. (2021) reported a maximum PDR532 as high as 90 % in the presence of spruce pollen, a similar pollen type in terms of shape to that of pine pollen. This feature has also been detected here for pine pollen. The presence of other depolarizing aerosols is excluded. Furthermore, no multiple scattering has been found for the preceding instruments at the highest observed pollen concentration. The multiple-scattering calculations were performed using the Eloranta (1998) model. To investigate the overall fluctuation at PDR532, we regarded the aerosol volume size distribution of the particles considering cases with pine concentrations above 4000 particles m−3. There were 13 cases that were further split into three categories (PDR532 ≤ 40 %, two cases; 40< PDR532 < 60 %, eight cases; and PDR532 ≥ 60 %, three cases). In terms of RH, there was no significant difference between the three categories, with mean layer values of 43 % (low PDR532), 40 % (mid PDR532), and 34 % (high PDR532), respectively. Similarly, the mean PM10 concentration was 11, 13, and 12 µg m−3 for the low-, mid-, and high-PDR532 categories, respectively. Therefore, the discrepancy in the PDR532 was attributed to the relative contribution of the different aerosol modes in the aerosol volume size distribution (Fig. 7). Considering this dataset, the pollen optical properties are dominated by large particles (>1 µm). Specifically, there was a noticeable change in the share of particles with a diameter between 1 and 2.5 µm between the high- and low-PDR532 categories. Particularly, a 21 % share was attributed to this size range for the low-PDR532 category as opposed to the high-PDR532 category (in which the share was as low as 6 %). Whilst particles with sizes below 1 µm had a 5 %–11 % bigger share in the high-mid PDR category compared with the low-PDR category, the mid-PDR category presented an almost identical aerosol size distribution to the high-PDR category; thus, the change in the PDR532 value may have resulted from changes in the structure of the pollen itself. At the same concentration range, the longer wavelengths showed little PDR discrepancy. Consequently, longer wavelengths can be beneficial for the detection of the large pollen particles.
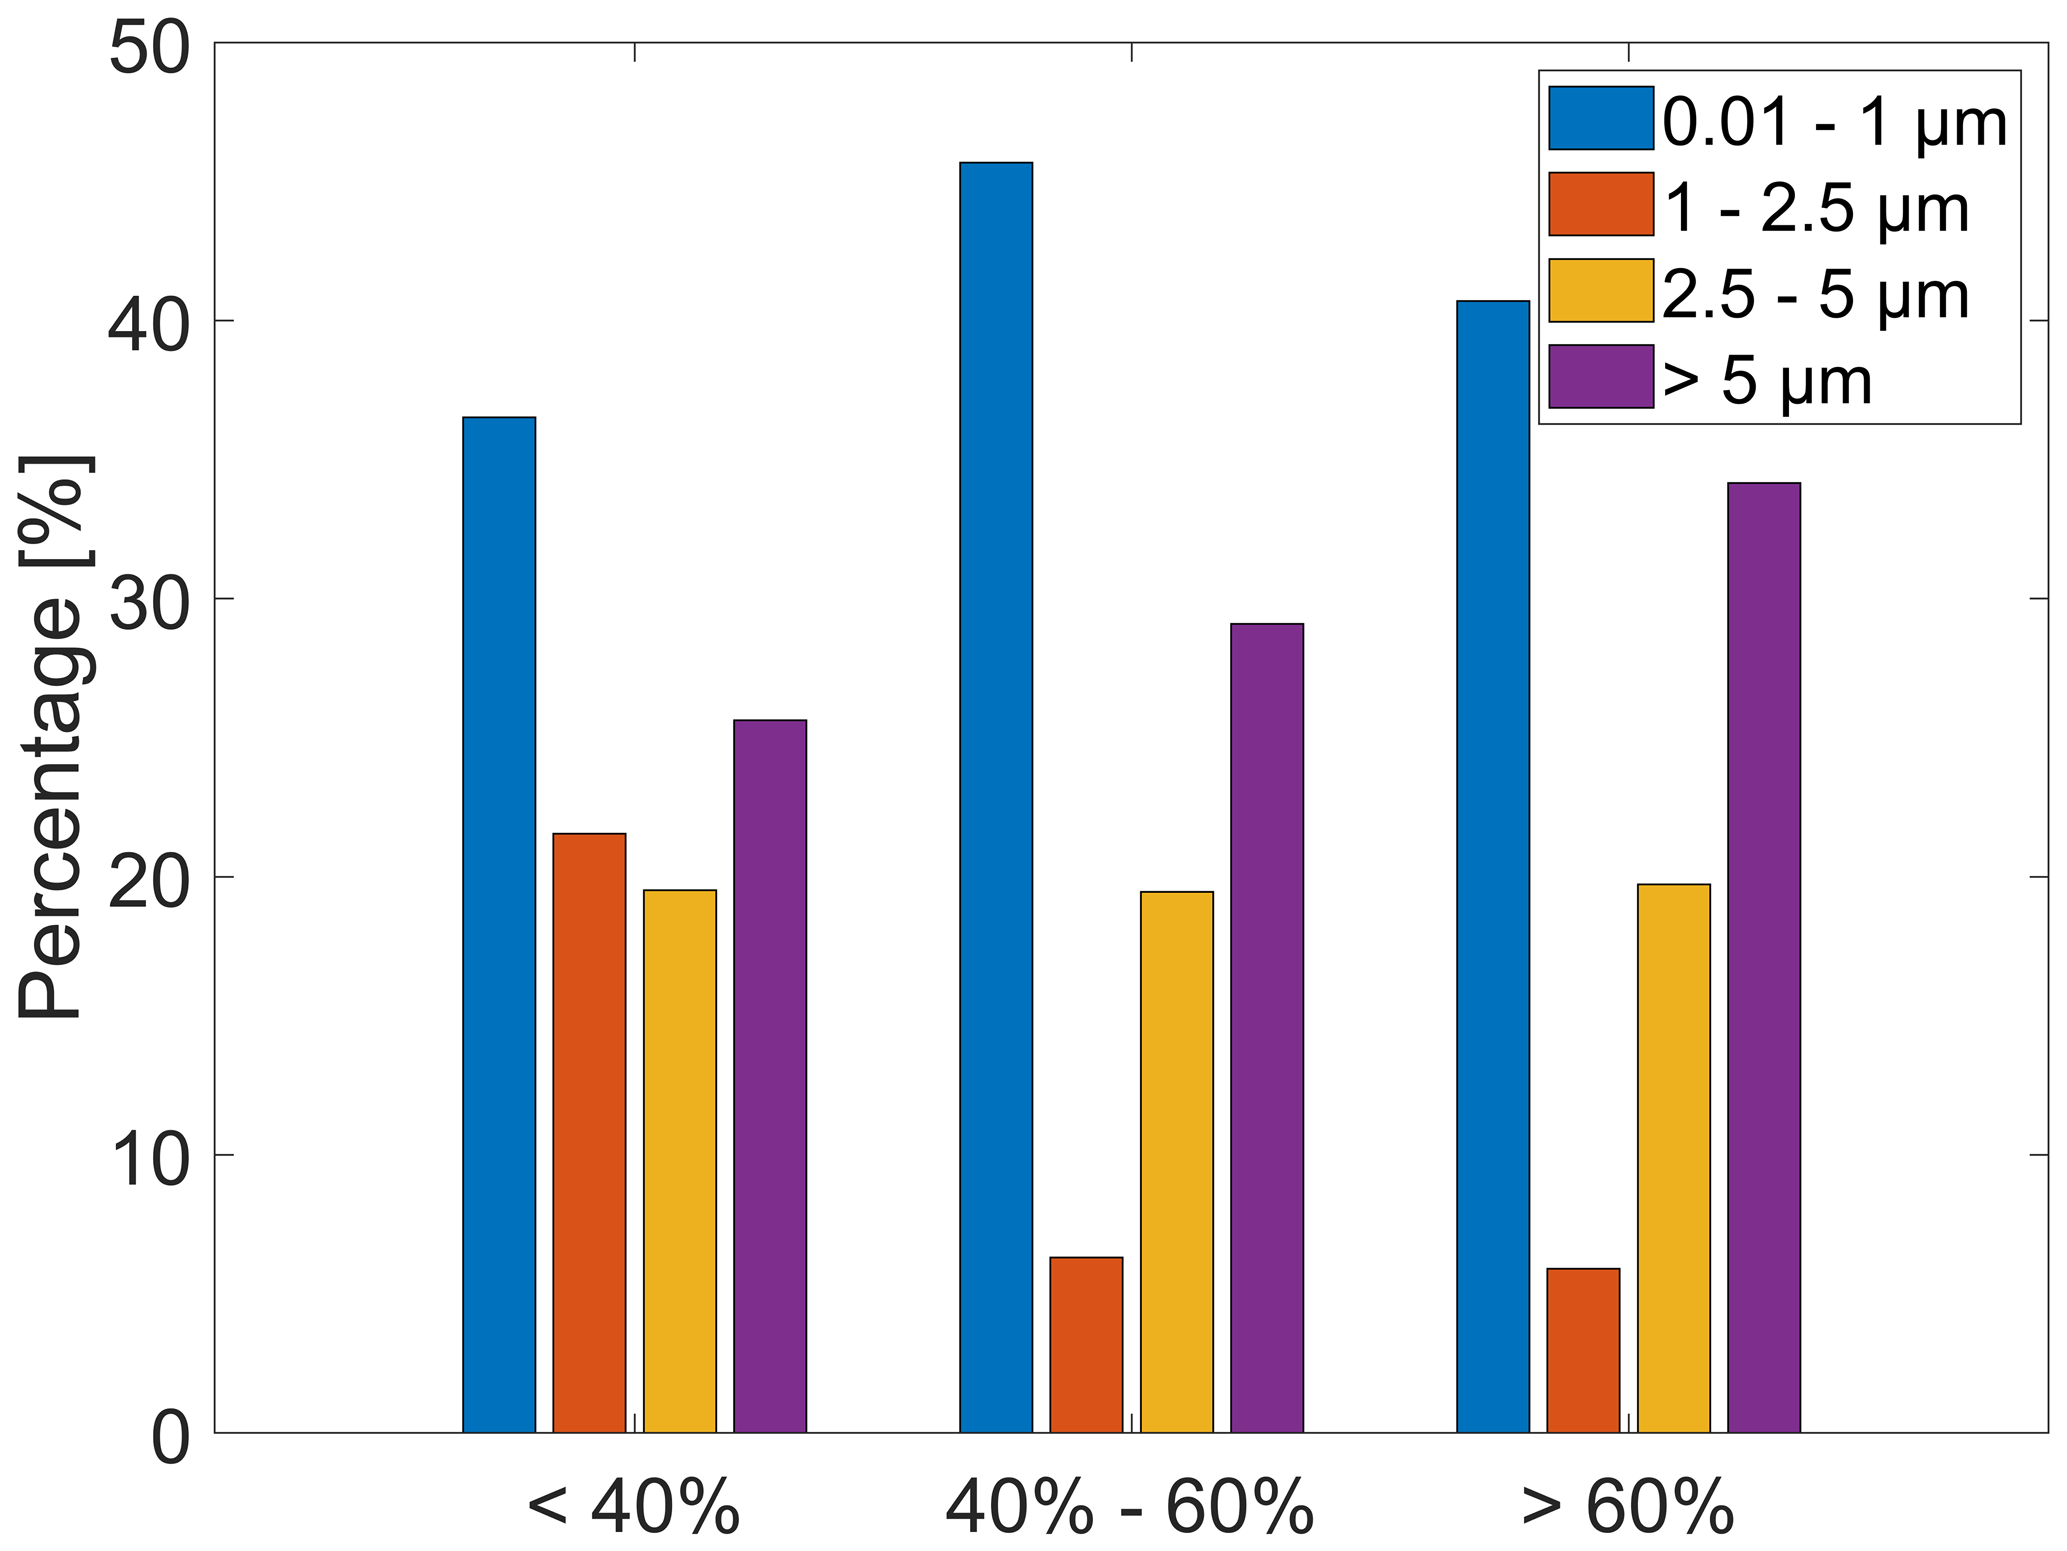
Figure 7Relative contribution of PM in the size ranges from 0.01 to 1 µm (blue), 1 to 2.5 µm (red), 2.5 to 5 µm (yellow), and >5 µm (purple) to PM10 as detected by the NS and OPS instruments. The data shown correspond to cases with a PDR532 larger than 60 %, between 40 % and 60 %, and below 40 %. All three categories were limited to a pine pollen concentration above 4000 particles m−3.
Considering cases with a PM10 contribution of less than 5 % to the total aerosol share, a mean PDR of 6 ± 2 %, 43 ± 11 %, 22 ± 6 %, and 26 ± 3 % at 355, 532, 910, and 1565 nm was retrieved, respectively. The mean RH for this subset of 30 cases was 42 ± 9 %. Similar to Fig. 5, Fig. 8 presents the spectral dependence of the PDR for pine pollen. There is a maximum observed at a wavelength of 532 nm for this pollen type. This is evident in all (laboratory and ambient) studies. We found a minor spectral dependence between wavelengths of 910 and 1565 nm compared with Cao et al. (2010), who reported that the PDR decreases with increasing wavelength. Regarding the PDR355, the combination of the large pine particles which may not be distributed homogeneously in the BL and the instrumental limitation of no reliable measurements below 800 m resulted in uncorrelated PDR355 values compared with the laboratory studies. The similarity of the PDR spectral dependence in Bohlmann et al. (2021) for spruce and in this study for pine pollen is noteworthy. Although the layer mean BÅE was 0.14 ± 0.49, 0.53 ± 0.42, and 0.47 ± 0.24 at BÅE355–532, BÅE532–910, and BÅE532–1064, respectively, negative values were retrieved for the BÅE355–532 during the highest-pine-pollen cases. A negative BÅE has been reported previously by Bohlmann et al. (2021) during high concentrations of spruce pollen. Similarly, negative BÅE values have been previously retrieved in the presence of mineral dust aerosol particles. Recently, Veselovskii et al. (2020) linked the discrepancy in BÅE values in dust layers to the complex refractive index of the particles and, more specifically, to the imaginary part of the complex refractive index. To this end, the imaginary part of the complex refractive index for pine pollen remains undocumented, yet the negative values at BÅE355–532 combined with the wavelength dependence and the maxima at PDR532 can be seen as a general characteristic of pollen belonging to the Pinaceae family.
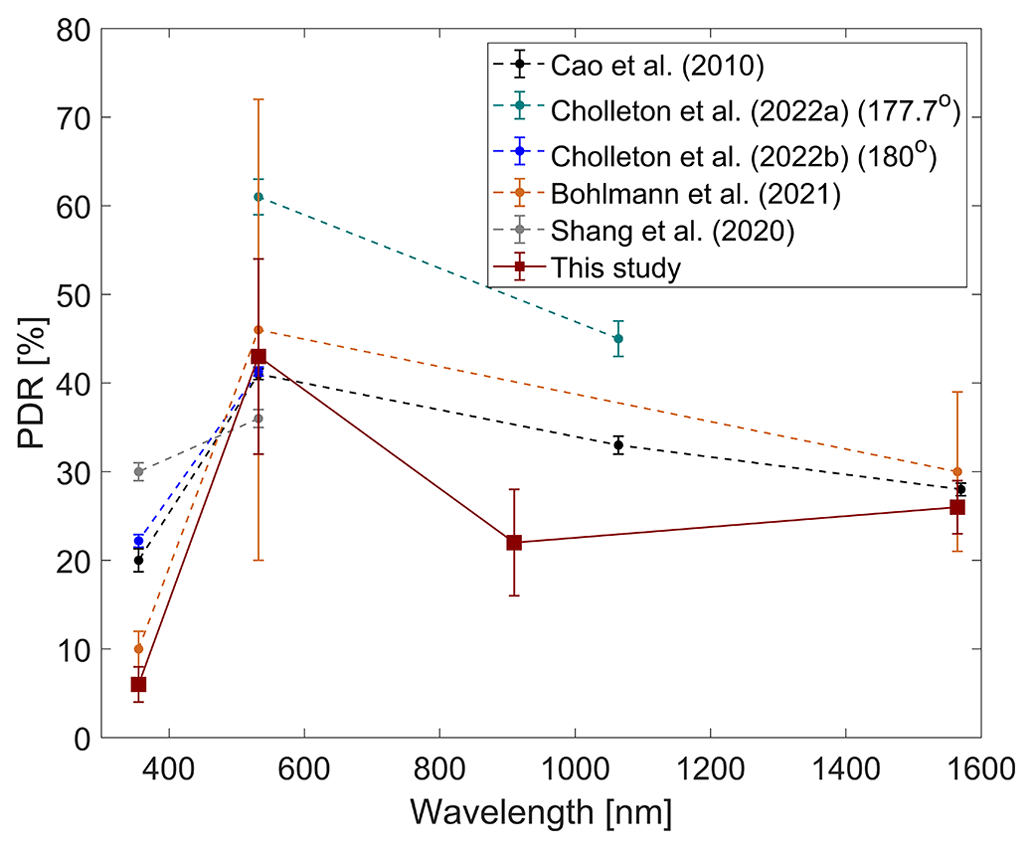
Figure 8Similar to Fig. 5 for pine pollen. Note that the Cao et al. (2010) study refers to Pinus virginiana, the Cholleton et al. (2022a, b) studies refer to Pinus strobus, the Bohlmann et al. (2021) study refers to a mixture of birch (Betula) and Norway spruce (Picea abies), and the Shang et al. (2020) study refers to a projected pine (Pinus) PDR assuming a BÅE of zero.
The pollen optical properties of birch and pine were investigated with a synergy of three lidars and co-located in situ aerosol and pollen instruments at the rural site of Vehmasmäki (Kuopio) in Finland. Regardless of the pollen type, the PDR was positively (negatively) correlated with the pollen concentration (share of other aerosol particles in the mixture). A higher pollen concentration and lower contribution of other aerosols resulted in a higher PDR in the pollen layer. More specifically, the PDR at both the 910 and 1565 nm wavelengths reached a plateau at high pollen concentrations, with minimal discrepancy. The reason behind this is the sensitivity of longer wavelengths to large particles like pollen. This highlights the suitability of the PDR at longer wavelengths for pollen detection. As they are the most sensitive to small particles, the shorter wavelengths of 355 and 532 nm demonstrated larger PDR variability, even at high pollen counts. Defining whether this PDR discrepancy at shorter wavelengths, specifically at 532 nm, is due to the share of pollen (intact, ruptured, or fragments) in the mixture or is the result of more complex mechanisms, for example, pollen shape and orientation, is not feasible with the current instrumental set-up. Therefore, the findings refer to the effect of pollen (intact, ruptured, or fragments) in the aerosol mixture.
By choosing cases with a low background aerosol population, we were able to retrieve the characteristic PDR and BÅE optical properties for birch and pine pollen. Regarding birch pollen, we retrieved a PDR of 5 ± 2 %, 28 ± 6 %, 23 ± 6 %, and 33 ± 4 % at wavelengths of 355, 532, 910, and 1565 nm, respectively. In terms of the BÅE, birch pollen had similar values to dust aerosols, indicating rather big particles. A mean value of 0.37 ± 0.63, 0.16 ± 0.20, and 0.54 ± 0.41 was calculated for BÅE355–532, BÅE532–910, and BÅE532–1064 combinations at the pollen layer, respectively. Birch pollen layers were found under rather dry conditions with a mean RH of 29 ± 9 %. Regarding pine pollen, even higher PDR values were estimated for the 532 nm wavelength compared with that of birch. The pollen layers had a mean PDR of 6 ± 2 %, 43 ± 11 %, 22 ± 6 %, and 26 ± 3 % at wavelengths of 355, 532, 910, and 1565 nm, respectively. As far as the BÅE is concerned, values of 0.14 ± 0.49, 0.53 ± 0.42, and 0.47 ± 0.24 were found at BÅE355–532, BÅE532–910, and BÅE532–1064, respectively. A negative BÅE355–532 was retrieved during the highest pine pollen concentrations. This negative BÅE and the high PDR at 532 nm could be characteristic of this pollen type.
Pollen release in the Northern Hemisphere is well-documented, yet little is known about its optical properties. Lidar-derived PDR and BÅE profiles can provide essential information about pollen presence in the atmosphere, thereby serving as a validation tool in aerosol dispersion models of pollen and further improving pollen representation through lidar assimilation procedures. Furthermore, pollen is currently missing from lidar aerosol classification algorithms. Therefore, there is a great inconsistency in the lidar literature related to the characteristic optical properties of atmospheric pollen. Here, we have hinted that discrepancies in the background aerosol population and the pollen amount with regard to the wavelength and possibly the pollen size itself are most probably the reasons behind this discrepancy. The challenges in defining pollen optical properties are related to their low concentration in the atmosphere. Because of the relatively clean background conditions at our measurement site, we were able to capture the relationship between the PDR and pollen concentration and further connect it with the presence of other aerosol particles in the air. Nevertheless, with the current instrumental set-up, we were not able to distinguish whether the reported optical properties were the result of intact pollen grains, ruptured pollen, fragments, or a combination of these. Therefore, future studies should focus on characterizing the state of the pollen grains and further link these to optical properties.
Level-1 PollyXT observations are visualized at https://polly.tropos.de/ (last access: 26 June 2023) and are available upon request from the authors. Level-1 CL61 ceilometer and HALO Doppler data are available through CloudNet portal (https://hdl.handle.net/21.12132/2.d51fdac9e1114762, CLU, 2023). Level-2 lidar data and in situ data are available upon request from the authors. The Global Data Assimilation System (GDAS) meteorological data used in the Klett inversion are available from https://www.ncei.noaa.gov/access/metadata/landing-page/bin/iso?id=gov.noaa.ncdc:C00379 (NOAA, 2023).
MF developed the algorithms, analysed the PollyXT and CL61 lidar data, and conceptualized and wrote the original paper. AL developed the algorithms and analysed the in situ aerosol data. VV developed the algorithms and provided the HALO Doppler data. AS and LT performed the analysis of the pollen samples. EOC performed the multiple-scattering calculations. AL, PT, XS, and MK were responsible for the lidar and ensuring good in situ operation as well as for the collection of the pollen samples during the campaigns. MT, PT, and EOC assisted with the CL61 calibration and data interpretation. All authors were involved in editing the paper, interpreting the results, and the discussion of the manuscript.
The contact author has declared that none of the authors has any competing interests.
Publisher’s note: Copernicus Publications remains neutral with regard to jurisdictional claims in published maps and institutional affiliations.
The authors gratefully acknowledge support from the Vaikuttavuussäätiö (Finnish Research Impact Foundation) via the Tandem Industry Academia (TIA) programme. Dust data and/or images were provided by the WMO Barcelona Dust Regional Center and the partners of the Sand and Dust Storm Warning Advisory and Assessment System (SDS-WAS) for Northern Africa, the Middle East, and Europe. We acknowledge ACTRIS for providing the CLU (2023) dataset used in this study; the aforementioned dataset was produced by the Finnish Meteorological Institute and is available for download from https://cloudnet.fmi.fi/ (last access: 5 August 2023).
This research has been supported by the Vaikuttavuussäätiö (Finnish Research Impact Foundation) via the Tandem Industry Academia (TIA) programme.
This paper was edited by Matthias Tesche and reviewed by three anonymous referees.
Adamov, S., Lemonis, N., Clot, B., Crouzy, B., Gehrig, R., Graber, M., Sallin, C., and Tummon, F.: On the measurement uncertainty of Hirst-type volumetric pollen and spore samplers, Aerobiologia, https://doi.org/10.1007/s10453-021-09724-5, 2021. a
Alas, H. D. C., Weinhold, K., Costabile, F., Di Ianni, A., Müller, T., Pfeifer, S., Di Liberto, L., Turner, J. R., and Wiedensohler, A.: Methodology for high-quality mobile measurement with focus on black carbon and particle mass concentrations, Atmos. Meas. Tech., 12, 4697–4712, https://doi.org/10.5194/amt-12-4697-2019, 2019. a
Anderson, T. and Ogren, J.: Determining aerosol radiative properties using the TSI 3563 integrating nephelometer, Aerosol Sci. Technol., 29, 57–69, 1998. a
Baars, H., Ansmann, A., Althausen, D., Engelmann, R., Heese, B., Müller, D., Artaxo, P., Paixao, M., Pauliquevis, T., and Souza, R.: Aerosol profiling with lidar in the Amazon Basin during the wet and dry season, J. Geophys. Res.-Atmos., 117, D21201, https://doi.org/10.1029/2012JD018338, 2012. a
Beggs, P.: Environmental Allergens: from Asthma to Hay Fever and Beyond, Current Climate Change Reports, 1, 176–184, https://doi.org/10.1007/s40641-015-0018-2, 2015. a
Behrendt, A. and Nakamura, T.: Calculation of the calibration constant of polarization lidar and its dependency on atmospheric temperature, Opt. Express, 10, 805–817, https://doi.org/10.1364/OE.10.000805, 2002. a
Bohlmann, S., Shang, X., Giannakaki, E., Filioglou, M., Saarto, A., Romakkaniemi, S., and Komppula, M.: Detection and characterization of birch pollen in the atmosphere using a multiwavelength Raman polarization lidar and Hirst-type pollen sampler in Finland, Atmos. Chem. Phys., 19, 14559–14569, https://doi.org/10.5194/acp-19-14559-2019, 2019. a, b, c, d
Bohlmann, S., Shang, X., Vakkari, V., Giannakaki, E., Leskinen, A., Lehtinen, K. E. J., Pätsi, S., and Komppula, M.: Lidar depolarization ratio of atmospheric pollen at multiple wavelengths, Atmos. Chem. Phys., 21, 7083–7097, https://doi.org/10.5194/acp-21-7083-2021, 2021. a, b, c, d, e
Burkart, J., Gratzl, J., Seifried, T. M., Bieber, P., and Grothe, H.: Isolation of subpollen particles (SPPs) of birch: SPPs are potential carriers of ice nucleating macromolecules, Biogeosciences, 18, 5751–5765, https://doi.org/10.5194/bg-18-5751-2021, 2021. a, b
Burton, S. P., Hair, J. W., Kahnert, M., Ferrare, R. A., Hostetler, C. A., Cook, A. L., Harper, D. B., Berkoff, T. A., Seaman, S. T., Collins, J. E., Fenn, M. A., and Rogers, R. R.: Observations of the spectral dependence of linear particle depolarization ratio of aerosols using NASA Langley airborne High Spectral Resolution Lidar, Atmos. Chem. Phys., 15, 13453–13473, https://doi.org/10.5194/acp-15-13453-2015, 2015. a
Buters, J. T. M., Antunes, C., Galveias, A., Bergmann, K. C., Thibaudon, M., Galán, C., Schmidt-Weber, C., and Oteros, J.: Pollen and spore monitoring in the world, Clinical and Translational Allergy, 8, 9, https://doi.org/10.1186/s13601-018-0197-8, 2018. a
Cao, X., Roy, G. A., and Bernier, R.: Lidar polarization discrimination of bioaerosols, Opt. Eng., 49, 116201, https://doi.org/10.1117/1.3505877, 2010. a, b, c, d
Cholleton, D., Bialic, É., Dumas, A., Kaluzny, P., Rairoux, P., and Miffre, A.: Laboratory evaluation of the scattering matrix of ragweed, ash, birch and pine pollen towards pollen classification, Atmos. Meas. Tech., 15, 1021–1032, https://doi.org/10.5194/amt-15-1021-2022, 2022a. a
Cholleton, D., Rairoux, P., and Miffre, A.: Laboratory Evaluation of the (355, 532) nm Particle Depolarization Ratio of Pure Pollen at 180.0 Lidar Backscattering Angle, Remote Sens., 14, 3767, https://doi.org/10.3390/rs14153767, 2022b. a
CLU: Cloud profiling measurements: Doppler lidar, Lidar; 2022-04-01 to 2022-06-30; from Vehmasmäki. Generated by the cloud profiling unit of the ACTRIS Data Centre, https://hdl.handle.net/21.12132/2.d51fdac9e1114762 (last access: 5 August 2023), 2023. a, b
Crouzy, B., Stella, M., Konzelmann, T., Calpini, B., and Clot, B.: All-optical automatic pollen identification: Towards an operational system, Atmos. Environ., 140, 202–212, https://doi.org/10.1016/j.atmosenv.2016.05.062, 2016. a
Diehl, K., Quick, C., Matthias-Maser, S., Mitra, S., and Jaenicke, R.: The ice nucleating ability of pollen: Part I: Laboratory studies in deposition and condensation freezing modes, Atmos. Res., 58, 75–87, https://doi.org/10.1016/S0169-8095(01)00091-6, 2001. a
Diehl, K., Matthias-Maser, S., Jaenicke, R., and Mitra, S.: The ice nucleating ability of pollen:: Part II. Laboratory studies in immersion and contact freezing modes, Atmos. Res., 61, 125–133, https://doi.org/10.1016/S0169-8095(01)00132-6, 2002. a
Dreischmeier, K., Budke, C., Wiehemeier, L., Kottke, T., and Koop, T.: Boreal pollen contain ice-nucleating as well as ice-binding “antifreeze” polysaccharides, Sci. Rep., 7, 41890, https://doi.org/10.1038/srep41890, 2017. a
Eloranta, E. W.: Practical model for the calculation of multiply scattered lidar returns, Appl. Opt., 37, 2464–2472, https://doi.org/10.1364/AO.37.002464, 1998. a
Engelmann, R., Kanitz, T., Baars, H., Heese, B., Althausen, D., Skupin, A., Wandinger, U., Komppula, M., Stachlewska, I. S., Amiridis, V., Marinou, E., Mattis, I., Linné, H., and Ansmann, A.: The automated multiwavelength Raman polarization and water-vapor lidar PollyXT: the neXT generation, Atmos. Meas. Tech., 9, 1767–1784, https://doi.org/10.5194/amt-9-1767-2016, 2016. a, b
Filioglou, M., Nikandrova, A., Niemelä, S., Baars, H., Mielonen, T., Leskinen, A., Brus, D., Romakkaniemi, S., Giannakaki, E., and Komppula, M.: Profiling water vapor mixing ratios in Finland by means of a Raman lidar, a satellite and a model, Atmos. Meas. Tech., 10, 4303–4316, https://doi.org/10.5194/amt-10-4303-2017, 2017. a
Freudenthaler, V.: About the effects of polarising optics on lidar signals and the Δ90 calibration, Atmos. Meas. Tech., 9, 4181–4255, https://doi.org/10.5194/amt-9-4181-2016, 2016. a
Gregory, P. H.: The microbiology of the atmosphere, ISBN 0249441101, 1973. a
Griffiths, P. T., Borlace, J.-S., Gallimore, P. J., Kalberer, M., Herzog, M., and Pope, F. D.: Hygroscopic growth and cloud activation of pollen: a laboratory and modelling study, Atmos. Sci. Lett., 13, 289–295, https://doi.org/10.1002/asl.397, 2012. a
Gute, E., David, R. O., Kanji, Z. A., and Abbatt, J. P. D.: Ice Nucleation Ability of Tree Pollen Altered by Atmospheric Processing, ACS Earth and Space Chemistry, 4, 2312–2319, https://doi.org/10.1021/acsearthspacechem.0c00218, 2020. a
Hader, J. D., Wright, T. P., and Petters, M. D.: Contribution of pollen to atmospheric ice nuclei concentrations, Atmos. Chem. Phys., 14, 5433–5449, https://doi.org/10.5194/acp-14-5433-2014, 2014. a
Hirst, J. M.: An automatic volumetric spore trap, Ann. Appl. Biol., 39, 257–265, https://doi.org/10.1111/j.1744-7348.1952.tb00904.x, 1952. a
Hopkin, E., Illingworth, A. J., Charlton-Perez, C., Westbrook, C. D., and Ballard, S.: A robust automated technique for operational calibration of ceilometers using the integrated backscatter from totally attenuating liquid clouds, Atmos. Meas. Tech., 12, 4131–4147, https://doi.org/10.5194/amt-12-4131-2019, 2019. a
Kitinoja, M., Hugg, T., Siddika, N., Rodriguez, Y., Jaakkola, M., and Jaakkola, J.: Short-term exposure to pollen and the risk of allergic and asthmatic manifestations: a systematic review and meta-analysis, BMJ Open, 10, https://doi.org/10.1136/bmjopen-2019-029069, 2020. a
Klett, J. D.: Stable analytical inversion solution for processing lidar returns, Appl. Opt., 20, 211–220, https://doi.org/10.1364/AO.20.000211, 1981. a
Lake, I., Jones, N., Agnew, M., Goodess, C., Giorgi, F., Hamaoui-Laguel, L., Semenov, M., Solmon, F., Storkey, J., Vautard, R., and Epstein, M.: Climate Change and Future Pollen Allergy in Europe, Environ. Health Perspect., 1, 385–391, https://doi.org/10.1289/EHP173, 2018. a
Leskinen, A., Ruuskanen, A., Kolmonen, P., Zhao, Y., Fang, D., Wang, Q., Gu, C., Jokiniemi, J., Hirvonen, M.-R., Lehtinen, K., Romakkaniemi, S., and Komppula, M.: The contribution of black carbon and non-BC absorbers to the aerosol absorption coefficient in Nanjing, China, Aerosol. Air. Qual. Res., 20, 590–605, https://doi.org/10.4209/aaqr.2019.06.0326, 2020. a
Löndahl, J.: Physical and Biological Properties of Bioaerosols, chap. 3, 33–48, Springer, New York, NY, ISBN 978-1-4419-5581-4, 2014. a
Mampage, C. B., Hughes, D. D., Jones, L. M., Metwali, N., Thorne, P. S., and Stone, E. A.: Characterization of sub-pollen particles in size-resolved atmospheric aerosol using chemical tracers, Atmospheric Environment: X, 15, 100177, https://doi.org/10.1016/j.aeaoa.2022.100177, 2022. a
Manninen, H. E., Bäck, J., Sihto-Nissila, S.-L., Huffman, J. A., Pessi, A.-M., Hiltunen, V., Aalto, P. P., Hidalgo, P. J., Hari, P., Saarto, A., Kulmala, M., and Petäjä, T.: Patterns in airborne pollen and other primary biological aerosol particles (PBAP), and their contribution to aerosol mass and number in a boreal forest, Boreal Environ. Res., 19, 383–405, 2014. a
Menut, L., Flamant, C., Pelon, J., and Flamant, P. H.: Urban boundary-layer height determination from lidar measurements over the Paris area, Appl. Opt., 38, 945–954, https://doi.org/10.1364/AO.38.000945, 1999. a
Mikhailov, E., Ivanova, O., Nebosko, E., Vlasenko, S., and Ryshkevich, T. I.: Subpollen Particles as Atmospheric Cloud Condensation Nuclei, Izv. Atmos. Ocean. Phys., 55, 357–364, https://doi.org/10.1134/S000143381904008X, 2019. a
NOAA: Global Data Assimilation System (GDAS) meteorological data, https://www.ncei.noaa.gov/access/metadata/landing-page/bin/iso?id=gov.noaa.ncdc:C00379 (last access: 10 August 2023), 2023. a
Noh, Y. M., Lee, H., Mueller, D., Lee, K., Shin, D., Shin, S., Choi, T. J., Choi, Y. J., and Kim, K. R.: Investigation of the diurnal pattern of the vertical distribution of pollen in the lower troposphere using LIDAR, Atmos. Chem. Phys., 13, 7619–7629, https://doi.org/10.5194/acp-13-7619-2013, 2013a. a
Noh, Y. M., Lee, H., Mueller, D., Lee, K., Shin, D., Shin, S., Choi, T. J., Choi, Y. J., and Kim, K. R.: Investigation of the diurnal pattern of the vertical distribution of pollen in the lower troposphere using LIDAR, Atmos. Chem. Phys., 13, 7619–7629, https://doi.org/10.5194/acp-13-7619-2013, 2013b. a
O'Connor, E. J., Illingworth, A. J., and Hogan, R. J.: A Technique for Autocalibration of Cloud Lidar, J. Atmos. Ocean. Tech., 21, 777–786, https://doi.org/10.1175/1520-0426(2004)021<0777:ATFAOC>2.0.CO;2, 2004. a
Oteros, J., Weber, A., Kutzora, S., Rojo, J., Heinze, S., Herr, C., Gebauer, R., Schmidt-Weber, C. B., and Buters, J. T.: An operational robotic pollen monitoring network based on automatic image recognition, Environ. Res., 191, 110031, https://doi.org/10.1016/j.envres.2020.110031, 2020. a
Pawankar, R., Baena-Cagnani, C., Bousquet, J., Canonica, G., Cruz, A., Kaliner, M., and Lanier, B.: State of world allergy report 2008: allergy and chronic respiratory diseases, World Allergy Organ Journal, 1, 4–17, https://doi.org/10.1097/WOX.0b013e31817ff995, 2008. a
Pearson, G., Davies, F., and Collier, C.: An Analysis of the Performance of the UFAM Pulsed Doppler Lidar for Observing the Boundary Layer, J. Atmos. Ocean. Tech., 26, 240–250, https://doi.org/10.1175/2008JTECHA1128.1, 2009. a
Pope, F.: Pollen grains are efficient cloud condensation nuclei, Environ. Res. Lett., 5, 044015, https://doi.org/10.1088/1748-9326/5/4/044015, 2010. a, b
Prisle, N. L., Lin, J. J., Purdue, S., Lin, H., Meredith, J. C., and Nenes, A.: Cloud condensation nuclei activity of six pollenkitts and the influence of their surface activity, Atmos. Chem. Phys., 19, 4741–4761, https://doi.org/10.5194/acp-19-4741-2019, 2019. a
Pummer, B. G., Bauer, H., Bernardi, J., Bleicher, S., and Grothe, H.: Suspendable macromolecules are responsible for ice nucleation activity of birch and conifer pollen, Atmos. Chem. Phys., 12, 2541–2550, https://doi.org/10.5194/acp-12-2541-2012, 2012. a
Richardson, S., Mytilinaios, M., Foskinis, R., Kyrou, C., Papayannis, A., Pyrri, I., Giannoutsou, E., and Adamakis, I.: Bioaerosol detection over Athens, Greece using the laser induced fluorescence technique, Sci. Total Environ., 696, 133 906, https://doi.org/10.1016/j.scitotenv.2019.133906, 2019. a
Saito, Y., Ichihara, K., Morishita, K., Uchiyama, K., Kobayashi, F., and Tomida, T.: Remote Detection of the Fluorescence Spectrum of Natural Pollens Floating in the Atmosphere Using a Laser-Induced-Fluorescence Spectrum (LIFS) Lidar, Remote Sens., 10, 1533, https://doi.org/10.3390/rs10101533, 2018. a
Sassen, K.: Boreal tree pollen sensed by polarization lidar: Depolarizing biogenic chaff, Geophys. Res. Lett., 35, L18810, https://doi.org/10.1029/2008GL035085, 2008. a
Sauvageat, E., Zeder, Y., Auderset, K., Calpini, B., Clot, B., Crouzy, B., Konzelmann, T., Lieberherr, G., Tummon, F., and Vasilatou, K.: Real-time pollen monitoring using digital holography, Atmos. Meas. Tech., 13, 1539–1550, https://doi.org/10.5194/amt-13-1539-2020, 2020. a
Shang, X., Giannakaki, E., Bohlmann, S., Filioglou, M., Saarto, A., Ruuskanen, A., Leskinen, A., Romakkaniemi, S., and Komppula, M.: Optical characterization of pure pollen types using a multi-wavelength Raman polarization lidar, Atmos. Chem. Phys., 20, 15323–15339, https://doi.org/10.5194/acp-20-15323-2020, 2020. a, b, c, d, e
Shang, X., Baars, H., Stachlewska, I. S., Mattis, I., and Komppula, M.: Pollen observations at four EARLINET stations during the ACTRIS-COVID-19 campaign, Atmos. Chem. Phys., 22, 3931–3944, https://doi.org/10.5194/acp-22-3931-2022, 2022. a, b
Sicard, M., Izquierdo, R., Alarcón, M., Belmonte, J., Comerón, A., and Baldasano, J. M.: Near-surface and columnar measurements with a micro pulse lidar of atmospheric pollen in Barcelona, Spain, Atmos. Chem. Phys., 16, 6805–6821, https://doi.org/10.5194/acp-16-6805-2016, 2016. a
Steiner, A. L., Brooks, S. D., Deng, C., Thornton, D. C. O., Pendleton, M. W., and Bryant, V.: Pollen as atmospheric cloud condensation nuclei, Geophys. Res. Lett., 42, 3596–3602, https://doi.org/10.1002/2015GL064060, 2015. a
Vakkari, V., Manninen, A. J., O'Connor, E. J., Schween, J. H., van Zyl, P. G., and Marinou, E.: A novel post-processing algorithm for Halo Doppler lidars, Atmos. Meas. Tech., 12, 839–852, https://doi.org/10.5194/amt-12-839-2019, 2019. a
Vakkari, V., Baars, H., Bohlmann, S., Bühl, J., Komppula, M., Mamouri, R.-E., and O'Connor, E. J.: Aerosol particle depolarization ratio at 1565 nm measured with a Halo Doppler lidar, Atmos. Chem. Phys., 21, 5807–5820, https://doi.org/10.5194/acp-21-5807-2021, 2021. a, b, c, d, e
Veselovskii, I., Goloub, P., Podvin, T., Bovchaliuk, V., Derimian, Y., Augustin, P., Fourmentin, M., Tanre, D., Korenskiy, M., Whiteman, D. N., Diallo, A., Ndiaye, T., Kolgotin, A., and Dubovik, O.: Retrieval of optical and physical properties of African dust from multiwavelength Raman lidar measurements during the SHADOW campaign in Senegal, Atmos. Chem. Phys., 16, 7013–7028, https://doi.org/10.5194/acp-16-7013-2016, 2016. a
Veselovskii, I., Hu, Q., Goloub, P., Podvin, T., Korenskiy, M., Derimian, Y., Legrand, M., and Castellanos, P.: Variability in lidar-derived particle properties over West Africa due to changes in absorption: towards an understanding, Atmos. Chem. Phys., 20, 6563–6581, https://doi.org/10.5194/acp-20-6563-2020, 2020. a
Veselovskii, I., Hu, Q., Goloub, P., Podvin, T., Choël, M., Visez, N., and Korenskiy, M.: Mie–Raman–fluorescence lidar observations of aerosols during pollen season in the north of France, Atmos. Meas. Tech., 14, 4773–4786, https://doi.org/10.5194/amt-14-4773-2021, 2021. a
Veselovskii, I., Kasianik, N., Korenskii, M., Hu, Q., Goloub, P., Podvin, T., and Liu, D.: Multiwavelength fluorescence lidar observations of smoke plumes, Atmos. Meas. Tech., 16, 2055–2065, https://doi.org/10.5194/amt-16-2055-2023, 2023. a
Wiegner, M. and Gasteiger, J.: Correction of water vapor absorption for aerosol remote sensing with ceilometers, Atmos. Meas. Tech., 8, 3971–3984, https://doi.org/10.5194/amt-8-3971-2015, 2015. a, b
Williams, C. G. and Després, V.: Northern Hemisphere forests at temperate and boreal latitudes are substantial pollen contributors to atmospheric bioaerosols, Forest Ecol. Manag., 401, 187–191, https://doi.org/10.1016/j.foreco.2017.06.040, 2017. a
Wozniak, M. C., Solmon, F., and Steiner, A. L.: Pollen Rupture and Its Impact on Precipitation in Clean Continental Conditions, Geophys. Res. Lett., 45, 7156–7164, https://doi.org/10.1029/2018GL077692, 2018. a