the Creative Commons Attribution 4.0 License.
the Creative Commons Attribution 4.0 License.
 | 11 Aug 2023
Characterization of gas and particle emissions from open burning of household solid waste from South Africa
Hatef Firouzkouhi
Judith C. Chow
John G. Watson
Warren Carter
Alexandra S. M. De Vos
Open burning of household and municipal solid waste is a frequent practice in many developing countries. Due to limited resources for collection and proper disposal, solid waste is often disposed of in neighborhoods and open-burned in piles to reduce odors and create space for incoming waste. Emissions from these ground-level and low-temperature burns cause air pollution, leading to adverse health effects among community residents. In this study, laboratory combustion experiments were conducted to characterize gas and particle emissions from 10 waste categories representative of those burned in South Africa: paper, leather/rubber, textiles, plastic bottles, plastic bags, vegetation (with three different moisture content levels), food discards, and combined materials. Carbon dioxide (CO2) and carbon monoxide (CO) were measured in real time to calculate modified combustion efficiencies (MCEs). MCE is used along with video observations to determine fuel-based emission factors (EFs) during flaming and smoldering phases as well as the entire combustion process. Fuel elemental composition and moisture content have strong influences on emissions. Plastic bags have the highest carbon content and the highest combustion efficiency, leading to the highest EFs for CO2. Textiles have the highest nitrogen and sulfur content, resulting in the highest EFs for nitrogen oxides (NOx) and sulfur dioxide (SO2). Emissions are similar for vegetation with 0 % and 20 % moisture content; however, EFs for CO and particulate matter (PM) from the vegetation with 50 % moisture content are 3 and 20–30 times, respectively, those from 0 % and 20 % moisture content. This study also shows that neglecting carbon in the ash and PM can lead to significant overestimation of EFs. Results from this study are applicable to emission inventory improvements as well as air quality management to assess the health and climate effects of household-waste open burning.
- Article
(2835 KB) - Full-text XML
-
Supplement
(6372 KB) - BibTeX
- EndNote


Solid-waste management is a global environmental challenge. Approximately 2×10⁹ t per year of municipal solid waste (MSW) is generated globally (Wilson and Velis, 2015). Even though high-income countries have higher per capita MSW generation, waste generation in middle- and low-income countries is growing rapidly due to population growth and economic development (Ferronato and Torretta, 2019). Waste disposal practices include collection, recycling, land filling, incineration, and open burning (Wilson and Velis, 2015; Wiedinmyer et al., 2014). In contrast to the nearly 100 % collection and controlled disposal rates in high- and upper-middle-income countries, low-income countries often have collection rates of less than 50 %, with nearly 0 % controlled disposal common in rural areas. It is estimated that at least 2 billion people worldwide still lack access to solid-waste collection, treatment, or disposal services and infrastructure (Cook and Velis, 2021; Wilson et al., 2015).
In rural communities of developing countries, particularly regions where waste collection service is expensive, unavailable, or infrequent, uncontrolled open burning of household solid waste is a common practice for decreasing MSW mass and volume, reducing unpleasant odors from decomposing materials, fueling heating and cooking activities, and destroying pathogens (Cook and Velis, 2021). Globally, about half of the household waste (i.e., about 1×10⁹ t) is burned in open, uncontrolled fires every year. Open burning is conducted by not only community members but also municipal authorities. Although perceived as a cost-effective method of waste disposal, uncontrolled solid-waste open burning generates a wide range of hazardous substances that pose threats to human health and contribute to climate change (Wiedinmyer et al., 2014; Lemieux et al., 2004). These air contaminants include criteria pollutants, such as carbon monoxide (CO), nitrogen dioxide (NO2), sulfur dioxide (SO2), particulate matter with aerodynamic diameter ≤2.5 µm (PM2.5) and ≤10 µm (PM10), and lead. Burning also emits other air toxics, such as heavy metal elements, polychlorinated and polybrominated dioxins and furans, and polycyclic aromatic hydrocarbons (PAHs) (Velis and Cook, 2021; Wiedinmyer et al., 2014). Many of these pollutants are carcinogenic or mutagenic; they may cause immunological and developmental impairments and lead to respirable and cardiovascular diseases. It is estimated that exposure to PM2.5 from open burning of solid waste causes at least 270 000 premature deaths in the world every year (Williams et al., 2019; Kodros et al., 2016). In addition, open burning emits large amounts of carbon dioxide (CO2) and light-absorbing carbon (including black carbon, BC), two of the largest climate forcers of global warming (Bond et al., 2013; IPCC, 2013).
Despite the global health crisis and potential climate impacts caused by uncontrolled solid-waste open burning, the quantity of pollutant emissions is uncertain. Due to a lack of data, household-solid-waste open-burning emissions are not often included in regional, national, or global emission inventories (Wiedinmyer et al., 2014). Estimating household-waste-burning emissions faces two challenges: (1) it is difficult to estimate when, where, and how much burning occurs (activities), and (2) few studies have systematically quantified representative open-burning emission factors (EFs; i.e., amount of pollutant emitted per kilogram of fuel burned).
Several approaches have been used to derive EFs. The Intergovernmental Panel on Climate Change (IPCC, 2006) calculates CO2 EFs from carbon content in several categories of solid-waste fuels. Bond et al. (2004) used a single PM10 EF value of 30 g kg−1 to represent all solid-waste open burning when establishing a global inventory of black and organic carbon emissions. The US Environmental Protection Agency (US EPA) tested solid-waste emissions when compiling and validating EFs in its AP-42 Compilation of Air Emissions Factors (U.S. EPA, 1992; Gerstle and Kemnitz, 1967; Lemieux, 1997, 1998). However, many of the fuels do not represent modern waste materials, and the applied measurement technologies are outdated. Other studies acquired laboratory emissions for several waste categories, such as shredded tires, plastic bags, and mixed garbage (Stockwell, 2016; Yokelson et al., 2013; Cheng et al., 2020), and several field measurements were conducted in Nepal and China (Stockwell et al., 2016; Jayarathne et al., 2018; Wu et al., 2021). While EFs for biomass burning are available, data for other waste categories, particularly those in Africa, are scant (Rabaji, 2019; Kwatala et al., 2019). Developing more reliable EFs that represent real-world conditions has been identified as a research priority to reduce harm from solid-waste open burning (Cook and Velis, 2021).
To improve emission inventories, comprehensive laboratory combustion experiments were conducted to determine household-solid-waste-burning emissions. The tested waste materials were collected from the Waste Collection Interventions (WCI) program implemented by Sasol, a petrochemical and energy company in South Africa, to assist the local Zamdela community in MSW collection and disposal in landfills to minimize open burning and improve air quality in communities near Sasol facilities. EFs for criteria pollutants from smoldering and flaming phases as well as the entire combustion process are reported for 10 waste materials representing those commonly disposed of in South Africa.
2.1 Waste materials
The mass distribution of common waste material categories that are burned in South Africa townships is shown in Fig. 1. Vegetation had the highest weight percent (33.3 %), followed by plastics (20 %) and paper (19.5 %). Examples of major waste categories included in this study are illustrated in Fig. S1 in the Supplement. Due to difficulties in preserving and importing food discards and vegetation, local substitutes (Nevada, USA) were used. Food waste was represented by a mixture of bread, potato skins and banana peels, lettuce, cucumbers, and tomatoes (Cronje et al., 2018). Vegetation samples were collected in Nevada to represent similar species in South Africa, including basin wild rye, Sandberg bluegrass, crested wheat grass, red willows, and creeping wild rye, typical of African bunch grasses, African sumac, and crab grass. EFs for glass, metals, and ceramics were not separately measured as they do not combust or degrade at open-burning temperatures. However, to simulate their potential effects on combustion, these discards were included in the laboratory testing with combined waste materials. Ten types of waste categories/conditions were tested: (1) paper, (2) leather/rubber, (3) textiles, (4) plastic bottles and food containers (hard plastics), (5) plastic bags (soft plastics), (6) dry vegetation (0 % moisture content), (7) natural vegetation (20 % moisture content), (8) damp vegetation (50 % moisture content), (9) food discards, and (10) combined materials. The combined materials were mixtures of all categories based on their mass fractions in Fig. 1. Each category was tested at least three times, with the exception of vegetation with 20 % and vegetation with 50 % moisture content, which were each tested twice.
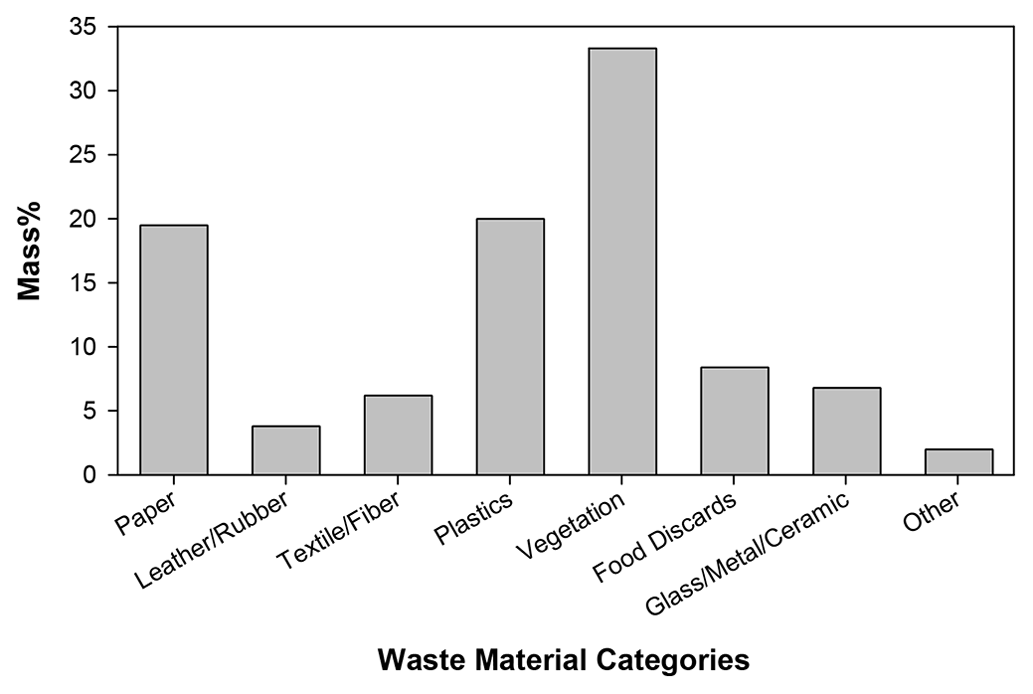
Figure 1Mass fraction of MSW categories collected by Sasol's Waste Collection Interventions (WCI) program in Zamdela, South Africa.
Because fuel moisture content affects combustion behavior and emissions (Rein et al., 2008; Chen et al., 2010), the moisture content of waste materials was measured right after field collection, ranging from 0.5 % to 35 % (Table S1). To account for moisture changes during shipping and storage, all materials (except food discards) were oven-dried at 90 ∘C for 24 h. A calculated amount of distilled deionized water (DDW) was then added to the dried materials to achieve the natural moisture levels shown in Table S1. These moisturized materials were sealed in airtight bags to equilibrate for at least 24 h before testing. Fresh food discards were tested without drying or re-moisturizing to avoid irreversible changes. The moisture content for the combined waste was calculated as the sum of the mass-weighed moisture content in individual waste categories.
Table S2 shows the major elemental compositions (i.e., carbon, C; hydrogen, H; nitrogen, N; sulfur, S; and oxygen, O) of the waste materials measured by an elemental analyzer (Model Flash EA1112, Thermo Scientific). Plastic bags (84 %) and plastic bottles (64 %) have higher carbon content than other materials (33 %–48 %). This carbon content falls within the IPCC (2006) range for all materials except the leather/rubber category: 33 % (this study) vs. 67 % (IPCC, 2006). The single synthetic leather/rubber piece (a car floor mat) measured in this study may not be representative of all such materials available elsewhere. Unlike other waste categories, IPCC (2006) does not give a range of carbon content for leather/rubber, indicating a need for a wider range of testing for this category. The textile category contained the highest nitrogen (8 %) and sulfur (0.71 %) content, while most other materials yielded sulfur content below the minimum detection limit. The paper category had the highest oxygen content (44 %), followed by vegetation and food discards (41 %–42 %). The lowest (∼3 %) oxygen was found for soft plastic bags.
After combustion, the ash was weighed to calculate its mass fraction related to the original dry material mass, ranging from 2 % to 58 % (Table S3). The C, H, N, and S content of the ash was also measured by the elemental analyzer, and the ash carbon content was used in the EF calculation.
2.2 Combustion experiments
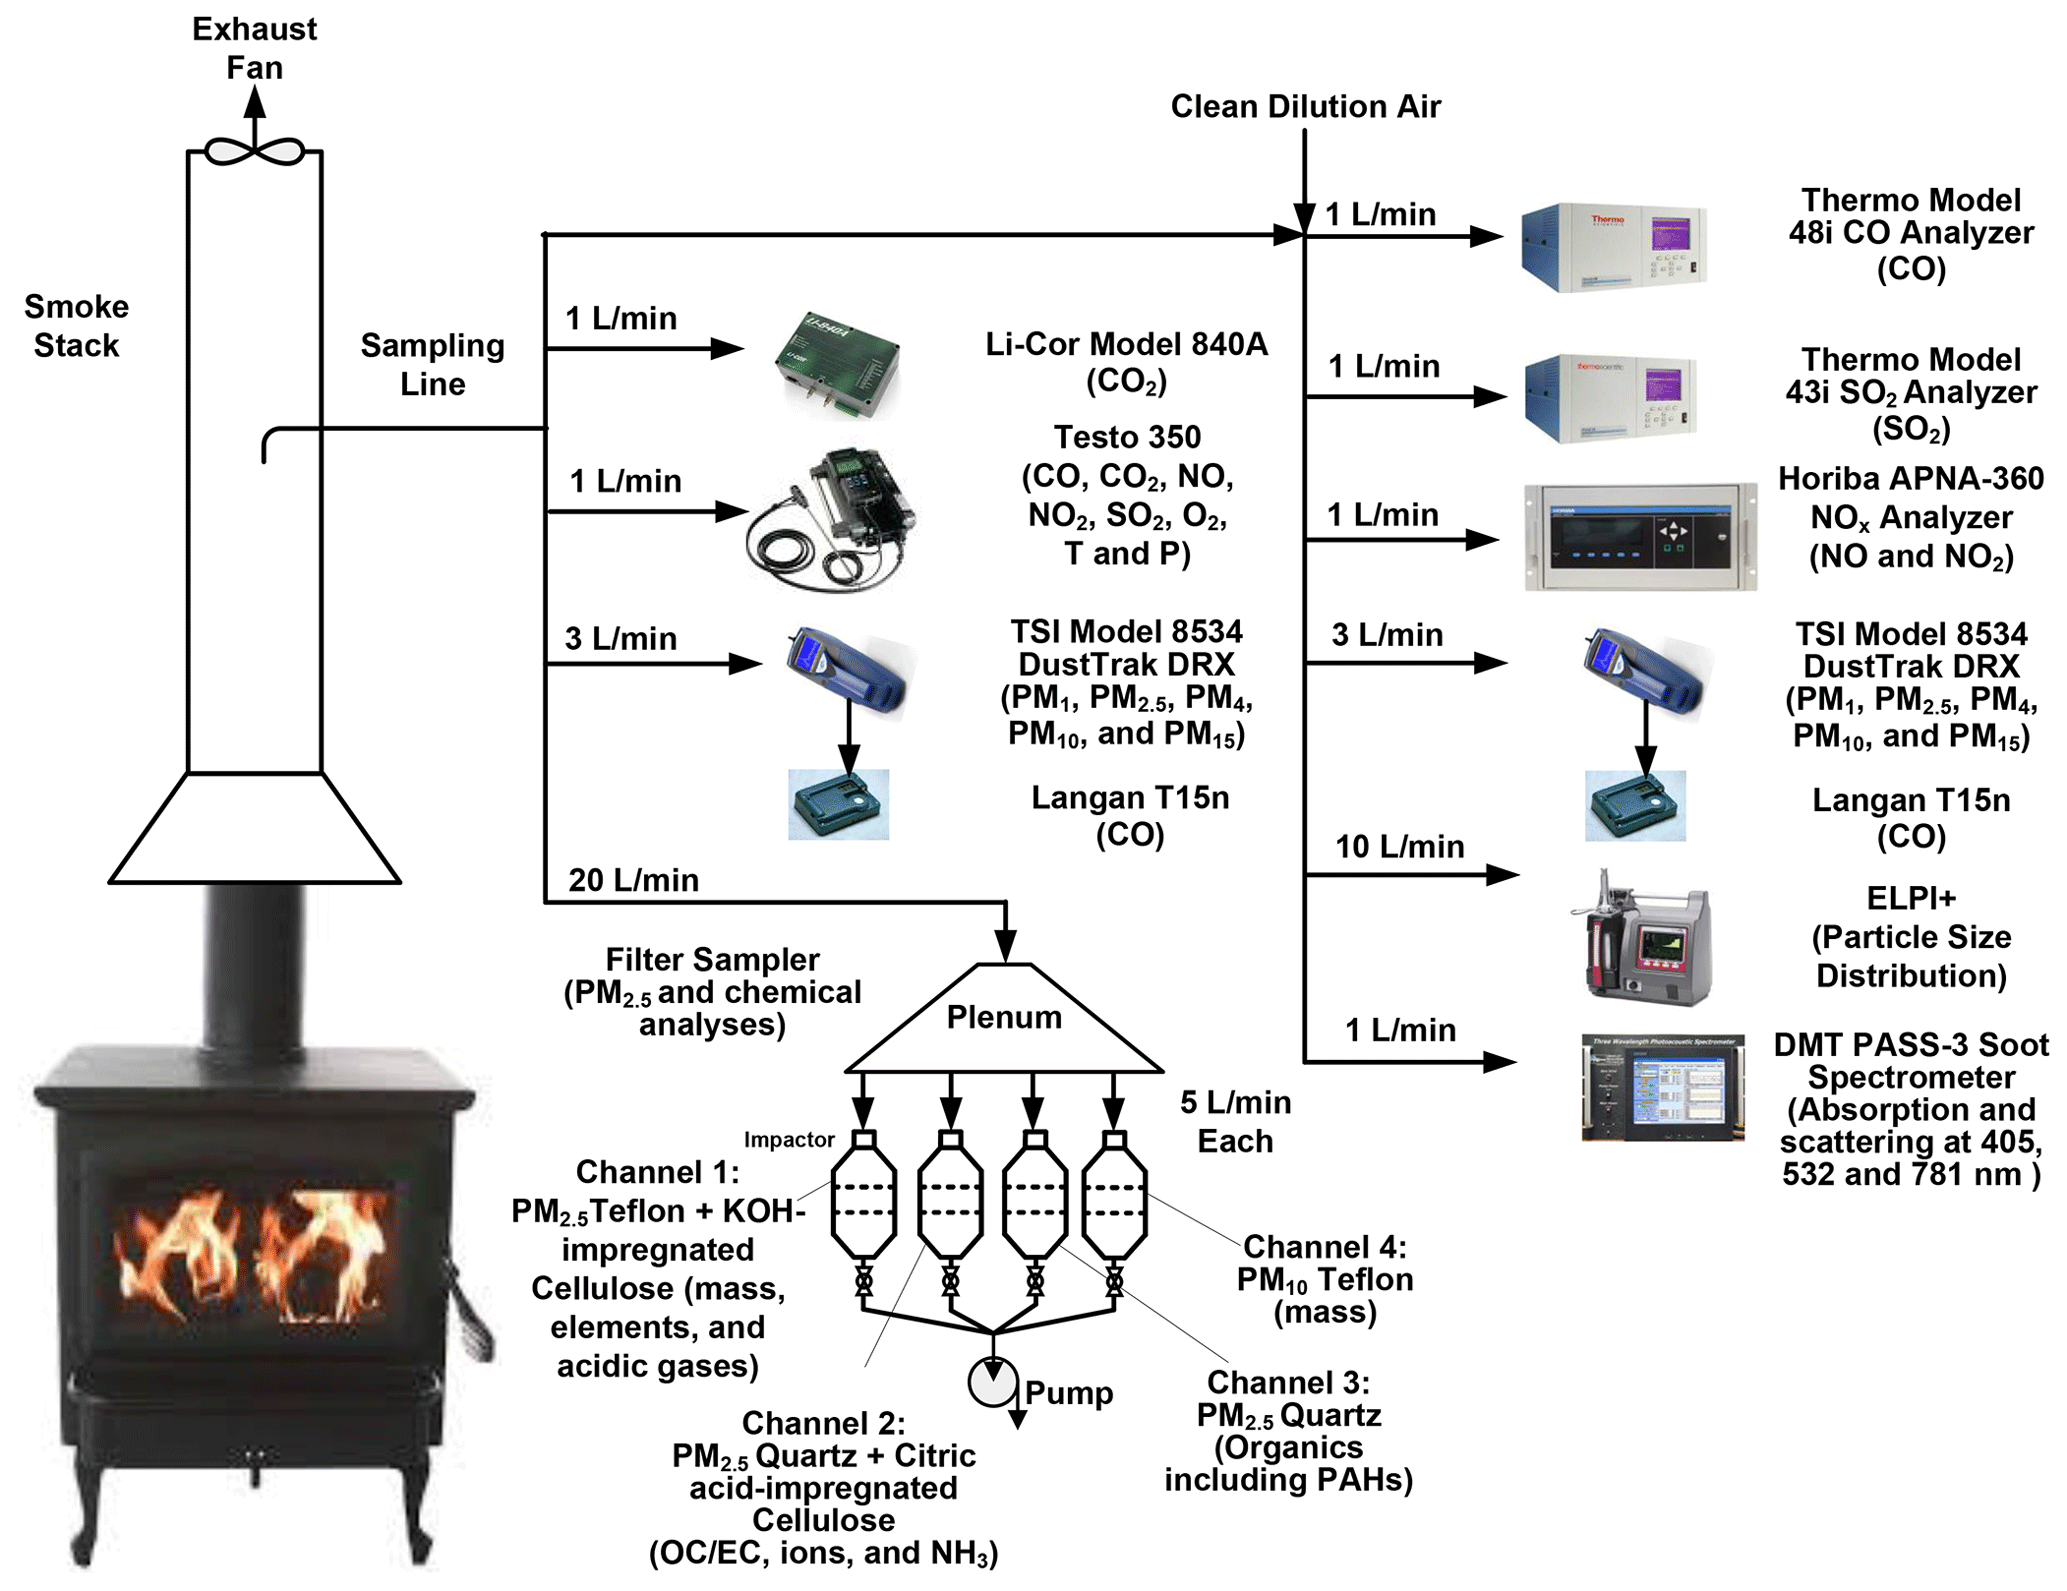
The experimental setup is shown in Fig. 2 and is similar to the ones used in previous studies (Chen et al., 2010; Chow et al., 2019; Tian et al., 2015; Wang et al., 2019, 2020b). Key specifications for gas and particle measurement instruments are listed in Table S4. For each experiment, a small amount (0.5–20 g) of waste material was placed in a ceramic crucible inside a woodstove, then quickly heated to and maintained at 450 ∘C by a temperature-controlled heater to simulate large-scale open burning. The heater accounts for open-burning temperatures surrounding the fuel materials that could be much higher than those produced by laboratory fuels (Chen et al., 2010; Chow et al., 2019). Flammable waste materials (i.e., paper, textiles, plastic bags, dry and natural moist vegetation, and combined waste) were ignited by an electric heat gun or a butane lighter. For nonflammable materials (i.e., leather/rubber, plastic bottles, damp vegetation, and food discards), smoldering emissions were measured when the materials were heated to 450 ∘C. Each test started with about 5 min of sampling of background concentrations and ended when pollutant concentrations returned to baselines. Elapsed time varied from 1000 to 4000 s for each burn, with typical run times of 30 min per sample. An exhaust fan drew fresh air through the stove inlet and vented the smoke above the roof via the stack. Temperature and relative humidity (RH) of the exhaust air were monitored by a hygrometer (Model HH314A, Omega). A web camera inside the stove recorded the combustion process.
During combustion, major fuel components of C, H, N, and S are oxidized to generate carbon dioxide (CO2), carbon monoxide (CO), water (H2O), oxides of nitrogen (NOx), sulfur dioxide (SO2), volatile organic compounds (VOCs), and particulate matter (PM) (Akagi et al., 2011). The air sample was extracted from the stack through a sampling line and directed to a suite of gas and particle analyzers (Table S4). CO2 was measured by a CO2 analyzer (Model 840A, LI-COR). CO was measured by a CO analyzer (Model 48i, ThermoFisher Scientific), which is designated as a federal equivalent method (FEM) by the US Environmental Protection Agency (US EPA). SO2 was measured by a FEM SO2 analyzer (Model 43i, ThermoFisher Scientific). Nitric oxide (NO), nitrogen dioxide (NO2), and NOx were measured by a FEM NO–NO2–NOx analyzer (Model APNA-360, Horiba Ltd). An emission analyzer (Model 350 XL, Testo Inc.) provided redundant measurements of CO2, CO, SO2, NO, and NO2 in order to accommodate high concentrations in the event that the FEM analyzers were saturated. In addition, the Testo also measured oxygen (O2), temperature (T), and pressure (P). Size-segregated PM mass concentrations were acquired every second by an aerosol monitor (Model DustTrak DRX, TSI Inc.) in five size fractions (i.e., PM1, PM2.5, PM4, PM10, and PM15) (Wang et al., 2009). Gas and particle analyzers were calibrated before and after experiments. All analyzer responses were quality-checked to ensure readings were within their measurement ranges.
PM2.5 and PM10 samples were collected on Teflon-membrane and quartz-fiber filters. The gravimetric mass concentrations were used to calibrate the real-time mass concentrations by the DRX. Organic and elemental carbon (OC and EC) were analyzed from the quartz-fiber filters using the DRI Model 2015 multiwavelength carbon analyzer following the IMPROVE_A protocol (Chow et al., 2007; Chen et al., 2015). Detailed chemical composition of PM2.5 analyzed from the filters, particle size distribution by the Electrical Low Pressure Impactor (ELPI+), and particle light scattering and absorption by the Photoacoustic Soot Spectrometer (PASS-3) will be reported in future publications.
2.3 Data analysis
Data from real-time gas and particle analyzers were assembled and mapped to a common time stamp with 1 s time resolution. Time series of gas and particle concentrations were aligned to account for their different transport and response times. Calibration factors were applied to each analyzer. Modified combustion efficiency (MCE) was calculated as
where ΔCO2 and ΔCO are CO2 and CO concentrations above background concentrations. MCE provides a real-time indicator of the combustion phase (i.e., MCE ≥ 0.9 for flaming and MCE < 0.9 for smoldering) (Reid et al., 2005; Yokelson et al., 1996; Wang et al., 2020a).
Fuel-based emission factors (EFp,i's) were calculated based on carbon mass balance as (Wang et al., 2019; Chen et al., 2007; Moosmüller et al., 2003)
where EFp,i is the emission factor of pollutant p from waste material i in grams per kilogram of fuel; CMFfuel is the carbon mass fraction of the fuel in grams of carbon per gram of fuel (Table S2); CMFash is the carbon mass fraction of the ash in grams of carbon per gram of ash (Table S3); mash and mfuel are the mass of ash and fuel in grams, respectively; Cp is the mean plume concentration of pollutant p in grams per cubic meter averaged over the calculation period (i.e., flaming, smoldering, or entire combustion process); and CCO and are the mean concentrations of CO2 and CO in grams per cubic meter, respectively. CPM is the mean total carbon (TC = OC + EC) concentration in PM10 in grams per cubic meter. MC, , and MCO are the atomic or molecular weights of carbon, CO2, and CO in grams per mole, respectively. The factor of 1000 converts mass from kilograms to grams. Equation (2) assumes that the carbon mass in emissions other than CO2, CO, and PM10 is negligible, which is a reasonable assumption for such burns. However, it is recognized that some carbon will be emitted as methane (CH4) and VOCs, causing the EFs determined by Eq. (2) to be slightly overestimated. For waste materials that had both flaming and smoldering combustions, the split points between the two phases were determined from the burn video recording and MCE. EFp,i's for flaming, smoldering, and the entire burning process were calculated. Means and standard deviations of EFp,i for each waste category and/or burn condition were calculated from repeated tests.
3.1 Evolution of air pollutants during combustion
Time series plots of criteria pollutant concentrations, along with photographs of the waste materials, ash, and sample filters for each waste category, are presented in Sect. S3 in the Supplement to provide more details on the emission evolution, flaming vs. smoldering phases, ash content, and potential light absorption properties for each fuel. Results for plastic bottles and bags are presented below to illustrate experimental findings from smoldering- and flaming-dominated combustions, respectively.
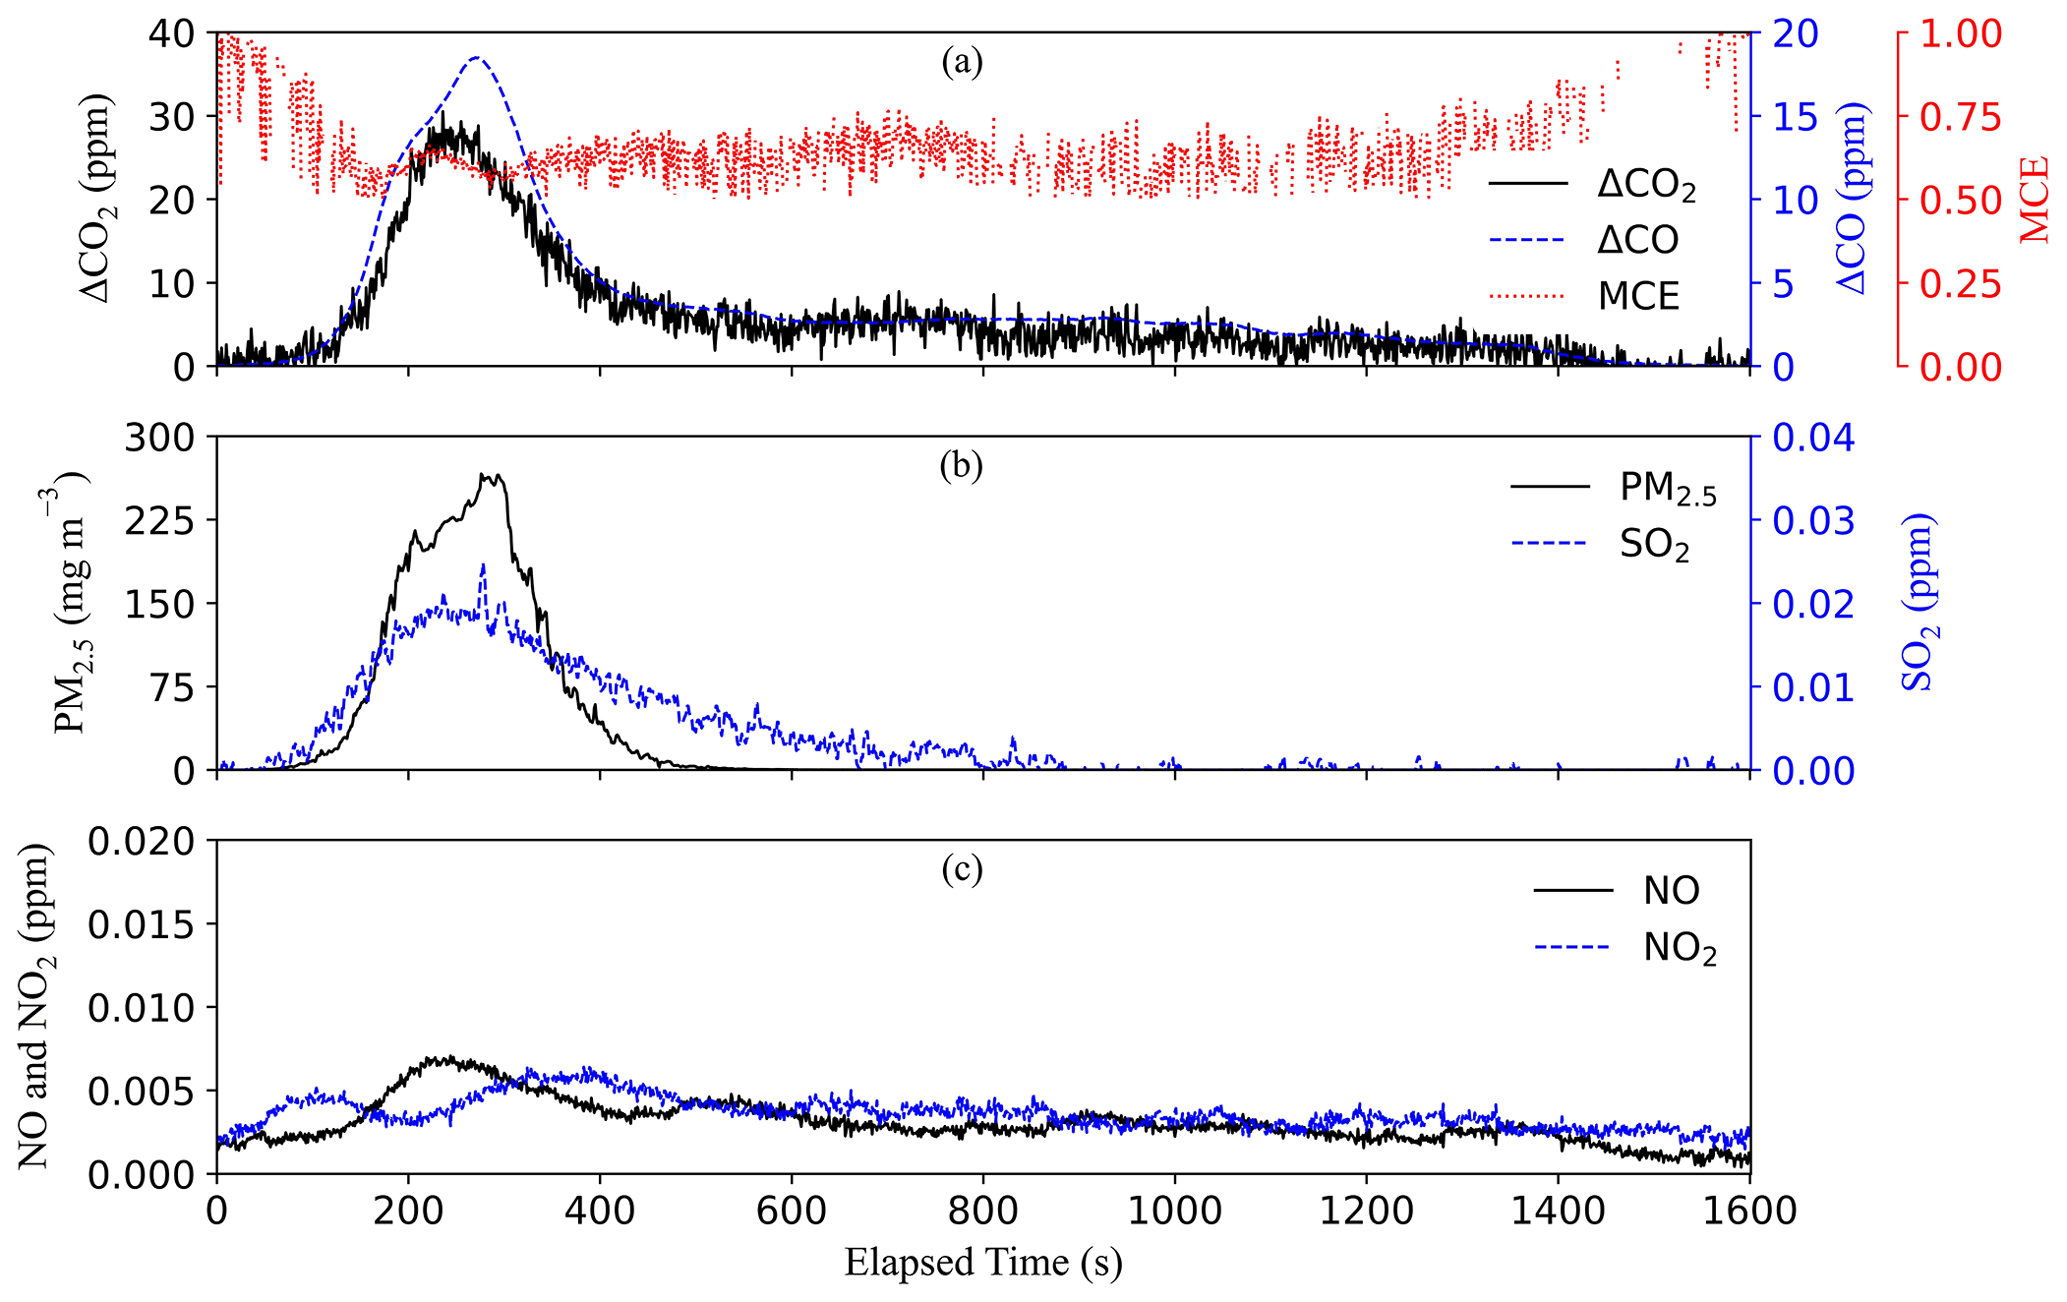
Trial burns with ∼5 g of mixed plastic bottles generated very high PM concentrations that clogged filters and overloaded real-time particle sampling instruments. The final tests utilized 0.5 g of this material moisturized to 0.54 % water content (Fig. S13a). As shown in Fig. 3, smoldering started ∼100 s after initial heating with low CO2 and CO concentrations. PM emissions were the highest among all the waste materials and likely formed from condensation of semivolatile thermal-decomposition products, such as carboxylic acids and hydroxyl esters including phthalates (Sovová et al., 2008; Holland and Hay, 2002). The MCE was only ∼0.6 during most of the duration of the burn, indicating low combustion efficiencies. NOx concentrations were only slightly above the background levels during the peak emission period, likely due to the low combustion temperatures, low nitrogen content of the plastic bottles (Table S2), and a small quantity of materials burned.
For the plastic bag experiment, 5 g of mixed soft plastic bags (Fig. S16a) were prepared with 0.54 % moisture content. Flaming started ∼150 s after ignition, causing all pollutant concentrations to increase (Fig. 4). In contrast to the smoldering-only plastic bottle combustion, flaming dominated the combustion of soft plastics, generating ∼20 times higher CO2 and CO concentrations. The shaded area in Fig. 4 shows the period during which a flame was visible from the video camera. The MCE was high (>0.94) during most parts of the burn, indicating high combustion efficiencies. Plastic bags produced the highest CO2 and the lowest CO EFs among all test materials, consistent with the high MCEs due to their high C and H content (Table S2). Due to the higher combustion temperatures, NOx concentrations during plastic bag burning were also higher than those during plastic bottle burning. Only a small amount of ash (3.4 %) remained after combustion (Fig. S16b).
Among the 10 waste types, paper, textiles, soft plastic bags, vegetation with dry and natural moisture content, and combined waste had both flaming and smoldering phases. Leather/rubber, plastic bottles, damp vegetation, and food discards only smoldered. Ash residues were the highest for rubber (∼58 %) (Table S3), consistent with its high fraction of elements other than C, H, N, S, and O (Table S2). Similar flaming-dominated burns were found for vegetation with 0 % and 20 % moisture content (Figs. S20 and S21), in contrast to the smoldering-dominated 50 % moist vegetation that charred but did not flame (Fig. S22). The mean MCEs for vegetation with 0 %, 20 %, and 50 % moisture content were ∼0.92, 0.9, and 0.8, respectively, signifying the role of the moisture in the combustion efficiency (Chen et al., 2010).
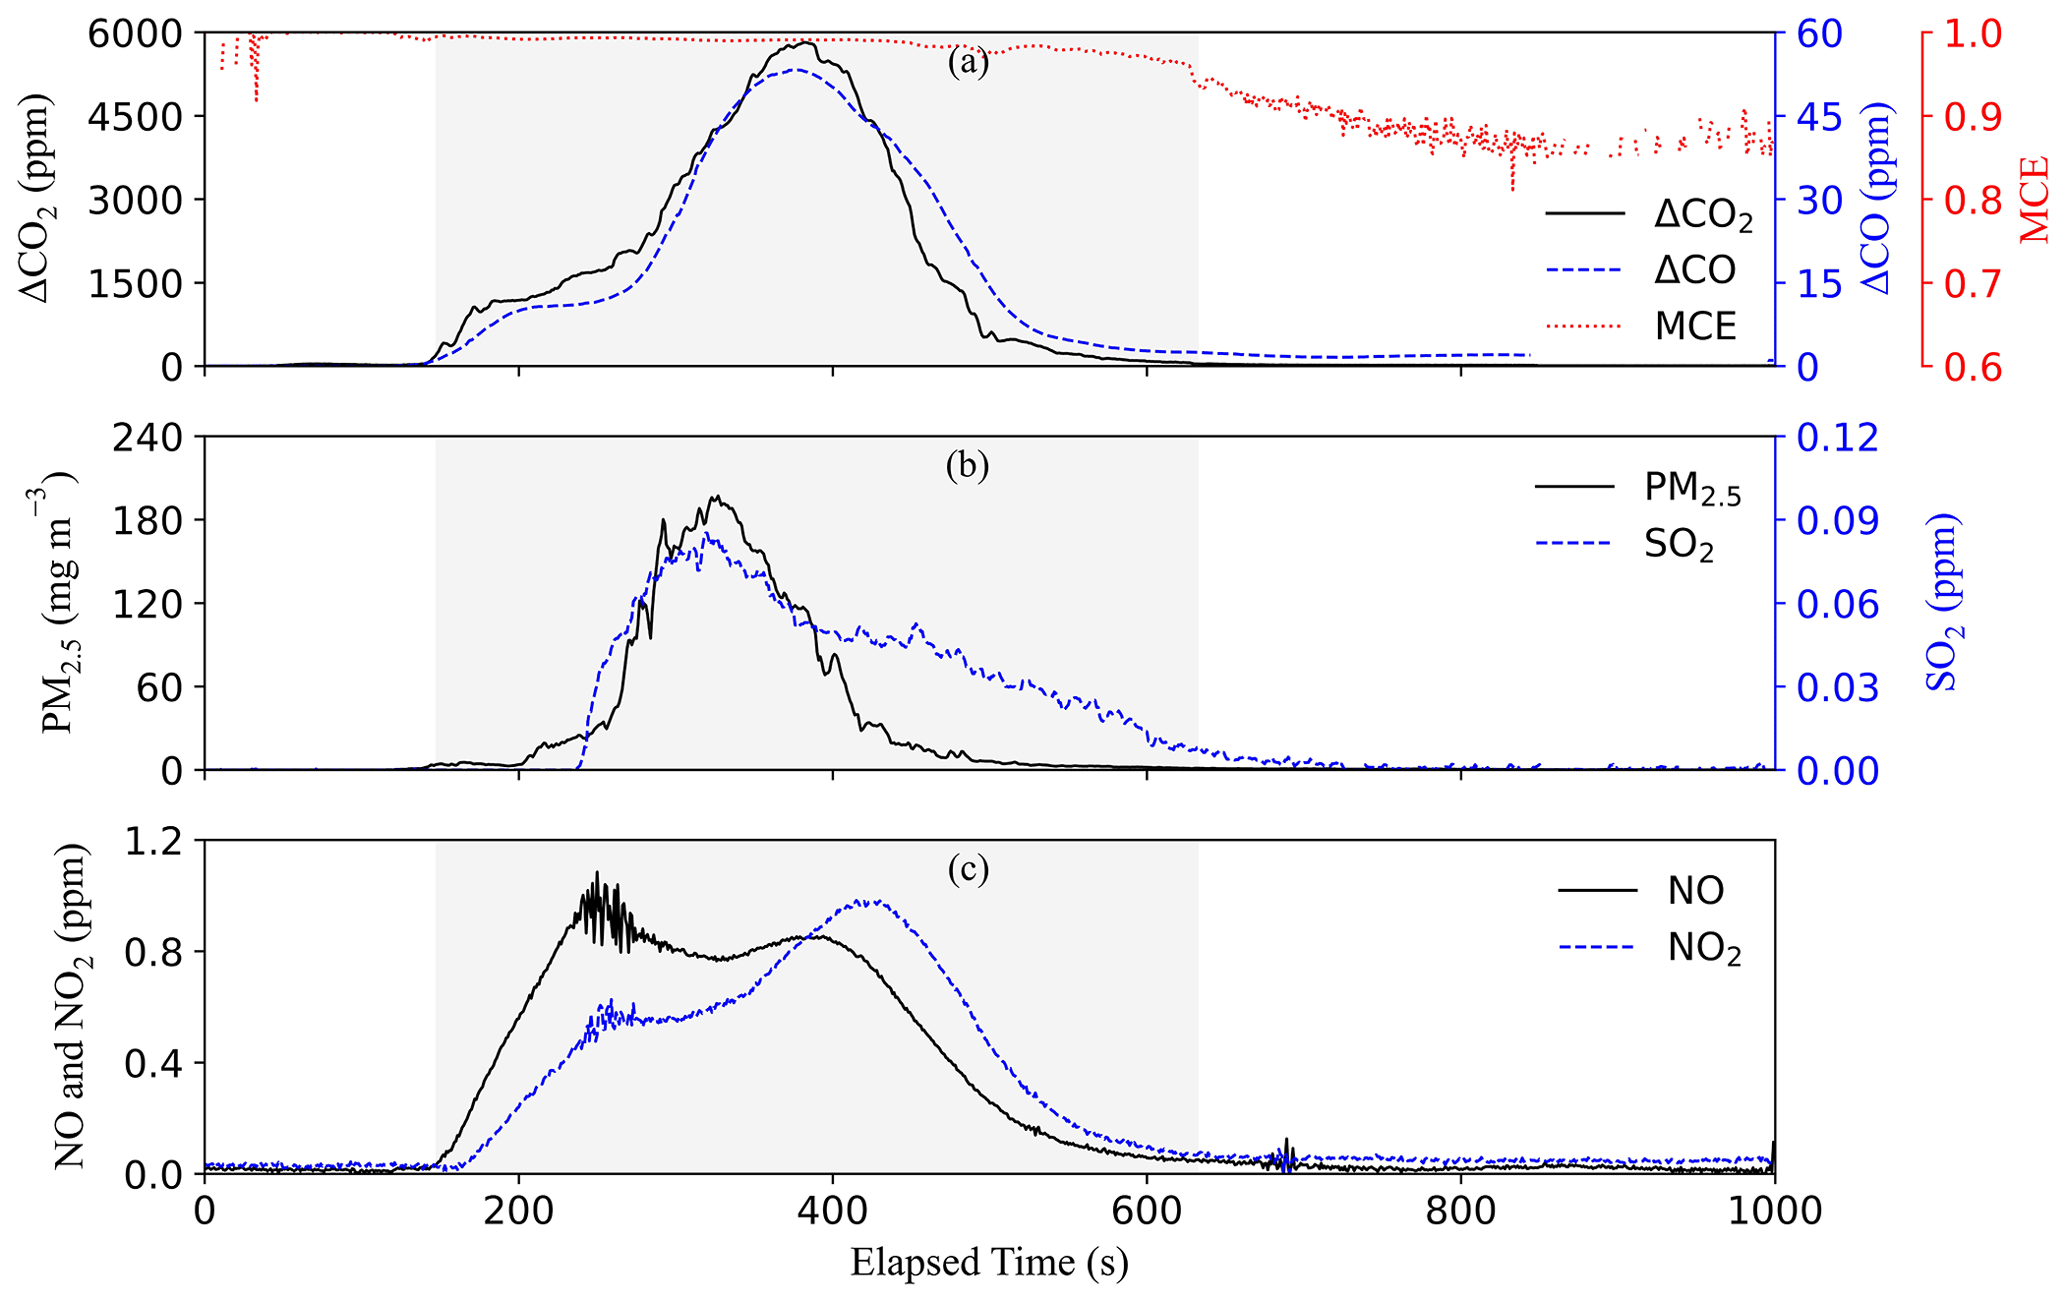
Figure 4Time series of emissions during a plastic-bag-burning experiment. The shaded areas indicate the flaming stage.
3.2 PM2.5, PM10, and particulate carbon
Figure 5 shows high correlations (R2=1) between PM2.5 and PM10 mass for 30 sample sets. The linear regression slopes indicate that PM2.5 constituted ∼93 % of PM10, consistent with findings for combustion emissions reported in the literature (e.g., U.S. EPA, 1992; Lemieux, 1997).
Since the DRX measures PM concentration based on light scattering, and its conversion from the scattering signal to mass concentration depends on particle refractive index, density, and size distribution, the DRX concentrations need to be calibrated with gravimetric concentrations (Wang et al., 2009). The mean DRX and gravimetric PM2.5 and PM10 mass concentrations are highly correlated, with R2 of 0.95–0.96 (Fig. S2). The DRX-measured mass concentrations were about 2 times those by gravimetry (slopes of 1.88 for PM2.5 and 1.82 for PM10). The DRX had an internal custom photometric calibration factor (PCF) of 1.0 and size calibration factor (SCF) of 1.7. The higher DRX-reported concentrations are expected because the standard calibration uses Arizona road dust (ARD) with a density of 2.65 g cm−3 (Wang et al., 2009), while the major compositions of the combustion particles are OC and EC, which have lower densities (∼1.8 and 1.1–1.4 g cm−3, respectively) (Schmid et al., 2009). The DRX concentrations are normalized to the gravimetric PM2.5 and PM10 concentrations for EF calculations.
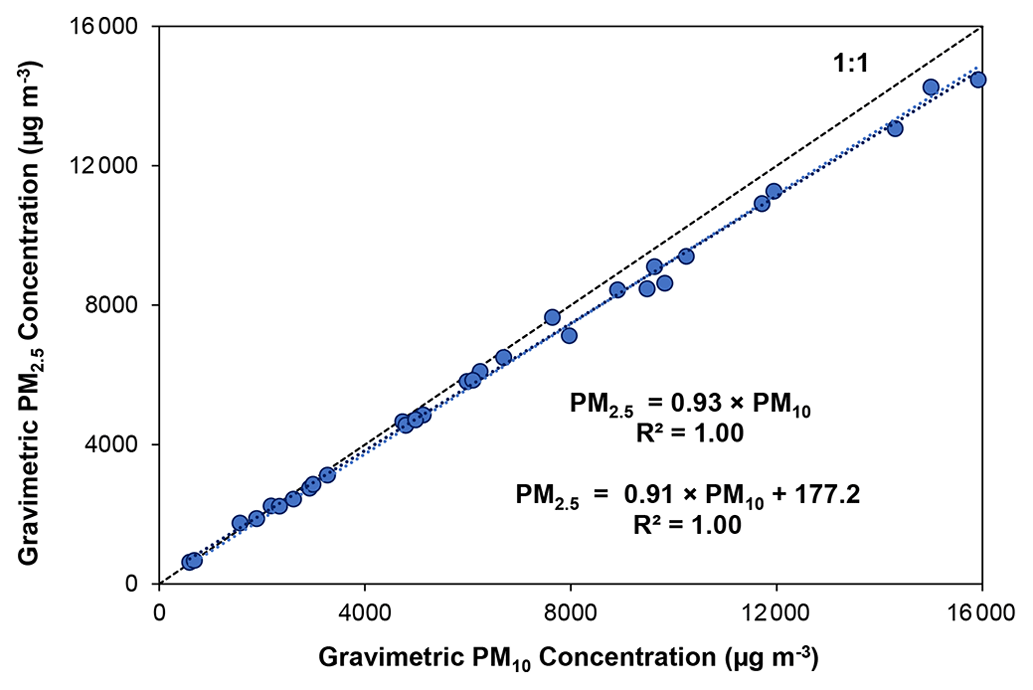
Figure 5Comparison of PM2.5 and PM10 mass concentrations measured from the Teflon-membrane filters.
Carbon is the most abundant PM2.5 component. As shown in Fig. 6, TC contributed 70±11 % (ranging 51 %–94 %) of the PM2.5 mass, with higher OC found in smoldering-dominated materials (i.e., rubber, plastic bottles, damp vegetation, and food discards). The EC fraction increased during flaming combustion, particularly for plastic bags and combined materials. Since PM10 is only ∼7 % higher than PM2.5 (Fig. 5), it is reasonable to assume that PM2.5 and PM10 have comparable TC fractions. The CPM in Eq. (2) was calculated from the TC fraction in PM2.5 (Fig. 6) multiplied by the PM10 mass concentration.
The properties and abundances of OC and EC affect the optical properties of PM emissions. Photographs of sample filters in the insert of Fig. 6 and in Sect. S3 show that particles from flaming-dominated combustion of textiles, plastic bags, and combined materials have gray to black coloration due to high EC abundances. Some OC-abundant filters do not show colors (e.g., rubber and plastic bottles) or show yellow/brown colors (e.g., paper, damped vegetation, and food discards), suggesting the presence of different amounts of brown carbon (Andreae and Gelencsér, 2006; Chen et al., 2021). Quantitative analysis of particle optical properties will be reported in a separate publication.
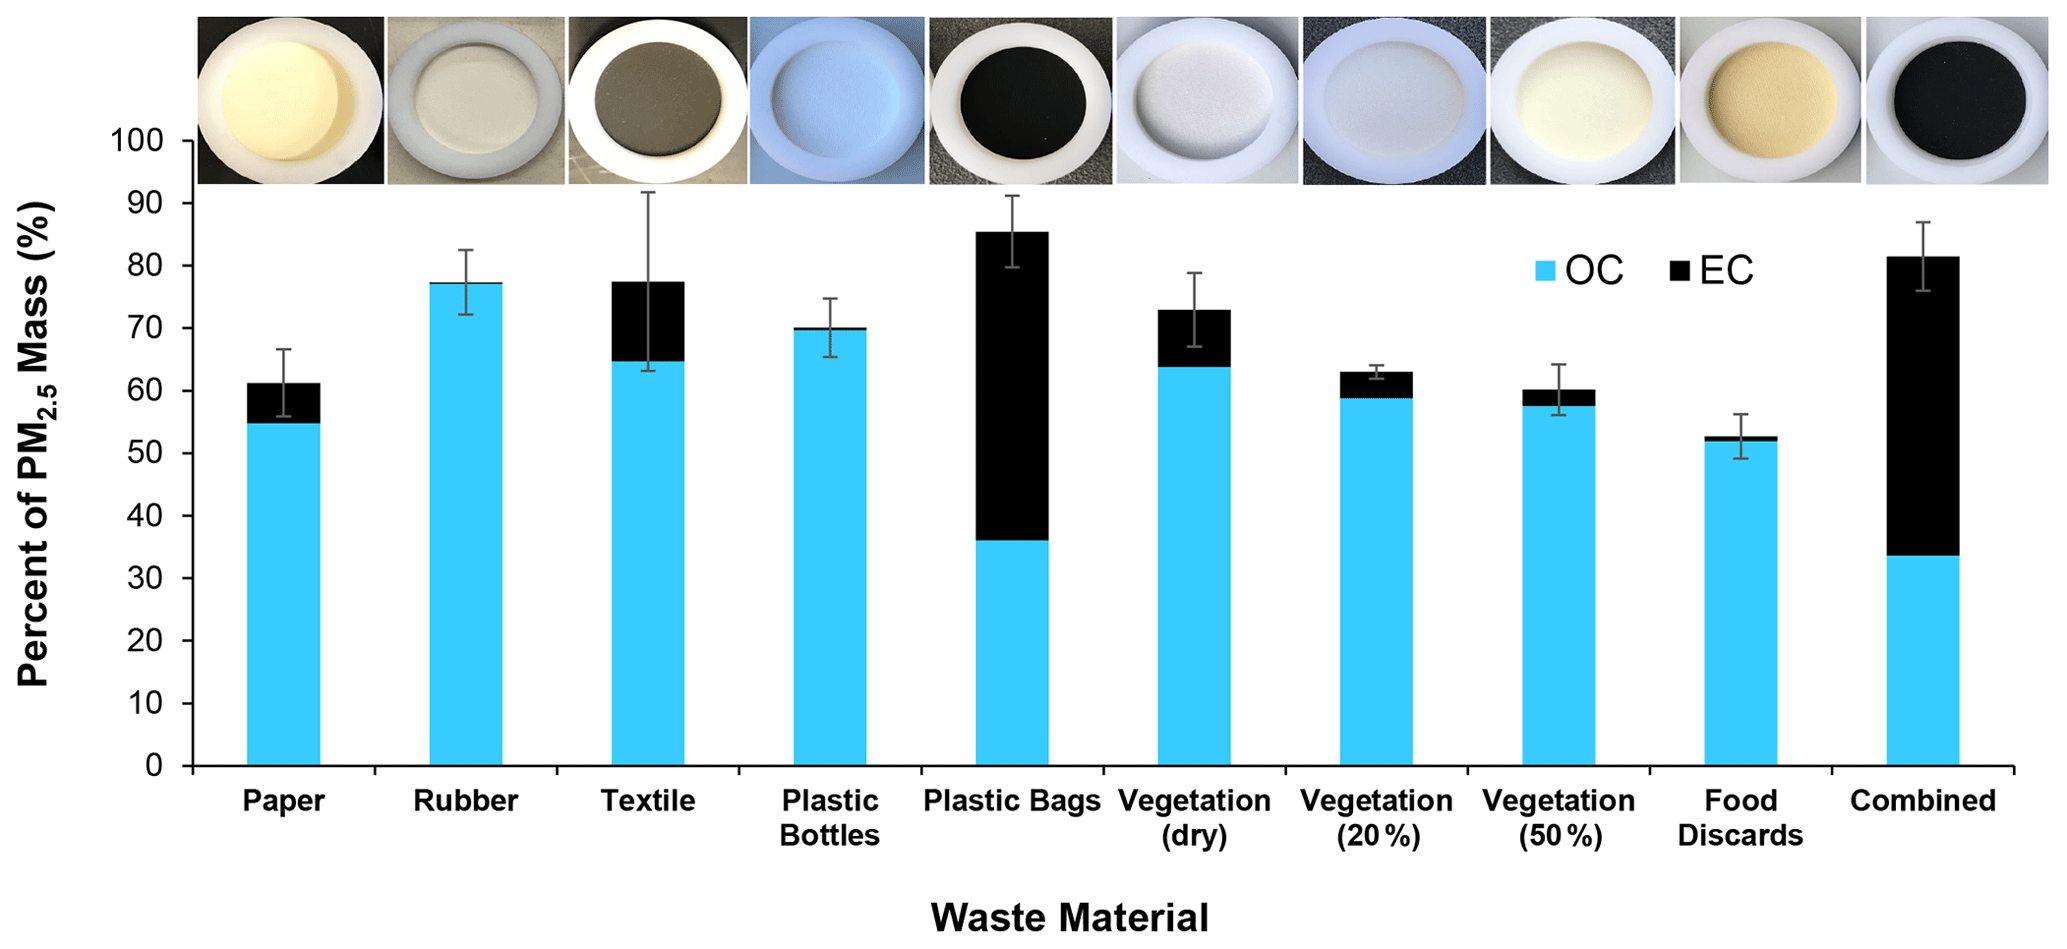
Figure 6Mass percent of organic carbon (OC) and elemental carbon (EC) in PM2.5. The error bar indicates the uncertainty in total carbon (TC = OC + EC), calculated as the larger of the analytical uncertainties and standard deviations of multiple runs. The top row insert shows photographs of representative PM2.5 quartz-fiber filters collected from the burnings of each material.
Table 1Percentage of consumed fuel and emissions during flaming and smoldering phases.
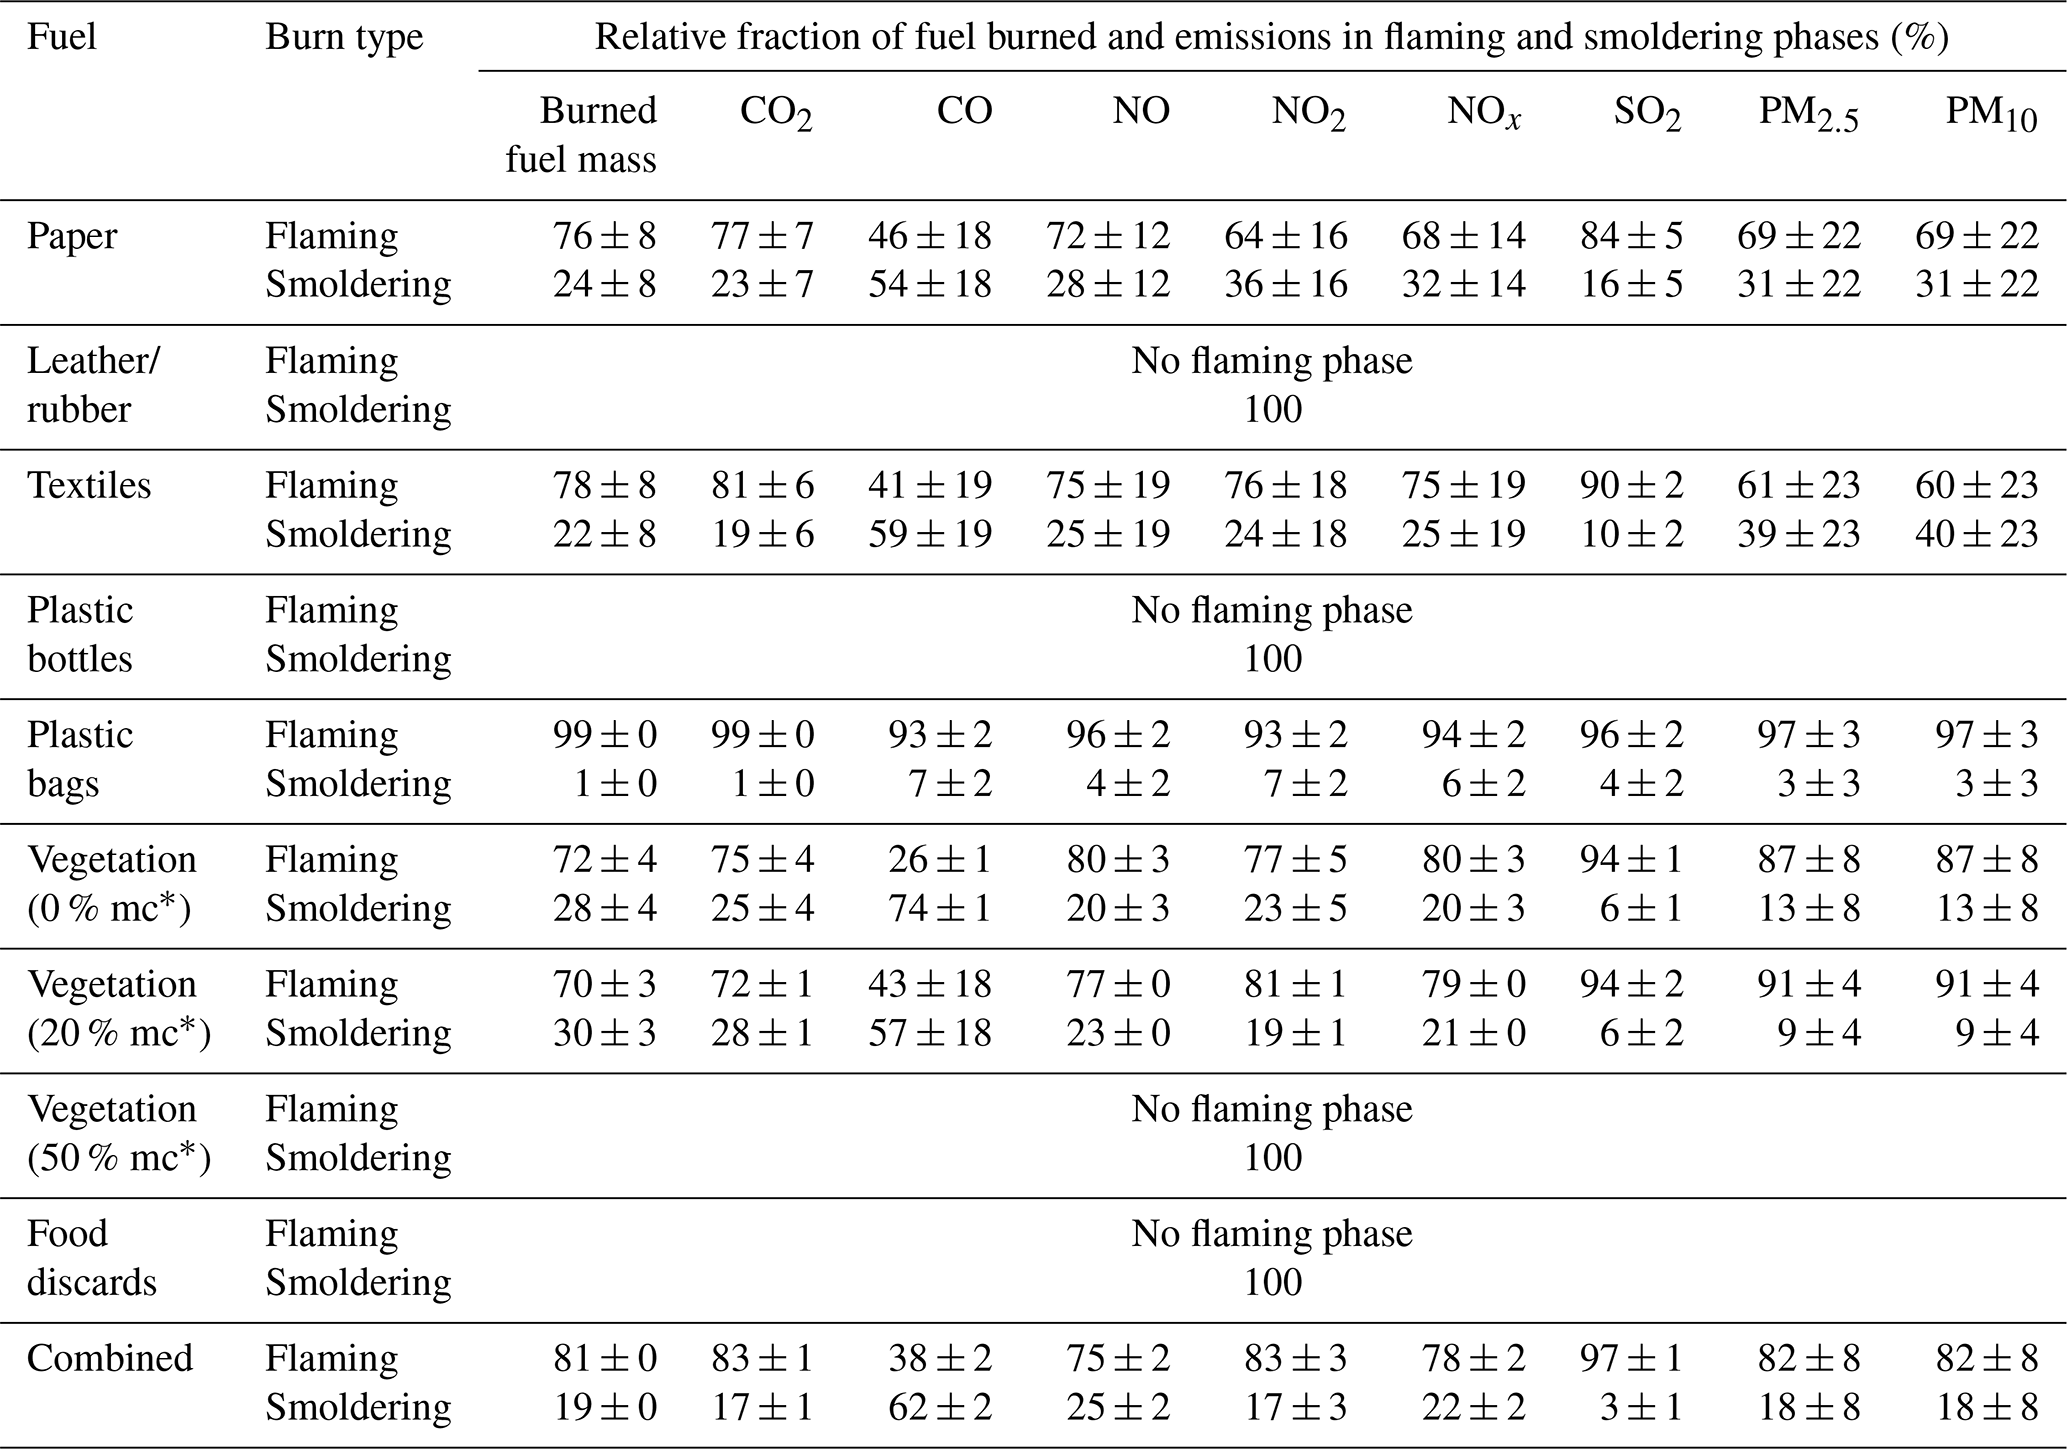
*mc: fuel moisture content.
3.3 Emission factors (EFs) for criteria pollutants
The percentages of consumed waste materials and emissions during flaming and smoldering phases for each category are listed in Table 1. Mean EFs for criteria pollutants are reported in Table 2 for flaming and smoldering phases, as well as for the entire combustion process. The relative standard deviations (RSDs) of total EFs from multiple tests of each material were within 50 % of the mean, showing reproducibility. Except for plastic bags that have high EFs due to high carbon fuel content, total CO2 EFs are relatively consistent for materials that have both flaming and smoldering phases (i.e., paper, textiles, dry and natural vegetation, and combined waste), with an RSD of 3 % and an ANOVA test p value of 0.20, in part due to similar fuel carbon content, as shown in Table S2 (RSD = 6 %). Several exceptions with high RSD (e.g., NOx for textiles and plastic bottles) were due to fuel material heterogeneity or low emission levels. The RSDs for the flaming phases and smoldering phases were higher than those for the entire burns due to a somewhat subjective split between the two phases. Table 3 compares EFs from this study with those reported in the literature for similar fuel materials.
For paper, most of the fuel (76 %) was consumed in the flaming phase (Table 1), consistent with elevated CO2 concentrations (Fig. S4). Approximately 65 %–85 % of pollutants were emitted in the flaming phase, except for CO, which was emitted about equally in both phases. EFs for CO in the smoldering phase were ∼4 times those in the flaming phase. EFs for paper combustion are scarce in the literature (Table 3). Results from this study are close to those reported by Cheng et al. (2020). The EFs for PM2.5 and PM10 are higher than other studies; Park et al. (2013) reported EFs that were an order of magnitude lower than those in this study. Paper briquettes used in the Marshall Islands (Thai et al., 2016; Xiu et al., 2018) likely have different combustion behaviors compared to the open burning of loose paper; therefore, the EFs are not considered to be comparable.
The car-floor-mat synthetic rubber sample only smoldered without flaming, leading to low CO2 and high PM EFs (Table 2). A large fraction (58 %) of material was unburned as ash with 13 % carbon content (Table S3). Field and laboratory studies of tire burning emissions (Ryan, 1989; Downard et al., 2015; Stockwell, 2016) report higher EFs than those found here for most pollutants, but PM10 EFs are similar.
Textile burning consumed 78 % of the mass and emitted 60 %–90 % of pollutants in the flaming phase, while it emitted ∼20 % more CO emissions in the smoldering phase (Table 1). While EFs for CO2 and SO2 were higher in the flaming phase, EFs for CO and PM were higher in the smoldering phase (Table 2). Textile burning had the highest EFs for NOx and SO2 among all tested materials, consistent with higher nitrogen and sulfur content (Table S1). Wesolek and Kozlowski (2002) measured gas emissions during thermal decomposition of natural and synthetic fabrics at 450, 550, and 750 ∘C. The EFs for CO2 and CO from this study fall within the ranges of those reported for different fabrics (Table 3). EFs for NOx and SO2 are higher in this study, likely due to differences in material compositions. EFs from this study are also higher than those reported by Cheng et al. (2020).
Table 2Measured emission factors (mean ± standard deviation) for waste materials tested in this study.
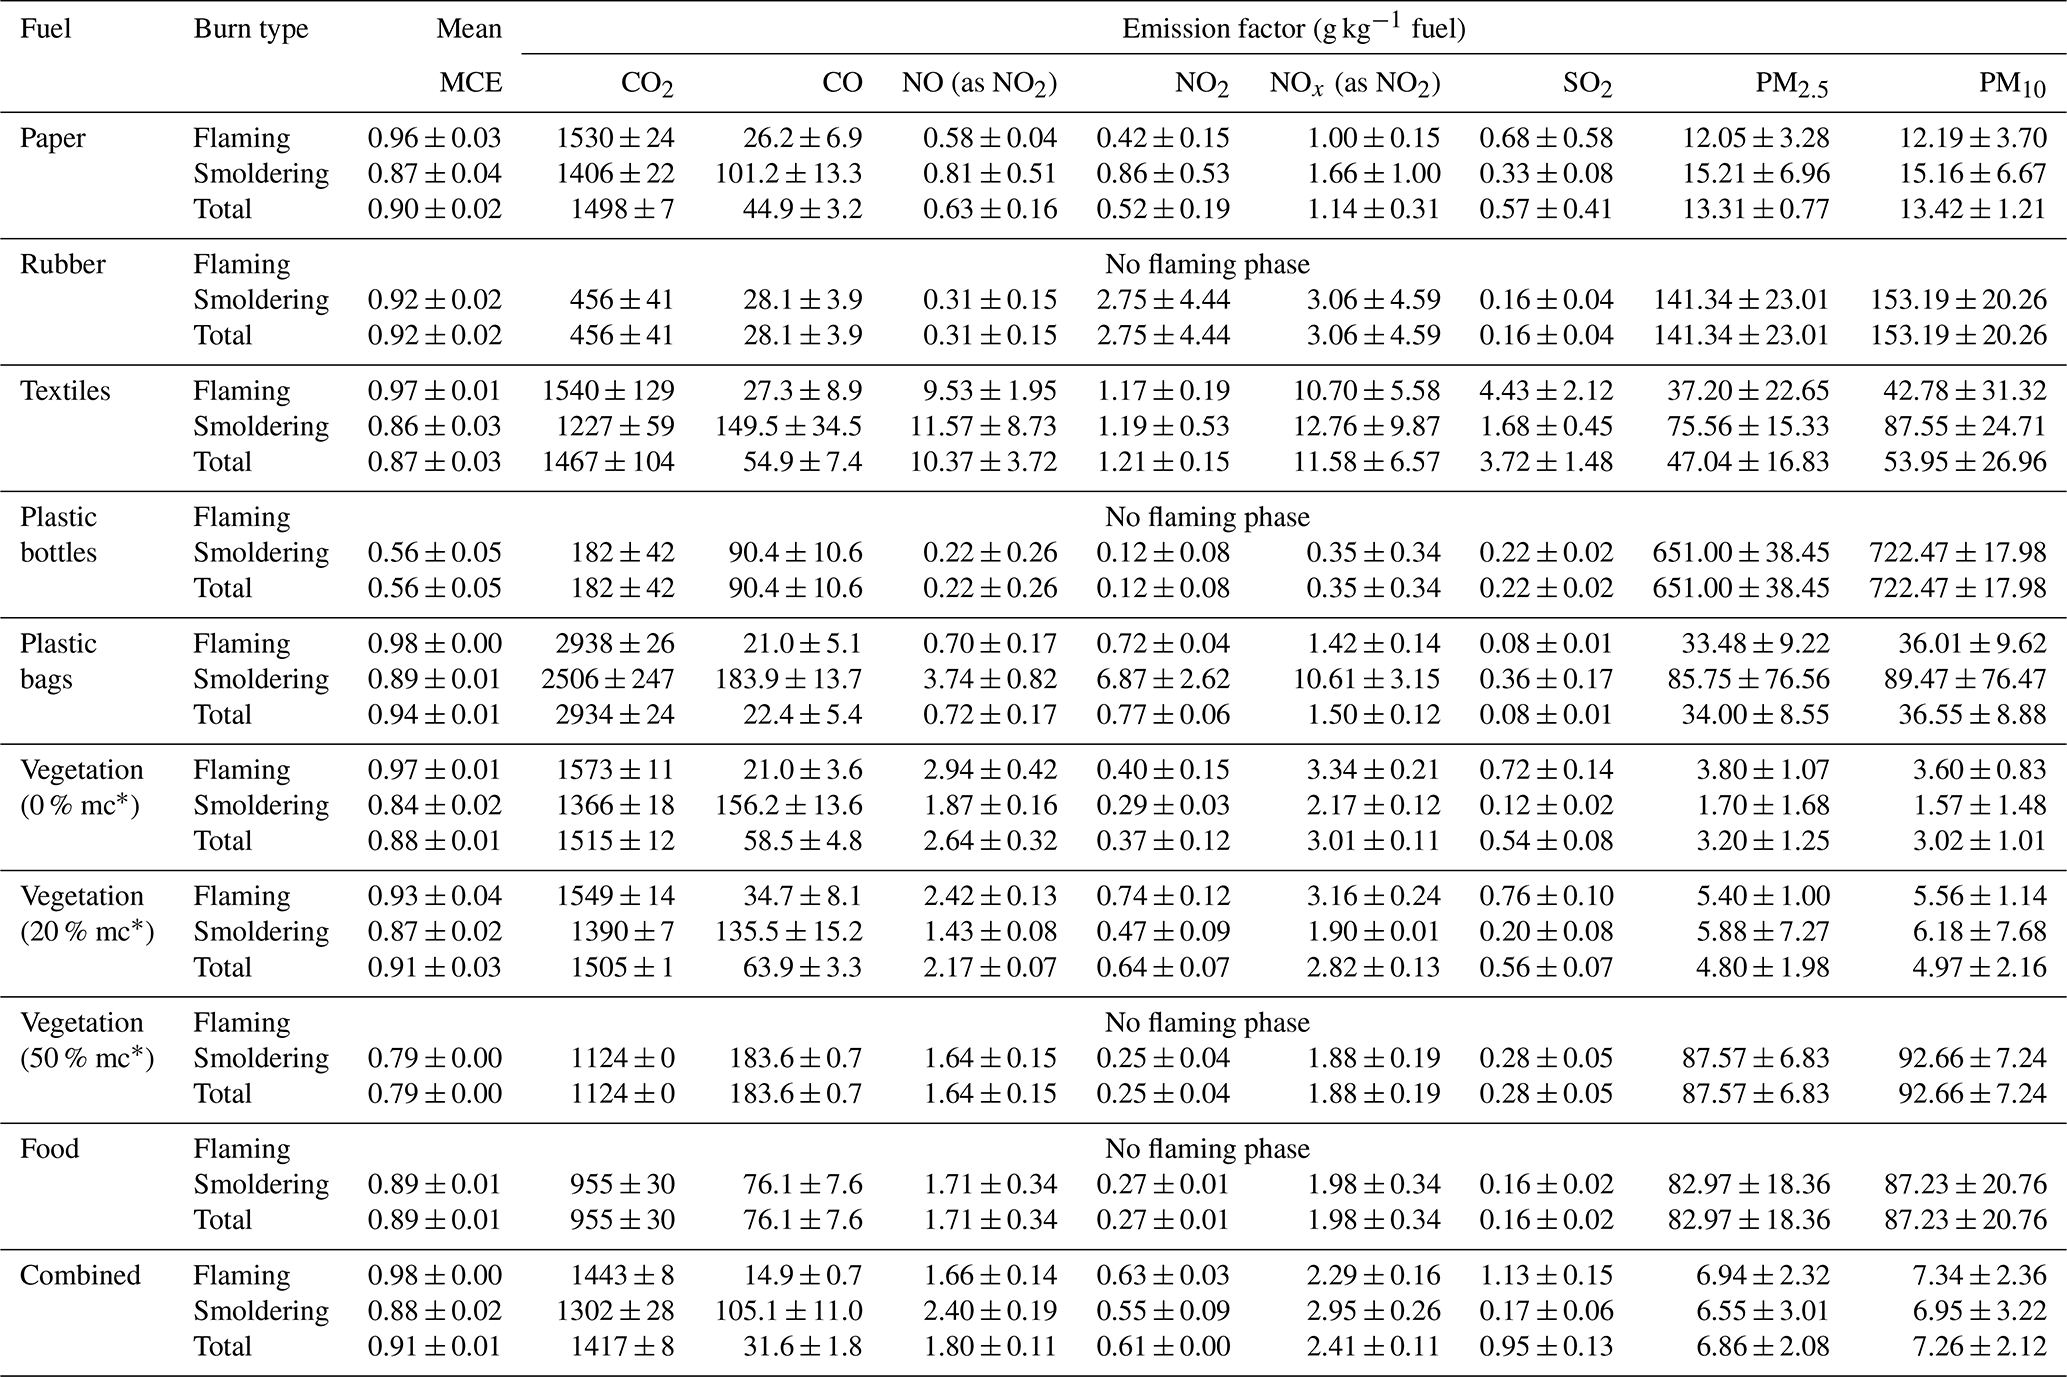
*mc: fuel moisture content.
Table 3Comparison of emission factors from this study with those reported in the literature.
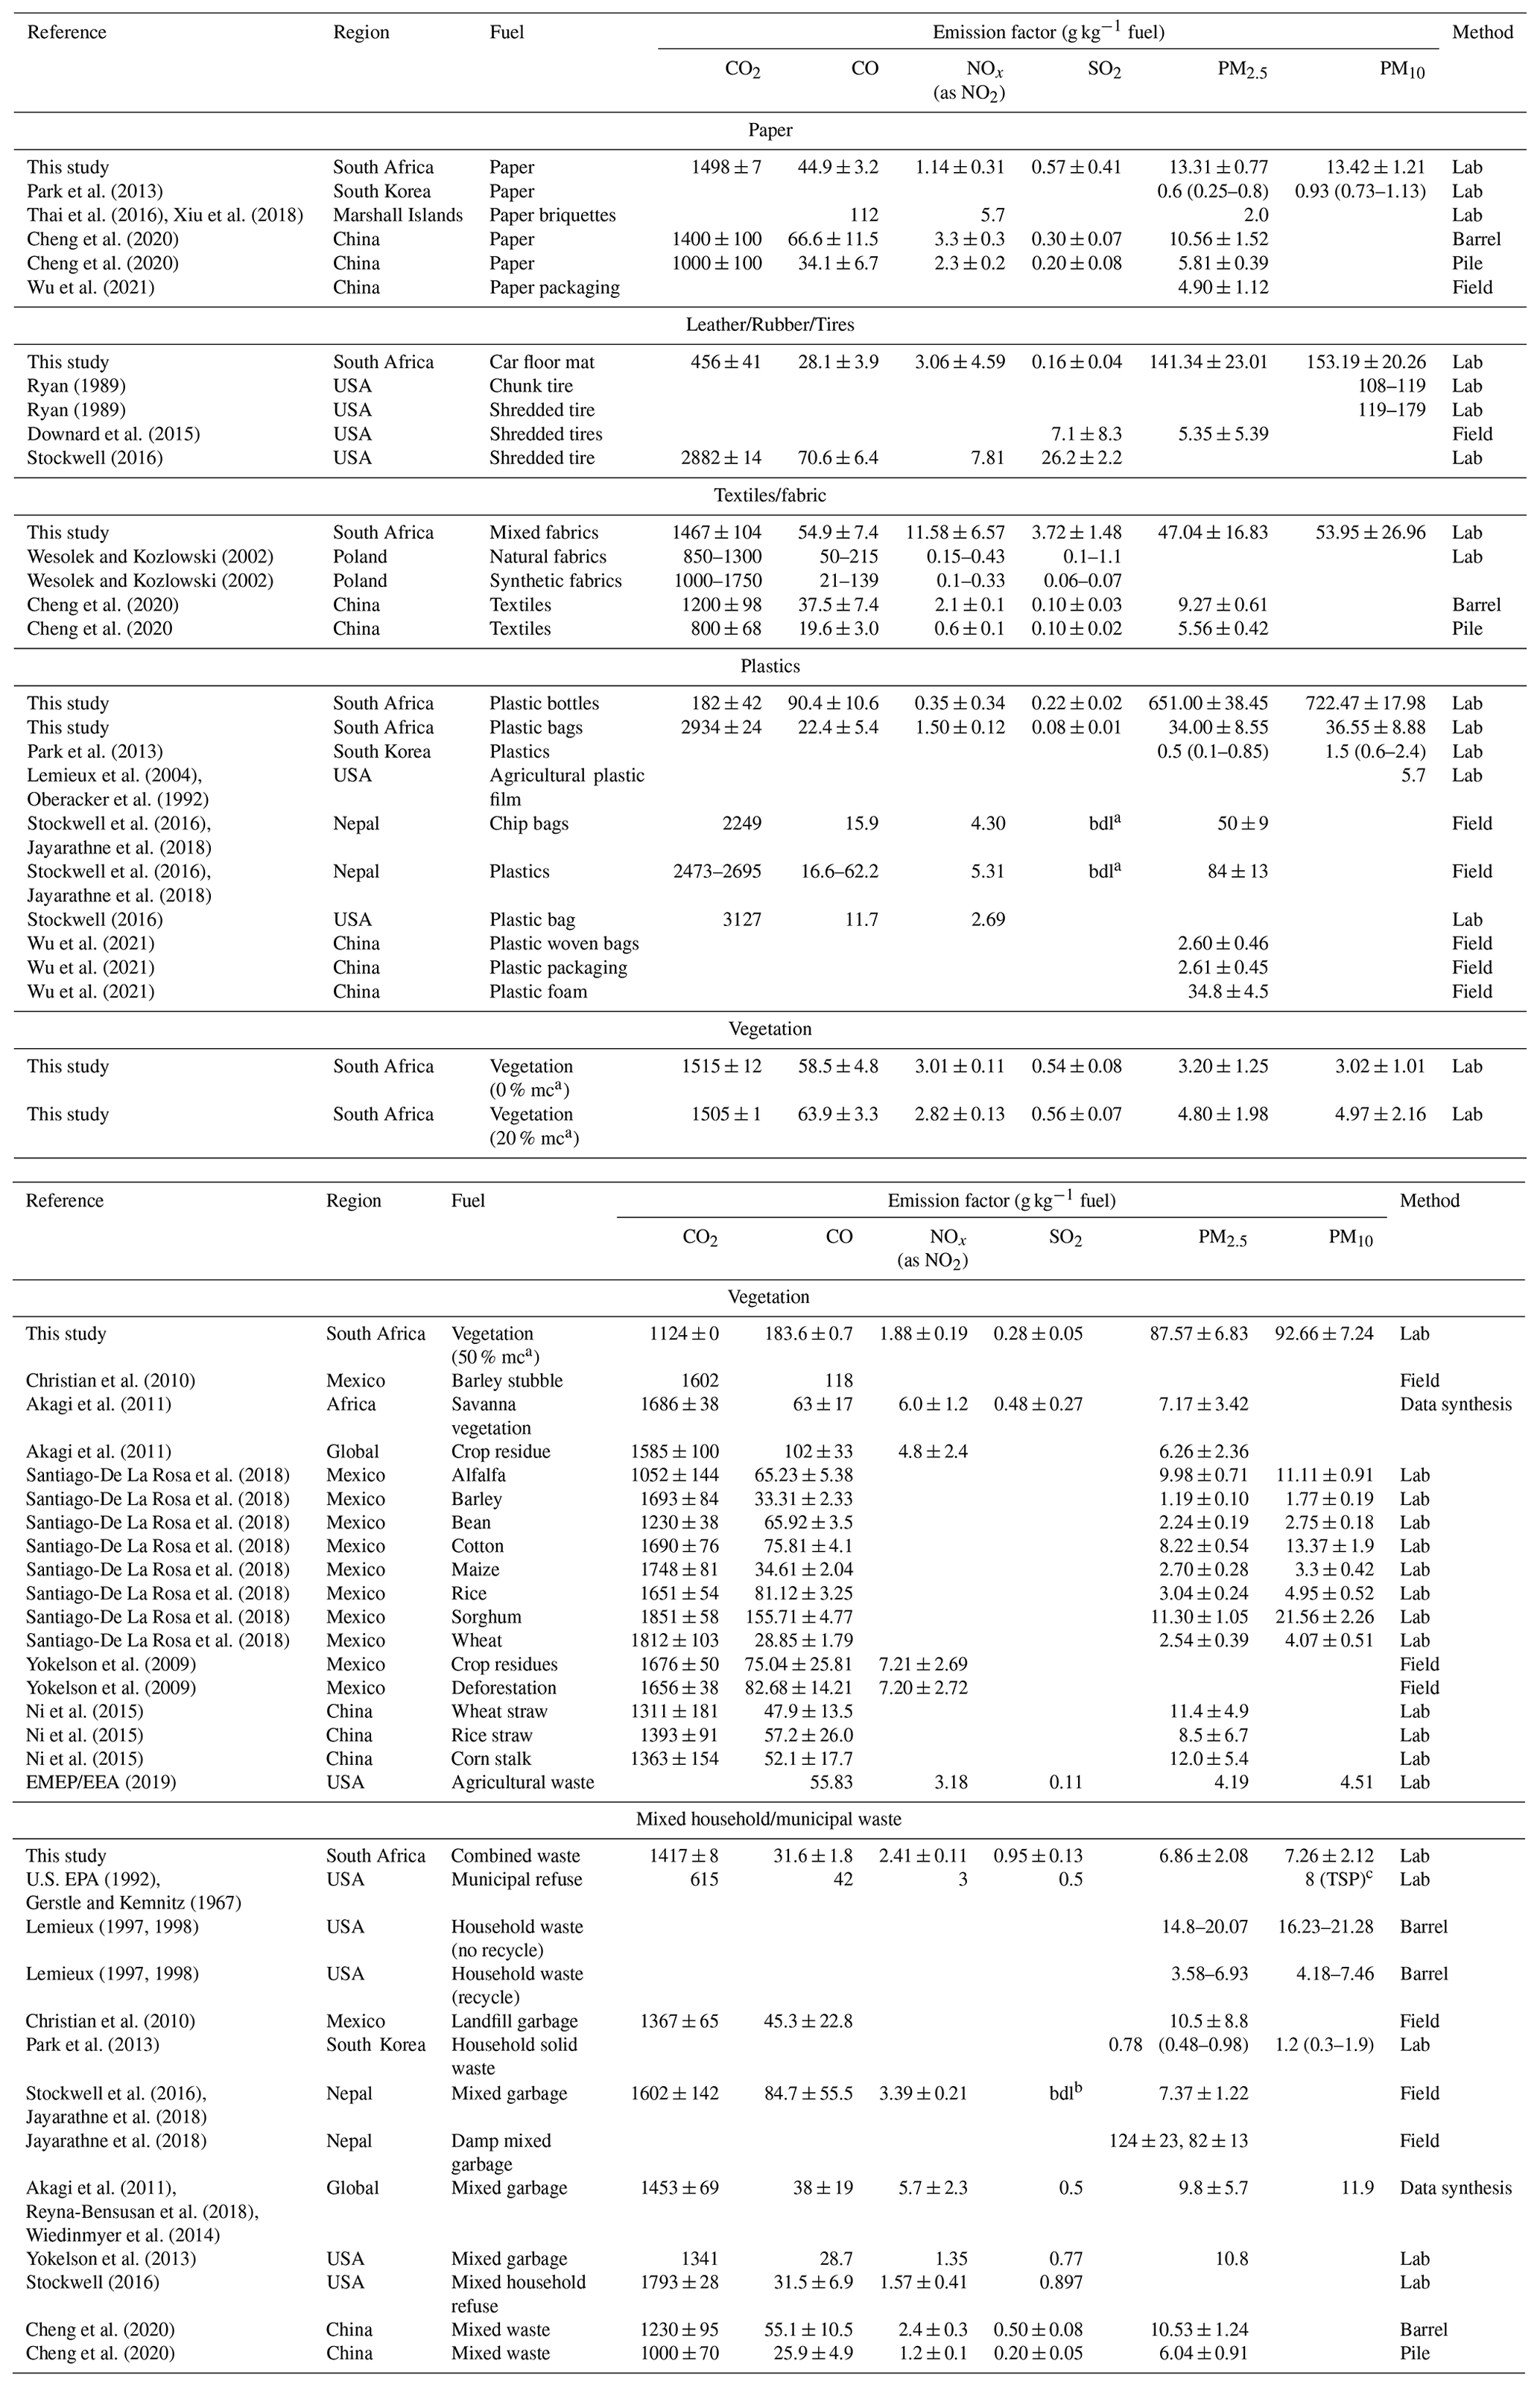
a mc: moisture content. bbdl: below detection limit. cTSP: total suspended particulate.
The plastic bottles only smoldered, yielding the lowest CO2 EFs and among the highest CO and PM EFs (Table 2). Most fuel carbon was turned into PM and volatile organics (strong odor). In contrast, flaming dominated plastic bag combustion, consuming ∼99 % of the fuel mass and contributing over 90 % of emissions (Table 1). Among all waste materials, plastic bags had the highest CO2 EFs due to their high carbon content (Table S1) and high combustion efficiencies. Similar high-efficiency combustion of plastic bags is reported by Stockwell (2016). Plastic bag EFs are in the same range as literature values. Note that the literature has a wide range of PM EFs (Table 3), likely due to different plastic materials and burning conditions (Park et al., 2013; Lemieux et al., 2004; Oberacker et al., 1992; Stockwell et al., 2016; Jayarathne et al., 2018; Stockwell, 2016; Wu et al., 2021).
The flaming phase for vegetation with 0 % and 20 % moisture content consumed ∼70 % of the fuel mass and emitted over 70 % of pollutants, except that ∼ 60 %–75 % of the CO was emitted during smoldering (Table 1). The damp vegetation with 50 % moisture content emitted 26 % less CO2, but higher CO and PM by a factor of 3 and 20–30, respectively, as compared to the drier vegetation. Most of the published vegetation emissions lack information on moisture content. Some studies with fuels relevant to South Africa are compared in Table 3 (Christian et al., 2010; Akagi et al., 2011; Santiago-De La Rosa et al., 2018; Yokelson et al., 2009; Ni et al., 2015; EMEP/EEA, 2019). The EFs are consistent with those of low moisture content measured in this study. In particular, EFs for CO2, CO, and SO2 derived here are in good agreement with those derived for savanna vegetation (Akagi et al., 2011). The EFs for PM from damp vegetation burning were about 1 order of magnitude higher than literature values.
Food discards did not flame due to high moisture content in fresh vegetables and fruits, resulting in lower EFs for CO2 and higher EFs for CO and PM (Table 2). Food discards are often included in municipal/household waste, but no separate EFs for food discard burning have been found in the literature.
Flaming-dominated combustion of the combined materials consumed 81 % of the fuel mass and emitted over 75 % of the pollutants, except that 62 % of the CO was emitted during smoldering (Table 1). Combined-waste combustion was efficient, and MCE for most of the burn period was higher than 0.90 (Fig. S29). The EFs for combined waste fall within the EF ranges of the individual waste categories, but with lower EFs for PM (Table 2). Considering the wide variety of waste materials and burn practices, EFs are expected to vary over a wide range. Interestingly, as shown in Table 3, with the exception of an old (1967) test in the USA (U.S. EPA, 1992; Gerstle and Kemnitz, 1967) with a “below average” data quality rating and the study by Park et al. (2013), which showed consistently lower EFs than other studies, most other studies show reasonable consistency in EFs (Lemieux, 1997, 1998; Christian et al., 2010; Stockwell et al., 2016; Jayarathne et al., 2018; Akagi et al., 2011; Reyna-Bensusan et al., 2018; Wiedinmyer et al., 2014; Yokelson et al., 2013; Stockwell, 2016; Cheng et al., 2020). EFs for CO2 and CO from this study agree remarkably well with data suggested for global emission inventory development (Akagi et al., 2011; Reyna-Bensusan et al., 2018; Wiedinmyer et al., 2014).
Table 2 shows that CO2 EFs are 10 %–25 % higher for flaming compared to smoldering and are lowest for smoldering-only combustions, while CO EFs are 4–9 times higher for smoldering than for flaming. Figure S3a and b show that, overall, CO2 increased with MCE, while CO decreased with MCE, although there were large variations among fuel materials. Among the tested materials, textiles have the highest nitrogen and sulfur content, resulting in the highest EFs for NOx and SO2. EFs for NOx are generally higher in the smoldering phase (except for vegetation), probably due to the time required for fuel nitrogen to be oxidized and released. Due to larger fuel influences, NOx emissions do not show a strong pattern as a function of MCE (Fig. S3c). EFs for SO2 are generally higher in the flaming phase (except for plastic bags). Figure S3d shows that EFs for PM2.5 do not show a strong correlation with MCE. Higher EFs by a factor of 2 are found for smoldering compared to flaming of textiles and plastic bags, with smaller variations between the two phases for paper, vegetation, and combined materials (Table 2).
3.4 Effects of ash and particulate carbon content on EF calculation
Carbon content in the ash or PM emissions (Eq. 2) is rarely included in fuel-based EF calculations (Stockwell et al., 2016; Christian et al., 2010; Jayarathne et al., 2018; Wang et al., 2019; Chen et al., 2007). Their impacts are assumed to be negligible but have not been systematically evaluated. Table 4 demonstrates the importance of carbon in ash and PM in EF calculations using Eq. (2). Without including ash and/or PM carbon, changes in EFs are <5 % for flaming-dominated combustion of paper, plastic bags, vegetation with 0 % and 20 % moisture content, and combined materials. These fuels had <5 % fuel carbon in ash and <5 % emitted carbon in PM.
Table 4Emission factor changes relative to Eq. (2) when the carbon in the PM (CPM) or ash (CMFash) is not included.
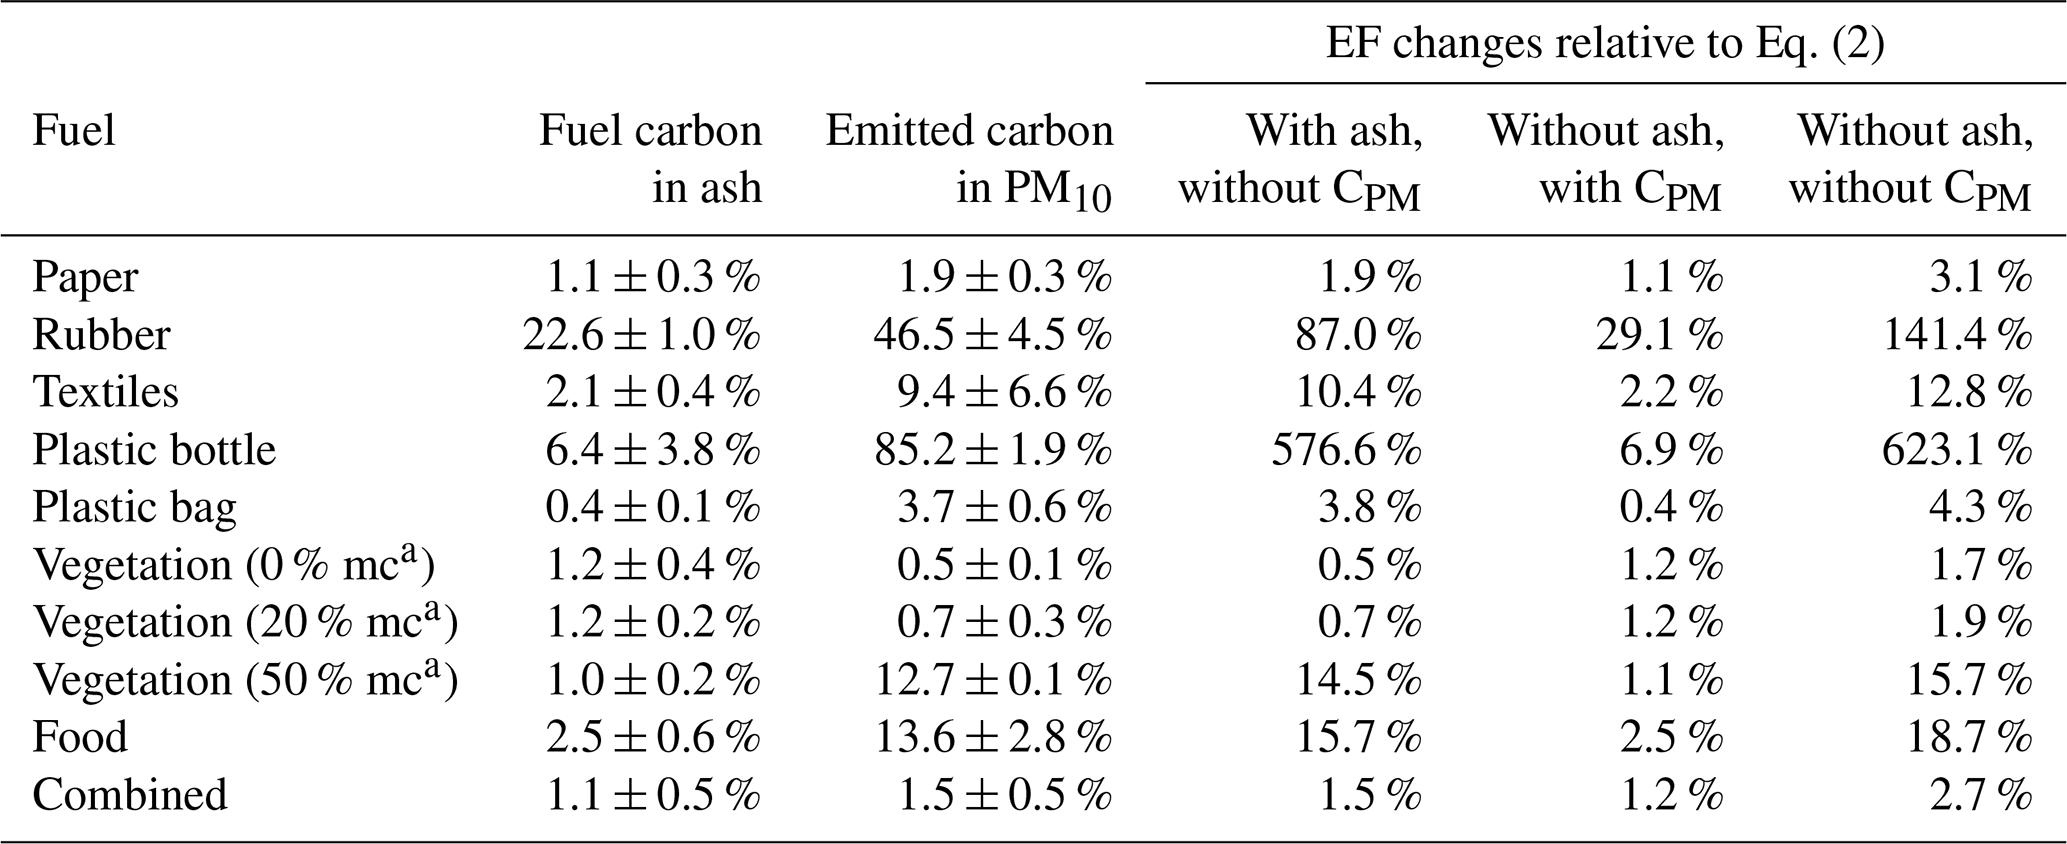
a mc: fuel moisture content.
The consequences of not including ash or PM carbon are larger for smoldering fuels. Due to their high EFs of carbonaceous PM, the errors caused by not including PM carbon are over 10 %. Rubber had the highest fuel carbon (22.6 %) in the ash, and excluding ash in Eq. (2) results in a 29.1 % overestimation of EFs. Rubber had 46.5 % of carbon emitted as TC in PM; excluding CPM causes an EF overestimation of 87 %. If neither ash nor PM carbon is included, the EFs are overestimated by 141 %. The hard-plastic-bottle EFs are also affected by carbon content. Because of the very high EFs for carbonaceous PM and relatively low EFs for CO and CO2, 85 % of the carbon was emitted as PM. Not including CPM results in an EF overestimation of 577 %; in addition, if ash carbon is not included, the EFs are overestimated by 623 %.
This result shows that ash and PM carbon cannot be neglected in EF calculations, particularly for smoldering combustion with high carbon content in ash and/or PM emissions. Carbon can also be emitted as gaseous hydrocarbons, and excluding it in Eq. (2) may result in some overestimation of the EFs. While it is expected that the hydrocarbon carbon content is lower than that in CO and CO2 in most cases, it may not be negligible when their emissions are high. Future studies should measure total hydrocarbons for more accurate EF determination.
3.5 Discussion: emission factors for solid-waste open-burning emission inventories
One application of EFs is to estimate emission rates for establishing emission inventories (U.S. EPA, 1992). These inventories are used to conduct air quality modeling, track long-term trends, evaluate control strategy effectiveness, and provide offsets for other emitters. For example, emissions avoided by trucking the normally open-burned household solid waste to landfills by Sasol's WCI can be estimated as
where Ep is total avoided emission of pollutant p (in metric tons per year); AR is the activity rate, i.e., the amount of burned waste avoided in a year (in metric tons per year); and EFp is the emission factor (in grams of emissions per gram of waste) of pollutant p from the waste that would otherwise be burned. The subscript i corresponds to values for each waste material (e.g., paper, textiles, plastics, and vegetation). EFp corresponds to the measured EFs from the combined waste materials; it can also be estimated by summing EFp,i for individual waste materials, weighted by their mass fractions (Fig. 1). EFp,i can be determined from laboratory testing under controlled conditions, and the heterogeneity of waste materials can be accounted for by examining the waste refuse. The separation of flaming and smoldering EFs offers additional flexibility in accounting for burning condition changes. However, it should be cautioned that the burning behaviors differ between separated and combined waste materials, causing emissions to change. Table S5 compares the measured EFs for the combined materials and the values calculated from EFp,i. The calculated EFs agree with the measured values within 10 % for CO2 and NOx; however, the calculated EFs for CO and PM are over 50 % and 600 % higher, respectively. It is possible that more efficient combustion in the combined materials lowered CO and PM emissions as compared to less efficient individual burns, particularly for materials that only smoldered and had high EFs for CO and PM. Additionally, laboratory-measured EFp,i or EFp values might differ from field values given the complex waste mixtures and burning conditions. Adjustments to laboratory EFp,i's might be needed when estimating real-world EFp's. Future studies comparing in situ measurements from a variety of representative real-world burns with laboratory data would assist in establishing adjustment factors.
In this study, criteria pollutant emissions were measured from simulated combustion of different household solid-waste materials representative of those in open burnings in South Africa. EFs vary with waste composition and combustion conditions. Data from this study fill EF gaps for paper, leather/rubber, textile, and food discard burning that have been scarcely reported in the literature. EFs for vegetation and mixed waste materials from this study are within the ranges reported in the literature. These EFs can be used to improve emission inventories for household- and municipal-solid-waste open-burning emissions in South Africa and other countries.
Emissions are closely related to elemental compositions in fuel. Among the tested materials, plastic bags have the highest carbon content and the highest combustion efficiency, leading to the highest EFs for CO2. Textiles have the highest abundances of nitrogen and sulfur, resulting in the highest EFs for NOx and SO2. Combustion behaviors and emissions are also affected by fuel moisture content. EFs for vegetation with three moisture content values – dry (0 %), natural (20 %), and damp (50 %) – were measured. Emissions were similar for 0 % and 20 % moisture content; however, EFs for CO and PM from the vegetation with 50 % moisture content are 3 and 20–30 times, respectively, those from 0 % and 20 % moisture content.
This study reports three sets of EFs (i.e., flaming, smoldering, and entire combustion), which can be applied to estimate emissions based on waste burning characteristics. It also reports EFs for individual and combined waste categories. These data offer flexibility in calculating emission rates depending on waste composition and burning characteristics. However, caution should be exerted when using the mass-weighted sum of individual-waste-category EFs to calculate combined-waste EFs as the combustion behavior might be different between individual and combined waste materials. This study shows that neglecting the carbon in ash and/or PM may lead to significant overestimation of EFs.
EF data from this study were obtained from controlled laboratory tests simulating real-world open-burning conditions. Real-world open-burning emissions vary with waste material composition, pile size, packing structure, moisture content, ambient temperature, and wind speed. Such variations are reflected in the wide range of EFs reported in the literature. Although this and past studies agree within reported extremes, laboratory tests are an approximation of real-world variations. The EFs derived from laboratory experiments represent the values obtained under specific conditions in laboratory tests; adjustment might be needed when real-world burning conditions are very different from laboratory test conditions.
Data are available at https://doi.org/10.7910/DVN/QTV9YW (Wang, 2023). Additional data are available upon request.
The supplement related to this article is available online at: https://doi.org/10.5194/acp-23-8921-2023-supplement.
XW, JCC, and JGW designed the study; HF conducted the combustion experiments; XW and HF performed the data analyses and prepared the original paper draft; WC and ASMDV provided waste materials and resources; all authors reviewed and edited the paper.
The contact author has declared that none of the authors has any competing interests.
Publisher’s note: Copernicus Publications remains neutral with regard to jurisdictional claims in published maps and institutional affiliations.
The authors thank Matthew Claassen of DRI for collecting vegetation for testing.
This research was funded partially by Sasol (grant no. 2000751484) and partially by Desert Research Institute internal funding.
This paper was edited by Sergey A. Nizkorodov and reviewed by two anonymous referees.
Akagi, S. K., Yokelson, R. J., Wiedinmyer, C., Alvarado, M. J., Reid, J. S., Karl, T., Crounse, J. D., and Wennberg, P. O.: Emission factors for open and domestic biomass burning for use in atmospheric models, Atmos. Chem. Phys., 11, 4039–4072, https://doi.org/10.5194/acp-11-4039-2011, 2011.
Andreae, M. O. and Gelencsér, A.: Black carbon or brown carbon? The nature of light-absorbing carbonaceous aerosols, Atmos. Chem. Phys., 6, 3131–3148, https://doi.org/10.5194/acp-6-3131-2006, 2006.
Bond, T. C., Streets, D. G., Yarber, K. F., Nelson, S. M., Woo, J.-H., and Klimont, Z.: A technology-based global inventory of black and organic carbon emissions from combustion, J. Geophys. Res., 109, D14203, https://doi.org/10.1029/2003jd003697, 2004.
Bond, T. C., Doherty, S. J., Fahey, D. W., Forster, P. M., Berntsen, T., DeAngelo, B. J., Flanner, M. G., Ghan, S., Kärcher, B., and Koch, D.: Bounding the role of black carbon in the climate system: A scientific assessment, J. Geophys. Res.-Atmos., 118, 5380–5552, 2013.
Chen, L.-W. A., Moosmüller, H., Arnott, W. P., Chow, J. C., Watson, J. G., Susott, R. A., Babbitt, R. E., Wold, C. E., Lincoln, E. N., and Hao, W. M.: Emissions from Laboratory Combustion of Wildland Fuels: Emission Factors and Source Profiles, Environ. Sci. Technol., 41, 4317–4325, https://doi.org/10.1021/es062364i, 2007.
Chen, L.-W. A., Verburg, P., Shackelford, A., Zhu, D., Susfalk, R., Chow, J. C., and Watson, J. G.: Moisture effects on carbon and nitrogen emission from burning of wildland biomass, Atmos. Chem. Phys., 10, 6617–6625, https://doi.org/10.5194/acp-10-6617-2010, 2010.
Chen, L.-W. A., Chow, J. C., Wang, X. L., Robles, J. A., Sumlin, B. J., Lowenthal, D. H., Zimmermann, R., and Watson, J. G.: Multi-wavelength optical measurement to enhance thermal/optical analysis for carbonaceous aerosol, Atmos. Meas. Tech., 8, 451–461, https://doi.org/10.5194/amt-8-451-2015, 2015.
Chen, L.-W. A., Chow, J. C., Wang, X., Cao, J., Mao, J., and Watson, J. G.: Brownness of Organic Aerosol over the United States: Evidence for Seasonal Biomass Burning and Photobleaching Effects, Environ. Sci. Technol., 55, 8561–8572, https://doi.org/10.1021/acs.est.0c08706, 2021.
Cheng, K., Hao, W., Wang, Y., Yi, P., Zhang, J., and Ji, W.: Understanding the emission pattern and source contribution of hazardous air pollutants from open burning of municipal solid waste in China, Environ. Pollut., 263, 114417, https://doi.org/10.1016/j.envpol.2020.114417, 2020.
Chow, J. C., Watson, J. G., Chen, L.-W. A., Chang, M. C. O., Robinson, N. F., Trimble, D., and Kohl, S.: The IMPROVE_A temperature protocol for thermal/optical carbon analysis: maintaining consistency with a long-term database, J. Air Waste Manage., 57, 1014–1023, 2007.
Chow, J. C., Cao, J., Antony Chen, L.-W., Wang, X., Wang, Q., Tian, J., Ho, S. S. H., Watts, A. C., Carlson, T. B., Kohl, S. D., and Watson, J. G.: Changes in PM2.5 peat combustion source profiles with atmospheric aging in an oxidation flow reactor, Atmos. Meas. Tech., 12, 5475–5501, https://doi.org/10.5194/amt-12-5475-2019, 2019.
Christian, T. J., Yokelson, R. J., Cárdenas, B., Molina, L. T., Engling, G., and Hsu, S.-C.: Trace gas and particle emissions from domestic and industrial biofuel use and garbage burning in central Mexico, Atmos. Chem. Phys., 10, 565–584, https://doi.org/10.5194/acp-10-565-2010, 2010.
Cook, E. and Velis, C.: Global review on safer end of engineered life, Royal Academy of Engineering, London, UK, https://doi.org/10.5518/100/58, 2021.
Cronjé, N., Van der Merwe, I., and Müller, I.-M.: Household food waste: A case study in Kimberley, South Africa, Journal of Consumer Sciences, 1–9, 46, 2018.
Downard, J., Singh, A., Bullard, R., Jayarathne, T., Rathnayake, C. M., Simmons, D. L., Wels, B. R., Spak, S. N., Peters, T., Beardsley, D., Stanier, C. O., and Stone, E. A.: Uncontrolled combustion of shredded tires in a landfill – Part 1: Characterization of gaseous and particulate emissions, Atmos. Environ., 104, 195–204, https://doi.org/10.1016/j.atmosenv.2014.12.059, 2015.
EMEP/EEA: EMEP/EEA air pollutant emission inventory guidebook 2019, European Environmental Agency, Copenhagen, Denmark, https://doi.org/10.2800/293657, 2019.
Ferronato, N. and Torretta, V.: Waste Mismanagement in Developing Countries: A Review of Global Issues, Int. J. Environ. Res. Public Health, 16, 1060, https://doi.org/10.3390/ijerph16061060, 2019.
Gerstle, R. W. and Kemnitz, D. A.: Atmospheric Emissions from Open Burning, JAPCA J. Air Wate Ma., 17, 324–327, https://doi.org/10.1080/00022470.1967.10468988, 1967.
Holland, B. J. and Hay, J. N.: The thermal degradation of PET and analogous polyesters measured by thermal analysis–Fourier transform infrared spectroscopy, Polymer, 43, 1835–1847, https://doi.org/10.1016/S0032-3861(01)00775-3, 2002.
IPCC: 2006 IPCC guidelines for national greenhouse gas inventories, National Greenhouse Gas Inventories Programme Japan, Intergovernmental Panel on Climate Change (IPCC), Geneva, Switzerland, ISBN 4-88788-032-4, 2006.
IPCC: Climate change 2013: The physical science basis. Working Group I Contribution to the Fifth Assessment Report of the Intergovernmental Panel on Climate Change, Cambridge University Press Cambridge, UK, New York, ISBN 978-1-107-05799-1, 2013.
Jayarathne, T., Stockwell, C. E., Bhave, P. V., Praveen, P. S., Rathnayake, C. M., Islam, Md. R., Panday, A. K., Adhikari, S., Maharjan, R., Goetz, J. D., DeCarlo, P. F., Saikawa, E., Yokelson, R. J., and Stone, E. A.: Nepal Ambient Monitoring and Source Testing Experiment (NAMaSTE): emissions of particulate matter from wood- and dung-fueled cooking fires, garbage and crop residue burning, brick kilns, and other sources, Atmos. Chem. Phys., 18, 2259–2286, https://doi.org/10.5194/acp-18-2259-2018, 2018.
Kodros, J. K., Wiedinmyer, C., Ford, B., Cucinotta, R., Gan, R., Magzamen, S., and Pierce, J. R.: Global burden of mortalities due to chronic exposure to ambient PM2.5 from open combustion of domestic waste, Environ. Res. Lett., 11, 124022, https://doi.org/10.1088/1748-9326/11/12/124022, 2016.
Kwatala, N., Naidoo, M., Naidoo, S., and Garland, R. M.: Estimated emissions of domestic waste burning in South Africa, 2019 Conference of the National Association for Clean Air, Western Cape, 3–4 October 2019.
Lebreton, L. and Andrady, A.: Future scenarios of global plastic waste generation and disposal, Palgrave Communications, 5, 6, https://doi.org/10.1057/s41599-018-0212-7, 2019.
Lemieux, P. M.: Evaluation of emissions from the open burning of household waste in barrels – Volume 1. Technical Report, National Risk Management Research Laboratory, US Environmental Protection Agency, Cincinnati, OHEPA-600/R-97-134a, NTIS PB98-127343, 1997.
Lemieux, P. M.: Evaluation of emissions from the open burning of household waste in barrels - Project Summary, National Risk Management Research Laboratory, US Environmental Protection Agency, Cincinnati, OH EPA/600/SR-97/134, 1998.
Lemieux, P. M., Lutes, C. C., and Santoianni, D. A.: Emissions of organic air toxics from open burning: a comprehensive review, Prog. Energy Combust. Sci., 30, 1–32, https://doi.org/10.1016/j.pecs.2003.08.001, 2004.
Moosmüller, H., Mazzoleni, C., Barber, P., Kuhns, H., Keislar, R., and Watson, J.: On-road measurement of automotive particle emissions by ultraviolet lidar and transmissometer: Instrument, Environ. Sci. Technol., 37, 4971–4978, 2003.
Ni, H., Han, Y., Cao, J., Chen, L.-W. A., Tian, J., Wang, X. L., Chow, J. C., Watson, J. G., Wang, Q., Wang, P., Li, H., and Huang, R.-J.: Emission characteristics of carbonaceous particles and trace gases from open burning of crop residues in China, Atmos. Environ., 123, 399–406, https://doi.org/10.1016/j.atmosenv.2015.05.007, 2015.
Oberacker, D. A., Lin, P. C., Shaul, G. M., Ferguson, D. T., Engleman, V. S., Jackson, T. W., Chapman, J. S., Evans, J. D., Martrano, R. J., and Evey, L. L.: Characterization of Emissions Formed from Open Burning of Pesticide Bags, in: Pesticide Waste Management, ACS Symposium Series, 510, American Chemical Society, 78–94, https://doi.org/10.1021/bk-1992-0510.ch007, 1992.
Park, Y. K., Kim, W., and Jo, Y. M.: Release of Harmful Air Pollutants from Open Burning of Domestic Municipal Solid Wastes in a Metropolitan Area of Korea, Aerosol Air Qual. Res., 13, 1365–1372, https://doi.org/10.4209/aaqr.2012.10.0272, 2013.
Rabaji, O. P.: Waste dumping in Sharpeville (Emfuleni Municipality): an investigation of the characteristics and the potential impacts on air quality, M.S., Environmental Management, North-West University, Potchefstroom, South Africa, 2019.
Reid, J. S., Koppmann, R., Eck, T. F., and Eleuterio, D. P.: A review of biomass burning emissions part II: intensive physical properties of biomass burning particles, Atmos. Chem. Phys., 5, 799–825, https://doi.org/10.5194/acp-5-799-2005, 2005.
Rein, G., Cleaver, N., Ashton, C., Pironi, P., and Torero, J. L.: The severity of smouldering peat fires and damage to the forest soil, CATENA, 74, 304–309, https://doi.org/10.1016/j.catena.2008.05.008, 2008.
Reyna-Bensusan, N., Wilson, D. C., and Smith, S. R.: Uncontrolled burning of solid waste by households in Mexico is a significant contributor to climate change in the country, Environ. Res., 163, 280–288, https://doi.org/10.1016/j.envres.2018.01.042, 2018.
Ryan, J. V.: Characterization of emissions from the simulated open burning of scrap tires, Acurex Corp., Research Triangle Park, NCEPA-600/2-89-054, 1989.
Santiago-De La Rosa, N., González-Cardoso, G., Figueroa-Lara, J. d. J., Gutiérrez-Arzaluz, M., Octaviano-Villasana, C., Ramírez-Hernández, I. F., and Mugica-Álvarez, V.: Emission factors of atmospheric and climatic pollutants from crop residues burning, J. Air Waste Manage. Assoc., 68, 849–865, https://doi.org/10.1080/10962247.2018.1459326, 2018.
Schmid, O., Chand, D., Karg, E., Guyon, P., Frank, G. P., Swietlicki, E., and Andreae, M. O.: Derivation of the density and refractive index of organic matter and elemental carbon from closure between physical and chemical aerosol properties, Environ. Sci. Technol., 43, 1166–1172, https://doi.org/10.1021/es800570p, 2009.
Sovová, K., Ferus, M., Matulková, I., Španěl, P., Dryahina, K., Dvořák, O., and Civiš, S.: A study of thermal decomposition and combustion products of disposable polyethylene terephthalate (PET) plastic using high resolution fourier transform infrared spectroscopy, selected ion flow tube mass spectrometry and gas chromatography mass spectrometry, Mol. Phys., 106, 1205–1214, https://doi.org/10.1080/00268970802077876, 2008.
Stockwell, C. E.: Advanced measurements of undersampled globally significant biomass burning sources, Chemistry, The University of Montana, Missoula, MT, 2016.
Stockwell, C. E., Christian, T. J., Goetz, J. D., Jayarathne, T., Bhave, P. V., Praveen, P. S., Adhikari, S., Maharjan, R., DeCarlo, P. F., Stone, E. A., Saikawa, E., Blake, D. R., Simpson, I. J., Yokelson, R. J., and Panday, A. K.: Nepal Ambient Monitoring and Source Testing Experiment (NAMaSTE): emissions of trace gases and light-absorbing carbon from wood and dung cooking fires, garbage and crop residue burning, brick kilns, and other sources, Atmos. Chem. Phys., 16, 11043–11081, https://doi.org/10.5194/acp-16-11043-2016, 2016.
Thai, P., Rahman, M. M., Pourkhesalian, A. M., and Stevanovic, S.: Comparative investigations of combustion emissions from paper briquettes, International Laboratory for Air Quality and Health (ILAQH) at Queensland University of Technology (QUT), ISBN 978-982-04-0597-4, 2016.
Tian, J., Chow, J. C., Cao, J., Han, Y., Ni, H., Chen, L.-W. A., Wang, X. L., Huang, R., Moosmüller, H., and Watson, J. G.: A Biomass Combustion Chamber: Design, Evaluation, and a Case Study of Wheat Straw Combustion Emission Tests, Aerosol Air Qual. Res., 15, 2104–2114, 2015.
U.S. EPA: Compilation of Air Pollutant Emissions Factors AP-42, Fifth Edition Section 2.5 Open Burning, U.S. Environmental Protection Agency, Research Triangle Park, NCEPA AP-42, 1992.
Velis, C. A. and Cook, E.: Mismanagement of Plastic Waste through Open Burning with Emphasis on the Global South: A Systematic Review of Risks to Occupational and Public Health, Environ. Sci. Technol., 55, 7186–7207, https://doi.org/10.1021/acs.est.0c08536, 2021.
Wang, Q., Wang, L., Li, X., Xin, J., Liu, Z., Sun, Y., Liu, J., Zhang, Y., Du, W., Jin, X., Zhang, T., Liu, S., Liu, Q., Chen, J., Cheng, M., and Wang, Y.: Emission characteristics of size distribution, chemical composition and light absorption of particles from field-scale crop residue burning in Northeast China, Sci. Total Environ., 710, 136304, https://doi.org/10.1016/j.scitotenv.2019.136304, 2020a.
Wang, X. L.: Data for: Air Pollutant Emissions from Open Burning of Household Solid Waste from South Africa, https://doi.org/10.7910/DVN/QTV9YW, Harvard Dataverse, V1, 2023.
Wang, X. L., Chancellor, G., Evenstad, J., Farnsworth, J. E., Hase, A., Olson, G. M., Sreenath, A., and Agarwal, J. K.: A Novel Optical Instrument for Estimating Size Segregated Aerosol Mass Concentration in Real Time, Aerosol Sci. Technol., 43, 939–950, 2009.
Wang, X. L., Zhou, H., Arnott, W. P., Meyer, M. E., Taylor, S., Firouzkouhi, H., Moosmüller, H., Chow, J. C., and Watson, J. G.: Characterization of smoke for spacecraft fire safety, J. Aerosol Sci., 136, 36–47, https://doi.org/10.1016/j.jaerosci.2019.06.004, 2019.
Wang, X. L., Zhou, H., Arnott, W. P., Meyer, M. E., Taylor, S., Firouzkouhi, H., Moosmüller, H., Chow, J. C., and Watson, J. G.: Evaluation of Gas and Particle Sensors for Detecting Spacecraft-Relevant Fire Emissions, Fire Safety J., 113, 1–12, https://doi.org/10.1016/j.firesaf.2020.102977, 2020b.
Wesolek, D. and Kozlowski, R.: Toxic gaseous products of thermal decomposition and combustion of natural and synthetic fabrics with and without flame retardant, Fire Mater., 26, 215–224, https://doi.org/10.1002/fam.800, 2002.
Wiedinmyer, C., Yokelson, R. J., and Gullett, B. K.: Global Emissions of Trace Gases, Particulate Matter, and Hazardous Air Pollutants from Open Burning of Domestic Waste, Environ. Sci. Technol., 48, 9523–9530, https://doi.org/10.1021/es502250z, 2014.
Williams, M., Gower, R., Green, J., Whitebread, E., Lenkiewicz, Z., and Schröder, P.: No time to waste: Tackling the plastic pollution crisis before it's too late, Tearfund, London, UK, 2019.
Wilson, D. C. and Velis, C. A.: Waste management – still a global challenge in the 21st century: An evidence-based call for action, Waste Manage. Res., 33, 1049–1051, https://doi.org/10.1177/0734242X15616055, 2015.
Wilson, D. C., Rodic, L., Modak, P., Soos, R., Carpintero, A., Velis, K., Iyer, M., and Simonett, O.: Global waste management outlook, United Nations Environment Programme (UNEP), ISBN 978-92-807-3479-9, 2015.
Wu, D., Li, Q., Shang, X., Liang, Y., Ding, X., Sun, H., Li, S., Wang, S., Chen, Y., and Chen, J.: Commodity plastic burning as a source of inhaled toxic aerosols, J. Hazard. Mater., 416, 125820, https://doi.org/10.1016/j.jhazmat.2021.125820, 2021.
Xiu, M., Stevanovic, S., Rahman, M. M., Pourkhesalian, A. M., Morawska, L., and Thai, P. K.: Emissions of particulate matter, carbon monoxide and nitrogen oxides from the residential burning of waste paper briquettes and other fuels, Environ. Res., 167, 536–543, https://doi.org/10.1016/j.envres.2018.08.008, 2018.
Yokelson, R. J., Griffith, D. W. T., and Ward, D. E.: Open-path Fourier transform infrared studies of large-scale laboratory biomass fires, J. Geophys. Res.-Atmos., 101, 21067–21080, https://doi.org/10.1029/96jd01800, 1996.
Yokelson, R. J., Crounse, J. D., DeCarlo, P. F., Karl, T., Urbanski, S., Atlas, E., Campos, T., Shinozuka, Y., Kapustin, V., Clarke, A. D., Weinheimer, A., Knapp, D. J., Montzka, D. D., Holloway, J., Weibring, P., Flocke, F., Zheng, W., Toohey, D., Wennberg, P. O., Wiedinmyer, C., Mauldin, L., Fried, A., Richter, D., Walega, J., Jimenez, J. L., Adachi, K., Buseck, P. R., Hall, S. R., and Shetter, R.: Emissions from biomass burning in the Yucatan, Atmos. Chem. Phys., 9, 5785–5812, https://doi.org/10.5194/acp-9-5785-2009, 2009.
Yokelson, R. J., Burling, I. R., Gilman, J. B., Warneke, C., Stockwell, C. E., de Gouw, J., Akagi, S. K., Urbanski, S. P., Veres, P., Roberts, J. M., Kuster, W. C., Reardon, J., Griffith, D. W. T., Johnson, T. J., Hosseini, S., Miller, J. W., Cocker III, D. R., Jung, H., and Weise, D. R.: Coupling field and laboratory measurements to estimate the emission factors of identified and unidentified trace gases for prescribed fires, Atmos. Chem. Phys., 13, 89–116, https://doi.org/10.5194/acp-13-89-2013, 2013.