the Creative Commons Attribution 4.0 License.
the Creative Commons Attribution 4.0 License.
 | 04 Aug 2023
Modeling dust mineralogical composition: sensitivity to soil mineralogy atlases and their expected climate impacts
María Gonçalves Ageitos
Vincenzo Obiso
Ron L. Miller
Oriol Jorba
Martina Klose
Matt Dawson
Yves Balkanski
Jan Perlwitz
Sara Basart
Enza Di Tomaso
Jerónimo Escribano
Francesca Macchia
Gilbert Montané
Natalie M. Mahowald
Robert O. Green
David R. Thompson
Carlos Pérez García-Pando
Soil dust aerosols are a key component of the climate system, as they interact with short- and long-wave radiation, alter cloud formation processes, affect atmospheric chemistry and play a role in biogeochemical cycles by providing nutrient inputs such as iron and phosphorus. The influence of dust on these processes depends on its physicochemical properties, which, far from being homogeneous, are shaped by its regionally varying mineral composition. The relative amount of minerals in dust depends on the source region and shows a large geographical variability. However, many state-of-the-art Earth system models (ESMs), upon which climate analyses and projections rely, still consider dust mineralogy to be invariant. The explicit representation of minerals in ESMs is more hindered by our limited knowledge of the global soil composition along with the resulting size-resolved airborne mineralogy than by computational constraints. In this work we introduce an explicit mineralogy representation within the state-of-the-art Multiscale Online Nonhydrostatic AtmospheRe CHemistry (MONARCH) model. We review and compare two existing soil mineralogy datasets, which remain a source of uncertainty for dust mineralogy modeling and provide an evaluation of multiannual simulations against available mineralogy observations. Soil mineralogy datasets are based on measurements performed after wet sieving, which breaks the aggregates found in the parent soil. Our model predicts the emitted particle size distribution (PSD) in terms of its constituent minerals based on brittle fragmentation theory (BFT), which reconstructs the emitted mineral aggregates destroyed by wet sieving. Our simulations broadly reproduce the most abundant mineral fractions independently of the soil composition data used. Feldspars and calcite are highly sensitive to the soil mineralogy map, mainly due to the different assumptions made in each soil dataset to extrapolate a handful of soil measurements to arid and semi-arid regions worldwide. For the least abundant or more difficult-to-determine minerals, such as iron oxides, uncertainties in soil mineralogy yield differences in annual mean aerosol mass fractions of up to ∼ 100 %. Although BFT restores coarse aggregates including phyllosilicates that usually break during soil analysis, we still identify an overestimation of coarse quartz mass fractions (above 2 µm in diameter). In a dedicated experiment, we estimate the fraction of dust with undetermined composition as given by a soil map, which makes up ∼ 10 % of the emitted dust mass at the global scale and can be regionally larger. Changes in the underlying soil mineralogy impact our estimates of climate-relevant variables, particularly affecting the regional variability of the single-scattering albedo at solar wavelengths or the total iron deposited over oceans. All in all, this assessment represents a baseline for future model experiments including new mineralogical maps constrained by high-quality spaceborne hyperspectral measurements, such as those arising from the NASA Earth Surface Mineral Dust Source Investigation (EMIT) mission.
- Article
(15769 KB) - Full-text XML
-
Supplement
(5381 KB) - BibTeX
- EndNote


Airborne dust is one of the most abundant aerosols in the atmosphere and a fundamental component of the Earth system (e.g., Miller et al., 2014). Dust scatters and absorbs short- and long-wave radiation (e.g., Di Biagio et al., 2017, 2019) and affects cloud formation processes (e.g., Atkinson et al., 2013; Harrison et al., 2019; Chatziparaschos et al., 2023) and atmospheric chemistry and biogeochemical cycles (e.g., Krueger et al., 2004; Jickells, 2005; Kanakidou et al., 2018). All these processes are sensitive to dust mineralogy, as dust is present in soils and in the atmosphere as a mixture of different minerals with varying physicochemical properties rather than as a homogeneously mixed species.
Iron oxides are effective absorbers of short-wave (SW) radiation (Sokolik and Toon, 1996, 1999; Moosmuller et al., 2012; Wagner et al., 2012; Di Biagio et al., 2019), while minerals like calcite, quartz or phyllosilicates interact mostly with thermal radiation (Sokolik et al., 1998; Di Biagio et al., 2014, 2017). Dust particles chemically age in the atmosphere, becoming coated by acids (such as sulfuric acid, nitric acid or chlorine) or organic species (Goodman et al., 2000). The uptake rates of such compounds on dust aerosols are enhanced by the amounts of calcite and other alkaline components present (Krueger et al., 2004; Kakavas et al., 2021). Due to these coatings, originally hydrophobic dust becomes hygroscopic, which favors cloud formation processes (Usher et al., 2002). In addition, K-feldspars and quartz (Zimmermann et al., 2008; Atkinson et al., 2013; Harrison et al., 2019) have been revealed as efficient ice nuclei compared to other minerals present in dust, and their presence can enhance the generation of mixed-phase clouds (e.g., Chatziparaschos et al., 2023). Finally, iron and/or phosphorous species in mineral dust act as micronutrients for ocean and terrestrial ecosystems, influencing the global carbon, phosphorus and nitrogen biogeochemical cycles (Mahowald et al., 2008; Yu et al., 2015; Ito and Shi, 2016; Wang et al., 2017; Kanakidou et al., 2018). In particular, atmospheric soluble iron deposition constitutes a controlling factor of primary productivity in certain open-ocean regions (Jickells, 2005). Although the solubility of freshly emitted iron from dust sources is relatively low, it becomes enhanced during transport owing to atmospheric processing mechanisms. Both the amount of iron emitted from dust sources and its susceptibility to becoming soluble in the atmosphere depend on the dust composition (Journet et al., 2008; Shi et al., 2011, 2012; Myriokefalitakis et al., 2018, 2022).
However, many state-of-the-art Earth system models (ESMs) do not account for this information and still consider dust to be a homogeneous species, mainly due to the existing uncertainties in the size-resolved composition of parent soils, the resulting size distribution of minerals in airborne dust, the scarcity of observations to constrain them, and computational constraints.
Atmospheric dust occurs due to soil particles lifting from the Earth's surface, primarily from arid and semi-arid regions. The direct action of wind and turbulent forces together with the impact of saltating grains acts on the erodible surface layer of the soil to produce emission of particles mostly in the clay (up to 2 µm in diameter) and silt size ranges (from 2 to 63 µm in diameter). Therefore, the size-dependent composition of the parent soil determines the mineralogy of the emitted dust. Observations show a distinctive composition of airborne dust originating from different source regions. Mineralogy is often inferred from elemental composition analyses or is determined through semi-quantitative methods (Kandler et al., 2007, 2009; Scheuvens et al., 2013; Panta et al., 2023). Airborne dust samples are usually scarce, and many times these are complemented by artificially resuspended soil samples in the laboratory, experimental setups designed to mimic dust emission, or dust deposition and sediment samples (Kandler et al., 2007, 2009; Lawrence and Neff, 2009; Scheuvens et al., 2013).
Regional variations in dust mineralogy are commonly associated with changes in soil geology or weathering processes (Claquin et al., 1999; Scheuvens et al., 2013). Chemical weathering is enhanced in warm wet climates compared to dry cold climates. Some minerals, e.g., quartz, are insensitive to chemical weathering, while others are more susceptible to change and lead to the formation of secondary minerals (e.g., the hydrolysis of feldspars forms kaolinite, or the oxidation of ferromagnesian silicates produces secondary iron oxides). These factors explain, for instance, why dust from the Sahel region, characterized by intense weathering, is richer in kaolinite than that from the Saharan sources (Chester et al., 1972; Caquineau et al., 2002), and it has a high iron oxide content (Formenti et al., 2008, 2014). Chlorite is usually more abundant in dust from high latitudes (Griffin et al., 1968; Chester et al., 1972; Kandler et al., 2020). A latitudinal gradient of calcite, quartz and illite is also found in dusts originating from northern African sources, with decreasing mass fractions towards the Equator (Chester et al., 1972; Chiapello et al., 1997; Caquineau et al., 1998, 2002; Lafon et al., 2006; Formenti et al., 2008). In particular, the abundance of carbonates in the northern and northwestern Saharan dusts is related to the soil geology from these areas, which are dominated by limestones and carbonate-rich soils, i.e., Calcisols (Scheuvens et al., 2013; Formenti et al., 2011). Central Asian sources are rich in quartz (Gomes and Gillette, 1993), illite or chlorite (Gomes and Gillette, 1993; Lafon et al., 2006; Kandler et al., 2020). There is also evidence of dust mineralogical composition changes with transport. Typically, coarse-grained minerals, such as feldspars or quartz, constitute a higher fraction of transported masses close to sources compared to samples collected in remote regions, where smaller phyllosilicates are more abundant (Lawrence and Neff, 2009).
Despite this evidence, our knowledge of soil mineralogy at the global scale relies exclusively on a scarce set of soil descriptions. These measurements are particularly rare in the arid and semi-arid regions prone to dust emission and usually provide only a crude representation of the size distribution. Exploiting this information, previous works (Claquin et al., 1999; Nickovic et al., 2012; Journet et al., 2014; Ito and Wagai, 2017) developed soil mineralogy maps, oriented towards atmospheric and climate modeling, which provide the mineral mass fractions present in the clay and silt size ranges.
The earliest soil mineralogy atlas (SMA) used for atmospheric studies, by Claquin et al. (1999), reports eight different minerals relevant for their climate effects, i.e., illite, smectite, kaolinite, calcite, quartz, feldspars, gypsum and hematite. The latter is commonly taken as a proxy for iron oxides (mainly hematite and goethite) and, although originally apportioned exclusively to the silt size, further extensions of the soil map (Nickovic et al., 2012) consider iron oxides to also be present in the finer clay sizes. This updated size distribution has been proven to be more realistic through modeling studies (Scanza et al., 2015; Perlwitz et al., 2015a, b). A more recent map by Journet et al. (2014) reports four additional minerals, including chlorite, vermiculite and mica, and distinguishes between hematite in the clay and goethite in the clay and silt sizes of the soil. Ito and Wagai (2017) introduce novel approaches to quantify the existing uncertainties in our knowledge of topsoil and subsoil composition of clay size minerals. Unfortunately, their study neglects the silt size grains, which prevents modelers from having consistent information throughout the size ranges of airborne dust.
These maps are built upon soil descriptions usually obtained through experimental techniques that break the aggregates originally present in the soil (i.e., wet sieving). As a result, phyllosilicates, which are usually emitted as aggregates, are overemphasized in the finer soil fractions compared to what is observed in airborne dust. Soil analyses may also alter the size distribution of carbonates such as calcite. Some modeling studies directly attribute the soil minerals' size distribution to the airborne dust (e.g., Atkinson et al., 2013; Ito and Xu, 2014). However, novel approaches relying on brittle fragmentation theory (BFT) (Kok, 2011) were introduced by Perlwitz et al. (2015a, b), Scanza et al. (2015) and Pérez García-Pando et al. (2016), which allows one to represent the emitted mineral size distribution more realistically.
A range of previous modeling studies have focused on constraining the influence of mineralogy on the dust direct radiative effect (DRE). Non-negligible impacts on dust absorption have been identified, either using the raw mineral variations in the soil (e.g., Claquin et al., 1999), directly translating them into airborne mass fractions (e.g., Journet et al., 2014), or redistributing the minerals into the emitted sizes through BFT (e.g., Scanza et al., 2015; Ito et al., 2021; Obiso et al., 2023a). In particular, our poor knowledge of the abundance of iron oxides and their speciation has been identified as a key factor contributing to the uncertainty in modeled dust DRE in one of the few analyses to date which considers not only the mean mineralogy, but also the ranges of variability provided with the soil maps (Li et al., 2021). Despite these uncertainties, accounting for the soil's varying composition improves the spatiotemporal variability in modeled dust absorption as compared to observations (Obiso et al., 2023a, b).
Some models already incorporate explicitly the number concentrations of K-feldspar and quartz in the atmosphere (Atkinson et al., 2013; Vergara-Temprado et al., 2017; Chatziparaschos et al., 2023) to derive the concentration of ice-nucleating particles (INPs). Their evaluation against observations suggests improvements in the geographical distribution of the INPs (Atkinson et al., 2013) and their relevance at the global scale (Vergara-Temprado et al., 2017; Chatziparaschos et al., 2023). Dust mineralogy has also been considered in models to derive the total iron content and its potential solubility through atmospheric processing (e.g., Ito and Xu, 2014; Wang et al., 2015; Ito and Shi, 2016; Ito et al., 2018; Scanza et al., 2018; Myriokefalitakis et al., 2018; Hamilton et al., 2019; Myriokefalitakis et al., 2022; Bergas-Massó et al., 2023), with the aim of assessing its effect on soluble iron deposition over the ocean and hence on primary productivity and biogeochemical cycles.
Of these efforts, only a few (e.g., Perlwitz et al., 2015a, b; Scanza et al., 2015, 2018; Pérez García-Pando et al., 2016; Ito and Shi, 2016; Hamilton et al., 2019; Li et al., 2021; Ito et al., 2021; Myriokefalitakis et al., 2022; Bergas-Massó et al., 2023; Obiso et al., 2023a) consider the difference between the size distribution of minerals reported in the soil maps and that of the aerosol, and even fewer (Li et al., 2021) make use of different soil maps in a common model.
To our knowledge, a systematic evaluation of the impact of the choice of a specific soil mineralogy map on the modeled airborne mineralogy has not been conducted, although such a choice has a potentially relevant effect on the modeled atmospheric composition and climate. To that end, we extend the atmospheric dust cycle of the Multiscale Online Nonhydrostatic AtmospheRe CHemistry (MONARCH) model (Klose et al., 2021, and references therein) to allow for an explicit representation of the different minerals present in dust aerosols. We review and assess the SMAs from Claquin et al. (1999), with the updates by Nickovic et al. (2012), and Journet et al. (2014) and we conduct three different global multiannual experiments in which we exclusively vary the soil composition information. We compare our model results to available observations of dust mineralogy to provide an overall assessment of the model capabilities and the weaknesses and strengths of the soil mineralogy choice. Finally, we derive proxies that allow us to assess the impact of the modeled mineralogy on key climate aspects, such as the dust DRE and the atmospheric soluble iron deposition. Our study represents the baseline upon which simulations including soil mineralogy maps built with new high-quality spaceborne hyperspectral information (Green et al., 2020) will be compared in the near future.
2.1 The atmospheric chemistry model
MONARCH is a fully coupled atmosphere chemistry model developed at the Earth Sciences Department of the Barcelona Supercomputing Center (BSC). The model's atmospheric dynamics rely on the Non-hydrostatic Multiscale Model on the B-grid (NMMB) (Janjic and Gall, 2012), which can be applied from regional to global spatial scales. MONARCH has also inherited from the NMMB the ability to use different representations for relevant physics processes (e.g., the land surface model or the cloud microphysics representation).
MONARCH includes an in-line gas-phase chemistry module (Jorba et al., 2012; Badia and Jorba, 2015; Badia et al., 2017) and advanced representation of natural and anthropogenic aerosols, i.e., dust (Pérez et al., 2011; Haustein et al., 2012; Klose et al., 2021), sea salt (Spada et al., 2013), organic mass (primary and secondary), black carbon (Spada, 2015), sulfate, ammonia and nitrate. The dynamic aerosols can interact with short- and long-wave radiation (Pérez et al., 2011). Ongoing developments include the representation of heterogeneous chemistry considering dust mineralogy (Soussé Villa et al., 2021) as well as brown carbon and its effects on the atmospheric radiative balance (Navarro-Barboza et al., 2021). At the moment, the aerosol–cloud interactions are not explicitly solved, and the cloud activation schemes rely on aerosol climatologies. One of the guiding principles of the model design is flexibility in a way that allows the user to select the aerosol species to be simulated, the activation or not of the gas-phase chemistry, the coupling of the dynamically represented aerosols with radiation, etc. Also, work is being done to allow the chemistry to be solved using runtime configuration approaches (Dawson et al., 2021) and exploiting GPU heterogeneous architectures (Guzmán-Ruiz et al., 2020).
MONARCH is a member of the multi-model ensemble of the Copernicus Atmosphere Monitoring Service (CAMS) of the European Commission, providing operational air quality forecasts, analyses and reanalyses of the main atmospheric pollutants among reactive gases and aerosols for an extended European domain (, ). The MONARCH assimilation system (MONARCH-DA) is based on a local ensemble transform Kalman filter (LETKF) scheme (Hunt et al., 2007; Miyoshi and Yamane, 2007; Schutgens et al., 2010; Di Tomaso et al., 2017; Escribano et al., 2022) coupled to the model through input/output (I/O) routines and requires the model to be run in an ensemble mode. These complex simulations are handled through the Autosubmit workflow manager (Manubens-Gil et al., 2016; Uruchi et al., 2021), which also allows us to process the necessary input files and to postprocess and archive the model outputs in an easy way.
In this work, we apply MONARCH's standard configuration for the physics schemes and parameterizations. This setup counts on the Rapid Radiative Transfer Model, RRTMG (Iacono et al., 2001, 2008), to solve short- and long-wave radiation. The Betts–Miller–Janjic scheme (Betts, 1986; Betts and Miller, 1986) parameterizes convection, while grid-scale precipitation is defined through Ferrier microphysics (Ferrier et al., 2002). Turbulence and the planetary boundary layer rely on the Mellor–Yamada–Janjic scheme (Janjic, 2002; Mellor and Yamada, 1982) and the land surface fluxes on the Noah model (Ek et al., 2003). All the experiments are configured to represent only the atmospheric dynamics and the speciated dust cycle, disabling the gas-phase chemistry and the other dynamic aerosols. The dust interaction with radiation, along with that of other aerosols, is solved by using prescribed aerosol climatologies. This configuration allows us to reproduce the main features or the mineral life cycle, while it optimizes the computational time needed to conduct the experiments.
2.2 Representation of the dust cycle
The MONARCH dust cycle has been extensively evaluated at regional and global scales (Pérez et al., 2011; Haustein et al., 2012; Klose et al., 2021). The model is the reference forecast system of the Barcelona Dust Forecast Center (https://dust.aemet.es/, last access: 6 December 2022) and the Regional Center for Northern Africa, the Middle East and Europe (NAMEE) of the Sand and Dust Storms Warning Advisory and Assessment System (SDS-WAS) of the World Meteorological Organization (WMO). Moreover, MONARCH has the capability to improve dust estimates through data assimilation techniques, using both column-integrated (Di Tomaso et al., 2017; Di Tomaso et al., 2022) and vertically resolved (Escribano et al., 2022) satellite dust retrievals, and it was recently used to derive a dust regional reanalysis for the NAMEE domain (Di Tomaso et al., 2022) with unprecedented high resolution.
MONARCH represents dust generation and uplift by surface winds and turbulence through a set of different schemes. Then dust aerosols are transported through horizontal and vertical advection, horizontal diffusion and vertical transport by turbulence and convection and are removed from the atmosphere by dry deposition, gravitational settling and in-cloud and below-cloud scavenging. The dust size distribution follows a sectional approach and considers eight transport bins ranging up to 20 µm in diameter, with the four finest bins covering the clay size range and the others falling into the silt size ranges; in particular, 0.2–0.36, 0.36–0.6, 0.6–1.2, 1.2–2.0, 2.0–3.6, 3.6–6.0, 6.0–12.0 and 12.0–20.0 µm (Pérez et al., 2011; Klose et al., 2021) are the size boundaries for each bin.
Dust emission can be defined via a variety of schemes (Klose et al., 2021), ranging from more physics-based to more heuristic approaches (Marticorena and Bergametti, 1995; Ginoux et al., 2001; Shao, 2001, 2004; Shao et al., 2011; Kok et al., 2014). The schemes either produce a particle size distribution (PSD) at emission dependent on the atmospheric forces (Shao, 2001) or fix the emitted PSD following either D'Almeida (1987) or Kok (2011).
In this work, we select one of the configurations defined and assessed in Klose et al. (2021) (G01-UST), in which dust emission relies on a topography-based source function (Ginoux et al., 2001) that scales the flux from potentially available sources and depends on the friction velocity. Dust emission is possible from areas identified through maps of frequency of occurrence of dust optical depth above 0.2 created from Moderate Resolution Imaging Spectroradiometer (MODIS) Deep Blue retrievals (Ginoux et al., 2012; Hsu et al., 2004). The effect of surface roughness is parameterized based on Raupach et al. (1993) using vegetation cover information derived from Landsat and MODIS surface reflectance monthly data (Guerschman et al., 2015).
2.3 Dust mineralogy
A key element to independently trace different minerals is to estimate the size-resolved mineralogy at emission. To do so, we need (1) to define the soil mineralogy at the model grid horizontal resolution (Sect. 2.3.1) and (2) to project the soil mineralogy onto the transport bin sizes (Sect. 2.3.2). Then, the emitted mineral mass fractions in each of the size bins are multiplied by the modeled bulk dust flux, and each mineral is independently traced and subjected to the main transport and removal processes. The representation of the minerals' size distribution in MONARCH follows that of the compositionally homogeneous dust; i.e., each mineral will be represented by eight tracers with diameters ranging from 0.2 to 20 µm. The current implementation allows the user to customize the subset of minerals to be simulated with the aim of making the model computationally lighter for specific applications.
We define mineral-dependent mass densities according to literature data (Table 1). All minerals are considered to be externally mixed, except for iron oxides. A large part of the emitted flux of iron oxides is considered to be internally mixed with other minerals, e.g., in the form of accretions in phyllosilicates, in line with observational evidence and previous modeling studies (Kandler et al., 2009; Perlwitz et al., 2015a). In MONARCH, we define two different types of tracers for the iron oxides. One set of tracers carries the masses of the iron oxides that constitute accretions in other minerals, which make up the largest fraction and are allowed to be up to 5 % of the masses of the other minerals at emission (Perlwitz et al., 2015a). Given that their total emitted mass is low compared to the sum of all the minerals, we assume that these accretions do not change the mass density of the host particles, and we assign them the density of the most abundant phyllosilicate, i.e., illite. Another set of tracers is used to transport the remaining fraction of iron oxides, which is considered to be externally mixed. Their mass density depends on the speciation given by the soil map used, either as iron oxides (average between hematite and goethite), pure hematite or pure goethite.
Mass density impacts the mineral settling velocity, which is particularly relevant for the removal of coarse particles and for parameters influencing the wet deposition, which constitutes an effective removal process for finer particles. Below-cloud particle scavenging in MONARCH is defined according to Slinn (1984), and the capture efficiencies for snow and rain droplets change with the mass density, the volume and the effective particle radius (see Pérez et al., 2011, for details). At present, minerals have the same treatment in in-cloud scavenging; i.e., they are assumed to share the same solubility, and they do not chemically interact with other gas-phase or aerosol species in the model. The change in densities with respect to homogeneous dust (set to 2500 kg m−3 for the four finest bins and to 2650 kg m−3 for the four coarsest bins), together with the preferential size distribution of the minerals (e.g., finer phyllosilicate grains, coarser calcite, quartz and feldspars), results in differences in the global distribution of minerals with respect to homogeneous dust (see Sect. 5.3).
Table 1Mass densities (kg m−3) and iron content (wt %) defined for the minerals included in MONARCH.
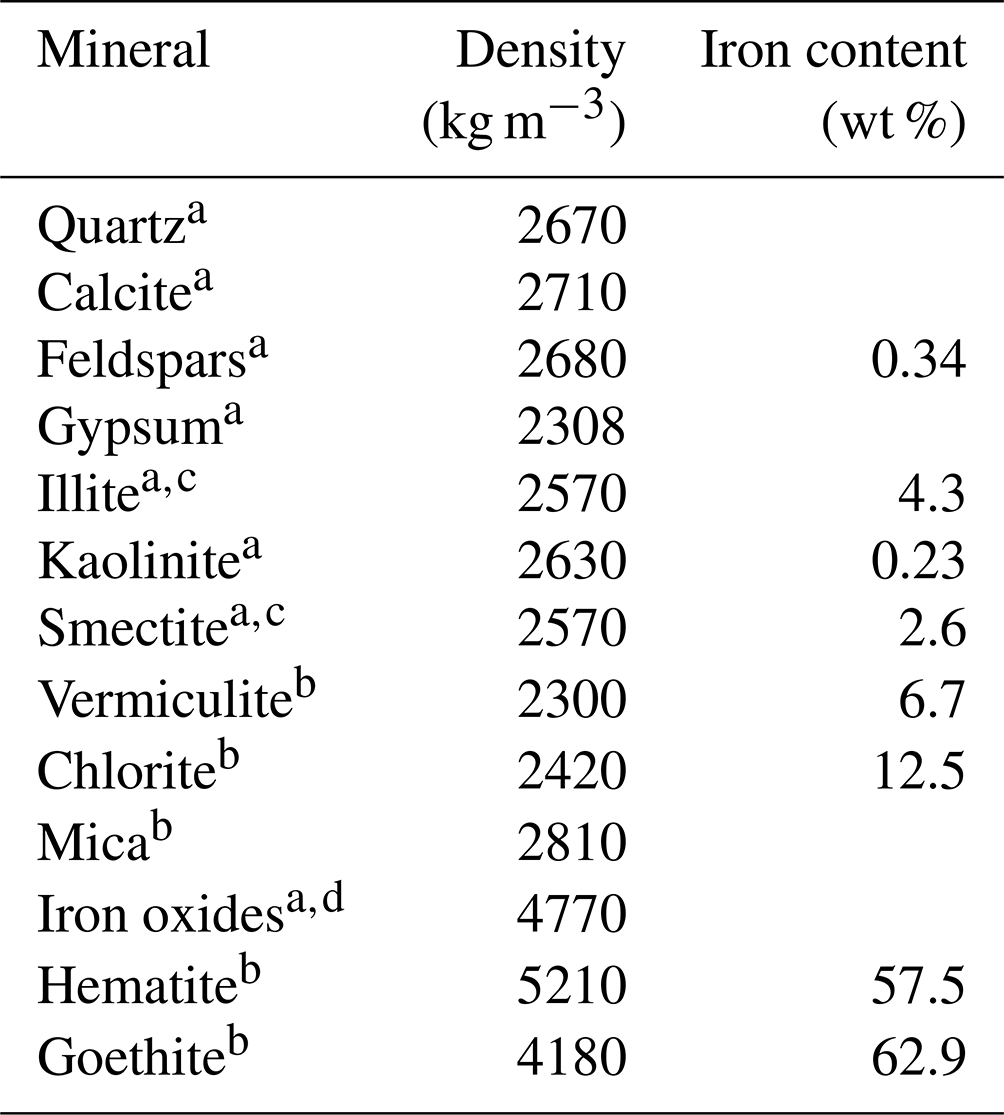
Density values from https://www.mindat.org (last access: 6 December 2022), https://www.engineeringtoolbox.com (last access: 6 December 2022) and http://www.webmineral.com (last access: 6 December 2022) as compiled by
a Perlwitz et al. (2015a) and b Menut et al. (2020).
c Average between illite and smectite. d Average for iron oxides including goethite and hematite. Iron content for phyllosilicate minerals is taken from Journet et al. (2014) and for iron oxides from Journet et al. (2008).
2.3.1 Soil mineralogy at the model resolution
MONARCH can derive the soil composition of dust sources from the soil map of Claquin et al. (1999) with modifications by Nickovic et al. (2012), C1999-SMA, or from a revised version of the map by Journet et al. (2014), J2014-SMA. C1999-SMA and J2014-SMA were originally designed with a focus on dust mineralogy modeling and, as mentioned before, they identify 8 and 12 relevant minerals for dust–climate interactions in the clay and silt fractions of the soil, respectively (see Appendix A for details).
Both maps rely on the same basic principle: they hypothesize that mineralogy is inherently linked to the soil physicochemical properties and texture, which are commonly used in soil classification systems (e.g., those reported by the Food and Agricultural Organization, FAO, of the United Nations). C1999-SMA considers 28 arid and semi-arid soil types identified by the FAO (FAO-UNESCO, 1974) and mapped in the FAO Digital Soil Map of the World (DSMW) (FAO-UNESCO, 1995) with a horizontal resolution of 0.083∘ (∼ 10 km at mid-latitudes). J2014-SMA relies on the FAO74 (FAO-UNESCO, 1974) and FAO90 (FAO-UNESCO, 1997) soil classifications mapped in the Harmonized World Soil Database (HWSD) version 1.1 (FAO/IIASA/ISRIC/ISSCAS/JRC, 2009) with a spatial resolution of 0.0083∘ (∼ 1 km at mid-latitudes). Combining both FAO74 and FAO90, there is a total of 211 different soil units with potential mineralogical content according to J2014-SMA.
In both C1999-SMA and J2014-SMA, a mean mineralogy is assigned to each soil type or unit by compiling available descriptions from the literature, and it is subsequently extrapolated geographically to any location that shares the same soil classification, hence providing a spatially resolved map of soil mineral fractions. Despite the extensive data collection, the scarcity of soil composition measurements, their heterogeneity and their uneven geographical distribution challenge the generation of globally representative SMAs. In particular, the available observations at the time allowed Claquin et al. (1999) to describe the mineralogy of 80 % of the soil types they identify as arid or semi-arid. Journet et al. (2014) have observational information about some of the mineral abundances in 55 % of the 211 FAO74 and FAO90 soil units and include regions that were not represented in C1999-SMA. However, the compiled observations do not provide information on calcite or iron oxides for many soil units in the clay size fraction and, in general, there is a misrepresentation of the mineralogy of the silt size class. As a result, both maps add empirical relations (e.g., between soil texture and the size distribution of calcite or the quartz-to-feldspar ratio) and perform additional hypotheses (e.g., associating the soil color with the iron oxide content) to further extend the mineralogical information. In Journet et al. (2014), the distinction in hematite and goethite is sometimes obtained through the application of a fixed ratio based on empirical evidence (Kandler et al., 2009). Furthermore, extensions through averaging of mineral fractions for all the silt size records or for major soil groups are proposed for mica, chlorite, quartz and feldspars, respectively, to complete the global map (see CASE2 in Journet et al., 2014).
C1999-SMA and J2014-SMA treat differently the components of the soil descriptions that do not correspond to their target minerals and that are listed in Table 1. While Claquin et al. (1999) report the mineral fractions normalized to sum to 100 %, i.e., assume that soil mineralogy fundamentally consists only of the eight identified minerals, Journet et al. (2014) provide the mean mineralogy as derived from the soil records, with total mass fractions of known minerals ranging from 42.4 % to 102.8 % (without considering inferred calcite fractions and other extensions). That is, J2014-SMA allows the possibility of emitted minerals that are unidentified and not included in our Table 1. MONARCH can currently use C1999-SMA normalized and two variations for J2014-SMA: normalized and non-normalized, which are both based on the extended mineralogy data referred to as CASE2 by Journet et al. (2014). Appendix A describes these datasets (Sect. A1) and summarizes the revision we made (Sect. A2).
One recognized weakness of the methodology to construct the SMAs arises from the main assumption: the link between the defining parameters of a soil class and a mineralogy, which is questionable for some soil classes where the variability in composition among samples is much larger than that of the mean composition. Please note that here we work exclusively with the information on the mean mineralogy, and we do not consider the uncertainties provided in the original works (i.e., standard deviations of the mineral abundances for each soil type and the number of soil descriptions used to derive the values). These uncertainties have been explored for the particular case of iron oxides in previous works (Li et al., 2021), and we plan to consider them in the future to further assess the sensitivity of our modeled minerals to the soil composition.
Although, at the regional scale, atmospheric models can reach resolutions as high as those of the SMAs presented here (0.0083∘ for J2014-SMA and 0.083∘ for C1999-SMA), this is rarely the case for global atmospheric models, let alone ESMs. Therefore, the high-resolution information of the SMAs has to be adapted to the coarser model grid before estimating the minerals' emission. If we assume that the heterogeneity of the local sources may be masked by the mixing of dust plumes at a regional scale (Scheuvens et al., 2013), the soil mineralogy at the coarser model resolution would correspond to the average of the high-resolution information from the soil maps. However, under the assumption that the mineralogy of the most abundant soil type is the one that determines the composition of a source, the dominant soil type over a grid cell provides a computationally efficient approach to derive the mineralogy at the model resolution, and it is the one currently implemented in MONARCH. The impact of this choice remains to be explored, and it may be significant in regions where the soil composition variability is high.
2.3.2 Deriving the emitted PSD of dust minerals from the soil composition
The mineralogy of the soils provided in the SMAs has been inferred in many cases via techniques that alter the original soil size distribution, i.e., through wet sieving. This dispersal is particularly relevant for the phyllosilicates, which are usually found in the form of aggregates in soils and are detected in the atmosphere at higher proportions at coarser (silt) sizes than those reported in the soil maps (Perlwitz et al., 2015a; Pérez García-Pando et al., 2016). In these recent studies, it was also shown that BFT (Kok, 2011) represents a practical framework to describe the emitted PSD in terms of its constituent minerals as it builds upon the dispersed soil PSD, which underpins the soil mineralogical datasets.
BFT is derived by analogy to the fragmentation of brittle materials such as glass spheres. It describes the emitted PSD as a power law between ∼ 2 and ∼ 10 µm along with a depletion relative to the power law for dust 10 µm, depending on the side-crack propagation length (λ), and for dust 2 µm due to the size of the indivisible dust particles. In BFT the production of dust particles with sizes Dd is assumed to be proportional to the volume fraction of soil particles with sizes Ds ≤ Dd. All in all, the normalized emitted mass PSD can be expressed as
where erf is the error function and Cm is a normalization constant. Kok (2011) assumed an invariant soil size distribution with a volume median diameter () of 3.4 ± 1.9 µm and a geometric standard deviation (σs) of 3.0 ± 0.4 derived from available measurements. With these values, λ= 12 ± 1 µm was obtained by fitting Eq. (1) to measurements of the emitted size distribution.
Let be the mass fraction of mineral i in the clay fraction and the mass fraction of mineral i in the silt fraction (see Appendix A). To derive the normalized mass size distribution for each emitted mineral, we assume that aggregates are homogeneous mixtures of minerals with similar fragmentation properties. The emitted mass PSD for each mineral i (for each soil type and soil texture) can be derived as
with . The emitted mass fraction Mik of every mineral i in each size bin k relative to the total emitted mass up to 20 µm is then estimated by integrating Eq. (2) over each of the four smallest bins (i.e., 0.2–2 µm) and Eq. (3) over each of the four coarsest bins (i.e., 2–20 µm):
where and where and are the minimum and maximum diameters of each bin k.
Figure 1 compares the relative contribution of each mineral in each size bin in the soil and the emitted dust for one of the most abundant soil types in C1999-SMA. As expected from Eq. (2), the minerals in the clay size range of the dispersed soil contribute exclusively and with the same proportion to the emitted particles below 2 µm. Some of the silt size aggregates are clay minerals (e.g., illite) that are disaggregated (or fragmented) during wet sieving and thus are present at clay sizes in the SMA. For particle diameters above 2 µm, the emitted mass of a given mineral has contributions from the dispersed soil clay and silt sizes as reflected in Eq. (3). The redistribution of soil-dispersed clay minerals into coarser emitted grains has a double effect: it includes phyllosilicates (e.g., illite, kaolinite and smectite) in these size ranges and reduces the fractional contribution of minerals originally reported in the silt sizes (e.g., quartz or feldspars), producing an aerosol size-resolved mineralogy more consistent with observations (Perlwitz et al., 2015b; Pérez García-Pando et al., 2016).
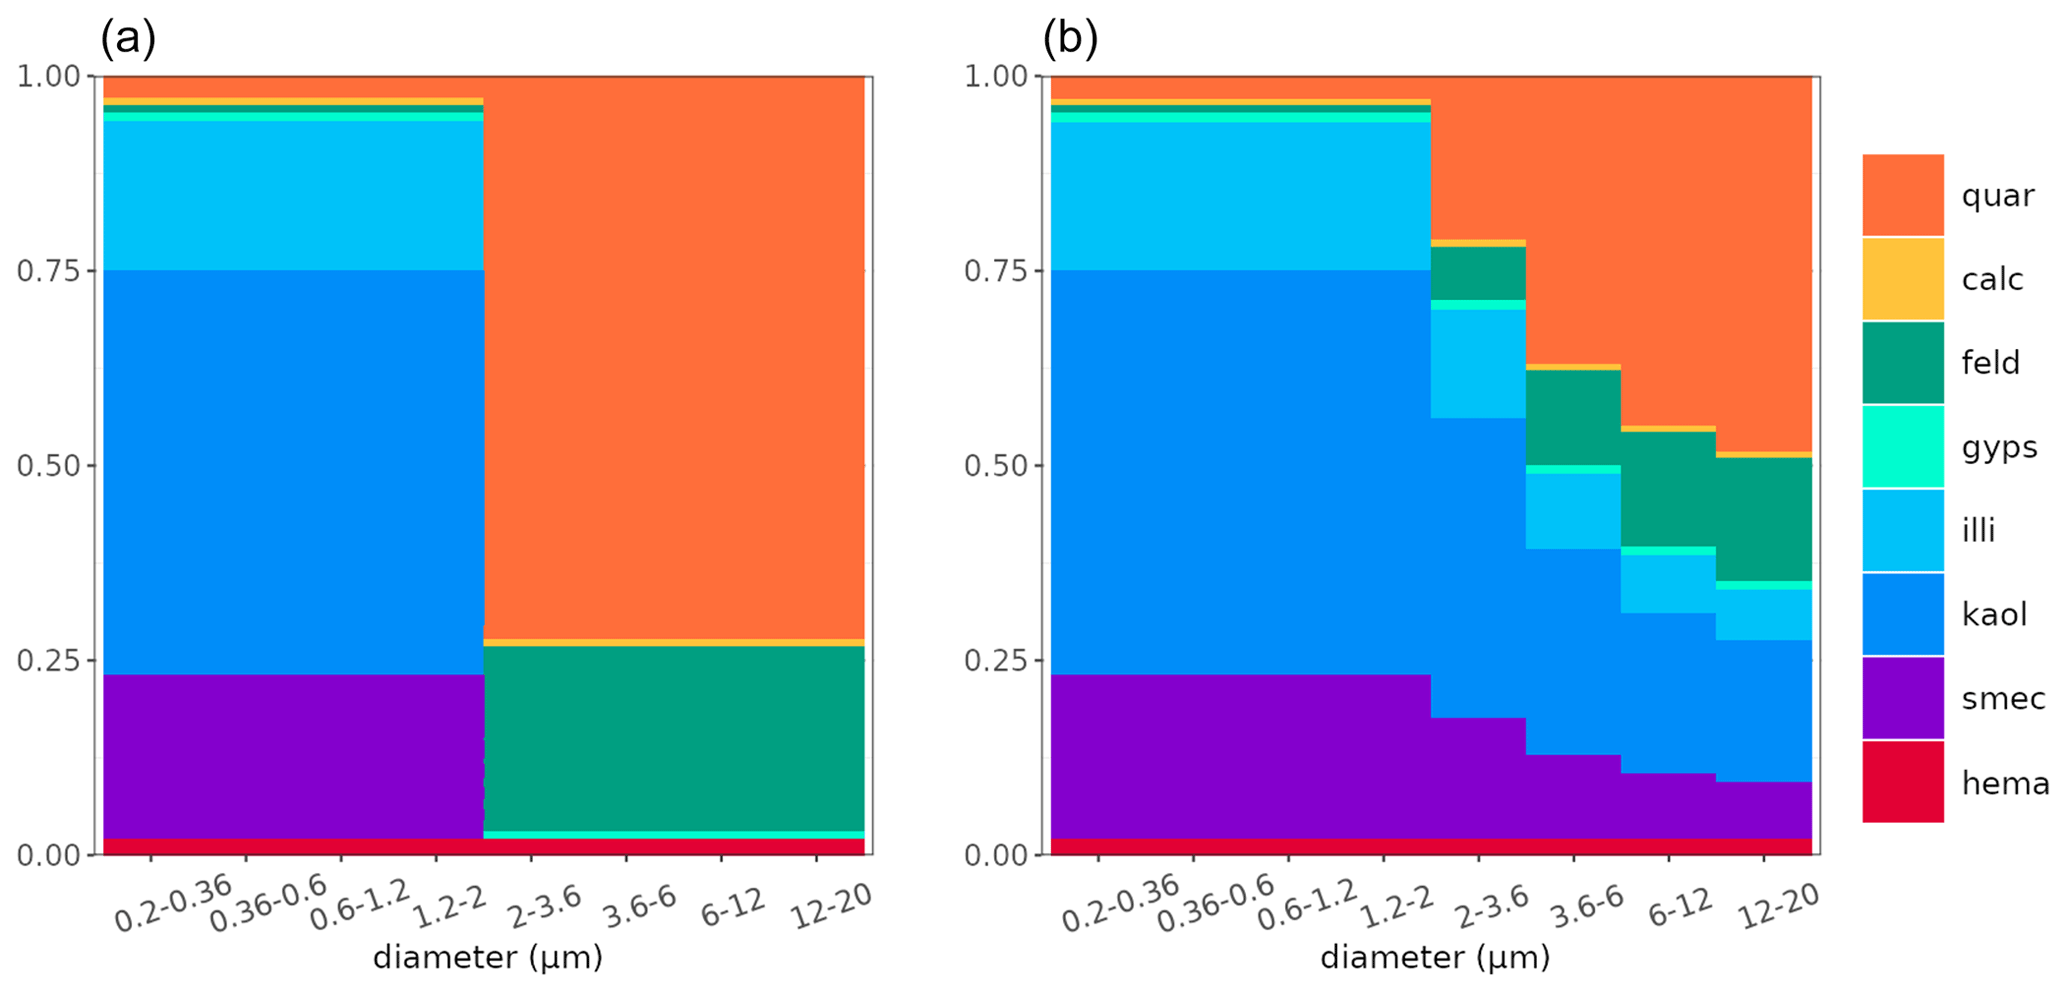
Figure 1Normalized mass size distribution of minerals in the soil (a) and the aerosol (b) for the Xerosols Haplic soil type according to C1999-SMA. Quar: quartz; calc: calcite; feld: feldspars; gyps: gypsum; illi: illite; kaol: kaolinite; smec: smectite; hema: hematite.
We aim to assess the sensitivity of the modeled mineralogy and its potential climate impacts to the choice of a specific soil mineralogy. To that end, we design three different experiments (Table 2) that rely on the same model configuration and use the C1999-SMA, J2014-SMA normalized and J2014-SMA non-normalized soil datasets described above (Sect. 2.3.1) and referred to as C1999, J2014 and J2014NN, respectively.
Claquin et al. (1999)Nickovic et al. (2012)Journet et al. (2014)Journet et al. (2014)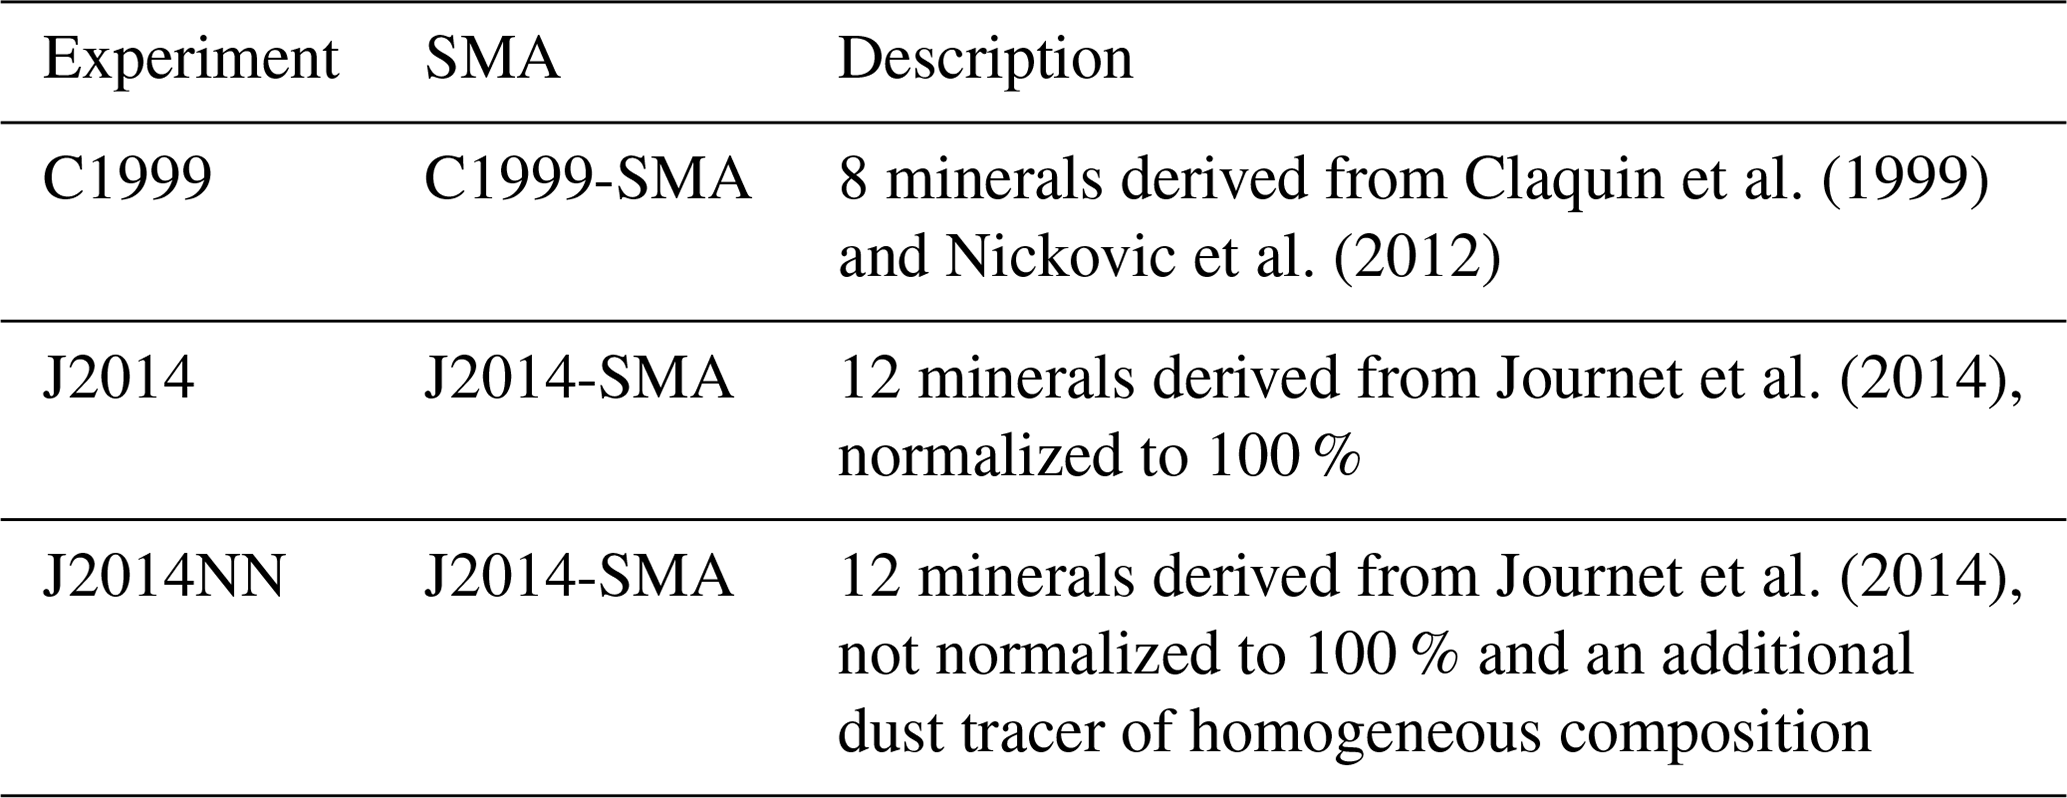
The configuration of MONARCH for the atmospheric physics is summarized in Sect. 2.1, and the specific setup for the dust cycle is summarized in Sect. 2.2. The simulations are performed at the global scale with a regular horizontal grid of 1∘ × 1.4∘ (latitude × longitude) resolution and 48 vertical hybrid pressure-sigma layers up to 10 hPa. They cover the period from 2006 to 2010 after 1 year used as spinup (2005) for the soil humidity and mineral initial conditions. The atmospheric meteorological variables are initialized from the ERA-Interim reanalysis (Berrisford et al., 2009; Dee et al., 2011) every 24 h to keep the modeled circulation close to observations and hence allow for a more precise comparison of the dust cycle to observations. However, the soil temperature, moisture and mineral dust fields are those prognostically estimated by MONARCH (i.e., every day the model uses as an initial state for these variables their modeled value at 24:00 of the day before).
4.1 Dust observations and the evaluation method
MONARCH's ability to reproduce the dust cycle with our selected configuration was presented in Klose et al. (2021), who included an extensive evaluation of the dust optical properties compared to the AErosol RObotic NETwork (AERONET) (Holben et al., 1998; Giles et al., 2019) and MODIS (Ginoux et al., 2012; Hsu et al., 2013) retrievals. Here, we complement these previous analyses by including the composition-invariant dust in one of our experiments and assessing the modeled dust surface concentration and deposition fluxes against climatological observations. The purpose of these additional diagnostics is to provide a framework for the evaluation of the mineralogy, which ultimately depends on the ability of MONARCH to represent the atmospheric processes of the dust cycle.
We use the climatological observations of dust surface concentrations from the Rosenstiel School of Marine and Atmospheric Science (RSMAS) of the University of Miami (Prospero, 1990, 1996, 1999; Arimoto et al., 1995) and the African Monsoon Multidisciplinary Analysis (AMMA) international program (Marticorena et al., 2010), the latter from the French National Observatory Service International Network to study Deposition and Atmospheric composition in AFrica (INDAAF; https://indaaf.obs-mip.fr/, last access: 6 December 2022). The three AMMA sites provide measurements of surface dust concentrations over northern African sources below 10 µm in diameter, while the 20 stations from the RSMAS are distributed over transport and remote regions (Fig. 2a) and report the total surface concentration. The dust evaluation is complemented by comparison with the dust deposition fluxes compiled by Albani et al. (2014) for the present climate, which cover 110 locations (Fig. 2a) and also give information on the fraction below 10 µm in diameter. For the comparison, we compute the 5-year annual mean of modeled surface concentration and deposition fluxes of dust. For those measurements where the mass below 10 µm in diameter is reported, we estimate the equivalent size range from the model. Spatially, the model values of the nearest-neighbor cell to the observation location are taken. An overview of the model performance against each dataset is given through the estimates of the normalized mean bias (nMB), normalized root mean square error (nRMSE) and correlation (r). The definition of these metrics and their ranges of uncertainty can be found in Sect. S1 in the Supplement.
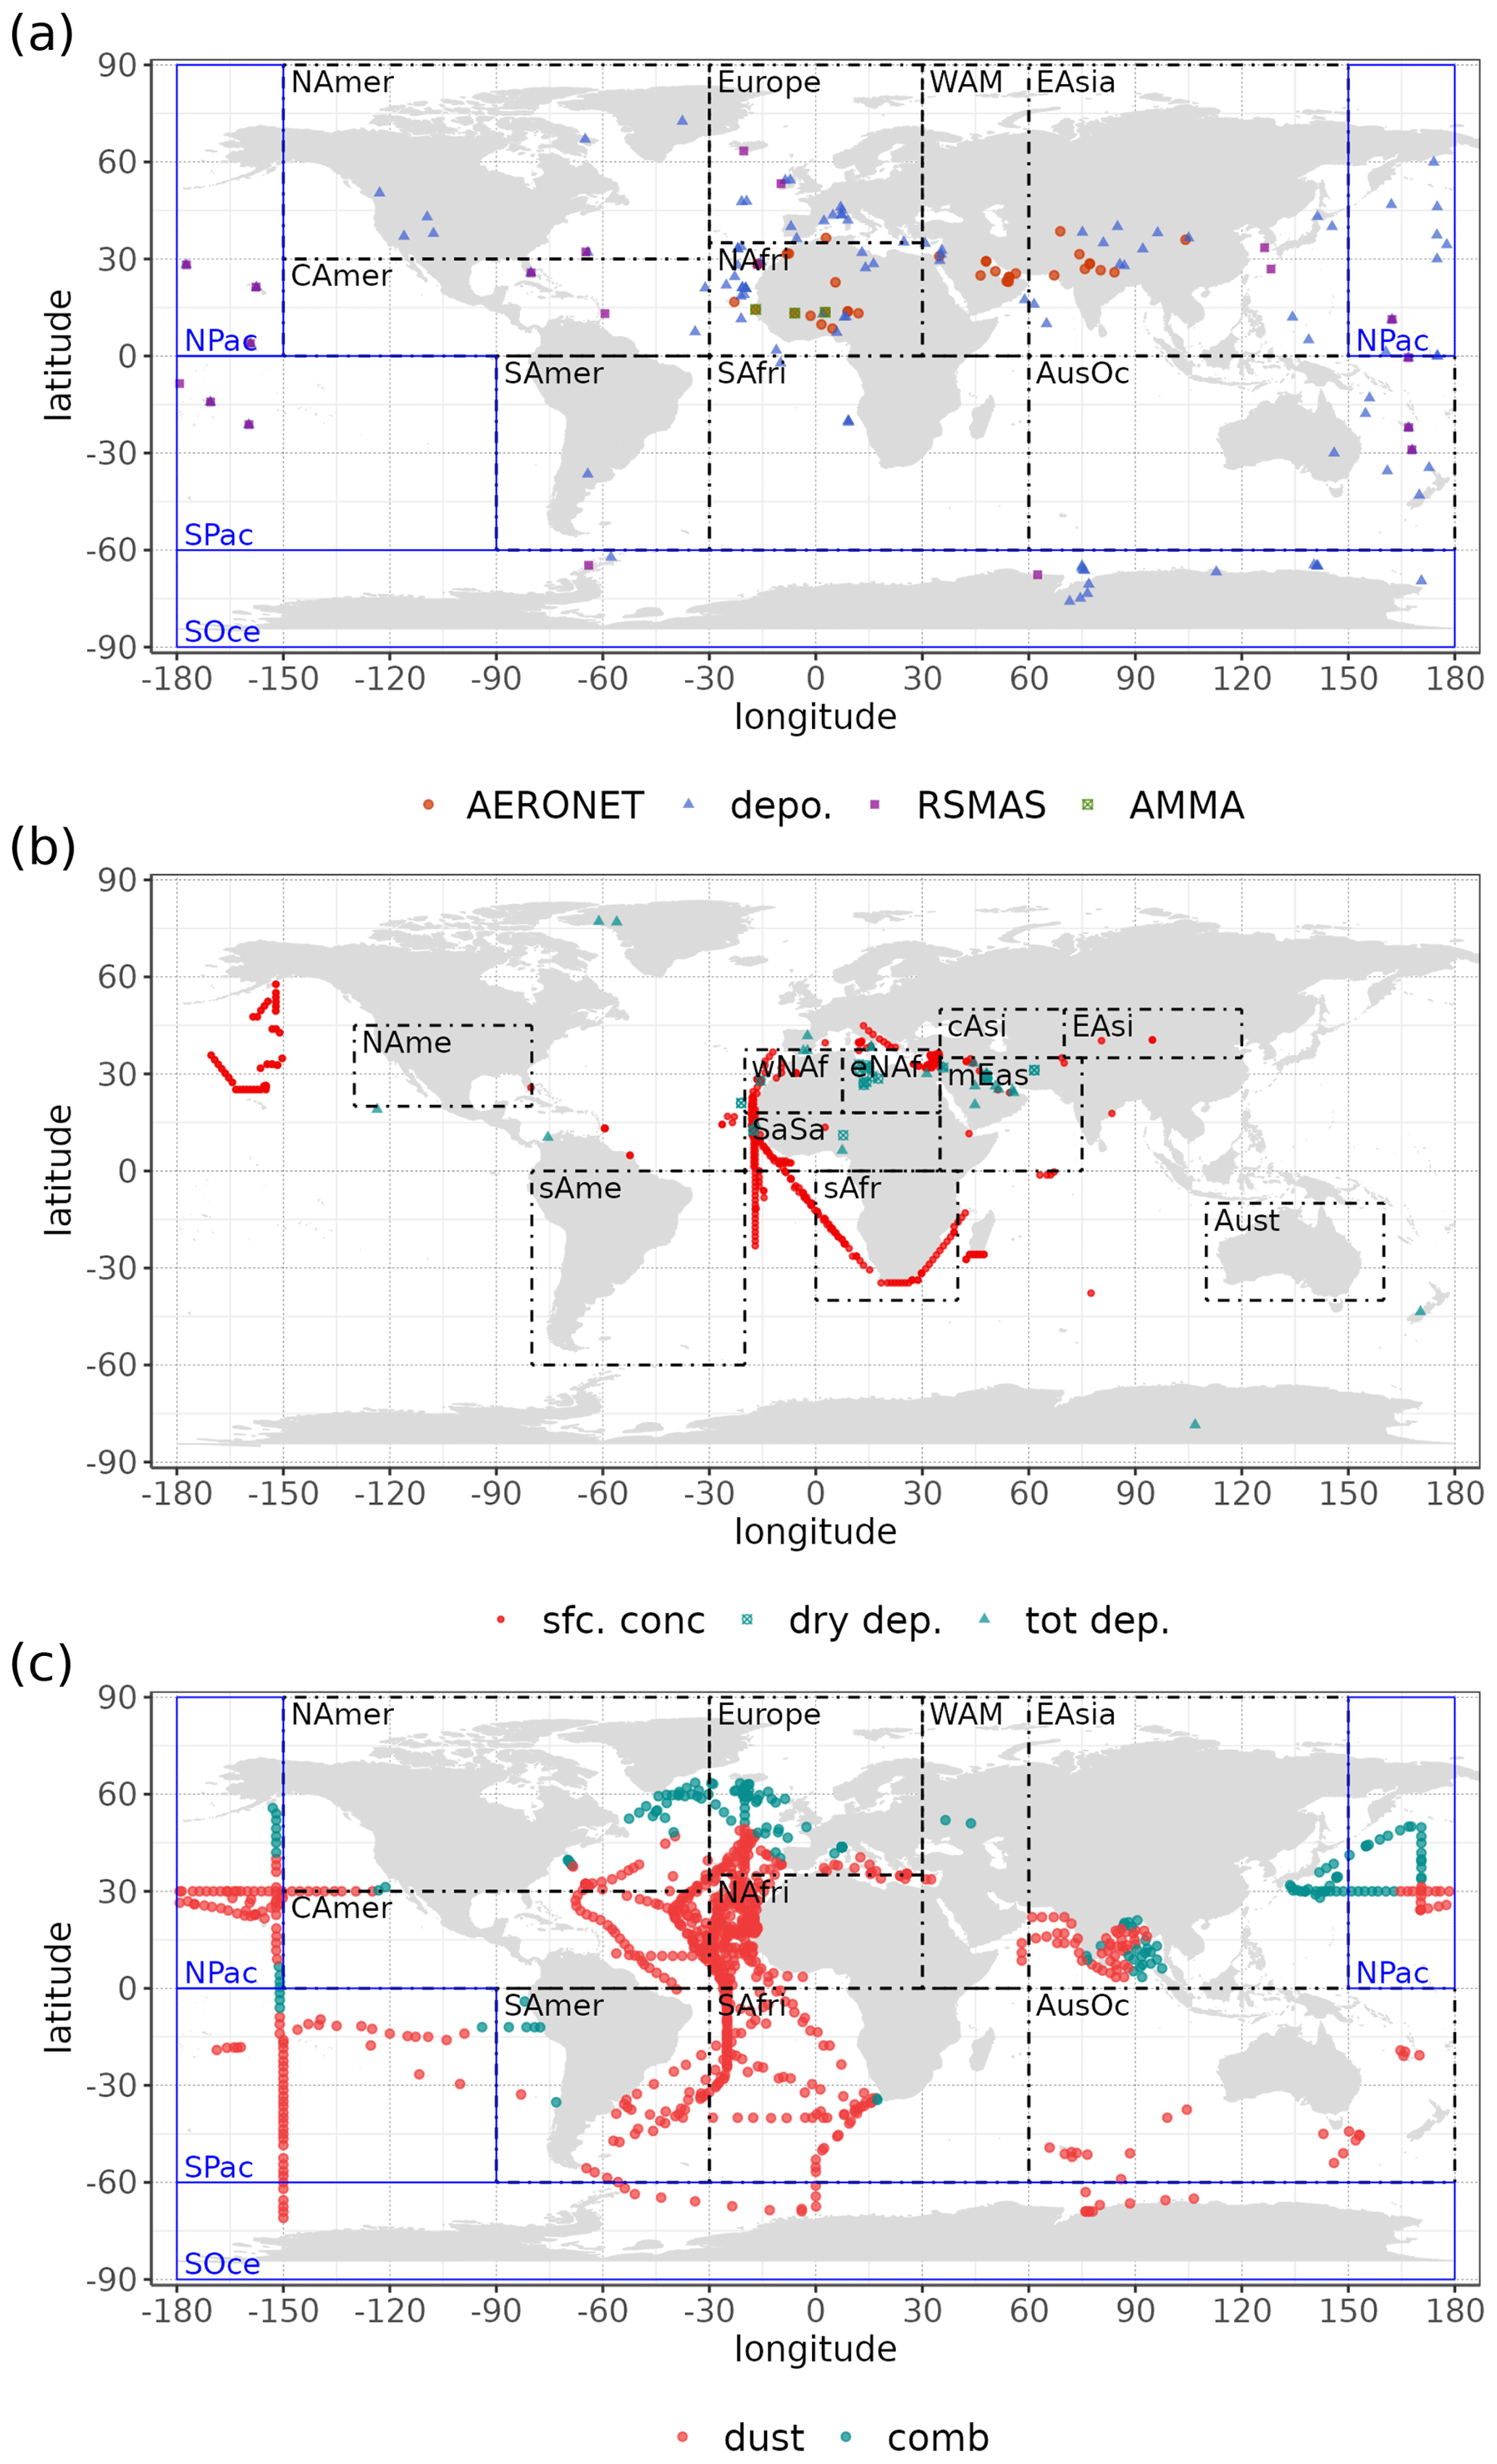
Figure 2(a) Locations of the surface concentration (RSMAS, AMMA) and deposition (depo.) observations used for the dust evaluation and domains defined to compute regional statistics (in boxes). The 35 AERONET sites resulting from the filtering for dust events described in Sect. 4.3 are represented by red dots on the map. (b) Locations of the samples of mass mineral fractions in dust surface concentration (sfc. conc.) and dry (dry dep.) and total (tot. dep.) deposition used in this study. Source regions, as defined by Kok et al. (2021), considered for the regional analyses are depicted with boxes. (c) Locations of the total iron concentration measurements from Myriokefalitakis et al. (2018). Red dots correspond to those influenced by dust aerosols and used for evaluation purposes in this study.
4.2 Mineral observations and the evaluation method
We conduct a direct evaluation of the modeled mineral fractions, in both surface concentrations and deposition fluxes, following Perlwitz et al. (2015b). That work compiles observed mineral mass fractions (wt %) in surface concentration along with total and dry deposition samples at 154 locations (Fig. 2b), including data from single points and average information along ship tracks. It details the number of samples taken, the standard deviation (when available), the sampling period, the size range, the location and the reference to the original work from which the data are obtained. For ship campaigns, information about the ship initial and final locations is usually provided.
Most of the observational studies considered in Perlwitz et al. (2015b) tailor specifically dust, by methodology or by selection of dusty episodes. However, some of the observations may be affected by anthropogenic mineral contributions. In particular, anthropogenic combustion processes and metal industry activities have been identified as sources of iron oxides, phyllosilicates or quartz particles (e.g., Querol et al., 1996; Rathod et al., 2020; Weinbruch et al., 2022). Our model estimates exclusively the mineralogy from natural dust sources, and therefore we filter the observations in Perlwitz et al. (2015b) to remove those locations that could have an anthropogenic influence. To that end, we consider a multiannual experiment conducted with the Community Atmosphere Model version 5 at the global scale (Hamilton et al., 2019), which accounts for mineral dust, biomass burning and anthropogenic sources of iron. We assume that mineralogy is dominated by dust in those areas where the annual mean contribution of iron from dust to the total iron concentration is 75 % or larger (see Sect. S2). It has to be noted that the evaluation metrics using this filter are very close to those obtained using the full dataset (not shown), which suggests a small contribution of the anthropogenic sources in the studies selected by Perlwitz et al. (2015b).
The sampling periods range from specific days to multiannual periods and span the late 1960s to the 2000s. We consider the interannual variability of the mineral fractions to be relatively low (Perlwitz et al., 2015b). We assume that close to dust sources the mineralogy is mainly affected by the soil composition, which does not undergo substantial changes in the considered time period. During transport the mixing of dust plumes of different origins is expected to homogenize the dust composition, thus buffering the effect of an interannual change in each source strength. In summary, the observed values are compared with the modeled multiannual means, even if they correspond to different time periods. The sampling time and number of samples allow the derivation of an uncertainty range for the observed values, such that they can be compared with monthly modeled means (Perlwitz et al., 2015b). As the observations usually contain minerals that are not represented in this modeling study, we create a correspondence between the minerals reported and those modeled here and recalculate the mass fractions and standard deviations of the observational data accordingly (see Table S1 and Sect. S2 for details).
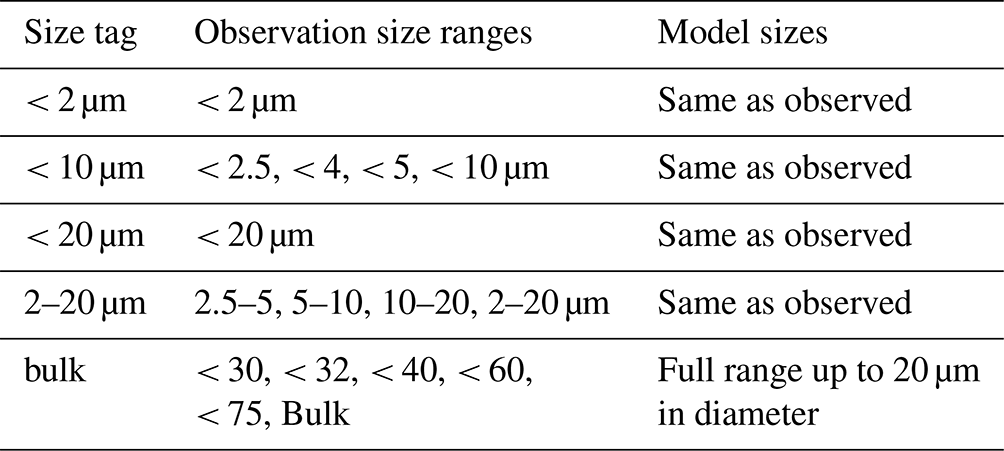
The size distribution of the modeled minerals uses eight bins with diameters from 0.2 to 20 µm. Observations are provided in different size ranges, including fractions lower than 2, 2.5, 4, 5, 10, 20, 30, 32, 40, 60 and 75 µm in diameter, diameters between 1–2.5, 2.5–5, 2–20, 10–20, 20–32, 2–50 and 20–60 µm, and bulk measurements. The observations with sizes entirely above our modeled size ranges (e.g., those reporting sizes from 20–40 or 20–60 µm) are excluded from our evaluation. We keep those observations that span larger diameters than the 20 µm modeled limit but that overlap with the modeled size ranges (e.g., those reported as < 32 or < 60 µm). For those observations below 20 µm, we consider the specific observed size range and compute the equivalent model value. For the rest we compare the full model range, knowing that the size difference will introduce a bias into our comparison.
To summarize the evaluation, we aggregate the size ranges into five categories (Table 3): (1) below 2 µm; (2) between 2 and 20 µm, to assess whether there is a difference in model performance for clay and silt size ranges; (3) below 10 µm (to consider a size cut usually applied in air quality measurements); (4) below 20 µm (to assess the full model size range); and (5) the bulk size (to include the observations that extend outside the model range).
Table 3Size classes considered for the evaluation of the mineral fractions and the corresponding size ranges.
We collocate temporally and spatially the modeled and observed values. The temporal match is done on a monthly basis (e.g., if an observation reports values for January, the model corresponding value will be calculated as the mean of the January values for the 2006–2010 period). The spatial collocation is done by taking the nearest model cell to the location of the observation for fixed site measurements and as an average of the cells nearest the trajectory for the ship measurements.
In summary, the evaluation is performed by collocating model and observations in terms of composition (we assess ratios only of minerals that are both modeled and observed), size, location and time (on a climatological monthly basis). From these pairs of observed and modeled values we compute the nMB, nRMSE and r. On many occasions, the number of points available for our analyses is low, and therefore we calculate the uncertainty ranges of these metrics at a 95 % level, with the objective of more robustly assessing the significance of the differences among our experiment performance (see Sect. S1 for details).
4.3 Diagnostic and evaluation of the minerals' single-scattering albedo
One of the key aspects that motivates the characterization of minerals within ESMs is the potential effect they have on dust optical properties, and particularly the dust absorption at ultraviolet (UV) and visible (VIS) wavelengths. For that reason, we calculate offline the single-scattering albedo (SSA) in the UV-VIS band (i.e., from 300 to 770 nm) that would result from the modeled mineral mass concentrations in our two standard scenarios (C1999, J2014), and we compare them with an AERONET-derived climatology (2006–2010) of dust SSA in the same UV-VIS band (band averages are computed using optical depth and solar flux as weighting functions).
The calculation of the mineral-dependent SSA in this contribution follows Obiso et al. (2023a) and considers three externally mixed mineral components: (1) externally mixed iron oxides, (2) all minerals other than iron oxides (host minerals) and (3) iron oxides internally mixed with host minerals (accretions). Each of these mineral components has a different refractive index, which we calculate by combining recent measurements of dust aerosols from natural parent soils (Di Biagio et al., 2017, 2019) and a collection of refractive indices for individual minerals from Scanza et al. (2015). We estimate the refractive index of the mixture of host minerals by computing the volume-weighted mean of indices from Scanza et al. (2015) based on the fractions of these minerals measured in soil samples by Di Biagio et al. (2017, 2019) (median among samples). For accretions, we take as a reference the 5 % by mass in the mixture that is imposed at emission to estimate the amount of internally mixed iron oxides (following Perlwitz et al., 2015b), and we directly use the refractive index retrieved by Di Biagio et al. (2019) for soil samples with the closest mass fractions of iron oxides (interpolation between 4.8 % and 5.8 %). Finally, for externally mixed iron oxides, we invert the empirical relationship (at different wavelengths) of the imaginary index versus the soil content of iron oxides derived by Di Biagio et al. (2019) by fitting a Maxwell Garnett model to the observations (i.e., we estimate the imaginary index of iron oxides that would explain the observed relationship, using a value derived from Longtin et al. (1988) as the real index). The resulting refractive indices for these species are reported in Sect. S3.
To further assess the mineralogy effect on the SW absorption, we also estimate the SSA that would result from applying dust-homogeneous optical properties in the UV-VIS band that are calculated using a globally uniform refractive index based on Sinyuk et al. (2003). In all these estimates, we use mass densities reported in Table 1 (averaging the values for iron oxides and host minerals in the calculation with three components) and consider dust particles to be spherical.
The AERONET version-3 level-2.0 Almucantar retrievals (Giles et al., 2019; Sinyuk et al., 2020) are filtered following the methodology in Obiso et al. (2023a) that retains events dominated by dust, attempting to filter out the AERONET scenes contaminated by other absorbing aerosols (e.g., absorbing carbonaceous species). The hourly retrievals from AERONET are considered to represent dust when the fine-volume fraction is small (below 15 %), the SSA increases from 440 to 675 nm (a feature that distinguishes dust from other species; see Dubovik et al., 2002), and the mean of the imaginary indices at red and infrared wavelengths (675, 870 and 1020 nm) is lower than 0.0042 (as higher values would indicate the presence of absorbing black and brown carbon, following Schuster et al., 2016). These criteria are applied to the available AERONET data for the 2006–2010 period, and monthly means over that period are computed only when 30 or more retrievals are available. Model monthly SSAs are then interpolated at the selected AERONET stations (Fig. 2a) and masked for unavailable months for the comparison with AERONET.
4.4 Total iron from dust and evaluation
Atmospheric deposition of soluble iron constitutes a key input of micronutrients to certain open-ocean regions, where it can control primary productivity and thus carbon uptake (Jickells, 2005). Dust sources largely contribute to atmospheric iron emissions (e.g., Mahowald et al., 2009). However, the solubility of this emitted iron at the origin is low, and it is believed to increase through atmospheric processing. Both the amount of iron associated with dust and its susceptibility to becoming soluble in the atmosphere depend on mineralogy (Journet et al., 2008; Myriokefalitakis et al., 2018, 2022; Bergas-Massó et al., 2023). In Sect. 6, we present an offline estimate of the total iron as derived from the mineralogy simulated in our experiments considering the iron content per mineral specified in Table 1. We assess the resulting surface concentration of total iron against climatological observations provided in Myriokefalitakis et al. (2018), filtered to avoid large contributions of combustion aerosols (of either anthropogenic or biomass burning origin) and following the same criteria as for the mineralogy observations (see Sect. 4.2 and Fig. 1c). We also provide a proxy for the iron fractional solubility based on its mineralogical origin.
5.1 Evaluation of the dust cycle
With the current setup, and in line with Klose et al. (2021), MONARCH produces a total annual dust emission of 3482.5 ± 105.0 Tg (mean ± standard deviation of annual values over the 2006–2010 period) for particle diameters below 20 µm. The annual mean atmospheric dust burden is 28.4 ± 1.1 Tg, and dry deposition and wet deposition remove 3394.7 ± 104.1 Tg annually from the atmosphere, with the former being the primary removal pathway (2019.4 ± 79.3 Tg yr−1 compared to 1375.3 ± 26.6 Tg yr−1). The annual average lifetime of dust in our experiments is then 3.05 ± 0.04 d. These values fall within the range of recent multi-model estimates constrained by observations (Kok et al., 2021). Our current implementation accounts for the effect of the density and size distribution of the different minerals in the transport and deposition processes; however, these alone do not substantially change the dust cycle (when we sum the mineral mass as compared to the compositionally homogeneous dust tracer).
Major dust sources are represented over the Northern Hemisphere desert belt (Fig. 3a). As a result, high annual mean surface concentrations are modeled over the northern African and East Asian regions (Fig. 3b), which present a relatively fair agreement with observations (model estimates fall within the range of 2 times the observational value for most of the sites in these regions; see Fig. 4a). The Atlantic transport is well captured by the model and leads to annual mean surface concentrations over Central America close to the observations. This is also the case for the modeled surface dust concentration over the North Pacific (Fig. 4a). Dust in the Southern Hemisphere is primarily emitted from South American, Australian and to a lesser extent southern African sources (Fig. 3a). The model tends to misrepresent the observed dust surface concentration at Southern Hemisphere locations (e.g., over Australian or South Pacific sites, modeled values fall only within 1 order of magnitude of the observations), with an overall underestimation that seems particularly relevant for remote stations (e.g., those over the Southern Ocean). Other global models (Albani et al., 2014; Checa-Garcia et al., 2021) show similar or worse performances in representing the dust surface concentration in the Southern Ocean, with deviations from the observations of 1 order of magnitude. Globally, MONARCH slightly overestimates the surface concentration (nMB of 12.5 %). The deviation from observations (nRMSE of 116.0 %) is largely influenced by the aforementioned poor representation of the Southern Hemisphere surface concentration levels. In spite of these biases, MONARCH reproduces the dust surface concentration spatial variations as described by the observations, with a correlation towards worldwide observations of 0.95 when the 23 measurement locations are considered (Fig. 4a; Table S3 summarizes the evaluation statistics).
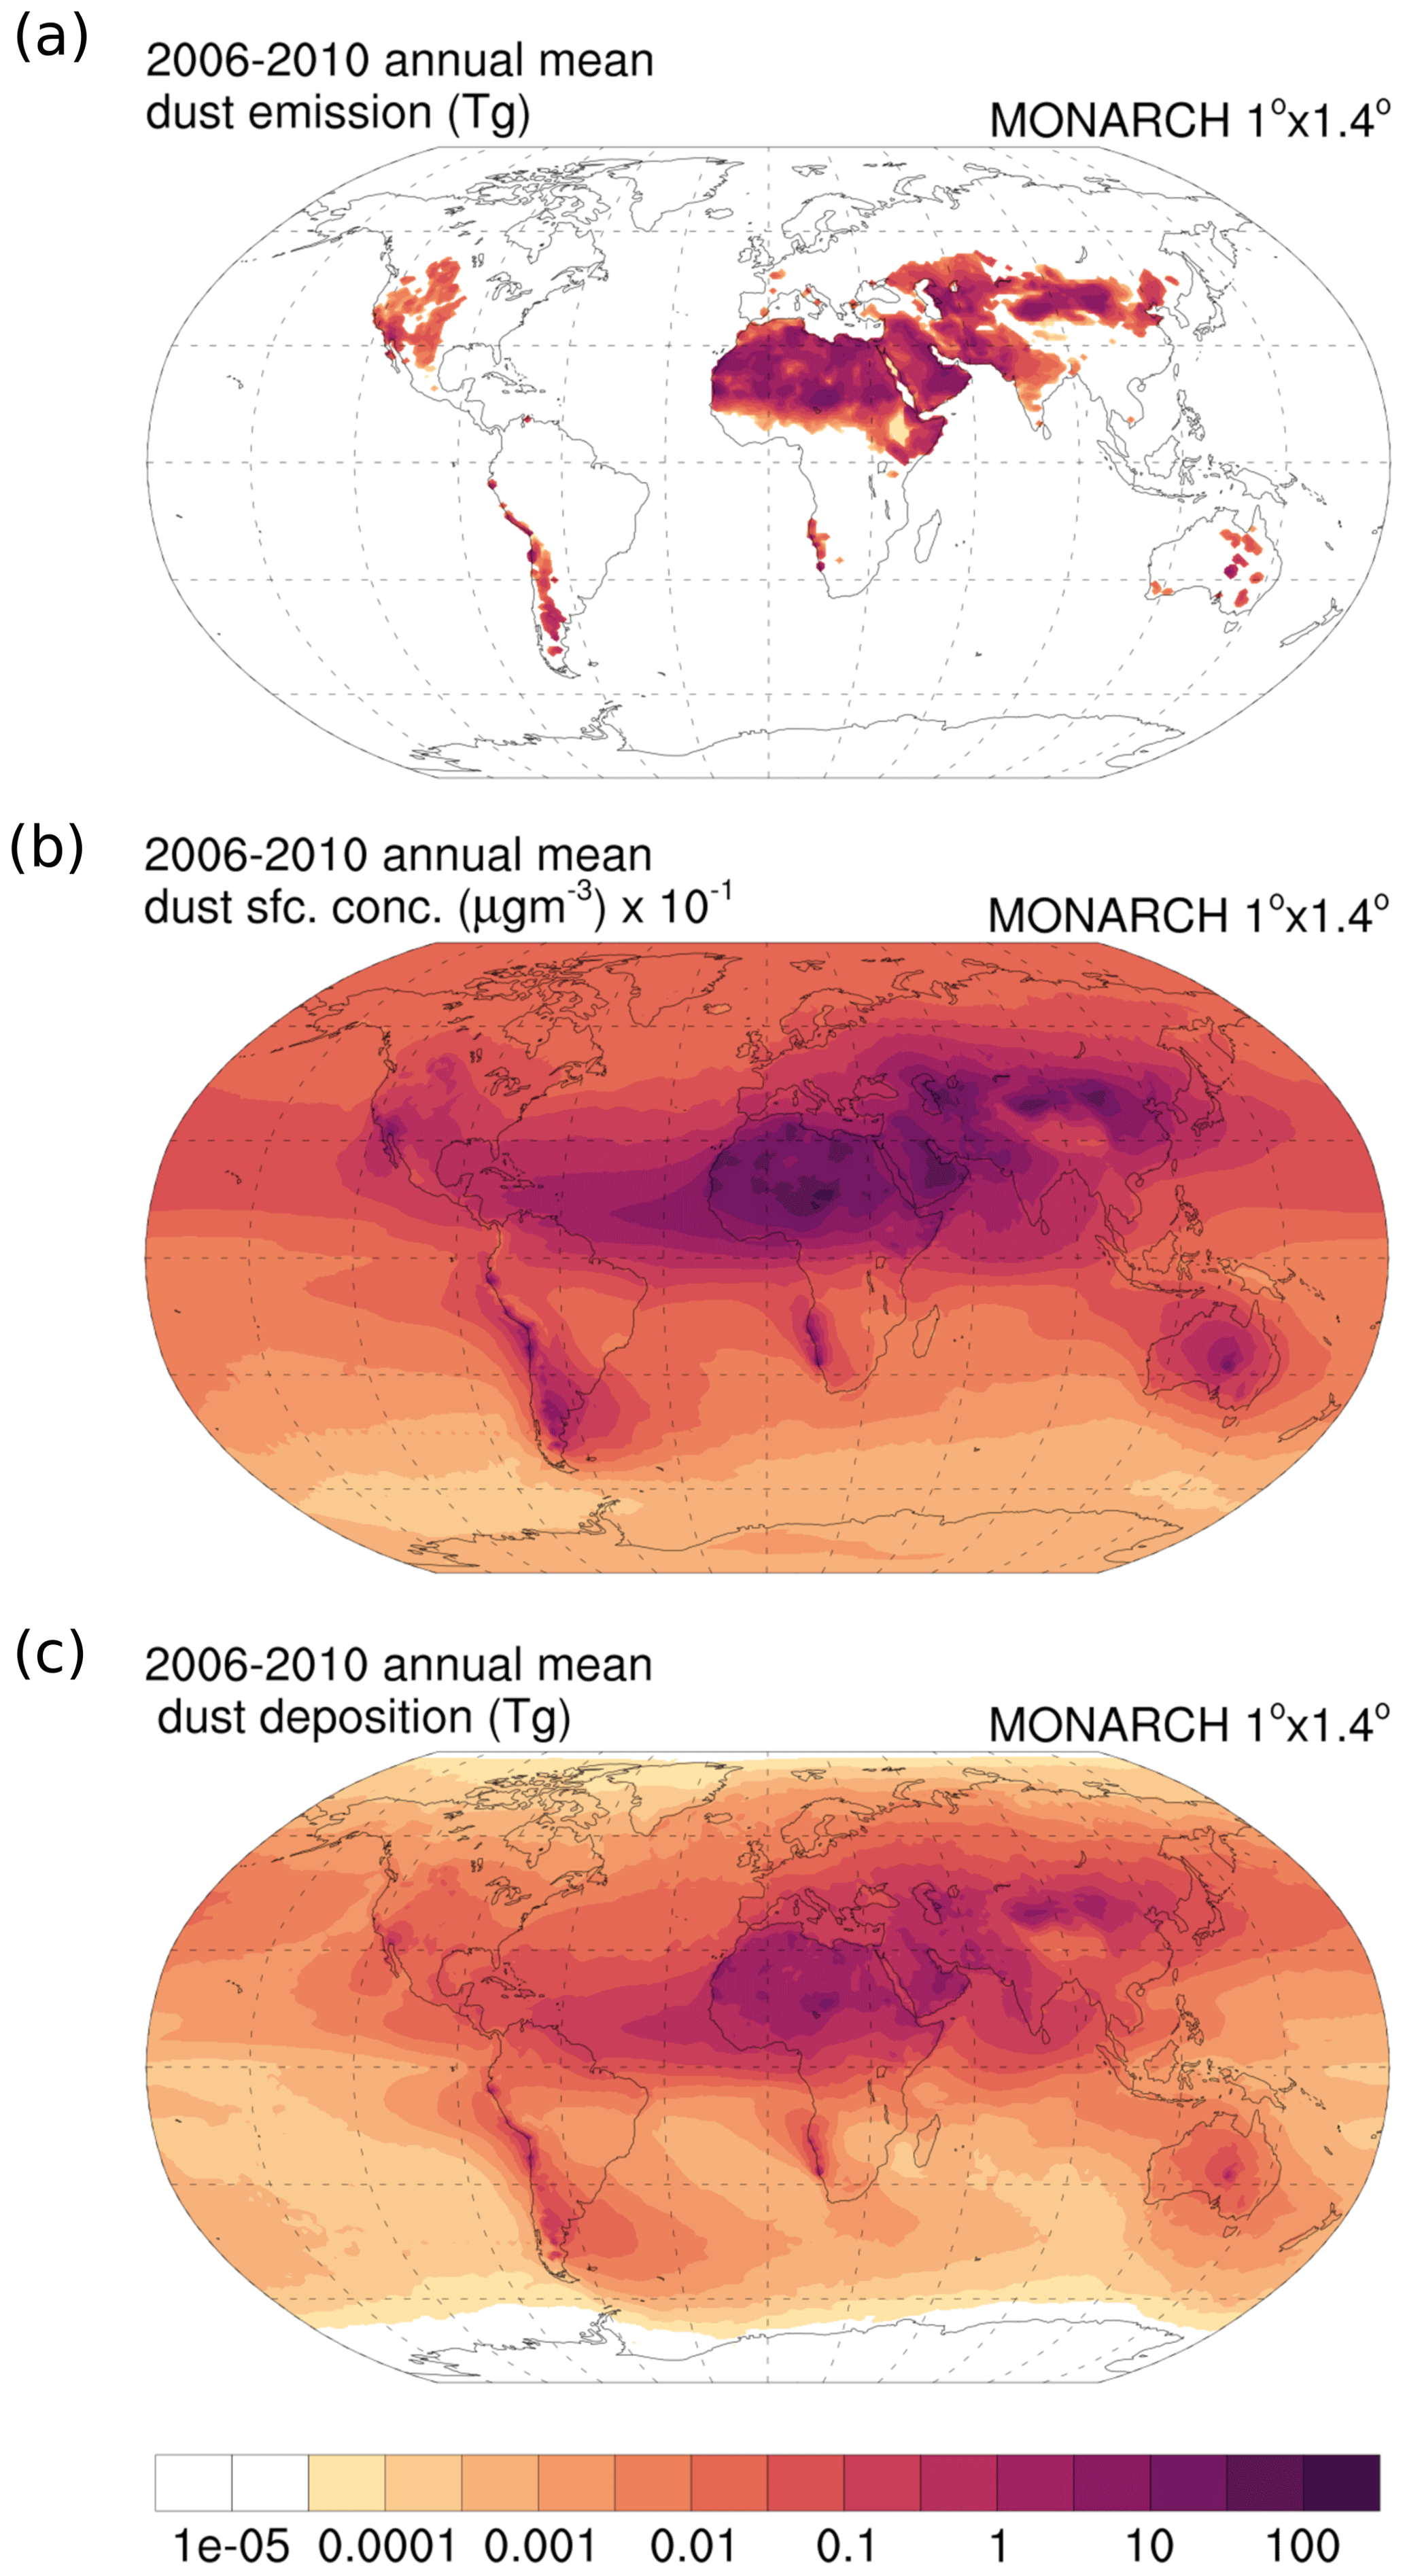
Figure 3MONARCH-modeled homogeneous (a) dust annual mean emission (Tg), (b) surface concentration (µg m−3) × 10−1 and (c) total deposition (Tg), averaged over 2006–2010.
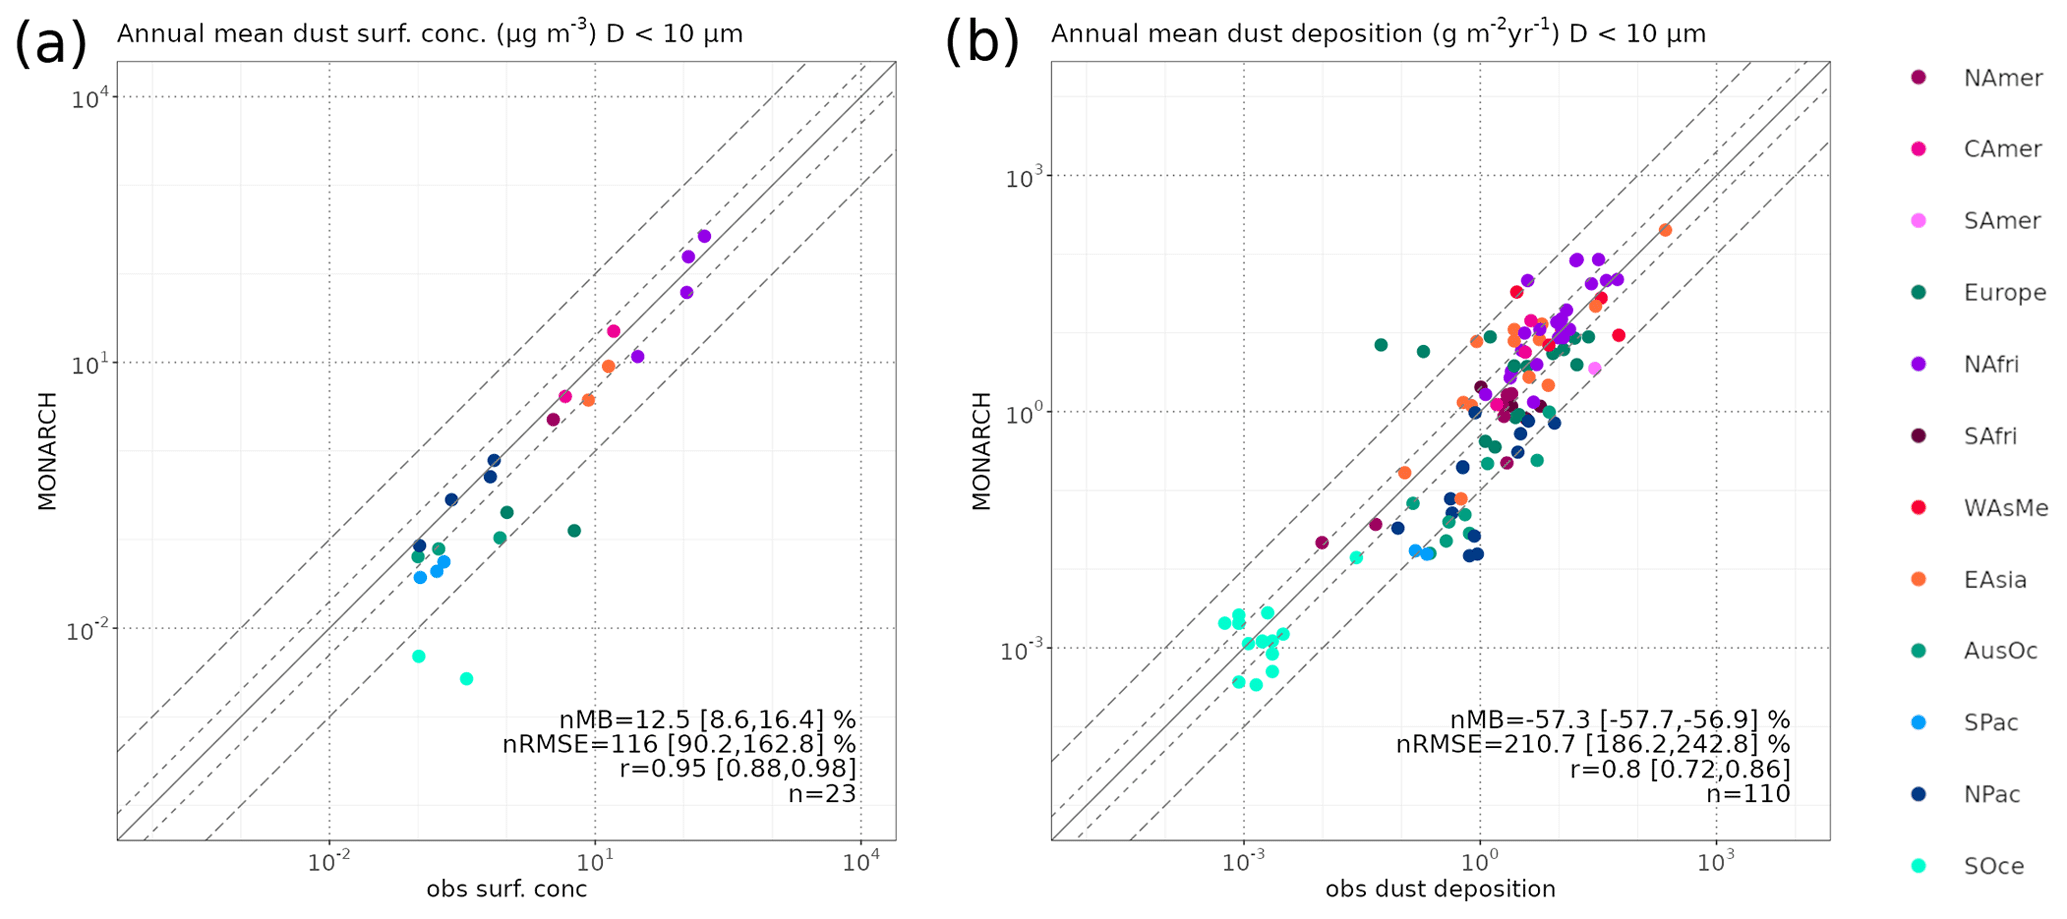
Figure 4MONARCH-modeled annual mean (a) dust surface concentration (µg m−3) and (b) total deposition flux (g m−2 y−1) compared to observations from the RSMAS and INDAAF databases (a) and the compilation of Albani et al. (2014) (b), where n is the number of measurements, nRMSE the normalized root mean square error, nMB the normalized mean bias, and r the correlation over all the points. The ranges for nMB, nRMSE and r correspond to the 95 % confidence level (see Sect. S1 for details). Regions are depicted in Fig. 1a. Dashed lines represent differences of 2 times and 1 order of magnitude.
The dust deposition fluxes (Fig. 3c) are overall underestimated by the model, and errors are larger than for the surface concentration field (nMB = −57.3 % and nRMSE = 210.7 % as an average over all the measurement points; Fig. 4b; Table S3). Most of the modeled deposition fluxes fall within 1 order of magnitude of the observations, although the model behavior is particularly poor in some locations of the North Pacific, South Pacific and Australian regions, with underestimations beyond that (Fig. 4b). MONARCH estimates are the closest to the observations for some points over sources (e.g., some locations over northern Africa) but also some over remote regions (e.g., the Southern Ocean), which points to multiple causes of the differences with respect to observations. Over the sources, gravitational settling dominates the deposition flux, and the fraction of coarse particles present plays a relevant role in the deposited mass. In transport or remote regions, the finest dust fractions dominate, and removal is controlled primarily by wet deposition processes (Huneeus et al., 2011; Kok et al., 2021). The geographical variability of the deposition is acceptably captured by the model, showing a correlation of 0.80 over the 110 measurements considered. Overall, MONARCH shows similar skills in representing dust deposition than other global atmospheric models (Huneeus et al., 2011; Albani et al., 2014; Checa-Garcia et al., 2021).
5.2 Modeled mineralogy at emission
The choice of the soil composition map and the approach used to represent it in the model have a direct influence on the emitted mineral fractions (Fig. 5, Table 4).
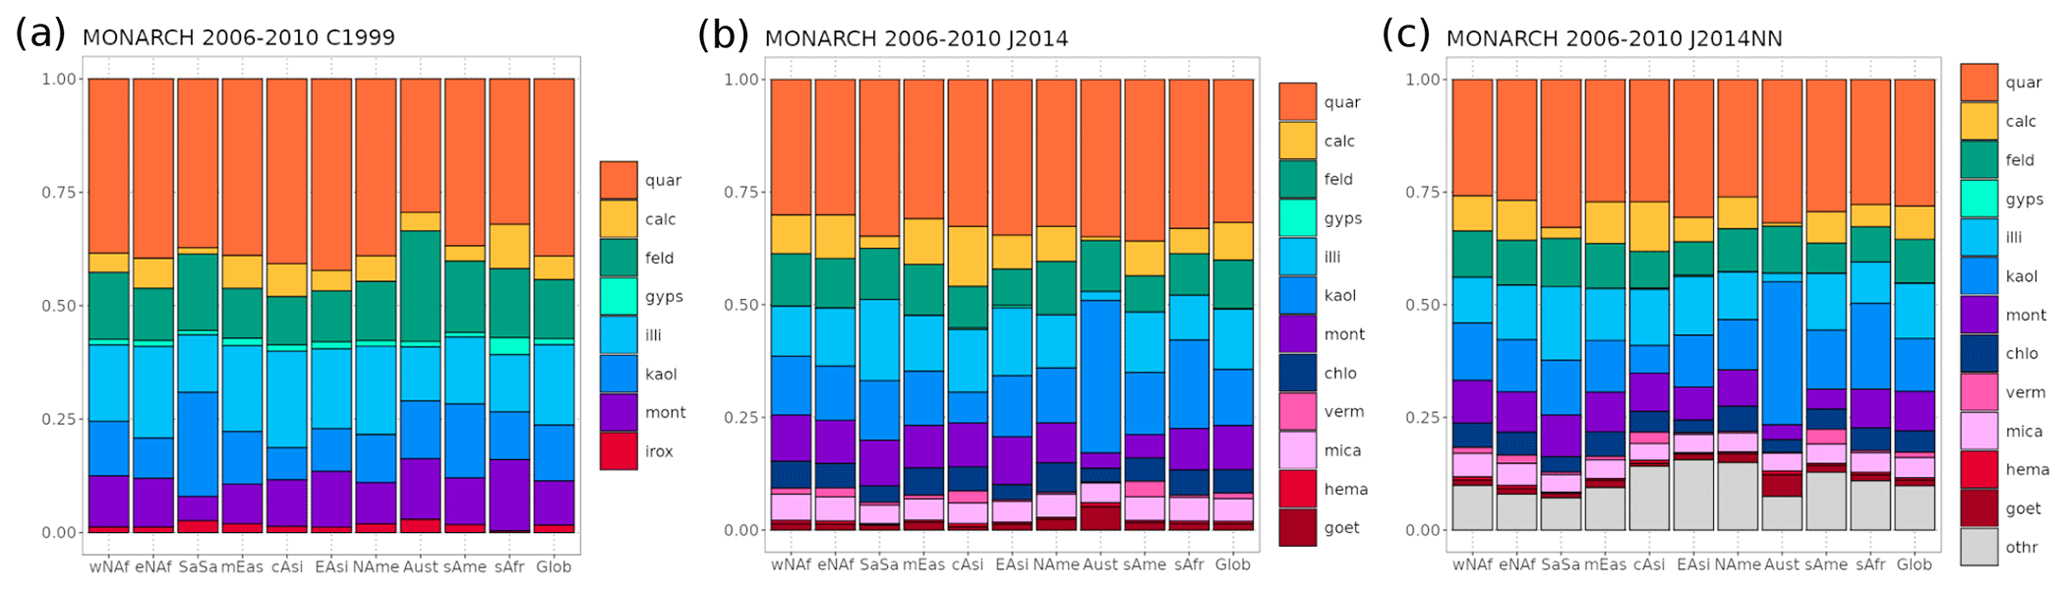
Figure 5Mineral mass fractions at emission per region (from left to right, wNAf: western North Africa; eNAf: eastern North Africa; SaSa: the southern Sahara and Sahel; mEas: the Middle East and the Horn of Africa; cAs: central Asia; EAsi: East Asia; NAme: North America; Aust: Australia; SAme: South America; sAfr: southern Africa, and Glob: global; see Fig. 2b) estimated by MONARCH C1999 (a), J2014 (b) and J2014NN (c) annual means over 2006–2010. Quar: quartz; calc: calcite; feld: feldspar; gyps: gypsum; illi: illite; kaol: kaolinite; smec: smectite; irox: iron oxide; chlo: chlorite; verm: vermiculite; mica: mica; hema: hematite; goet: goethite; othr: other.
Within our modeled size range (up to 20 µm in diameter), quartz is the most abundant mineral at emission, regardless of the soil mineralogy selected. On an annual basis, J2014 (J2014NN) yields a lower global fractional mass for quartz over sources other than C1999, but both experiments reflect this mineral's ubiquity, accounting for 39.0 % and 31.7 % (28.1 %) of the global emission budget in C1999 and J2014 (J2014NN), respectively. Regionally, the quartz contribution can be higher, being up to 42.2 % of the total annual emitted dust over East Asian sources in the C1999 experiment.
Phyllosilicate minerals, when added together (illite, kaolinite and smectite in C1999 plus chlorite, vermiculite and mica in J2014 and J2014NN), are also substantial over sources and make up a significant fraction of the emitted dust (39.8 % and 47.1 % (43.1 %) in C1999 and J2014 (J2014NN) at the global scale, respectively). C1999 reflects a higher kaolinite-to-illite ratio over the Sahel than over northern African regions, likely associated with the more weathered soils (Scheuvens et al., 2013). However, this signature does not appear in J2014 (J2014NN). The largest differences between C1999 and J2014 (J2014NN) occur over Australian sources: in J2014 and J2014NN, kaolinite dominates compared to illite and smectite, while in C1999 higher fractions of smectite are present, balanced with kaolinite and illite. The impact of adding vermiculite, chlorite and mica in J2014 (J2014NN) is relatively low, as their contribution to the total emitted dust is estimated at 11.4 % (10.7 %) globally.
Overall, C1999 emits a higher mass fraction of feldspars than J2014 (J2014NN), 13.0 %, compared to 10.8 % (9.7 %) globally, and differences are particularly large for specific sources, such as Australia, where the C1999-emitted feldspar fraction is double that in J2014 (J2014NN), 24.4 %, compared to 11.3 % (10.7 %).
Calcite is less abundant in C1999 emission, 5.2 %, than in J2014 (J2014NN), 8.4 % (7.4 %), although both experiments share regional variability. The large carbonate fraction associated with northern African soils and attributed to the underlying geology (Formenti et al., 2011; Scheuvens et al., 2013) is reflected in both C1999 and J2014 (J2014NN), with higher calcite fractions over northwestern and northeastern Africa than in the Sahel area. Also, in both maps, Middle Eastern and Central Asian sources are the richest in calcite. Over the Southern Hemisphere sources (e.g., South American or southern African sources), there is less agreement between experiments.
The largest differences in emitted fractions at the global scale are for iron oxides, where C1999 originally considers only hematite, yielding 1.6 % of the total emitted dust mass, and where J2014 (J2014NN) augments hematite with goethite, with 0.6 % (0.5 %) and 1.4 % (1.3 %) contributions to the total emitted dust, respectively. Due to the high sensitivity of dust radiation absorption to the abundance of iron oxides, these relatively small differences at emission have a relevant impact on the estimates of dust optical properties, as will be discussed in Sect. 6. Regionally, C1999 produces a higher emitted fraction of iron oxides over the Sahel region than in northern areas of northern Africa. In contrast, J2014 (J2014NN) yields a higher fractional emission of iron oxides over northeastern and northwestern Africa than over the Sahel area. For these relevant dust sources, the regional variability produced by C1999 may align better with observational evidence (Formenti et al., 2008, 2014). Despite the differences at global and regional scales, both experiments point to Australian sources being rich in iron oxides (either hematite in C1999 or hematite and goethite in J2014 and J2014NN) compared to other regions.
Gypsum is a minor component of the emitted dust, amounting globally to 1.4 % in C1999 and 1 order of magnitude less, 0.1 %, in J2014 (J2014NN). Note that the original Journet et al. (2014) work does not explicitly report this mineral, and its estimation comes from the data compiled in the HWSDv1.1.
Regionally, we find that, overall, C1999 shows a larger variability among sources than J2014 or J2014NN for quartz and feldspar, while the fractions of calcite, phyllosilicates and iron oxides vary more among regions in J2014 (J2014NN). In spite of the higher resolution of the original Journet et al. (2014) dataset, the variability in quartz and feldspars is masked by the effect of the multiple assumptions required to fill in the silt fraction data in soils, which on many occasions involves averaging over the composition of multiple soil units.
If we consider J2014NN, at the global scale, the total undetermined mineral fraction at emission adds up to 9.8 %, a non-negligible fraction. This assumption leads to relative differences in the emitted mineral mass that range from 3.8 % for hematite to 25.8 % for gypsum compared to J2014 (Table 4). For the Sahel, Australia or northeastern Africa, the unknown fraction is lower than at the global scale (≈ 7 % to 8 %), while in Central and East Asia or North America it is higher (≈ 14 % to 16 %). This variability among regions does not lead to substantial changes in the ratios among known minerals; i.e., if we recalculate the mineral-emitted fractions for J2014NN considering that dust is made of our identifiable minerals, the resulting mass fractions are close to those obtained from the J2014 experiment (with differences of up to 0.6 %). However, this suggests that for some regions the modeled minerals do not fully represent the dust composition.
Table 4Mineral mass fraction at emission and in the atmospheric burden and deposition at the global scale (%). Lifetime of the different minerals (d). Annual mean over 2006–2010. Quar: quartz; calc: calcite; feld: feldspar; gyps: gypsum; illi: illite; kaol: kaolinite; smec: smectite; irox: iron oxide; chlo: chlorite; verm: vermiculite; mica: mica; hema: hematite; goet: goethite; phyl: phyllosilicates; othr: other.
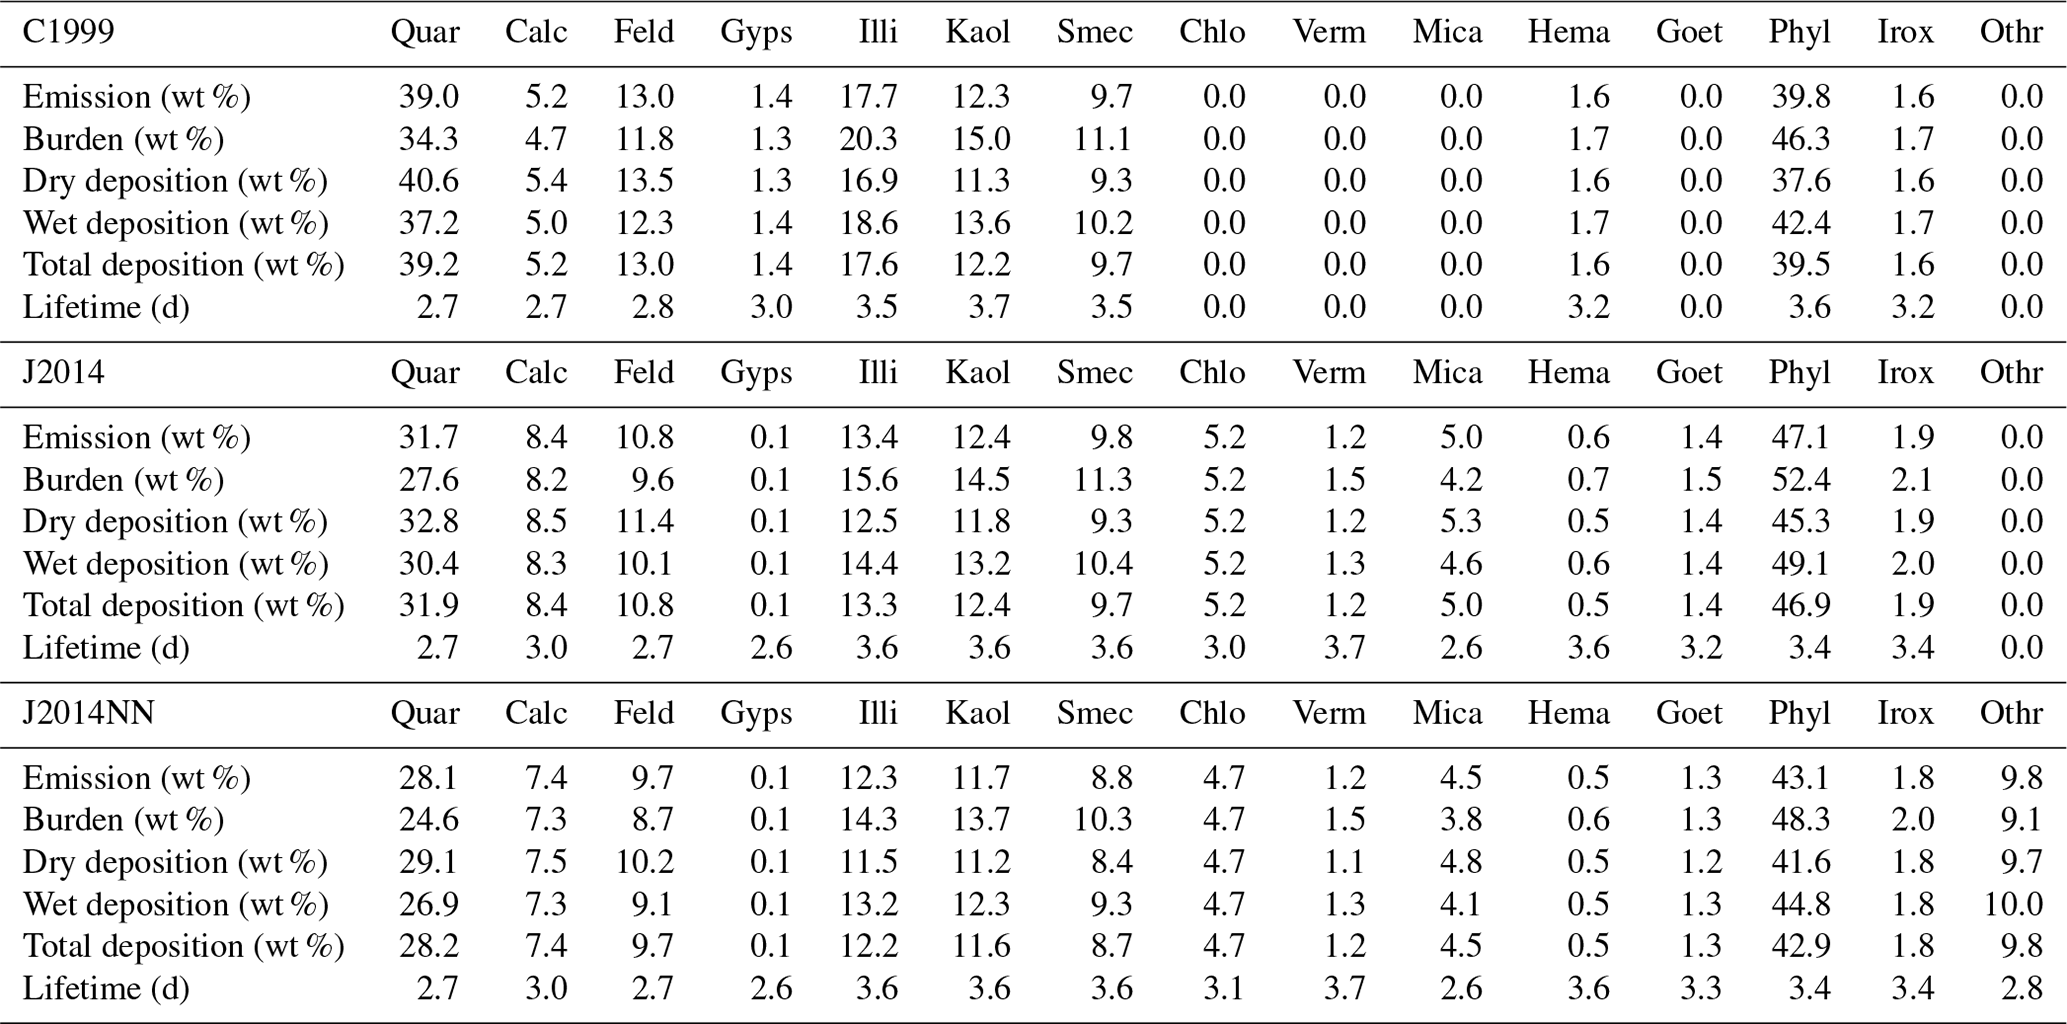
This table only shows relative fractions; the corresponding totals are provided in Table S4.
5.3 Modeled mineralogy in the atmosphere and at deposition
At the global scale, coarse minerals such as quartz, feldspars or even calcite preferentially reduce their abundance once in the atmosphere with respect to emission (Table 4). In contrast, the mass fractions of finer minerals (i.e., illite, kaolinite, smectite or vermiculite) increase compared to their emitted fractions. Both quartz and feldspar have lifetimes around 2.7 or 2.8 d depending on the experiment, which is lower than those of dust with mean composition. The atmospheric lifetimes of calcite differ between C1999, 2.7 d, and J2014 (J2014NN), 3.0 d, which is attributed to the different size distributions of this mineral in the two soil datasets. Overall, clay minerals remain longer in the atmosphere than homogeneous dust (with lifetimes above 3.0 d).
Although dry deposition is the predominant removal pathway for all minerals, the deposited mass fraction of the coarser and denser minerals (quartz, feldspar, calcite) is higher in dry deposition than in wet deposition, while finer clay minerals (illite, smectite, kaolinite, vermiculite, chlorite) that remain longer in the atmosphere increase their deposited fractions in wet deposition compared to dry deposition.
In our modeling framework, we assume that a large fraction of iron oxides at emission is internally mixed with phyllosilicates and therefore is transported and deposited as such. As a result, the lifetimes of iron oxides (C1999), hematite or goethite (J2014, J2014NN) follow the same trend as those of typical clay minerals, with slightly larger abundances in the atmosphere than at emission, a larger mass fraction at wet deposition than at dry deposition and overall longer lifetimes than homogeneous dust.
There are no substantial changes in the residence times of the modeled minerals between J2014 and J2014NN, suggesting that the normalization of the 12 minerals from J2014 does not substantially modify their size distribution and relative abundances. Given that the relative mass fractions at emission and deposition when we consider exclusively the 12 known minerals are also close, for now on we will focus our discussion on the comparison between the C1999 and J2014 experiments.
5.3.1 Phyllosilicates
The mass fraction of the modeled phyllosilicates at the surface is overall lower over source regions (ranging from ∼ 30 to ∼ 50 % in total) than in remote or transport regions, where dust is enriched in clay minerals (up to ∼ 80 %) due to the preferential deposition of coarser and denser minerals close to sources (Fig. 6).
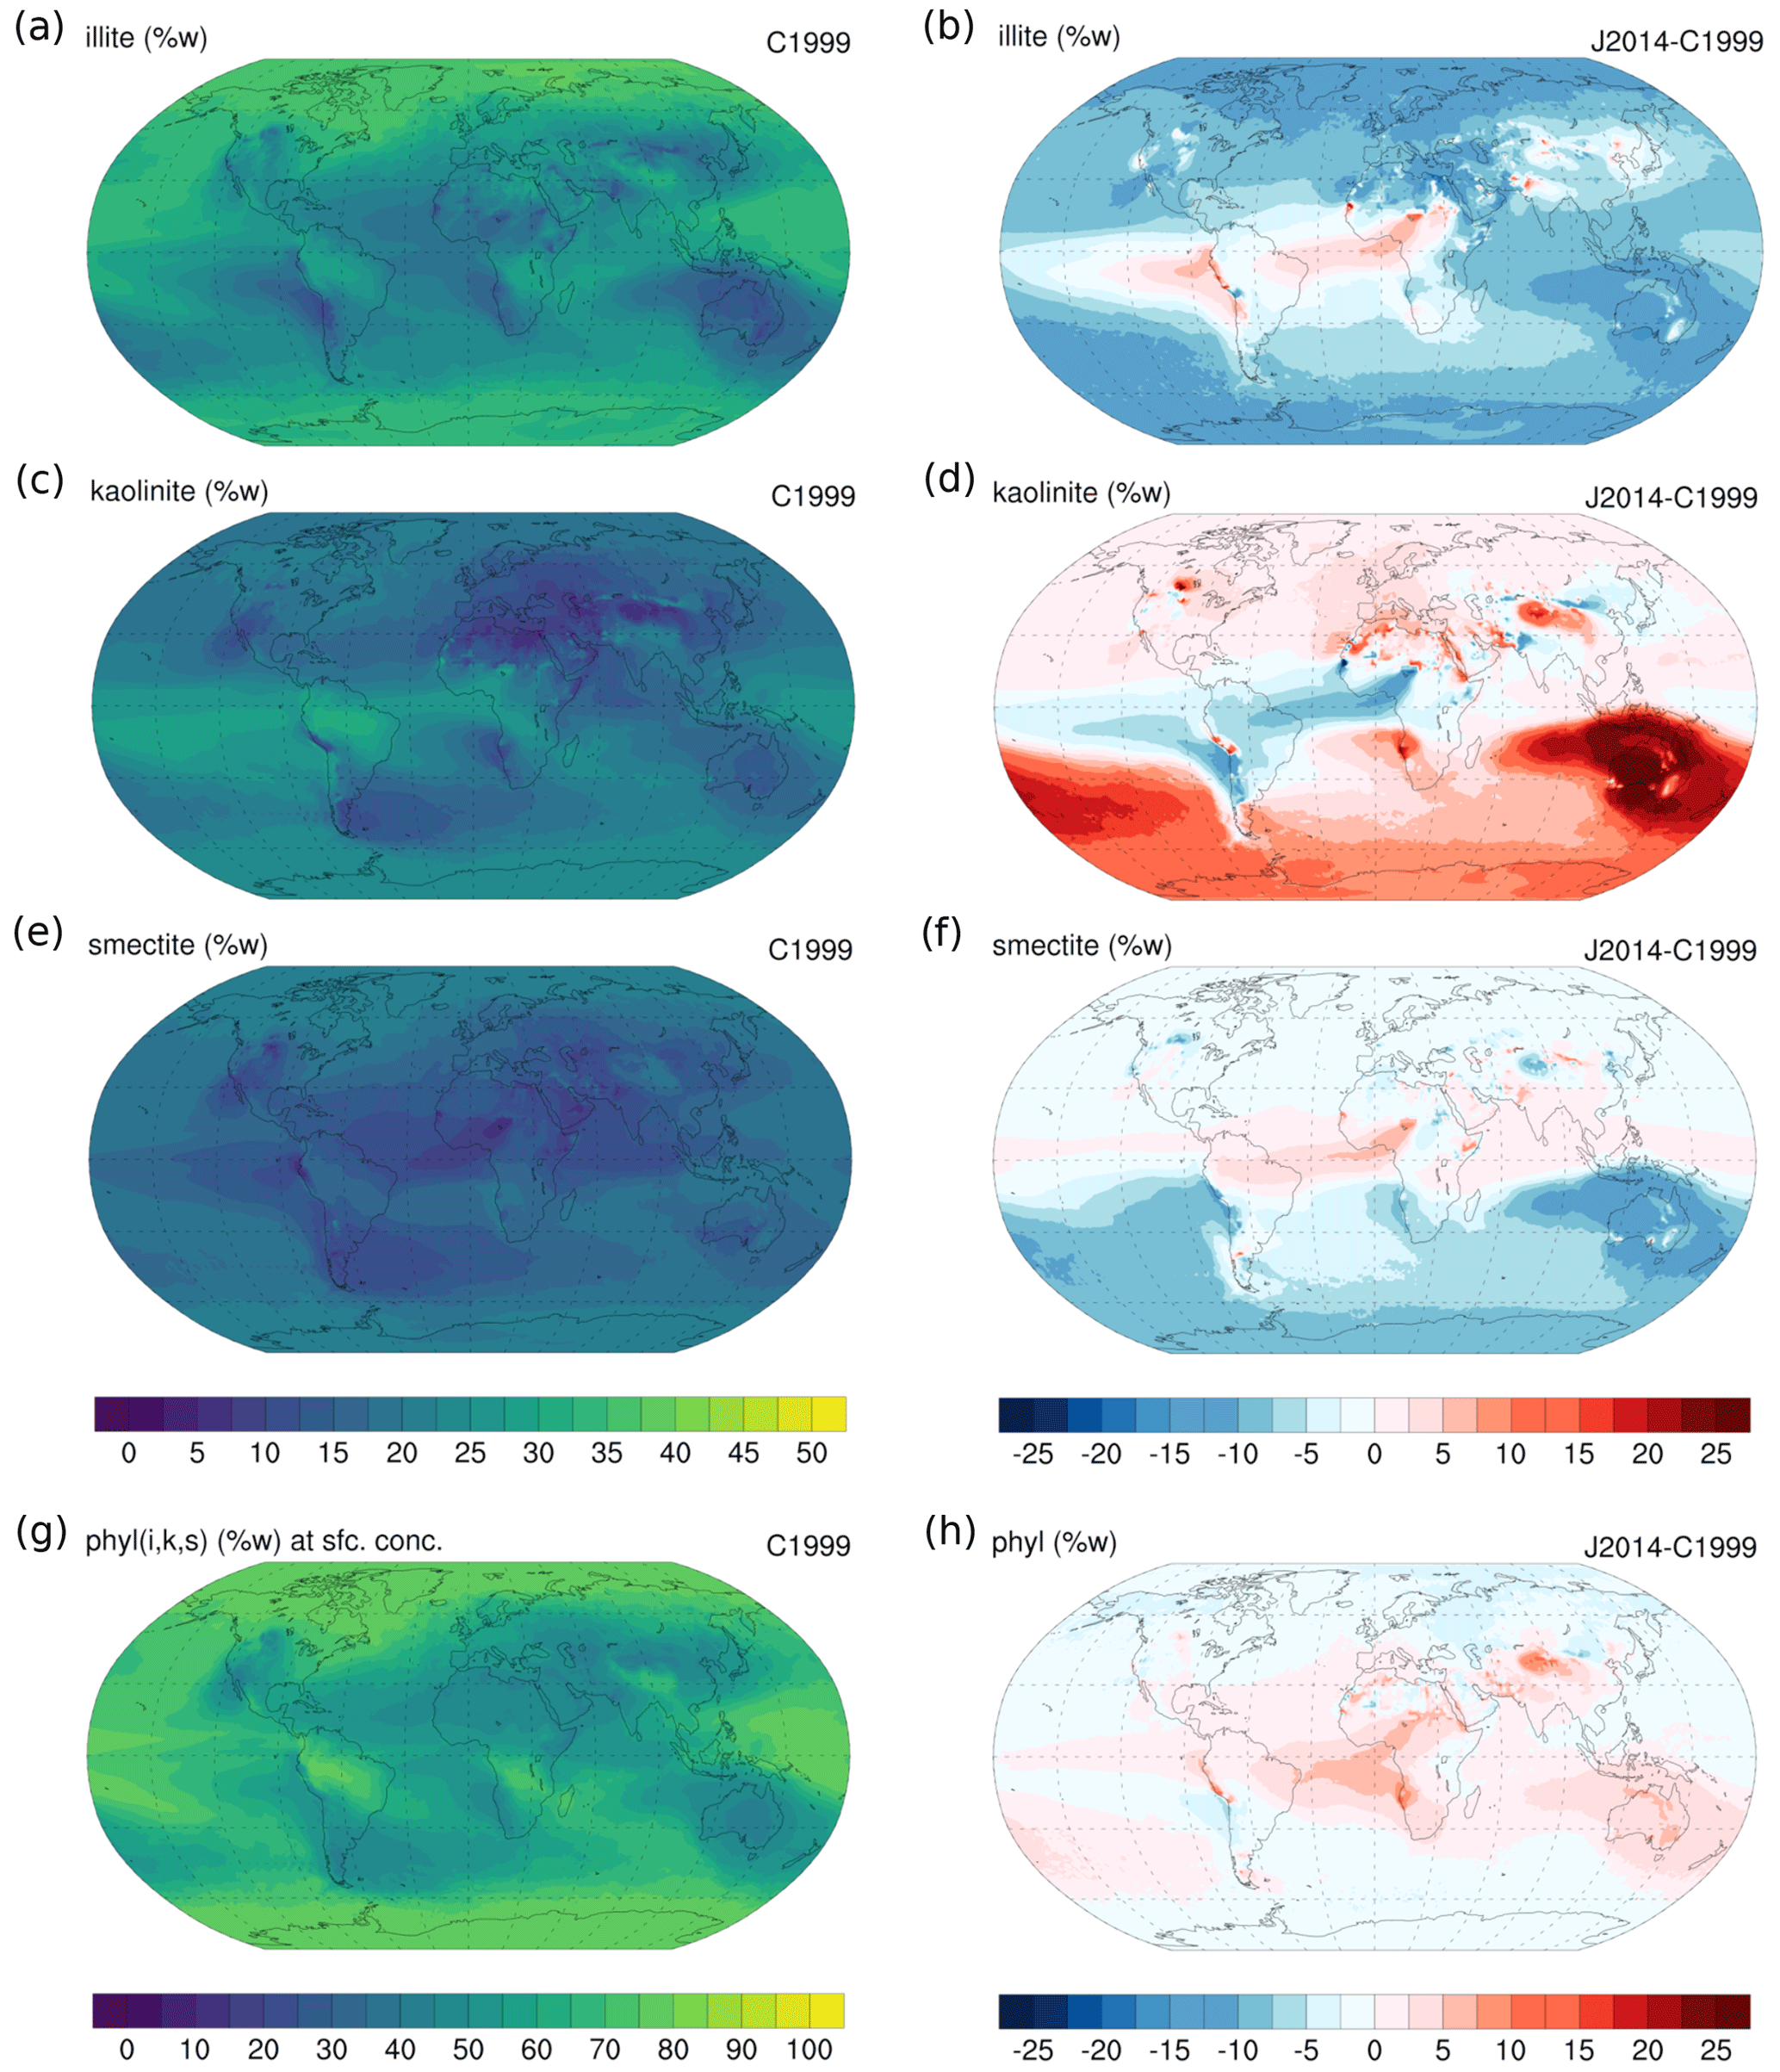
Figure 6Annual mean (a) illite, (c) kaolinite and (e) smectite and the (g) sum of all clay mineral mass fractions (wt %) at surface concentration in C1999. Differences in annual mean (b) illite, (d) kaolinite, (f) smectite and (h) all clay mineral mass fractions (wt %) at surface concentration in J2014 with respect to C1999.
Both C1999 and J2014 show similar geographical patterns and contributions to the total dust mass at the surface of clay phyllosilicates (i.e., illite, kaolinite and smectite in C1999 plus vermiculite and chlorite in J2014), with differences below ∼ 10 % mainly in plumes from Southern Hemisphere sources (e.g., Australia, southern African or South American sources), East Asia or the Bodélé in northern Africa. Differences between experiments increase when the different phyllosilicates are assessed independently, with overall lower (higher) mass fractions of illite (kaolinite) at the surface from northern African, North American and Australian sources and higher (lower) mass fractions from the northwestern African, Bodélé and South American sources in J2014 compared to C1999. The smectite mass fraction at the surface is overall lower in J2014 with respect to C1999, particularly in the Southern Hemisphere (Fig. 6e, f). Mica is a phyllosilicate of the same group as illite but is allocated in the soil map from J2014 to coarser sizes. If we add mica to the comparison, J2014 provides a higher mass fraction of total phyllosilicates in most dust sources (up to 15 %; see Fig. S3).
C1999 seems to reproduce better the observed geographical distribution of phyllosilicate minerals, particularly illite and smectite, than J2014 (size-dependent spatial correlations above 0.37 and below 0.26, respectively), but also for kaolinite (with a higher correlation of 0.67 vs. 0.47 and lower nRMSE and nMB). Overall, there is a general overestimation of the kaolinite and smectite fractions but an underestimation of illite (Fig. 7). In the finer clay size range (below 2 µm), both C1999 and J2014 overestimate the illite mass fraction close to sources and underestimate it in transport or remote regions, while the coarser silt size fractions are overall underestimated (i.e., close to and far from sources, Fig. 7). The latter may be caused by a still insufficient redistribution of soil clay mineral fractions towards coarser emitted sizes, even after applying BFT.
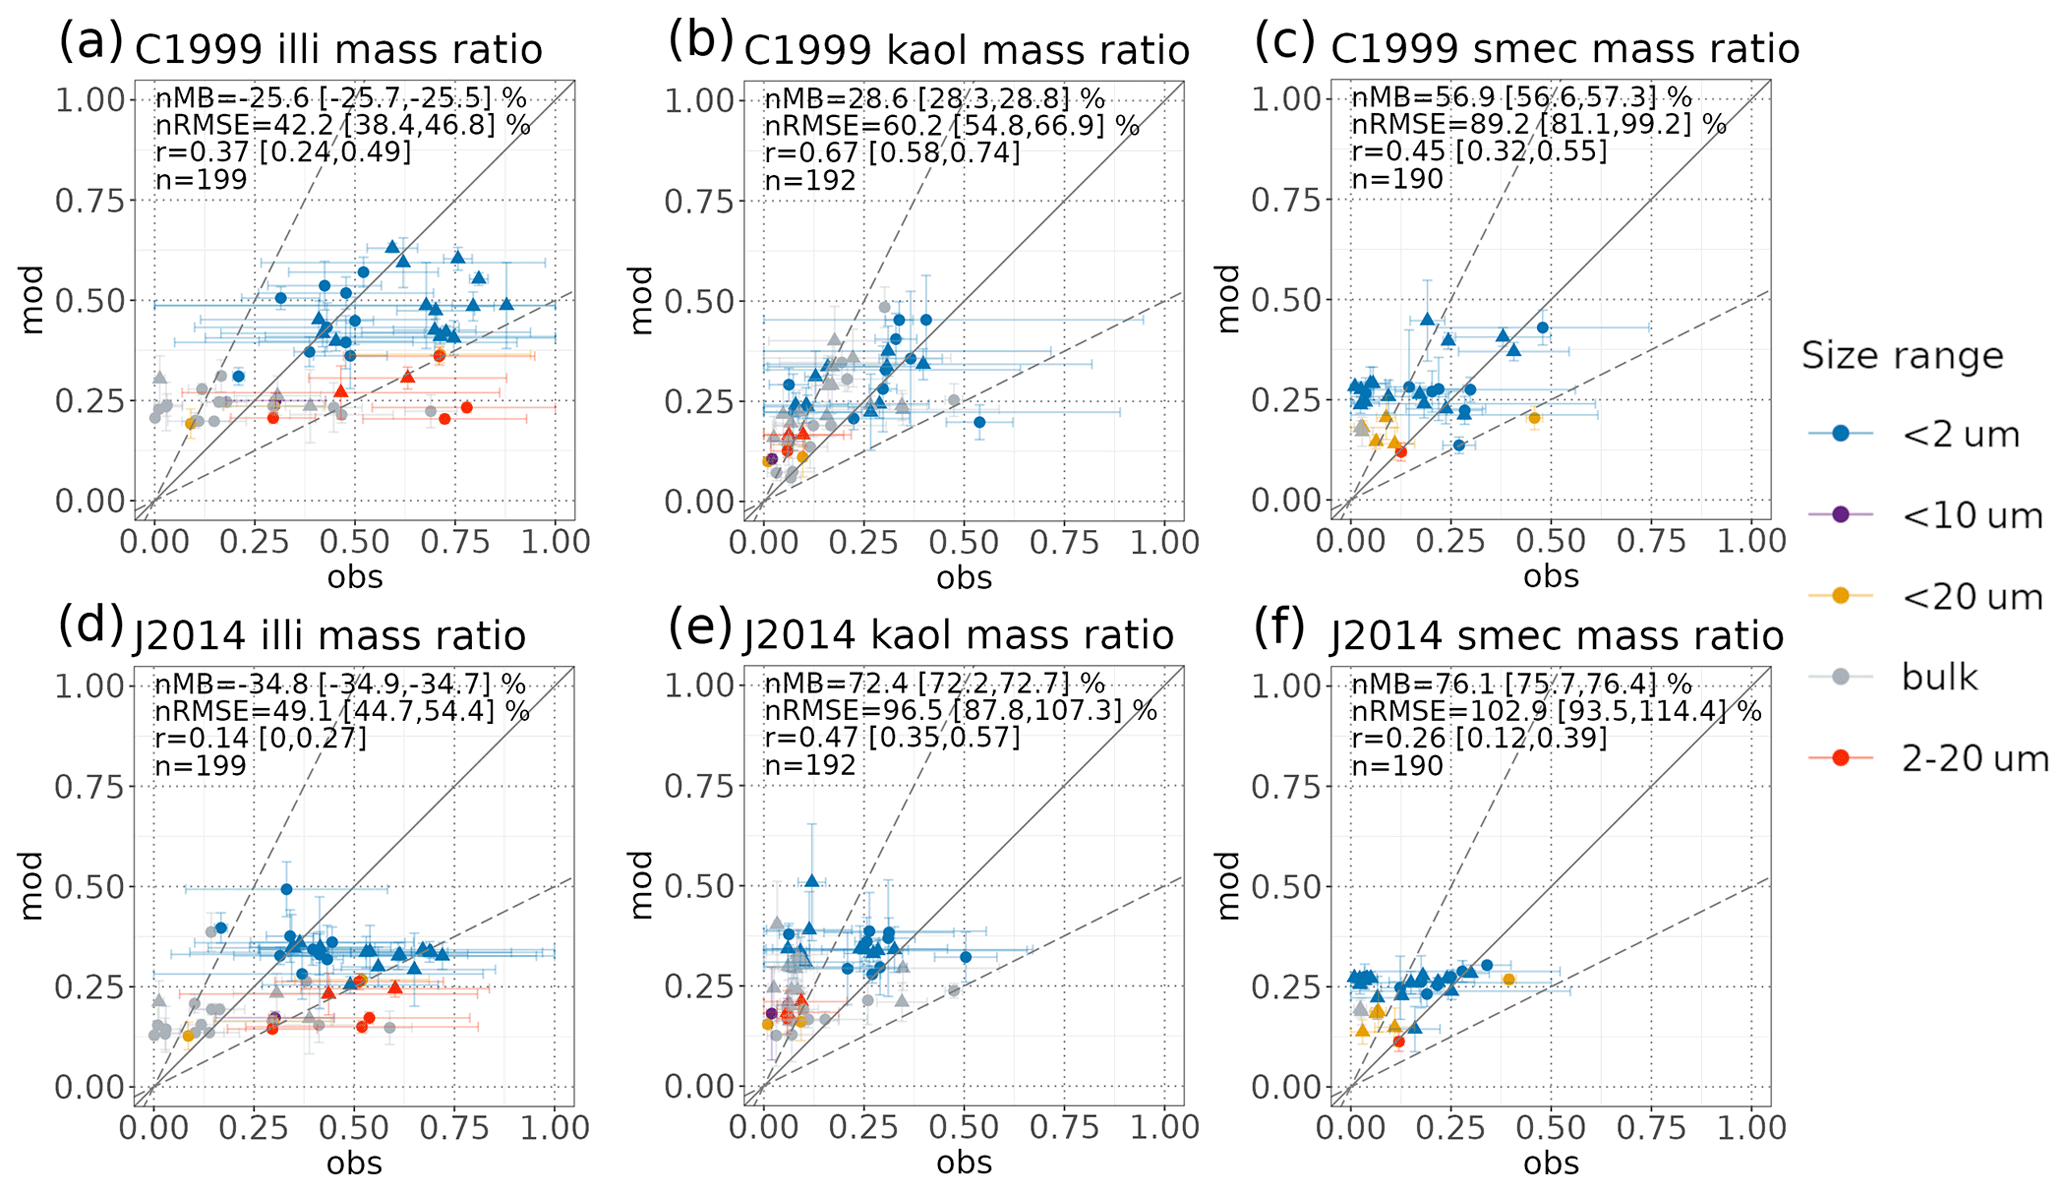
Figure 7Comparison of the illite (illi), kaolinite (kaol) and smectite (smec) modeled vs. observed mass fractions in the C1999 (a–c, respectively) and J2014 (d–f, respectively) experiments. Colors identify size ranges, circles correspond to observation points that fall within source regions as depicted in Fig. 2b, and triangles correspond to those outside. Statistics considering mean values are computed for all points within the modeled size ranges (up to 20 µm in diameter). The ranges for the nMB, nRMSE and r correspond to the 95 % confidence level (see Sect. S1 for details).
5.3.2 Quartz, feldspars and calcite
According to C1999, quartz makes up a large fraction of the dust surface concentration over major dust sources (up to ∼ 50 %), which is explained both by its high mass fraction at emission and the preferential removal close to sources due to its size and density. J2014 produces slightly lower mass fractions of quartz over the Northern Hemisphere, particularly over northern African and Asian sources (∼ 10 %–15 % lower), and slightly higher fractions over Australian sources (∼ 10 %–15 %, Fig. 8).
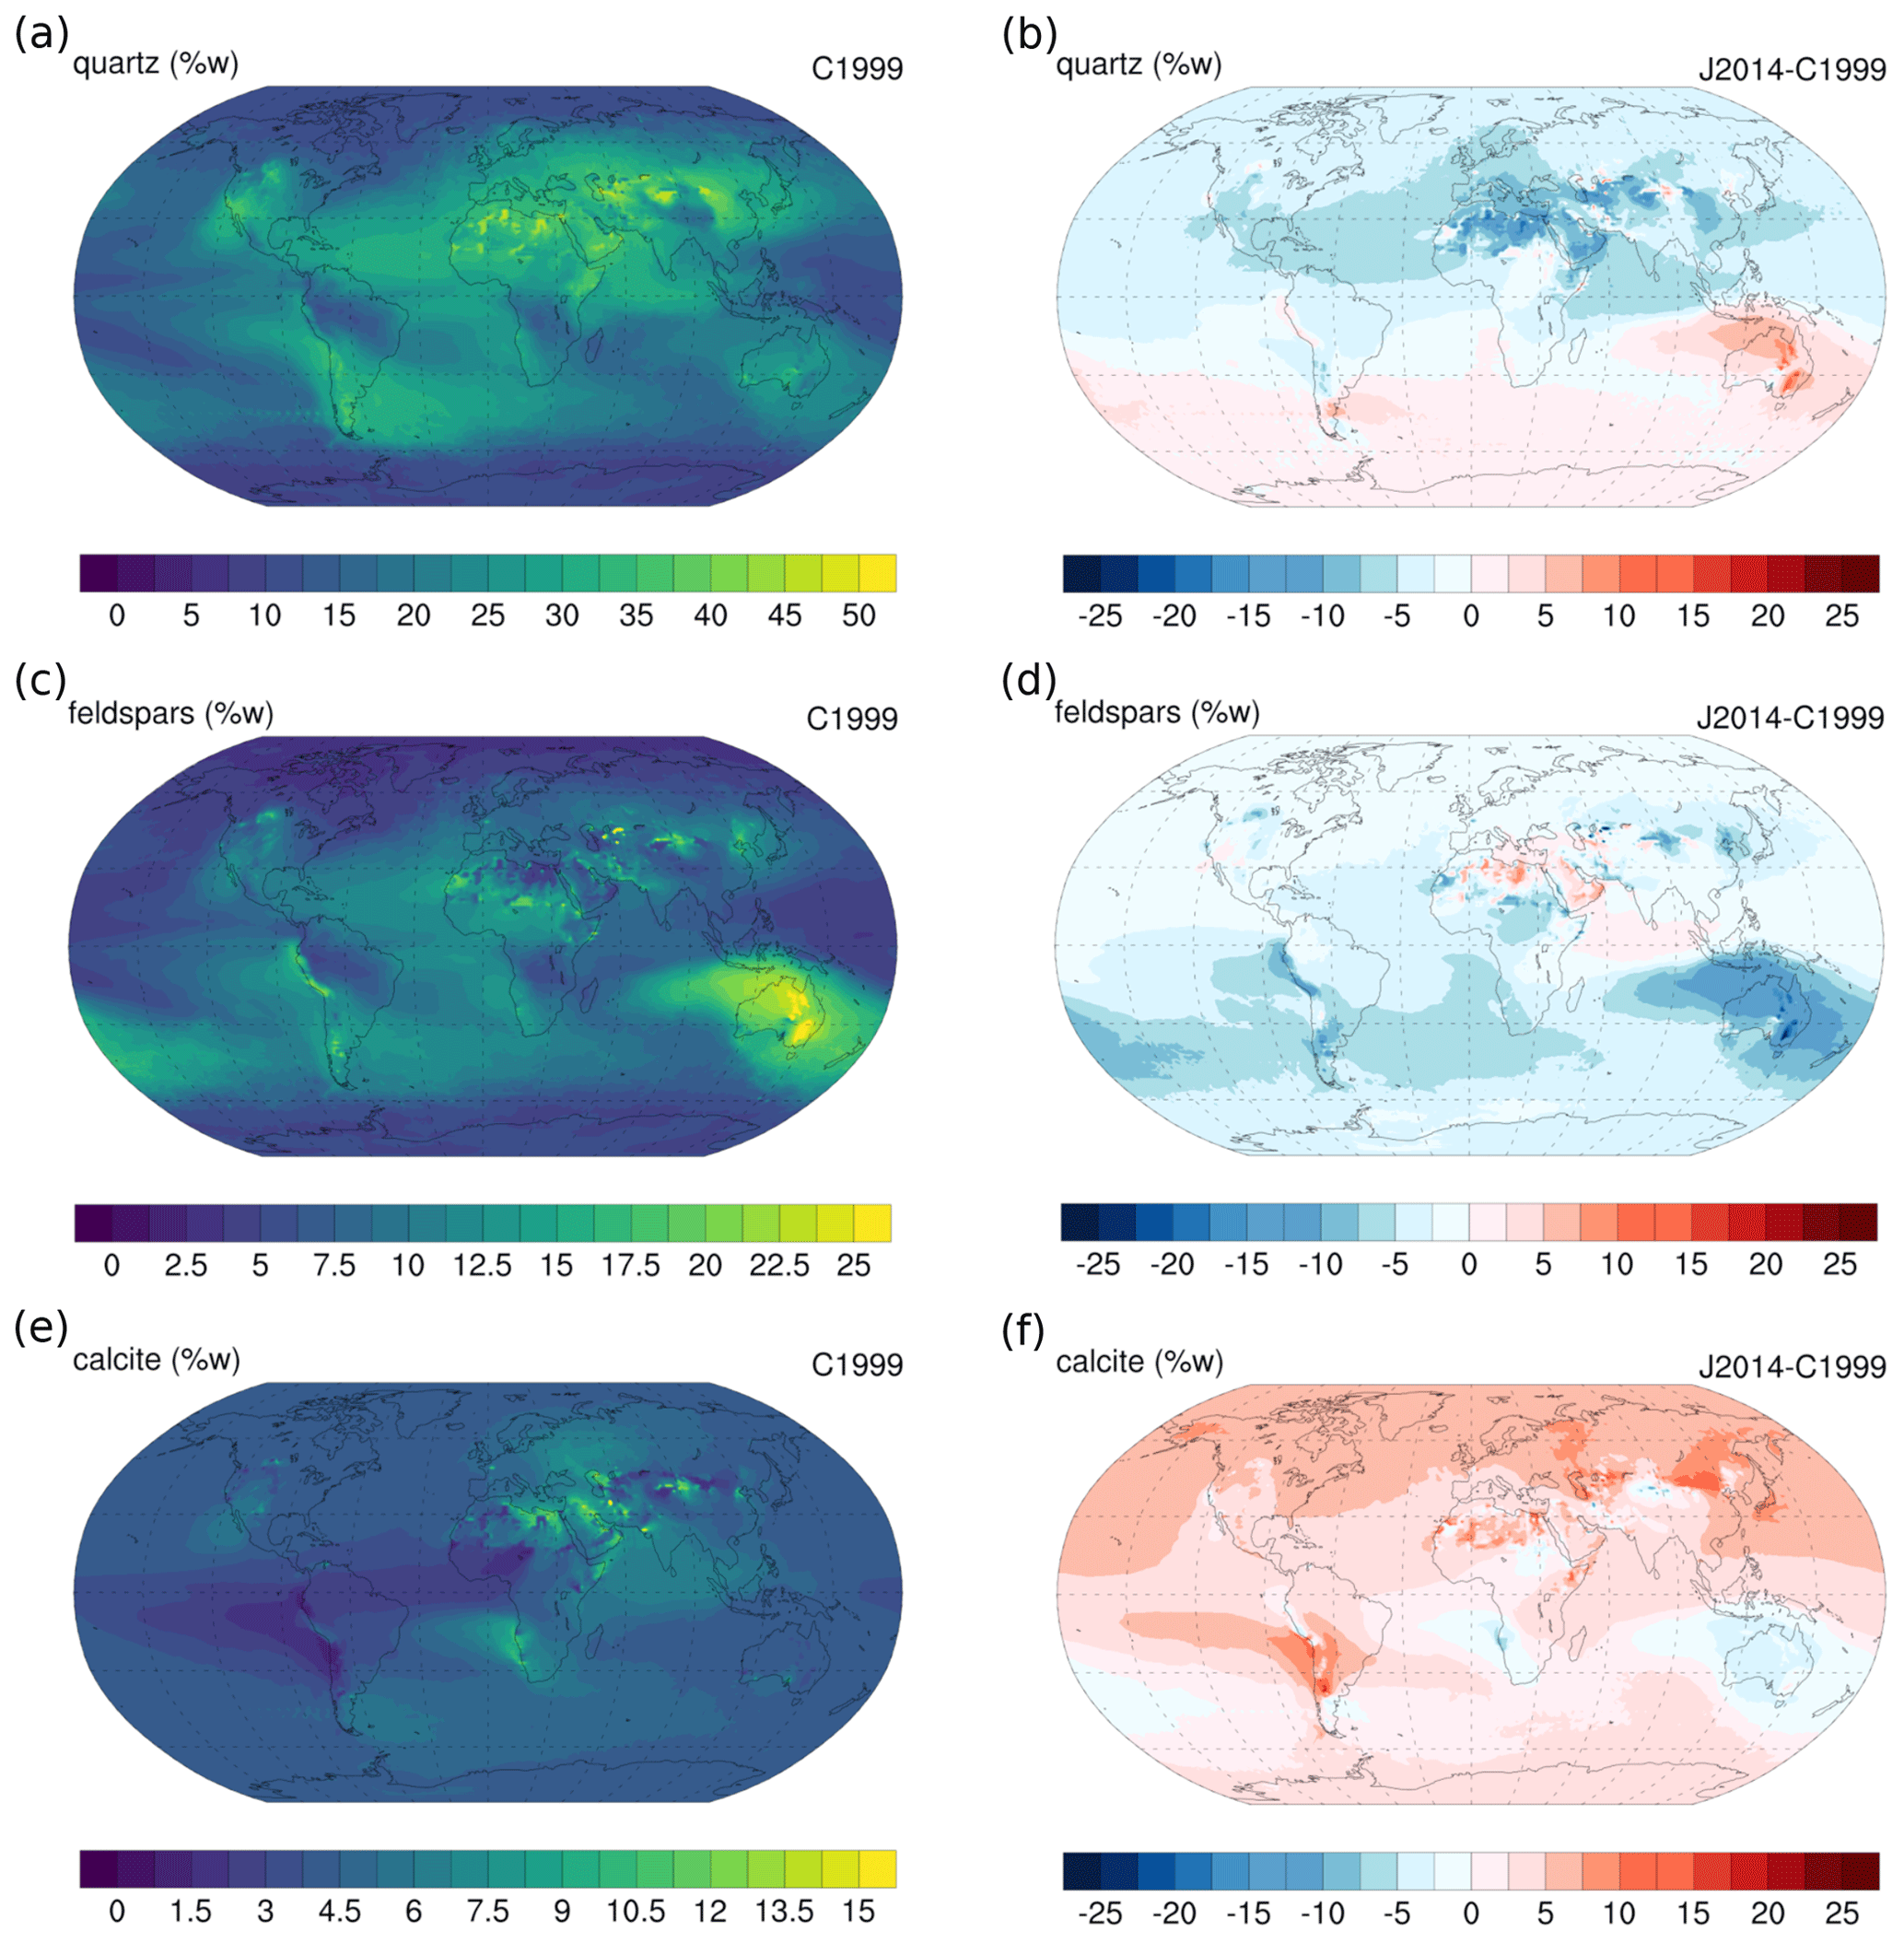
Figure 8Annual mean (a) quartz, (c) feldspar, (d) calcite mass fractions (wt %) at surface concentration in C1999. Differences in annual mean (b) quartz, (d) feldspar and (f) calcite mass fractions (wt %) at surface concentration in J2014 with respect to C1999.
The feldspar mass fraction also peaks over sources, with a contribution in C1999 of up to ∼ 25 % of the total dust in specific regions, particularly over Australia (up to ∼ 25 %), where in J2014 it is reduced by ∼ 15 %–20 % (Fig. 8).
The calcite contribution to the surface is largest over Asian and southern African sources in C1999 (making up to ∼ 15 % of the dust mass), with relatively low mass fractions within the Atlantic dust plume (originating in northern Africa) and from South American sources (Fig. 8). Overall, J2014 shows higher calcite mass fractions (up to ∼ 15 %), except for some Southern Hemisphere regions (e.g., Australia and southern Africa) and some spots over Asia, where calcite is less abundant than in C1999 (Fig. 8).
MONARCH tends to overestimate the silt size fraction of quartz (Fig. 9) and underestimate the clay size fraction independently of the soil map. The model is unable to capture the size and spatial variability of this mineral as described by observations. Similarly to illite, we think that these discrepancies are due to the excessive allocation of quartz to the coarser sizes that is derived from the soil information. Even after redistribution of other emitted minerals to silt sizes through BFT, an excessive mass fraction of quartz is projected in the coarsest silt transport bins, leading to the overestimation shown in particles with diameters below 10 µm and between 2 and 20 µm. The excellent agreement of the modeled quartz fraction with observed fractions in the bulk-sized particles reinforces this hypothesis. The observed quartz fraction normally increases with particle size. When we compare our modeled size range, up to 20 µm, with observed quartz fractions in particles larger than that, there is an artificial reduction in bias.
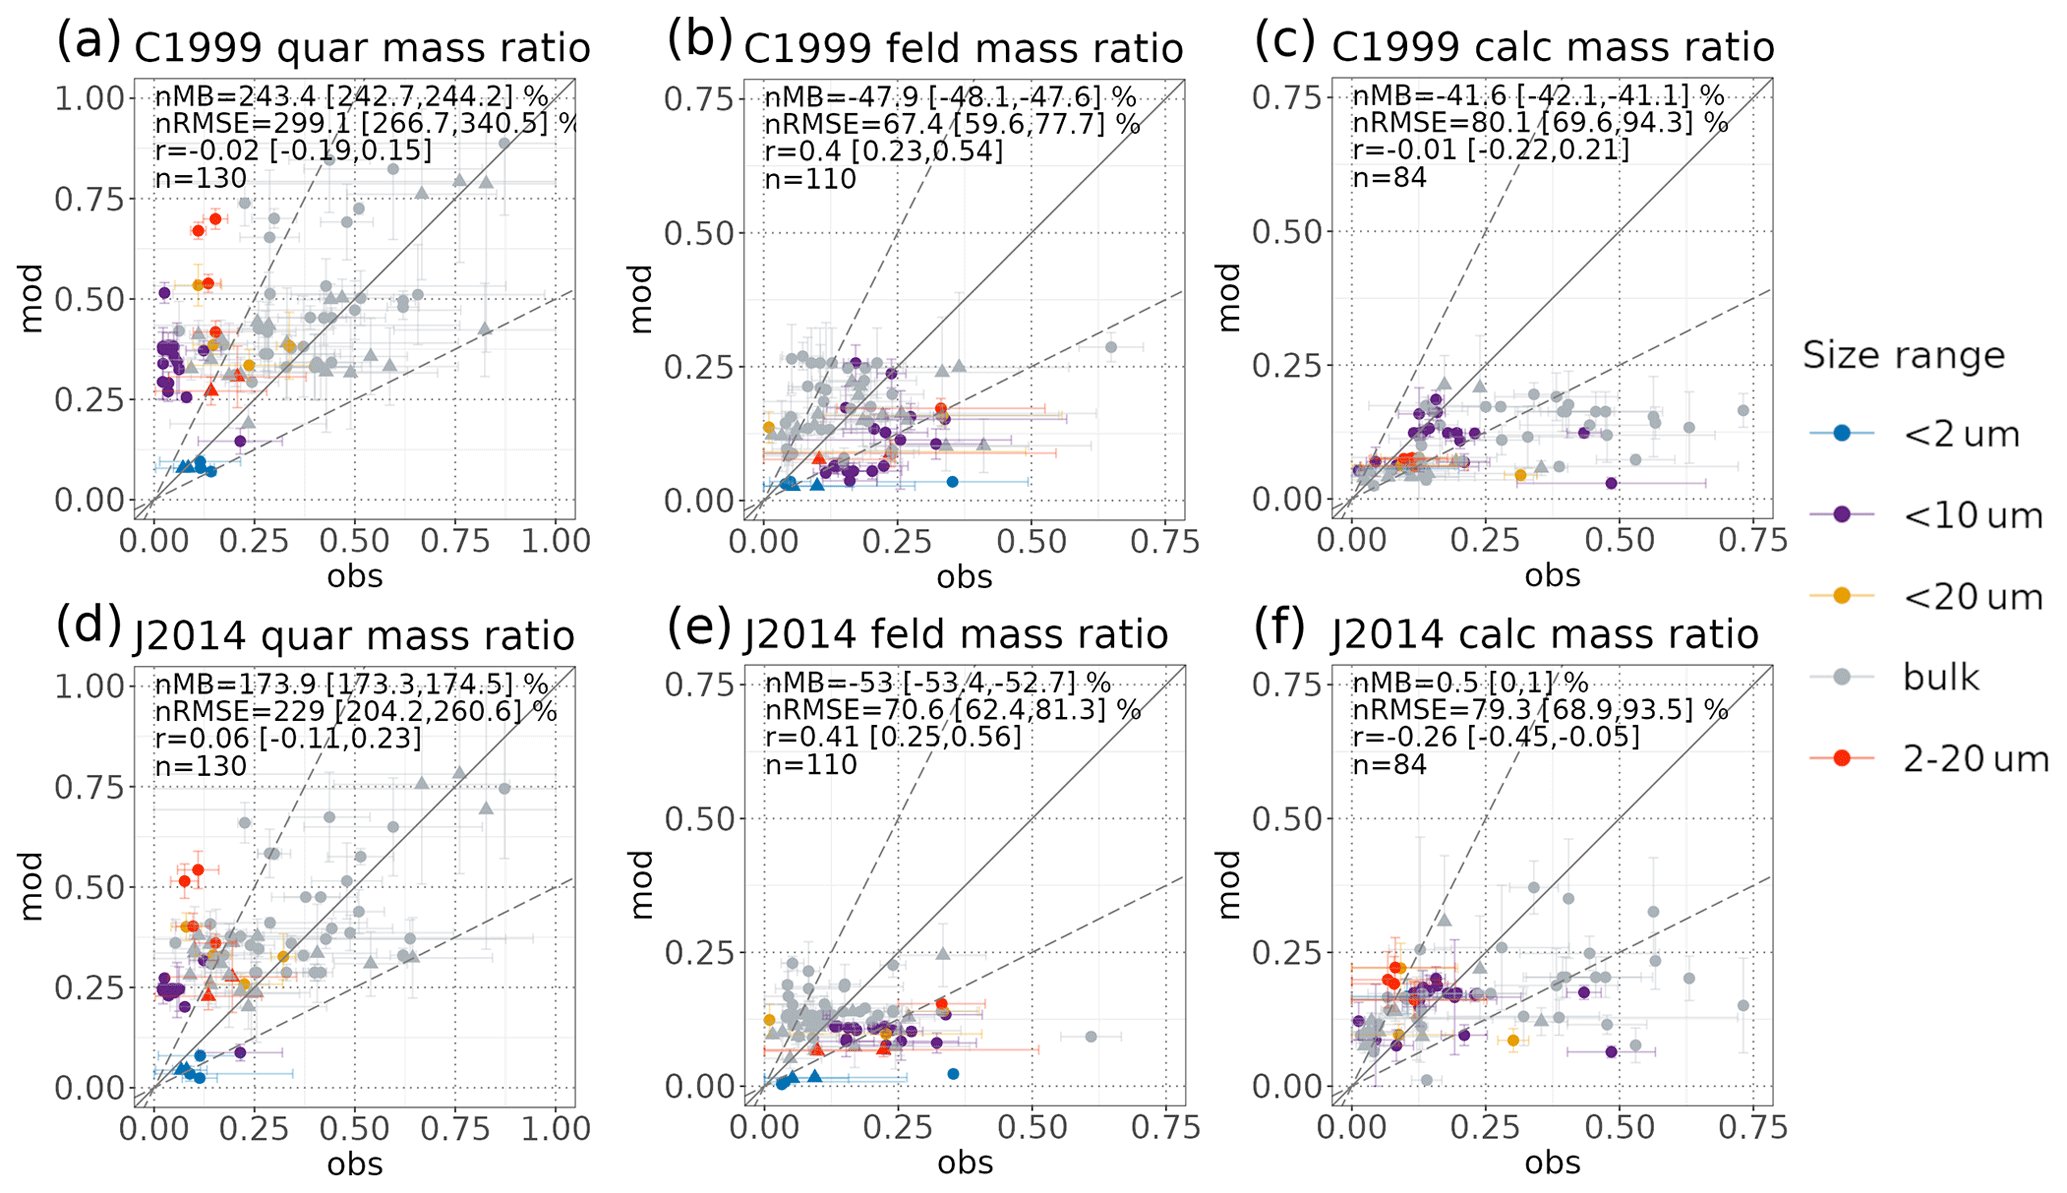
Figure 9Comparison of the quartz, feldspar and calcite modeled vs. observed mass fractions in the C1999 (a–c, respectively) and J2014 (d–f, respectively) experiments. Colors identify size ranges, circles correspond to observation points that fall within the source regions as depicted in Fig. 2b, and triangles correspond to those outside. Statistics considering mean values are computed for all points within the modeled size ranges (up to 20 µm in diameter). The ranges for the nMB, nRMSE and r correspond to the 95 % confidence level (see Sect. S1 for details).
All our estimates rely on relative mass fractions, and therefore the quartz overestimation in the silt sizes could be the reason explaining the underestimation of other typically coarse minerals, such as feldspars (Fig. 9). Overall, J2014 shows less variability in the modeled feldspar fraction than C1999, something we attribute to the multiple assumptions that Journet et al. (2014) made in order to fill in the missing information on the silt sizes, which many times involved averaging mass fractions over multiple soil categories (see Fig. S9). Despite the low variability, the size-dependent spatial correlation of the model versus observations is larger in J2014 than in C1999, although with larger errors and biases. It has to be noted here that the original J2014-SMA includes feldspars in both the clay and silt soil sizes, while we artificially introduce the feldspar clay fraction into C1999-SMA using the available information in the silt sizes (see Sect. A2 in Appendix A for details).
Calcite is slightly underestimated in the C1999 experiment, particularly for the 2–20 µm size range (Fig. 9); therefore, the increased mass fractions obtained with J2014 produce more realistic levels when compared to observations. In many cases, calcite size apportionment has been inferred from soil texture data in the original soil maps. Both C1999 and J2014 poorly represent the size-dependent spatial distribution of this mineral, as shown by the low correlation in Fig. 9.
5.3.3 Iron oxides
Iron oxides, represented as hematite in C1999 and as the sum of hematite and goethite in J2014, constitute a small fraction of the total dust load (Fig. 10). At the surface, mass fractions of up to ∼ 3.5 % occur in dust plumes from the Bodélé, Sahel and northwestern African sources as well as in some areas of the Middle East and North America in our C1999 experiment. Also, Australian dust is rich in iron oxides, with contributions of up to ∼ 4 % that influence the delivery of iron to the South Pacific region (e.g., Bergas-Massó et al., 2023). J2014-SMA follows current evidence (Lafon et al., 2006; Formenti et al., 2008) of goethite being more abundant in soils than hematite, and this is reflected in the aerosol abundance.
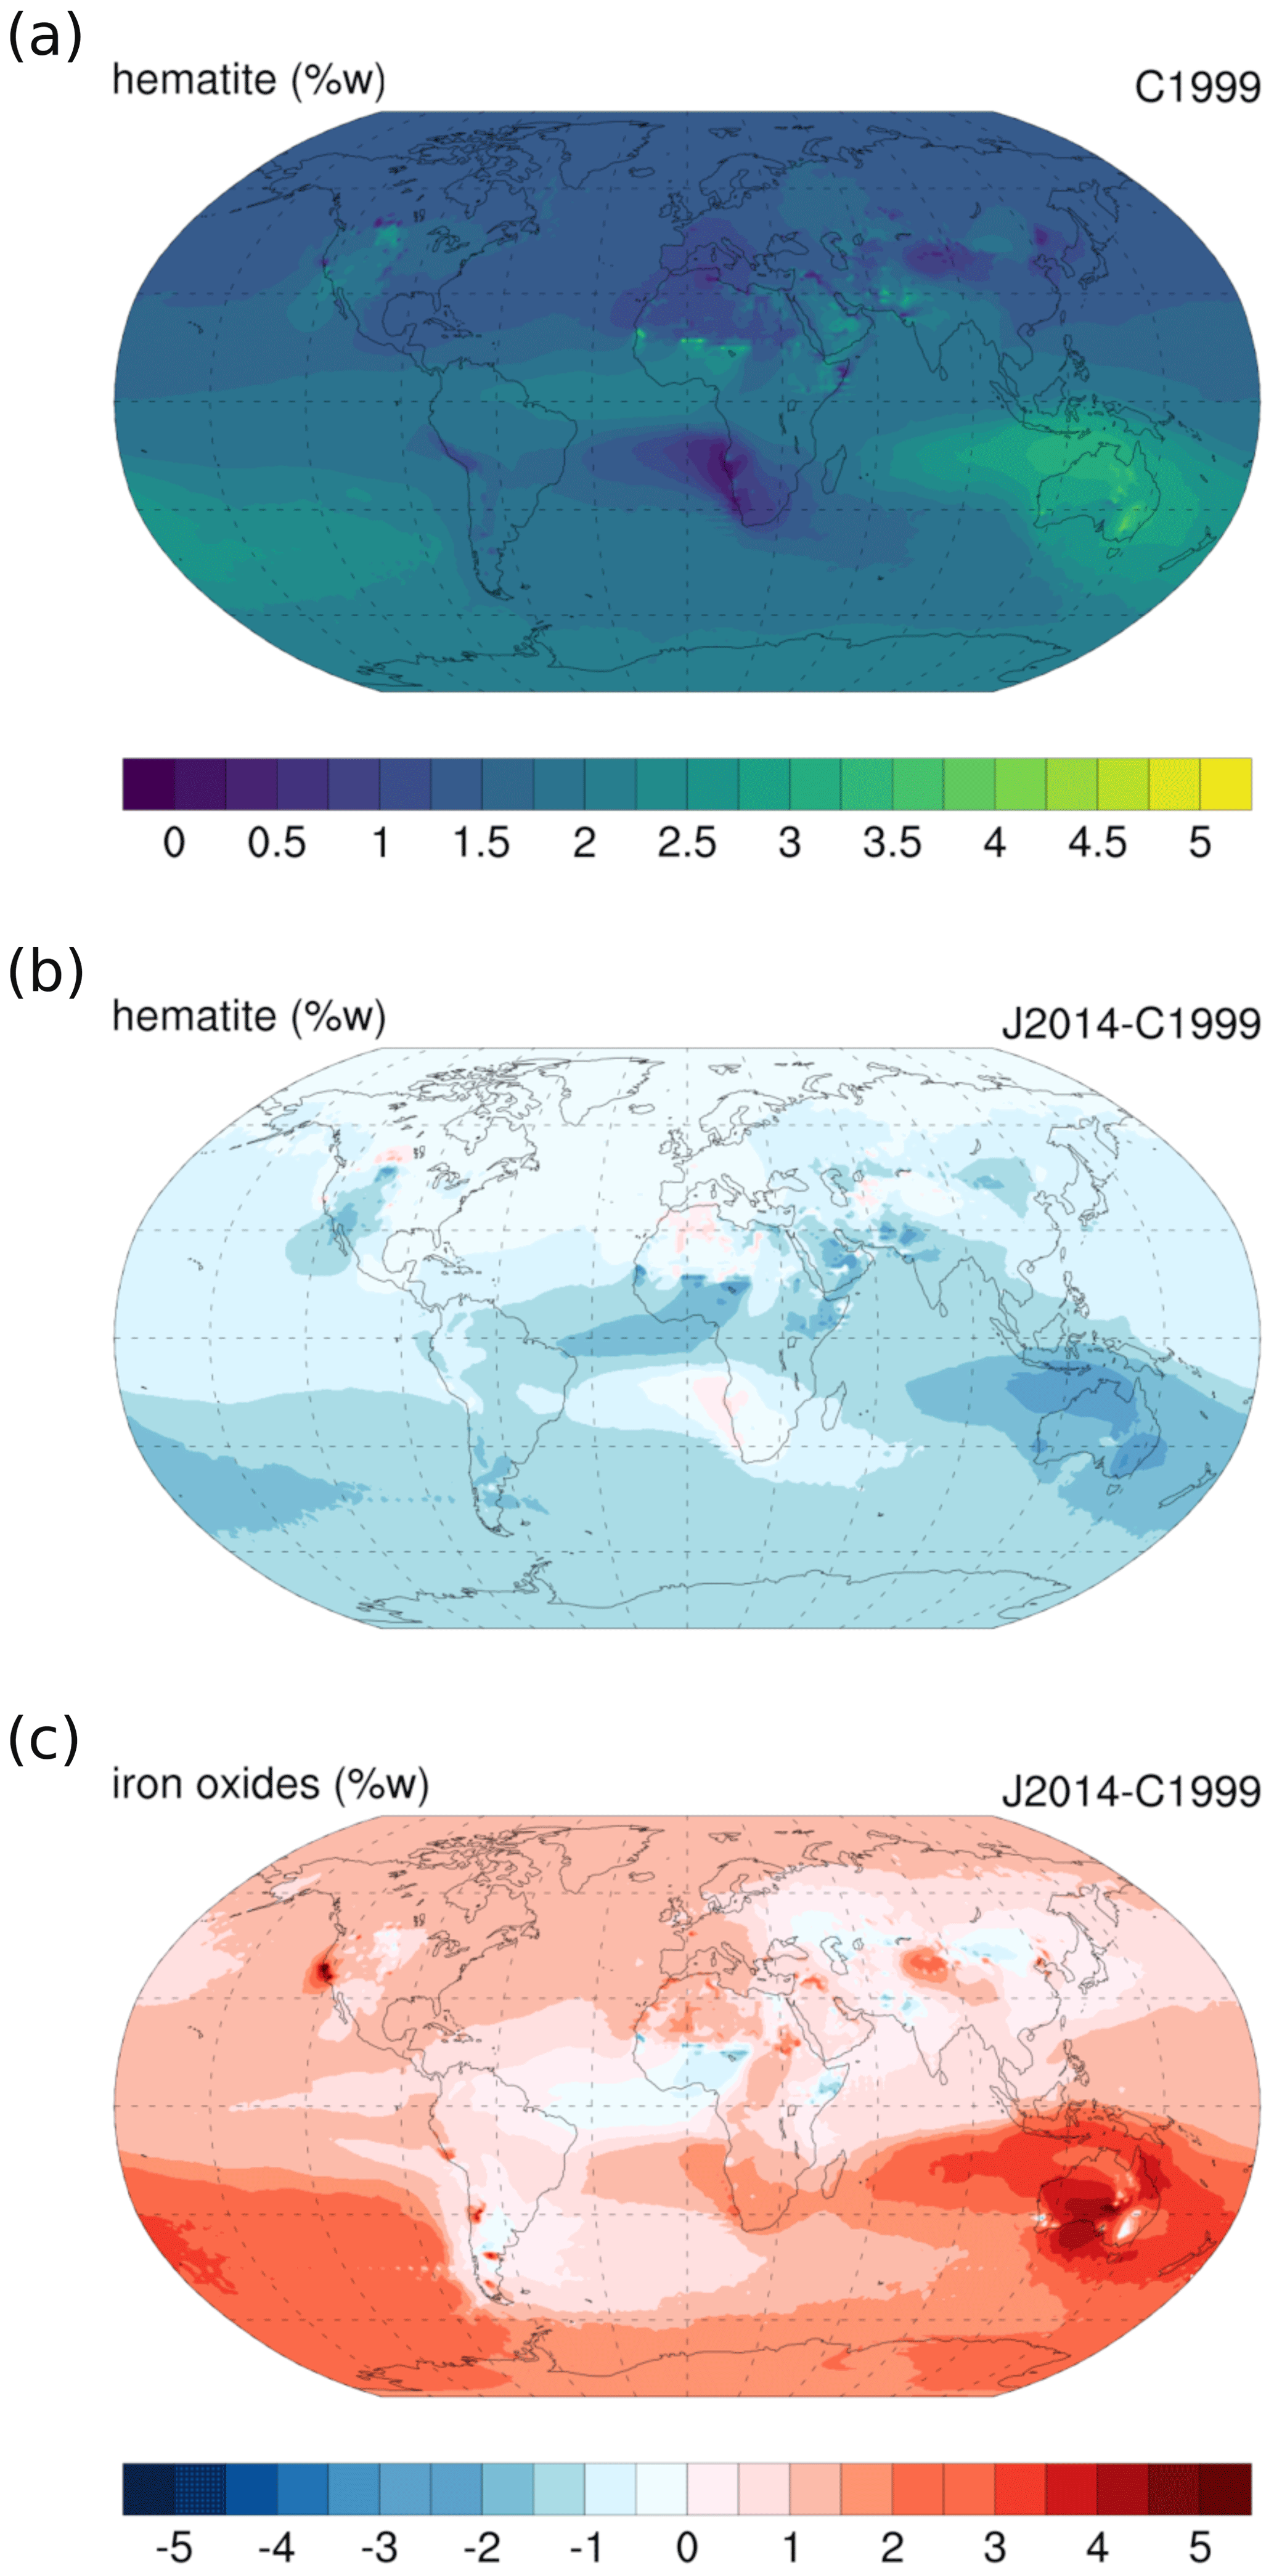
Figure 10Annual mean hematite (iron oxide) mass fraction (wt %) in surface concentration in C1999 (a) and differences compared to hematite in J2014 (b) and to iron oxides (hematite plus goethite) in J2014 (c).
The hematite levels in J2014 are lower than those in C1999 (up to ∼ 3 %), particularly over those regions where the maximum mass fractions in the surface concentration are shown. Considering the sum of hematite and goethite, J2014 provides an overall higher mass fraction of iron oxides at the surface than C1999 (differences up to ∼ 5 % over Australian sources). However, dust plumes originating in the Sahel and Bodélé areas have a lower iron oxide content in J2014 than in C1999 (Fig. 10). These constitute relevant dust sources, and while observational evidence (Formenti et al., 2008; Go et al., 2022) supports the Bódélé being depleted in iron oxides, it also suggests that the Sahel (characterized by intense soil weathering) is rich in iron oxides, a feature that would be better captured by C1999.
The available observations of hematite mass fractions are from two observation sites, one in Izaña (Tenerife, Spain) and the other in Tinfou (Morocco) (Kandler et al., 2007, 2009). For these spots, located in or influenced by African sources, both C1999 and J2014 underestimate the hematite content; however, C1999 shows a slightly lower error and a higher correlation than J2014 (Fig. 11a and c). This comparison potentially supports a more realistic geographical distribution of iron oxides over northern Africa in C1999, although the number of observations is too low to extract sound conclusions (differences in the evaluation metrics are not statistically significant). When we consider iron oxides, the number of observation sites increases. Please note that measurements reporting iron oxides do not necessarily report on goethite and hematite, but they could refer exclusively to hematite. Overall, J2014 provides a better agreement with the spatial and size distributions of the observations than C1999 (higher correlation) and similar errors. These results suggest that the introduction of goethite has a positive impact on estimating the total iron oxide content, which is generally underestimated in C1999. It is yet to be determined whether this is related to the iron oxides' speciation, their geographical distribution or just the increased mass fractions. More observations are needed and are very much desirable to be able to discuss their abundances and how they impact dust optical properties or ocean biogeochemistry.
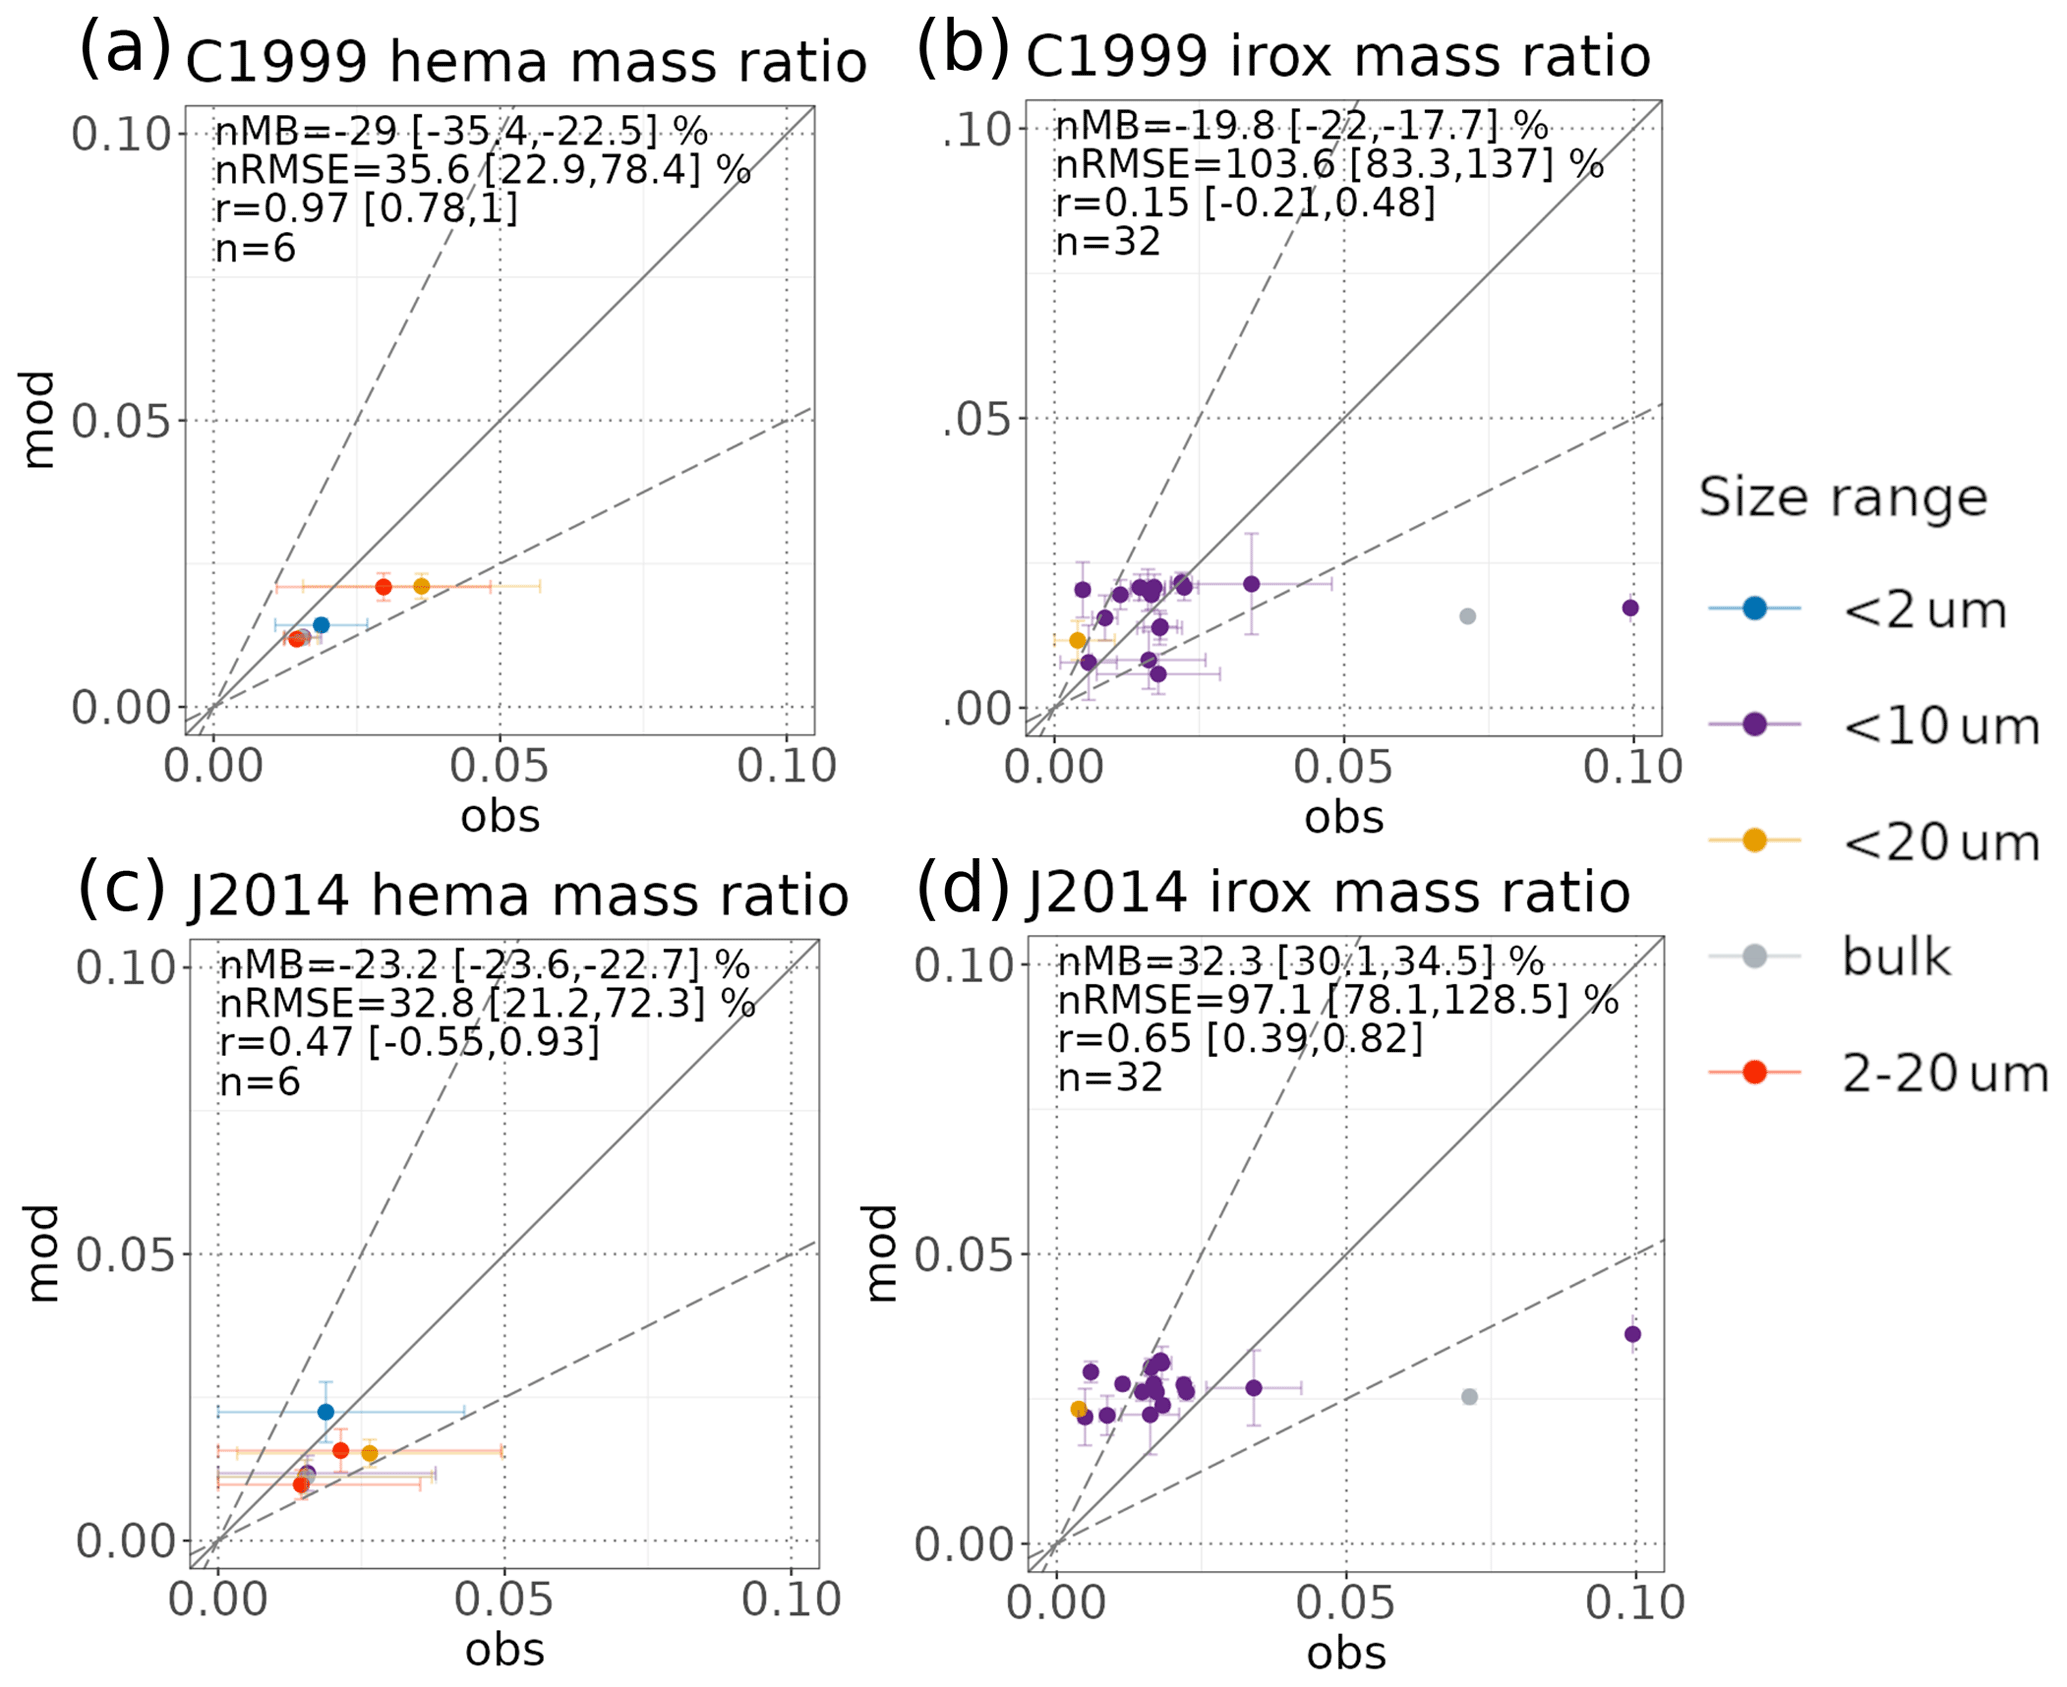
Figure 11Comparison of the hematite – hema – and total iron oxides – irox – (from left to right) modeled versus observed mass fractions in the C1999 (a, b, respectively) and J2014 (c, d, respectively) experiments. Colors identify size ranges, circles correspond to observation points that fall within source regions as depicted in Fig. 2b, and triangles correspond to those outside. Statistics considering mean values are computed for all points within the modeled size ranges (up to 20 µm in diameter). The ranges for the nMB, nRMSE and r correspond to the 95 % confidence level (see Sect. S1 for details).
The abundance of iron oxides determines the radiation absorption by mineral dust in the SW: the higher the amount of iron oxides, the lower the single-scattering albedo. Our offline calculations of SSA in the UV-VIS band (0.3–0.77 µm) for a dust of homogeneous composition range from 0.919 to 0.966 at the annual scale (Fig. 12a). When we consider the mineralogy variations, the annual mean SSA scales with the abundance of iron oxides, with the lowest values in C1999 (∼ 0.899) over Australia and slightly absorbing features in the dust plumes from the Bodélé, Sahel, Middle Eastern and South American sources (∼ 0.92) (Fig. 12b). Transport or remote regions are characterized by more scattering dust mixtures, with a SSA of up to 0.972. In line with the higher iron oxide content (see Sect. 5.3.3), the mineralogy of J2014 shows overall more absorbing features (with differences in SSA of ∼ 4 % over Australia, ∼ 0.856, Fig. 12c), except for the dust plume originating at the Bódélé depression, where J2014 shows lower iron oxide abundances and hence slightly more scattering dust properties. Our offline calculated SSA regional variations, from 0.899 to 0.972 in C1999 and from 0.856 to 0.960 in J2014, reach more absorbing values than the mineral-dependent estimates of Journet et al. (2014), which ranged at visible wavelengths from 0.935 to 0.975 using a core and shell model to estimate the optical properties. On the other hand, our estimates show more scattering features than those in Li et al. (2021). Their SSA in the 0.44–0.63 µm band ranges from 0.83 to 0.93 over dusty regions. The differences with our estimates are attributed both to the broader range of iron oxide abundance in their study, due to the use of the uncertainty ranges in the soil maps, and to the calculation of the dust complex refractive index through the minerals' volume average, which may overestimate the absorption.
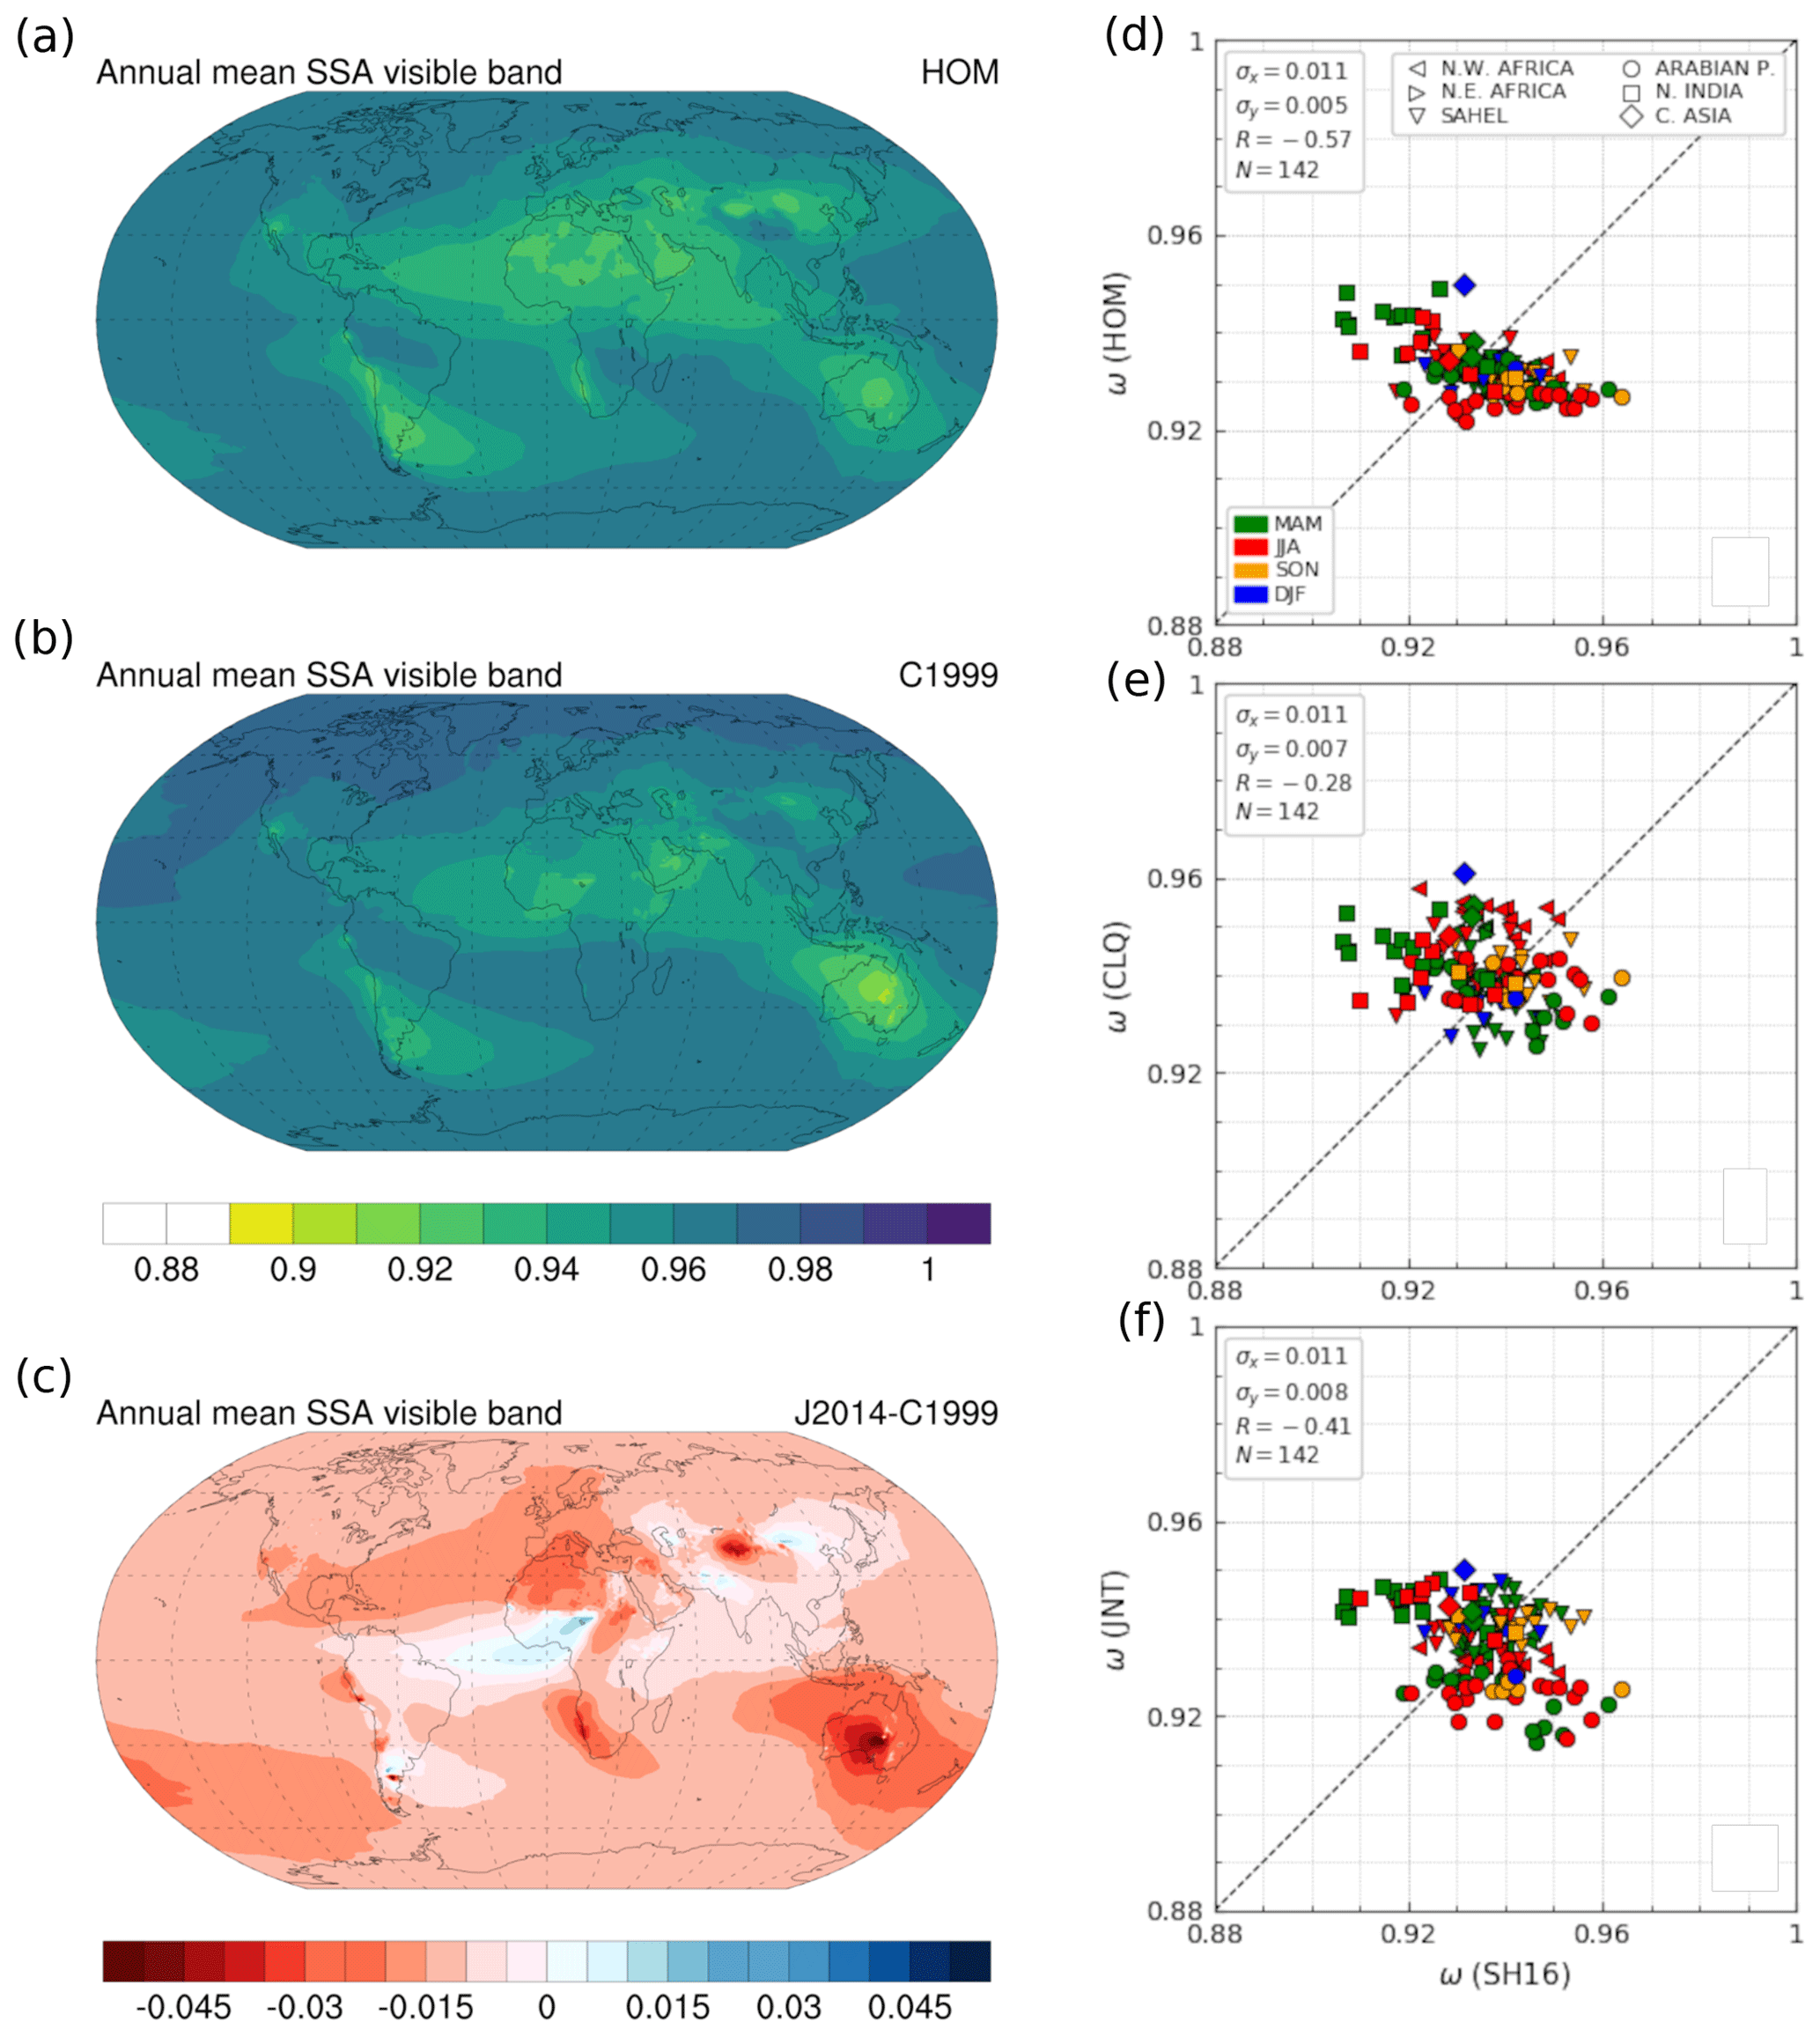
Figure 12Annual mean single-scattering albedo (SSA), averaged in the UV-VIS band (0.3–0.77 µm), considering dust to be an optically homogeneous species (a), as the sum of three optically different species using (b) C1999-modeled mineralogy. Differences between the latter and (c) J2014-modeled mineralogy. Comparison of monthly mean UV-VIS SSA, calculated considering dust to be a homogeneous species (d), and the mineralogy provided by C1999 (e) and J2014 (f) against dust-filtered SSA (averaged in the UV-VIS band) from AERONET version-3 level-2.0 Almucantar retrievals at the selected AERONET stations and months, labeled by region and season.
Our SSA calculation assuming regionally homogeneous dust optical properties that are independent of the mineral content produces a lower spatiotemporal variability with respect to dust-filtered AERONET retrievals at the selected stations and in the selected months (Fig. 12d), with a monthly SSA standard deviation of 0.005 compared to 0.011. The introduction of mineralogical variations according to C1999 (J2014) (Fig. 12e and f) increases this variability and brings it closer to the observed range, with a standard deviation of 0.007 (0.008). Despite the existing uncertainties in the characterization of iron oxides, reflected in the poor correlations with AERONET retrievals in all the cases, considering the regionally varying composition has a positive impact on our comparison with AERONET and thus represents a first promising step towards a more realistic representation of dust absorption and its climate impact.
On the other hand, dust is known to be a major source of iron in the atmosphere, which is relevant for ocean biogeochemistry upon deposition. The choice of a specific soil map has a large impact on the total iron estimates (Fig. 12a and b). The C1999 experiment emits 70.23 Tg yr−1 of iron on average for 2006–2010, which globally represents 2.0 wt % of the total dust-emitted mass, while J2014 derives 97.64 Tg yr−1 (2.8 wt %). In J2014NN, as we account for the fraction of dust with an unknown composition to which we do not attribute any iron content, the total iron emitted adds up to 89.5 Tg yr−1 (i.e., 2.6 wt % of dust). All of them fall below the 3.5 wt % iron-to-dust ratio commonly assumed in modeling studies that do not resolve dust mineralogy (e.g., Luo et al., 2008; Mahowald et al., 2009; Johnson and Meskhidze, 2013). Mineralogy-resolving models produce higher iron-to-dust ratios when they represent smaller size ranges than MONARCH (e.g., Scanza et al., 2018; three of the models in Myriokefalitakis et al., 2018, Hamilton et al., 2019, Bergas-Massó et al., 2023, or Wang et al., 2015 emit dust of up to 10 µm in diameter with 3.2 to 4.6 wt % of iron). Models sharing similar size ranges (e.g., the IMPACT model in Myriokefalitakis et al., 2018, tracing dust particles up to 20 µm in diameter) result in similar mass ratios (i.e., 2.65 wt %). This enrichment in small size ranges is attributed to the high abundance of phyllosilicates with large structural iron contents (see Table 1). Finally, the use of J2014 (or J2014NN) yields high iron at emissions for comparable size ranges due to the contribution of iron-rich minerals (i.e., chlorite and vermiculite) that are not represented in C1999 and are also due to the higher illite and smectite mass fractions in J2014.
The comparison of our diagnosed total iron with surface concentration observations suggests that C1999 underestimates the elemental iron present in dust. As a result of the higher iron-to-dust ratios, this bias is slightly reduced when we consider J2014NN (see Sect. S7) and gets closer to zero with J2014 on average. By contrast, applying a constant 3.5 wt % of iron in dust would lead to an overestimation of the observed total iron surface concentration (Fig. 13). The spatiotemporal variability of the modeled iron is primarily driven by the ability of the model to derive the dust fields; for this reason, the correlation of the diagnosed iron surface concentration is close in all the experiments and in the case of the homogeneous dust.
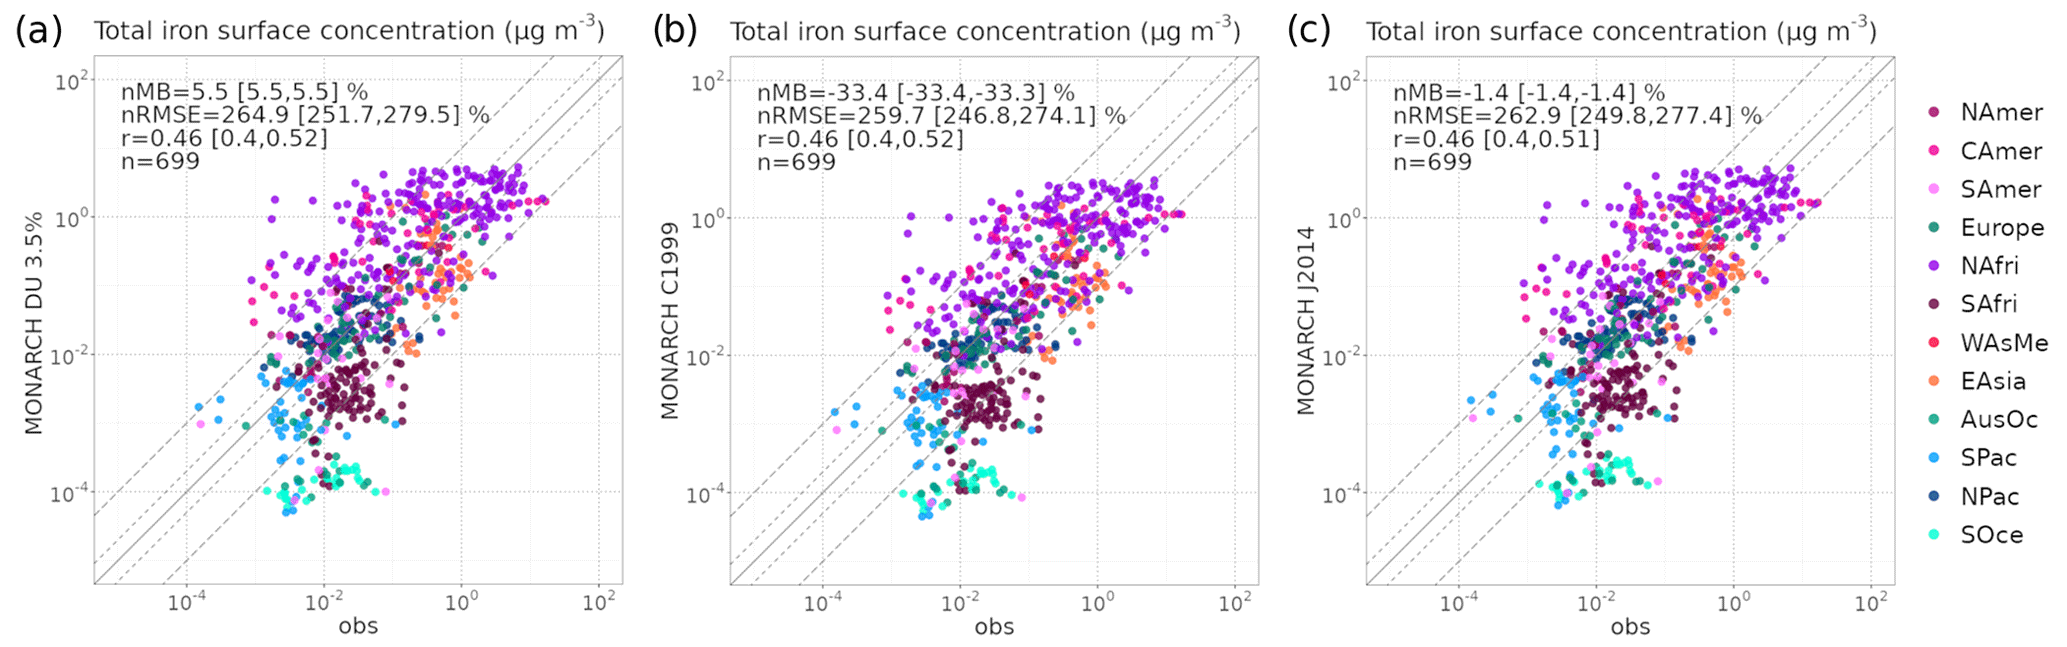
Figure 13Diagnostic of the total iron surface concentration (µg m−3) associated with the MONARCH-modeled (a) dust with an average of 3.5 wt % of iron content, (b) C1999 and (c) J2014 dust mineralogy compared with the observations compiled in Myriokefalitakis et al. (2018) identified as dust-dominated (see Fig. 1c and Sect. 4.4), where n is the number of measurements, nRMSE is the normalized root mean square error, nMB is the normalized mean bias, and r is the correlation over all the points. The ranges for the nMB, nRMSE and r correspond to the 95 % confidence level (see Sect. S1 for details). Regions are depicted in Fig. 1c. Dashed lines represent differences of 2 times and 1 order of magnitude.
In line with the emission, globally the amount of total iron deposited in J2014 (and J2014NN) is larger than in C1999, at 95.0 (87.0) Tg yr−1 (Fig. 14a and b and Sect. S7). In all the experiments, dry deposition is the predominant removal process (representing 57 % and 58 % of the total iron deposition in C1999 and J2014, respectively). These estimates fall within those reported in previous modeling studies (71.5 ± 43 Tg yr−1) applying both C1999 and J2014NN (Myriokefalitakis et al., 2018), which also highlights the relevance of dry deposition for iron removal of dust origin. Regionally, the largest differences in total iron deposition between C1999 and J2014 occur over the Atlantic and Indian oceans, while over the Southern Ocean (and in general the Southern Hemisphere basins), both soil mineralogy maps yield similarly low total iron deposition fluxes. Our model tends to underestimate the total deposited dust mass in this region (see Fig. 4 and Table S3), which has a direct impact on the estimated total iron deposition fluxes.
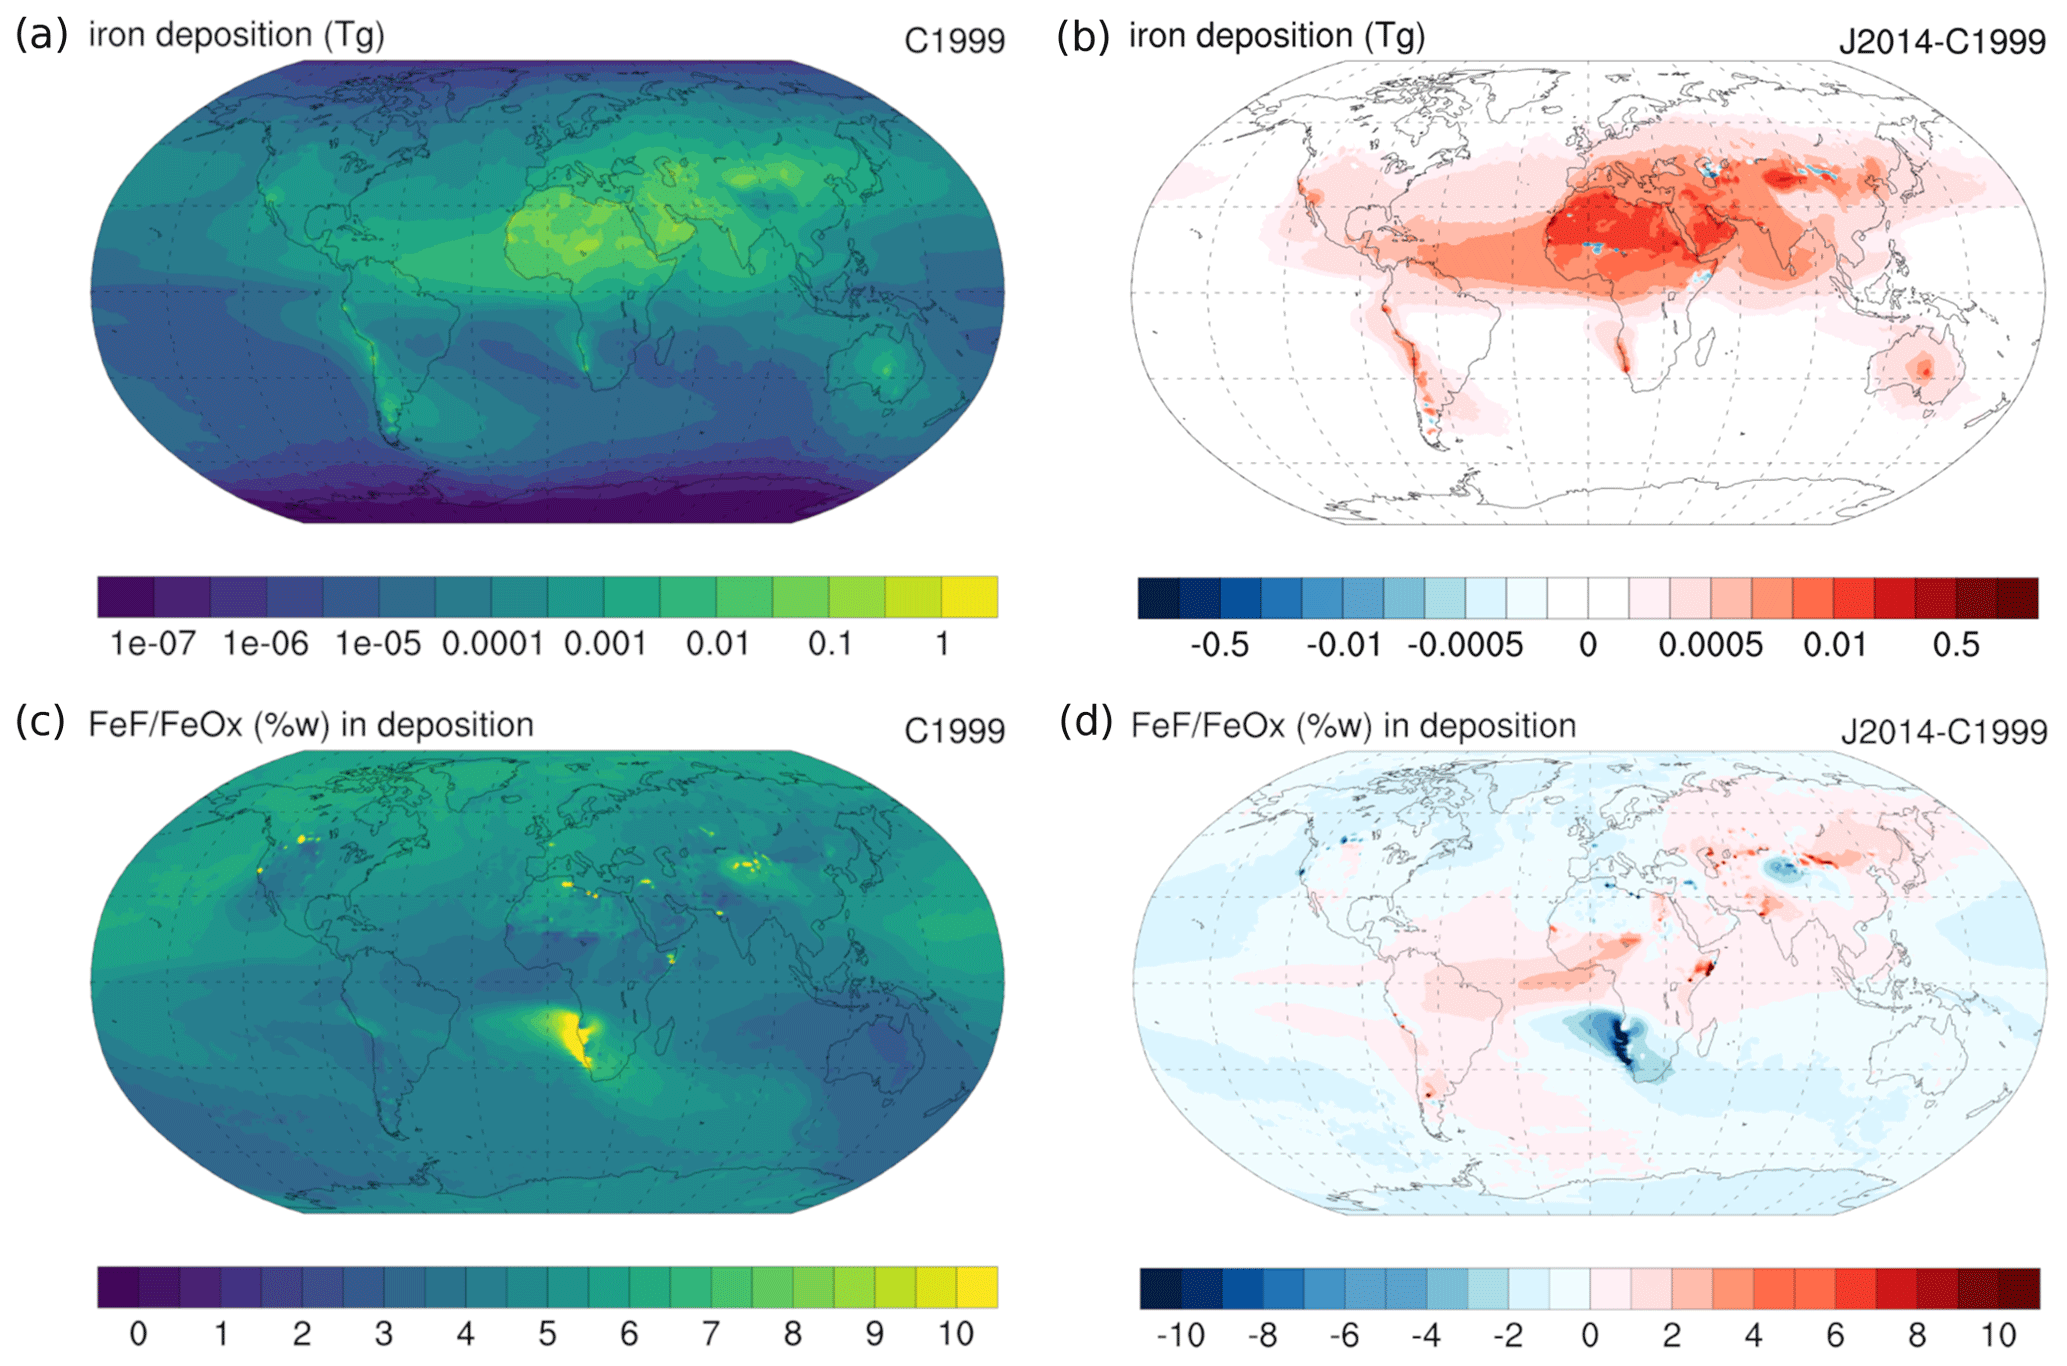
Figure 14Total iron deposition and ratio of ferrihydrite and nano-iron oxides (FeF) over pure crystalline iron oxides (FeOx) according to C1999 (a, c, respectively). Differences compared to J2014 (b, d, respectively). The iron content of phyllosilicate minerals and feldspars is taken from Journet et al. (2014) and for hematite and goethite from Journet et al. (2008). FeF is calculated as the sum of the fast- and intermediate-dissolution iron pools in Ito and Shi (2016), i.e., 1.95 wt % (0.65 wt % and 1.3 wt %, respectively) of the total iron.
Evidence suggests that a small fraction of the iron, present in amorphous and poorly crystalline minerals in the form of ferrihydrite and nano-iron oxides, is soluble and highly reactive. Structural iron, embedded in phyllosilicate matrices, is usually considered more difficult to dissolve, while iron in larger crystalline iron oxide particles (e.g., hematite or goethite) is the most refractory fraction (Shi et al., 2011, 2012; Ito and Xu, 2014). The representation of atmospheric iron dissolution through acidic processing as a three-stage kinetic mechanism (Shi et al., 2011) has been adopted by different atmospheric models (e.g., Myriokefalitakis et al., 2015; Ito and Xu, 2014; Ito and Shi, 2016; Scanza et al., 2018; Myriokefalitakis et al., 2022; Bergas-Massó et al., 2023), which usually partition the total emitted iron into different dissolution pools. Due to the lack of better estimates, the amount of iron in ferrihydrite and nano-iron oxides, which dissolves quickly (FeF), is usually computed as a small fraction of the total iron (e.g., Ito and Shi, 2016; Myriokefalitakis et al., 2022; Bergas-Massó et al., 2023), in line with observational evidence (Shi et al., 2012).
The ratio of poorly, FeF, to highly crystalline iron oxides (FeOx) can be used as a measure of the susceptibility of iron to dissolve but also to characterize the ageing of iron oxides (Shi et al., 2012). Usually, more weathered soils show lower ratios of more reactive iron species, as they are easily transformed into more stable forms. Over northern Africa, the C1999 experiment shows more ageing for the Sahel region, i.e., a lower fraction of highly reactive (FeF) over crystalline iron oxides (FeOx) and potentially lower solubility, while in J2014 the contrast between the Sahara and Sahel areas is less visible (Fig. 14c and d). In J2014, the Bodélé depression is characterized by a high ratio. Both features are consistent with the observations (Shi et al., 2012) and are in line with our previous analyses of the crystalline iron oxides (Sect. 5.3.3).
In addition to the susceptibility of iron dissolution owing to its morphology, the acidity of the aerosols is a key factor controlling the solubilization process (Journet et al., 2008; Myriokefalitakis et al., 2022; Bergas-Massó et al., 2023). Alkaline compounds in dust (such as calcite) can act as buffering species for acidic conditions. The higher levels of calcite in J2014 (Fig. 8) could potentially result in more basic aerosol pH and a reduced solubilization of iron through acidic attack.
Representing the mineralogy of atmospheric dust in Earth system models requires information on the size-resolved composition of the uppermost layer of the parent soils. This work examines three variations of currently available soil mineralogy maps in a set of otherwise identical modeling experiments. Our reference maps are C1999-SMA, from Claquin et al. (1999) and Nickovic et al. (2012), and two variations of J2014-SMA, from Journet et al. (2014). These maps constitute our best knowledge to date of the parent soils' composition at a global scale, even though they are derived by extrapolation of a scarce set of soil mineralogy observations and thus present large uncertainties. Despite these uncertainties, we show here that they share some common robust properties. For our modeled dust size range (up to 20 µm in diameter), quartz is consistently the most abundant mineral (wt %) at emission, independently of the source region and soil map used. Also, the phyllosilicates (illite, kaolinite and smectite with C1999-SMA plus vermiculite, chlorite and mica with J2014-SMA) show a similar distribution amongst our experiments. Globally, illite is more abundant than kaolinite and smectite. The largest uncertainties are related to less abundant minerals, such as feldspars, calcite and particularly the iron oxides. One of the variants of the J2014-SMA map considers the raw mineralogical information provided by the soil observations without normalizing their relative contributions to constituting the whole emitted dust mass. Using that information, we assess that at the global scale almost 10 % of the total emitted dust has an undetermined composition. The unknown fraction can be regionally higher, suggesting that in some areas our knowledge of the composition of dust sources is more robust than in others.
The emitted size distribution of the minerals is a key factor controlling their geographical distribution and lifetimes. Coarse-grained minerals, such as quartz, feldspars or calcite, are preferentially removed from the atmosphere by gravitational settling, hence showing higher abundances close to sources. In contrast, smaller clay size phyllosilicates remain longer in the atmosphere and constitute a large fraction of the dust transported to remote regions. The current SMAs provide a crude estimate of the soil size distribution for each mineral, distinguishing exclusively between the clay and silt size classes. In addition, the analyses applied to the soil samples often result in a disaggregation of soil aggregates that is much more intense than that caused by wind erosion, thereby overemphasizing the abundance of fine phyllosilicate fractions in soils compared to their presence in equivalent aerosol sizes. By applying brittle fragmentation theory (BFT) to derive the emitted size distribution for each mineral, we partially overcome this issue. BFT restores phyllosilicates at coarser sizes and decreases at the same time the mass fractions of typically coarse minerals. Even with this reaggregation, in all our experiments, the model overestimates the observed quartz mass fractions at coarse sizes and underestimates those at the finer ones (below 2 µm). This bias is attributed to the poor representation of the minerals' size distribution in the soils, which neglects the increased abundance of quartz with size. The SMAs provide a constant quartz proportion for soil grains from 2 up to 63 µm in diameter, which is likely too large for the smallest silt particles. As a consequence of the overestimation of the relative fraction of quartz, the model underestimates other typically coarse minerals over the same size ranges, e.g., feldspars. Further extensions of BFT are planned, particularly in the description of the soil mineral size distributions, which we expect will yield a more realistic size distribution of the emitted minerals.
The comparison with observations suggests that C1999 represents the phyllosilicates best. In particular, kaolinite is also qualitatively in agreement with the expected distribution in soils; i.e., higher mass fractions correspond to regions of intense weathering. Feldspar abundance shows a larger spatial variability and slightly lower errors with C1999-SMA; we attribute this to the particularly sparse information for the silt size fraction in J2014-SMA, which required extensions in many cases through the use of averages over multiple soil classes. However, the size apportionment in C1999-SMA excluded feldspars from the finer soil fractions, which results in a poor correlation with observations in size and space. Calcite levels are overall better reproduced with J2014-SMA, with large underestimations in C1999. Both maps represent qualitatively known variations of calcite in northern African soils (with higher mass fractions over the Sahara than in the Sahel).
The available observations of iron oxides are scarce and do not allow for a comprehensive assessment; however, the iron oxide apportionment provided in J2014-SMA seems to be in better agreement with recent evidence than the C1999-SMA database. The majority of observations suggest that goethite is more abundant than hematite in soils and that the latter is usually confined to the smaller sizes, whereas goethite appears in both the fine and coarse fractions. Also, if hematite with C1999-SMA and hematite plus goethite with J2014-SMA are both compared to observations of total iron oxides, the latter provides slightly better correlation in size and space. Over relevant northern African dust sources, the regional variations described by the two soil maps differ, and while C1999-SMA represents better the higher iron oxide content of the weathered Sahelian soils, J2014-SMA identifies the Bódélé depression as depleted in iron oxides, and both features are consistent with the observational evidence.
The iron oxide abundance is directly associated with the dust absorption properties in the SW, and therefore our estimates of dust SSA in the UV-VIS band are impacted by the choice of the soil map. Despite the poor spatiotemporal correlation with AERONET-derived SSA, likely due to inaccuracies in the current prescription of iron oxide soil content, considering mineralogy variations increases the regional and temporal variability of dust SSA compared to that of a compositionally homogeneous dust species, bringing the model SSA range closer to the observed one.
Our analyses support the need for more observations of iron oxides in soils and airborne dust, ideally providing information not only on the bulk iron oxide masses, but also on their speciation (e.g., in hematite and/or goethite) and size distribution. Improved soil mineralogy maps, such as those that will arise from high-quality spaceborne hyperspectral measurements in the framework of the NASA Earth Surface Mineral Dust Source Investigation (EMIT) project (Green et al., 2020) and field measurements of the emitted dust PSD and its composition (e.g., Panta et al., 2023; González-Flórez et al., 2023), will strongly contribute towards constraining the effects of dust mineralogy on climate.
All in all, the mineralogy of atmospheric dust shows significant regional variations. Neglecting those variations in modeling frameworks can affect not only our estimates of the regional variability of dust absorption of solar radiation, but also the total iron emission and the chemical interactions that lead to its solubilization in the atmosphere. The abundance of minerals such as quartz or feldspars within mixed-phase clouds, which is influenced by their size distribution, impacts ice formation (Chatziparaschos et al., 2023), which remains an important source of uncertainty in current model estimates of the climate forcing.
A1 Main features of the soil mineralogy atlases used in this study
The soil mineralogy atlases used in this work come from Claquin et al. (1999), with revisions from Nickovic et al. (2012) for C1999-SMA and from Journet et al. (2014) for J2014-SMA. While C1999-SMA provides information on eight minerals (illite, smectite, kaolinite, quartz, feldspars, calcite, gypsum and hematite) for arid and semi-arid regions, J2014-SMA reports four additional minerals (chlorite, smectite, mica and goethite) with global coverage (Table A1).
Table A1Main characteristics of the C1999-SMA and J2014-SMA soil mineralogy atlases.
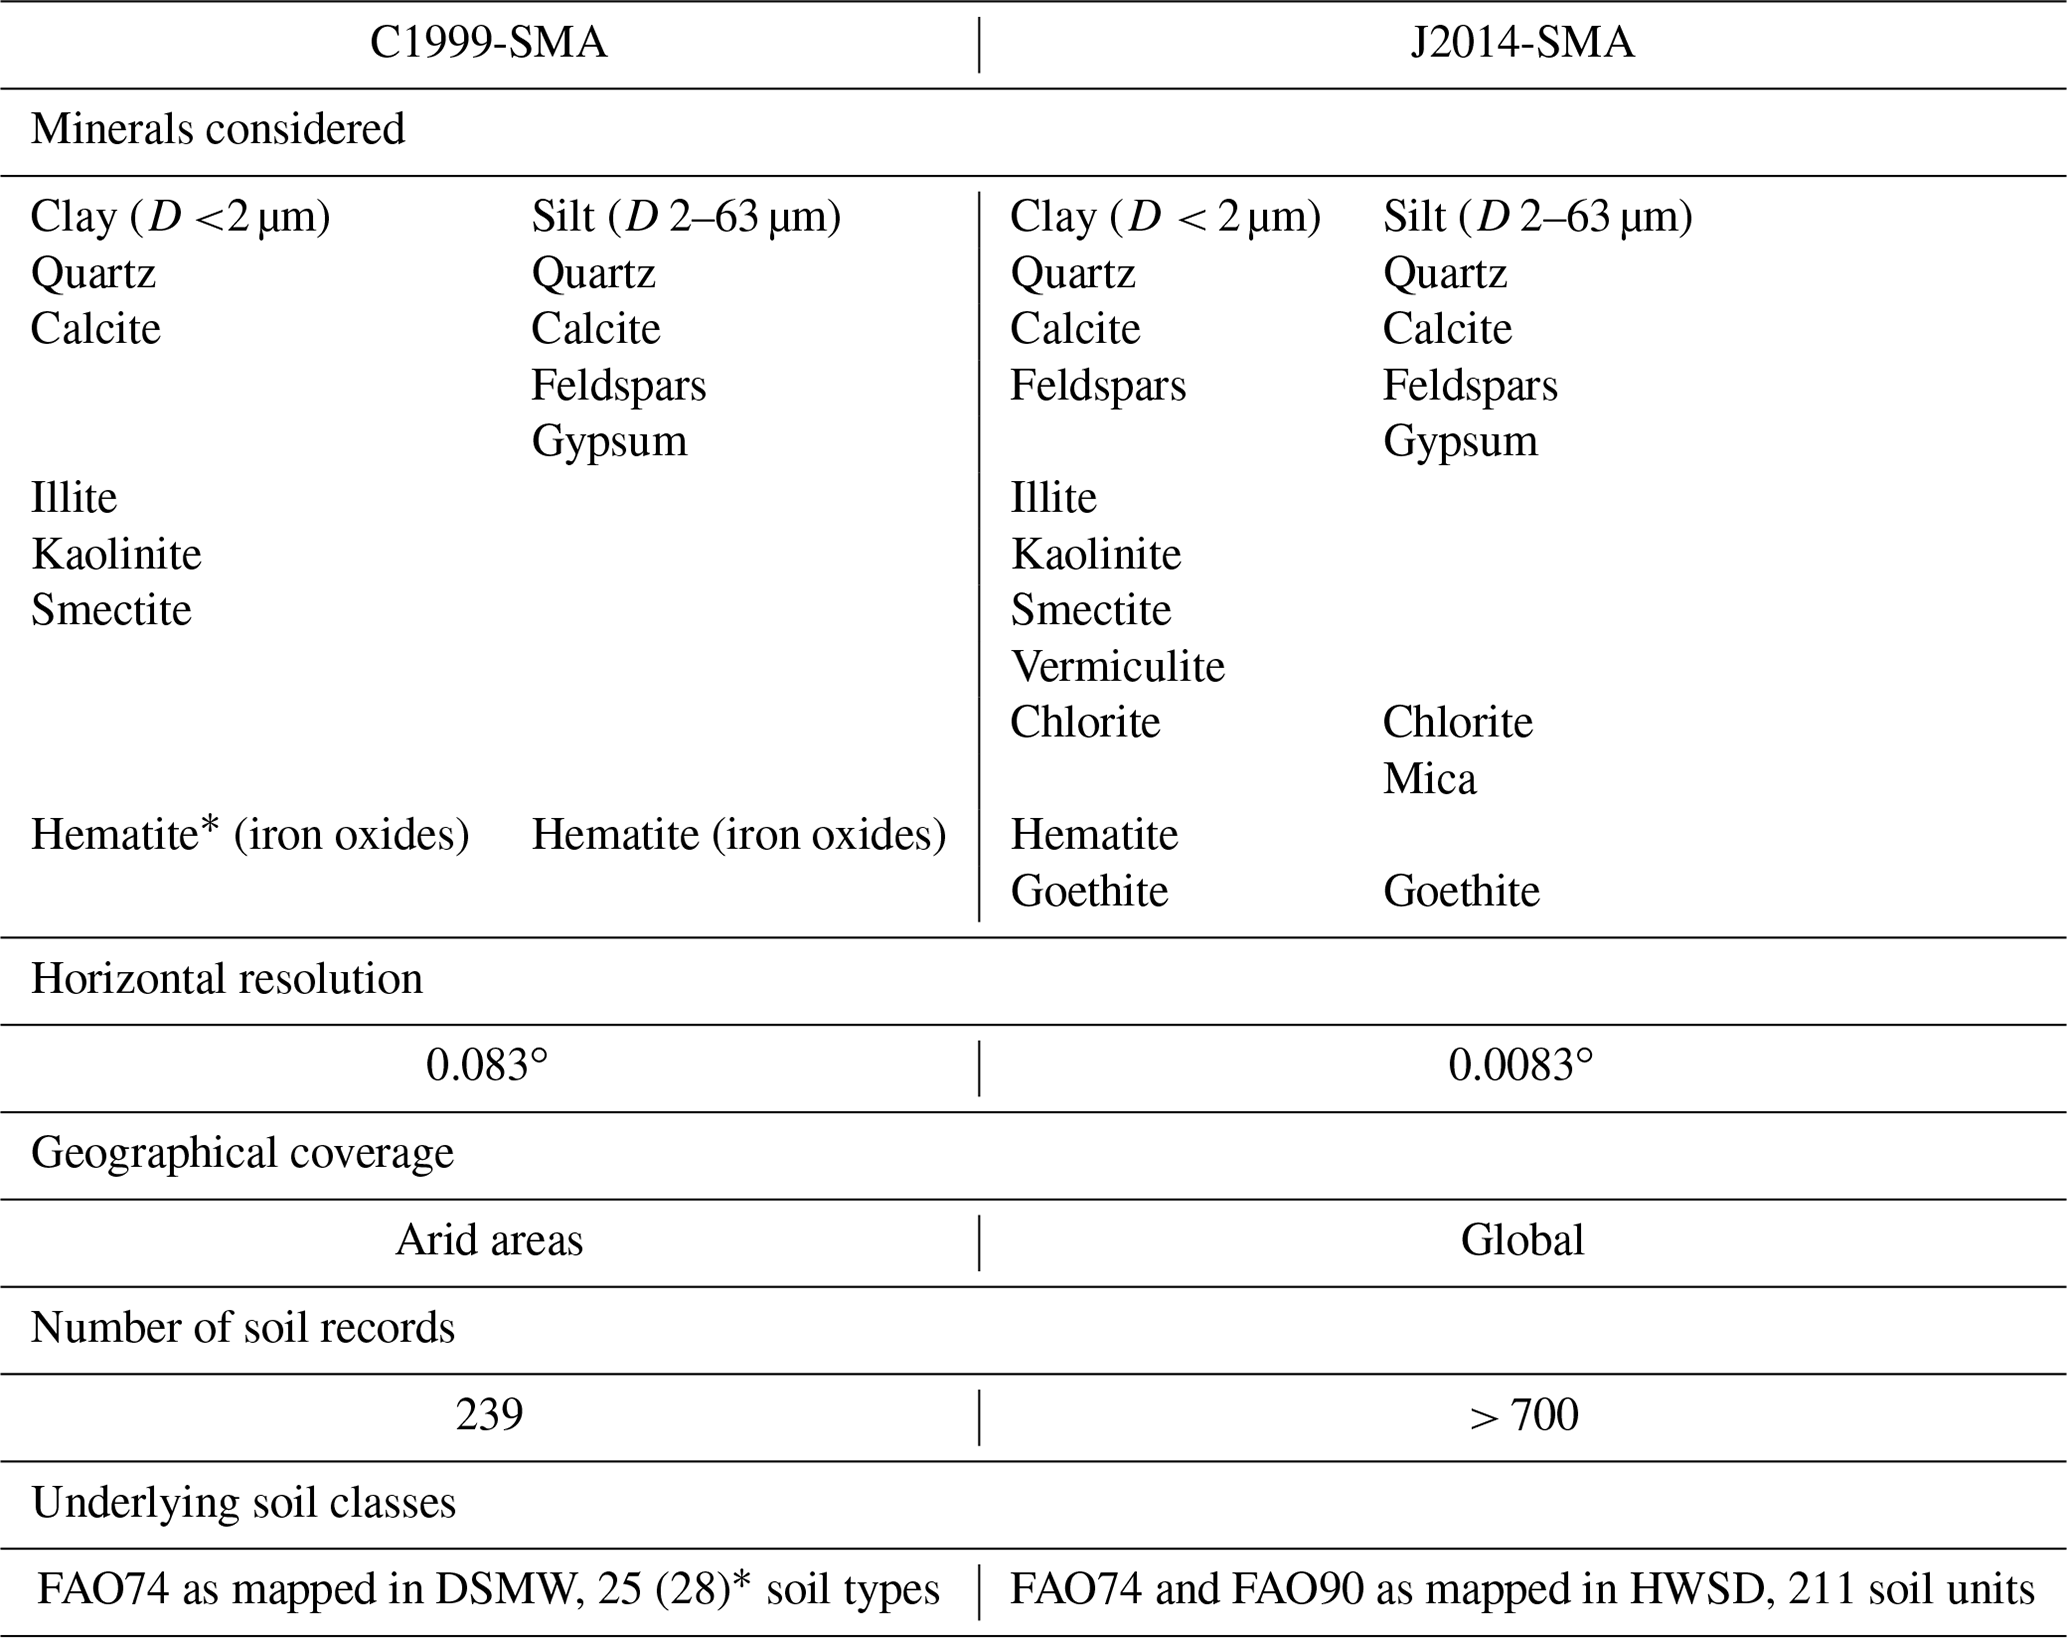
* Originally, Claquin et al. (1999) reported the mean mineralogy for 25 soil types, and Nickovic et al. (2012) added 3 more types while extending the same hematite fraction as in silt to the clay size category and referring to both as total iron oxides.
These maps give information on the mineralogy in two size classes of the soil: clay (up to 2 µm in diameter) and silt (from 2 to 63 µm in diameter). The minerals are distributed in the same size ranges in both SMAs, except for feldspars, which are only present in silt sizes in C1999-SMA but also in clay in J2014-SMA. Iron oxides, identified as hematite, are present in both the clay and silt sizes of the soil in C1999-SMA, while J2014-SMA distinguishes hematite, in the clay, from goethite, in both the clay and silt fractions.
Both SMAs describe the mineralogy of the soil after gathering mineral soil descriptions available in the literature and associating them with soil types from existing soil classification systems (i.e., from FAO). Once they attribute a mean mineralogy to a specific soil type, the geographical distribution of that soil type is used to create a map of soil composition over either arid and semi-arid regions (C1999-SMA) or else globally (J2014-SMA).
Claquin et al. (1999) use 239 soil descriptions to derive the mean mineralogical composition for 25 soil types (FAO-UNESCO, 1974) provided by the FAO Digital Soil Map of the World (DSMW) (FAO-UNESCO, 1995). From the original analyses found in the literature, they are able to provide mineralogical information for approximately 80 % of the soil types identified as arid or semi-arid. They complete the mean mineralogy for the missing soil types by applying empirical relationships, e.g., inferring the apportionment of calcite in the clay and silt soil sizes or the quartz and feldspar ratio from soil texture information and associating the soil hematite content with information about soil redness.
Nickovic et al. (2012) extend the original dataset of Claquin et al. (1999), adding three new soil types (Yermosols, Haplic Yermosols and Xerosols) that also have a presence in arid and semi-arid regions, and attribute the same amount (wt %) of hematite to the clay fraction as reported in Claquin et al. (1999) for the silt size faction.
The horizontal resolution of the FAO DSMW and thus of the C1999-SMA dataset is 0.083∘ (∼ 10 km at mid-latitudes). Note that the increased resolution available in Nickovic et al. (2012) results from the remapping of the FAO data onto a higher-resolution grid (0.0083∘, ∼ 1 km at mid-latitudes) to be compatible with soil texture data at that higher resolution, so that the higher-resolution spatial variations are rarely the result of abundant mineral measurements.
Journet et al. (2014) relate soil mineral composition to the soil unit attribute rather than the soil type used by C1999-SMA, also relying on the FAO soil classification system but updating the information source to the Harmonized World Soil Database (HWSD) version 1.1 (FAO/IIASA/ISRIC/ISSCAS/JRC, 2009), a raster with a native spatial resolution of 0.0083∘ (∼ 1 km at mid-latitudes). In this work, we have applied the HWSD version 1.2 (FAO/IIASA/ISRIC/ISSCAS/JRC, 2012) for convenience. However, there are no differences regarding the soil unit mapping. Worldwide coverage is provided through the combination of the original FAO74 system (FAO-UNESCO, 1974) and the updated FAO90 system (FAO-UNESCO, 1997) and uses 220 soil units, although 9 of them correspond to classes that are not relevant for mineralogy modeling (i.e., glaciers, water bodies, rock outcrops, urban or humanly disturbed areas and non-information classes), leaving a total of 211 soil units to consider.
The mean mineralogy provided by Journet et al. (2014) relies on more than 700 soil descriptions that allow them to sample 55 % of the FAO soil units and to extend and/or improve the geographical coverage of Claquin et al. (1999). To complete the missing information, they apply similar approaches to Claquin et al. (1999), again relying on soil texture data, soil color for iron oxides and in-lab analyses (e.g., for the apportionment of iron oxides in hematite and goethite). Information on chlorite, mica, quartz and feldspars in the silt sizes is assigned for many soil units as an average of the mass fractions of the major soil groups or the full silt dataset. Journet et al. (2014) further extend the mineralogy of the clay fraction by providing two alternative maps. In this work, we rely on CASE2, which assigns the mineralogy of the major soil group to those soil units with missing information.
The increased number of soil classes in Journet et al. (2014) as compared to Claquin et al. (1999) and Nickovic et al. (2012) results in comparable or lower sample sizes than the characterization of the mineralogy per soil unit. Consequently, the resulting mean mineralogy is not necessarily more robust despite the increased number of soil descriptions used. Moreover, the spatial distribution of some soil units differs between the DSMW and the HWSD, which affects the resulting mineralogy maps. Finally, the increased geographical variability, expected due to the application of a higher-resolution soil class map, is for some minerals buffered due to the extrapolations done by averaging the limited measurements of mineralogical composition over multiple soil units.
A2 Changes included in the original soil mineralogy atlases
Our method to project the soil composition into the emitted size distribution redistributes the minerals in the clay sizes towards coarser aerosol diameters to account for the disturbed soil size distribution reported in the soil maps (see Sect. 2.3.2). To apply this method, we need the minerals to be identified in both the clay and silt sizes of the soil. Therefore we modify the C1999-SMA and J2014-SMA to account for feldspars and hematite in both soil size classes, which will produce a more realistic emitted size distribution of these minerals but also for gypsum. Gypsum is usually associated with the coarser silt soil fraction; we also add it to the clay, although its presence there is minimal. Given the low abundance of this mineral in the soil maps, we do not expect a significant impact on the other clay size mineral abundances.
Table A2Corrected clay size mineralogy associated with the Acrisols Haplic soil unit in J2014-SMA (wt %).

In C1999-SMA we infer a fraction of feldspars in the clay sizes (feldspars) for each soil type (i) that considers the fraction in the silt (feldspars) and scales it according to the distribution of quartz in the clay (quartz) and silt (quartz) fractions (Eq. A1). We apply the same approach to the J2014-SMA soil units that have inferred feldspar information in the silt but not in the clay.
In both C1999-SMA and J2014-SMA, the clay fraction of gypsum (gypsum) in each soil type (i) is obtained by scaling the corresponding silt fraction (gypsum) by the ratio of calcite in clay (calcite) and silt (calcite) fractions (Eq. A2).
Hematite is added in the C1999-SMA to the clay fraction in the same proportion as it is present in the silt, following Nickovic et al. (2012). The added amount of feldspars and gypsum in C1999-SMA and J2014-SMA and of hematite in C1999-SMA is proportionally removed from the rest of the minerals present in the clay fraction.
When generating the J2014-SMA map, we found small differences by combining the HWSDv1.2 FAO codes with the mean mineralogy table provided in Journet et al. (2014) and the actual maps published in their work. Some of the differences in the clay fraction arise from a typo in the article for the Acrisols Haplic composition (Table A2), which influences mainly the mineralogy of soils over the Amazon region or central Africa. Also, in their analyses, the mass fractions of calcite and goethite in the silt sizes for Fluvisols, Calcisols Haplic, Andosols and Luvisols Orthic are derived from extensions of the original dataset. In this revision process, we decided to keep the original values reported in the Supplement of the article (Journet et al., 2014), which are derived from the compilation of soil descriptions.
The HWSDv1.2 raster provides high-resolution information on the geographical distribution of the FAO90 and FAO74 soil units by code. Correspondence between those numerical codes and the actual soil units is provided in the HWSDv1.2 database. During the revision, we detected a discrepancy in the HWSDv1.2 database, in which the FAO74 codes for the Fluvisols units differ depending on the source of information (i.e., the HWSD_DATA compared to the D_SYMBOL74 data sheets). After correspondence with the database developers, we confirmed that the correct assignations for those soil units are FAO74 code 147, Fluvisols Eutric (Je), code 148, Fluvisols Calcaric (Jc), and code 149, Fluvisols Dystric (Jd).
Figures S6 to S11 show the distribution of mineral fractions in the clay and silt sizes for C1999-SMA and J2014-SMA (normalized) after this revision process, considering the dominant soil types at a 0.5∘ × 0.5∘ resolution. The soil maps at 0.0833∘ × 0.0833∘ resolution are provided in netCDF files (see the Data availability section for details).
C1999-SMA and J2014-SMA used and revised in this work and mapped at 0.0833∘ × 0.0833∘ horizontal resolution, as well as the size-distributed multiannual means of the atmospheric mass mineral fractions from the C1999 and J2014 experiments at different pressure levels, are available at Zenodo (Gonçalves Ageitos et al., 2023, https://doi.org/10.5281/zenodo.8091828).
The supplement related to this article is available online at: https://doi.org/10.5194/acp-23-8623-2023-supplement.
MGA: conceptualization, formal analysis, investigation, methodology, software, validation, visualization, funding acquisition, resources, supervision, writing – original draft preparation. VO: conceptualization, formal analysis, investigation, methodology, validation, visualization, writing – review and editing. RLM: conceptualization, methodology, supervision, writing – review and editing. OJ, MD, MK, SB, EDT, JE: methodology, software, writing – review and editing. FM, GM: software, data curation. YB, JP: methodology, writing – review and editing. NMM, ROG, DRT: writing – review and editing. CPGP: conceptualization, formal analysis, methodology, funding acquisition, resources, supervision, project administration, writing – review and editing.
At least one of the (co-)authors is a member of the editorial board of Atmospheric Chemistry and Physics. The peer-review process was guided by an independent editor, and the authors also have no other competing interests to declare.
Publisher’s note: Copernicus Publications remains neutral with regard to jurisdictional claims in published maps and institutional affiliations.
We thank Akinori Ito and the anonymous reviewer who, with their comments, contributed to improving this paper's quality.
The authors are grateful to the AERONET and RSMAS PI(s) and their staff for establishing and maintaining the sites and data used in this investigation. PM10 measurements in Banizoumbou (Niger), Cinzana (Mali) and M'Bour (Senegal) were performed in the framework of the French National Observatory Service INDAAF (International Network to study Deposition and Atmospheric composition in AFrica; https://indaaf.obs-mip.fr/, last access: 6 December 2022) piloted by LISA and LAERO and supported by the INSU/CNRS, the IRD, the Observatoire Midi-Pyrénées and the Observatoire des Sciences de l'Univers EFLUVE. We also thank the Harmonized World Soil Database developers from the FAO, IIASA, ISRIC-World Soil Information, the Institute of Soil Science, the Chinese Academy of Sciences (ISSCAS) and the Joint Research Centre of the European Commission (JRC) for openly publishing their data and for answering our queries. Part of the data processing and analysis in this work has used different R (R Core Team, 2021) packages, climate data operators (CDOs, Schulzweida, 2022), NetCDF operators (NCOs, Zender, 2008) and the NCAR command language (NCL, UCAR/NCAR/CISL/VETS, 2019).
This work was funded by the European Research Council (ERC) under the Horizon 2020 research and innovation program through the ERC Consolidator Grant FRAGMENT (grant agreement no. 773051), the AXA Research Fund through the AXA Chair on Sand and Dust Storms at the Barcelona Supercomputing Center (BSC), the Spanish Ministerio de Economía y Competitividad through the NUTRIENT project (CGL2017-88911-R), the European Union’s Horizon 2020 research and innovation program under grant agreement no. 821205 (FORCeS), the European Space Agency (ESA) through the DOMOS project (ESA AO/1-10546/20/I-NB) and the Department of Research and Universities of the Government of Catalonia via the Research Group Atmospheric Composition (code 2021 SGR 01550).
María Gonçalves Ageitos, Vincenzo Obiso, Ron L. Miller, Martina Klose, Jan Perlwitz, Natalie M. Mahowald, Robert O. Green, David R. Thompson and Carlos Pérez García-Pando also thank the National Aeronautics and Space Administration (NASA) EMIT project, which is supported by the NASA Earth Venture Instrument program under the Earth Science Division of the Science Mission Directorate. A portion of this research was carried out at the Jet Propulsion Laboratory (JPL), California Institute of Technology, under a contract with NASA (80NM0018D0004TS14). Ron L. Miller and Vincenzo Obiso received support from the NASA Modeling, Analysis and Prediction program (NNG14HH42I), as well as Jan Perlwitz (grant no. 80NSSC19K0056), who was also supported by the NASA Atmospheric Composition Modeling and Analysis program (grant no. 80NSSC19K0984). Vincenzo Obiso was supported by the NASA Postdoctoral Program at the NASA Goddard Institute for Space Studies administered by Oak Ridge Associated Universities under contract with NASA (80HQTR21CA005). Jerónimo Escribano, Martina Klose and Matt Dawson received funding from the European Union’s Horizon 2020 research and innovation program under the Marie Sklodowska-Curie grant agreement nos. H2020-MSCA-COFUND-2016-754433, H2020-MSCA-IF-2017-789630 and H2020-MSCA-IF-2016-747048, respectively. Martina Klose received further support through the Helmholtz Association’s Initiative and Networking Fund (grant no. VH-NG-1533). Natalie M. Mahowald was supported by US DOE DE-SC0021302.
We thank all the members of the Computational Earth Sciences and Atmospheric Composition groups of the BSC for their help in designing, creating and maintaining the infrastructure that makes the simulations and analyses presented here possible. In particular, we would like to mention Aleix Bou, Roger Garatachea, Calum Meikle, Carles Tena and Marc Guevara for their valuable contributions to developments and discussions related to this work. We would also like to thank Emilie Journet for her kind advice in the review process of the soil mineralogy map.
Finally, PRACE (eDUST, eFRAGMENT1 and eFRAGMENT2) and RES (AECT-2020-3-0020 and AECT-2022-3-0013) awarded us access to MareNostrum at the BSC and provided technical support.
This research was supported by the European Commission’s Horizon 2020 framework program (grant nos. 773051, 821205, H2020-MSCA-COFUND-2016-754433, H2020-MSCA-IF-2017-789630 and H2020-MSCA-IF-2016-747048), the National Aeronautics and Space Administration (grant nos. NNG14HH42I, 80NM0018D0004TS14, 80NSSC19K0056, 80NSSC19K0984, 80HQTR21CA005) as well as the EMIT project from the NASA Earth Venture Instrument program under the Earth Science Division of the Science Mission Directorate, the US DOE DE-SC0021302 project, the Ministerio de Economía y Competitividad of Spain (grant no. CGL2017-88911-R), the European Space Agency (grant no. ESA AO/1-10546/20/I-NB), the Department of Research and Universities of the Government of Catalonia through the Atmospheric Composition Research Group (code 2021 SGR 01550), the Helmholtz Association (grant no. VH-NG-1533), and the AXA Research Fund through the AXA Chair on Sand and Dust Storms at the Barcelona Supercomputing Center (BSC).
This paper was edited by Toshihiko Takemura and reviewed by Akinori Ito and one anonymous referee.
Albani, S., Mahowald, N. M., Perry, A., Scanza, R. A., Zender, C. S., Heavens, N., Maggi, V., Kok, J. F., and Otto-Bliesner, B.: Improved dust representation in the Community Atmosphere Model, J. Adv. Model. Earth Sy., 6, 541–570, https://doi.org/10.1002/2013MS000279, 2014. a, b, c, d
Arimoto, R., Duce, R. A., Ray, B. J., Ellis, W. G., Cullen, J. D., and Merrill, J. T.: Trace elements in the atmosphere over the North Atlantic, J. Geophys. Res., 100, 1199–1213, https://doi.org/10.1029/94JD02618, 1995. a
Atkinson, J. D., Murray, B. J., Woodhouse, M. T., Whale, T. F., Baustian, K. J., Carslaw, K. S., Dobbie, S., O'Sullivan, D., and Malkin, T. L.: The importance of feldspar for ice nucleation by mineral dust in mixed-phase clouds, Nature, 498, 355–258, https://doi.org/10.1038/nclimate2153, 2013. a, b, c, d, e
Badia, A. and Jorba, O.: Gas-phase evaluation of the online NMMB/BSC-CTM model over Europe for 2010 in the framework of the AQMEII-Phase2 project, Atmos. Environ., 115, 657–669, https://doi.org/10.1016/j.atmosenv.2014.05.055, 2015. a
Badia, A., Jorba, O., Voulgarakis, A., Dabdub, D., Pérez García-Pando, C., Hilboll, A., Gonçalves, M., and Janjic, Z.: Description and evaluation of the Multiscale Online Nonhydrostatic AtmospheRe CHemistry model (NMMB-MONARCH) version 1.0: gas-phase chemistry at global scale, Geosci. Model Dev., 10, 609–638, https://doi.org/10.5194/gmd-10-609-2017, 2017. a
Bergas-Massó, E., Gonçalves Ageitos, M., Myriokefalitakis, S., Miller, R. L., van Noije, T., Le Sager, P., Montané, G., and Pérez García-Pando, C.: Pre-industrial, present and future atmospheric soluble iron deposition and the role of aerosol acidity and oxalate under CMIP6 emissions, Earths Future, 11, e2022EF003353, https://doi.org/10.1029/2022EF003353, 2023. a, b, c, d, e, f, g, h
Berrisford, P., Dee, D., Fielding, K., Fuentes, M., Kallberg, P., Kobayashi, S., and Uppala, S.: The ERA-Interim Archive, Tech. Rep. 1, https://www.ecmwf.int/en/elibrary/73681-era-interim-archive (last access: 20 July 2023), 2009. a
Betts, A. K.: A new convective adjustment scheme. Part I: Observational and theoretical basis, Q. J. Roy. Meteor. Soc., 112, 677–691, https://doi.org/10.1002/qj.49711247307, 1986. a
Betts, A. K. and Miller, M. J.: A new convective adjustment scheme. Part II: Single column tests using GATE wave, BOMEX, ATEX and arctic air-mass data sets, Q. J. Roy. Meteor. Soc., 112, 693–709, https://doi.org/10.1002/qj.49711247308, 1986. a
Caquineau, S., Gaudichet, A., Gomes, L., Magonthier, M. C., and Chatenet, B.: Saharan dust: Clay ratio as a relevant tracer to assess the origin of soil-derived aerosols, Geophys. Res. Lett., 25, 983–986, https://doi.org/10.1029/98GL00569, 1998. a
Caquineau, S., Gaudichet, A., Gomes, L., and Legrand, M.: Mineralogy of Saharan dust transported over northwestern tropical Atlantic Ocean in relation to source regions, J. Geophys. Res., 107, 4251, https://doi.org/10.1029/2000JD000247, 2002. a, b
Chatziparaschos, M., Daskalakis, N., Myriokefalitakis, S., Kalivitis, N., Nenes, A., Gonçalves Ageitos, M., Costa-Surós, M., Pérez García-Pando, C., Zanoli, M., Vrekoussis, M., and Kanakidou, M.: Role of K-feldspar and quartz in global ice nucleation by mineral dust in mixed-phase clouds, Atmos. Chem. Phys., 23, 1785–1801, https://doi.org/10.5194/acp-23-1785-2023, 2023. a, b, c, d, e
Checa-Garcia, R., Balkanski, Y., Albani, S., Bergman, T., Carslaw, K., Cozic, A., Dearden, C., Marticorena, B., Michou, M., van Noije, T., Nabat, P., O'Connor, F. M., Olivié, D., Prospero, J. M., Le Sager, P., Schulz, M., and Scott, C.: Evaluation of natural aerosols in CRESCENDO Earth system models (ESMs): mineral dust, Atmos. Chem. Phys., 21, 10295–10335, https://doi.org/10.5194/acp-21-10295-2021, 2021. a, b
Chester, R., Elderfield, H., Griffin, J. J., Johnson, L. R., and Padgham, R. C.: Eolian dust along the eastern margins of the Atlantic Ocean, Mar. Geol., 13, 91–105, https://doi.org/10.1016/0025-3227(72)90048-5, 1972. a, b, c
Chiapello, I., Bergametti, G., Chatenet, P., Bousquet, P., Dulac, F., and Santos Soares, E.: Origins of African dust transported over the northeastern tropical Atlantic, J. Geophys. Res., 102, 13701–13709, https://doi.org/10.1029/97JD00259, 1997. a
Claquin, T., Schulz, M., and Balkanski, Y. J.: Modeling the mineralogy of atmospheric dust sources, J. Geophys. Res.-Atmos., 104, 22243–22256, https://doi.org/10.1029/1999JD900416, 1999. a, b, c, d, e, f, g, h, i, j, k, l, m, n, o, p, q, r
Colette, A., Collin, G., Blot, E., Meleux, F., Peuch, V.-H., et al.: Copernicus Atmosphere Monitoring Service Regional Air Quality Forecasting System v1.0, in preparation, 2023. a
D'Almeida, G. A.: On the variability of desert aerosol radiative characteristics, J. Geophys. Res., 92, 3107–3026, https://doi.org/10.1029/JD092iD03p03017, 1987. a
Dawson, M. L., Guzman, C., Curtis, J. H., Acosta, M., Zhu, S., Dabdub, D., Conley, A., West, M., Riemer, N., and Jorba, O.: Chemistry Across Multiple Phases (CAMP) version 1.0: an integrated multiphase chemistry model, Geosci. Model Dev., 15, 3663–3689, https://doi.org/10.5194/gmd-15-3663-2022, 2022. a
Dee, D. P., Uppala, S. M., Simmons, A. J., Berrisford, P., Poli, P., Kobayashi, S., Andrae, U., Balmaseda, M. A., Balsamo, G., Bauer, P., Bechtold, P., Beljaars, A. C. M., van de Berg, L., Bidlot, J., Bormann, N., Delsol, C., Dragani, R., Fuentes, M., Geer, A. J., Haimberger, L., Healy, S. B., Hersbach, H., Hólm, E. V., Isaksen, L., Kallberg, P., Köhler, M., Matricardi, M., Mcnally, A. P., Monge-Sanz, B. M., Morcrette, J. J., Park, B. K., Peubey, C., de Rosnay, P., Tavolato, C., Thépaut, J. N., and Vitart, F.: The ERA-Interim reanalysis: Configuration and performance of the data assimilation system, Q. J. Roy. Meteor. Soc., 137, 553–597, https://doi.org/10.1002/qj.828, 2011. a
Di Biagio, C., Boucher, H., Caquineau, S., Chevaillier, S., Cuesta, J., and Formenti, P.: Variability of the infrared complex refractive index of African mineral dust: experimental estimation and implications for radiative transfer and satellite remote sensing, Atmos. Chem. Phys., 14, 11093–11116, https://doi.org/10.5194/acp-14-11093-2014, 2014. a
Di Biagio, C., Formenti, P., Balkanski, Y., Caponi, L., Cazaunau, M., Pangui, E., Journet, E., Nowak, S., Caquineau, S., Andreae, M. O., Kandler, K., Saeed, T., Piketh, S., Seibert, D., Williams, E., and Doussin, J.-F.: Global scale variability of the mineral dust long-wave refractive index: a new dataset of in situ measurements for climate modeling and remote sensing, Atmos. Chem. Phys., 17, 1901–1929, https://doi.org/10.5194/acp-17-1901-2017, 2017. a, b, c, d
Di Biagio, C., Formenti, P., Balkanski, Y., Caponi, L., Cazaunau, M., Pangui, E., Journet, E., Nowak, S., Andreae, M. O., Kandler, K., Saeed, T., Piketh, S., Seibert, D., Williams, E., and Doussin, J.-F.: Complex refractive indices and single-scattering albedo of global dust aerosols in the shortwave spectrum and relationship to size and iron content, Atmos. Chem. Phys., 19, 15503–15531, https://doi.org/10.5194/acp-19-15503-2019, 2019. a, b, c, d, e, f
Di Tomaso, E., Schutgens, N. A. J., Jorba, O., and Pérez García-Pando, C.: Assimilation of MODIS Dark Target and Deep Blue observations in the dust aerosol component of NMMB-MONARCH version 1.0, Geosci. Model Dev., 10, 1107–1129, https://doi.org/10.5194/gmd-10-1107-2017, 2017. a
Di Tomaso, E., Escribano, J., Basart, S., Ginoux, P., Macchia, F., Barnaba, F., Benincasa, F., Bretonnière, P.-A., Buñuel, A., Castrillo, M., Cuevas, E., Formenti, P., Gonçalves, M., Jorba, O., Klose, M., Mona, L., Montané Pinto, G., Mytilinaios, M., Obiso, V., Olid, M., Schutgens, N., Votsis, A., Werner, E., and Pérez García-Pando, C.: The MONARCH high-resolution reanalysis of desert dust aerosol over Northern Africa, the Middle East and Europe (2007–2016), Earth Syst. Sci. Data, 14, 2785–2816, https://doi.org/10.5194/essd-14-2785-2022, 2022. a
Dubovik, O., Holben, B., Eck, T. F., Smirnov, A., Kaufman, Y. J., King, M. D., Tanré, D., and Slutsker, I.: Variability of Absorption and Optical Properties of Key Aerosol Types Observed in Worldwide Locations, J. Atmos. Sci., 59, 590–608, https://doi.org/10.1175/1520-0469(2002)059<0590:VOAAOP>2.0.CO;2, 2002. a
Ek, M. B., Mitchell, K. E., Lin, Y., Rogers, E., Grunmann, P., Koren, V., Gayno, G., and Tarpley, J. D.: Implementation of Noah land surface model advances in the National Centers for Environmental Prediction operational mesoscale Eta model, J. Geophys. Res.-Atmos., 108, 8851, https://doi.org/10.1029/2002JD003296, 2003. a
Escribano, J., Di Tomaso, E., Jorba, O., Klose, M., Gonçalves Ageitos, M., Macchia, F., Amiridis, V., Baars, H., Marinou, E., Proestakis, E., Urbanneck, C., Althausen, D., Bühl, J., Mamouri, R.-E., and Pérez García-Pando, C.: Assimilating spaceborne lidar dust extinction can improve dust forecasts, Atmos. Chem. Phys., 22, 535–560, https://doi.org/10.5194/acp-22-535-2022, 2022. a, b
FAO-UNESCO: Soil Map of the World – Volume I Legend, Food and Agriculture Organization – United Nations Educational Scientific and Cultural Organization, Paris, http://www.fao.org/3/as360e/as360e.pdf (last access: 6 December 2022), 1974. a, b, c, d
FAO-UNESCO: Food and Agriculture Organization – United Nations Educational Scientific and Cultural Organization. Digital Soil Map of the World and Derived Soil Properties, Food and Agriculture Organization – United Nations Educational Scientific and Cultural Organization, Rome, 1995. a, b
FAO-UNESCO: Soil Map of the World, Revised Legend with corrections and updates. World Soil Resources Report 60. FAO, 1988. Reprinted with updates as Technical Paper 20, ISRIC, 1997, Food and Agriculture Organization – United Nations Educational Scientific and Cultural Organization, FAO, Rome, ISRIC, Wageningen, http://www.fao.org/fileadmin/user_upload/soils/docs/isricu_i9264_001.pdf (last access: 6 December 2022), 1997. a, b
FAO/IIASA/ISRIC/ISSCAS/JRC: Harmonized World Soil Database (version 1.1), Food and Agriculture Organization, FAO, Rome, Italy and IIASA, Laxenburg, Austria, https://www.fao.org/3/aq361e/aq361e.pdf (last access: 6 December 2022), 2009. a, b
FAO/IIASA/ISRIC/ISSCAS/JRC: Harmonized World Soil Database (version 1.2), Food and Agriculture Organization, FAO, Rome, Italy and IIASA, Laxenburg, Austria, https://esdac.jrc.ec.europa.eu/ESDB_Archive/Soil_Data/Docs_GlobalData/Harmonized_World_Soi_Database_v1.2.pdf (last access: 6 December 2022), 2012. a
Ferrier, B. S., Jin, Y., Lin, Y., Black, T., Rogers, E., and DiMego, G.: Implementation of a new grid-scale cloud and precipitation scheme in the NCEP Eta Model, in: Proceedings of the 15th Conference on Numerical Weather Prediction, American Meteorological Society, San Antonio (Texas), 15 August 2022, 280–283, 2002. a
Formenti, P., Rajot, J. L., Desboeufs, K., Caquineau, S., Chevaillier, S., Nava, S., Gaudichet, A., Journet, E., Triquet, S., Alfaro, S., Chiari, M., Haywood, J., Coe, H., and Highwood, E.: Regional variability of the composition of mineral dust from western Africa: Results from the AMMA SOP0/DABEX and DODO field campaigns, J. Geophys. Res.-Atmos., 113, 1–12, https://doi.org/10.1029/2008JD009903, 2008. a, b, c, d, e
Formenti, P., Schütz, L., Balkanski, Y., Desboeufs, K., Ebert, M., Kandler, K., Petzold, A., Scheuvens, D., Weinbruch, S., and Zhang, D.: Recent progress in understanding physical and chemical properties of African and Asian mineral dust, Atmos. Chem. Phys., 11, 8231–8256, https://doi.org/10.5194/acp-11-8231-2011, 2011. a, b
Formenti, P., Caquineau, S., Desboeufs, K., Klaver, A., Chevaillier, S., Journet, E., and Rajot, J. L.: Mapping the physico-chemical properties of mineral dust in western Africa: mineralogical composition, Atmos. Chem. Phys., 14, 10663–10686, https://doi.org/10.5194/acp-14-10663-2014, 2014. a, b
Giles, D. M., Sinyuk, A., Sorokin, M. G., Schafer, J. S., Smirnov, A., Slutsker, I., Eck, T. F., Holben, B. N., Lewis, J. R., Campbell, J. R., Welton, E. J., Korkin, S. V., and Lyapustin, A. I.: Advancements in the Aerosol Robotic Network (AERONET) Version 3 database – automated near-real-time quality control algorithm with improved cloud screening for Sun photometer aerosol optical depth (AOD) measurements, Atmos. Meas. Tech., 12, 169–209, https://doi.org/10.5194/amt-12-169-2019, 2019. a, b
Ginoux, P., Chin, M., Tegen, I., Prospero, J. M., Holben, B., Dubovik, O., and Lin, S.-J.: Sources and distributions of dust aerosols simulated with the GOCART model, J. Geophys. Res., 106, 20255, https://doi.org/10.1029/2000JD000053, 2001. a, b
Ginoux, P., Prospero, J. M., Gill, T. E., Hsu, N. C., and Zhao, M.: Global scale attribution of anthropogenic and natural dust sources and their emission rates based on MODIS Deep Blue aerosol products, Rev. Geophys., 50, 3005, https://doi.org/10.1029/2012RG000388, 2012. a, b
Go, S., Lyapustin, A., Schuster, G. L., Choi, M., Ginoux, P., Chin, M., Kalashnikova, O., Dubovik, O., Kim, J., da Silva, A., Holben, B., and Reid, J. S.: Inferring iron-oxide species content in atmospheric mineral dust from DSCOVR EPIC observations, Atmos. Chem. Phys., 22, 1395–1423, https://doi.org/10.5194/acp-22-1395-2022, 2022. a
Gomes, L. and Gillette, D. A.: A comparison of characteristics of aerosol from dust storms in Central Asia with soil-derived dust from other regions, Atmos. Environ., 27, 2539–2544, https://doi.org/10.1016/0960-1686(93)90027-V, 1993. a, b
Gonçalves Ageitos, M., Obiso, V., Miller, R. L., Jorba, O., Klose, M., Dawson, M., Balkanski, Y., Perlwitz, J., Basart, S., Di Tomaso, E., Escribano, J., Macchia, F., Montané, G., Meikle, C., Mahowald, N. M., Green, R. O., Thompson, D. R., and Pérez García-Pando, C.: Modeling dust mineralogical composition: sensitivity to soil mineralogy atlases and their expected climate impacts. Soil and airborne mineral fraction datasets, Zenodo [data set], https://doi.org/10.5281/zenodo.8091828, 2023.
González-Flórez, C., Klose, M., Alastuey, A., Dupont, S., Escribano, J., Etyemezian, V., Gonzalez-Romero, A., Huang, Y., Kandler, K., Nikolich, G., Panta, A., Querol, X., Reche, C., Yus-Díez, J., and Pérez García-Pando, C.: Insights into the size-resolved dust emission from field measurements in the Moroccan Sahara, Atmos. Chem. Phys., 23, 7177–7212, https://doi.org/10.5194/acp-23-7177-2023, 2023. a
Goodman, A. L., Underwood, G. M., and Grassian, V. H.: A laboratory study of the heterogeneous reaction of nitric acid on calcium carbonate particles, J. Geophys. Res.-Atmos., 105, 29053–29064, https://doi.org/10.1029/2000JD900396, 2000. a
Green, R. O., Mahowald, N., Ung, C., Thompson, D. R., Bator, L., Bennet, M., Bernas, M., Blackway, N., Bradley, C., Cha, J., Clark, P., Clark, R., Cloud, D., Diaz, E., Ben Dor, E., Duren, R., Eastwood, M., Ehlmann, B. L., Fuentes, L., Ginoux, P., Gross, J., He, Y., Kalashnikova, O., Kert, W., Keymeulen, D., Klimesh, M., Ku, D., Kwong-Fu, H., Liggett, E., Li, L., Lundeen, S., Makowski, M. D., Mazer, A., Miller, R., Mouroulis, P., Oaida, B., Okin, G. S., Ortega, A., Oyake, A., Nguyen, H., Pace, T., Painter, T. H., Pempejian, J., Pérez García-Pando, C., Pham, T., Phillips, B., Pollock, R., Purcell, R., Realmuto, V., Schoolcraft, J., Sen, A., Shin, S., Shaw, L., Soriano, M., Swayze, G., Thingvold, E., Vaid, A., and Zan, J.: The Earth Surface Mineral Dust Source Investigation: An Earth Science Imaging Spectroscopy Mission, in: 2020 IEEE Aerospace Conference, Big Sky, MT, USA, 1–14 March, 1–15, https://doi.org/10.1109/AERO47225.2020.9172731, 2020. a, b
Griffin, J. J., Windom, H., and Goldberg, E. D.: The distribution of clay minerals in the World Ocean, Deep-Sea Res., 15, 433–459, https://doi.org/10.1016/0011-7471(68)90051-X, 1968. a
Guerschman, J. P., Scarth, P. F., McVicar, T. R., Renzullo, L. J., Malthus, T. J., Stewart, J. B., Rickards, J. E., and Trevithick, R.: Assessing the effects of site heterogeneity and soil properties when unmixing photosynthetic vegetation, non-photosynthetic vegetation and bare soil fractions from Landsat and MODIS data, Remote Sens. Environ., 161, 12–26, https://doi.org/10.1016/j.rse.2015.01.021, 2015. a
Guzmán-Ruiz, C., Acosta, M., Dawson, M., Jorba, O., Pérez García-Pando, C., and Serradell, K.: Accelerating Chemistry Modules in Atmospheric Models using GPUs, in: NVIDIA's GPU Technology Conference (GTC), GTC, San Jose, CA, USA, 22–26 March, http://hdl.handle.net/2117/331028 (last access: 6 December 2022), 2020. a
Hamilton, D. S., Scanza, R. A., Feng, Y., Guinness, J., Kok, J. F., Li, L., Liu, X., Rathod, S. D., Wan, J. S., Wu, M., and Mahowald, N. M.: Improved methodologies for Earth system modelling of atmospheric soluble iron and observation comparisons using the Mechanism of Intermediate complexity for Modelling Iron (MIMI v1.0), Geosci. Model Dev., 12, 3835–3862, https://doi.org/10.5194/gmd-12-3835-2019, 2019. a, b, c, d
Harrison, A. D., Lever, K., Sanchez-Marroquin, A., Holden, M. A., Whale, T. F., Tarn, M. D., McQuaid, J. B., and Murray, B. J.: The ice-nucleating ability of quartz immersed in water and its atmospheric importance compared to K-feldspar, Atmos. Chem. Phys., 19, 11343–11361, https://doi.org/10.5194/acp-19-11343-2019, 2019. a, b
Haustein, K., Pérez, C., Baldasano, J. M., Jorba, O., Basart, S., Miller, R. L., Janjic, Z., Black, T., Nickovic, S., Todd, M. C., Washington, R., Müller, D., Tesche, M., Weinzierl, B., Esselborn, M., and Schladitz, A.: Atmospheric dust modeling from meso to global scales with the online NMMB/BSC-Dust model – Part 2: Experimental campaigns in Northern Africa, Atmos. Chem. Phys., 12, 2933–2958, https://doi.org/10.5194/acp-12-2933-2012, 2012. a, b
Holben, B. N., Eck, T. F., Slutsker, I., Tanré, D., Buis, J. P., Setzer, A., Vermote, E., Reagan, J. A., Kaufman, Y. J., Nakajima, T., Lavenu, F., Jankowiak, I., and Smirnov, A.: AERONET – A federated instrument network and data archive for aerosol characterization, Remote Sens. Environ., 66, 1–16, https://doi.org/10.1016/S0034-4257(98)00031-5, 1998. a
Hsu, N. C., Tsay, S. C., King, M. D., and Herman, J. R.: Aerosol properties over bright-reflecting source regions, IEEE T. Geosci. Remote, 42, 557–569, https://doi.org/10.1109/TGRS.2004.824067, 2004. a
Hsu, N. C., Jeong, M. J., Bettenhausen, C., Sayer, A. M., Hansell, R., Seftor, C. S., Huang, J., and Tsay, S. C.: Enhanced Deep Blue aerosol retrieval algorithm: The second generation, J. Geophys. Res.-Atmos., 118, 9296–9315, https://doi.org/10.1002/jgrd.50712, 2013. a
Huneeus, N., Schulz, M., Balkanski, Y., Griesfeller, J., Prospero, J., Kinne, S., Bauer, S., Boucher, O., Chin, M., Dentener, F., Diehl, T., Easter, R., Fillmore, D., Ghan, S., Ginoux, P., Grini, A., Horowitz, L., Koch, D., Krol, M. C., Landing, W., Liu, X., Mahowald, N., Miller, R., Morcrette, J.-J., Myhre, G., Penner, J., Perlwitz, J., Stier, P., Takemura, T., and Zender, C. S.: Global dust model intercomparison in AeroCom phase I, Atmos. Chem. Phys., 11, 7781–7816, https://doi.org/10.5194/acp-11-7781-2011, 2011. a, b
Hunt, B. R., Kostelich, E. J., and Szunyogh, I.: Efficient data assimilation for spatiotemporal chaos: A local ensemble transform Kalman filter, Physica D, 230, 112–126, https://doi.org/10.1016/j.physd.2006.11.008, 2007. a
Iacono, M. J., Mlawer, E. J., and Clough, S. A.: Validation of the RRTM Shortwave Radiation Model and Comparison to GCM Shortwave Models, Eleventh ARM Science Team Meeting Proceedings, 2, 1–6, 2001. a
Iacono, M. J., Delamere, J. S., Mlawer, E. J., Shephard, M. W., Clough, S. A., and Collins, W. D.: Radiative forcing by long-lived greenhouse gases: Calculations with the AER radiative transfer models, J. Geophys. Res.-Atmos., 113, 1–8, https://doi.org/10.1029/2008JD009944, 2008. a
Ito, A. and Shi, Z.: Delivery of anthropogenic bioavailable iron from mineral dust and combustion aerosols to the ocean, Atmos. Chem. Phys., 16, 85–99, https://doi.org/10.5194/acp-16-85-2016, 2016. a, b, c, d, e, f
Ito, A. and Wagai, R.: Data Descriptor: Global distribution of clay-size minerals on land surface for biogeochemical and climatological studies, Sci. Data, 4, 1–11, https://doi.org/10.1038/sdata.2017.103, 2017. a, b
Ito, A. and Xu, L.: Response of acid mobilization of iron-containing mineral dust to improvement of air quality projected in the future, Atmos. Chem. Phys., 14, 3441–3459, https://doi.org/10.5194/acp-14-3441-2014, 2014. a, b, c, d
Ito, A., Lin, G., and Penner, J. E.: Radiative forcing by light-absorbing aerosols of pyrogenetic iron oxides, Sci. Rep., 8, 1–11, https://doi.org/10.1038/s41598-018-25756-3, 2018. a
Ito, A., Adebiyi, A. A., Huang, Y., and Kok, J. F.: Less atmospheric radiative heating by dust due to the synergy of coarser size and aspherical shape, Atmos. Chem. Phys., 21, 16869–16891, https://doi.org/10.5194/acp-21-16869-2021, 2021. a, b
Janjic, Z.: Nonsingular Implementation of the Mellor-Yamada Level 2.5 Scheme in the NCEP Meso model, NCEP Office Note, 437, 61, http://www.emc.ncep.noaa.gov/officenotes/newernotes/on437.pdf (last access: 6 December 2022), 2002. a
Janjic, Z. and Gall, R.: Scientific Documentation of the NCEP Nonhydrostatic Multiscale Model on the B grid (NMMB). Part 1 Dynamics, NCAR Technial Note, 1–80 pp., https://doi.org/10.5065/D6WH2MZX, 2012. a
Jickells, T. D.: Global Iron Connections Between Desert Dust, Ocean Biogeochemistry, and Climate, Science, 308, 67–71, https://doi.org/10.1126/science.1105959, 2005. a, b, c
Johnson, M. S. and Meskhidze, N.: Atmospheric dissolved iron deposition to the global oceans: effects of oxalate-promoted Fe dissolution, photochemical redox cycling, and dust mineralogy, Geosci. Model Dev., 6, 1137–1155, https://doi.org/10.5194/gmd-6-1137-2013, 2013. a
Jorba, O., Dabdub, D., Blaszczak-Boxe, C., Pérez, C., Janjic, Z., Baldasano, J. M., Spada, M., Badia, A., and Gonçalves, M.: Potential significance of photoexcited NO2 on global air quality with the NMMB/BSC chemical transport model, J. Geophys. Res., 117, D13301, https://doi.org/10.1029/2012JD017730, 2012. a
Journet, E., Desboeufs, K. V., Caquineau, S., and Colin, J. L.: Mineralogy as a critical factor of dust iron solubility, Geophys. Res. Lett., 35, 3–7, https://doi.org/10.1029/2007GL031589, 2008. a, b, c, d, e
Journet, E., Balkanski, Y., and Harrison, S. P.: A new data set of soil mineralogy for dust-cycle modeling, Atmos. Chem. Phys., 14, 3801–3816, https://doi.org/10.5194/acp-14-3801-2014, 2014. a, b, c, d, e, f, g, h, i, j, k, l, m, n, o, p, q, r, s, t, u, v, w, x, y, z
Kakavas, S., Patoulias, D., Zakoura, M., Nenes, A., and Pandis, S. N.: Size-resolved aerosol pH over Europe during summer, Atmos. Chem. Phys., 21, 799–811, https://doi.org/10.5194/acp-21-799-2021, 2021. a
Kanakidou, M., Myriokefalitakis, S., and Tsigaridis, K.: Aerosols in atmospheric chemistry and biogeochemical cycles of nutrients, Environ. Res. Lett., 13, 063004, https://doi.org/10.1088/1748-9326/aabcdb, 2018. a, b
Kandler, K., Benker, N., Bundke, U., Cuevas, E., Ebert, M., Knippertz, P., Rodríguez, S., Schütz, L., and Weinbruch, S.: Chemical composition and complex refractive index of Saharan Mineral Dust at Izanã, Tenerife (Spain) derived by electron microscopy, Atmos. Environ., 41, 8058–8074, https://doi.org/10.1016/j.atmosenv.2007.06.047, 2007. a, b, c
Kandler, K., Schütz, L., Deutscher, C., Ebert, M., Hofmann, H., Jäckel, S., Jaenicke, R., Knippertz, P., Lieke, K., Massling, A., Petzold, A., Schladitz, A., Weinzierl, B., Wiedensohler, A., Zorn, S., and Weinbruch, S.: Size distribution, mass concentration, chemical and mineralogical composition and derived optical parameters of the boundary layer aerosol at Tinfou, Morocco, during SAMUM 2006, Tellus B, 61, 32–50, https://doi.org/10.1111/j.1600-0889.2008.00385.x, 2009. a, b, c, d, e
Kandler, K., Schneiders, K., Heuser, J., Waza, A., Aryasree, S., Althausen, D., Hofer, J., Abdullaev, S. F., and Makhmudov, A. N.: Differences and Similarities of Central Asian, African, and Arctic Dust Composition from a Single Particle Perspective, Atmosphere, 11, 1–16, https://doi.org/10.3390/atmos11030269, 2020. a, b
Klose, M., Jorba, O., Gonçalves Ageitos, M., Escribano, J., Dawson, M. L., Obiso, V., Di Tomaso, E., Basart, S., Montané Pinto, G., Macchia, F., Ginoux, P., Guerschman, J., Prigent, C., Huang, Y., Kok, J. F., Miller, R. L., and Pérez García-Pando, C.: Mineral dust cycle in the Multiscale Online Nonhydrostatic AtmospheRe CHemistry model (MONARCH) Version 2.0, Geosci. Model Dev., 14, 6403–6444, https://doi.org/10.5194/gmd-14-6403-2021, 2021. a, b, c, d, e, f, g, h
Kok, J. F.: A scaling theory for the size distribution of emitted dust aerosols suggests climate models underestimate the size of the global dust cycle, P. Natl. Sci. USA, 108, 1016–1021, https://doi.org/10.1073/pnas.1014798108, 2011. a, b, c, d
Kok, J. F., Mahowald, N. M., Fratini, G., Gillies, J. A., Ishizuka, M., Leys, J. F., Mikami, M., Park, M.-S., Park, S.-U., Van Pelt, R. S., and Zobeck, T. M.: An improved dust emission model – Part 1: Model description and comparison against measurements, Atmos. Chem. Phys., 14, 13023–13041, https://doi.org/10.5194/acp-14-13023-2014, 2014. a
Kok, J. F., Adebiyi, A. A., Albani, S., Balkanski, Y., Checa-Garcia, R., Chin, M., Colarco, P. R., Hamilton, D. S., Huang, Y., Ito, A., Klose, M., Li, L., Mahowald, N. M., Miller, R. L., Obiso, V., Pérez García-Pando, C., Rocha-Lima, A., and Wan, J. S.: Contribution of the world's main dust source regions to the global cycle of desert dust, Atmos. Chem. Phys., 21, 8169–8193, https://doi.org/10.5194/acp-21-8169-2021, 2021. a, b, c
Krueger, B. J., Grassian, V. H., Cowin, J. P., and Laskin, A.: Heterogeneous chemistry of individual mineral dust particles from different dust source regions: The importance of particle mineralogy, Atmos. Environ., 38, 6253–6261, https://doi.org/10.1016/j.atmosenv.2004.07.010, 2004. a, b
Lafon, S., Sokolik, I. N., Rajot, J. L., Caquincau, S., Gaudichet, A., Caquineau, S., and Gaudichet, A.: Characterization of iron oxides in mineral dust aerosols: Implications for light absorption, J. Geophys. Res.-Atmos., 111, 1–19, https://doi.org/10.1029/2005JD007016, 2006. a, b, c
Lawrence, C. R. and Neff, J. C.: The contemporary physical and chemical flux of aeolian dust: A synthesis of direct measurements of dust deposition, Chem. Geol., 267, 46–63, https://doi.org/10.1016/j.chemgeo.2009.02.005, 2009. a, b
Li, L., Mahowald, N. M., Miller, R. L., Pérez García-Pando, C., Klose, M., Hamilton, D. S., Gonçalves Ageitos, M., Ginoux, P., Balkanski, Y., Green, R. O., Kalashnikova, O., Kok, J. F., Obiso, V., Paynter, D., and Thompson, D. R.: Quantifying the range of the dust direct radiative effect due to source mineralogy uncertainty, Atmos. Chem. Phys., 21, 3973–4005, https://doi.org/10.5194/acp-21-3973-2021, 2021. a, b, c, d, e
Longtin, D. R., Shettle, E. P., Hummel, J. R., and Pryce, J. D.: A wind dependent desert aerosol model: radiative properties, Technical report afgl-tr-88-0112, Air Force Geophysics Laboratory, Hanscom AFB, Massachussets, https://apps.dtic.mil/sti/citations/ADA201951 (last access: 6 December 2022), 1988. a
Luo, C., Mahowald, N., Bond, T., Chuang, P. Y., Artaxo, P., Siefert, R., Chen, Y., and Schauer, J.: Combustion iron distribution and deposition, Global Biogeochem. Cy., 22, GB1012, https://doi.org/10.1029/2007GB002964, 2008. a
Mahowald, N., Jickells, T. D., Baker, A. R., Artaxo, P., Benitez-Nelson, C. R., Bergametti, G., Bond, T. C., Chen, Y., Cohen, D. D., Herut, B., Kubilay, N., Losno, R., Luo, C., Maenhaut, W., McGee, K. A., Okin, G. S., Siefert, R. L., and Tsukuda, S.: Global distribution of atmospheric phosphorus sources, concentrations and deposition rates, and anthropogenic impacts, Global Biogeochem. Cy., 22, 1–19, https://doi.org/10.1029/2008GB003240, 2008. a
Mahowald, N. M., Engelstaedter, S., Luo, C., Sealy, A., Artaxo, P., Benitez-Nelson, C., Bonnet, S., Chen, Y., Chuang, P. Y., Cohen, D. D., Dulac, F., Herut, B., Johansen, A. M., Kubilay, N., Losno, R., Maenhaut, W., Paytan, A., Prospero, J. M., Shank, L. M., and Siefert, R. L.: Atmospheric iron deposition: global distribution, variability, and human perturbations, Annu. Rev. Mar. Sci., 1, 245–278, https://doi.org/10.1146/annurev.marine.010908.163727, 2009. a, b
Manubens-Gil, D., Vegas-Regidor, J., Prodhomme, C., Mula-Valls, O., and Doblas-Reyes, F. J.: Seamless Management of Ensemble Climate Prediction Experiments on HPC Platforms, in: 2016 International Conference on High Performance Computing and Simulation (HPCS), IEEE, Innsbruck, 18-22 July 2016, 895–900 pp., https://doi.org/10.1109/HPCSim.2016.7568429, 2016. a
Marticorena, B. and Bergametti, G.: Modeling the atmospheric dust cycle: 1. Design of a soil-derived dust emission scheme, J. Geophys. Res., 100, 16415–16430, https://doi.org/10.1029/95jd00690, 1995. a
Marticorena, B., Chatenet, B., Rajot, J. L., Traoré, S., Coulibaly, M., Diallo, A., Koné, I., Maman, A., NDiaye, T., and Zakou, A.: Temporal variability of mineral dust concentrations over West Africa: analyses of a pluriannual monitoring from the AMMA Sahelian Dust Transect, Atmos. Chem. Phys., 10, 8899–8915, https://doi.org/10.5194/acp-10-8899-2010, 2010. a
Mellor, G. L. and Yamada, T.: Development of a turbulence closure model for geophysical fluid problems, Rev. Geophys., 20, 851–875, https://doi.org/10.1029/RG020i004p00851, 1982. a
Menut, L., Siour, G., Bessagnet, B., Couvidat, F., Journet, E., Balkanski, Y., and Desboeufs, K.: Modelling the mineralogical composition and solubility of mineral dust in the Mediterranean area with CHIMERE 2017r4, Geosci. Model Dev., 13, 2051–2071, https://doi.org/10.5194/gmd-13-2051-2020, 2020. a
Miller, R. L., Knippertz, P., Pérez García-Pando, C., Perlwitz, J. P., and Tegen, I.: Impact of Dust Radiative Forcing upon Climate, in: Mineral Dust, edited by: Knippertz, P. and Stuut, J. B., 1st edition, Springer, Dordrecht, https://doi.org/10.1007/978-94-017-8978-3_13, 2014. a
Miyoshi, T. and Yamane, S.: Local ensemble transform Kalman filtering with an AGCM at a T159/L48 resolution, Mon. Weather Rev., 135, 3841–3861, https://doi.org/10.1175/2007MWR1873.1, 2007. a
Moosmuller, H., Engelbrecht, J. P., Skiba, M., Frey, G., Chakrabarty, R. K., and Arnott, W. P.: Single scattering albedo of fine mineral dust aerosols controlled by iron concentration, J. Geophys. Res.-Atmos., 117, 1–10, https://doi.org/10.1029/2011JD016909, 2012. a
Myriokefalitakis, S., Daskalakis, N., Mihalopoulos, N., Baker, A. R., Nenes, A., and Kanakidou, M.: Changes in dissolved iron deposition to the oceans driven by human activity: a 3-D global modelling study, Biogeosciences, 12, 3973–3992, https://doi.org/10.5194/bg-12-3973-2015, 2015. a
Myriokefalitakis, S., Ito, A., Kanakidou, M., Nenes, A., Krol, M. C., Mahowald, N. M., Scanza, R. A., Hamilton, D. S., Johnson, M. S., Meskhidze, N., Kok, J. F., Guieu, C., Baker, A. R., Jickells, T. D., Sarin, M. M., Bikkina, S., Shelley, R., Bowie, A., Perron, M. M. G., and Duce, R. A.: Reviews and syntheses: the GESAMP atmospheric iron deposition model intercomparison study, Biogeosciences, 15, 6659–6684, https://doi.org/10.5194/bg-15-6659-2018, 2018. a, b, c, d, e, f, g, h, i
Myriokefalitakis, S., Bergas-Massó, E., Gonçalves-Ageitos, M., Pérez García-Pando, C., van Noije, T., Le Sager, P., Ito, A., Athanasopoulou, E., Nenes, A., Kanakidou, M., Krol, M. C., and Gerasopoulos, E.: Multiphase processes in the EC-Earth model and their relevance to the atmospheric oxalate, sulfate, and iron cycles, Geosci. Model Dev., 15, 3079–3120, https://doi.org/10.5194/gmd-15-3079-2022, 2022. a, b, c, d, e, f, g
Navarro-Barboza, H., Pandolfi, M., and Jorba, O.: Constraining the chemical composition of particulate matter in an atmospheric chemistry model, in: 8th BSC Doctoral Symposium, edited by: Center, B. S., Barcelona, 50–51 pp., http://hdl.handle.net/2117/346338 (last access: 6 December 2022), 2021. a
Nickovic, S., Vukovic, A., Vujadinovic, M., Djurdjevic, V., and Pejanovic, G.: Technical Note: High-resolution mineralogical database of dust-productive soils for atmospheric dust modeling, Atmos. Chem. Phys., 12, 845–855, https://doi.org/10.5194/acp-12-845-2012, 2012. a, b, c, d, e, f, g, h, i, j, k, l
Obiso, V., Gonçalves Ageitos, M., Pérez García-Pando, C., Schuster, G. L., Bauer, S. E., Di Biagio, C., Formenti, P., Perlwitz, J. P., Tsigaridis, K., and Miller, R. L.: Observationally constrained regional variations of shortwave absorption by iron oxides emphasize the cooling effect of dust, EGUsphere [preprint], https://doi.org/10.5194/egusphere-2023-1166, 2023a. a, b, c, d, e
Obiso, V., Gonçalves Ageitos, M., Miller, R. L., Pérez García-Pando, C., Schuster, G. L., Bauer, S. E., Di Biagio, C., Formenti, P., Jorba, O., Perlwitz, J. P., and Tsigaridis, K.: Regional variations in dust shortwave absorption explained predominantly by mineralogical composition, in preparation, 2023b. a
Panta, A., Kandler, K., Alastuey, A., González-Flórez, C., González-Romero, A., Klose, M., Querol, X., Reche, C., Yus-Díez, J., and Pérez García-Pando, C.: Insights into the single-particle composition, size, mixing state, and aspect ratio of freshly emitted mineral dust from field measurements in the Moroccan Sahara using electron microscopy, Atmos. Chem. Phys., 23, 3861–3885, https://doi.org/10.5194/acp-23-3861-2023, 2023. a, b
Pérez, C., Haustein, K., Janjic, Z., Jorba, O., Huneeus, N., Baldasano, J. M., Black, T., Basart, S., Nickovic, S., Miller, R. L., Perlwitz, J. P., Schulz, M., and Thomson, M.: Atmospheric dust modeling from meso to global scales with the online NMMB/BSC-Dust model – Part 1: Model description, annual simulations and evaluation, Atmos. Chem. Phys., 11, 13001–13027, https://doi.org/10.5194/acp-11-13001-2011, 2011. a, b, c, d, e
Pérez García-Pando, C., Miller, R. L., Perlwitz, J. P., Rodríguez, S., and Prospero, J. M.: Predicting the mineral composition of dust aerosols: Insights from elemental composition measured at the Izaña Observatory, Geophys. Res. Lett., 43, 10520–10529, https://doi.org/10.1002/2016GL069873, 2016. a, b, c, d
Perlwitz, J. P., Pérez García-Pando, C., and Miller, R. L.: Predicting the mineral composition of dust aerosols – Part 1: Representing key processes, Atmos. Chem. Phys., 15, 11593–11627, https://doi.org/10.5194/acp-15-11593-2015, 2015a. a, b, c, d, e, f, g
Perlwitz, J. P., Pérez García-Pando, C., and Miller, R. L.: Predicting the mineral composition of dust aerosols – Part 2: Model evaluation and identification of key processes with observations, Atmos. Chem. Phys., 15, 11629–11652, https://doi.org/10.5194/acp-15-11629-2015, 2015b. a, b, c, d, e, f, g, h, i, j, k
Prospero, J. M.: Mineral-Aerosol Transport to the North Atlantic and North Pacific: The Impact of African and Asian Sources, in: The Long-Range Atmospheric Transport of Natural and Contaminant Substances, edited by: Knap, A. H., Kaiser, M. S., and Kaiser, M. S., NATO ASI Series, Vol. 297, 1st edn., Springer, Dordrecht, https://doi.org/10.1007/978-94-009-0503-0_4, 1990. a
Prospero, J. M.: The Atmospheric Transport of Particles to the Ocean, in: Particle Flux in the Ocean, edited by: Ittekkot, V., Schafer, P., Honjo, S., and Depetris, P. J., Wiley, New York, 19–52, ISBN 978-0471960737, 1996. a
Prospero, J. M.: Long-term measurements of the transport of African mineral dust to the southeastern United States: Implications for regional air quality, J. Geophys. Res.-Atmos., 104, 15917–15927, https://doi.org/10.1029/1999JD900072, 1999. a
Querol, X., Alastuey, A., Lopez-Soler, A., Mantilla, E., and Plana, F.: Mineral composition of atmospheric particulates around a large coal-fired power station, Atmos. Environ., 30, 3557–3572, https://doi.org/10.1016/1352-2310(96)00108-2, 1996. a
R Core Team: R: A Language and Environment for Statistical Computing, R Foundation for Statistical Computing, Vienna, Austria, https://www.R-project.org/ (last access: 6 December 2022), 2021. a
Rathod, S. D., Hamilton, D. S., Mahowald, N. M., Klimont, Z., Corbett, J. J., and Bond, T. C.: A Mineralogy-Based Anthropogenic Combustion-Iron Emission Inventory, J. Geophys. Res.-Atmos., 125, 1–35, https://doi.org/10.1029/2019JD032114, 2020. a
Raupach, M. R., Gilette, D. A., and Leys, J. F.: The effect of roughness elements on wind erosion threshold, J. Geophys. Res., 98, 3023–3029, https://doi.org/10.1029/92JD01922, 1993. a
Scanza, R. A., Mahowald, N., Ghan, S., Zender, C. S., Kok, J. F., Liu, X., Zhang, Y., and Albani, S.: Modeling dust as component minerals in the Community Atmosphere Model: development of framework and impact on radiative forcing, Atmos. Chem. Phys., 15, 537–561, https://doi.org/10.5194/acp-15-537-2015, 2015. a, b, c, d, e, f
Scanza, R. A., Hamilton, D. S., Perez Garcia-Pando, C., Buck, C., Baker, A., and Mahowald, N. M.: Atmospheric processing of iron in mineral and combustion aerosols: development of an intermediate-complexity mechanism suitable for Earth system models, Atmos. Chem. Phys., 18, 14175–14196, https://doi.org/10.5194/acp-18-14175-2018, 2018. a, b, c, d
Scheuvens, D., Schütz, L., Kandler, K., Ebert, M., and Weinbruch, S.: Bulk composition of northern African dust and its source sediments-A compilation, Earth-Sci. Rev., 116, 170–194, https://doi.org/10.1016/j.earscirev.2012.08.005, 2013. a, b, c, d, e, f, g
Schulzweida, U.: CDO User Guide, https://doi.org/10.5281/zenodo.7112925, 2022. a
Schuster, G. L., Dubovik, O., and Arola, A.: Remote sensing of soot carbon – Part 1: Distinguishing different absorbing aerosol species, Atmos. Chem. Phys., 16, 1565–1585, https://doi.org/10.5194/acp-16-1565-2016, 2016. a
Schutgens, N. A. J., Miyoshi, T., Takemura, T., and Nakajima, T.: Applying an ensemble Kalman filter to the assimilation of AERONET observations in a global aerosol transport model, Atmos. Chem. Phys., 10, 2561–2576, https://doi.org/10.5194/acp-10-2561-2010, 2010. a
Shao, Y.: A model for mineral dust emission, J. Geophys. Res., 106, 20239–20254, https://doi.org/10.1029/2001JD900171, 2001. a, b
Shao, Y.: Simplification of a dust emission scheme and comparison with data, J. Geophys. Res.-Atmos., 109, 10202, https://doi.org/10.1029/2003JD004372, 2004. a
Shao, Y., Ishizuka, M., Mikami, M., and Leys, J. F.: Parameterization of size-resolved dust emission and validation with measurements, J. Geophys. Res.-Atmos., 116, 8203, https://doi.org/10.1029/2010JD014527, 2011. a
Shi, Z., Krom, M. D., Bonneville, S., Baker, A. R., Bristow, C., Drake, N., Mann, G., Carslaw, K., McQuaid, J. B., Jickells, T., and Benning, L. G.: Influence of chemical weathering and aging of iron oxides on the potential iron solubility of Saharan dust during simulated atmospheric processing, Global Biogeochem. Cy., 25, GB2010, https://doi.org/10.1029/2010GB003837, 2011. a, b, c
Shi, Z., Krom, M. D., Jickells, T. D., Bonneville, S., Carslaw, K. S., Mihalopoulos, N., Baker, A. R., and Benning, L. G.: Impacts on iron solubility in the mineral dust by processes in the source region and the atmosphere: A review, Aeol. Res., 5, 21–42, https://doi.org/10.1016/j.aeolia.2012.03.001, 2012. a, b, c, d, e
Sinyuk, A., Torres, O., and Dubovik, O.: Combined use of satellite and surface observations to infer the imaginary part of refractive index of Saharan dust, Geophys. Res. Lett., 30, 1081, https://doi.org/10.1029/2002GL016189, 2003. a
Sinyuk, A., Holben, B. N., Eck, T. F., Giles, D. M., Slutsker, I., Korkin, S., Schafer, J. S., Smirnov, A., Sorokin, M., and Lyapustin, A.: The AERONET Version 3 aerosol retrieval algorithm, associated uncertainties and comparisons to Version 2, Atmos. Meas. Tech., 13, 3375–3411, https://doi.org/10.5194/amt-13-3375-2020, 2020. a
Slinn, W.: Precipitation scavenging, in: Atmospheric Science and Power Production, Tech. Inf. Cent., Off. of Sci. and Techn. Inf., Dep. of Energy, Washington DC, USA, pp. 466–532, ISBN 0-87079-126-5, 1984. a
Sokolik, I. N. and Toon, O. B.: Direct radiative forcing by anthropogenic airborne mineral aerosols, Nature, 381, 681–683, https://doi.org/10.1038/381681a0, 1996. a
Sokolik, I. N. and Toon, O. B.: Incorporation of mineralogical composition into models of the radiative properties of mineral aerosol from UV to IR wavelengths, J. Geophys. Res.-Atmos., 104, 9423–9444, https://doi.org/10.1029/1998JD200048, 1999. a
Sokolik, I. N., Toon, O. B., and Bergstrom, R. W.: Modeling the radiative characteristics of airborne mineral aerosols at infrared wavelengths, J. Geophys. Res.-Atmos., 103, 8813–8826, https://doi.org/10.1029/98JD00049, 1998. a
Soussé Villa, R., Casellas, J., and Pérez García-Pando, C.: Modeling nitric acid uptake by mineral dust, in: 8th BSC Doctoral Symposium, edited by: Center, B. S., Barcelona, https://doi.org/10.17077/etd.2xewzpnz, 2021. a
Spada, M.: Development and evaluation of an atmospheric aerosol module implemented within the NMMB/BSC-CTM, Ph.D. thesis, Universitat Politècnica de Catalunya, http://hdl.handle.net/2117/95991 (last access: 6 December 2022), 2015. a
Spada, M., Jorba, O., Pérez García-Pando, C., Janjic, Z., and Baldasano, J. M.: Modeling and evaluation of the global sea-salt aerosol distribution: sensitivity to size-resolved and sea-surface temperature dependent emission schemes, Atmos. Chem. Phys., 13, 11735–11755, https://doi.org/10.5194/acp-13-11735-2013, 2013. a
UCAR/NCAR/CISL/VETS: The NCAR Command Language [Software], https://doi.org/10.5065/D6WD3XH5, 2019. a
Uruchi, W., Castrillo, M., and Beltrán, D.: Autosubmit GUI: A Javascript-based Graphical User Interface to Monitor Experiments Workflow Execution, Journal of Open Source Software, 6, 3049, https://doi.org/10.21105/joss.03049, 2021. a
Usher, C. R., Al-Hosney, H., Carlos-Cuellar, S., and Grassian, V. H.: A laboratory study of the heterogeneous uptake and oxidation of sulfur dioxide on mineral dust particles, J. Geophys. Res.-Atmos., 107, 1–9, https://doi.org/10.1029/2002JD002051, 2002. a
Vergara-Temprado, J., Murray, B. J., Wilson, T. W., O'Sullivan, D., Browse, J., Pringle, K. J., Ardon-Dryer, K., Bertram, A. K., Burrows, S. M., Ceburnis, D., DeMott, P. J., Mason, R. H., O'Dowd, C. D., Rinaldi, M., and Carslaw, K. S.: Contribution of feldspar and marine organic aerosols to global ice nucleating particle concentrations, Atmos. Chem. Phys., 17, 3637–3658, https://doi.org/10.5194/acp-17-3637-2017, 2017. a, b
Wagner, R., Ajtai, T., Kandler, K., Lieke, K., Linke, C., Müller, T., Schnaiter, M., and Vragel, M.: Complex refractive indices of Saharan dust samples at visible and near UV wavelengths: a laboratory study, Atmos. Chem. Phys., 12, 2491–2512, https://doi.org/10.5194/acp-12-2491-2012, 2012. a
Wang, R., Balkanski, Y., Boucher, O., Bopp, L., Chappell, A., Ciais, P., Hauglustaine, D., Peñuelas, J., and Tao, S.: Sources, transport and deposition of iron in the global atmosphere, Atmos. Chem. Phys., 15, 6247–6270, https://doi.org/10.5194/acp-15-6247-2015, 2015. a, b
Wang, Z., Pan, X., Uno, I., Li, J., Wang, Z., Chen, X., Fu, P., Yang, T., Kobayashi, H., Shimizu, A., Sugimoto, N., and Yamamoto, S.: Significant impacts of heterogeneous reactions on the chemical composition and mixing state of dust particles: A case study during dust events over northern China, Atmos. Environ., 159, 83–91, https://doi.org/10.1016/j.atmosenv.2017.03.044, 2017. a
Weinbruch, S., Zou, L., Ebert, M., Benker, N., Drotikova, T., and Kallenborn, R.: Emission of nanoparticles from coal and diesel fired power plants on Svalbard: An electron microscopy study, Atmos. Environ., 282, 119138, https://doi.org/10.1016/j.atmosenv.2022.119138, 2022. a
Yu, H., Chin, M., Yuan, T., Bian, H., Remer, L. A., Prospero, J. M., Omar, A., Winker, D., Yang, Y., Zhang, Y., Zhang, Z., and Zhao, C.: The fertilizing role of African dust in the Amazon rainforest: A first multiyear assessment based on data from Cloud-Aerosol Lidar and Infrared Pathfinder Satellite Observations, Geophys. Res. Lett., 42, 1984–1991, https://doi.org/10.1002/2015GL063040, 2015. a
Zender, C. S.: Analysis of Self-describing Gridded Geoscience Data with netCDF Operators (NCO), Environ. Modell. Softw., 23, 1338–1342, https://doi.org/10.1016/j.envsoft.2008.03.004, 2008. a
Zimmermann, F., Weinbruch, S., Schütz, L., Hofmann, H., Ebert, M., Kandler, K., and Worringen, A.: Ice nucleation properties of the most abundant mineral dust phases, J. Geophys. Res., 113, D23204, https://doi.org/10.1029/2008JD010655, 2008. a
- Abstract
- Introduction
- Modeling dust mineralogy in MONARCH
- Experiment definitions
- Methodology and observational data for model evaluation
- Results and discussion
- Implications of modeled mineralogy for dust–climate interactions
- Conclusions
- Appendix A: Review of currently available soil mineralogy atlases
- Data availability
- Author contributions
- Competing interests
- Disclaimer
- Acknowledgements
- Financial support
- Review statement
- References
- Supplement