the Creative Commons Attribution 4.0 License.
the Creative Commons Attribution 4.0 License.
 | 01 Aug 2023
Pollution slightly enhances atmospheric cooling by low-level clouds in tropical West Africa
Valerian Hahn
Ralf Meerkötter
Christiane Voigt
Sonja Gisinger
Daniel Sauer
Valéry Catoire
Volker Dreiling
Cyrille Flamant
Stefan Kaufmann
Jonas Kleine
Peter Knippertz
Manuel Moser
Philip Rosenberg
Hans Schlager
Alfons Schwarzenboeck
Jonathan Taylor
Reflection of solar radiation by tropical low-level clouds has an important cooling effect on climate and leads to decreases in surface temperatures. Still, the effect of pollution on ubiquitous tropical continental low-level clouds and the investigation of the related impact on atmospheric cooling rates are poorly constrained by in situ observations and modeling, in particular during the West African summer monsoon season. Here, we present comprehensive in situ measurements of microphysical properties of low-level clouds over tropical West Africa, measured with the Deutsches Zentrum für Luft- und Raumfahrt (DLR) aircraft Falcon 20 during the DACCIWA (Dynamics–Aerosol–Chemistry–Cloud Interactions in West Africa) campaign in June and July 2016. Clouds below 1800 m altitude, identified as boundary layer clouds, were classified according to their carbon monoxide (CO) pollution level into pristine and less polluted clouds (CO < 135 ppbv) and polluted low-level clouds (CO > 155 ppbv) as confirmed by the linear CO to accumulation aerosol number concentration correlation. Whereas slightly enhanced aerosol background levels from biomass burning were measured across the entire area, clouds with substantially enhanced aerosol levels were measured in the outflow of major coastal cities, as well as over rural conurbations in the hinterlands. Here we investigate the impact of pollution on cloud droplet number concentration and size during the West African monsoon season. Our results show that the cloud droplet number concentration (CDNC) measured in the size range from 3 to 50 µm around noon increases by 26 % in the elevated aerosol outflow of coastal cities and conurbations with elevated aerosol loadings from median CDNC of 240 cm−3 (52 to 501 cm−3 interquartile range) to 324 cm−3 (60 to 740 cm−3 interquartile range). Higher CDNC resulted in a 17 % decrease in effective cloud droplet diameter from a median deff of 14.8 µm to a deff of 12.4 µm in polluted clouds.
Radiative transfer simulations show a non-negligible influence of higher droplet number concentrations and smaller particle sizes on the diurnally averaged (noon) net radiative forcing at the top of atmosphere of −3.9 W m−2 (−16.3 W m−2) of polluted with respect to less polluted clouds and lead to a change in instantaneous heating rates of −22.8 K d−1 (−17.7 K d−1) at the top of clouds. Thus, the atmospheric cooling by low-level clouds increases only slightly in the polluted case due to the already elevated background aerosol concentrations. Additionally, the occurrence of mid- and high-level cloud layers atop buffer this effect further, so that the net radiative forcing and instantaneous heating rate of low-level clouds turn out to be less sensitive towards projected future increases in anthropogenic pollution in West Africa.
- Article
(3488 KB) - Full-text XML
- BibTeX
- EndNote


The sensitivity of climate change to the properties of clouds is yet ambiguous and as such limits the confidence in model simulations of projected climate change from global climate models (Eyring et al., 2020). In situ measurements in rarely studied locations, such as tropical West Africa, are required to improve and constrain the cloud droplet number concentration (CDNC) and effective droplet diameter (ED) in global climate models (Righi et al., 2020). Cloud formation processes and their dependence on updraft and cloud condensation nuclei concentrations, although being studied for quite some time, are still subject to scientific research within different regions of the globe (e.g., Kirschler et al., 2022; Braga et al., 2017a, b, 2022; Painemal et al., 2014; Douglas and L'Ecuyer, 2020; Christensen et al., 2020; Menut et al., 2018; Kaufman and Fraser, 1997; Kaufman et al., 2005; Ramanathan et al., 2001). Thus, the role of widespread occurrence of low-level clouds (below 800 hPa, ∼ 1800 m) during the West African summer monsoon, for the local atmospheric energy budget is yet to be better understood (Knippertz et al., 2017; Hill et al., 2018; van der Linden et al., 2015; Flamant et al., 2018a).
With an annual 6 % increase of its gross domestic product (Knippertz et al., 2017), sub-Saharan Africa's economy and socio-economic system is undergoing major changes. The ongoing population growth, urbanization and industrialization leads to strong increases in emissions from industry and the transport sector in particular in the major cities but also from domestic fires in urban and more rural areas (Liousse et al., 2014). The effect of an increase in anthropogenic emissions is not only of concern in view of health aspects but leads to uncertainties for future regional climate. Knippertz et al. (2015) raise the question on the susceptibility of clouds to increases in anthropogenic pollution in West Africa. Hence, a scientific goal of the international DACCIWA project (Dynamics–Aerosol–Chemistry–Clouds Interactions in West Africa) was to quantify and better understand the effects of increased pollution levels within the boundary layer on low-level clouds over tropical West Africa and on the corresponding radiation budget (Knippertz et al., 2015).
This project combined large-scale satellite observations and local ground-based measurements with detailed trace gas, aerosol, cloud and meteorology observations from three airborne platforms: the German Deutsches Zentrum für Luft- und Raumfahrt (DLR) Falcon 20, the French Service des Avions Français Instrumentés pour la Recherche en Environnement (SAFIRE) ATR 42 and the British Antarctic Survey (BAS) Twin Otter (Flamant et al., 2018b). The deployment of the research aircraft to Lomé, Togo, took place from 29 June to 16 July 2016 and involved survey flights over Togo, Benin, Ghana and Côte d'Ivoire.
In their comprehensive analysis of the aerosol composition, Haslett et al. (2019) find a large contribution of accumulation-mode aerosol from biomass burning transported from the Southern Hemisphere in the background aerosol distribution in West Africa, which acts as cloud condensation nuclei.
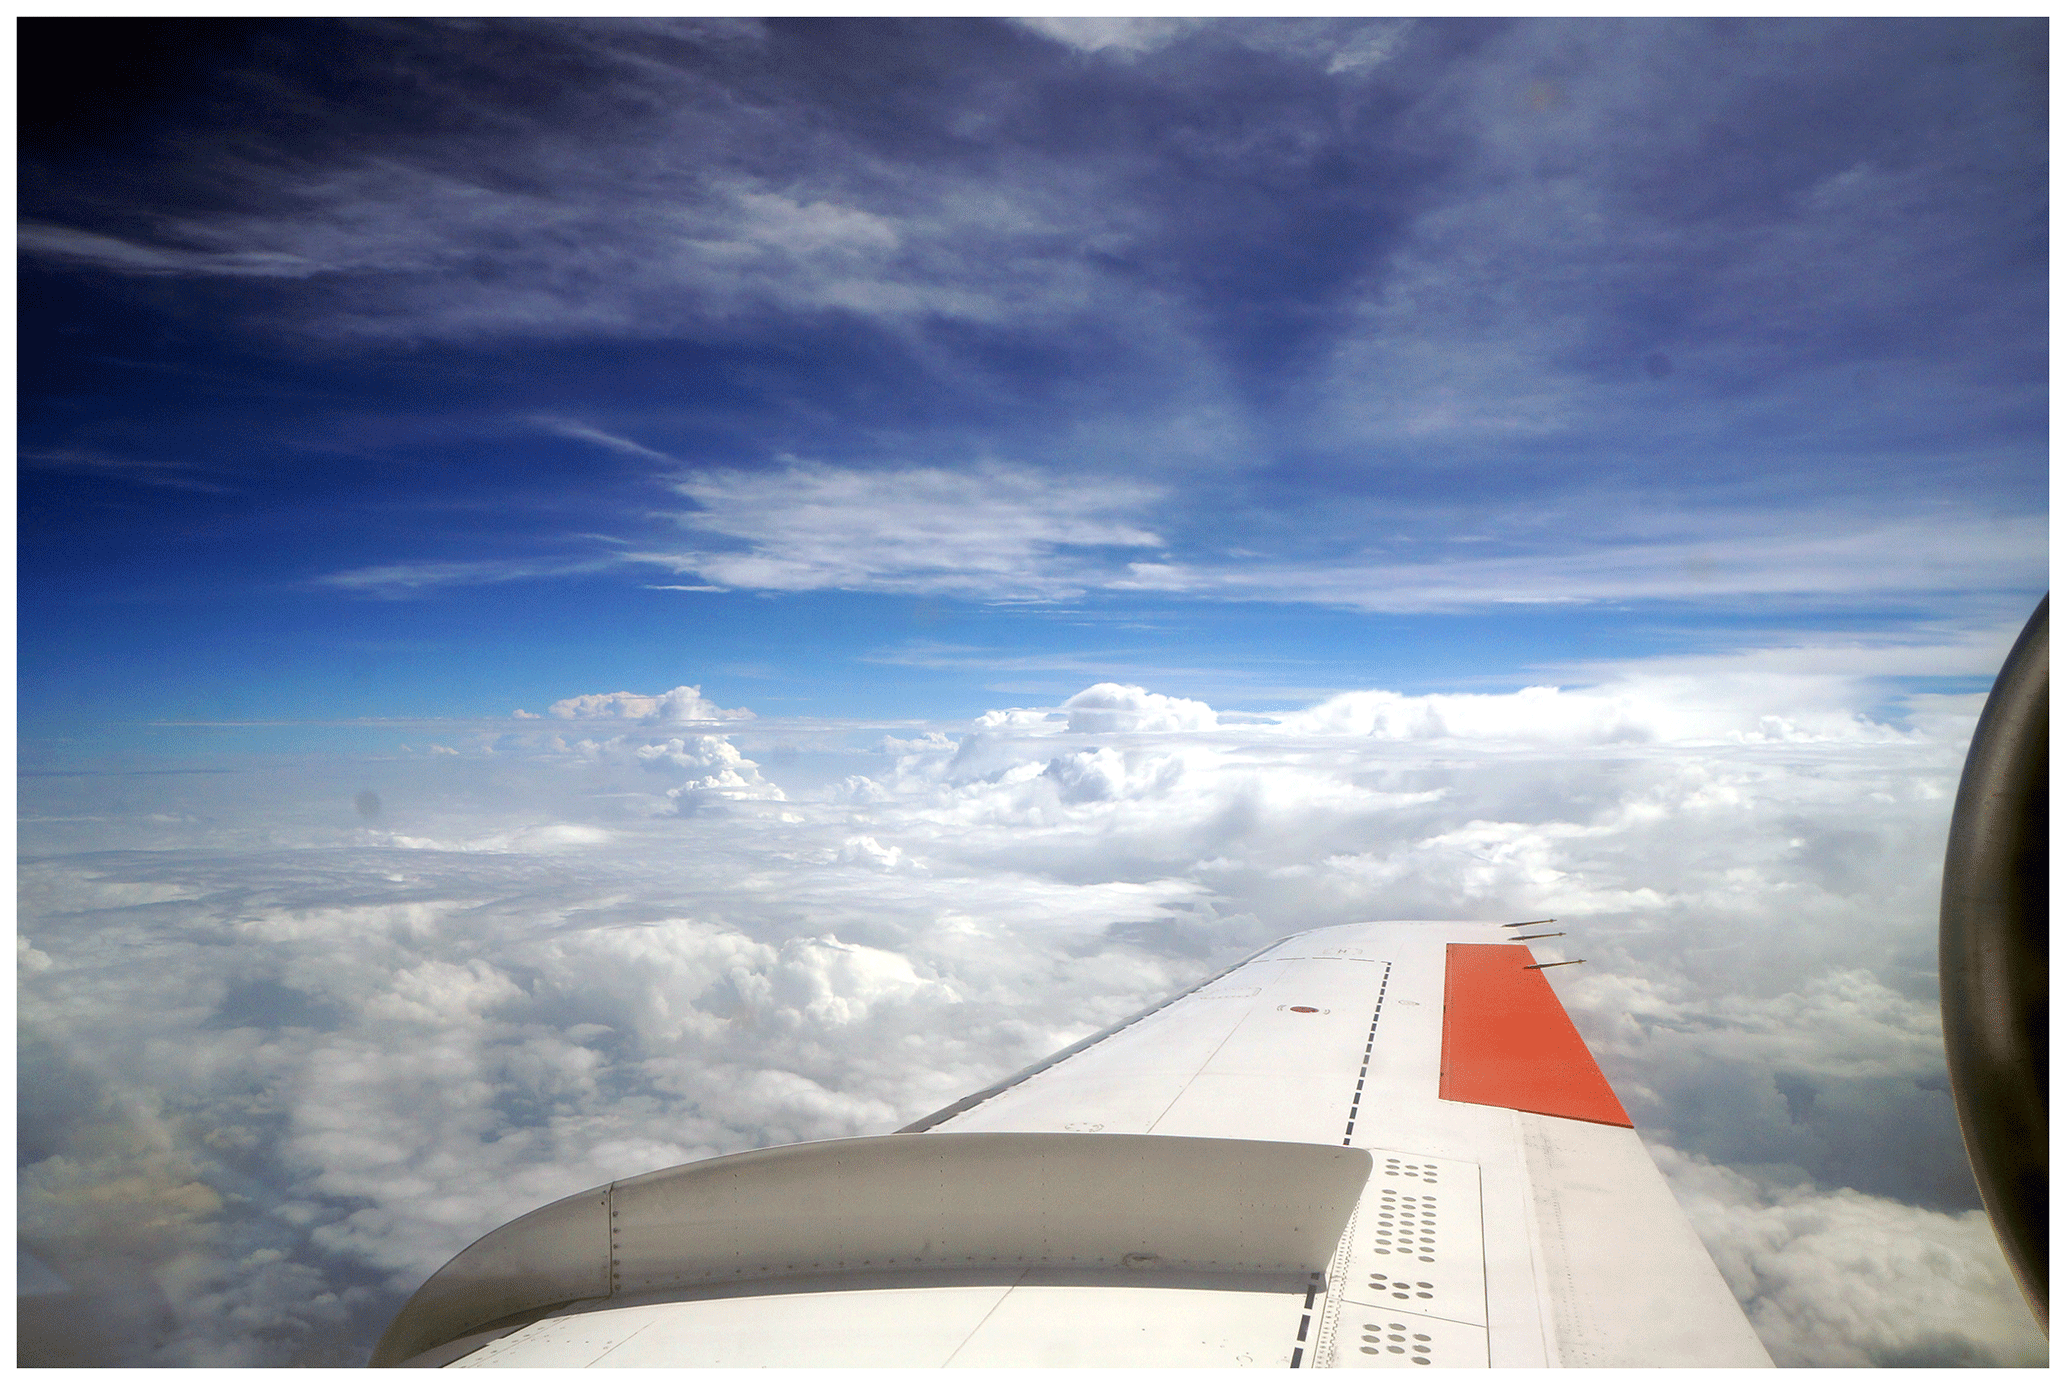
Figure 1Cloud situation as seen from the DLR Falcon research aircraft from the DACCIWA campaign with low-level cumuli as sequel of the nightly low-level stratus deck, convective clouds with significant vertical extent and various cirrus layers atop.
While Deroubaix et al. (2022) use a modeling approach, with a regional meteorology chemistry model (Baklanov et al., 2014; Menut et al., 2019), to study the sensitivity of low-level clouds and precipitation, Taylor et al. (2019) present a comprehensive statistical analysis of cloud properties from the three research aircraft and assess the cloud droplet activation by a variation of local aerosol sources. Hill et al. (2018) statistically analyze the radiative effects from 12 distinct cloud types over southern West Africa during the summer period from June to September using satellite data and calculate a surface cooling of all indicated cloud types including only a small radiative cooling of the atmosphere attributed to low-level clouds. They identified the frequent obscuring of low-level clouds by higher cloud layers (Fig. 1) as an obstacle in satellite data, limiting the information on low-level cloud properties.
This study complements the satellite observations and the radiative transfer calculations of Hill et al. (2018) with an in situ perspective as input to sensitivity studies of radiative transfer modeling. In addition, it extends the work of Taylor et al. (2019) by using the in situ cloud measurements as an input and a base to investigate the effect of pollution on low-level clouds, radiative transfer and climate in West Africa. We investigate the radiative impact of increased anthropogenic pollution on low-level clouds during the monsoon onset phase in West Africa by calculating instantaneous radiative forcings and heating rates. The basis is a comprehensive data set of in situ cloud observations from the 12 measurement flights of the Falcon 20 research aircraft during the DACCIWA airborne campaign.
An overview of the instruments and the methodology is presented in Sect. 2. Sections 3 and 4 describe the microphysical quantities of low-level clouds that serve as input to radiative transfer model simulations. Model results and sensitivity of the clouds radiative impact to aerosol, meteorology and diurnal impact are presented in Sect. 5.
Microphysical properties of low-level clouds were measured in situ with the cloud and aerosol spectrometer (CAS) installed at a wing station of the Falcon 20 research aircraft. In addition, the European Centre for Medium-range Weather Forecast's (ECMWF) Integrated Forecasting System (IFS) provided the basis for flight planning. Atmospheric-state parameters from ECMWF Copernicus Atmosphere Monitoring Service (CAMS) were used for radiative transfer calculations with the software package libRadtran (Mayer and Kylling, 2005). From these calculations, we investigate the influence of an increase of cloud droplet number concentrations with decreasing droplet diameter in low-level clouds on radiative forcing and atmospheric heating rates.
2.1 In situ trace gas, aerosol and cloud instrumentation on the Falcon research aircraft
Particles and trace gases were measured with a set of well characterized instruments that have been deployed aboard the Falcon in previous flight campaigns (e.g., Voigt et al., 2010, 2022; Kleine et al., 2018).
2.1.1 The cloud and aerosol spectrometer (CAS)
The cloud and aerosol spectrometer (CAS) (Baumgardner et al., 2001; Voigt et al., 2021) mounted on an inner underwing position of the Falcon was used to measure the cloud droplet number and the droplet size distribution in a size range between 0.5 and 50 µm. A photodetector senses forward scattered light from an annulus between 4 and 12∘ from particles that pass through a laser beam within the depth of field. Assuming Lorenz–Mie's theory for spherical water droplets allows for the classification into 30 size bins for particles within a defined sample area. The CAS sample area (SA) of 0.25 ± 0.04 mm2 was determined by a water droplet beam mapping following the procedure outlined by Lance et al. (2010). The size calibration has been performed according to Borrmann et al. (2000) and Rosenberg et al. (2012), leading to uncertainties of ± 16 % of the droplet diameters (Dp) reported here. The subsequent application of a Mie binning proposed by Baumgardner et al. (2001) accounts for ambiguous assignments of scattering cross sections to corresponding droplet diameters leaving 18 unambiguous size bins. The time resolution of cloud measurements was set to 1 Hz. Coincident droplet measurements (Lance, 2012) were corrected with an empirical coincidence correction function derived by Kleine et al. (2018). The analyses of particle interarrival times render particle shattering (Field et al., 2003) negligible for this survey of warm low-level clouds. Cloud droplet number concentrations (CDNCs) were derived from counted droplet number (N) within a given time period (dt), size of the SA and aircraft's true airspeed (TAS):
The cloud droplet effective diameter (ED) is then calculated as the ratio of the cumulated droplet radii as follows:
Finally, the liquid water content (LWC) is derived as the integral of the mass of spherical water droplets over all size bins, assuming a water density of 1 g cm−3.
A statistical comparison by Taylor et al. (2019) of cloud data from the cloud spectrometers flown on the three research aircraft during DACCIWA shows an excellent agreement in CDNC data from two cloud droplet probes (CDPs) and the CAS, with a mutual agreement of the medians and quartiles within 5 %. As for the ED, all three probes agreed within approximately 1 µm.
2.1.2 Aerosol optical particle counter
Aerosol number concentrations and size distributions in the size range of 0.25 up to 3 µm are measured with the optical particle counter SkyOPC (Version 1.129; GRIMM Aerosol, Germany) sampling inside the fuselage behind an isokinetic aerosol inlet. The instrument can detect particles starting from 0.25 µm in diameter, the upper size limit is set by particle transmission efficiency of inlet and tubing and was found to be between 1.5 and 3 µm depending on flight altitude (Fiebig, 2001; Schumann et al., 2011). Water-saturation-dependent cloud condensation nuclei counters were not operated on the Falcon; therefore we use here the correlation between aerosol measured with the OPC and CO data as indicative of enhanced aerosol levels or pollution.
2.1.3 Trace gas instruments for CO and H2O
Since accumulation-mode aerosol measurements with the SkyOPC are affected by the presence of clouds, CO concentrations have been used to derive location and dilution of local sources such as urban emission plumes as well as local biomass burning sites (Haslett et al., 2019). CO mixing ratios were measured using infrared absorption spectrometry by the SPectrometre InfraRouge In situ Toute altitude (SPIRIT; Catoire et al., 2017). The instrument uses the effect of absorption in the mid-infrared spectrum by various trace gas species. The setup comprises three quantum cascade lasers (QCLs) enclosed within a Robert cell, where two parabolic mirrors ensure a sufficient absorption path length. Sampled air is drawn from a rear-facing inlet on the aircraft fuselage ducted via Teflon tubing to the instrument. Mass flow and system pressure are controlled by a scroll pump, an upstream regulator gauge and a dosing valve. The absorption behavior of an air sample is analyzed with the help of a photodetector. The overall uncertainty for CO measurements is estimated to be ± 4 ppbv, with a precision of ± 0.3 ppbv for flight measurements at a sampling time of 1.6 s (Catoire et al., 2017). Further trace gases to be measured with SPIRIT are NO2 and CH4 (Brocchi et al., 2019).
2.1.4 Wind, temperature and humidity
The Falcon basic measurement system captures the in situ meteorological data (i.e., pressure, temperature, humidity and 3-dimensional wind) as well as the position and attitude information of the aircraft. The reliability of the pitot static system was reviewed shortly before the DACCIWA campaign (Rotering, 2012). The measurement uncertainties for the pressure signals and subsequently the derived wind calculations are discussed in Bramberger et al. (2017). They derive for the pressure signals a measurement uncertainty of 0.5 hPa, for the vertical wind 0.3 and about 0.9 m s−1 for the horizontal wind components. The measurement uncertainty of the temperature signals is given with 0.5 K. However, due to wetting and evaporation biases, the accuracy is significantly reduced within clouds. Details about the measurement techniques and the applied corrections are described in Mallaun et al. (2015). Water vapor mixing ratios were measured with an uncertainty of ± 7 % with a CR-2 frost point hygrometer from Buck Research Instruments, LLC (Busen and Buck, 1995; Heller et al., 2017; Kaufmann et al., 2018) connected to a backward-facing inlet to exclude sampling of condensed water. The meteorological measurement system aboard the Falcon detected temperature and pressure with accuracies of ± 0.5 K and ± 0.5 hPa, respectively. From the water vapor and temperature data, the ambient relative humidity with respect to liquid (RHl) or ice (RHi) was calculated. In the air surrounding the clouds, RHl ranged near and below 100 % with an estimated uncertainty of ± 7 %.
2.2 Meteorological data sets
We use meteorological data analysis of the Integrated Forecasting System (IFS) of the European Centre for Medium-range Weather Forecast's (ECMWF) Copernicus Atmosphere Monitoring Service (CAMS) to describe the basic meteorological conditions and atmospheric composition in the African tropics in summer 2016 for radiative transfer simulations.
The spatial resolution of the data set is ∼ 80 km horizontally on 60 vertical levels from the surface up to 0.1 hPa. CAMS reanalyses are available on a 3-hourly time step. CAMS reanalysis was produced using 4DVar data assimilation in cycle 41r2 of ECMWF's Integrated Forecasting System (IFS) (Flemming et al., 2015). Here we use temperature, water vapor and other trace gas species as an input to the radiative transfer calculations.
2.3 Radiative transfer calculations
Radiative transfer calculations were carried out to show how the measured microphysical parameters of the boundary layer clouds affect the radiation budget of the atmosphere. Here, the radiative transfer solver DISORT (six streams for irradiances) of the 1-dimensional routine UVSPEC from the program package libRadtran (Mayer and Kylling, 2005) is used to calculate the effects of polluted and less polluted water cloud layers in the planetary boundary layer on static vertical profiles of irradiances and heating rates in the shortwave (SW from 0.24 to 5.0 µm) and the longwave spectral range (LW from 2.5 to 100 µm). Considered are all relevant radiative processes in the atmosphere–surface system, i.e., multiple scattering, absorption and thermal emission by atmospheric aerosol particles, cloud droplets, ice crystals, trace gases and the ground. The microphysical properties of cloud layers defined in libRadtran are described by the vertical profiles of the ED and LWC based on the observations. Below cloud base and above cloud top these values are set to zero. For the low-level water cloud, radiative transfer calculations are based on the vertical statistics on the LWC and ED profiles representing the cloud fields probed during the Falcon operation days. The low-level clouds measured around noon are compiled into a 1-layer surrogate, which is embedded between 790 and 1870 m and discretized into 60 model layers. To show the pure effect of different ED profiles on the radiation fields, it is assumed that the LWC profile for the polluted low-level water cloud is the same as for the less polluted cloud (see Sect. 4).
To study the effect of cloud layers overlying the boundary layer cloud, a thin medium–high water cloud and an ice cloud are added to the model atmosphere in a sensitivity study. The medium–high cloud is located between 4770 and 4840 m, the ice cloud between 9100 and 9700 m, as found on average in the measurements. LWC/IWC and ED profiles for these clouds have been taken from measurements from 6 July 2016 and are then gradually adjusted for sensitivity studies (Sect. 5.2). The translation of IWC and ED to the optical properties and the description of the ice crystals as a general habit mixture follow Baum et al. (2005a). In order to pinpoint the sole contribution to a cloud radiative effect only one representative vertical profile as on 29 June 2016 for the meteorological parameter temperature and pressure, and such air density, and the profiles of the trace gases H2O, O2, CO, CO2 and NO2 are taken from ECMWF CAMS data (Flemming et al., 2015). For CH4 and N2O, the default mixing ratios of libRadtran are chosen, i.e., 1.6 and 0.28 ppmv, respectively. The 12:00 and 18:00 UTC CAMS analysis are interpolated in space and time to the flight track of the Falcon on 29 June. Selected are vertical profiles close to the location of Lomé (Togo). The temperature profile used was compiled as a composite from all campaign flights. Regarding O3, GEMS data are used which include background ozone chemistry. All profiles are assumed to be constant over time.
To describe the reflection properties of the surface in the SW spectral range, the MODerate resolution Imaging Spectroradiometer (MODIS) broadband albedo product (MCD43C3) has been used (Schaaf and Wang, 2015). To be close to the cloud conditions during the campaign, the bihemispherical reflectance (white-sky albedo) has been selected. The MODIS product contains 16 d of data provided in a 0.05∘ (5600 m) latitude/longitude grid. Selected MODIS albedo data represent the 16 d from 29 June to 15 July 2016, thus covering the campaign period very well. Spatial averaging of the broadband white-sky albedo data over an area including the flights tracks gives α = 0.16. In the LW range a constant emissivity of ε = 0.99 is assumed, which after Wilber et al. (1999) should represent surfaces consisting of types like savanna and urban quite well. The aerosol optical thickness (AOT) has been derived from AERONET data for July 2016 based on measurements at the sites Koforidua Anuc (Ghana) and KITcube Save (Benin). Averaging the AERONET (Holben et al., 1998) data results in AOT = 0.38 at 0.55 µm. For the atmospheric boundary layer, the libRadtran aerosol type “urban” has been selected due to increased emissions from industry and the transport sector in the region around the main cities.
Radiative quantities
One basic model output is the instantaneous spectral irradiance FΔλ in W m−2 at each layer boundary from which the net irradiance Fnet,Δλ is calculated according to
Fup,Δλ is the upward and Fdown,Δλ the downward-directed irradiance integrated over the wavelength interval Δλ (here SW and LW). Upward-directed irradiances are counted negatively, and downward-directed irradiances are counted positively. The net radiative forcing RFnet in W m−2, as used in this study, is defined as the difference of the net irradiances calculated for the atmosphere with an embedded polluted cloud (CO > 155 ppbv) minus the net irradiances obtained for the less polluted cloud. Net irradiances are balanced over the SW and LW spectral ranges:
The ratio of the upward-directed irradiance to the downward irradiance at each model layer is defined as the albedo integrated over the wavelength interval Δλ:
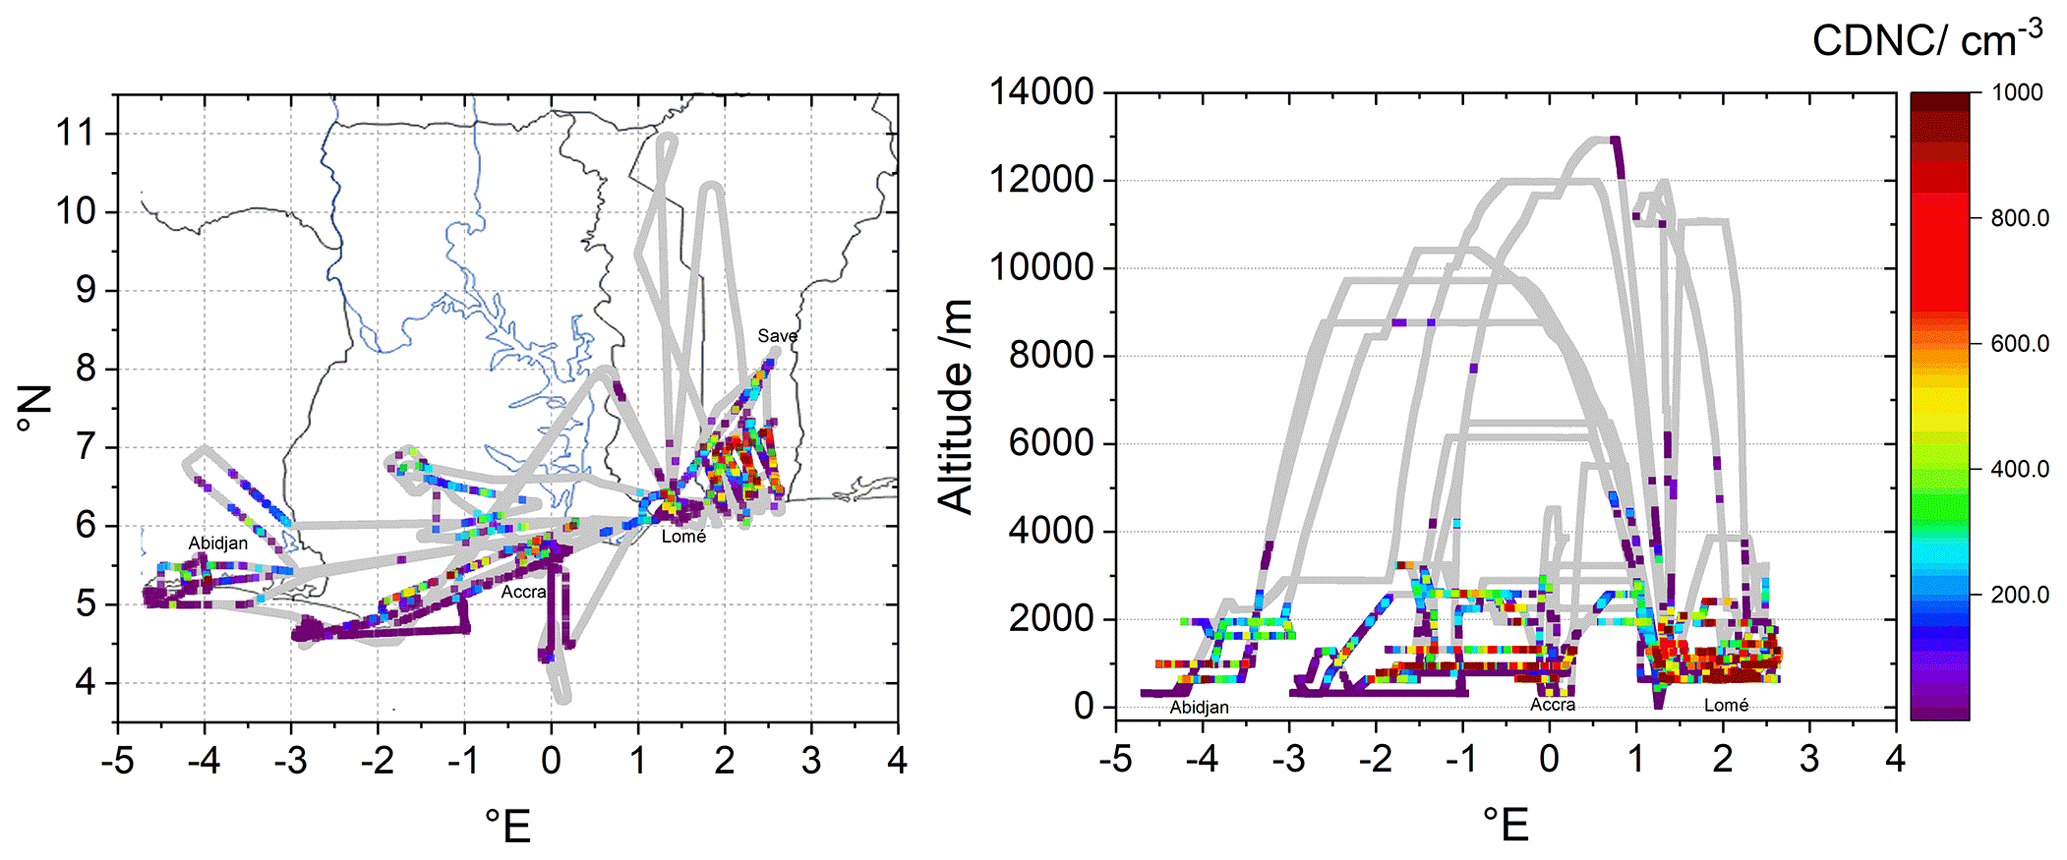
Figure 2Flight paths of the DLR Falcon research aircraft during the DACCIWA airborne measuring campaign from 29 June until 14 July 2016. Based in Lomé, Togo, 12 research flights in total led across the West African neighboring countries of Côte d'Ivoire, Ghana and Benin, as well as of segments above the Gulf of Guinea. Measured cloud sequences from the CAS-DPOL are color-coded along the flight tracks.
The heating rate HΔλ in K d−1 is integrated over the spectral interval Δλ (here SW and LW) and describes the temperature change of a model layer within a given time interval. It is defined as
with ρair denoting the air density and cp the specific heat capacity of air at constant pressure. represents the vertical divergence of the net irradiance Fnet,Δλ. Summing up HΔλ over the SW and LW spectral range results in the net heating rate Hnet.
Cloud measurements were performed with the CAS instrument during the 12 research flights led from Lomé, Togo, across the West African countries of Côte d'Ivoire, Ghana and Benin, with flight segments of above the Gulf of Guinea (Fig. 2). In order to characterize city plumes of the metropolitan regions of Lomé (Togo), Accra (Ghana), Abidjan (Côte d'Ivoire) and Save (Benin), sampling was performed during circuit flight patterns, covering the inflow as well as the outflow region of a city. The probing of the Lomé city plume was emphasized with multiple recurrent flights. Measured CDNC along the flight tracks (Fig. 2) in the Lomé downwind region to the east of the city uncover enhanced CDNC above 700 cm−3. Similar observations have been made around other close-by coastal cities in the region, with small CDNC below 70 cm−3 over coastal areas and enhanced CDNC further inland with concentrations between 210 and 490 cm−3 and enhanced CDNC in the vicinity or downwind region of conurbations. The density distribution of measured CDNC in low-level clouds, i.e., between ground and 1800 m (Fig. 3), peaks between 100 and 150 cm−3 with a median value around 250 cm−3. Towards the upper end of the distribution, CDNCs of 900 up to 950 cm−3 with a frequency of 1 % of occurrence can be found. Above that, CDNCs around 1300 cm−3 account only for less than 0.2 %.
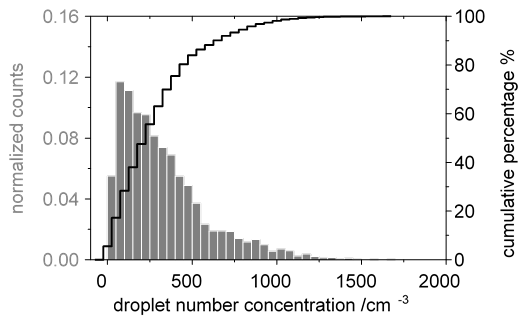
Figure 3Density distribution of measured cloud droplet number concentrations in low-level clouds across West Africa during the DACCIWA campaign as normalized counts and cumulative percentage.
3.1 Cloud classification for polluted and less polluted clouds
Measurements of cloud condensation nuclei (CCN) are unreliable within clouds as activated CCN grow to sizes too large to enter the aerosol inlet line and are therefore not measured by the OPC. In addition, the OPC lower cutoff size of 250 nm just measures the larger CCN. Therefore, carbon monoxide is used as a pollution marker and as a proxy for the amount of accumulation-mode aerosol in order to distinguish polluted from pristine or at least less polluted low-level clouds. Figure 4 shows a linear correlation between CO and accumulation-mode aerosol number concentrations outside clouds between 700 and 1800 m altitude. Although the lower part of the accumulation-mode aerosol might not lie within the measuring range of the SkyOPC-Probe, both parameters correlate linearly. This motivates our assumption that high CO mixing ratios can be regarded as a valid proxy for the abundance and number concentration of accumulation-mode aerosol, acting as potential CCN. Though, CO is a long-lived species that does not react with the cloud drops, accumulation-mode aerosols as cloud condensation nuclei might agglomerate and sediment or are subject to wet deposition and undergo a change in chemical composition (Capes et al., 2008). Also, different aerosol sources might affect the relationship between CO and aerosol measured with the OPC. Deviations from the overall linear correlation could be attributed to these effects. Throughout the campaign almost 40 % of the measured CO concentrations lie between 140 and 150 ppbv. The mean value of all CO mixing ratio measurements below 1800 m is 151 ppbv, with a median of 143 ppbv. This CO mixing ratio can be regarded as a CO seasonal average, originating from either local as well as remote sources in southern Africa (Haslett et al., 2019). In order to distinguish between polluted and less polluted air masses, we defined a threshold with CO mixing ratios lower than 135 ppbv (22nd percentile) as moderately polluted air masses and CO mixing ratios larger than 155 ppbv (79th percentile) as substantially polluted air masses. This nomenclature follows a classification used by Wendisch et al. (2016) from the ACRIDICON campaign in Brazil. CO mixing ratios between 60 and 160 ppbv within the South Atlantic maritime boundary layer as measured on Ascension Island during the CLARIFY-2017 campaign (Haywood et al., 2021) show comparable CO enhancements with the DACCIWA measurements, for periods within biomass burning plumes advected from central Africa. The correlation between CO and accumulation-mode aerosols below 1800 m and outside of clouds are analyzed in Fig. 4. CO measurements range between 120 and 300 ppbv. We find a linear correlation between aerosol number concentrations and CO with a slope of 2.83 (± 0.02) and a y intercept of −248.05 (± 2.65) with a R2 of 0.83.
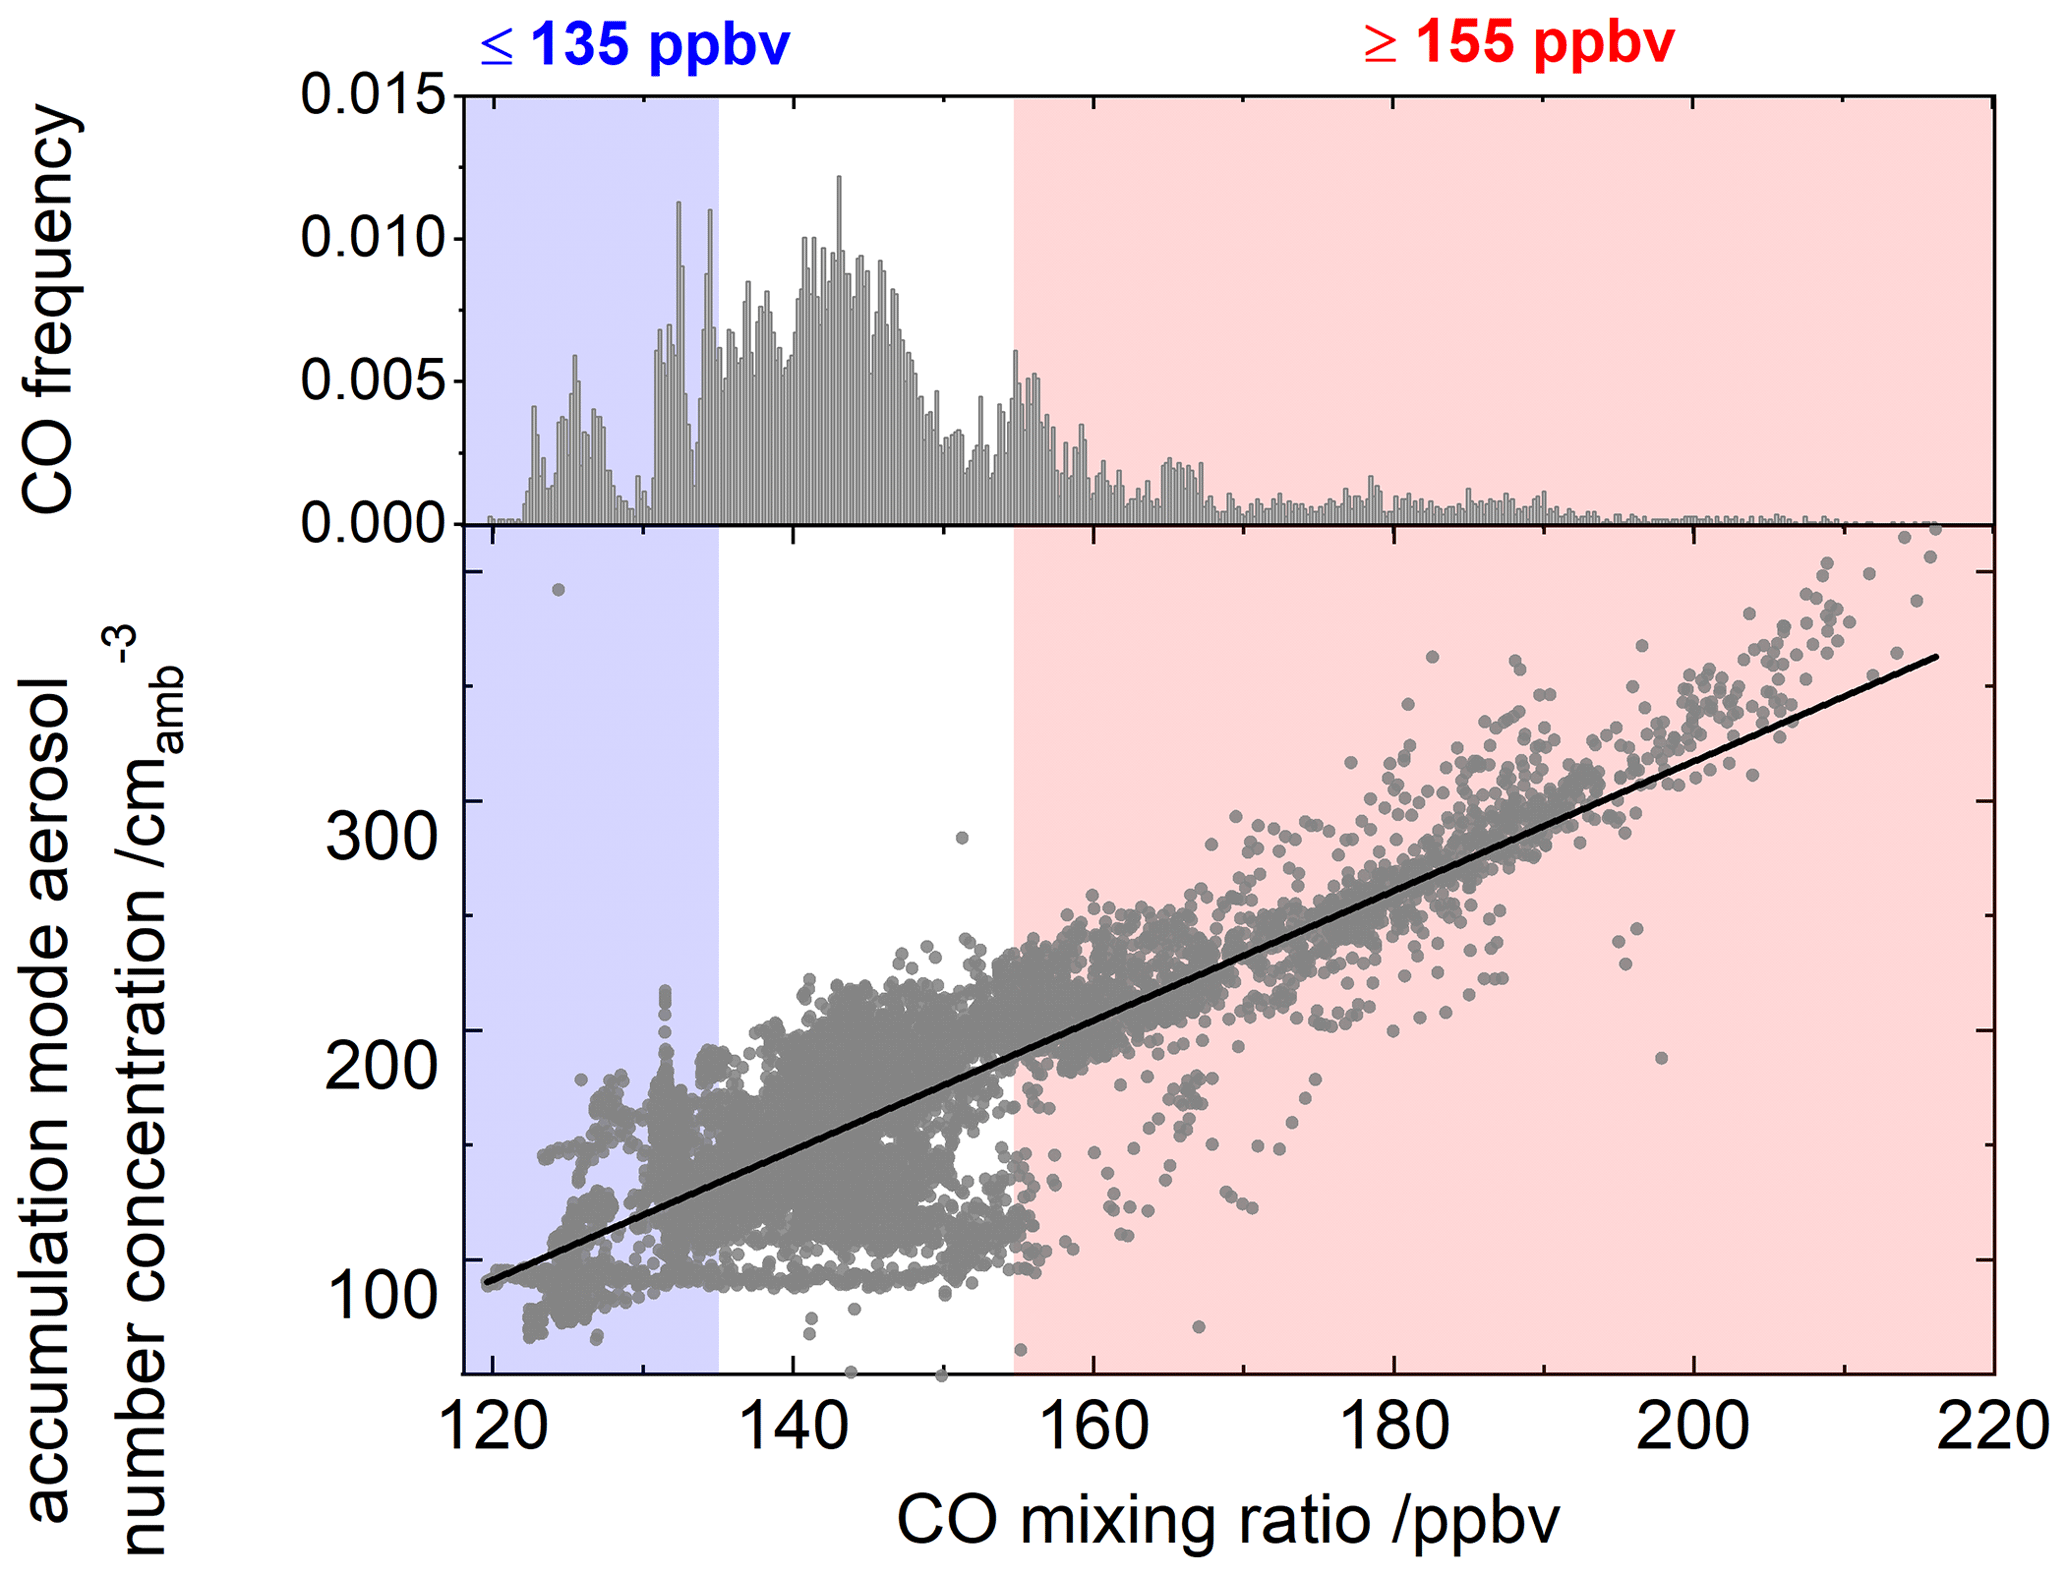
Figure 4Correlation of accumulation-mode aerosol and CO mixing ratio from all measurements < 1800 m of the DLR Falcon with a linear best fit of Ncacc−aerosol = (ppbv). The CO mixing ratio hence is used as a proxy for the degree of pollution and the abundance of activated cloud condensation nuclei within low-level clouds. Henceforth clouds with CO levels ≤ 135 ppbv (22nd percentile) and ≥ 155 ppbv (79th percentile) are characterized as less polluted or substantially polluted, respectively.
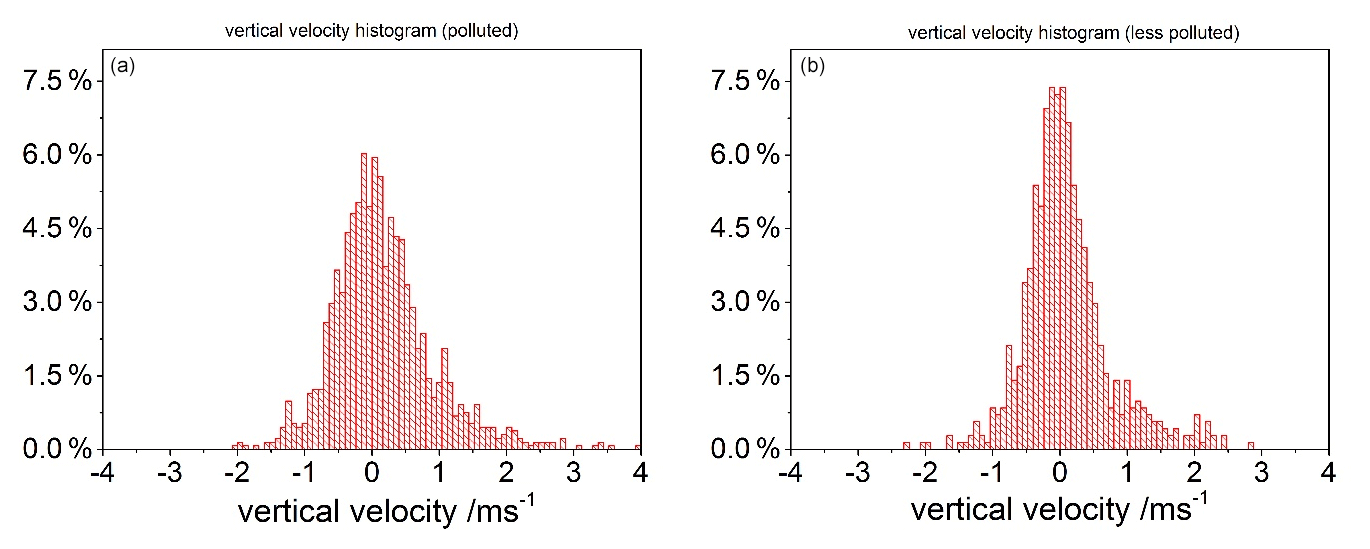
Figure 5Histograms of vertical velocities for the polluted (a) and less polluted (b) low-level clouds show an overall similar distribution, with median updraft speeds close to 0 m s−1 and standard deviations lower than 0.69 m s−1 in both cases.
3.2 Microphysical properties of tropical continental low-level clouds and influence of pollution
Particle size distributions of low-level clouds are shown in Fig. 6 for all cloud data measured in the boundary layer below 1800 m altitude. The cloud data were grouped into less polluted background clouds and polluted clouds using CO as pollution tracer. As already shown by Taylor et al. (2019) and Haslett et al. (2019), the less polluted clouds are still strongly influenced by biomass burning aerosol from southern Africa. Despite the high background CO mixing ratio also for the less polluted clouds, a difference is found in the cloud droplet size distribution of both cloud classes.
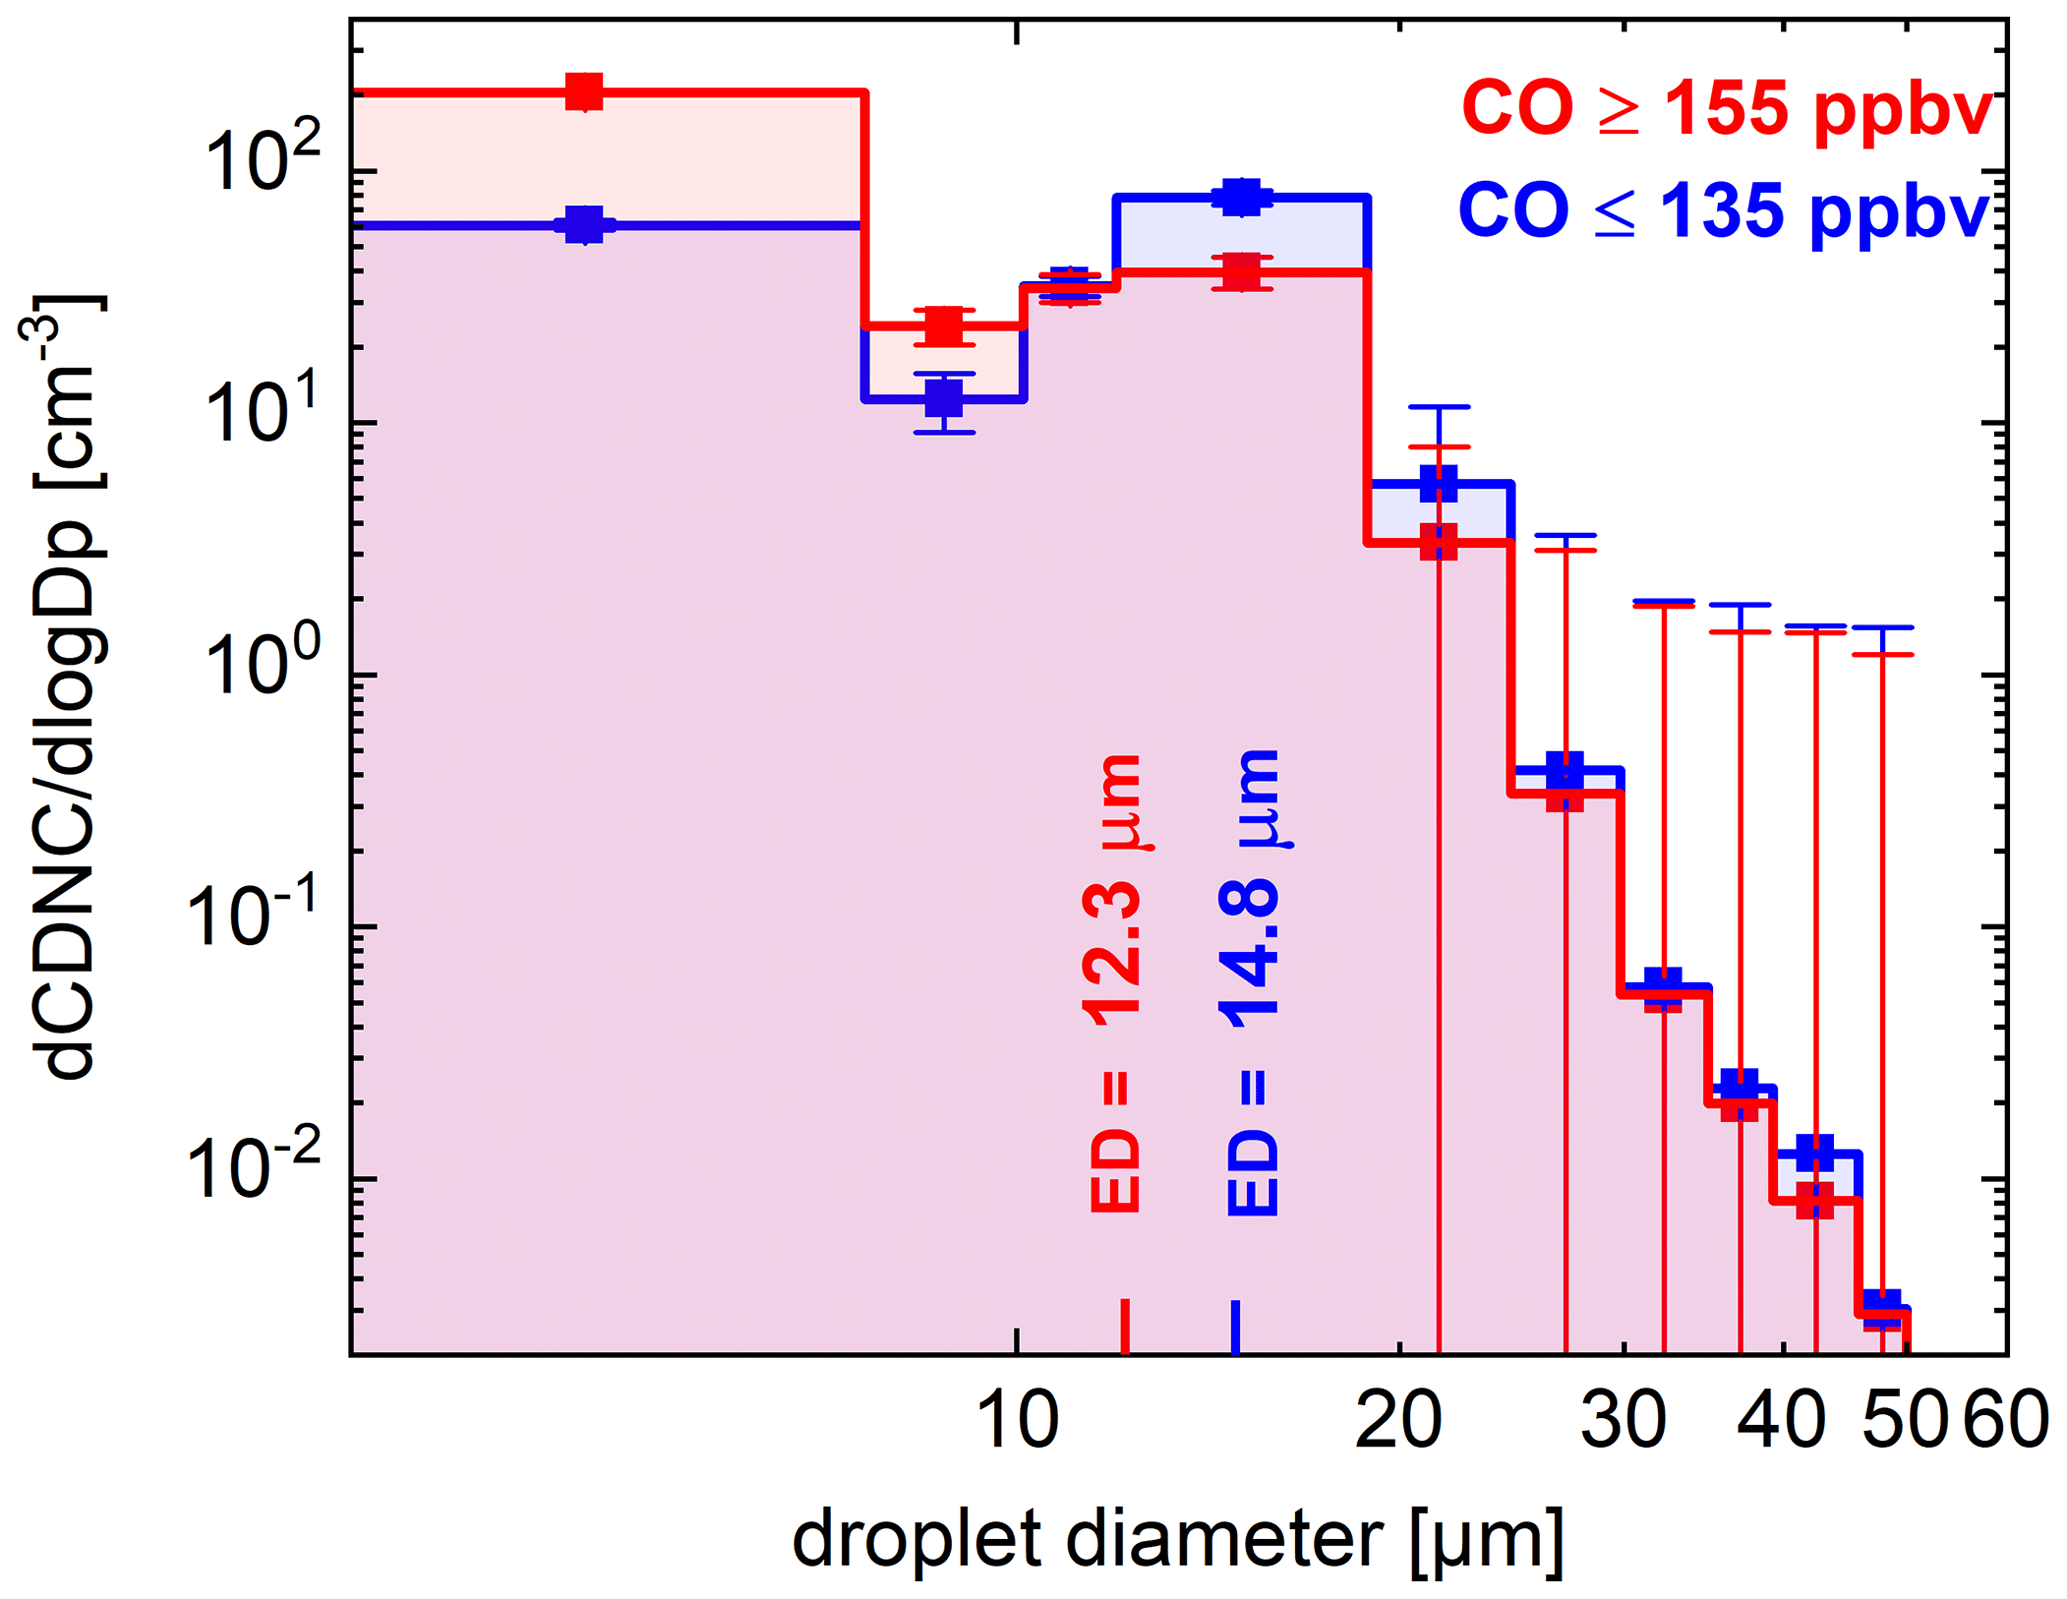
Figure 6Average cloud droplet size distributions (≥ 3 µm) of low-level clouds below 1800 m over West Africa from the cloud and aerosol spectrometer (CAS) measured during the DACCIWA campaign in summer 2016, separated into less polluted (blue) and substantially polluted (red) clouds according to CO mixing ratios ≤ 135 ppbv and ≥ 155 ppbv, respectively. The less polluted clouds have an effective cloud droplet diameter (ED) of 14.8 µm, and the substantially polluted clouds have an ED of 12.3 µm.
The mean effective diameter of the low-level less polluted clouds is 14.8 µm, and most of the measurements were performed between 10:00 and 14:00 UTC. The polluted clouds have a smaller ED of 12.4 µm; higher pollution levels tend to lead to an increase in cloud drop number and a decrease in cloud particle size. In our case, a 17 % reduction in particle size has been detected. The maximum of the particle size distribution of the polluted cloud is shifted towards smaller diameter, compared to the less polluted case. Variations between the size distribution decrease towards larger droplet diameters. A more accurate determination of the mode maximum in the substantially polluted case is limited due to Mie ambiguities in the lower size range. The majority of substantially polluted clouds were encountered in the city outflow regions along the West African coast. Variations in updraft speed have been shown to have a significant impact on cloud drop number concentrations, in particular at low updraft speeds (e.g. Moore et al., 2013, Taylor et al., 2019; Braga et al., 2017a, b, 2022; Cecchini et al., 2017; Dadashazar et al., 2021, Kirschler et al., 2022). In order to investigate potential effects of updraft speed variations on cloud droplet number concentrations, we derived probability density functions of the updraft speeds measured with the Falcon basic measurement system for the polluted and less polluted cloud cases.
As shown in Fig. 5, the difference between the two vertical velocity distributions is minor, as peak relative frequency of occurrence differs by 1.5 %. The median vertical velocities of 0.01 m s−1 (−0.09 m s−1) in polluted (less polluted) low-level clouds indicate no discernible overall trend in vertical motion during measurements, with no statistically significant difference in updraft speed distributions for high and less polluted clouds. In both cases, the standard deviations are 0.69 m s−1 (0.62 m s−1), with maximum vertical velocities reaching 4 m s−1 (3 m s−1). Since differences in updraft speed distributions are small for the polluted and less polluted cases in our study, we have assumed that it has only a minor influence on changes in cloud particle size distributions.
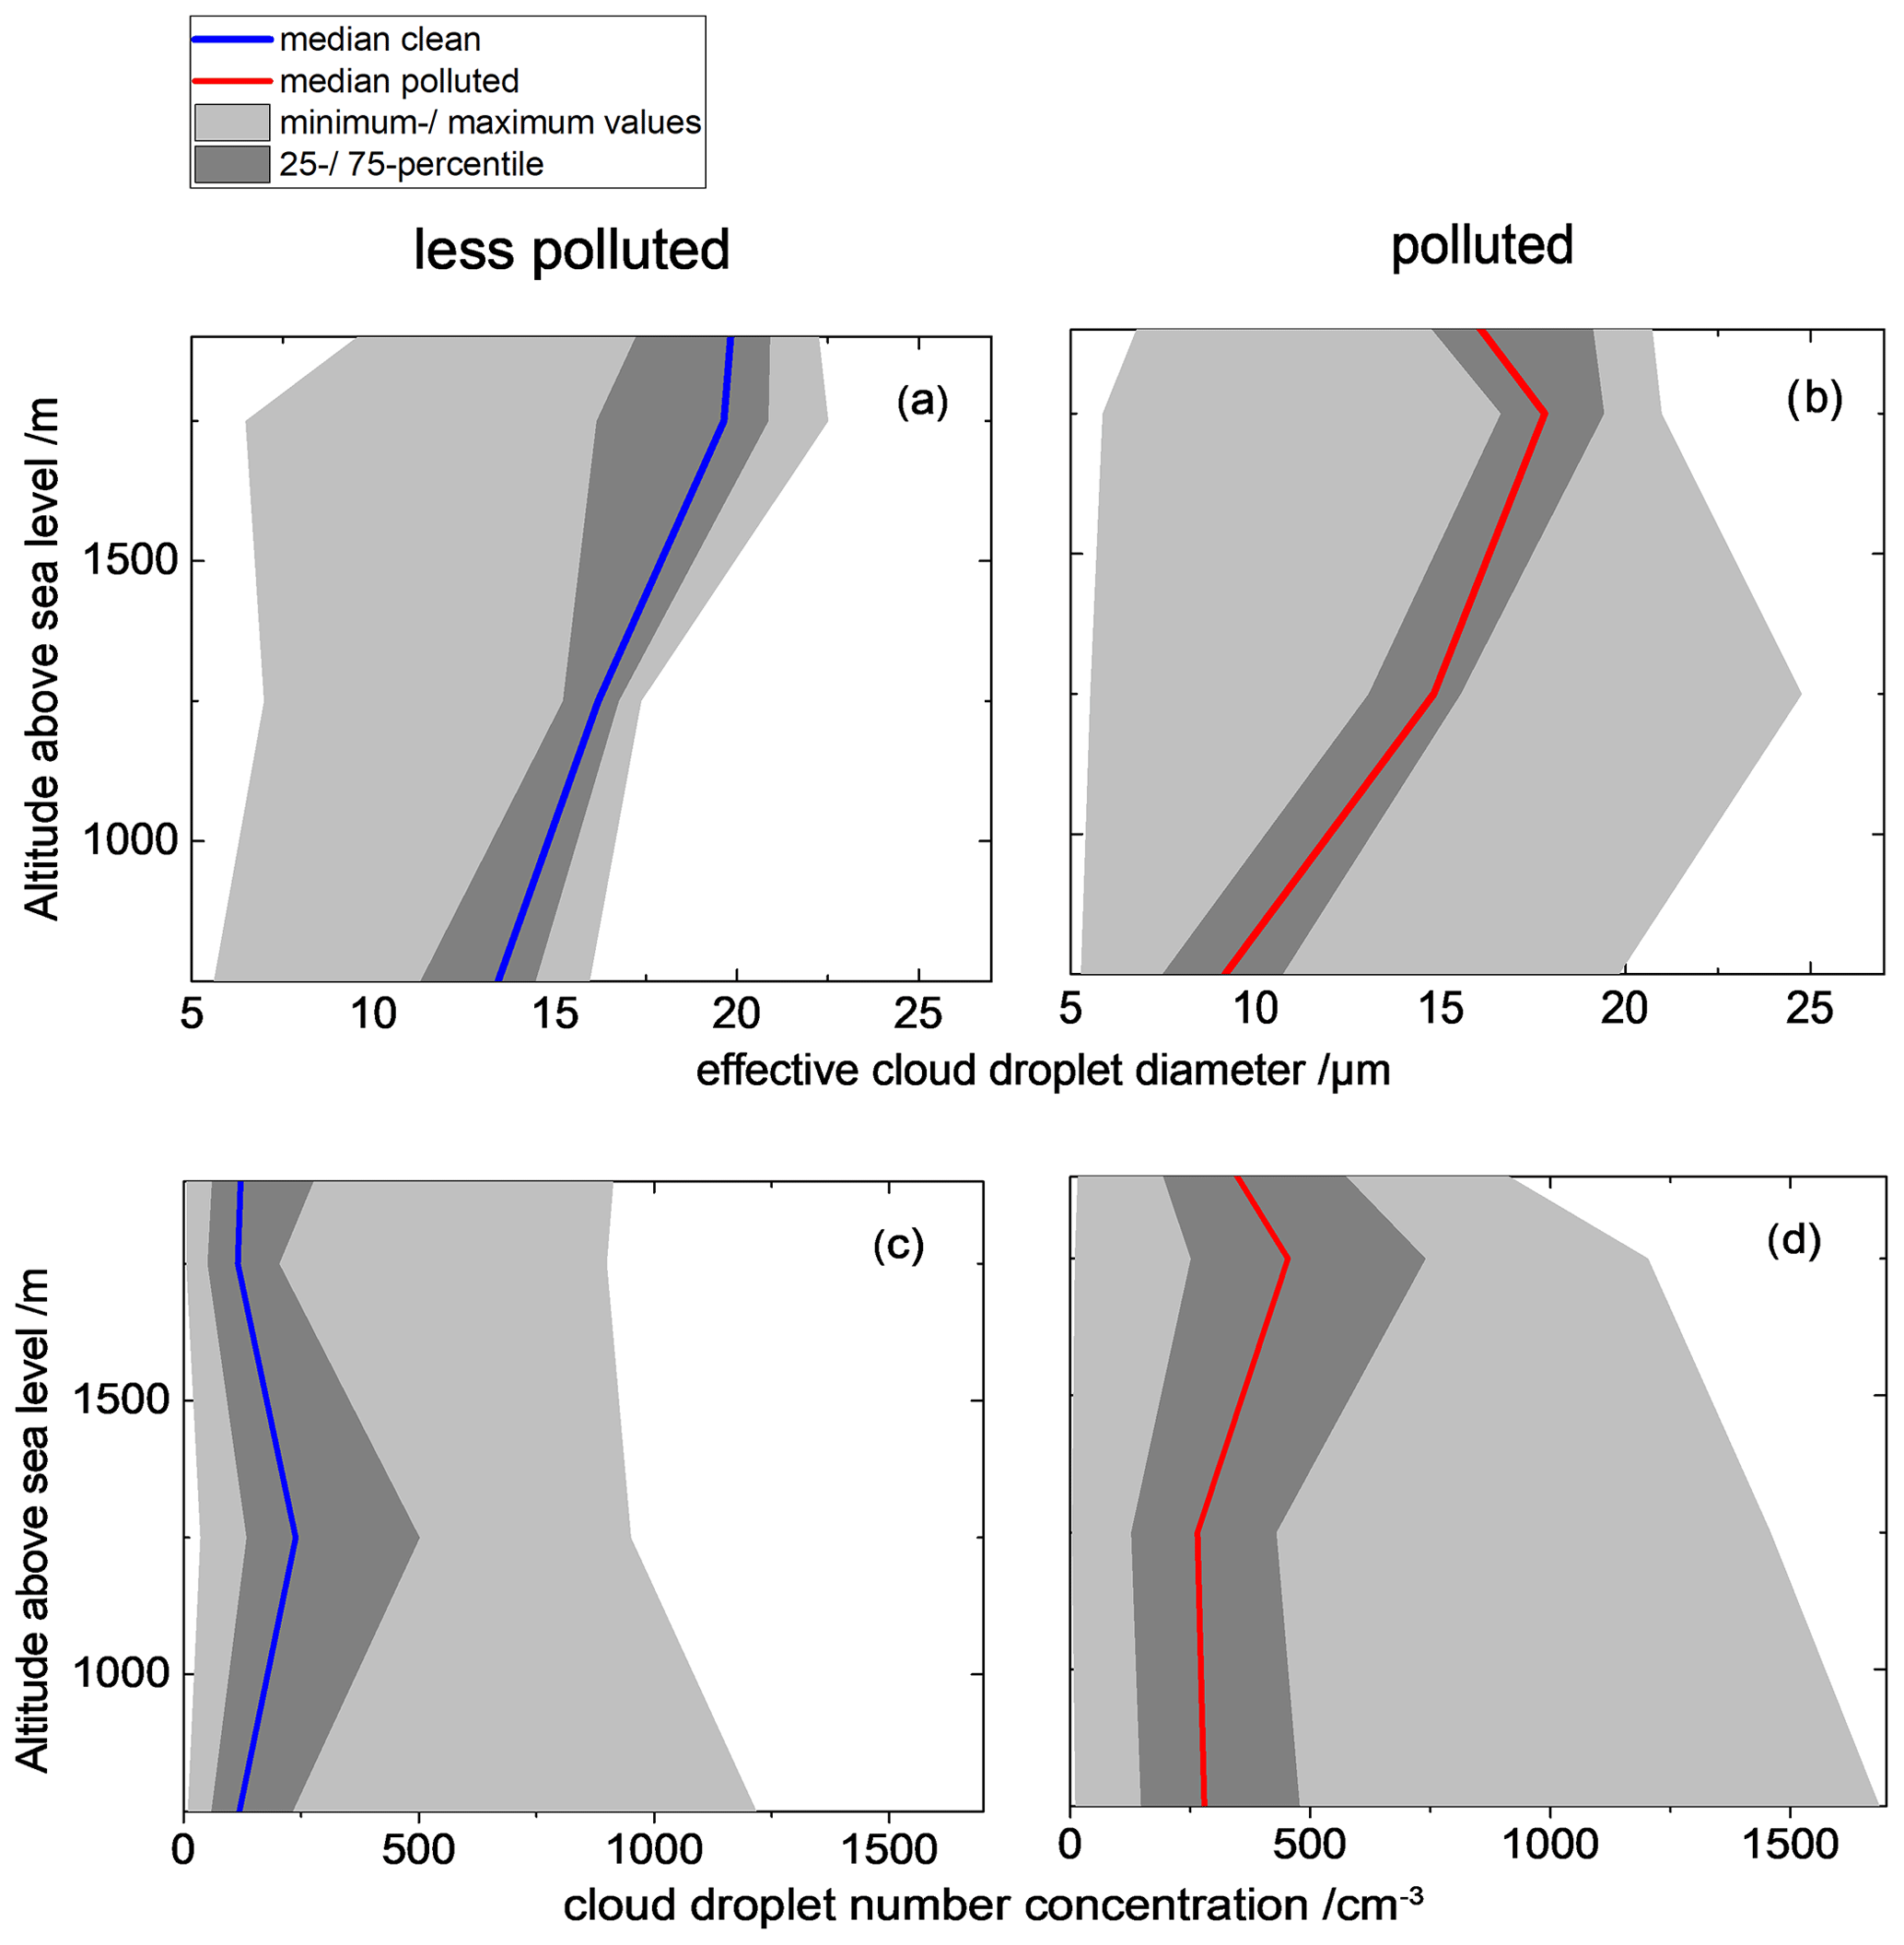
Figure 7Vertical statistics of cloud microphysical properties for less polluted and polluted clouds: (a, b) cloud effective diameter and (c, d) cloud droplet number concentration from measurements of low-level clouds at various heights and various cloud bases.
An analysis of a vertical dependency on microphysical properties to reveal relevant cloud features in low-level clouds is shown in Fig. 7. The determination of the vertical cloud structure is a representation of a height-bin-averaged profile over all campaign flights with the DLR Falcon performed around noon. They show a cloud base height (CBH) at an average of 666 ± 83 m and cloud top height (CTH) around 1909 ± 440 m. Instead of a single continuous compact cloud layer, different cloud encounters of different low-level clouds were compiled into a single vertical profile. The profiles of CDNC and ED of the less polluted (CO ≤ 135 ppbv) and the polluted clouds (CO ≥ 155 ppbv), compiled as averages of all low-level cloud measurements in various heights and with various cloud bases, show smaller cloud droplets in the polluted clouds over the complete altitude range below 1800 m and generally higher CDNC. The less polluted clouds already show larger ED in the lowermost cloud layer. The median ED as generally dependent on height above cloud base increases almost steadily up to 19 µm. The largest difference in ED between both cloud classes is visible in the lowermost layer, with median values of 9 and 14 µm. The polluted case also reaches its largest droplet radius at 1700 m altitude but shows smaller droplet diameters of 16 µm compared to 19 µm for the less polluted case.
Generally lower droplet number concentrations were observed for the less polluted clouds compared to the substantially polluted clouds. The less polluted clouds have a median CDNC of 110 cm−3 in the lowest cloud layer, and the median CDNC increases to near 200 cm−3 in the middle of the cloud. A decrease in CDNC is measured at the top of the cloud layer. In the polluted case, near surface values of CDNC are already increased compared to the less polluted clouds. Starting from 250 cm−3 (median) in the lowest altitudes, CDNC shows a slight decrease towards the middle of the cloud and a distinct increase of the droplet number concentration in the higher cloud layer up to 440 cm−3. Averaged over the entirety of low-level clouds in the less polluted case, median CDNC of 240 cm−3 was measured, with a variability as indicated by the 25th and 75th percentiles of 52 to 501 cm−3. The polluted clouds have higher mean CDNC of 324 cm−3 and a 25 % to 75 % range of 60 to 740 cm−3. Hence, the polluted clouds contained 26 % more cloud drops than the less polluted reference case. An aerosol effect on clouds and its implications for the radiation budget (Twomey, 1991) could lead to an increase in cloud droplet number concentration, at the same time reducing the effective radius, given that the liquid water content is similar (since LWC is basically given by the amount of condensable water and thus by the updraft speed).
The origin and long-range transport of aerosol, as is the case in West Africa, could play a role for the relationship between aerosol number concentration and the ED of clouds (e.g. Panicker et al., 2010). A saturation of the Twomey effect has been observed at AOTs of 0.4 to 0.5 and above by Wang et al. (2015). A mean AOT of 0.38 from the AERONET data in the campaign region might explain the comparatively small difference in effective diameters between polluted and less polluted low-level clouds in our study.
Toll et al. (2019) found in pollution tracks in various regions around the globe that aerosols generally increase cloud brightness, mainly due to the Twomey effect. An increase of the liquid water path (LWP) as a result of cloud adjustment would be canceled out by an entrainment effect, which leads to an overall reduced sensitivity of LWP towards anthropogenic emissions. This study shows that a decrease of the LWP can offset the Twomey effect by 23 %.
Wall et al. (2022) suggest that LWP is reduced by increases in sulfate aerosol, accompanied by a delay or suppression of precipitation. Also, Pante et al. (2021) find a correlation between increased anthropogenic aerosol emissions and reduced rainfall during the DACCIWA campaign.
Another study by Manshausen et al. (2022) found a significant negative forcing as a result of an increase of the LWP in ship tracks. The presence of a strong inversion opposes this effect, leading to the assumption that a deepening of clouds is necessary for an LWP amplification.
The pollution effect identified in our study, without being able to distinguish between various contributions to cloud adjustments, is used as a basis to derive the instantaneous cloud radiative forcing and the instantaneous heating rates based on greater CDNC and smaller ED.
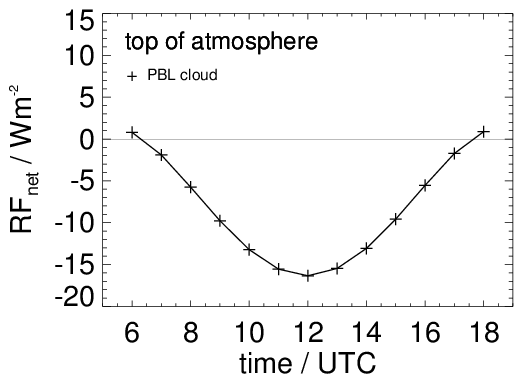
Figure 8Diurnal cycle of net radiative forcing (RFnet) at the top of the atmosphere for 29 June 2016 containing one horizontally homogeneous water cloud in the planetary boundary layer (PBL cloud) between 790 and 1870 m.
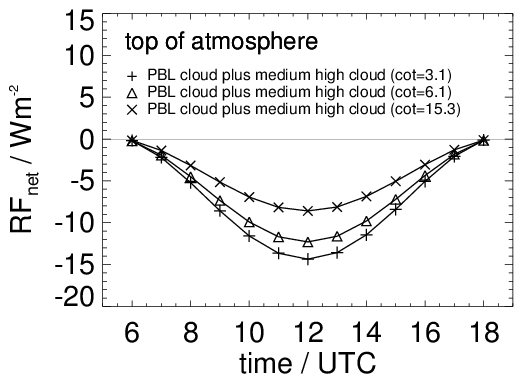
Figure 9As in Fig. 8, but for the atmosphere containing two water cloud layers, i.e., one cloud in the planetary boundary layer (PBL cloud) located between 790 and 1870 m and medium–high clouds of different optical thicknesses located between 4770 and 4840 m. The curve marked with crosses results for the medium–high cloud of measured cloud optical thickness (COT) of 3.1 at 0.55 µm, the two other curves represent net radiative forcings for artificially increased COT values as indicated.
Figure 8 presents the diurnal cycle of the instantaneous net radiative forcing, RFnet, at the top of the atmosphere (TOA) as the difference of the net irradiances between the polluted and less polluted case for the horizontally homogeneous water cloud in the planetary boundary layer. The cycle of the solar zenith angle (SZA) corresponds to day 180 (28 June 2016) as of the beginning of the flight campaign. Shown are the results from 06:00 to 18:00 UTC. During night the net forcing is determined solely by the irradiances in the longwave spectral range leading to a temporally constant value of RFnet = +1.1 W m−2 according to the assumption of a fixed temperature profile. During daytime the net forcing depends on the SZA and is negative with a minimum of RFnet = −16.3 W m−2 at 12:00 UTC. The SW forcing dominates the LW forcing during daytime. Negative forcing values are caused by a higher cloud albedo in the polluted case, a consequence of smaller effective diameter. At 12:00 UTC (08:00 UTC) the SW albedo (Eq. 6) at the top of the cloud (TOC) is 0.81 (0.85) for the polluted cloud against 0.79 (0.84) for the less polluted cloud.
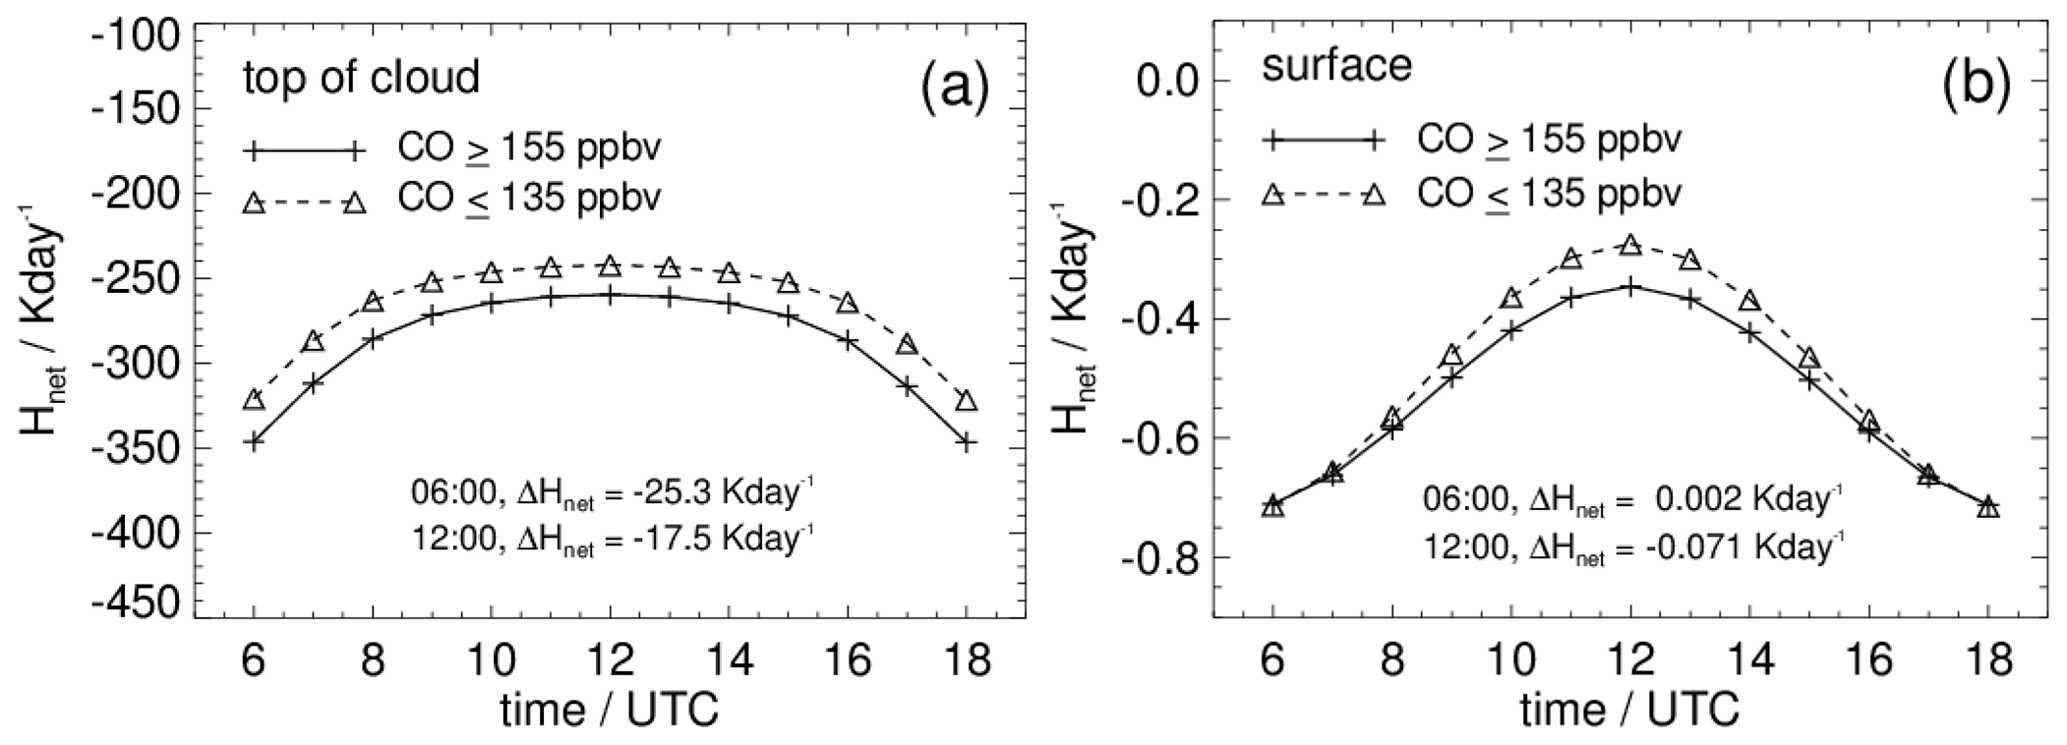
Figure 10Diurnal cycles of instantaneous net heating rates (Hnet) at the top of the boundary layer cloud (a) and at the surface (b) for the polluted (CO ≥ 155 ppbv) and the less polluted atmosphere (CO ≤ 135 ppbv). ΔHnet denotes the difference of Hnet for the polluted and the less polluted case at the times indicated.
Averaging the net forcing calculated for TOA over 24 h gives RFnet = −3.9 W m−2. Note that all numbers for RFnet given in this section are valid for a horizontally homogenous cloud layer of 100 % coverage. The net forcing, which, as defined in this study, is based on the Twomey effect only, decreases with decreasing cloud cover.
As Hill et al. (2018) have shown that low-level clouds often coincide with medium- and high-level cloud layers, we perform a sensitivity study on the net RFnet including clouds at higher altitudes above a low-level cloud layer with polluted and less polluted microphysical properties. Figure 9 shows diurnal cycles of the TOA net forcing for an atmosphere containing a second, geometrically thin water cloud located between 4770 and 4840 m above the boundary layer cloud. The microphysical properties of this cloud stem from a single measurement, and pollution effects for this cloud are not considered. The LWC and ED profiles result in a cloud optical thickness of 3.1. Figure 9 shows that scattering processes at this second medium–high cloud layer slightly dampen the TOA net forcing caused by the pollution of the boundary layer cloud. At 12:00 UTC the model gives RFnet = −14.4 W m−2 compared to RFnet = −16.3 W m−2 for the atmosphere containing only one cloud layer (Fig. 7). Increasing the optical thickness of the medium–high cloud to COT = 6.1 (COT = 15.3) by increasing the LWC by a factor of 2 (Eq. 3) in each layer, in order to estimate the sensitivity of this additional cloud layer regarding the net radiative forcing, results in RFnet = −12.3 W m−2 (RFnet = −8.6 W m−2) at 12:00 UTC (Fig. 8). Averaging over 24 h reduces TOA net forcing values to −4.0 W m−2 (COT = 3.1), −3.4 W m−2 (COT = 6.1) and −2.4 W m−2 (COT = 15.3). These numbers are valid for a horizontally homogeneous medium–high cloud with 100 % coverage. Note, a smaller coverage of medium–high clouds over the homogeneous boundary layer cloud would have less dampening impact on the net forcing at TOA due to a reduced effective optical thickness.
Finally, simulations were carried out for an atmosphere with an additional ice cloud layer located between 9100 and 9700 m. Since the measured microphysical parameters lead to an optical thickness clearly below 0.1, COT has been increased to 0.3 by manipulation of the IWC while keeping the vertical extension of the ice cloud. As expected, the additional effect of an optically thin ice cloud layer on the TOA net forcing turns out to be weak. For example, simulations that take into account three cloud layers give W m−2 at 12:00 UTC in comparison to W m−2 valid for the two-cloud layer configuration with a medium–high cloud of COT = 6.1.
In order to get an idea how both, polluted and less polluted low-level clouds independently locally affect a surrounding temperature profile, Fig. 10a and b display diurnal variations of instantaneous net heating rates Hnet at the top of the boundary layer cloud (TOC) and at the surface, respectively. At TOC (Fig. 10a) and at the surface (Fig. 10b) the LW cooling dominates the SW heating during daytime, de facto leading to net cooling rates at both altitudes. At 12:00 UTC the polluted cloud (less polluted cloud) gives a LW cooling rate of K d−1 (−317.8 K d−1) at the TOC, whereas the corresponding SW warming rate results in K d−1 (+75.6 K d−1). With increasing SZA the SW warming decreases approaching zero, at SZA ≤ 0 only LW cooling is effective. The curve for the polluted atmosphere shows higher cooling rates compared to that of the less polluted atmosphere (Fig. 10). The reason is the higher optical thickness of the polluted model cloud (COT =85.7 vs. COT =75.6) leading to a greater vertical divergence of net irradiances (Eq. 7) at the top of the cloud. Differences in net heating rates between both cases range between −17.5 K d−1 at noon and −25.3 K d−1 at 06:00 UTC. Averaging the instantaneous net heating rate differences at TOC over 24 h gives a value of −22.8 K d−1. In case of an atmosphere containing the low- and medium-level water cloud, the cooling rate difference results in 0.1 K d−1 at the top of the medium–high cloud at 12:00 UTC (not shown). At the surface (Fig. 10b), cooling rates are strongly reduced due to the overlying homogenous cloud, which causes very small divergences of net irradiances. Cooling rate differences due to pollution effects are almost negligible; the maximum difference at 12:00 UTC is −0.07 K d−1.
This study presents a comprehensive data set of in situ cloud measurements from the research aircraft Falcon 20 in tropical West Africa during the monsoon onset season. This data set contributes to fill the gap of scarce measurement coverage in the Gulf of Guinea, ranging as far as Benin to the east and Côte d'Ivoire in the west. We also investigate effects of pollution on low-level clouds and on the radiation budget in this region. The characterization of low-level clouds (below 1800 m altitude) over this region, between 29 June and 14 July 2016 shows median cloud droplet number concentrations around 270 cm−3, as measured from the CAS underwing probe. To identify aerosol–cloud effects, we aimed to classify the probed air according to an apparent pollution level in terms of accumulation-mode aerosol number concentration and relate these directly to respective clouds. Because measurements within clouds are flawed once CCN is activated, we correlated aerosol number concentrations (> 0.25 µm) outside clouds with CO mixing ratios measured with the SPIRIT absorption spectrometer aboard the Falcon. A linear trend shows the relation between these two parameters. Using the CO mixing ratio as a proxy for the pollution level of an air mass, we regard CO ≤ 135 ppbv and CO ≥ 155 ppbv as less polluted and substantially polluted, respectively. Although a high biomass burning aerosol background entrained from central Africa reduces the delta between both classes and reduces the susceptibility to additional local emissions, an aerosol–cloud effect is still visible in cloud microphysical properties, showing effective droplet diameter between 12.3 µm in the polluted case, compared to an ED of 14.8 µm in the less polluted case and CDNCs that almost double (median) in the polluted case.
The influence of the pollution level on the local radiative budget as an instantaneous net forcing and derived instantaneous heating rates between both cases of low-level clouds was the subject of a modeling study with the libRadtran 1-dimensional radiative transport model under application of the UVSPEC/DISORT solver. Seeding the simulation with the microphysical properties from the in situ measurements shows a negative radiative net forcing at TOA (Fnet, SW + LW, CO ≥ 155 ppbv minus Fnet, SW + LW, CO ≤ 135 ppbv) integrated over the day for the low-level boundary layer cloud. Thus, in a polluted atmosphere, changes due to ED would locally lead to a further cooling of the earth–atmosphere system, with a net forcing of −16.3 W m−2 at noon and an 24 h average of −3.9 W m−2. To put this into perspective: a comparison in net radiative forcings at TOA of a substantially polluted cloud layer with a cloud-free scenario, as reference baseline, results in −638.2 W m−2 at 12:00 UTC with a 24 h average of −196.6 W m−2, the LW contribution is + 9.4 W m−2. Thus, net forcing at TOA accounts for only 2.6 % of the net forcing of the reference case (CO ≥ 155 ppbv minus cloud free). This difference in instantaneous net radiative forcing caused by slightly altered cloud droplet number concentration and effective diameter shows the non-linearity of radiative properties and degree of pollution on low-level clouds, especially when considering already polluted background conditions.
As the occurrence of layered cloud structures with medium and high-level clouds atop a low-level cloud layer still poses an uncertainty in weather models, this scenario was also simulated, suggesting that net forcing effects due to pollution are discernible at TOA. Maximum net forcing values at TOA range between −16.3 W m−2 (one cloud layer) and −8.5 W m−2 (three cloud layers), with a 24 h average of these maximum forcings at TOA divided by a factor of about 3.5. The direct effect of this instantaneous net radiative forcing translated into an instantaneous net heating rate (SW + LW) at TOC of a low-level less polluted compared to a substantially polluted boundary layer cloud changes by about −18 K d−1 at 12:00 UTC and −25 K d−1 at 06:00 UTC. Again, the net heating rate of the scenario with vertically layered clouds with each cloud subset as low-level cloud shows that changes due to pollution are negligible at the surface and at TOC.
In order to determine an effective radiative forcing based on instantaneous heating rates, further studies of cloud and atmospheric adjustment are needed using a thermodynamic model that also accounts for adjustment of cloud microphysics. The adjustments according to the demonstrated aerosol–cloud interaction and corresponding radiative response cannot be simulated by use of a 1-dimensional RT-model like the UVSPEC/DISORT routine from libRadtran, and the calculation is out of the scope of our study. These results confirm observations by previous studies and not only extend them by a detailed analysis of instantaneous radiative effects of low-level clouds under consideration of different pollution levels but also take into consideration the presence of layered cloud structures with a variation of the pollution level within the lowermost cloud layer. The growing economy and ongoing urbanization in West Africa suggest further increases in aerosol emissions and related changes in cloud condensation nuclei concentrations in future. Still, our study suggests that clouds have a lower susceptibility to aerosol in a regime with high background aerosol concentrations and that related instantaneous cloud radiative forcing changes are small and might be damped by medium–high and high clouds.
Results of this study are representative for the monsoon onset period in West Africa, associated with long-range transport of biomass burning aerosol related to agricultural land use in southern and central Africa where each year slash-and-burn methods are used for land cultivation. It remains to be investigated whether the results from this study can be transferred to other regions in the world with higher pollution levels.
The data obtained during the DACCIWA campaign are available from the SEDOO database (http://baobab.sedoo.fr/DACCIWA/, BAOBAB, 2020). Operational meteorological analyses are available from the MARS archive at ECMWF (https://apps.ecmwf.int/archive-catalogue/, ECMWF, 2016). CAMS analyses are available via https://apps.ecmwf.int/archive-catalogue/?class=mc (ECMWF, 2023). AERONET data are accessible via https://aeronet.gsfc.nasa.gov/cgi-bin/webtool_aod_v3 (NASA, 2023).
VH, JK, DS, SK and MM performed the measurements and analyzed the data. VH and CV performed the scientific study, RM conducted radiative transfer calculations, and VH and RM wrote the paper. All authors contributed to the paper.
The contact author has declared that none of the authors has any competing interests.
Publisher's note: Copernicus Publications remains neutral with regard to jurisdictional claims in published maps and institutional affiliations.
We thank the DLR flight department including the sensor and data team for excellent support and flight operations in West Africa during DACCIWA.
This research has been supported by the EU DACCIWA funding. Christiane Voigt and Manuel Moser are funded by the Deutsche Forschungsgemeinschaft (DFG; German Research Foundation) under grant nos. SPP PROM Vo1504/5-1, SPP HALO1294 1504/7-1 and TRR 301 – project ID 428312742.
The article processing charges for this open-access publication were covered by the German Aerospace Center (DLR).
This paper was edited by Philip Stier and reviewed by Michael Diamond and one anonymous referee.
Baklanov, A., Schlünzen, K., Suppan, P., Baldasano, J., Brunner, D., Aksoyoglu, S., Carmichael, G., Douros, J., Flemming, J., Forkel, R., Galmarini, S., Gauss, M., Grell, G., Hirtl, M., Joffre, S., Jorba, O., Kaas, E., Kaasik, M., Kallos, G., Kong, X., Korsholm, U., Kurganskiy, A., Kushta, J., Lohmann, U., Mahura, A., Manders-Groot, A., Maurizi, A., Moussiopoulos, N., Rao, S. T., Savage, N., Seigneur, C., Sokhi, R. S., Solazzo, E., Solomos, S., Sørensen, B., Tsegas, G., Vignati, E., Vogel, B., and Zhang, Y.: Online coupled regional meteorology chemistry models in Europe: current status and prospects, Atmos. Chem. Phys., 14, 317–398, https://doi.org/10.5194/acp-14-317-2014, 2014.
BAOBAB: SEDOO database – DACCIWA, BAOBAB [data set], http://baobab.sedoo.fr/DACCIWA/, last access: 27 February 2020.
Baum, B. A., Heymsfield, A. J., Yang, P., and Bedka, S. T.: Bulk Scattering Properties for the Remote Sensing of Ice Clouds. Part I: Microphysical Data and Models, J. Appl. Meteor., 44, 1885–1895, https://doi.org/10.1175/JAM2308.1, 2005a.
Baumgardner, D., Jonsson, H., Dawson, W., O'Connor, D., and Newton, R.: The cloud, aerosol and precipitation spectrometer (CAPS): a new instrument for cloud investigations, Atmos. Res., 59–60, 251–264, 2001.
Borrmann, S., Luo, B., and Mishchenko, M.: 2000: Application of the T-Matrix method to the measurement of aspherical (ellipsoidal) particles with forward scattering optical particle counters, J. Aerosol Sci., 31, 789–799, 2000.
Braga, R. C., Rosenfeld, D., Weigel, R., Jurkat, T., Andreae, M. O., Wendisch, M., Pöhlker, M. L., Klimach, T., Pöschl, U., Pöhlker, C., Voigt, C., Mahnke, C., Borrmann, S., Albrecht, R. I., Molleker, S., Vila, D. A., Machado, L. A. T., and Artaxo, P.: Comparing parameterized versus measured microphysical properties of tropical convective cloud bases during the ACRIDICON–CHUVA campaign, Atmos. Chem. Phys., 17, 7365–7386, https://doi.org/10.5194/acp-17-7365-2017, 2017a.
Braga, R. C., Rosenfeld, D., Weigel, R., Jurkat, T., Andreae, M. O., Wendisch, M., Pöschl, U., Voigt, C., Mahnke, C., Borrmann, S., Albrecht, R. I., Molleker, S., Vila, D. A., Machado, L. A. T., and Grulich, L.: Further evidence for CCN aerosol concentrations determining the height of warm rain and ice initiation in convective clouds over the Amazon basin, Atmos. Chem. Phys., 17, 14433–14456, https://doi.org/10.5194/acp-17-14433-2017, 2017b.
Braga, R. C., Rosenfeld, D., Andreae, M. O., Pöhlker, C., Pöschl, U., Voigt, C., Weinzierl, B., Wendisch, M., Pöhlker, M. L., and Harrison, D.: Detrainment dominates CCN concentrations around non-precipitating convective clouds over the Amazon, Geophys. Res. Lett., 49, e2022GL100411, https://doi.org/10.1029/2022GL100411, 2022.
Bramberger, M., Dörnbrack, A., Bossert, K., Ehard, B., Fritts, D. C., Kaifler, B., Mallaun, C., Orr, A., Pautet, P.-D., Rapp, M., Taylor, M. J., Vosper, S., Williams, Bifford, P., and Witschas, B.: Does strong tropospheric forcing cause large-amplitude mesospheric gravity waves? A DEEPWAVE case study, J. Geophys. Res.-Atmos., 122, 11–422, https://doi.org/10.1002/2017jd027371, 2017.
Brocchi, V., Krysztofiak, G., Deroubaix, A., Stratmann, G., Sauer, D., Schlager, H., Deetz, K., Dayma, G., Robert, C., Chevrier, S., and Catoire, V.: Local air pollution from oil rig emissions observed during the airborne DACCIWA campaign, Atmos. Chem. Phys., 19, 11401–11411, https://doi.org/10.5194/acp-19-11401-2019, 2019.
Busen, R. and Buck, A. L.: A high-performance hygrometer for aircraft use: Description, installation, and flight data, J. Atmos. Ocean. Tech., 12, 73–84, 1995.
Capes, G., Johnson, B., McFiggans, G., Williams, P. I., Haywood, J., and Coe, H.: Aging of biomass burning aerosols over West Africa: Aircraft measurements of chemical composition, microphysical properties, and emission ratios, J. Geophys. Res., 113, D00C15, https://doi.org/10.1029/2008JD009845, 2008.
Catoire, V., Robert, C., Chartier, M., Jacquet, P., Guimbaud, C., and Krysztofiak, G.: The SPIRIT airborne instrument: a three-channel infrared absorption spectrometer with quantum cascade lasers for in situ atmospheric trace-gas measurements, Appl. Phys. B, 123, 244, https://doi.org/10.1007/s00340-017-6820-x, 2017.
Cecchini, M. A., Machado, L. A. T., Andreae, M. O., Martin, S. T., Albrecht, R. I., Artaxo, P., Barbosa, H. M. J., Borrmann, S., Fütterer, D., Jurkat, T., Mahnke, C., Minikin, A., Molleker, S., Pöhlker, M. L., Pöschl, U., Rosenfeld, D., Voigt, C., Weinzierl, B., and Wendisch, M.: Sensitivities of Amazonian clouds to aerosols and updraft speed, Atmos. Chem. Phys., 17, 10037–10050, https://doi.org/10.5194/acp-17-10037-2017, 2017.
Christensen, M. W., Jones, W.. K., and Stier, P.: Aerosols enhance cloud lifetime and brightness along the stratus-to-cumulus transition, P. Natl. Acad. Sci. USA, 117, 17591–17598, https://doi.org/10.1073/pnas.1921231117, 2020.
Dadashazar, H., Painemal, D., Alipanah, M., Brunke, M., Chellappan, S., Corral, A. F., Crosbie, E., Kirschler, S., Liu, H., Moore, R. H., Robinson, C., Scarino, A. J., Shook, M., Sinclair, K., Thornhill, K. L., Voigt, C., Wang, H., Winstead, E., Zeng, X., Ziemba, L., Zuidema, P., and Sorooshian, A.: Cloud drop number concentrations over the western North Atlantic Ocean: seasonal cycle, aerosol interrelationships, and other influential factors, Atmos. Chem. Phys., 21, 10499–10526, https://doi.org/10.5194/acp-21-10499-2021, 2021.
Deroubaix, A., Menut, L., Flamant, C., Knippertz, P., Fink, A. H., Batenburg, A., Brito, J., Denjean, C., Dione, C., Dupuy, R., Hahn, V., Kalthoff, N., Lohou, F., Schwarzenboeck, A., Siour, G., Tuccella, P., and Voigt, C.: Sensitivity of low-level clouds and precipitation to anthropogenic aerosol emission in southern West Africa: a DACCIWA case study, Atmos. Chem. Phys., 22, 3251–3273, https://doi.org/10.5194/acp-22-3251-2022, 2022.
Douglas, A. and L'Ecuyer, T.: Quantifying cloud adjustments and the radiative forcing due to aerosol–cloud interactions in satellite observations of warm marine clouds, Atmos. Chem. Phys., 20, 6225–6241, https://doi.org/10.5194/acp-20-6225-2020, 2020.
ECMWF: Archive Catalogue, European Centre for Medium-range Weather Forecast [data set], https://apps.ecmwf.int/archive-catalogue/ (last access: August 2020), 2016.
ECMWF: Archive Catalogue – Copernicus Atmosphere Monitoring Service (CAMS), European Centre for Medium-range Weather Forecast [data set], https://apps.ecmwf.int/archive-catalogue/?class=mc, last access: 21 June 2023.
Eyring, V., Bock, L., Lauer, A., Righi, M., Schlund, M., Andela, B., Arnone, E., Bellprat, O., Brötz, B., Caron, L.-P., Carvalhais, N., Cionni, I., Cortesi, N., Crezee, B., Davin, E. L., Davini, P., Debeire, K., de Mora, L., Deser, C., Docquier, D., Earnshaw, P., Ehbrecht, C., Gier, B. K., Gonzalez-Reviriego, N., Goodman, P., Hagemann, S., Hardiman, S., Hassler, B., Hunter, A., Kadow, C., Kindermann, S., Koirala, S., Koldunov, N., Lejeune, Q., Lembo, V., Lovato, T., Lucarini, V., Massonnet, F., Müller, B., Pandde, A., Pérez-Zanón, N., Phillips, A., Predoi, V., Russell, J., Sellar, A., Serva, F., Stacke, T., Swaminathan, R., Torralba, V., Vegas-Regidor, J., von Hardenberg, J., Weigel, K., and Zimmermann, K.: Earth System Model Evaluation Tool (ESMValTool) v2.0 – an extended set of large-scale diagnostics for quasi-operational and comprehensive evaluation of Earth system models in CMIP, Geosci. Model Dev., 13, 3383–3438, https://doi.org/10.5194/gmd-13-3383-2020, 2020.
Fiebig, M.: Das troposphärische Aerosol in mittle Breiten – Mikrophysik, Optik und Klimaantrieb am Beispiel der Feldstudie LACE 98, PhD thesis, Physik, München, Ludwig-Maximilians-Universität, p. 244, 2001
Field, P. R., Wood, R., Brown, P. R. A., Kaye, P. H., Hirst, E., Greenaway, R., and Smith, J. A.: Ice particle interarrival times measured with a fast FSSP, J. Atmos. Ocean. Tech., 20, 249–261, https://doi.org/10.1175/1520-0426(2003)020<0249:IPITMW>2.0.CO;2, 2003.
Flamant, C., Deroubaix, A., Chazette, P., Brito, J., Gaetani, M., Knippertz, P., Fink, A. H., de Coetlogon, G., Menut, L., Colomb, A., Denjean, C., Meynadier, R., Rosenberg, P., Dupuy, R., Dominutti, P., Duplissy, J., Bourrianne, T., Schwarzenboeck, A., Ramonet, M., and Totems, J.: Aerosol distribution in the northern Gulf of Guinea: local anthropogenic sources, long-range transport, and the role of coastal shallow circulations, Atmos. Chem. Phys., 18, 12363–12389, https://doi.org/10.5194/acp-18-12363-2018, 2018a.
Flamant, C., Knippertz, P., Fink, A. H., Akpo, A., Brooks, B., Chiu, C. J., Coe, H., Danuor, S., Evans, M., Jegede, O., Kalthoff, N., Konaré, A., Liousse, C., Lohou, F., Mari, C., Schlager, H., Schwarzenboeck, A., Adler, B., Amekudzi, L., Aryee, J., Ayoola, M., Batenburg, A. M., Bessardon, G., Borrmann, S., Brito, J., Bower, K., Burnet, F., Catoire, V.,Colomb, A., Denjean, C., Fosu-Amankwah, K., Hill, P. G., Lee, J., Lothon, M., Maranan, M., Marsham, J., Meynadier,R., Ngamini, J.-B., Rosenberg, P., Sauer, D., Smith, V., Stratmann, G., Taylor, J. W., Voigt, C., and Yoboué, V.: TheDynamics–Aerosol–Chemistry–Cloud Interactions in West Africa Field Campaign: Overview and Research Highlights, B. Am. Meteorol. Soc., 99, 83–104, https://doi.org/10.1175/BAMS-D-16-0256.1, 2018b.
Flemming, J., Huijnen, V., Arteta, J., Bechtold, P., Beljaars, A., Blechschmidt, A.-M., Diamantakis, M., Engelen, R. J., Gaudel, A., Inness, A., Jones, L., Josse, B., Katragkou, E., Marecal, V., Peuch, V.-H., Richter, A., Schultz, M. G., Stein, O., and Tsikerdekis, A.: Tropospheric chemistry in the Integrated Forecasting System of ECMWF, Geosci. Model Dev., 8, 975–1003, https://doi.org/10.5194/gmd-8-975-2015, 2015.
Haslett, S. L., Taylor, J. W., Evans, M., Morris, E., Vogel, B., Dajuma, A., Brito, J., Batenburg, A. M., Borrmann, S., Schneider, J., Schulz, C., Denjean, C., Bourrianne, T., Knippertz, P., Dupuy, R., Schwarzenböck, A., Sauer, D., Flamant, C., Dorsey, J., Crawford, I., and Coe, H.: Remote biomass burning dominates southern West African air pollution during the monsoon, Atmos. Chem. Phys., 19, 15217–15234, https://doi.org/10.5194/acp-19-15217-2019, 2019.
Haywood, J. M., Abel, S. J., Barrett, P. A., Bellouin, N., Blyth, A., Bower, K. N., Brooks, M., Carslaw, K., Che, H., Coe, H., Cotterell, M. I., Crawford, I., Cui, Z., Davies, N., Dingley, B., Field, P., Formenti, P., Gordon, H., de Graaf, M., Herbert, R., Johnson, B., Jones, A. C., Langridge, J. M., Malavelle, F., Partridge, D. G., Peers, F., Redemann, J., Stier, P., Szpek, K., Taylor, J. W., Watson-Parris, D., Wood, R., Wu, H., and Zuidema, P.: The CLoud–Aerosol–Radiation Interaction and Forcing: Year 2017 (CLARIFY-2017) measurement campaign, Atmos. Chem. Phys., 21, 1049–1084, https://doi.org/10.5194/acp-21-1049-2021, 2021.
Heller, R., Voigt, C., Beaton, S., Dörnbrack, A., Giez, A., Kaufmann, S., Mallaun, C., Schlager, H., Wagner, J., Young, K., and Rapp, M.: Mountain waves modulate the water vapor distribution in the UTLS, Atmos. Chem. Phys., 17, 14853–14869, https://doi.org/10.5194/acp-17-14853-2017, 2017.
Hill, P. G., Allan, R. P., Chiu, J. C., and Bodas-Salcedo, A.: Quantifying the contribution of different cloud types to the radiation budget in southern West Africa, J. Climate, 31, 5273–5291, https://doi.org/10.1175/JCLI-D-17-0586.1, 2018.
Holben, B., Eck, T., Slutsker, I., Tanre, D., Buis, J., Setzer, A., Vermote, E., Reagan, J., Kaufman, Y., Nakajima, T., Lavenu, F., Jankowiak, I., and Smirnov, A.: AERONET – a federated instrument network and data archive for aerosol characterization, Remote Sens. Environ., 66, 1–16, 1998.
Kaufman, Y. J. and Fraser, R. S.: The effect of smoke particles on clouds and climate forcing, Science, 277, 1636–1639, https://doi.org/10.1126/science.277.5332.1636, 1997.
Kaufman, Y. J., Koren, I., Remer, L. A., Rosenfeld, D., and Rudich, Y.: The effect of smoke, dust, and pollution aerosol on shallow cloud development over the Atlantic Ocean, P. Natl. Acad. Sci. USA, 102, 11207–11212, https://doi.org/10.1073/pnas.0505191102, 2005.
Kaufmann, S., Voigt, C., Heller, R., Jurkat-Witschas, T., Krämer, M., Rolf, C., Zöger, M., Giez, A., Buchholz, B., Ebert, V., Thornberry, T., and Schumann, U.: Intercomparison of midlatitude tropospheric and lower-stratospheric water vapor measurements and comparison to ECMWF humidity data, Atmos. Chem. Phys., 18, 16729–16745, https://doi.org/10.5194/acp-18-16729-2018, 2018.
Kirschler, S., Voigt, C., Anderson, B., Campos Braga, R., Chen, G., Corral, A. F., Crosbie, E., Dadashazar, H., Ferrare, R. A., Hahn, V., Hendricks, J., Kaufmann, S., Moore, R., Pöhlker, M. L., Robinson, C., Scarino, A. J., Schollmayer, D., Shook, M. A., Thornhill, K. L., Winstead, E., Ziemba, L. D., and Sorooshian, A.: Seasonal updraft speeds change cloud droplet number concentrations in low-level clouds over the western North Atlantic, Atmos. Chem. Phys., 22, 8299–8319, https://doi.org/10.5194/acp-22-8299-2022, 2022.
Kleine, J., Voigt, C., Sauer, D., Schlager, H., Scheibe, M., Jurkat-Witschas, T., Kaufmann, S., Kärcher, B., and Anderson, B. E.: In Situ Observations of Ice Particle Losses in a Young Persistent Contrail, Geophys. Res. Lett., 45, 13553–13561, https://doi.org/10.1029/2018GL079390, 2018.
Knippertz, P., Coe, H., Chiu, J. C., Evans, M. J., Fink, A. H., Kalthoff, N., Liousse, C., Mari, C., Allan, R. P., Brooks, B., Danour, S., Flamant, C., Jegede, O. O., Lohou, F., and Marsham, J. H.: The DACCIWA project: Dynamics-aerosol-chemistry-cloud interactions in West Africa, B. Am. Meteorol. Soc., 96, 1451–1460, https://doi.org/10.1175/BAMS-D-14-00108.1, 2015.
Knippertz, P., Fink, A. H., Deroubaix, A., Morris, E., Tocquer, F., Evans, M. J., Flamant, C., Gaetani, M., Lavaysse, C., Mari, C., Marsham, J. H., Meynadier, R., Affo-Dogo, A., Bahaga, T., Brosse, F., Deetz, K., Guebsi, R., Latifou, I., Maranan, M., Rosenberg, P. D., and Schlueter, A.: A meteorological and chemical overview of the DACCIWA field campaign in West Africa in June–July 2016, Atmos. Chem. Phys., 17, 10893–10918, https://doi.org/10.5194/acp-17-10893-2017, 2017.
Lance, S.: Coincidence Errors in a Cloud Droplet Probe (CDP) and a Cloud and Aerosol Spectrometer (CAS), and the Improved Performance of a Modified CDP, J. Atmos. Ocean. Tech., 29, 1532–1541, https://doi.org/10.1175/JTECH-D-11-00208.1, 2012.
Lance, S., Brock, C. A., Rogers, D., and Gordon, J. A.: Water droplet calibration of the Cloud Droplet Probe (CDP) and in-flight performance in liquid, ice and mixed-phase clouds during ARCPAC, Atmos. Meas. Tech., 3, 1683–1706, https://doi.org/10.5194/amt-3-1683-2010, 2010.
Liousse, C., Assamoi, E., Criqui, P., Granier, C., and Rosset, R.: Explosive growth in African combustion emissions from 2005 to 2030, Environ. Res. Lett., 9, 035003, https://doi.org/10.1088/1748-9326/9/3/035003, 2014.
Mallaun, C., Giez, A., and Baumann, R.: Calibration of 3-D wind measurements on a single-engine research aircraft, Atmos. Meas. Tech., 8, 3177–3196, https://doi.org/10.5194/amt-8-3177-2015, 2015.
Manshausen, P., Watson-Parris, D., Christensen, M. W., Jalkanen, J.-P., and Stier, P.: Invisible ship tracks show large cloud sensitivity to aerosol, Nature, 610, 101–106, 2022.
Mayer, B. and Kylling, A.: Technical note: The libRadtran software package for radiative transfer calculations - description and examples of use, Atmos. Chem. Phys., 5, 1855–1877, https://doi.org/10.5194/acp-5-1855-2005, 2005.
Menut, L., Flamant, C., Turquety, S., Deroubaix, A., Chazette, P., and Meynadier, R.: Impact of biomass burning on pollutant surface concentrations in megacities of the Gulf of Guinea, Atmos. Chem. Phys., 18, 2687–2707, https://doi.org/10.5194/acp-18-2687-2018, 2018.
Menut, L., Tuccella, P., Flamant, C., Deroubaix, A., and Gaetani, M.: The role of aerosol–radiation–cloud interactions in linking anthropogenic pollution over southern west Africa and dust emission over the Sahara, Atmos. Chem. Phys., 19, 14657–14676, https://doi.org/10.5194/acp-19-14657-2019, 2019.
Moore, R. H., Karydis, V. A., Capps, S. L., Lathem, T. L., and Nenes, A.: Droplet number uncertainties associated with CCN: an assessment using observations and a global model adjoint, Atmos. Chem. Phys., 13, 4235–4251, https://doi.org/10.5194/acp-13-4235-2013, 2013.
NASA: AERONET (Aerosol Robotic Network), Version 3, NASA [data set], https://aeronet.gsfc.nasa.gov/cgi-bin/webtool_aod_v3, last access: 21 June 2023.
Painemal, D., Kato, S., and Minnis, P.: Boundary layer regulation in the southeast Atlantic cloud microphysics during the biomass burning season as seen by the A-train satellite constellation, J. Geophys. Res., 119, 11288–11302, https://doi.org/10.1002/2014JD022182, 2014.
Panicker, A. S., Pandithurai, G., Dipu, S.: Aerosol indirect effect during successive contrasting monsoon seasons over Indian subcontinent using MODIS data, Atmos. Environ., 44, 1937–1943, https://doi.org/10.1016/j.atmosenv.2010.02.015, 2010.
Pante, G., Knippertz, P., Fink, A. H., and Kniffka, A.: The potential of increasing man-made air pollution to reduce rainfall over southern West Africa, Atmos. Chem. Phys., 21, 35–55, https://doi.org/10.5194/acp-21-35-2021, 2021.
Ramanathan, V., Crutzen, P. J., Kiehl, J. T., and Rosenfeld, D.: Aerosols, climate, and the hydrological cycle, Science, 294, 2119–2124, https://doi.org/10.1126/science.1064034, 2001.
Righi, M., Hendricks, J., Lohmann, U., Beer, C. G., Hahn, V., Heinold, B., Heller, R., Krämer, M., Ponater, M., Rolf, C., Tegen, I., and Voigt, C.: Coupling aerosols to (cirrus) clouds in the global EMAC-MADE3 aerosol–climate model, Geosci. Model Dev., 13, 1635–1661, https://doi.org/10.5194/gmd-13-1635-2020, 2020.
Rosenberg, P. D., Dean, A. R., Williams, P. I., Dorsey, J. R., Minikin, A., Pickering, M. A., and Petzold, A.: Particle sizing calibration with refractive index correction for light scattering optical particle counters and impacts upon PCASP and CDP data collected during the Fennec campaign, Atmos. Meas. Tech., 5, 1147–1163, https://doi.org/10.5194/amt-5-1147-2012, 2012.
Rotering, H.: Falcon 20-E5 Trailing Cone Validation, DLR-Interner Bericht, DLR-IB 111-2011/28, Institute of Flight Systems, Flight Experiments, p. 46, 2012.
Schaaf, C. and Wang, Z.: MCD43C3 MODIS/Terra+Aqua BRDF/Albedo Albedo Daily L3 Global 0.05 Deg CMG V006, NASA EOSDIS Land Processes DAAC [data set], https://doi.org/10.5067/MODIS/MCD43C3.006, 2015.
chumann, U., Weinzierl, B., Reitebuch, O., Schlager, H., Minikin, A., Forster, C., Baumann, R., Sailer, T., Graf, K., Mannstein, H., Voigt, C., Rahm, S., Simmet, R., Scheibe, M., Lichtenstern, M., Stock, P., Rüba, H., Schäuble, D., Tafferner, A., Rautenhaus, M., Gerz, T., Ziereis, H., Krautstrunk, M., Mallaun, C., Gayet, J.-F., Lieke, K., Kandler, K., Ebert, M., Weinbruch, S., Stohl, A., Gasteiger, J., Groß, S., Freudenthaler, V., Wiegner, M., Ansmann, A., Tesche, M., Olafsson, H., and Sturm, K.: Airborne observations of the Eyjafjalla volcano ash cloud over Europe during air space closure in April and May 2010, Atmos. Chem. Phys., 11, 2245–2279, https://doi.org/10.5194/acp-11-2245-2011, 2011.
Toll, V., Christensen, M., Quaas, J., and Bellouin, N.: Weak average liquid-cloud-water response to anthropogenic aerosols, Nature, 572, 51–55, 2019.
Taylor, J. W., Haslett, S. L., Bower, K., Flynn, M., Crawford, I., Dorsey, J., Choularton, T., Connolly, P. J., Hahn, V., Voigt, C., Sauer, D., Dupuy, R., Brito, J., Schwarzenboeck, A., Bourriane, T., Denjean, C., Rosenberg, P., Flamant, C., Lee, J. D., Vaughan, A. R., Hill, P. G., Brooks, B., Catoire, V., Knippertz, P., and Coe, H.: Aerosol influences on low-level clouds in the West African monsoon, Atmos. Chem. Phys., 19, 8503–8522, https://doi.org/10.5194/acp-19-8503-2019, 2019.
Twomey, S.: Aerosols, clouds and radiation, Atmos. Environ. A-Gen., 25, 2435–2442, https://doi.org/10.1016/0960-1686(91)90159-5, 1991.
van der Linden, R., Fink, A. H., and Redl, R.: Satellite-based climatology of low-level continental clouds in southern West Africa during the summer monsoon season, J. Geophys. Res., 120, 1186–1201, https://doi.org/10.1002/2014JD022614, 2015.
Voigt, C., Schumann, U., Jurkat, T., Schäuble, D., Schlager, H., Petzold, A., Gayet, J.-F., Krämer, M., Schneider, J., Borrmann, S., Schmale, J., Jessberger, P., Hamburger, T., Lichtenstern, M., Scheibe, M., Gourbeyre, C., Meyer, J., Kübbeler, M., Frey, W., Kalesse, H., Butler, T., Lawrence, M. G., Holzäpfel, F., Arnold, F., Wendisch, M., Döpelheuer, A., Gottschaldt, K., Baumann, R., Zöger, M., Sölch, I., Rautenhaus, M., and Dörnbrack, A.: In-situ observations of young contrails – overview and selected results from the CONCERT campaign, Atmos. Chem. Phys., 10, 9039–9056, https://doi.org/10.5194/acp-10-9039-2010, 2010.
Voigt, C., Kleine, J., Sauer, D., Moore, R. H., Bräuer, T., Le Clercq, P., Kaufmann, S., Scheibe, M., Jurkat-Witschas, T., Aigner, M., Bauder, U., Boose, Y., Borrmann, S., Crosbie, E., Diskin, G. S., DiGangi, J., Hahn, V., Heckl, C., Huber, F., Nowak, J. B., Rapp, M., Rauch, B., Robinson, C., Schripp, T., Shook, M., Winstead, E., Ziemba, L., Schlager, H., and Anderson, B. E.: Cleaner burning aviation fuels can reduce contrail cloudiness, Nature Commun. Earth Environ., 2, 114, https://doi.org/10.1038/s43247-021-00174-y, 2021.
Wall, C. J., Norris, J. R., Possner, A., McCoy, D. T., McCoy, I. L., and Lutsko, N. J.: Assessing effective radiative forcing from aerosol-cloud interactions over the global ocean, P. Natl. Acad. Sci. USA, 119, e2210481119, https://doi.org/10.1073/pnas.221048111, 2022.
Wang, F., Guo, J., Zhang, J., Huang, J., Min, M., Chen, T., Liu, H., Deng, M., and Li, X.: Multi-sensor quantification of aerosol-induced variability in warm clouds over eastern China, Atmos. Environ., 113, 1–9, https://doi.org/10.1016/j.atmosenv.2015.04.063, 2015.
Watts, P. D., Bennartz, R., and Fell, F.: Retrieval of two-layer cloud properties from multispectral observations using optimal estimation, J. Geophys. Res.-Atmos., 116, D16203, https://doi.org/10.1029/2011JD015883, 2011.
Wendisch, M., Pöschl, U., Andreae, M. O., et al.: ACRIDICON–CHUVA campaign:Studying tropical deep convective clouds and precipitation over Amazonia using the new German research aircraft HALO, B. Am. Meteorol. Soc., 97, 1885–1908, https://doi.org/10.1175/BAMS-D-14-00255.1, 2016.
Wilber, A. C., Kratz, D. P., and Gupta, S. K.: Surface emissivity maps for use in satellite retrievals of longwave radiation, NASA Tech. Report, NASA/TP-1999-209362, L-17861, 35 pp., 1999.
- Abstract
- Introduction
- Instrumentation and methods
- Microphysical properties of tropical continental low-level clouds
- Altitude and aerosol effect on low-level clouds
- Net radiative forcings and heating rates induced by tropical low-level clouds
- Summary and conclusions
- Data availability
- Author contributions
- Competing interests
- Disclaimer
- Acknowledgements
- Financial support
- Review statement
- References