the Creative Commons Attribution 4.0 License.
the Creative Commons Attribution 4.0 License.
 | 04 Jan 2023
New particle formation and growth during summer in an urban environment: a dual chamber study
Spiro D. Jorga
Kalliopi Florou
David Patoulias
Spyros N. Pandis
Nucleation and subsequent growth are a major source of new particles in many environments, but the pollutants involved and the details of the corresponding processes are still under debate. While sulfuric acid has a major role in new particle formation under a lot of conditions, the role of ammonia, amines, and organic vapors is less clear. In most continental areas, new particle formation is quite frequent especially on relatively clean, sunny days when there is some sulfur dioxide available. In parts of the Eastern Mediterranean even if all the previous requirements are satisfied, new particle formation events are relatively rare during summertime.
In this work, we take advantage of this unexpected low, new particle formation frequency in Greece and use a dual atmospheric simulation chamber system with starting point ambient air in an effort to gain insight about the chemical species that is limiting nucleation in this area. A potential nucleation precursor, ammonia, was added in one of the chambers, while the other one was used as a reference. Three different types of outcomes were observed: new particle formation only in the perturbed chamber, new particle formation in both chambers, and no observed new particle formation. The addition of ammonia assisted in new particle formation in almost 50 % of the experiments conducted. The growth rate of the newly formed particles ranged from 3–11 nm h−1, with particles reaching a diameter of 20–25 nm after a few hours. The nucleation rate was estimated using an aerosol dynamics model and was found to be in the range of 500 to 25 000 particles cm−3 h−1 in the different experiments. These results support the hypothesis that ammonia at levels of several ppb can accelerate or even cause new particle formation, at least in the environment of the Eastern Mediterranean.
- Article
(2857 KB) - Full-text XML
-
Supplement
(603 KB) - BibTeX
- EndNote


Atmospheric aerosol can be produced from many natural or anthropogenic sources and plays a significant role in Earth's climate and in public health (Haywood and Boucher, 2000; Pope et al., 2002). Aerosols can affect climate either by scattering and absorbing incoming solar radiation (direct effect) or by acting as cloud condensation nuclei (CCN), thus affecting reflectivity and lifetimes of clouds (indirect effect). New particle formations (NPF) through nucleation of low-volatility vapors can be an important source of atmospheric aerosols and is responsible for close to 50 % of the global CCN (Merikanto et al., 2009). Newly formed particles either grow to larger sizes through condensation or are scavenged by larger pre-existing particles through coagulation. Self-coagulation is another growth process for the newly formed particles. The competition between these processes determines how many of those new particles will grow to become CCN, and how fast this will happen. NPF has been observed in many areas around the world in all types of environments (urban, rural, forests, remote, marine, etc.) (Kulmala et al., 2007; Kerminen et al., 2010; Wang et al., 2017; Yao et al., 2018; Zhu et al., 2019; Saha et al., 2019).
Previous studies have underlined the importance of sulfuric acid for NPF in most environments (Jaecker-Voirol and Mirabel, 1989; Weber et al., 1996; Laaksonen et al., 2000; Sipilä et al., 2010). Additional studies have shown the importance of ammonia and amines as vapors that can accelerate the nucleation rate of sulfuric acid with water by stabilizing the initial clusters of sulfuric acid (Weber et al., 1998; Kirkby et al., 2011; Jen et al., 2014; Glasoe et al., 2015). Low and extremely low volatility organic vapors play a major role in the growth of the new particles and may also be participating in the nucleation process itself (Yli-Juuti et al., 2011; Zhao et al., 2014; Ehn et al., 2014; Mohr et al., 2019). In marine environments, iodine compounds have been identified as vapors that can form new particles (McFiggans et al., 2010; Sipilä et al., 2016; He et al., 2021). Wang et al. (2020) recently reported fast growth rates of newly formed particles at some atmospheric conditions due to the condensation of ammonium nitrate. The pre-existing aerosol (condensation sink), the availability of gaseous precursors, and the meteorological conditions all affect the intensity and frequency of NPF events in the atmosphere.
Extensive monitoring of NPF events has taken place in many sites in Europe (Manninen et al., 2010; Dinoi et al., 2021) and the Eastern Mediterranean (Pikridas et al., 2012; Berland et al., 2017; Kalkavouras et al., 2017; Kalivitis et al., 2019; Hussein et al., 2020; Brilke et al., 2020). Siakavaras et al. (2016) reported frequent nucleation events in Thessaloniki, a major urban center in northern Greece. On the other hand, the nucleation frequency in southern Greece is relatively low (compared to central and northern Europe), especially during the summer (Kalivitis et al., 2008, 2019). Kopanakis et al. (2013) observed nucleation events only in 13 out of the 157 d of measurements in the Akrotiri station, in Crete. Kalkavouras et al. (2020) reported a relatively low 20 % nucleation frequency during the summer in Finokalia, Crete. Particle size distribution measurements at five stations in four cities in Greece (Athens, Patras, Thessaloniki, and Finokalia) during the summer of 2012, showed low NPF frequency in Patras and Finokalia (Vratolis et al., 2019). Pikridas et al. (2012) provided evidence that ammonia or amines may be the missing reactants that are responsible for the lack of nucleation in this sunny, relatively clean area with sulfur dioxide available.
In this work, we test the hypothesis that in an environment such as the Eastern Mediterranean during the summer, in which, despite the high sunlight intensity, rapid photochemistry, moderate to low particle levels, always available sulfur dioxide, and reasonable levels of both biogenic and anthropogenic VOCs, nucleation events are rare due to the relatively low ammonia levels. The experiments took place during summer in Patras, Greece in an environment with low nucleation and growth frequency (Patoulias et al., 2018; Vratolis et al., 2019) using a dual chamber system. The use of this innovative experimental setup, in a location in which nucleation is infrequent, allows us to perturb the atmosphere (at least a few cubic meters of it) in order to identify the reactant that is limiting the new particle formation. The use of two chambers to correct for various complications arising from these challenging measurements is an additional novelty of this work. Both chambers were filled with ambient air, ammonia was added to one of them, and the evolution of the aerosol followed in both chambers.
2.1 Dual chamber system
A dual chamber system was deployed as part of the 2019 summer PANACEA (PANhellenic infrastructure for Atmospheric Composition and climatE change) campaign in Patras, Greece. Measurements were conducted in the outskirts of Patras (population 200 000 people) between 15 July until 15 August 2019, at the Institute of Chemical Engineering Sciences (ICE-HT), approximately 8 km from the city center. The dual chamber system consisted of two identical Teflon chambers (1.3 m3 each) located inside a structure that included the chambers and five panels of UV lights used for illumination purposes ( min−1). Ammonia was added in one of the chambers (perturbation chamber), while the other one was used as the reference. The top of the structure could be removed, and natural sunlight was used if the weather conditions allowed it. Details about the design and testing of the dual chamber system can be found in Kaltsonoudis et al. (2019).
The major difference between the conditions in the reference chamber and the ambient air is that the chamber has a little lower concentration due to losses in the sampling system. The UV light is also different in some experiments in which artificial light was used. Other experiments used natural sunlight, so this was not an issue. Other differences include the interactions of the pollutants inside the reference chamber with the walls of the chamber (for example, losses of particles but also some vapors to the walls during the experiment). Finally, the pollutant levels in ambient air in the site may change as the wind brings new air masses to the area, while the air mass inside the reference chamber remains the same as that present in the site at the time of the filling of the chamber.
2.2 Experimental procedure
Before the beginning of each experiment both chambers were flushed with ambient air for approximately 2 h. The main purpose of the flushing is the conditioning of the chambers and the sampling lines to the environmental conditions and composition, thus minimizing losses of volatile or semivolatile compounds to the walls of the system. During this preparation period both chambers were swept for 20 min using an ionizer fan (Dr Schneider PC, Model SL-001) to reduce the charges on the chamber walls, thus reducing the particle wall losses (Jorga et al., 2020). After the chambers were ready, they were filled with ambient air using a metal-bellows pump (Senior Aerospace, model MB-302). The concentrations of pollutants in both the gas and particulate phases were then characterized for 1 h. A 0.25 in copper tube was used for the particle phase measurements and a 0.25 in PTFE tube was used for the gas measurements. The instruments were located inside a room next to the chambers to avoid their exposure to high temperatures. The distance from the chambers to the instruments was approximately 4 m. An automated valve was used to alternate sampling between the two chambers. The valve was synchronized with the sampling periods of the various instruments, and sufficient time was allowed between each sampling change to flush any remaining air from the previous measurement.
After the characterization phase, ammonia was injected through a heated line into the perturbation chamber using a glass syringe. The concentration of the injected ammonia was estimated using the volume of the chamber and the amount of liquid ammonia injected, and it varied from 20 to 200 ppb. These estimates are probably upper limits because losses of ammonia in the inlet system and the walls of the chamber are expected Even though the ammonia levels used in this study are relatively high, they are still in the range of observed concentrations in the atmosphere. For example, Dammers et al. (2017) measured ammonia concentrations in the Netherlands up to 300 ppb. The fact that we have several measurements at concentrations higher than those used by Kirkby et al. (2011), but still relevant to the atmosphere, is a nice feature of this work. After the ammonia injection, the top cover of the system was removed, and the chambers were exposed to natural sunlight. If the wind speed is high, even if only the top cover is off, the chambers may be destroyed by the wind. So, during these conditions the chamber system was kept completely covered, and UV lights were used instead of natural sunlight for the corresponding experiment.
At the end of the experiment, ammonium sulfate seeds were injected into both chambers to measure the size-dependent particle wall-loss rate constants using the method described in Wang et al. (2018). After the end of the particle wall-loss period both chambers were flushed once again with ambient air for approximately 2 h, to remove the ammonium sulfate and any remaining pollutants, and to prepare them for the next experiment. The potential interactions of our experimental system with the chamber walls are the reason for the use of the second (reference) chamber. Any interactions will also be present there and will be observable, and, therefore, we can correct for them. Desorption of ammonia from the walls was tested with blank experiments the following day from a perturbation experiment. The system was filled with ambient air, with no addition of ammonia, and the system response was tested. In all the blank experiments we did not observe any nucleation in the perturbed chamber due to the ammonia that had been added in past experiments.
2.3 Instrumentation
The chemical composition of the aerosol was monitored using a High-Resolution Time-of-Flight Aerosol Mass Spectrometer (HR-ToF-AMS) from Aerodyne Research Inc. Two scanning mobility particle sizers (SMPS) were used to measure the number size distributions from 9–160 nm (classifier model 3080, CPC model 3775) and from 14–730 nm (classifier model 3080, CPC model 3025A) respectively. The sample flow was dried before reaching the AMS and SMPS systems using a Nafion dryer. A suite of gas monitors was used to measure the concentrations of NOx (Teledyne 201E/501), SO2 (Thermo Scientific Model 43i), and O3 (Teledyne 400E).
2.4 Aerosol dynamics model
A zero-dimensional aerosol dynamic model was used for the simulation of nucleation, condensation, and coagulation inside the perturbation chamber (Capaldo et al., 1999). The multicomponent aerosol size distribution is described using 270 size sections covering the diameter range from 1 nm to 1 µm. The aerosol components include sulfate, ammonium, organics, and others, with the latter assumed to be non-volatile and inert during the few hours of the simulation period.
The condensation rate of H2SO4 to a particle of diameter Dp is described using the modified form of the Fuchs–Sutugin equation (Hegg et al., 1991; Kreidenweis et al., 1991) given by
where D is the diffusivity of the vapor air (set to 0.1 cm2 s−l in this application), Kn is the Knudsen number (that is the ratio of the air mean free path to the particle radius), F(Kn) is a coefficient correcting for free molecular effects given by
and A is a coefficient correcting for the interfacial mass transport limitations described by the accommodation αe,
Finally, P is the bulk H2SO4 vapor partial pressure, and Po is its partial pressure at the particle surface. An accommodation coefficient of 0.02 for the condensation of H2SO4 on the aerosol particles is assumed (Van Dingenen and Raes, 1991). The vapor pressure of H2SO4 at the aerosol surface can be estimated from the data of Bolsaitis and Elliott (1990). Values less than 10−3 ppt were found for the conditions of our experiments, and, therefore, the surface vapor pressure of H2SO4 in our mass transfer calculations was assumed to be zero.
Brownian coagulation between all particles is simulated by solving the discrete coagulation equation (Seinfeld and Pandis, 2016),
The generalized coagulation coefficient K1,2 for the collision of two particles is calculated as
where D1, D2 are the individual Brownian diffusion coefficients for the particles, , are the particle diameters, and β is the Fuchs correction factor (Fuchs, 1964). Because of the high resolution of the size distribution, coagulation can be simulated accurately by directly calculating the coagulation rates between each of the size sections and moving the particles to the corresponding size bin.
2.5 Data analysis
The condensation sink (CS) is a metric of the ability of the pre-existing aerosol population to remove vapors from the system by condensation. The CS values were calculated using the aerosol distribution between 14–700 nm, as measured by the SMPS and the properties of sulfuric acid as the condensing vapor. The CS is given by
where D is the diffusion coefficient of sulfuric acid, βm is the transition-regime correction factor, Dp the diameter of the particle, and N the respective number concentration in each size bin of the SMPS.
Using the initial SO2 concentration in the perturbed chamber and the condensation sink we can estimate the sulfuric acid concentration according to
where kOH is the reaction constant of SO2 and OH, which is equal to cm3 molec−1 s−1 at 298 K (DeMore et al., 1997), [SO2] and [OH] are the concentrations of sulfur dioxide and hydroxyl radicals, respectively, and CS is the condensational sink as calculated from Eq. (7). For the hydroxyl radical concentration, we assumed an average value of 5×10⁶ molec cm−3. Equation (7) is based on the assumptions that the only sulfuric acid source is the oxidation of SO2 from OH radicals, its major sink is its condensation onto the aerosol surface, and the system is in the pseudo-steady state.
3.1 Initial conditions
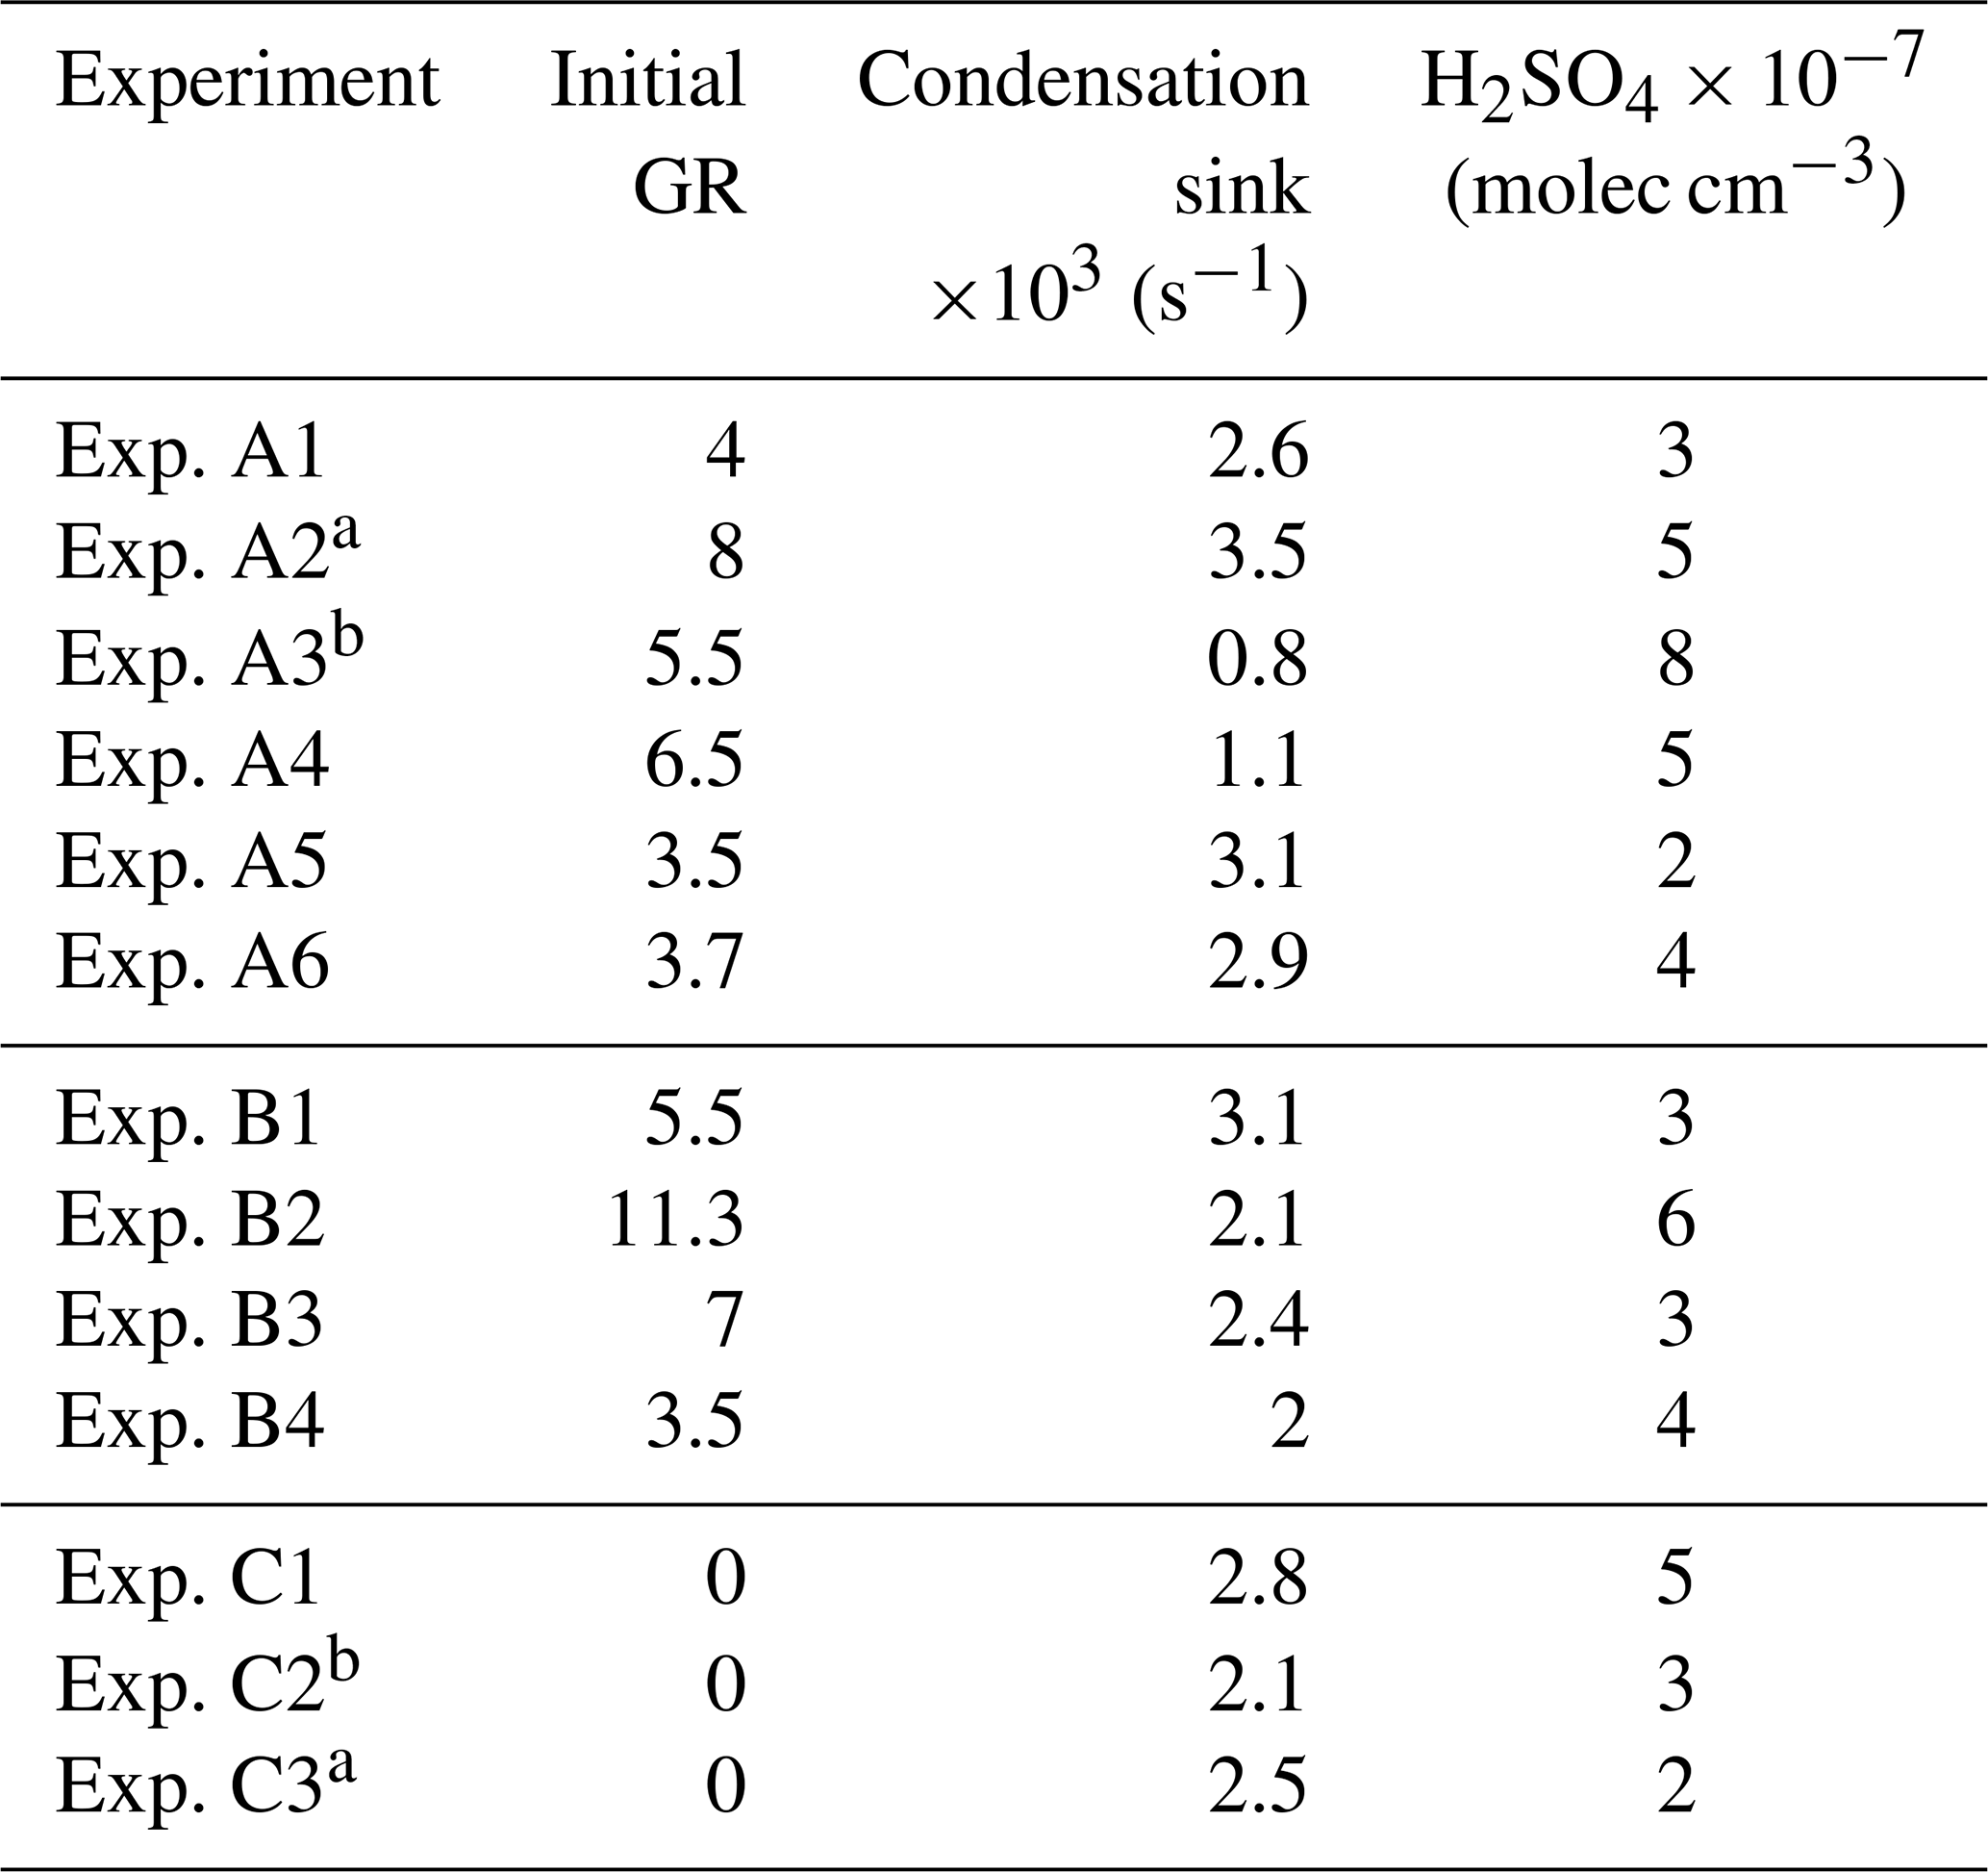
During the study, 13 perturbation experiments were conducted (Table 1). Two of these took place during the night using UV lights and the rest during midday. Natural sunlight was used in two experiments, while UV lights were used during the rest.
Table 1Initial conditions in the experiments conducted.
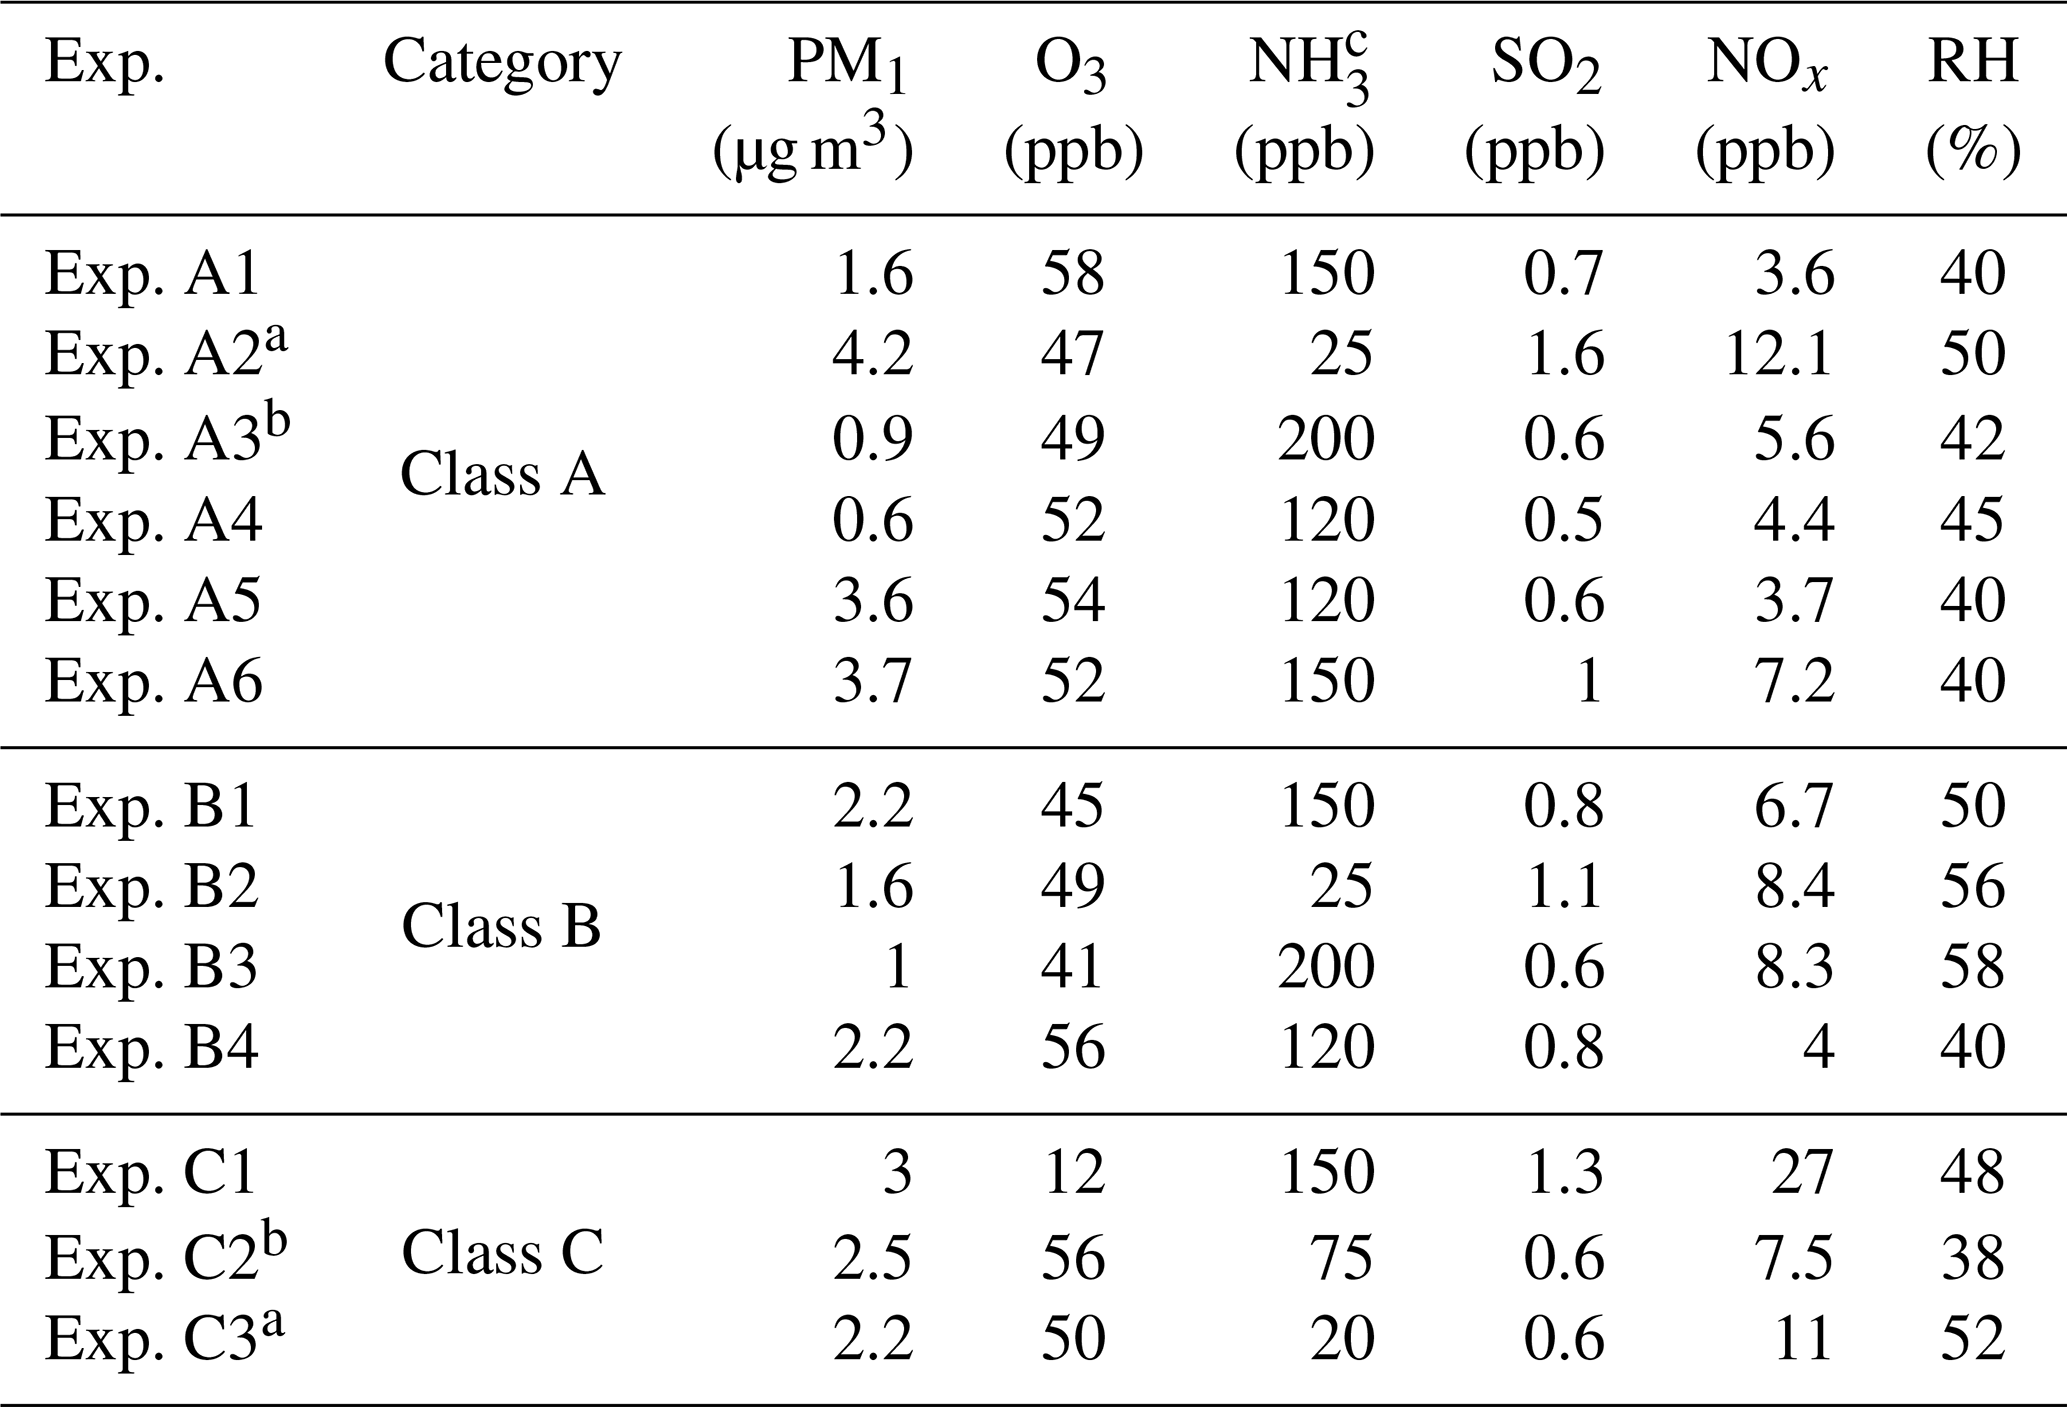
a Experiments illuminated by natural sunlight; b experiment conducted at night; c estimated concentration in the perturbation chamber.
The main components of non-refractory PM1 in the beginning of our experiments were organics (46.6±6.5 %) followed by sulfate (37.1±4.5 %), ammonium (14.3±1.8 %), nitrate (1.5±0.5 %), and chloride (0.5±0.4 %). The average oxygen to carbon ratio (O:C) (Canagaratna et al., 2015) in the chambers after filling them with ambient air was 0.68±0.1, indicating an already oxidized OA. In order to check whether any contamination occurred during the flushing and filling processes we calculated the theta angle (Kostenidou et al., 2009) between the organic mass spectra of the ambient air and the OA in the two chambers. The theta angles were less than 6∘ in all experiments, indicating negligible contamination during the filling process.
The initial concentrations of the SO2, O3, and NOx inside the chambers after the filling process were approximately within 10 % of their ambient values. The initial concentrations of these gases in the two chambers differed by less than 3 %. More than 70 % of the ambient PM1 was transferred in the chambers in most experiments. The initial PM1 levels were quite low, ranging from 0.6 to 4.2 µg m−3. The atmosphere of Patras was quite clear during these experiments. The initial conditions in all experiments are summarized in Table 1.
3.2 New particle formation and growth
The experiments conducted were classified into three different classes based on the observations of new particle formation in the two chambers. In class A experiments, nucleation and particle growth only occurred in the perturbed chamber, in class B nucleation and particle growth happened in both chambers, and in class C when there was no detection of new particle formation in either chamber.
3.2.1 Nucleation and growth only in the perturbed chamber
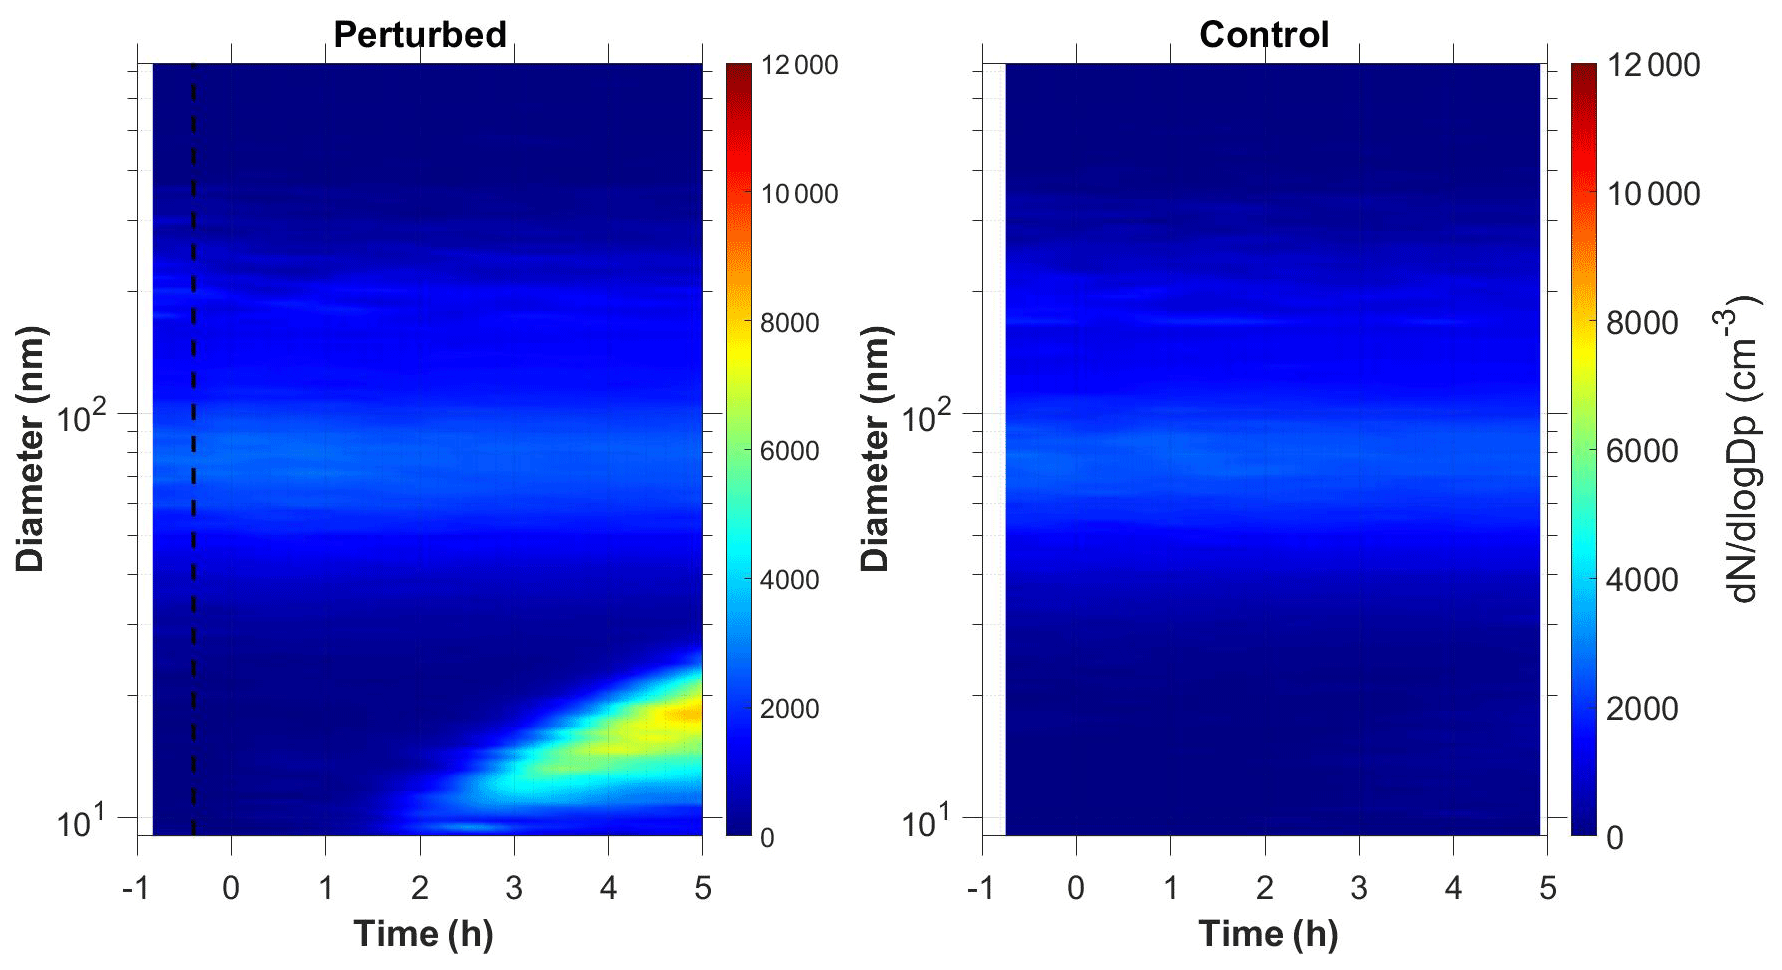
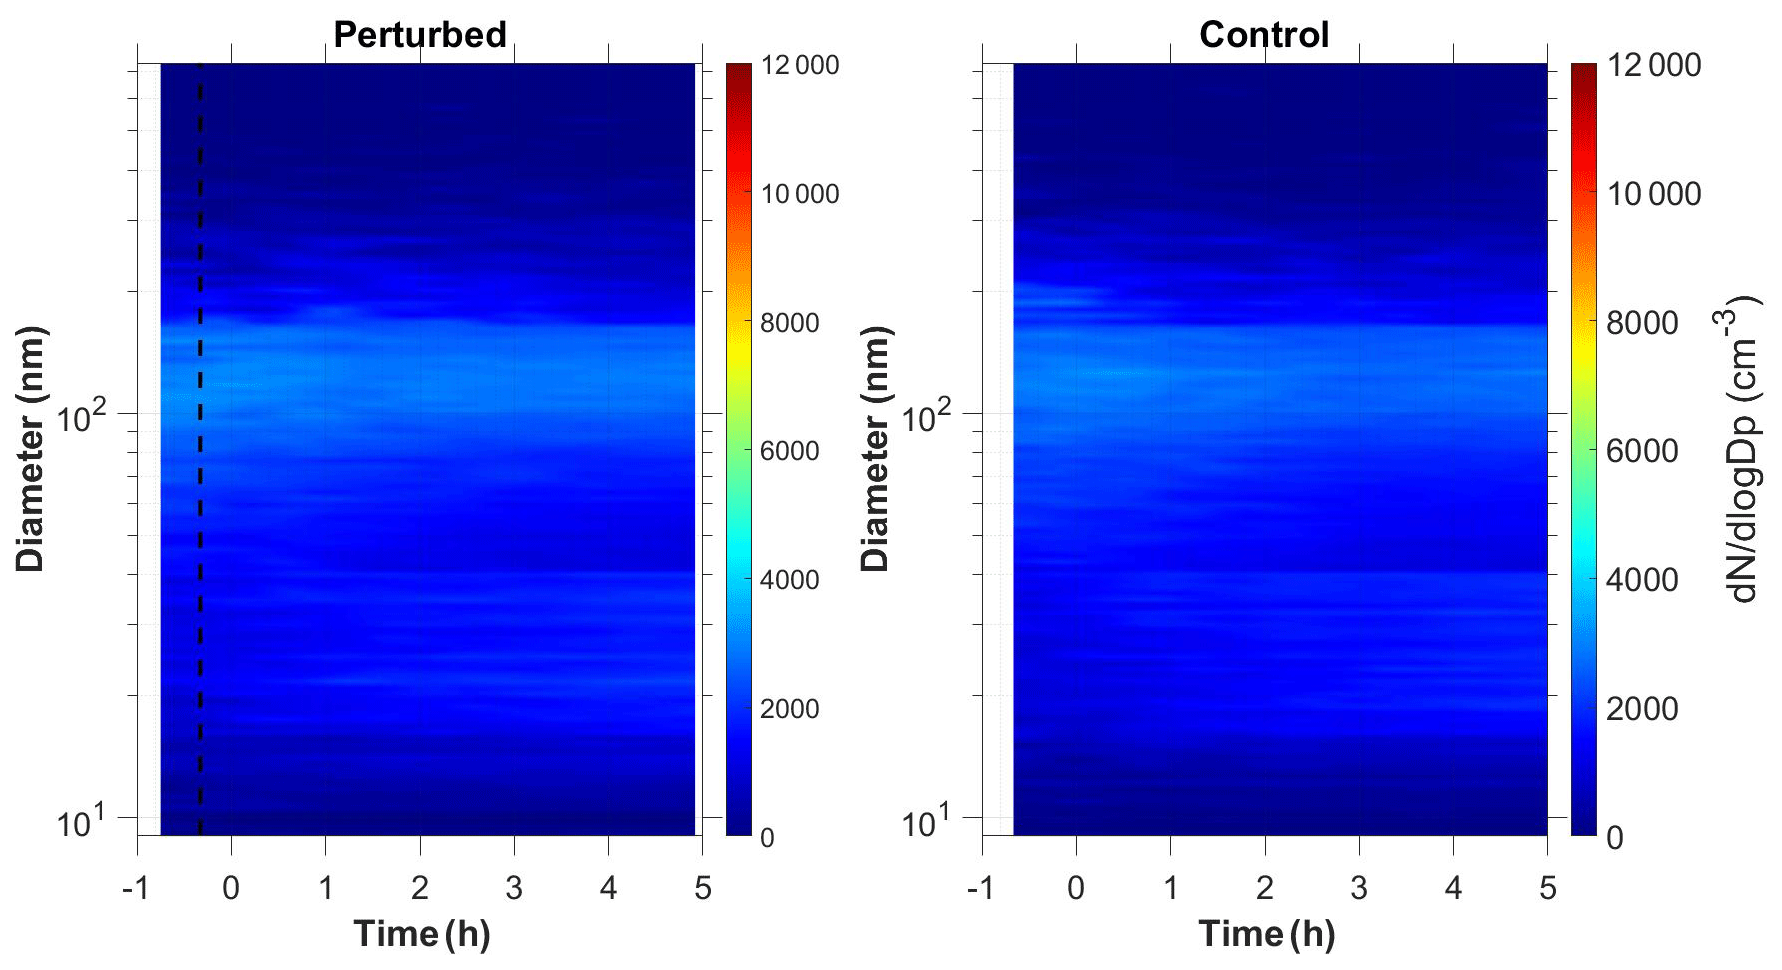
Nucleation and growth of the new particles to sizes above 9 nm only in the perturbed chamber and not in the reference chamber were observed in 6 out of the 13 performed experiments. Figure 1 depicts the particle number concentration N9 (Dp>9 nm) after corrections for particle losses to the chamber walls and the sampling lines, inside the two chambers for a typical Class A experiment. During Exp. A1 the initial concentration of SO2 was 0.7 ppb and of O3 equal to 58 ppb. After the injection of ammonia (approximately 150 ppb) the UV lights were turned on (t=0 h), illuminating both chambers. The N9 particle number concentration started increasing in the perturbed chamber approximately 1.5 h after the lights were turned on, reaching close to 4000 cm−3, almost double its initial concentration value. The observed delay of the N9 particle number concentration in the perturbed chamber is attributed to the time needed for the particles to grow to larger sizes, so that they could be detected by the instrumentation available to us. The N9 concentration in the control chamber remained within 5 % of the initial levels. Figure 2 shows the measured number distributions in the two chambers after correction for particle losses. The formation and growth of the new particles in the perturbed chamber is evident. With a CS of 0.0026 s−1 the H2SO4 concentration was calculated to be of the order of 3×10⁷ molec cm−3. Assuming that nucleation started at t=0 the measured initial growth rate in the perturbed chamber was, on average, 4 nm h−1. This rate is based on the time of growth of the nucleation mode to 15 nm. For this experiment, 3.8 h were required for the growth of the new particles to 15 nm, so the estimated growth rate is approximately 4 nm h−1. The newly formed particles at the end of the experiment (after 5 h from the illumination) grew to approximately 20 nm. The experiment was stopped at that point because a significant fraction of the air in the two chambers had been sampled.
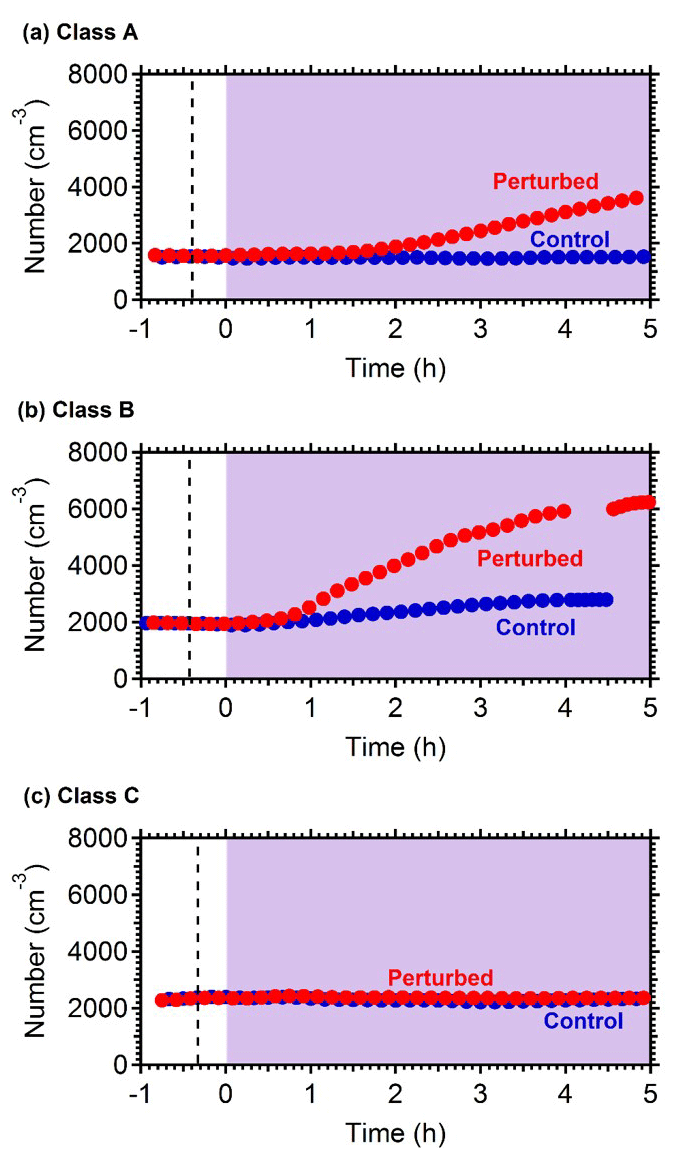
Figure 1Wall loss corrected number concentration N9 in the three different types of experiments, (a) NPF and growth only in the perturbed chamber (Exp. A1), (b) NPF and growth in both chambers (Exp. B1) and (c) no NPF observed (Exp. C1). The dashed line marks the time that ammonia was injected in the perturbed chamber. At t=0 both chambers were illuminated with UV light.
The estimated initial growth rates (refers to the average rate for the period between the start of the experiment and the time the particles reach a diameter of 9 nm) for the daytime experiments A1, A2, A4, A5, and A6 varied from 3.5 to 8 nm h−1 and were correlated with the estimated H2SO4 levels (R2=0.76) (Table 2). Experiments A1, A5, and A6 had similar CS and H2SO4 levels and resulted in similar initial growth rates (Table 2). The slope of the growth rate versus sulfuric acid linear regression for the daytime experiments was 1.4 nm h−1 molec−1 s and the intercept was low and equal to 0.05 nm h−1.
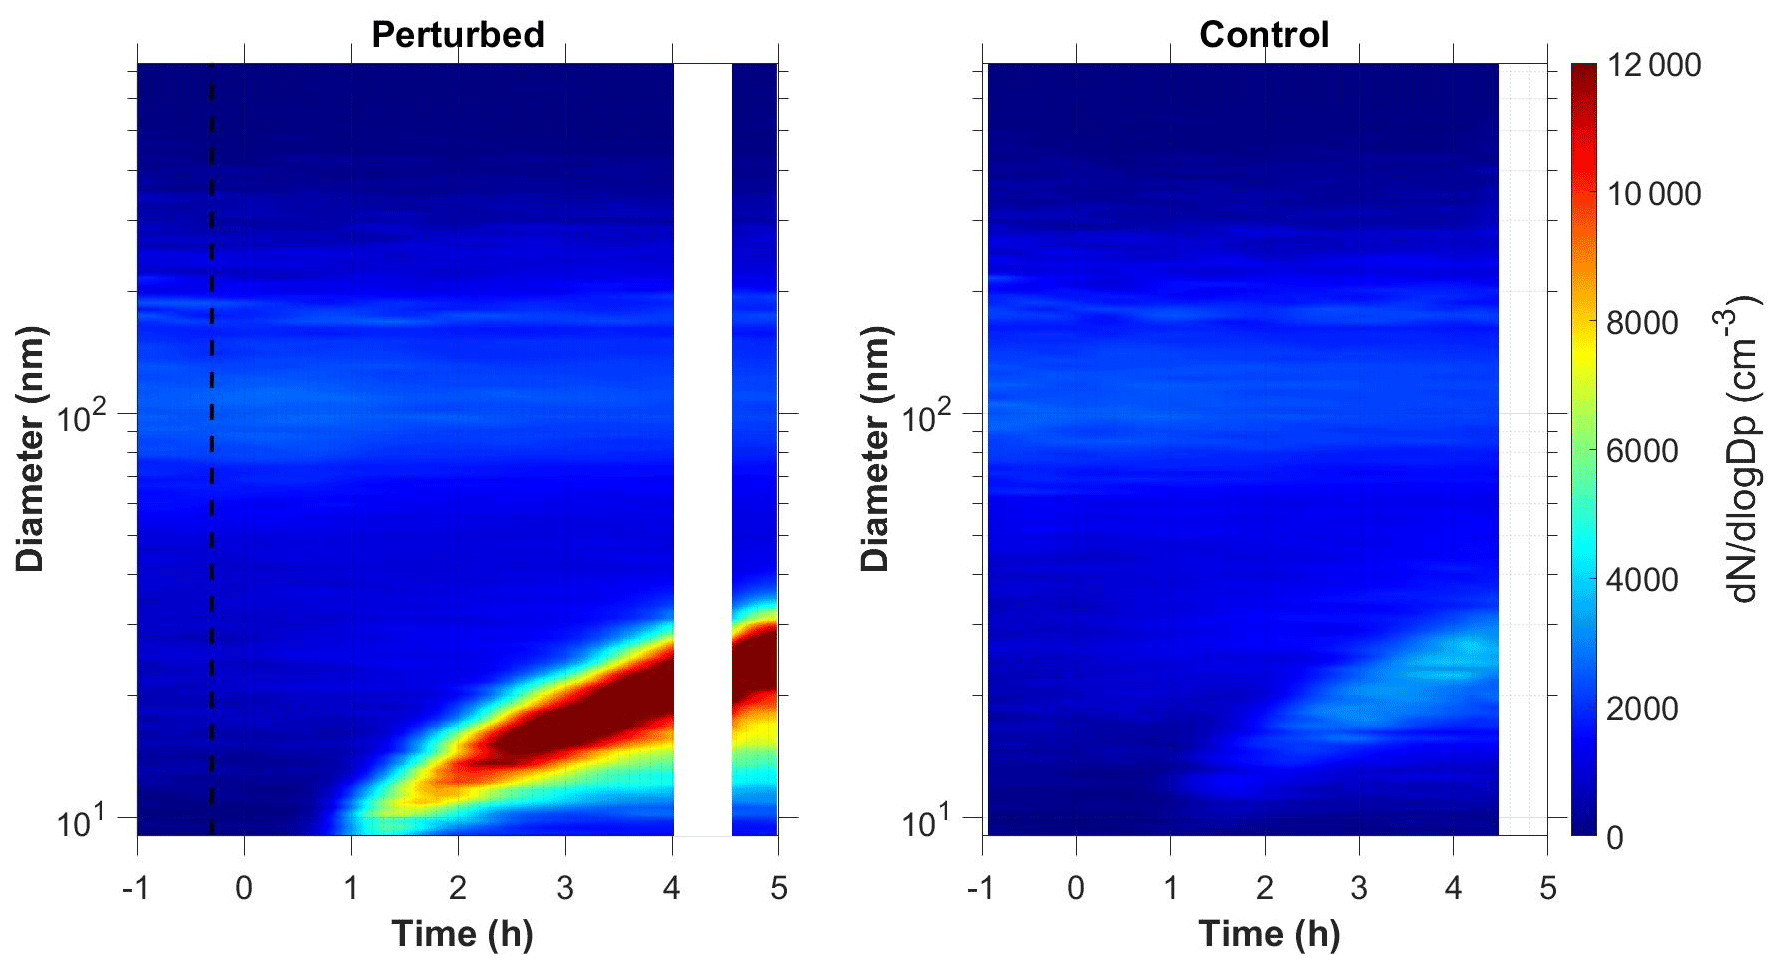
Table 2Nucleation time, nucleation rate, and condensation rate in the experiments where NPF was observed in the perturbed chamber.
a Experiments illuminated by natural sunlight; b experiment conducted at night.
Experiment A3 was conducted during the night (the chambers were filled with ambient air at 21:00 LT, so it has a relatively different behavior than the rest. If this experiment is included in the growth rate versus H2SO4 correlation, the R2 drops to 0.27. This probably suggests that the estimated OH levels are not accurate in this case, and, therefore, the H2SO4 is probably also a lot more uncertain than in the other experiments. Also, the growth process may be different with organic vapors playing a more significant role.
3.2.2 Nucleation and growth in both chambers
In 4 (B1 to B4) out of the 13 perturbation experiments, new particle formation and growth was observed in both chambers (Table 2). This suggests that the ambient air already had the potential to form new particles without the addition of ammonia.
Figure 1b shows the N9 concentration in the two chambers during Exp. B1. The initial levels of SO2 in both chambers were 0.8 ppb, and approximately 150 ppb of ammonia were added to the perturbation chamber. Half an hour after the exposure of the chambers to UV light the N9 in both chambers started increasing with higher concentrations in the perturbed chamber. The number concentration of the particles in the perturbed chamber reached close to 6000 cm−3, almost three times the initial levels. The concentration in the baseline chamber increased by approximately 50 % to 3000 cm−3. The newly formed particles in the perturbed chamber at the end of the experiment reached a mode diameter of 26 nm (Fig. 3), with an initial GR of 5.5 nm h−1. The growth rate of the particles in the reference chamber was only 10 % lower than in the perturbed one (Fig. 4) suggesting that the addition of ammonia probably influenced the nucleation rate significantly but had a small effect on the growth rate.
We tested the hypothesis that the appearance of the new particles in the reference chamber was due to a sampling error, caused by some cross contamination of the two samples as the same sampling line was used. We compared the shape of aerosol size distributions in the two chambers. The nucleation mode distribution in the reference chamber was wider (Fig. S1 in the Supplement), which is a strong indication that these were different particle populations sampled by our system.
The condensation sink in the class B experiments was on average 0.0024 s−1 quite similar to the 0.0023 s−1 in the A experiments, so the pre-existing particle mass was quite similar in the two classes of experiments. Also, the average SO2 was practically the same (0.83 ppb for the B experiments and 0.82 ppb for the A experiments). The average ammonium concentration for the class A experiments was only 20 % higher than that of Class B-experiments. The ammonium levels in this area are to a large extent determined by the sulfate levels. Adding the similarity of the UV intensity, it is clear that the major factors (sunlight, condensational sink, SO2 availability) that usually determine nucleation rates were not the reason for the weak nucleation and growth in the reference chamber in these experiments. The presence of sufficient ammonia levels is one of the possible explanations for this behavior.
The observed growth rates in these B-class experiments varied from 3.5 to 11.3 nm h−1 and were a little higher on average than those in the A group of experiments. Adding these four experiments to the linear regression of the growth rate versus sulfuric acid reduced the R2 to 0.43, but the slope remained the same, while the intercept increased to 0.7 nm h−1. These provide some weak evidence of the involvement of more compounds, probably organics, in the growth of these newly formed particles in this second group of experiments.
3.2.3 Nucleation and growth not observed
In three of the experiments C1–C3, we did not observe growth of new particles to the size of 9 nm. It is still possible that there was nucleation, but the growth may have been too slow (less than 2 nm h−1). We were only able to measure particles larger than 9 nm. If the growth rate in those experiments was less than 2 nm h−1, then the particles would not reach the 9 nm threshold during the experiment. Figure 1c depicts the N9 number concentration during Exp. C1. The initial concentration of SO2 was 1.3 ppb in this experiment. The number concentration after correction for particle losses remained constant at close to 2200 cm−3, and the corresponding number distributions changed little during the experiment (Fig. 4). Exp. C1 had the lowest initial levels of ozone of all the experiments (Table 1), around 12 ppb, a factor of four lower than the average concentration. The low O3 levels were probably due to the highest NOx levels (27 ppb) in this air mass.
Exp. C2 was conducted in the early evening (the chamber was filled with ambient air around 19:00 LT), and the lowest detectable particle size for this experiment was 14 nm because of technical difficulties. Finally, Exp. C3 had relatively low levels of sulfuric acid (2.5×10⁷ molec cm−3) compared to the rest of the experiments, a low estimated level of injected ammonia (20 ppb), and natural sunlight.
3.3 Particle composition
The mass concentration of the major components of PM1 (sulfate, organics, nitrate, ammonium) in the two chambers, after correcting for chamber particle wall losses, remained practically constant during all experiments. The corrected for wall losses mass concentration inside both chambers during Exp. B1 are shown in Fig. 5. Considering the uncertainty of the wall loss correction, the maximum increase of the concentration of the corresponding secondary PM components during the few hours of the experiments should have been a few percent or less. This will be an important constraint for the analysis of these experimental results with the aerosol dynamics model in the next section.
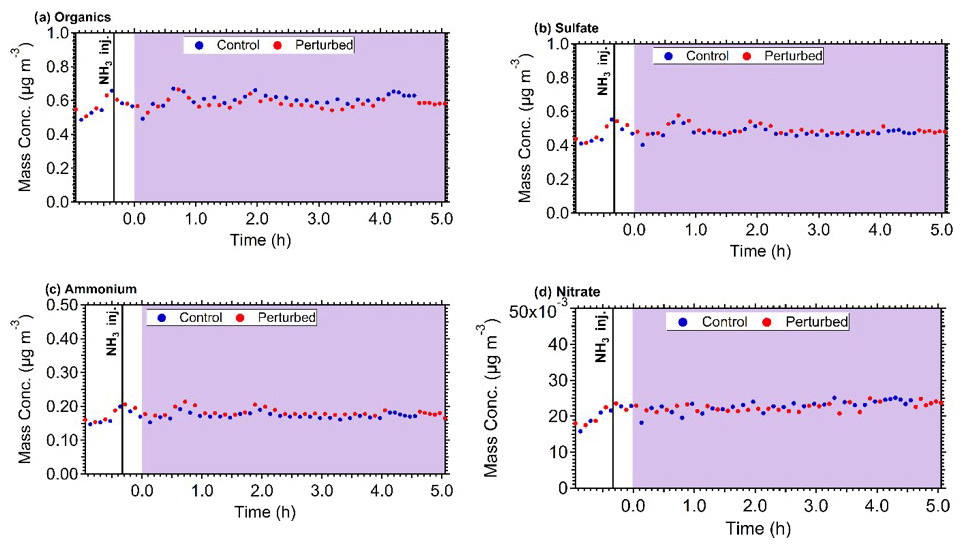
Figure 5The wall loss corrected mass concentration of (a) organics, (b) sulfate, (c) ammonium, and (d) nitrate in the control (blue dots) and perturbed (red dots) chamber during Exp. B1. The purple shades region represents the time that the chambers were under UV illumination.
3.4 Estimation of nucleation rate using an aerosol dynamics model
We used our aerosol dynamics model to simulate the growth and coagulation of the particles in the perturbed chamber assuming a nucleation rate. Our goal is to use the observations to constrain the nucleation rate that could not be measured directly. The model uses as inputs the temperature and relative humidity during the experiments and is initialized with the measured particle number distribution at time zero. There are three adjustable parameters in the model: the duration of nucleation, the nucleation rate, and the condensation rate. Nucleation is assumed to start at time zero, and a constant nucleation rate is assumed for the duration of the event. This is a necessary assumption given the available measurements. This constant rate is, in practice, an average rate for the estimated duration of the event. The condensing components are assumed to have practically zero vapor pressure. The three parameters were chosen so that the model predictions were in good agreement with the observations of particle number concentration and size distribution and also the mass concentration. The change in the condensation sink during the experiments was modest (a reduction of 10 %–30 %); however, other important parameters like the concentration of the species participating in the nucleation process were probably changing at the same time.
Figure 6 shows the measured and the predicted particle number, surface, and volume concentrations in the perturbed chamber for Exp. A1. A nucleation event with rate equal to J1=9500 cm−3 h−1 and a duration of 3 h together with a condensation rate of 3.2 ppt h−1 was needed to reproduce the observations. For much lower condensation rates, the particles did not grow to detectable sizes, and for higher condensation rates, the predicted PM mass increase was not consistent with the small mass concentration change observed. We performed sensitivity analysis around these central values, and values of cm−3 h−1 remained consistent with the observations. The average errors during the simulation were 6 % for the number concentration, 16 % for the surface concentration, and 17 % for the mass concentration. Other effective nucleation rates (e.g., J3 or J9) can be estimated with our approach, but this would require reconfiguration of the model so that the size distribution would start at the corresponding diameter threshold.
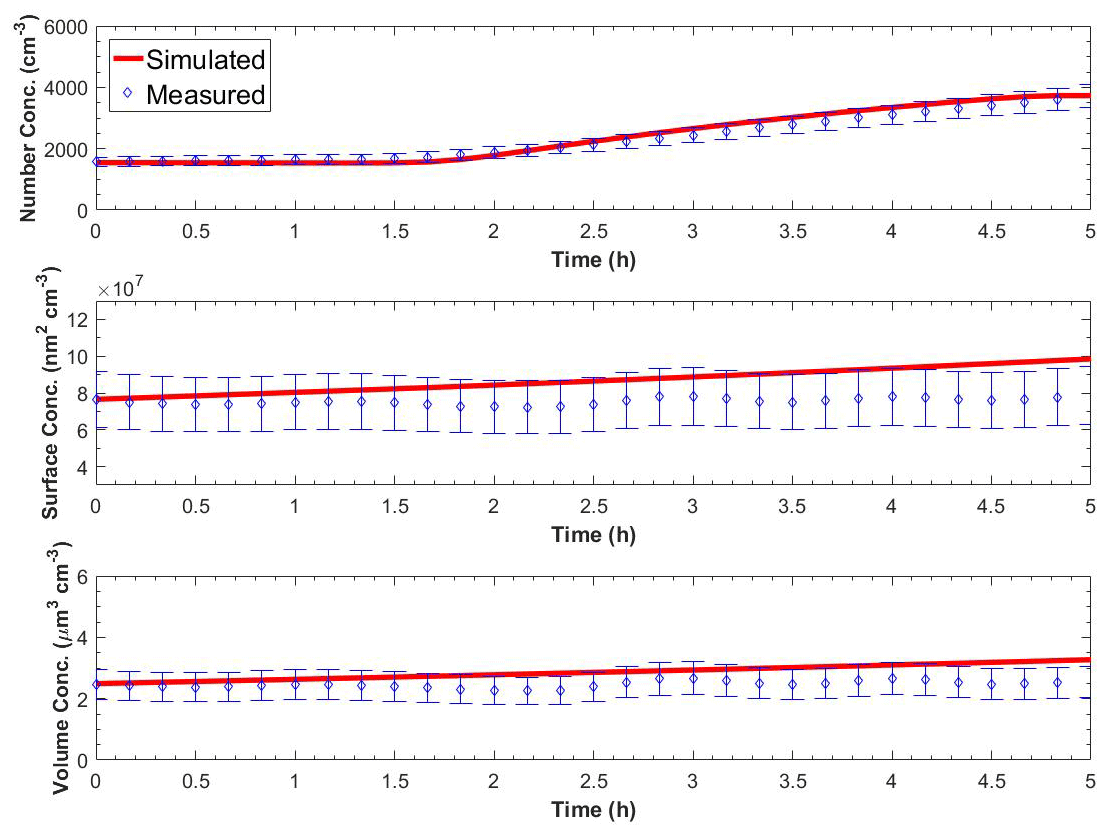
Figure 6Measured and simulated number, surface, and volume concentration in the perturbed chamber after turning UV lights on for Exp. A1. The error bars in the measured values are calculated from the uncertainty in the particle wall loss correction and represent two standard deviations.
The predicted and observed evolution of the aerosol number distributions are shown in Fig. S2. The differences for the smaller particle sizes are partially due to the losses of these particles in the sampling and measurement systems.
Table 3 summarizes the estimated nucleation rates together with the corresponding durations of the nucleation events and the required condensation rates for all experiments in groups A and B in which nucleation and growth were observed. The estimated J1 rates varied from 500 to 25 000 cm−3 h−1. These values are between those in ambient measurements and those of the CLOUD laboratory experiments (Fig. S3).
Table 3Nucleation time, nucleation rate, and condensation rate in the experiments that NPF was observed in the perturbed chamber.
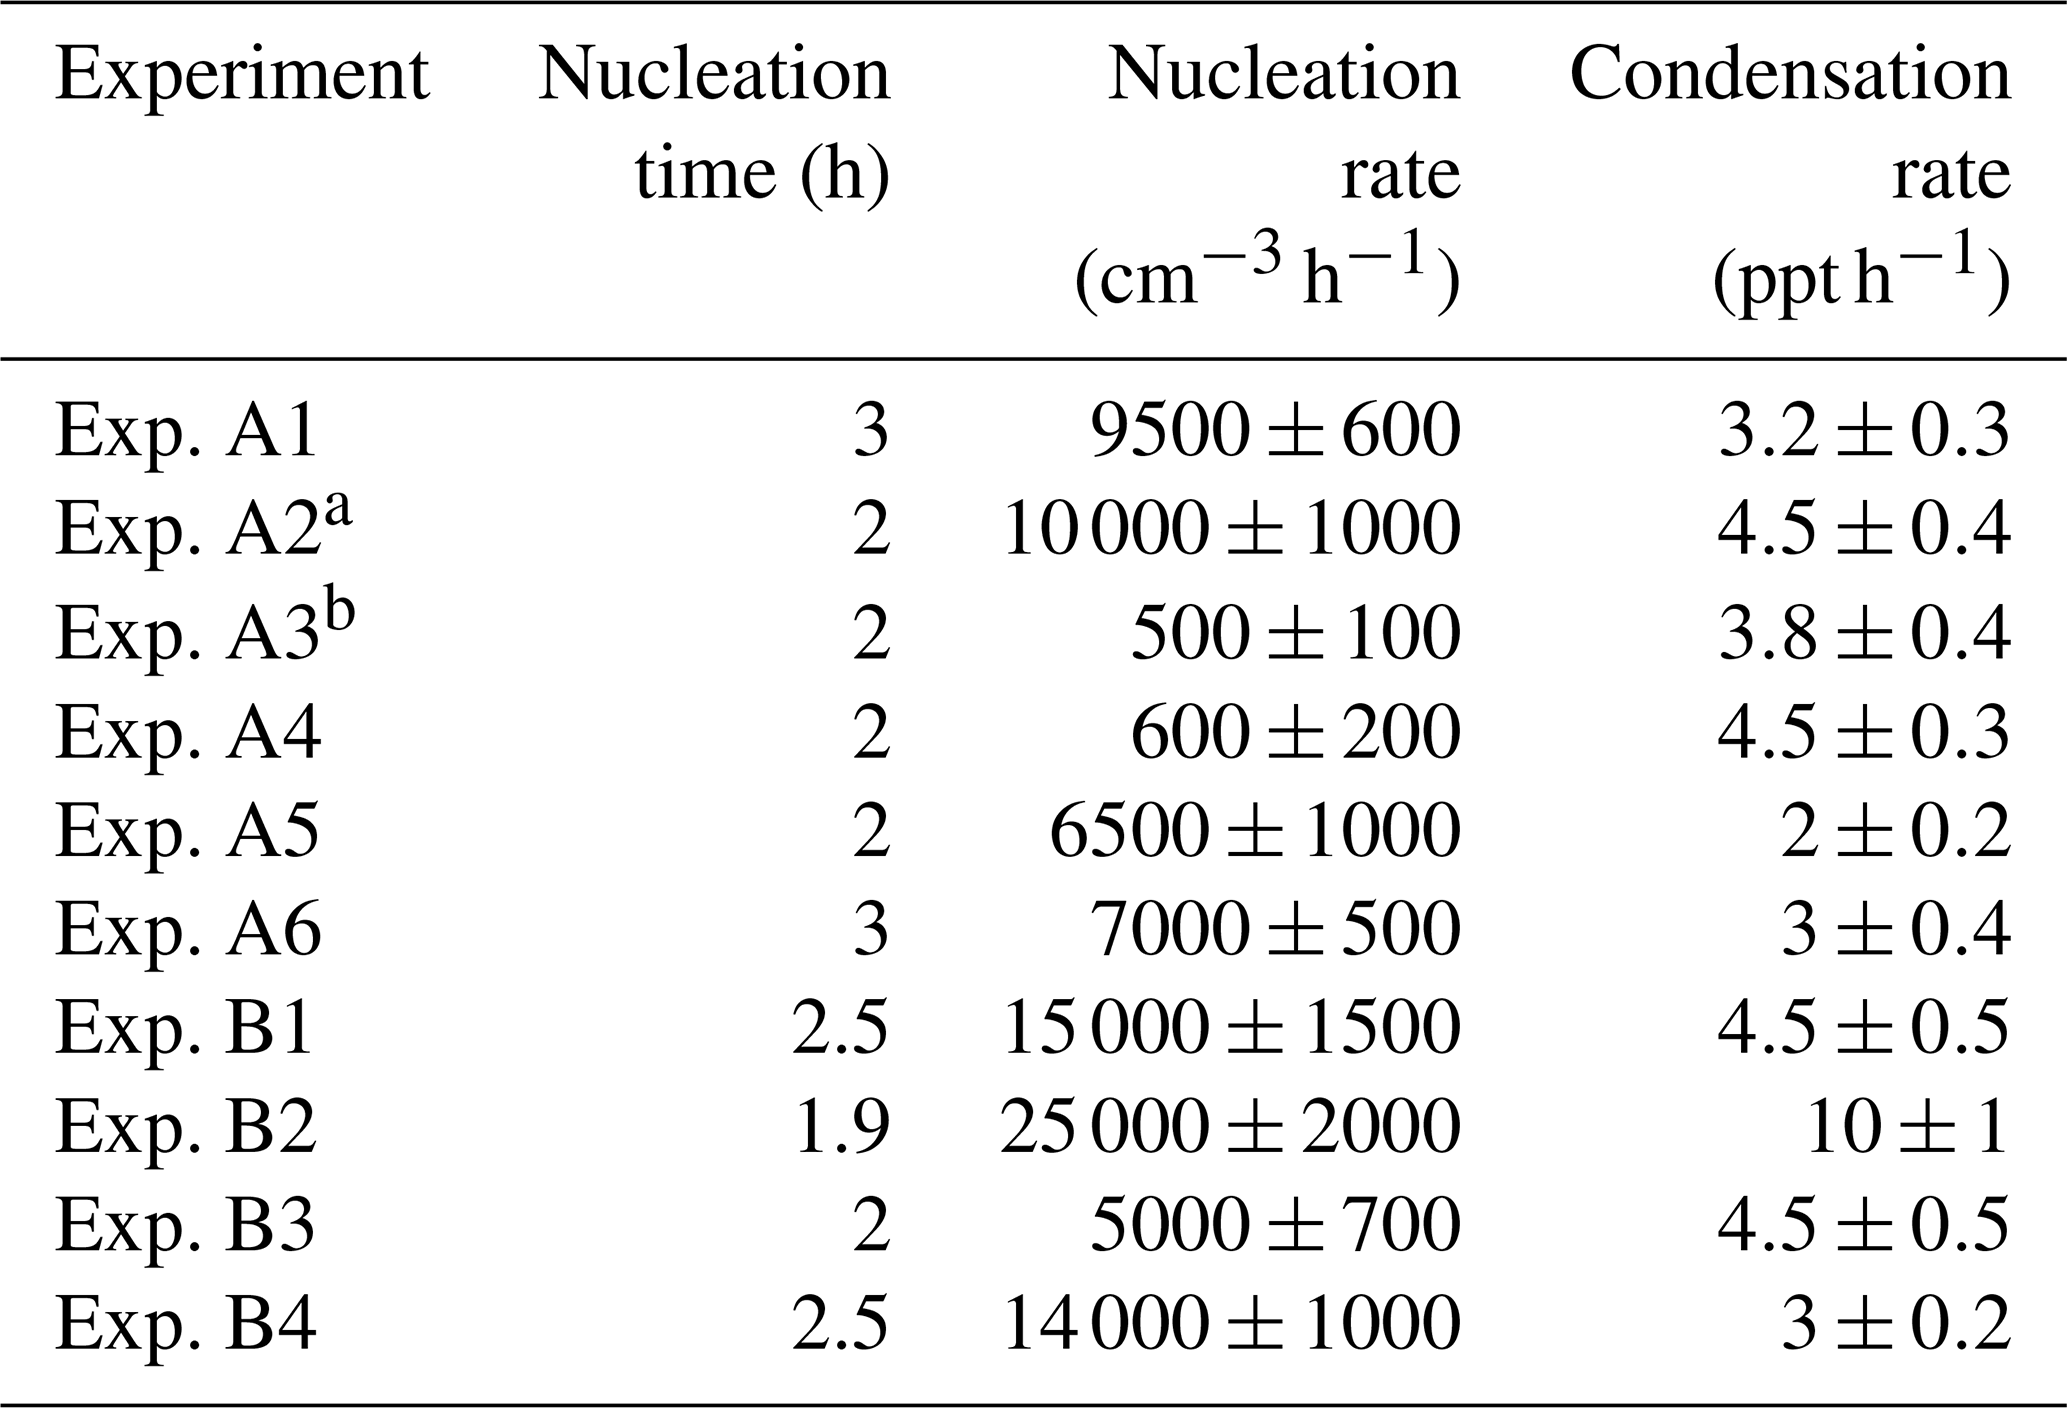
a Experiments illuminated by natural sunlight; b experiment conducted at night.
These results can be roughly compared to the CLOUD measurements for sulfuric acid-ammonia nucleation (Kirkby et al., 2011) in the 2×10⁷-108 molec cm−3 H2SO4 concentration range that was estimated for our experiments. The CLOUD measurements for the highest ammonia levels used suggested a J1.7 rate of approximately 500 cm−3 h−1 for H2SO4 concentration equal to 5×10⁷ molec cm−3. For experiment A4, we estimated the same H2SO4 concentration and a nucleation rate of 400±200 cm−3 h−1 (Fig. S3). While this agreement is probably fortuitous, overall, our estimated nucleation rates are in general consistent (considering their uncertainties) with the CLOUD measurements for the ammonia-sulfuric acid system assuming that the rate does not increase further as ammonia increases above 1 ppb.
A dual chamber system was used to investigate the hypothesis that ammonia is often the limiting reactant for new particle formation in the Eastern Mediterranean, using a new experimental approach in one of the areas with the lowest new particle formation frequency in Europe during the summer. Ambient air characterized by relatively aged air masses in southern Greece was used as the starting point of our experiments. Ammonia was added in one chamber, while the second chamber was used as a reference. Using two chambers adds to the novelty of this work, allowing for corrections due to the interactions between the chamber walls and the reacting gases and particles. To the best of our knowledge this is the first study that uses such an experimental setup for determining the role of a reactant, like ammonia, in new particle formation under realistic environmental conditions.
In 6 out of the 13 experiments (46 %) the addition of ammonia led to the formation and then growth to detectable size (approximately 10 nm) of new particles, while no formation of particles was observed in the reference chamber. In another four experiments (31 %), the addition of ammonia significantly enhanced the formation of new particles, but new particles were formed also in the reference chamber. Finally, in the remaining three experiments (23 %), we did not observe new particle formation. New particles may have been formed and may have not grown to detectable sizes in these experiments. The particles formed grew to sizes around 20–25 nm after 5 h, with an estimated initial growth rate ranging from 3 to 11 nm h−1. These results suggest that the presence of ammonia, at least at the high levels used in our study, allowed almost half of the time the formation and growth of particles that would not be formed otherwise. In one-quarter of the cases, ammonia significantly increased the nucleation rate compared to the ambient conditions. Finally, in the last quarter of the cases, the high ammonia levels did not cause nucleation and growth to detectable sizes.
We should note that we did not observe ammonium nitrate formation in any of our experiments despite the high ammonia levels. This is probably due to the combination of relatively low nitric acid levels and high temperatures during our study. This suggests that ammonium nitrate was not formed in the perturbed chamber after the ammonia injection and did not contribute to the particle growth in our experiments.
An aerosol dynamics model was used to estimate the J1 nucleation rate constrained by the measured aerosol number distribution and mass concentrations. The box model used does not directly include the ammonia concentration or a nucleation parameterization but is used instead to provide estimates of the nucleation and growth rates that are consistent with the measurements. New particle formation occurred even at the lowest ammonia levels (20 ppb) used in these experiments. The nucleation rate in the perturbed chamber ranged from 500 up to 25 000 cm−3 h−1. Coupled with the estimated sulfuric acid concentrations these rates are in general consistent (within one order of magnitude) with both ambient measurements and those of the CLOUD lab experiments for the nucleation rates in the sulfuric acid-ammonia-water system. Nucleation was observed even at the lower ammonia levels used in this work (20 ppb), and the estimated nucleation rate was quite high. This result is applicable to environments with high ammonia levels like the Netherlands or the Po Valley. The ammonia levels in these areas are often similar to those in our experiments.
The two major new advances of this work are first the use of a new experimental technique that allowed us to test the hypothesis of Pikridas et al. (2012), which was based on circumstantial evidence (the ratio of ammonium to sulfate in the particles and the wind trajectories) and second the results of the experiments that strongly support the hypothesis. A technique to estimate the nucleation and growth rates from these data even without measurements of sub-10 nm particles is an additional contribution.
Experiments in which new particles' formation was observed in both chambers show one of the advantages of using a dual chamber system in such experiments. The use of the reference chamber can help verify whether the conducted perturbation was responsible for the observed change. Future experiments with this system should include measurements of the sub-10 nm part of the aerosol size distribution and accurate measurements of the NH3 concentration.
The laboratory results and the aerosol dynamics code are available from the authors (spyros@chemeng.upatras.gr).
The supplement related to this article is available online at: https://doi.org/10.5194/acp-23-85-2023-supplement.
SDJ performed the experiments, analyzed the results, and wrote the paper. KF helped in the performance of the experiments. DP wrote the aerosol dynamics code. SNP was responsible for the design of the study and the synthesis of the results and contributed to the writing of the paper.
The contact author has declared that none of the authors has any competing interests.
Publisher's note: Copernicus Publications remains neutral with regard to jurisdictional claims in published maps and institutional affiliations.
This work was supported by the FORCeS project funded from the European Union's Horizon 2020 research and innovation programme under grant agreement No. 821205. We also acknowledge support by the Panhellenic infrastructure for atmospheric composition and climate change (PANACEA) project (grant no. MIS 5021516), which is implemented under the framework of “Reinforcement of the Research and Innovation Infrastructure” project funded by the European Operational Programme of “Competitiveness, Entrepreneurship and Innovation” (grant no. NSRF 2014–2020) and co-financed by Greece and the European Union (as part of the European Regional Development Fund).
This paper was edited by Manabu Shiraiwa and reviewed by two anonymous referees.
Berland, K., Rose, C., Pey, J., Culot, A., Freney, E., Kalivitis, N., Kouvarakis, G., Cerro, J. C., Mallet, M., Sartelet, K., Beckmann, M., Bourriane, T., Roberts, G., Marchand, N., Mihalopoulos, N., and Sellegri, K.: Spatial extent of new particle formation events over the Mediterranean Basin from multiple ground-based and airborne measurements, Atmos. Chem. Phys., 17, 9567–9583, https://doi.org/10.5194/acp-17-9567-2017, 2017.
Bolsaitis, P. and Elliott, J. F.: Thermodynamic activities and equilibrium partial pressures for aqueous sulfuric acid solutions, J. Chem. Eng. Data, 35, 69–85, https://doi.org/10.1021/je00059a022, 1990.
Brilke, S., Fölker, N., Müller, T., Kandler, K., Gong, X., Peischl, J., Weinzierl, B., and Winkler, P. M.: New particle formation and sub-10 nm size distribution measurements during the A-LIFE field experiment in Paphos, Cyprus, Atmos. Chem. Phys., 20, 5645–5656, https://doi.org/10.5194/acp-20-5645-2020, 2020.
Canagaratna, M. R., Jimenez, J. L., Kroll, J. H., Chen, Q., Kessler, S. H., Massoli, P., Hildebrandt Ruiz, L., Fortner, E., Williams, L. R., Wilson, K. R., Surratt, J. D., Donahue, N. M., Jayne, J. T., and Worsnop, D. R.: Elemental ratio measurements of organic compounds using aerosol mass spectrometry: characterization, improved calibration, and implications, Atmos. Chem. Phys., 15, 253–272, https://doi.org/10.5194/acp-15-253-2015, 2015.
Capaldo, K. P., Kasibhatla, P., and Pandis, S. N.: Is aerosol production within the remote marine boundary layer sufficient to maintain observed concentrations?, J. Geophys. Res.-Atmos., 104, 3483–3500, https://doi.org/10.1029/1998JD100080, 1999.
Dammers, E., Schaap, M., Haaima, M., Palm, M., Wichink Kruit, R. J., Volten, H., Hensen, A., Swart, D., and Erisman, J. W.: Measuring atmospheric ammonia with remote sensing campaign: Part 1 – Characterisation of vertical ammonia concentration profile in the centre of The Netherlands, Atmos. Environ., 169, 97–112, https://doi.org/10.1016/j.atmosenv.2017.08.067, 2017.
DeMore, W. B., Sander, S. P., Golden, D. M., Hampson, R. F., Kurylo, M. J., Howard, C. J., Ravishankara, A. R., Kolb, C. E., and Molina, M. J.: Chemical Kinetics and Photochemical Data for Use in Stratospheric Modeling, JPL Publ. 97-4, Jet Prop. Lab., Pasadena, California, 278 pp., https://jpldataeval.jpl.nasa.gov/pdf/Atmos97_Anotated.pdf (last access: 3 January 2023), 1997.
Dinoi, A., Weinhold, K., Wiedensohler, A., and Contini, D.: Study of new particle formation events in southern Italy, Atmos. Environ., 244, 117920, https://doi.org/10.1016/j.atmosenv.2020.117920, 2021.
Ehn, M., Thornton, J. A., Kleist, E., Sipilä, M., Junninen, H., Pullinen, I., Springer, M., Rubach, F., Tillmann, R., Lee, B., Lopez-Hilfiker, F., Andres, S., Acir, I. H., Rissanen, M., Jokinen, T., Schobesberger, S., Kangasluoma, J., Kontkanen, J., Nieminen, T., Kurtén, T., Nielsen, L. B., Jørgensen, S., Kjaergaard, H. G., Canagaratna, M., Maso, M. D., Berndt, T., Petäjä, T., Wahner, A., Kerminen, V. M., Kulmala, M., Worsnop, D. R., Wildt, J., and Mentel, T. F.: A large source of low-volatility secondary organic aerosol, Nature, 506, 476–479, https://doi.org/10.1038/nature13032, 2014.
Fuchs, N. A.: The Mechanics of Aerosols, Elsevier, New York, ISBN 008010066X, 1964.
Glasoe, W. A., Volz, K., Panta, B., Freshour, N., Bachman, R., Hanson, D. R., McMurry, P. H., and Jen, C.: Sulfuric acid nucleation: An experimental study of the effect of seven bases, J. Geophys. Res.-Atmos., 120, 1933–1950, https://doi.org/10.1002/2014JD022730, 2015.
Haywood, J. and Boucher, O.: Estimates of the direct and indirect radiative forcing due to tropospheric aerosols: A review, Rev. Geophys., 38, 513–543, https://doi.org/10.1029/1999RG000078, 2000.
He, X.-C., Tham, Y. J., Dada, L., Wang, M., Finkenzeller, H., Stolzenburg, D., Iyer, S., Simon, M., Kürten, A., Shen, J., Rörup, B., Rissanen, M., Schobesberger, S., Baalbaki, R., Wang, D. S., Koenig, T. K., Jokinen, T., Sarnela, N., Beck, L. J., Almeida, J., Amanatidis, S., Amorim, A., Ataei, F., Baccarini, A., Bertozzi, B., Bianchi, F., Brilke, S., Caudillo, L., Chen, D., Chiu, R., Chu, B., Dias, A., Ding, A., Dommen, J., Duplissy, J., El Haddad, I., Gonzalez Carracedo, L., Granzin, M., Hansel, A., Heinritzi, M., Hofbauer, V., Junninen, H., Kangasluoma, J., Kemppainen, D., Kim, C., Kong, W., Krechmer, J. E., Kvashin, A., Laitinen, T., Lamkaddam, H., Lee, C. P., Lehtipalo, K., Leiminger, M., Li, Z., Makhmutov, V., Manninen, H. E., Marie, G., Marten, R., Mathot, S., Mauldin, R. L., Mentler, B., Möhler, O., Müller, T., Nie, W., Onnela, A., Petäjä, T., Pfeifer, J., Philippov, M., Ranjithkumar, A., Saiz-Lopez, A., Salma, I., Scholz, W., Schuchmann, S., Schulze, B., Steiner, G., Stozhkov, Y., Tauber, C., Tomé, A., Thakur, R. C., Väisänen, O., Vazquez-Pufleau, M., Wagner, A. C., Wang, Y., Weber, S. K., Winkler, P. M., Wu, Y., Xiao, M., Yan, C., Ye, Q., Ylisirniö, A., Zauner-Wieczorek, M., Zha, Q., Zhou, P., Flagan, R. C., Curtius, J., Baltensperger, U., Kulmala, M., Kerminen, V.-M., Kurtén, T., Donahue, N. M., Volkamer, R., Kirkby, J., Worsnop, D. R., and Sipilä, M.: Role of iodine oxoacids in atmospheric aerosol nucleation, Science, 371, 589–595, 2021.
Hegg, D. A., Radke, L. F., and Hobbs, P. V.: Measurements of Aitken nuclei and cloud condensation nuclei in the marine atmosphere and their relation to the DMS-Cloud-climate hypothesis, J. Geophys. Res., 96, 18727, https://doi.org/10.1029/91JD01870, 1991.
Hussein, T., Atashi, N., Sogacheva, L., Hakala, S., Dada, L., Petäjä, T., and Kulmala, M.: Characterization of urban new particle formation in Amman-Jordan, Atmosphere, 11, 79, https://doi.org/10.3390/atmos11010079, 2020.
Jaecker-Voirol, A. and Mirabel, P.: Heteromolecular nucleation in the sulfuric acid-water system, Atmos. Environ., 23, 2053–2057, https://doi.org/10.1016/0004-6981(89)90530-1, 1989.
Jen, C. N., McMurry, P. H., and Hanson, D. R.: Stabilization of sulfuric acid dimers by ammonia, methylamine, dimethylamine, and trimethylamine, J. Geophys. Res.-Atmos., 119, 7502–7514, https://doi.org/10.1002/2014JD021592, 2014.
Jorga, S. D., Kaltsonoudis, C., Liangou, A., and Pandis, S. N.: Measurement of Formation Rates of Secondary Aerosol in the Ambient Urban Atmosphere Using a Dual Smog Chamber System, Environ. Sci. Technol., 54, 1336–1343, https://doi.org/10.1021/acs.est.9b03479, 2020.
Kalivitis, N., Birmili, W., Stock, M., Wehner, B., Massling, A., Wiedensohler, A., Gerasopoulos, E., and Mihalopoulos, N.: Particle size distributions in the Eastern Mediterranean troposphere, Atmos. Chem. Phys., 8, 6729–6738, https://doi.org/10.5194/acp-8-6729-2008, 2008.
Kalivitis, N., Kerminen, V. M., Kouvarakis, G., Stavroulas, I., Tzitzikalaki, E., Kalkavouras, P., Daskalakis, N., Myriokefalitakis, S., Bougiatioti, A., Manninen, H. E., Roldin, P., Petäjä, T., Boy, M., Kulmala, M., Kanakidou, M., and Mihalopoulos, N.: Formation and growth of atmospheric nanoparticles in the eastern Mediterranean: Results from long-term measurements and process simulations, Atmos. Chem. Phys., 19, 2671–2686, https://doi.org/10.5194/acp-19-2671-2019, 2019.
Kalkavouras, P., Bossioli, E., Bezantakos, S., Bougiatioti, A., Kalivitis, N., Stavroulas, I., Kouvarakis, G., Protonotariou, A. P., Dandou, A., Biskos, G., Mihalopoulos, N., Nenes, A., and Tombrou, M.: New particle formation in the southern Aegean Sea during the Etesians: Importance for CCN production and cloud droplet number, Atmos. Chem. Phys., 17, 175–192, https://doi.org/10.5194/acp-17-175-2017, 2017.
Kalkavouras, P., Bougiatioti, A., Grivas, G., Stavroulas, I., Kalivitis, N., Liakakou, E., Gerasopoulos, E., Pilinis, C., and Mihalopoulos, N.: On the regional aspects of new particle formation in the Eastern Mediterranean: A comparative study between a background and an urban site based on long term observations, Atmos. Res., 239, 104911, https://doi.org/10.1016/j.atmosres.2020.104911, 2020.
Kaltsonoudis, C., Jorga, S. D., Louvaris, E., Florou, K., and Pandis, S. N.: A portable dual-smog-chamber system for atmospheric aerosol field studies, Atmos. Meas. Tech., 12, 2733–2743, https://doi.org/10.5194/amt-12-2733-2019, 2019.
Kerminen, V. M., Petäjä, T., Manninen, H. E., Paasonen, P., Nieminen, T., Sipilä, M., Junninen, H., Ehn, M., Gagné, S., Laakso, L., Riipinen, I., Vehkamäki, H., Kurten, T., Ortega, I. K., Dal Maso, M., Brus, D., Hyvärinen, A., Lihavainen, H., Leppä, J., Lehtinen, K. E. J., Mirme, A., Mirme, S., Hõrrak, U., Berndt, T., Stratmann, F., Birmili, W., Wiedensohler, A., Metzger, A., Dommen, J., Baltensperger, U., Kiendler-Scharr, A., Mentel, T. F., Wildt, J., Winkler, P. M., Wagner, P. E., Petzold, A., Minikin, A., Plass-Dülmer, C., Pöschl, U., Laaksonen, A., and Kulmala, M.: Atmospheric nucleation: Highlights of the EUCAARI project and future directions, Atmos. Chem. Phys., 10, 10829–10848, https://doi.org/10.5194/acp-10-10829-2010, 2010.
Kirkby, J., Curtius, J., Almeida, J., Dunne, E., Duplissy, J., Ehrhart, S., Franchin, A., Gagné, S., Ickes, L., Kürten, A., Kupc, A., Metzger, A., Riccobono, F., Rondo, L., Schobesberger, S., Tsagkogeorgas, G., Wimmer, D., Amorim, A., Bianchi, F., Breitenlechner, M., David, A., Dommen, J., Downard, A., Ehn, M., Flagan, R. C., Haider, S., Hansel, A., Hauser, D., Jud, W., Junninen, H., Kreissl, F., Kvashin, A., Laaksonen, A., Lehtipalo, K., Lima, J., Lovejoy, E. R., Makhmutov, V., Mathot, S., Mikkilä, J., Minginette, P., Mogo, S., Nieminen, T., Onnela, A., Pereira, P., Petäjä, T., Schnitzhofer, R., Seinfeld, J. H., Sipilä, M., Stozhkov, Y., Stratmann, F., Tomé, A., Vanhanen, J., Viisanen, Y., Vrtala, A., Wagner, P. E., Walther, H., Weingartner, E., Wex, H., Winkler, P. M., Carslaw, K. S., Worsnop, D. R., Baltensperger, U., and Kulmala, M.: Role of sulphuric acid, ammonia and galactic cosmic rays in atmospheric aerosol nucleation, Nature, 476, 429–433, https://doi.org/10.1038/nature10343, 2011.
Kopanakis, I., Chatoutsidou, S. E., Torseth, K., Glytsos, T., and Lazaridis, M.: Particle number size distribution in the eastern Mediterranean: Formation and growth rates of ultrafine airborne atmospheric particles, Atmos. Environ., 77, 790–802, https://doi.org/10.1016/j.atmosenv.2013.05.066, 2013.
Kostenidou, E., Lee, B. H., Engelhart, G. J., Pierce, J. R., and Pandis, S. N.: Mass spectra deconvolution of low, medium, and high volatility biogenic secondary organic aerosol, Environ. Sci. Technol., 43, 4884–4889, https://doi.org/10.1021/es803676g, 2009.
Kreidenweis, S. M., Yin, F., Wang, S.-C., Grosjean, D., Flagan, R. C., and Seinfeld, J. H.: Aerosol formation during photooxidation of organosulfur species, Atmos. Environ. Pt. A, 25, 2491–2500, https://doi.org/10.1016/0960-1686(91)90165-4, 1991.
Kulmala, M., Riipinen, I., Sipilä, M., Manninen, H. E., Petaja, T., Junninen, H., Maso, M. D., Mordas, G., Mirme, A., Vana, M., Hirsikko, A., Laakso, L., Harrison, R. M., Hanson, I., Leung, C., Lehtinen, K. E. J., and Kerminen, V.-M.: Toward Direct Measurement of Atmospheric Nucleation, Science, 318, 89–92, https://doi.org/10.1126/science.1144124, 2007.
Laaksonen, A., Pirjola, L., Kulmala, M., Wohlfrom, K. H., Arnold, F., and Raes, F.: Upper tropospheric so2 conversion into sulfuric acid aerosols and cloud condensation nuclei, J. Geophys. Res.-Atmos., 105, 1459–1469, https://doi.org/10.1029/1999JD900933, 2000.
Manninen, H. E., Nieminen, T., Asmi, E., Gagné, S., Häkkinen, S., Lehtipalo, K., Aalto, P., Vana, M., Mirme, A., Mirme, S., Hõrrak, U., Plass-Dülmer, C., Stange, G., Kiss, G., Hoffer, A., Töro, N., Moerman, M., Henzing, B., De Leeuw, G., Brinkenberg, M., Kouvarakis, G. N., Bougiatioti, A., Mihalopoulos, N., O'Dowd, C., Ceburnis, D., Arneth, A., Svenningsson, B., Swietlicki, E., Tarozzi, L., Decesari, S., Facchini, M. C., Birmili, W., Sonntag, A., Wiedensohler, A., Boulon, J., Sellegri, K., Laj, P., Gysel, M., Bukowiecki, N., Weingartner, E., Wehrle, G., Laaksonen, A., Hamed, A., Joutsensaari, J., Petäjä, T., Kerminen, V. M., and Kulmala, M.: EUCAARI ion spectrometer measurements at 12 European sites-analysis of new particle formation events, Atmos. Chem. Phys., 10, 7907–7927, https://doi.org/10.5194/acp-10-7907-2010, 2010.
McFiggans, G., Bale, C. S. E., Ball, S. M., Beames, J. M., Bloss, W. J., Carpenter, L. J., Dorsey, J., Dunk, R., Flynn, M. J., Furneaux, K. L., Gallagher, M. W., Heard, D. E., Hollingsworth, A. M., Hornsby, K., Ingham, T., Jones, C. E., Jones, R. L., Kramer, L. J., Langridge, J. M., Leblanc, C., LeCrane, J. P., Lee, J. D., Leigh, R. J., Longley, I., Mahajan, A. S., Monks, P. S., Oetjen, H., Orr-Ewing, A. J., Plane, J. M. C., Potin, P., Shillings, A. J. L., Thomas, F., Von Glasow, R., Wada, R., Whalley, L. K., and Whitehead, J. D.: Iodine-mediated coastal particle formation: An overview of the Reactive Halogens in the Marine boundary layer (RHaMBLe) Roscoff coastal study, Atmos. Chem. Phys., 10, 2975–2999, https://doi.org/10.5194/acp-10-2975-2010, 2010.
Merikanto, J., Spracklen, D. V., Mann, G. W., Pickering, S. J., and Carslaw, K. S.: Impact of nucleation on global CCN, Atmos. Chem. Phys., 9, 8601–8616, https://doi.org/10.5194/acp-9-8601-2009, 2009.
Mohr, C., Thornton, J. A., Heitto, A., Lopez-Hilfiker, F. D., Lutz, A., Riipinen, I., Hong, J., Donahue, N. M., Hallquist, M., Petäjä, T., Kulmala, M., and Yli-Juuti, T.: Molecular identification of organic vapors driving atmospheric nanoparticle growth, Nat. Commun., 10, 1–7, https://doi.org/10.1038/s41467-019-12473-2, 2019.
Patoulias, D., Fountoukis, C., Riipinen, I., Asmi, A., Kulmala, M., and Pandis, S. N.: Simulation of the size-composition distribution of atmospheric nanoparticles over Europe, Atmos. Chem. Phys., 18, 13639–13654, https://doi.org/10.5194/acp-18-13639-2018, 2018.
Pikridas, M., Riipinen, I., Hildebrandt, L., Kostenidou, E., Manninen, H., Mihalopoulos, N., Kalivitis, N., Burkhart, J. F., Stohl, A., Kulmala, M., and Pandis, S. N.: New particle formation at a remote site in the eastern Mediterranean, J. Geophys. Res.-Atmos., 117, D12205, https://doi.org/10.1029/2012JD017570, 2012.
Pope, C. A., Burnett, R. T., Thun, M. J., Calle, E. E., Krewski, D., Ito, K., and Thurston, G. D.: Lung cancer, cardiopulmonary mortality, and long-term exposure to fine particulate air pollution, J. Am. Med. Assoc., 287, 1132–1141, https://doi.org/10.1001/jama.287.9.1132, 2002.
Saha, P. K., Zimmerman, N., Malings, C., Hauryliuk, A., Li, Z., Snell, L., Subramanian, R., Lipsky, E., Apte, J. S., Robinson, A. L., and Presto, A. A.: Quantifying high-resolution spatial variations and local source impacts of urban ultrafine particle concentrations, Sci. Total Environ., 655, 473–481, https://doi.org/10.1016/j.scitotenv.2018.11.197, 2019.
Seinfeld, J. H. and Pandis, S. N.: Atmospheric Chemistry and Physics from Air Pollution to Climate Change, John Wiley, Hoboken, NJ, ISBN 978-1-118-94740-1, 2016.
Siakavaras, D., Samara, C., Petrakakis, M., and Biskos, G.: Nucleation events at a coastal city during the warm period: Kerbside versus urban background measurements, Atmos. Environ., 140, 60–68, https://doi.org/10.1016/j.atmosenv.2016.05.054, 2016.
Sipilä, M., Berndt, T., Petaja, T., Brus, D., Vanhanen, J., Stratmann, F., Patokoski, J., Mauldin, R. L., Hyvärinen, A. P., Lihavainen, H., and Kulmala, M.: The role of sulfuric acid in atmospheric nucleation, Science, 327, 1243–1246, https://doi.org/10.1126/science.1180315, 2010.
Sipilä, M., Sarnela, N., Jokinen, T., Henschel, H., Junninen, H., Kontkanen, J., Richters, S., Kangasluoma, J., Franchin, A., Peräkylä, O., Rissanen, M. P., Ehn, M., Vehkamäki, H., Kurten, T., Berndt, T., Petäjä, T., Worsnop, D., Ceburnis, D., Kerminen, V. M., Kulmala, M., and O'Dowd, C.: Molecular-scale evidence of aerosol particle formation via sequential addition of HIO3, Nature, 537, 532–534, https://doi.org/10.1038/nature19314, 2016.
Van Dingenen, R. and Raes, F.: Determination of the condensation accommodation coefficient of sulfuric acid on water-sulfuric acid aerosol, Aerosol Sci. Tech., 15, 93–106, https://doi.org/10.1080/02786829108959516, 1991.
Vratolis, S., Gini, M. I., Bezantakos, S., Stavroulas, I., Kalivitis, N., Kostenidou, E., Louvaris, E., Siakavaras, D., Biskos, G., Mihalopoulos, N., Pandis, S. N., Pilinis, C., Papayannis, A., and Eleftheriadis, K.: Particle number size distribution statistics at City-Centre Urban Background, urban background, and remote stations in Greece during summer, Atmos. Environ., 213, 711–726, https://doi.org/10.1016/j.atmosenv.2019.05.064, 2019.
Wang, M., Kong, W., Marten, R., He, X. C., Chen, D., Pfeifer, J., Heitto, A., Kontkanen, J., Dada, L., Kürten, A., Yli-Juuti, T., Manninen, H. E., Amanatidis, S., Amorim, A., Baalbaki, R., Baccarini, A., Bell, D. M., Bertozzi, B., Bräkling, S., Brilke, S., Murillo, L. C., Chiu, R., Chu, B., De Menezes, L. P., Duplissy, J., Finkenzeller, H., Carracedo, L. G., Granzin, M., Guida, R., Hansel, A., Hofbauer, V., Krechmer, J., Lehtipalo, K., Lamkaddam, H., Lampimäki, M., Lee, C. P., Makhmutov, V., Marie, G., Mathot, S., Mauldin, R. L., Mentler, B., Müller, T., Onnela, A., Partoll, E., Petäjä, T., Philippov, M., Pospisilova, V., Ranjithkumar, A., Rissanen, M., Rörup, B., Scholz, W., Shen, J., Simon, M., Sipilä, M., Steiner, G., Stolzenburg, D., Tham, Y. J., Tomé, A., Wagner, A. C., Wang, D. S., Wang, Y., Weber, S. K., Winkler, P. M., Wlasits, P. J., Wu, Y., Xiao, M., Ye, Q., Zauner-Wieczorek, M., Zhou, X., Volkamer, R., Riipinen, I., Dommen, J., Curtius, J., Baltensperger, U., Kulmala, M., Worsnop, D. R., Kirkby, J., Seinfeld, J. H., El-Haddad, I., Flagan, R. C., and Donahue, N. M.: Rapid growth of new atmospheric particles by nitric acid and ammonia condensation, Nature, 581, 184–189, https://doi.org/10.1038/s41586-020-2270-4, 2020.
Wang, N., Jorga, S. D., Pierce, J. R., Donahue, N. M., and Pandis, S. N.: Particle wall-loss correction methods in smog chamber experiments, Atmos. Meas. Tech., 11, 6577–6588, https://doi.org/10.5194/amt-11-6577-2018, 2018.
Wang, Z., Wu, Z., Yue, D., Shang, D., Guo, S., Sun, J., Ding, A., Wang, L., Jiang, J., Guo, H., Gao, J., Cheung, H. C., Morawska, L., Keywood, M., and Hu, M.: New particle formation in China: Current knowledge and further directions, Sci. Total Environ., 577, 258–266, https://doi.org/10.1016/j.scitotenv.2016.10.177, 2017.
Weber, R. J., Marti, J. J., Mcmurry, P. H., Eisele, F. L., Tanner, D. J., and Jefferson, A.: Measured atmospheric new particle formation rates: implications for nucleation mechanisms, Chem. Eng. Commun., 151, 53–64, https://doi.org/10.1080/00986449608936541, 1996.
Weber, R. J., McMurry, P. H., Mauldin, L., Tanner, D. J., Eisele, F. L., Brechtel, F. J., Kreidenweis, S. M., Kok, G. L., Schillawski, R. D., and Baumgardner, B.: A study of new particle formation and growth involving biogenic and trace gas species measured during ACE 1, J. Geophys. Res.-Atmos., 103, 16385–16396, https://doi.org/10.1029/97JD02465, 1998.
Yao, L., Garmash, O., Bianchi, F., Zheng, J., Yan, C., Kontkanen, J., Junninen, H., Mazon, S. B., Ehn, M., Paasonen, P., Sipilä, M., Wang, M., Wang, X., Xiao, S., Chen, H., Lu, Y., Zhang, B., Wang, D., Fu, Q., Geng, F., Li, L., Wang, H., Qiao, L., Yang, X., Chen, J., Kerminen, V.-M., Petäjä, T., Worsnop, D. R., Kulmala, M., and Wang, L.: Atmospheric new particle formation from sulfuric acid and amines in a Chinese megacity, Science, 361, 278–281, https://doi.org/10.1126/science.aao4839, 2018.
Yli-Juuti, T., Nieminen, T., Hirsikko, A., Aalto, P. P., Asmi, E., Hõrrak, U., Manninen, H. E., Patokoski, J., Dal Maso, M., Petäjä, T., Rinne, J., Kulmala, M., and Riipinen, I.: Growth rates of nucleation mode particles in Hyytiälä during 2003–2009: Variation with particle size, season, data analysis method and ambient conditions, Atmos. Chem. Phys., 11, 12865–12886, https://doi.org/10.5194/acp-11-12865-2011, 2011.
Zhao, Y., Hennigan, C. J., May, A. A., Tkacik, D. S., De Gouw, J. A., Gilman, J. B., Kuster, W. C., Borbon, A., and Robinson, A. L.: Intermediate-volatility organic compounds: A large source of secondary organic aerosol, Environ. Sci. Technol., 48, 13743–13750, https://doi.org/10.1021/es5035188, 2014.
Zhu, Y., Li, K., Shen, Y., Gao, Y., Liu, X., Yu, Y., Gao, H., and Yao, X.: New particle formation in the marine atmosphere during seven cruise campaigns, Atmos. Chem. Phys., 19, 89–113, https://doi.org/10.5194/acp-19-89-2019, 2019.