the Creative Commons Attribution 4.0 License.
the Creative Commons Attribution 4.0 License.
 | 18 Jan 2023
Observed changes in stratospheric circulation: decreasing lifetime of N2O, 2005–2021
Lucien Froidevaux
Nathaniel J. Livesey
Using Aura Microwave Limb Sounder satellite observations of stratospheric nitrous oxide (N2O), ozone, and temperature from 2005 through 2021, we calculate the atmospheric lifetime of N2O to be decreasing at a rate of −2.1 ± 1.2 %/decade. This decrease is occurring because the N2O abundances in the middle tropical stratosphere, where N2O is photochemically destroyed, are increasing at a faster rate than the bulk N2O in the lower atmosphere. The cause appears to be a more vigorous stratospheric circulation, which models predict to be a result of climate change. If the observed trends in lifetime and implied emissions continue, then the change in N2O over the 21st century will be 27 % less than those projected with a fixed lifetime, and the impact on global warming and ozone depletion will be proportionately lessened. Because global warming is caused in part by N2O, this finding is an example of a negative climate–chemistry feedback.
- Article
(543 KB) - Full-text XML
-
Supplement
(1022 KB) - BibTeX
- EndNote


Projections of climate change include the acceleration of the stratospheric overturning circulation over the 21st century (Abalos et al., 2021). This three-dimensional circulation, condensed into a two-dimensional framework called the Brewer–Dobson circulation (BDC), brings tropospheric air into the tropical stratosphere where it ascends, being photochemically processed with ultraviolet radiation that increases with altitude, mixes across latitudes, and then descends at mid to high latitudes, re-entering the troposphere around the mid latitudes (Plumb and Mahlman, 1987; Neu and Plumb, 1999; Butchart, 2014). Observational metrics for an enhanced BDC are based on trends in the age of air (AoA) using surrogate gases such as SF6. While models predict an enhanced BDC, the SF6 observations indicate an unchanged or decreasing BDC but with large uncertainty (Karpechko et al., 2018; Abalos et al., 2021; Garney et al., 2022). The comparison of models and measurements of AoA has proven difficult (Fritsch et al., 2020). The search for BDC change with AoA has missed a more obvious and compelling case based on the important greenhouse gas nitrous oxide (N2O), where recent work has shown agreement in upper stratospheric trends across satellite instruments and a model (Froidevaux et al., 2022). Here we take the Aura Microwave Limb Sounder (MLS) observations of N2O, ozone (O3), and temperature (T) from 2005 through 2021 and show that N2O increases through the middle tropical stratosphere, relatively greater than the rate of tropospheric increases, lead to a shorter atmospheric lifetime, an important consequence of a more vigorous BDC.
Consequences of an enhanced BDC have recently focussed on the increased flux of stratospheric ozone (O3) into the troposphere with a subsequent increase in tropospheric O3; see the discussion in Karpechko et al. (2018) and Garney et al. (2022). Enhanced BDC also leads to shorter lifetimes for gases like nitrous oxide (N2O) and chlorofluorocarbons (CFCs) as greater abundances are pushed higher into the tropical stratosphere, where they experience greater photolytic destruction. Two decades ago this mechanism was proposed by Butchart and Scaife (2001) for the CFCs based on dynamical diagnostics of the BDC from a climate model. Now we have observed and quantified this effect for a major greenhouse gas. Using the simultaneous MLS vertical profiles of N2O, O3, and temperature, we calculate the total loss of N2O in the column, needing only the solar spectrum and absorption cross sections, as in Prather et al. (2015, hence P2015). We find that the stratospheric N2O loss rate is increasing more quickly than the observed trend in surface N2O, and hence the N2O lifetime is declining. For N2O, a major greenhouse gas, it means that the climate impact of its anthropogenic emissions will be reduced over this century, and for CFCs, where we expect parallel results, it means that these now-banned ozone-depleting gases will be cleaned out of the atmosphere more quickly, as shown by Butchart and Scaife (2001).
The Aura MLS observations of N2O, O3, and T are taken from the Goddard Earth Sciences Data and Information Services Center in the form of V5 Level-3 monthly binned profiles from August 2004 through December 2021 (Lambert et al., 2021; Schwartz et al., 2021a, b). All data are averaged over the 72 longitude bins. There are 43 latitude profiles every 4∘ (84∘ S to 84∘ N). Pressure levels range from 100 to 0.001 hPa with logarithmic spacing, and the resolution depends on the MLS quantity. The very few negative O3 values (0.04 % of data at 0.01 hPa) occur at the minimum in the O3 profile and are replaced with the mean value of 0.2 ppm, with negligible impact on photolysis rates. The negative N2O values are slightly more frequent (about 0.1 % of data at 32 and 22 hPa but 1.6 % at 0.5 hPa, where the mean value is 2.3 ppb). We do not wish to inflate the N2O loss by replacing negative values with large positive ones, so we opt for the safest choice and just replace negative N2O values with 1 ppb, again with negligible impact on N2O loss. The N2O vertical grid between 146 and 1 hPa (six evenly spaced log(pressure) levels per decade) is coarser than that of O3 and T (both use 12 intervals per decade). The missing N2O levels in the O3–T grid are calculated as the square root of the product of the values on the adjacent levels. For pressures <0.4 hPa, where MLS V5 N2O data are not reported, we set the abundance to 0 ppb. Our consolidated MLS dataset then covers 43 latitudes (84∘ S to 84∘ N), 37 pressure levels (100–0.001 hPa), and 209 months (August 2004 to December 2021).
The observational data consist of 8987 independent column atmospheres. The top level (0.001 hPa) is high enough that only a single layer of thickness 0.001 hPa with the same properties as the top layer is added to complete the atmosphere for the radiative calculation. Below 100 hPa, we add six layers with typical tropospheric values (320 ppt); however, these layers have a negligible impact on N2O loss because very little of the critical ultraviolet radiation reaches below 100 hPa. Each latitude profile is weighted by the area of the Earth ±2∘ latitude on either side except for latitudes 1 (90–82∘ S) and 43 (82–90∘ N). For each column we calculate the profile of N2O loss from photolysis (J-N2O) and reaction with the electronically excited atomic oxygen O(1D) from the three reactions.
The O(1D) is calculated from the O3–T profiles assuming production equals loss.
The radiative transfer calculation is the same as in Prather et al. (2015) and includes the solar declination for the middle of each month, the Sun–Earth distance, but not the solar cycle (a mean solar flux is used).
Vertically, losses are weighted linearly in pressure (mass), and across latitude, they are weighted by the area of each latitude belt. Annually integrated budgets include the number of days in each month, but leap years are treated as 365 d years, and thus our annual losses are biased low by 0.07 %. Lifetimes are budgetary timescales and calculated as a 12-month burden (TgN) divided by the 12-month loss (TgN yr−1). The burden is calculated from monthly-mean, globally-averaged NOAA marine surface measurements (Dlugokencky, 2022) and uses the conversion factor of 4.78 TgN ppb−1 (Prather et al., 2012). Given that the gridding and source files have changed since P2015 (which used the 5∘ latitude GOZCARDS data), we compared the global monthly loss rates for the overlap period with P2015 (August 2004–December 2011): the mean difference of 0.2 % and root mean square (rms) difference of 0.6 % show that both calculations are essentially identical. Uncertainty in the absolute N2O lifetime is estimated at ±8 % (1-sigma), based primarily on the absolute calibration of MLS N2O and the chemical kinetics uncertainty; see Sect. 4 of P2015.
Uncertainties in trends here are calculated from a linear regression of the 12-month running averages of the monthly means as reported or calculated here. We select the 68 % (1-sigma) range, because we are looking for “likely” connections (68 % confidence) rather than “extremely likely” ones (95 %). For example, the linear regression trend in N2O loss uses the running averages and has 198 monthly points. The uncertainty is scaled up assuming there are only 17 yearly data points. As a check we recalculate the regression fit with the unsmoothed monthly data and get the same uncertainty.
The primary calculation here is the annual N2O loss (TgN yr−1) shown in Fig. 1a. It was surprising in that such a clear 17-year increase is apparent. Most of the interannual variability in this 12-month running mean time series is associated with the quasi-biennial oscillation (see Ruiz et al., 2021). The linear regression gives a trend of +5.0 ± 0.7 %/decade. This is larger than the +2.9 ± 0.02 %/decade trend in the burden (Fig. 1b) and results in an N2O budgetary lifetime trend of −2.1 ± 0.7 %/decade (Fig. 1c). Our best estimate for the N2O lifetime over the past decade (117 years) is still close to that in P2015, which included other model calculations. Most important for the N2O budget is the average loss itself, namely, 13.43 TgN yr−1 with an interannual standard deviation of 3 % and a min-to-max range of 7 %. The primary source of stratospheric odd-nitrogen species (e.g., NO, NO2, HNO3) is production of NO in Reaction (R3), and we calculate the production of NO (Figure 1d), which (like the N2O loss) also shows a positive trend of +3.9 ± 0.6 %/decade.
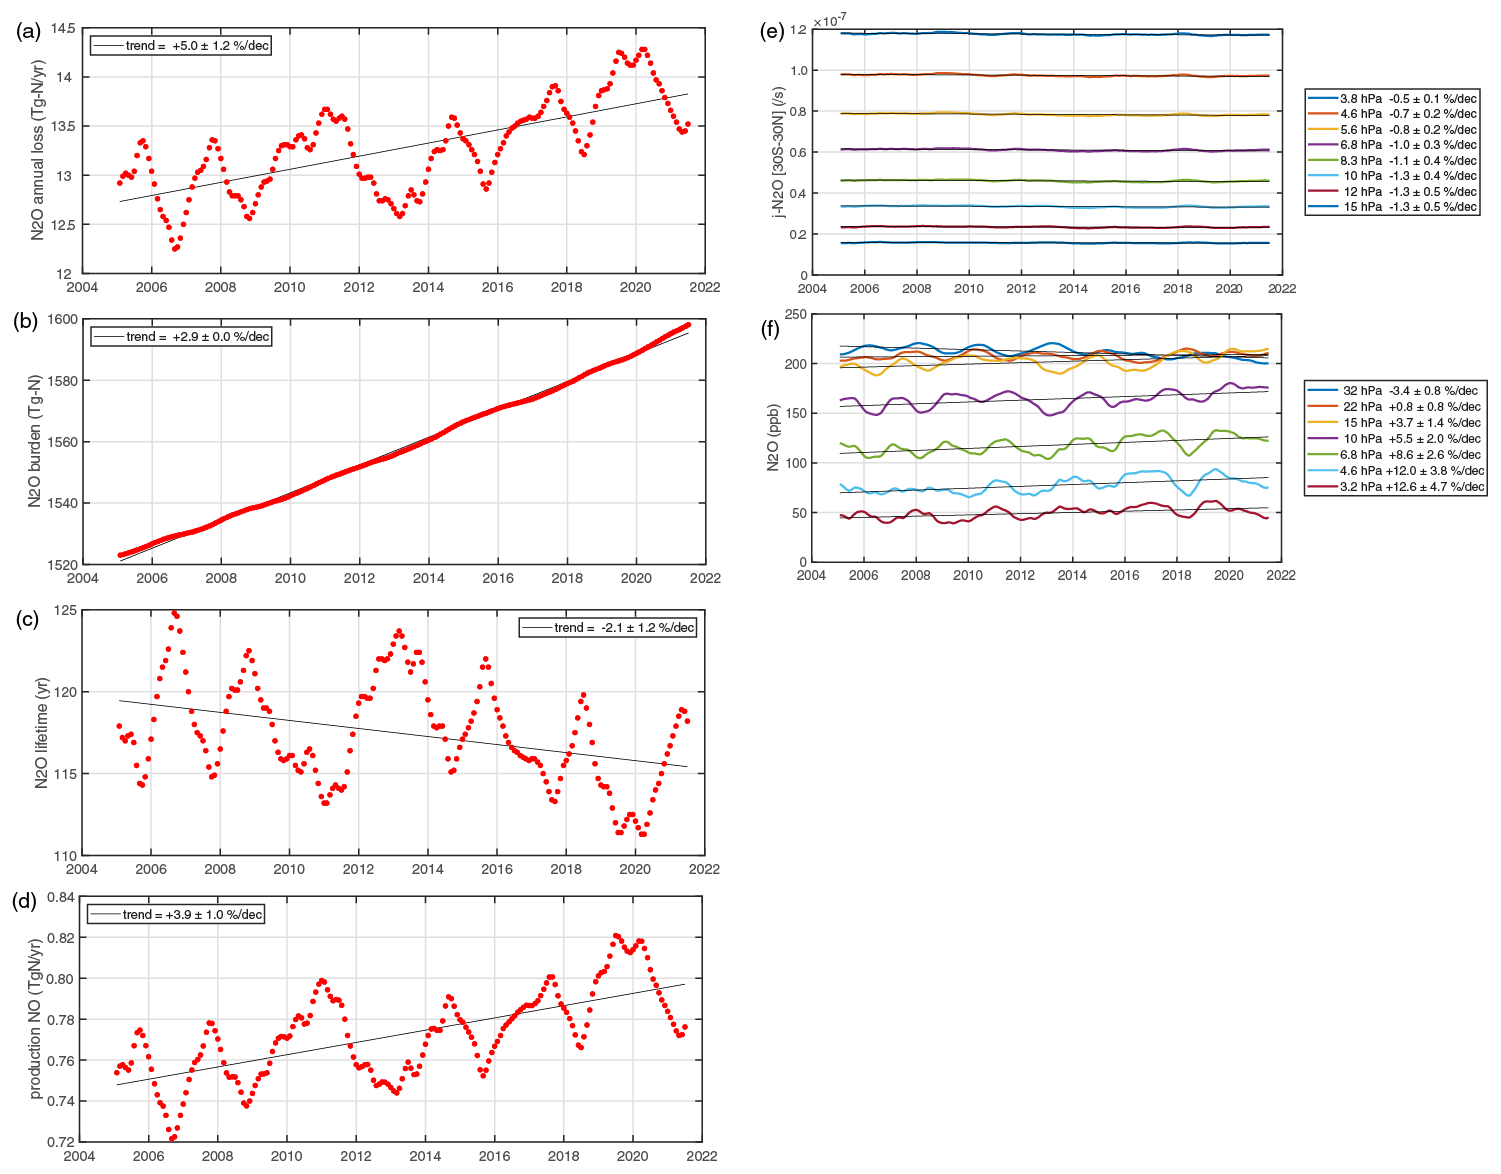
Figure 1(a) N2O loss rate (TgN yr−1) as monthly values of a 12-month running mean. The 198 red points begin with the 12-month average of August 2004 through July 2005 plotted as 1 February 2005 with the final point being 1 July 2021 (all of 2021). The thin black trend line shows the slope and uncertainty in the legend; see the text. (b) N2O global burden (TgN) based on marine surface observations. (c) N2O lifetime derived from the burden divided by loss rate. Production of NO (TgN yr−1) from N2O loss. (e) Stratospheric photolysis rates, J-N2O (/s), at the standard MLS V5 T pressure levels (see legend) and averaged over 30∘ S–30∘ N. (f) N2O abundance (ppb) at the standard V5 N2O pressure levels (see legend) and averaged over 30∘ S–30∘ N.
The immediate cause of the lifetime trends (i.e., enhanced N2O loss) can be an increase in the photochemical loss frequency or in the abundance of N2O, or both. The critical zone for loss in the vertical is 3 to 30 hPa (80 % of total loss), and in latitude it is 30∘ S to 30∘ N (75 %); see P2015. Thus we focus on the tropical middle stratosphere. Photolysis (Reaction R1) dominates loss here (by more than 90 %), and the monthly mean J-N2O at the Equator (Fig. 1e) shows only a consistent decline across the critical region from −0.5 ± 0.1 %/decade at the top of the region (3 hPa) to −1.3 ± 0.3 %/decade at altitudes below 10 hPa. This change by itself would reduce the loss.
The declining J-N2O is primarily due to the recovery of overhead ozone during this period from reduced chlorine-catalyzed depletion as the CFCs and other chlorinated gases have declined following the Montreal Protocol agreement that regulated these source gases (Bernath et al., 2020; Froidevaux et al., 2022, and references therein). Observations show continued increases in upper tropical stratospheric ozone for 2000–2020 (Godin-Beekmann et al., 2022) from a range of satellite measurements, including the MLS O3 used here that is driving the change in J-N2O. For the upper stratospheric tropics (1–10 hPa), the generally observed O3 trend of order +1.0 %/decade to +1.6 %/decade is consistent with the vertical pattern and magnitude of the J-N2O trend. Another source of declining J-N2O is the reduction in photolysis cross sections from lower temperatures. We calculate that the relative change in J in this altitude region is +0.4 % K−1, and combined with the observed temperature trend of about −0.5 K/decade (Maycock et al., 2018), we estimate that the trend in J from temperature-dependent cross sections is −0.2 %/decade and thus a small contribution to the total. The overall trend in J of about −1 %/decade reduces the N2O loss and makes the disagreement between the burden and loss trends even greater.
Given that N2O loss is increasing faster than the global burden by +2.1 %/decade, we expect that the N2O abundances in the critical zone are likewise increasing more quickly. Because of the reduction in photolysis rates, we expect the abundance to be increasing at about +6 %/decade. Can we see this in the MLS N2O data? The monthly mean 30∘ S–30∘ N N2O abundances are shown in Fig. 1f. The trends are clear but vary over altitude. At the bottom of the critical zone (32 hPa) the trend is negative, −3.4 ± 0.5 %/decade, and is probably due to a residual negative drift of the V5 MLS data in the lower stratosphere after 2010 as shown in Fig. 16 of Livesey et al. (2021). It is unlikely to be real because suppression of vertical transport of N2O below 30 hPa can hardly lead to increases in N2O above and, moreover, the ACE-FTS data show positive trends at these pressures following the analysis of Froidevaux et al. (2022). The trend increases rapidly, reaching +5.5 ± 1.2 %/decade in the central zone (10 hPa) and +12.0 ± 2.3 %/decade near the top (4.6 hPa). These increases are used directly in our calculation and average to the +6 %/decade needed to explain the trend in total N2O loss.
Are these increases in N2O real or an artifact of a known calibration drift in the MLS 190 GHz observations, affecting mainly water vapor and N2O? The MLS V5 dataset benefits from an extensive effort to remove/reduce drifts and verify the MLS H2O and N2O against the overlapping ACE-FTS satellite measurements, which are not believed to be drifting (Livesey et al., 2021; Froidevaux et al., 2022). The key comparison is Fig. 16 of Livesey et al. (2021). In the tropics (20∘ S–20∘ N) there could be a small positive drift in MLS V5 N2O versus ACE-FTS N2O for the period 2005–2010 in the range 3–30 hPa, but for the later period 2010–2019, there is no drift, or even a negative drift at 30 hPa and below. This change with altitude may explain the small or negative trend in N2O below 15 hPa. It is possible that N2O is increasing throughout the tropical stratosphere if the negative trend at 32 hPa is due to instrumental drift. Parallel analysis of the MLS V4 N2O (not shown) shows a similar increase in the trend from small negative trends at 32 hPa to large positive ones at 3 hPa (not shown). At the upper end of our range (2.2–6.8 hPa), Froidevaux et al. (2022, their Fig. 12) find similar trends in N2O to ours (∼ 13 %/decade) from MLS, ACE-FTS, and a model. Their analysis included a much wider latitude range (50∘ S–50∘ N), but because N2O abundances fall off rapidly outside of the tropical ascent region (see Fig. 3 of Prather et al., 2015), the tropics should dominate the mean value and its trend. Thus, any calibration drift that impacts the lifetime (i.e., occurring in the critical region 3 to 30 hPa and 30∘ S to 30∘ N) is negligible compared to the increasing trend in N2O loss (+5.0 %/decade). If the drift were slightly negative, correction would further increase this trend.
We believe that the solar cycle has had little impact on N2O lifetime variability over the Aura MLS record here. The period 2005–2011 following Cycle 23 showed low activity (smoothed monthly sunspot number <50), the peak of Cycle 24 (2011–2015) was among the lowest in the last 100 years, and Cycle 25 began in 2020 but activity remained low through 2021. We conclude that the impact of the solar cycle on these observations was much less than the min-to-max decrease in N2O lifetime of 4 %–7 % (see P2015) and probably less than 2 %–3 %. Moreover, the symmetry of this low solar activity over 2005–2021 is unlikely to affect trends.
The recent WMO Ozone Assessments (Karpechko et al., 2018; WMO, 2022) concluded that disagreement remains regarding the direction of the BDC trend between the chemistry–climate model simulations (increasing rates) and the satellite observations of AoA tracers (decreasing or uncertain). We present clear observational evidence supporting the models of what is likely a climate-change-driven increase in the net BDC using a major trace gas. N2O abundances in the tropical upper stratosphere are increasing at rates much faster than tropospheric abundances, but this pattern cannot distinguish between more rapid ascent or reduced mixing with extra-tropical latitudes. The latter would imply a slower growth rate for extra-tropical N2O, but this is not seen. If we perform a similar trend analysis to that shown in Fig. 1f for the extra-tropics (i.e., 30–58∘ N and 30–58∘ S), then we find an almost identical pattern to that in the tropics: increasing at 7 %/decade–8 %/decade versus 6 at 10 hPa and at 14 %/decade–18 %/decade versus 13 at 3.2 hPa; see Supplement Fig. S1 and Table S6. The obvious explanation is an increase in the meridional mean ascent rate in the tropics with little or no change in mixing across the barrier between the tropics and extra-tropics. The use of an integrated quantity like the N2O lifetime provides robust averaging over the large seasonal and interannual variability of this gas in the middle and upper stratosphere. We expect these results to hold for other gases with mid-stratosphere photolytic sinks, such as CFC-12.
Viewing the changing BDC in terms of lifetimes gives a different perspective of the potential consequences of climate change. If this rate of change continues over the 21st century, then the lifetimes of N2O and CFC-12 might drop by 20 %. Thus CFCs will be cleared out of the atmosphere earlier than currently projected (e.g., Butchart and Scaife, 2001). The climate impact of N2O emissions will drop because their decay time will fall from 110 to 90 years. Note that the decay time of a pulse based on a lifetime of 117 years is reduced by a factor of 0.94 due to chemical feedbacks (Prather, 1998; Prather et al., 2015). For example, if we extrapolate the observed growth in N2O burden over the last 2 decades (+2.9 %/decade), we reach 419 ppb by 2100, a value between RCP6.0 and RCP8.5. If we use a constant lifetime of 120 years to derive annual emissions and then re-project future N2O using a declining lifetime (−2.1 %/decade), this value drops to 391 ppb (see Fig. S2). Over the 21st century, the N2O increase drops by 27 % from 103 to 75 ppb, corresponding to a drop in effective radiative forcing of 0.09 W m−2, equivalent to about 6.6 ppm CO2 (Forster et al., 2021). Such differences are substantial when trying to tune our mitigation strategies to achieve climate change goals.
Overall, we will see an accelerated removal of the long-lived trace gases. Chipperfield et al. (2014) analyzed the change in CFC and N2O atmospheric lifetimes with climate change (year 2100 versus 2000). For the five chemistry–climate models that calculated the N2O lifetime, results were ambiguous: two increased, one decreased, and two were unchanged, all with absolute changes of less than 0.5 %/decade. These results are not necessarily inconsistent with the projections here because the modeled scenarios included other chemical changes in the stratosphere and adopted a middling climate scenario (RCP 4.5). Chipperfield et al. (2014) also found that AoA metrics were a poor predictor of N2O lifetime (see their Figs. 8–9). Thus, chemistry–climate model intercomparison projects should encourage the calculation of N2O and CFC lifetimes over the 21st century as a major diagnostic of changing BDC, although accompanying changes in O3 and T must also be diagnosed to evaluate the photochemically driven changes in lifetime.
There is an additional oddity in this analysis. We find that the production of NO (+3.9 %/decade) is increasing more quickly than the burden (+2.9 %/decade) but not as quickly as N2O loss (+5.0 %/decade), although the uncertainties overlap. This is expected because NO production peaks lower in the stratosphere and the rapid increase in loss above 10 hPa (∼ 32 km) produces proportionally much less NO (see P2015, Fig. 1). Reduced NO production relative to N2O loss was also a theme in Nevison et al. (1999), who suggested that such changes might occur and be detectable in the observed ratio of NOy (NO and its products) to N2O in the lowermost stratosphere. Our results are consistent with the analysis of Froidevaux et al. (2022), where the abundance of NO and NO2 in the upper stratosphere is increasing at a rate much lower than that of N2O (approximately 2 versus 12 %/decade). The abundance of NO in the tropical upper stratosphere, however, is a balance between production, vertical transport, and photochemical loss above 40 km, and we cannot estimate it from the production alone.
In parallel with our MLS N2O data analysis, S. E. Strahan led a full chemistry-transport modeling study of the MLS period using the MERRA-2 wind fields and focusing on the chemistry of N2O, NOy, and O3. Their results support our analysis and show that more rapid vertical ascent in the tropical upper stratosphere is the cause of enhanced N2O and N2O loss. This enhanced transport of NO led to its accumulation in the Arctic upper stratosphere, with enhanced O3 loss there. The modeled changes were shown to be driven by circulation changes, and they were matched by available satellite observations. That paper has now appeared (Strahan et al., 2022).
From the results here and in P2015, we assemble a budget for N2O from pre-industrial to the last 2 decades (Table S7). Assuming that the pre-industrial stratospheric loss (10.5 TgN yr−1) is natural and has remained constant, then the anthropogenic emission for the 2000s decade is 6.0 TgN yr−1 and that for the 2010s decade is 7.6 TgN yr−1. This 27 %/decade increase in anthropogenic emissions comes primarily from the increasing N2O atmospheric burden, with 4 %/decade of the total coming from the decrease in N2O lifetime derived here. Such growth in emissions shows how hard it will be to control them (Davidson, 2012) and identifies N2O as a looming threat to climate stabilization.
The raw data used here were downloaded from the sites and at the dates specified (https://gml.noaa.gov/webdata/ccgg/trends/n2o/n2o_mm_gl.txt, Dlugokencky, 2022; https://disc.gsfc.nasa.gov/datasets/ML3MBN2O_005/summary, Lambert et al., 2021; https://disc.gsfc.nasa.gov/datasets/ML3MBT_005/summary, Schwartz et al., 2021a; https://disc.gsfc.nasa.gov/datasets/ML3MBO3_005/summary, Schwartz et al., 2021b). The time series calculated here and shown in the figures are included in Tables S1–S5 and S8 in the Supplement.
The supplement related to this article is available online at: https://doi.org/10.5194/acp-23-843-2023-supplement.
MJP designed the research and performed the data analysis. LF and NJL analyzed the accuracy of the datasets. MJP wrote the paper. LF and NJL reviewed and edited the paper.
The contact author has declared that none of the authors has any competing interests.
We thank Jessica Neu for helpful framing discussions and other MLS team members (Alyn Lambert, William Read, and Ryan Fuller) who contributed to the MLS V4 and V5 datasets used here (O3, T, and especially N2O). We also thank the two anonymous ACP reviewers whose constructive reviews improved the manuscript.
Publisher’s note: Copernicus Publications remains neutral with regard to jurisdictional claims in published maps and institutional affiliations.
Research at the University of California Irvine was supported by grants from the National Aeronautics and Space Administration's Atmospheric Chemistry Modeling and Analysis Program (ACMAP; grant no. 80NSSC21K1454) and the National Science Foundation's Atmospheric Chemistry Program (grant no. AGS-2135749). Work at the Jet Propulsion Laboratory, California Institute of Technology, was performed under contract with NASA (80NM0018D0004).
This paper was edited by Susannah Burrows and reviewed by two anonymous referees.
Abalos, M., Calvo, N., Benito-Barca, S., Garny, H., Hardiman, S. C., Lin, P., Andrews, M. B., Butchart, N., Garcia, R., Orbe, C., Saint-Martin, D., Watanabe, S., and Yoshida, K.: The Brewer–Dobson circulation in CMIP6, Atmos. Chem. Phys., 21, 13571–13591, https://doi.org/10.5194/acp-21-13571-2021, 2021.
Bernath P. F., Steffen J., Crouse J., and Boone C. D.: Sixteen-year trends in atmospheric trace gases from orbit, J. Quant. Spectrosc. Ra., 253, 107178, https://doi.org/10.1016/j.jqsrt.2020.107178, 2020.
Butchart, N.: The Brewer-Dobson circulation, Rev. Geophys., 52, 157–184, https://doi.org/10.1002/2013RG000448, 2014.
Butchart, N. and Scaife, A.: Removal of chlorofluorocarbons by increased mass exchange between the stratosphere and troposphere in a changing climate, Nature, 410, 799–802, https://doi.org/10.1038/35071047, 2001.
Chipperfield, M. P., Liang, Q., Strahan, S. E., Morgenstern, O., Dhomse, S. S., Abraham, N. L., Archibald, A. T., Bekki, S., Braesicke, P., Di Genova, G., Fleming, E. L., Hardiman, S. C., Iachetti, D., Jackman, C. H., Kinnison, D. E., Marchand, M., Pitari, G., Pyle, J. A., Rozanov, E., Stenke, A., and Tummon, F.: Multi-model estimates of atmospheric lifetimes of long-lived Ozone-Depleting Substances: Present and future, J. Geophys. Res., 119, 2555–2573, https://doi.org/10.1002/2013JD021097, 2014.
Davidson, E. A.: Representative concentration pathways and mitigation scenarios for nitrous oxide, Environ. Res. Lett., 7, 024005, https://doi.org/10.1088/1748-9326/7/2/024005, 2012.
Dlugokencky, E.: Data from the NOAA web site, NOAA [data set], https://gml.noaa.gov/webdata/ccgg/trends/n2o/n2o_mm_gl.txt (last access: 26 July 2023), 2022.
Forster, P., Storelvmo, T., Armour, K., Collins, W., Dufresne, J.-L., Frame, D., Lunt, D. J., Mauritsen, T., Palmer, M. D., Watanabe, M., Wild, M., and Zhang, H.: The Earth's Energy Budget, Climate Feedbacks, and Climate Sensitivity, in: Climate Change 2021: The Physical Science Basis, Contribution of Working Group I to the Sixth Assessment Report of the Intergovernmental Panel on Climate Change, edited by: Masson-Delmotte, V., Zhai, P., Pirani, A., Connors, S. L., Péan, C., Berger, S., Caud, N., Chen, Y., Goldfarb, L., Gomis, M. I., Huang, M., Leitzell, K., Lonnoy, E., Matthews, J. B. R., Maycock, T. K., Waterfield, T., Yelekçi, O., Yu, R., and Zhou, B., Cambridge University Press, Cambridge, United Kingdom and New York, NY, USA, pp. 923–1054, https://www.ipcc.ch/report/ar6/wg1/ (last access: 13 January 2023), 2021.
Fritsch, F., Garny, H., Engel, A., Bönisch, H., and Eichinger, R.: Sensitivity of age of air trends to the derivation method for non-linear increasing inert SF6, Atmos. Chem. Phys., 20, 8709–8725, https://doi.org/10.5194/acp-20-8709-2020, 2020.
Froidevaux, L., Kinnison, D. E., Santee, M. L., Millán, L. F., Livesey, N. J., Read, W. G., Bardeen, C. G., Orlando, J. J., and Fuller, R. A.: Upper stratospheric ClO and HOCl trends (2005–2020): Aura Microwave Limb Sounder and model results, Atmos. Chem. Phys., 22, 4779–4799, https://doi.org/10.5194/acp-22-4779-2022, 2022.
Karpechko, A., Maycock, A., Abalos, M., Arblaster, J., Akiyoshi, H., Garfinkel, C., Rosenlof, K., and Sigmond, M.: Scientific Assessment of Ozone Depletion: 2018, World Meteorological Organisation Global Ozone Research and Monitoring Project-Report No. 58, WMO/UNEP Scientific Assessment of Ozone Depletion: 2018. Chapter 5: Stratospheric Ozone Changes and Climate, World Meteorological Organization, Geneva, Switzerland, 2018.
Lambert, A., Livesey, N., Read, W., and Fuller, R.: MLS/Aura Level 3 Monthly Binned Nitrous Oxide (N2O) Mixing Ratio on Assorted Grids V005, Greenbelt, MD, USA, Goddard Earth Sciences Data and Information Services Center (GES DISC) [data set], https://disc.gsfc.nasa.gov/datasets/ML3MBN2O_005/summary (last access: 13 January 2023), 2021.
Livesey, N. J., Read, W. G., Froidevaux, L., Lambert, A., Santee, M. L., Schwartz, M. J., Millán, L. F., Jarnot, R. F., Wagner, P. A., Hurst, D. F., Walker, K. A., Sheese, P. E., and Nedoluha, G. E.: Investigation and amelioration of long-term instrumental drifts in water vapor and nitrous oxide measurements from the Aura Microwave Limb Sounder (MLS) and their implications for studies of variability and trends, Atmos. Chem. Phys., 21, 15409–15430, https://doi.org/10.5194/acp-21-15409-2021, 2021.
Maycock, A. C., Randel, W. J., Steiner, A. K., Karpechko, A. Y., Christy, J., Saunders, R., Thompson, D. W. J., Zou, C.-Z., Chrysanthou, A., Abraham, N. L., Akiyoshi, H., Archibald, A. T., Butchart, N., Chipperfield, M., Dameris, M., Deushi, M., Dhomse, S., Di Genova, G., Jöckel, P., Kinnison, D. E., Kirner, O., Ladstaedter, F., Michou, M., Morgenstern, O., O'Connor, F., Oman, L., Pitari, G., Plummer, D. A., Revell, L. E., Rozanov, E., Stenke, A., Visioni, D., Yamashita, Y., and Zeng, G.: Revisiting the mystery of recent stratospheric temperature trends, Geophys. Res. Lett., 45, 9919–9933, https://doi.org/10.1029/2018GL078035, 2018.
Neu, J. L. and Plumb, R. A.: Age of air in a “leaky pipe” model of stratospheric transport, J. Geophys. Res., 104, 19243–19255, https://doi.org/10.1029/1999JD900251, 1999.
Nevison, C. D., Keim, E. R., Solomon, S., Fahey, D. W., Elkins, J. W., Lowenstein, M., and Podolske, J. R.: Constraints on N2O sinks inferred from observed tracer correlations in the lower stratosphere, Global Biogeochem. Cy., 13, 737–742, 1999.
Plumb, R. A. and Mahlman, J. D.: The zonally-averaged transport characteristics of the GFDL general circulation/tracer model, J. Atmos. Sci., 44, 298–327, https://doi.org/10.1175/1520-0469(1987)044<0298:TZATCO>2.0.CO;2, 1987.
Prather, M. J.: Time scales in atmospheric chemistry: coupled perturbations to N2O, NOy, and O3, Science, 279, 1339–1341, 1998.
Prather, M. J., Holmes, C. D., and Hsu, J.: Reactive greenhouse gas scenarios: Systematic exploration of uncertainties and the role of atmospheric chemistry, Geophys. Res. Lett., 39, L09803, https://doi.org/10.1029/2012GL051440, 2012.
Prather, M. J., Hsu, J., DeLuca, N. M., Jackman, C. H., Oman, L. D., Douglass, A. R., Fleming, E. L., Strahan, S. E., Steenrod, S. D., Søvde, O. A., Isaksen, I. S. A., Froidevaux, L., and Funke, B.: Measuring and modeling the lifetime of nitrous oxide including its variability, J. Geophys. Res.-Atmos., 120, 5693–5705, https://doi.org/10.1002/2015JD023267, 2015.
Ruiz, D. J., Prather, M. J., Strahan, S. E., Thompson, R. L., Froidevaux, L., and Steenrod, S. D.: How atmospheric chemistry and transport drive surface variability of N2O and CFC-11, J. Geophys. Res.-Atmos., 126, e2020JD033979, https://doi.org/10.1029/2020JD033979, 2021.
Schwartz, M., Livesey, N., Read, W., and Fuller, R.: MLS/Aura Level 3 Monthly Binned Temperature on Assorted Grids V005, Greenbelt, MD, USA, Goddard Earth Sciences Data and Information Services Center (GES DISC) [data set], https://disc.gsfc.nasa.gov/datasets/ML3MBT_005/summary (last access: 13 January 2023), 2021a.
Schwartz, M., Froidevaux, L., Livesey, N., Read, W., and Fuller, R.: MLS/Aura Level 3 Monthly Binned Ozone (O3) Mixing Ratio on Assorted Grids V005, Greenbelt, MD, USA, Goddard Earth Sciences Data and Information Services Center (GES DISC) [data set], https://disc.gsfc.nasa.gov/datasets/ML3MBO3_005/summary (last access: 13 January 2023), 2021b.
Strahan, S. E., Coy, L., Douglass, A. R., and Damon, M. R.: Faster tropical upper stratospheric upwelling drives changes in ozone chemistry, Geophys. Res. Lett., 49, e2022GL101075, https://doi.org/10.1029/2022GL101075, 2022.
World Meteorological Organization (WMO): Executive Summary, Scientific Assessment of Ozone Depletion: 2022, GAW Report No. 278, 56 pp., WMO: Geneva, ISBN 978-9914-733-99-0, 2022.