the Creative Commons Attribution 4.0 License.
the Creative Commons Attribution 4.0 License.
 | 27 Jul 2023
Zugspitze ozone 1970–2020: the role of stratosphere–troposphere transport
Thomas Trickl
Cédric Couret
Ludwig Ries
Hannes Vogelmann
The pronounced increase in ozone observed at the Alpine station Zugspitze (2962 ) since the 1970s has been ascribed to an increase in stratospheric air descending to the Alps. In this paper, we present a reanalysis of the data from for both ozone (1978 to 2011) and carbon monoxide (1990–2011), which has been extended until 2020 by the data from the Global Atmosphere Watch site at the Umweltforschungsstation Schneefernerhaus (UFS; 2671 – above sea level), which is located just below the Zugspitze summit. For ozone between 1970 and 1977, a constant annual average of 36.25 ppb (parts per billion) was assumed to have been obtained by extrapolation. The analysis is based on data filtering, utilizing the isotope 7Be (measured between 1970 and 2006) and relative humidity (1970 to 2011; UFS from 2002 to 2020). We estimate both the influence of stratospheric intrusions directly descending to the northern rim of the Alps from the full data filtering and the aged (“indirect”) intrusions from applying a relationship between ozone and the 7Be data. The evaluated total stratospheric contribution to the annual average ozone rises roughly from 12 ppb in 1970 to 24 ppb in 2003. It turns out that the increase in the stratospheric influence is particularly strong in winter. A lowering in positive trend is seen afterwards, with a delay of roughly 1 decade after the beginning of the decrease in the solar irradiation. The air masses hitting the Zugspitze summit became drier until 2003, and we see the growing stratospheric contribution as being an important factor for this drying. Both an increase in the lower-stratospheric ozone and the growing thickness of the intruding layers departing downward from just above the tropopause must be taken into consideration. Carbon monoxide in the intrusions did not change much during the full measurement period from 1990 to 2020, with a slight increase until 2005. This is remarkable since, for air outside intrusions, a decrease by approximately 44 % was found, indicating a substantial improvement in the tropospheric air quality.
- Article
(6198 KB) - Full-text XML
- BibTeX
- EndNote


The rise in the ozone level at the summit station Zugspitze (German Alps; 2962 – above sea level) between 1978 and 2003 has been emphasized in a number of publications during the past 20 years (e.g. Oltmans et al., 2006, 2012; Logan et al., 2012; Parrish et al., 2012, 2020; Gaudel et al., 2018). Until the early 1980s, the rise was very strong and associated mostly with growing air pollution. However, during the period afterwards, the air pollution in Europe no longer increased – and even decreased in the 1990s (e.g. Jonson et al., 2006; Vautard et al., 2006) – presumably due to the new political situation that led to improved air quality in eastern Europe.
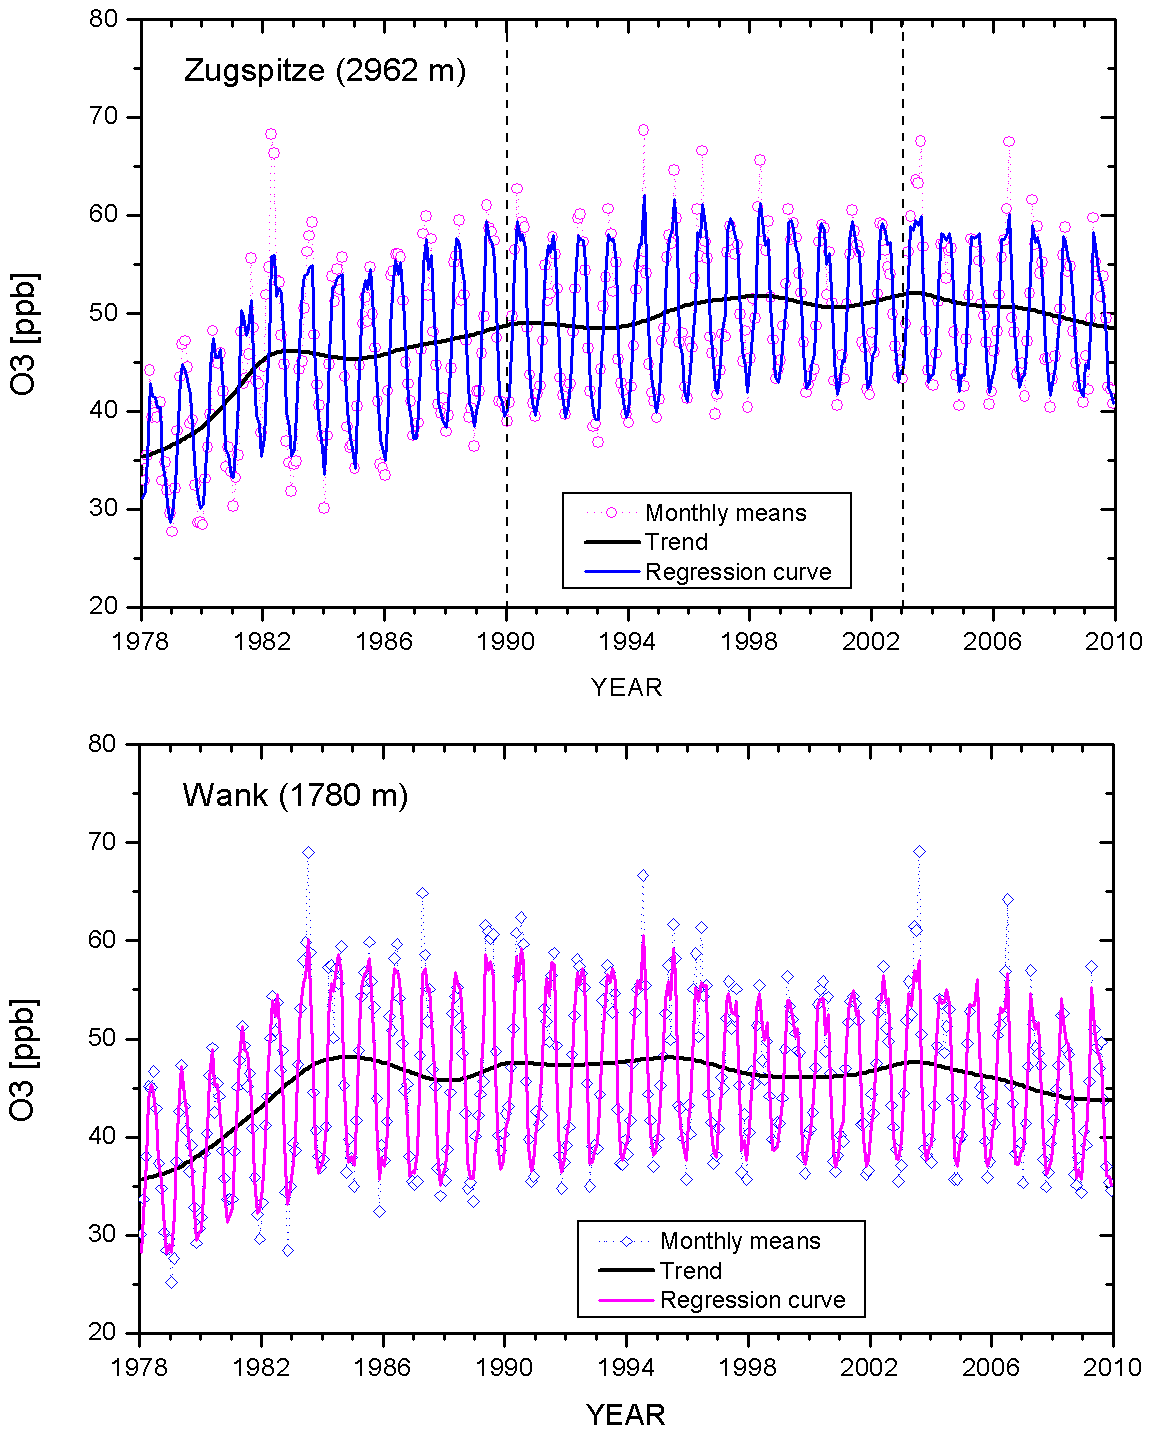
Figure 1Monthly mean ozone mixing ratios for the Zugspitze and Wank summits from 1978 to 2010. The black curves represent the deseasonalized values (adopted from Hans-Eckhart Scheel; presented at several conferences).
Scheel (2003) attributed the continual ozone rise at the Zugspitze summit to dry air descending from the tropopause region. Rising levels of 7Be supported the idea of an increasing fraction of stratospheric air reaching the high-lying station. Measurements of relative humidity (RH) and 7Be offer a unique chance to identify stratospheric air but are restricted to just a few elevated sites worldwide. Based on these measurements, Scheel analysed the stratospheric contribution from the beginning of the precision measurements in 1978 until 2004 (Hans-Eckhart Scheel, pp. 66–71 in ATMOFAST, 2005). This preliminary effort yielded a rather high stratospheric influence. The estimated total stratospheric contribution to the Zugspitze ozone more than doubled from 1978 to 2003 (Fig. 1 in Trickl et al., 2020a shows 11.3 to 23.5 ppb – parts per billion). Most importantly, the complementary tropospheric ozone contribution no longer exhibited a positive trend. However, the results have not revealed a decline in this contribution since 1990, as one would expect from that of the ozone precursor emissions, which could suggest that this estimate was rather conservative.
In Fig. 1, we show the development of the monthly mean values for the two summit stations around Garmisch-Partenkirchen (Germany), namely Zugspitze and Wank (1780 m), from 1978 to 2010, for which the data are evaluated for both stations (the operations at both stations were discontinued in or after 2012, following the retirement of Hans-Eckhart Scheel). The figure reveals several facts.
-
The Wank ozone trend ceases to be positive after 1981, whereas the Zugspitze ozone continues to increase. We ascribe this difference to the much less pronounced stratospheric impact at the lower-lying station. The number of stratospheric air intrusions reaching the Wank summit is less than 50 % of that reaching the Zugspitze summit (Elbern et al., 1997).
-
After 2003 there is an almost parallel, slight ozone decrease at both stations, which is similar to the findings of Cristofanelli et al. (2020) for the Italian mountain station of Monte Cimone (2165 ) that were displayed until 2017.
-
In the 1990s, the amplitude of the Wank seasonal cycle diminishes, which is in agreement with the decreased precursor emissions mentioned above. This decrease is less pronounced in the Zugspitze ozone, since the higher summit is less exposed to air from the boundary layer. The pronounced summer ozone maxima start to disappear.
There are several questions. Was the increase in Zugspitze ozone until 2003 caused by a change in atmospheric dynamics due to climate change? What is the reason for the trend reversal after 2003, and is it real? What happened after 2010?
The 1978 stratospheric contribution of 11.3 ppb almost matches the ozone value of just about 10 ppb that was estimated for the late 19th century (Volz and Kley, 1988; Marenco et al., 1994), which is in agreement with the idea that stratosphere-to-troposphere transport (STT) was the dominant source of ozone during that early period. However, this value may be too low, which indicates the presence of tropospheric influence. Tarasick et al. (2019), based on a large number of publications, suggested a higher background ozone of 20 to 25 ppb during the first half of the 20th century.
A comparable positive ozone trend is reported for the Swiss Jungfraujoch station (3580 ), where the ozone measurements started in 1992 (Ordoñez et al., 2007). Also, in other regions of the world, a positive trend of ozone from STT is seen. Clain et al. (2009) derived a positive ozone trend in the upper troposphere above Réunion island and concluded that there is a growing stratospheric influence, which is tentatively ascribed to climate change. Cooper et al. (2020) found positive trends for a number of elevated sites worldwide (1971 to 2018), in particular for Mauna Loa and for IAGOS (In-service Aircraft for a Global Observing System) in the Northern Hemisphere at a pressure level of 650 mbar. Butchart et al. (2006) and Butchart (2014) expect a growing exchange between the troposphere and the stratosphere with rising atmospheric temperatures because of an intensifying Brewer–Dobson circulation.
Deep stratospheric intrusions are characterized by very dry air with RH values in the lower free troposphere frequently far below 1 % (Trickl et al., 2014, 2015, 2016; see also Bithell et al., 2000; Pisso et al., 2009). Even for transport times of more than 10 d, sometimes very little evidence of the erosion of the layers in tropospheric air is found. This surprising observation contradicts traditional ideas (e.g. Shapiro, 1976, 1978, 1980). These results suggest that a determination of the stratospheric ozone fraction at the Zugspitze summit based on humidity data should be almost fully quantitative instead.
Another interesting finding was that intrusions originate just above the tropopause (Trickl et al., 2014, 2016). The Zugspitze CO values in these layers do not show a significant decrease in these layers in the lowermost stratosphere, confirming the idea of a mixing zone around the tropopause (Trickl et al., 2014). This zone seems to be a layer of near-horizontal convergence, collecting contributions from both below and above, with the latter also being concluded from our observations of stratospheric aerosol (Trickl et al., 2013). It is, therefore, difficult to quantify the true tropospheric ozone fraction in this layer.
The seasonal cycle of STT at Alpine summit stations is characterized by a winter maximum and a summer minimum (Stohl et al., 2000; Trickl et al., 2010). As a consequence, the well-known ozone spring maximum (Monks, 2000) cannot be explained by STT. The minimum is less pronounced at the highest, the Jungfraujoch station (3580 ), which indicates that more STT events reach higher altitudes during the warm season. In fact, a recent study shows that the STT summer minimum disappears if one looks at the free troposphere as a whole (Trickl et al., 2020a).
This fact and the differences between Wank and Zugspitze ozone mentioned above confirm that the penetration of stratospheric air into the troposphere decreases towards low altitudes. However, the descent of the dry-air tongues continues towards the Mediterranean basin, and thus, a significant stratospheric influence has been evaluated for Monte Cimone (Cristofanelli et al., 2006, 2015, 2020). Sprenger et al. (2003) and Škerlak et al. (2014) describe the behaviour of deep, medium, and shallow intrusions on a global scale and find clear differences. The occurrences of intrusions maximize along the jet streams, and deep intrusions are less frequent than medium or shallow ones. The latter is verified by many years of lidar measurements at Garmisch-Partenkirchen (Trickl et al., 2020a). There is little evidence of the penetration of stratospheric intrusions into the boundary layer. Reiter (1990) analysed a total of 1990 ozone, temperature, and wet-bulb temperature profiles on board the Eibsee Zugspitze cable car (1005 to 2955 ) between 1980 and 1982 and did not observe any case of subsidence of the stratospheric layers to below 1.4 However, the cable car is only operated during the daytime (i.e. in the presence of a boundary layer). In fact, Eisele et al. (1999) reported a case of a sufficiently deep early-morning descent of a STT layer that could be caught by the forming boundary layer (see also Davis and Schuepbach, 1994; Ott et al., 2016; Langford et al., 2021).
This paper resumes the Zugspitze ozone trend studies started by the late Hans-Eckhart Scheel, with emphasis on a more refined analysis of the STT. Parts of our paper are based on a preliminary document by Scheel, which is unfinished due to his unexpected death in 2013. In order to obtain some idea about the trend development beyond 2011, the study has been extended until 2020 with the data acquired at the Global Atmosphere Watch station at Umweltforschungsstation Schneefernerhaus (UFS), which is a research laboratory about 300 m below the Zugspitze summit.
We first describe and analyse the observational data used and their temporal development. In Sect. 3, we present the characteristics of the data and how they can be used for the data filtering. The filtering criteria eventually used are specified in Sect. 4. Finally, we present and discuss our results in Sects. 5 and 6.
2.1 Site description
The Zugspitze site of the former Fraunhofer Institute for Atmospheric Environmental Research (Fraunhofer-Institut für Atmosphärische Umweltforschung, IFU; now the Karlsruher Institut für Technologie, Institut für Meteorologie und Klimaforschung, IMK-IFU) is located at the northern rim of the Alps (47.421∘ N, 10.986∘ E). A detailed description of the topography was given by Reiter et al. (1986). The observations of trace gases, meteorological parameters, and 7Be were made at the summit of Zugspitze (2962 ) or temporarily close to the summit at 2932 m (1989–1994 or during a shorter period, depending on the parameter of the measurement programme). Not all the quantities have been measured over the entire period since 1970; some measurements were abandoned earlier, such as SO2 or CO2. The data are available in the data archive of the IMK-IFU as half-hour averages and supplemented by statistical products such as daily, monthly, and annual means. For the work presented here, we use ozone, 7Be, RH, and carbon monoxide. We completed the data archive for the Zugspitze summit until the end of 2011, based on files with evaluated data found on Hans-Eckhart Scheel's computer. No evaluated version of the data for the final year, 2012, was found. The revised scientific analysis is based on the methods for identifying stratospheric intrusions described by Trickl et al. (2010).
Since 2001, atmospheric in situ measurements have taken place at the Global Atmosphere Watch (GAW) observatory at the UFS research station on the southern face of Zugspitze, which is operated by the German Umweltbundesamt (UBA, i.e. Federal Environment Agency; 47.417∘ N, 10.979∘ E; air inlet at 2671 ). The calibration of the UBA instrumentation is routinely performed and verified as part of the GAW quality assurance standards. The instruments are controlled daily and serviced on all regular workdays.
Due to the small altitude difference, in principle, the stratospheric influence at UFS should not differ much from that at the summit. However, one should consider that, during the warm season, the boundary layer formation may prevent intrusions from descending by much below 3000 m. Thus, even a local orographic influence can be significant and lead to differences due to different upslope winds advecting the air from lower altitudes (Sect. 3.4). However, the trends should behave similarly, and the results for UFS can serve as a tool to extrapolate the results for the summit.
2.2 Techniques
2.2.1 Ozone
After the inception of non-wet chemical, continuous O3 monitoring in 1978, this species was measured using a Bendix 8002 chemiluminescence instrument and compared with a portable Dasibi system until 1999 (Reiter et al., 1987). After parallel operation with UV absorption instruments, the O3 measurements were based on two or three TE 49 analysers (Thermo Environmental Instruments, USA) operated simultaneously at the Zugspitze summit. Several comparisons by means of transfer standards (O3 calibrators; TE 49-PS) were made with the World Meteorological Organization (WMO) GAW reference instrument kept at the WMO–GAW calibration centre operated by Empa, Switzerland (Klausen et al., 2003). The most recent comparison was conducted in June 2006 and confirmed that the Zugspitze O3 data are on the GAW scale.
At UFS, ozone has been continuously measured by ultraviolet (UV) absorption at 253.65 nm (Thermo Electron Corporation; model TEI 49i) since 2002. For the ozone standard, a TEI 49C-PS instrument was used, which was calibrated against the ozone standard of UBA (UBA SRP no. 29) on an annual basis. UBA keeps the German reference normal with this standard, and it was adjusted, via the BIPM (Bureau International des Poids et Mesures or International Bureau of Weights and Measures) in Paris, to the valid NIST (National Institute of Standards and Technology) ozone reference standard, which is relevant for the WMO–GAW measurement programme. The measurements were supported by a second instrument (Horiba APOA-370), which also fully complied with the GAW quality requirements. For weekly and monthly calibration, a TE 49-PS instrument has been used at UFS. The GAW system and performance audits at the station for surface ozone took place in 2001, 2006, 2011, and 2020 (Zellweger et al., 2001, 2006, 2011, 2021).
The ozone data for both sites are stored at 0.5 h intervals, with an uncertainty of less than ± 0.5 ppb compared to the WMO standard (Hearn, 1961; see also Viallon et al., 2015). In total, 1 h averages were made available to the World Data Centre for Reactive Gases (WDCRG; https://ebas.nilu.no/, last access: 23 July 2023) and the Tropospheric Ozone Assessment Report (TOAR) database (Schultz et al., 2017). In the present study, we use data at a half-hour time resolution.
We also present monthly mean values from Fabian and Pruchniewicz (1977), which have been graphically reconstructed from the figures in that publication.
2.2.2 Carbon monoxide
Carbon monoxide (CO) measurements at the Zugspitze summit started at the end of 1989, with a gas chromatograph equipped with a mercury reduction detector (RGD-2; Trace Analytical). From 1994 onwards, this system has been either supplemented with or temporarily replaced by one or two gas filter correlation analysers (TE 48S). Since August 2004, a vacuum fluorescence instrument (AL5001; Aero-Laser GmbH, Germany) has served as the primary instrument, which brought about a significant improvement in the short-term CO resolution and exhibited a high reliability. The working standards employed for the calibration were tied to the carbon monoxide scale maintained by the NOAA Earth System Research Laboratories (ESRL) and Global Monitoring Laboratory (GML; Boulder, CO, USA) through several comparison experiments and are on the scale of the WMO–GAW network. Two different instruments were always used in parallel.
At UFS, two gas filter correlation analysers (TE 48C and TE 48S) were used, starting in 2002, and were substituted in 2004 by Aero-Laser AL5001 and Al5002 instruments. The working standards for the measurement of CO were adjusted regularly to the actual scale of the WMO–GAW measurement network by using a group of six NOAA laboratory standards. For the calibration of the Aero-Laser instruments, two 1 ppm (parts per million) standard CO mixtures from Deuste Steininger (https://www.europages.de/DEUSTEW-STEININGER-GMBH-PRUFGASEDRUCK, last access: 23 July 2023) were used. One of these gas tanks was used to calibrate the instrument to a working standard, whereas the other tank serves as a target cylinder. The GAW system and performance audits for carbon monoxide at the station were also carried out in 2001, 2006, 2011, and 2020 (Zellweger et al., 2001, 2006, 2011, 2021). However, for a number of years, the data have not yet been finalized.
2.2.3 Beryllium-7
In the late 1950s, radioactivity measurements were made by IFU at three stations (Zugspitze, Wank, and Garmisch-Partenkirchen) in view of potential nuclear fallout (Sládkovič, 1969, and references therein; Reiter et al., 1971). This led to studies of the descent of stratospheric air into the lower troposphere. Routine measurements of 7Be at the Zugspitze summit started in 1969 (Reiter et al., 1971) and have been archived for the period from 1 January 1970 until 30 April 2006. For the determination of the 7Be activity, aerosols in ambient air were sampled on cellulose nitrate filters (Sartorius no. 11301), using a Digitel DHA-80 high-volume sampler. The filters were found to retain aerosols with efficiencies between 93.0 % (diameters 0.05 to 0.1 µm) and 99.3 % (diameters > 0.3 µm; Reiter et al., 1971). The daily filters were measured in a laboratory of IFU by way of high-resolution gamma spectrometry. The sampling time was 24 h, as necessitated by the signal-to-noise ratio, which sets a certain limit on the identification of stratospheric air intrusions. Through an intercomparison experiment involving four high-altitude sites in Europe, the Zugspitze 7Be results were found to differ from the mean of all participants by less than twice the standard deviation (Tositti et al., 2004).
In 2002 and 2003, there were extended periods during which the 7Be sampler was out of operation. The data gaps could be filled with data from the new DWD (German Weather Service) 7Be sampler. The DWD data were accumulated over 12 h. The periods are time-shifted from 07:30 to 19:00 CET (central European time, which is UTC + 1 h) and from 19:30 to 07:00 CET. After multiplying the DWD values by 2 (24 h instead of 12 h), the IFU and DWD 7Be data agree rather well. For example, the averages for 2002 are 4.47 and 4.71 mBq m−3, respectively. The 24 h 7Be specific activities have been stored on a 0.5 h basis (i.e. without division by 48), which is the time resolution of our archive and our analysis.
2.2.4 Relative humidity
RH measurements at the summit with a dew point mirror instrument (Meteolabor AG; model Thygan VTP 6) started in 1997 and have been officially archived since 1998. The quoted uncertainty is below 5 % RH. For the years 1970 to 1997, RH values were taken from the Zugspitze weather station of the DWD (https://opendata.dwd.de/climate_environment/CDC/observations_germany/climate/hourly/air_temperature/, last access: 23 July 2023; station 05792; the times for this early period are listed in CET rather than in the current DWD standard of UTC). The time resolution of these data is 1 h. Thus, the values are listed twice per hour in our 0.5 h data archive. Moreover, some major data gaps in 2010 and 2011 were filled with RH values from the DWD.
The RH at UFS has been monitored by the DWD with an HMP45D sensor (Vaisala) from 3 August 2011 to 15 July 2014 and an EE33 humidity sensor (E+E Elektronik) thereafter. There is no information on the sensor type used from the beginning (23 August 2001) of the measurement period to 3 August 2011. We use the data from 2002 to 2020, provided at intervals of 0.5 h, after a conversion of the times from UTC (as per the DWD) to CET.
2.2.5 Lidar measurements
Lidar measurements have great potential for the study of stratospheric layers in the troposphere because they are characterized by elevated ozone and very low humidity. Measurements with the IFU ozone (Trickl et al., 2020b) and the UFS water vapour (Vogelmann and Trickl, 2008) differential-absorption lidar (DIAL) systems have accompanied the in situ measurements over many years. These measurements and transport modelling have given insight into the descent or long-range transport of the dry stratospheric layers towards Garmisch-Partenkirchen (Eisele et al., 1999; Zanis et al., 2003; Trickl et al., 2010, 2020a) and have given information on the minimum humidity as a function of the transport path length (Trickl et al., 2014, 2015, 2016). Some of these studies included the analysis of the long-range transport of air pollution (Stohl and Trickl, 1999; Trickl et al., 2003, 2011). Dense lidar time series at intervals of 1–2 h were extended to up to 4 d and were used to interpret the Zugspitze results. Daily lidar measurements with less dense sequences have been made for up to more than 1 week.
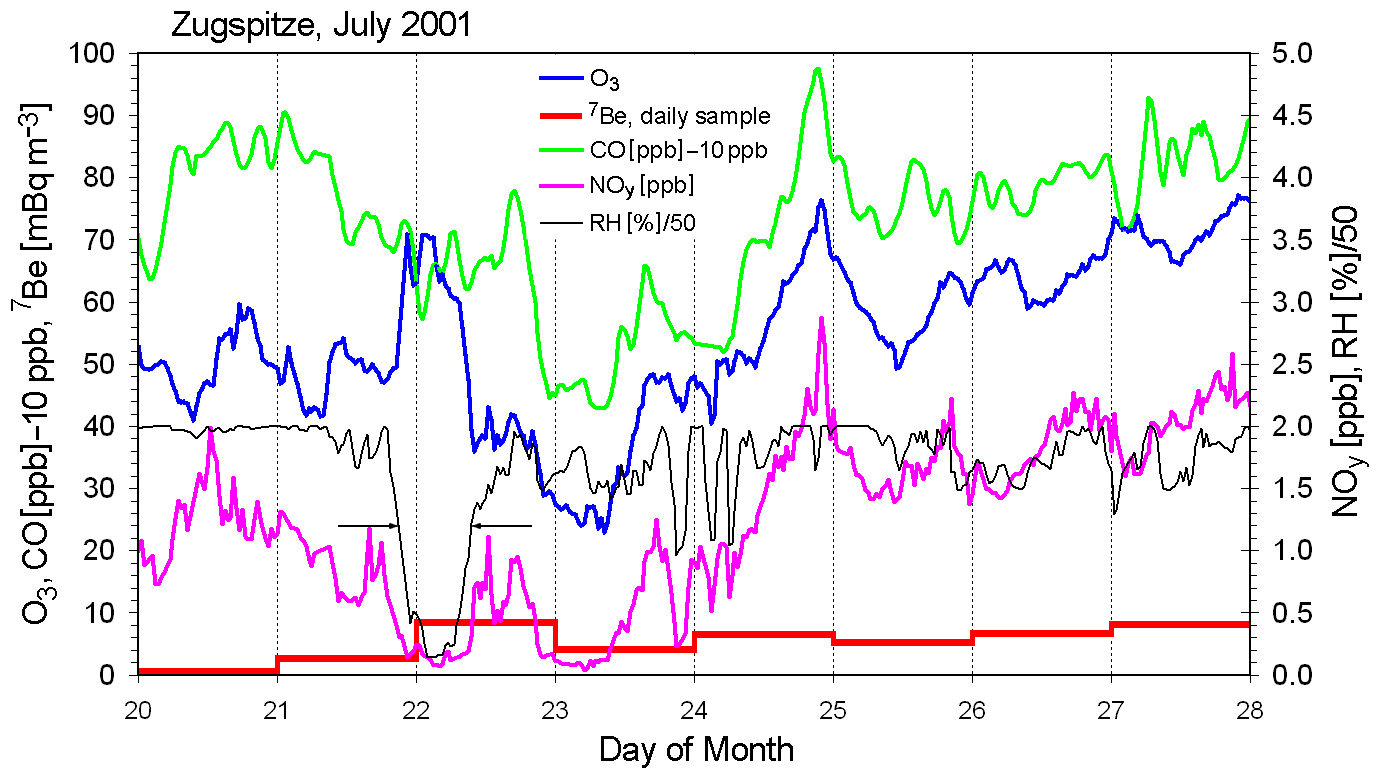
Figure 2Measurements of ozone, 7Be, CO, NOy, and RH at the Zugspitze summit between 20 and 27 July 2001. The 60 % RH level during an intrusion event on 21 and 22 July is marked by two horizontal black arrows.
2.3 Other tools
Trajectories have been used to verify deep stratospheric intrusions. Many case studies have been made with FLEXTRA trajectories and the particle dispersion model FLEXPART (Stohl and Trickl, 1999; Trickl et al., 2003, 2010, 2011, 2014). ETH Zürich provided 4 d forecasts on a daily basis, using the LAGRANTO model (Wernli, 1997; Wernli and Davies, 1997), until the end of the ozone lidar measurements in early 2019 (e.g. Zanis et al., 2003; Trickl et al., 2010, 2020a). In cases with subsidence periods exceeding 4 d, HYSPLIT (Hybrid Single-Particle Lagrangian Integrated Trajectory; Draxler and Hess, 1998; Stein et al., 2015; https://www.ready.noaa.gov/HYSPLIT_traj.php, last access: 23 July 2023) 315 h backward trajectories were calculated. We prefer the “reanalysis” mode that, despite having a moderate spatial resolution, has better explained our observations (e.g. Trickl et al., 2020a).
Linear regression analyses were done by applying a program developed for spectroscopic studies (e.g. Trickl and Wanner, 1984; Trickl et al., 1993, 1995). This program includes individual weights for the data points, error propagation, and recalibration of the standard deviations based on a χ2 analysis. In addition, more than 20 programs were developed to convert data formats, to fill gaps in the data archive, to calculate the percentiles of 7Be and RH, and for data filtering. For sliding arithmetic averages, we used the tool provided by the Origin graphics program to prepare the figures. This tool mostly generates rather realistic boundary conditions for the smoothing of the data set at both ends.
In previous efforts, the STT influence on the Zugspitze ozone has been determined by data filtering, based on correlating ozone with water vapour and 7Be (Elbern et al., 1997; Stohl et al., 2000; Scheel, 2003; Trickl et al., 2010). The STT fraction strongly depends on the threshold conditions chosen (Stohl et al., 2000).
Reiter et al. (1977) pointed out that elevated levels of Zugspitze ozone, exceeding the federal standard of the USA (80 ppb), occur during situations favourable for dry intrusions. A value of 145 ppb was registered during a high-ozone case on 8 and 9 January 1975. Sladkovic et al. (1994) found that both high and low levels of O3 in spring and summer (1984–1993) were most frequently associated with northerly winds. The strongly descending air masses were characterized by the elevated specific activities of 7Be. From the Zugspitze radioactivity measurements of 7Be and 32P, stratospheric residence times of ≥ 36 d and ≥ 17 d were estimated during spring and autumn, respectively (Reiter et al., 1975).
Finally, descending stratospheric air is dry. Beekmann et al. (1997) took an RH threshold of 20 % in their analysis of ozonesonde data. For the Zugspitze data, an RH threshold of 30 % was found to be adequate, as verified by comparisons with the predictions by transport models (Trickl et al., 2010).
In Fig. 2, the time series of several key constituents measured at the Zugspitze summit are displayed during a period well characterized by ozone lidar measurements and transport modelling (Trickl et al., 2010, 2011). The lidar time series demonstrated that the intrusion fully descended across the summit. The mutual correlations give clear hints with respect to atmospheric long-range transport. Late on the day of 21 July 2001, an intrusion from Greenland passed the summit station and continued until the next morning, exhibiting minimum RH = 7.19 % at 07:00 CET, minimum NOy = 0.07 ppb at 04:00 CET, and maximum ozone = 70.76 ppb at 02:00 CET. The Munich radiosonde (1:00 CET) showed a much smaller minimum RH of 3 %, which is in better agreement with the expectation for the calculated downward travel time of 8 to 9 d (Trickl et al., 2014; for more information on RH, see Sect. 3.4). The 24 h 7Be value is 8.26 mBq m−3, exceeding the classical threshold of 8.0 mBq m−3 (Sládkovič and Munzert, 1990) and the revised threshold of 5.5 mBq m−3 (Trickl et al., 2010).
The width of the RH trough is a good estimate of the length of an intrusion event. As indicated by the horizontal arrows, Scheel (2003) used an RH = 60 % threshold for estimating the full width at half maximum of the intrusion. The RH increases below this level, and the losses above this level, also caused by tropospheric mixing, approximately compensate. Thus, for ozone, this interval represents the stratospheric contribution rather well if the centre of the intrusion reaches the summit station. This is sometimes not the case, which infers uncertainty.
For CO, just a small concentration dip is observed during the intrusion. The absence of a pronounced CO concentration drop is rather typical (Trickl et al., 2014; see Sect. 3.4).
On 23 July, a minimum of all species except RH and 7Be occurred. This period is characterized by advection from the boundary layer over the tropical Atlantic, which is typical behaviour shortly after the beginning of a high-pressure event (Trickl et al., 2003, 2010). NOy was even lower than in the intrusion.
An important question is where the elevated 7Be on 24 July and on the following days comes from. Apart from three RH dips around midnight between 23 and 24 July, the RH values do not indicate any dry layer. If the elevated 7Be observed during this period originated in the stratosphere, then the air mass had almost completely lost its characteristics. Indeed, HYSPLIT backward trajectories run over 315 h for start times on late 24 July and early 25 July indicate a long-range descent from high altitudes over Arctic Canada which began before the computational period.
It is obvious that an identification of the stratospheric air from observational data is only possible for direct intrusions into the lower troposphere; i.e. these are intrusions that descend to altitudes above the boundary layer within approximately 3 to 15 d, during which the layers stay dry. For indirect intrusions, an estimate can be made based on assumptions about the stratospheric fraction of 7Be.
In the following subsections, some characteristics of the parameters employed for data filtering are presented, insofar as these details are of relevance for the subsequent ozone and CO analyses.
3.1 Ozone
A clear rise in the ozone level during the relevant time period is a good indicator of stratospheric air. The intrusion in Fig. 2 is a good example. However, pronounced ozone peaks are not always the case. There are several factors that can lead to less pronounced signatures. Of course, aged intrusions undergo mixing with tropospheric air, which could be verified by humidity measurements by the UFS water vapour lidar or radiosondes. As mentioned, we found that just the lowermost layer above the tropopause starts to subside (Fig. 18 in Trickl et al., 2014). This is mostly the case in winter and sometimes leads to just a small rise in ozone (Trickl et al., 2020a). Finally, there are cases in which just an edge of the intrusion layer hit the station, which can be associated with lower peak ozone. Small rises in ozone in the Zugspitze time series are hard to distinguish from the mostly rather variable concentrations around an intrusion period. Thus, we exclude ozone from the list of parameters used for identifying STT. This is justified by the thorough analysis of Trickl et al. (2010).
As discussed by Parrish et al. (2020), there is just a small average relative decrease of 2.6 % between the ozone values at the summit and the lower-lying UFS station. Therefore, we use the UFS data to extend the time series beyond 2011. The question is how well the results for the stratospheric influence at UFS match those for the summit during the period of overlap. In any case, even if there is a discrepancy, then at least the trend for the extended period of observation can be judged.
Fabian and Pruchniewicz (1977) published ozone values for the period 1970 to 1977. These values were rejected by Tarasick et al. (2019) and are not included in our analysis. Instead, we use an extrapolated constant ozone mixing ratio for the period 1970 to 1977, as justified in Sect. 5.2.
In general, short ozone data gaps are filled during the analysis by the respective monthly average.
3.2 Carbon monoxide
Carbon monoxide has both natural and anthropogenic sources (e.g. Duncan et al., 2007) and is of importance in tropospheric chemistry because of its reaction with the OH radical (Logan et al., 1981). The Zugspitze CO mixing ratio displays a pronounced seasonal cycle, with a maximum around April and a minimum from summer to autumn.
CO has been used to identify polluted air masses (Scheel, 2003). It is interesting that the highest CO mixing ratios have been observed in fronts (Rudolf Sládković, personal communication, around 1996). A strong rise in the CO level in a front is frequently associated with polluted air picked up over industrial regions to the northwest. In Fig. 2, this frontal passage took place on 20 July 2001 but with just a moderate increase in CO and NOy.
As confirmed in Fig. 2, CO is not a good tracer of stratospheric air hitting the summit. Trickl et al. (2014, 2016) explain this by pointing to the fact that intrusions emerge from the lowermost layer of the stratosphere, where obviously the descent to stratospheric values (20 to 40 ppb; e.g. Zahn et al., 1999; Fischer et al., 2000; Pan et al., 2004; Hegglin et al., 2009; Vogel et al., 2011) is not yet pronounced.
Trickl et al. (2014) determined a very small positive CO trend in intrusions for 1900 to 2005. The CO trend outside the intrusions during that period is slightly negative, indicating an improving air quality.
Here, we repeat the analysis based on one of the revised filtering criteria and extend it to 2020 by including the UFS data that start in 2009.
3.3 Beryllium-7
As strongly elevated values of the 7Be activity concentration (mBq m−3) are indicators of stratospheric intrusions (Reiter et al., 1983), this tracer has been important for flagging ozone data with respect to stratospheric influence. Its half-life time of 53.42 d ± 0.1 d (Huh and Liu, 2000) is rather suitable for studies of STT.
The 7Be threshold used at IFU in studies until 2000 is 8 mBq m−3 (Sládkovič and Munzert, 1990), which was adopted by Stohl et al. (2000). Elbern et al. (1997), in their analysis of Wank and Zugspitze, applied variable thresholds, given by a predefined increase in the standard deviation of the values against the running monthly mean, for the species used. In a study of stratospheric intrusions at Monte Cimone (Italy), Cristofanelli et al. (2006) employed both the fixed value of 8 mBq m−3 and a dynamic threshold based on running monthly means. By comparing trajectory-based predictions of stratospheric air intrusions for the period 2001–2005, Trickl et al. (2010) showed that the 7Be criterion could be weakened to a threshold of 5.5 mBq m−3 or perhaps less during that period.
There are two drawbacks that limit the specificity of 7Be for STT. As mentioned, one is the small concentration of the isotope in intrusions, which necessitates sampling over 24 h in the apparatus used. Second, 7Be is not only produced in the stratosphere but also in the upper troposphere, with an estimated global average contribution of about 33 % (Table 3 in Lal and Peters, 1967). This fraction does not apply for our latitude of about 47.5∘ N, where just 23.4 % is obtained from Fig. 16 found in Lal and Peters (1967). It is even smaller at the higher altitudes of typical source regions relevant for the observations of descending stratospheric air at the northern rim of the Alps. For example, from the same figure, we estimate a constant tropospheric fraction of just 10 % at 70∘ N and higher latitudes. This low fraction is highly advantageous for our analysis, since it reduces its uncertainty.
The primary production mechanism of stratospheric tracers such as 7Be, 10Be, and 14C is spallation or neutron capture by cosmic rays or solar wind (Lal and Peters, 1967; Herbst et al., 2017). The atmospheric production of these isotopes is modulated by the solar magnetic field, solar wind, and the geomagnetic field strength. For the period covered here, the influence of nuclear testing can be ruled out, since the last atmospheric nuclear test took place on 29 September 1969 (in China; https://en.wikipedia.org/wiki/Nuclear_weapons_testing, last access: 23 July 2023), given the short lifetime of the 7Be isotope.
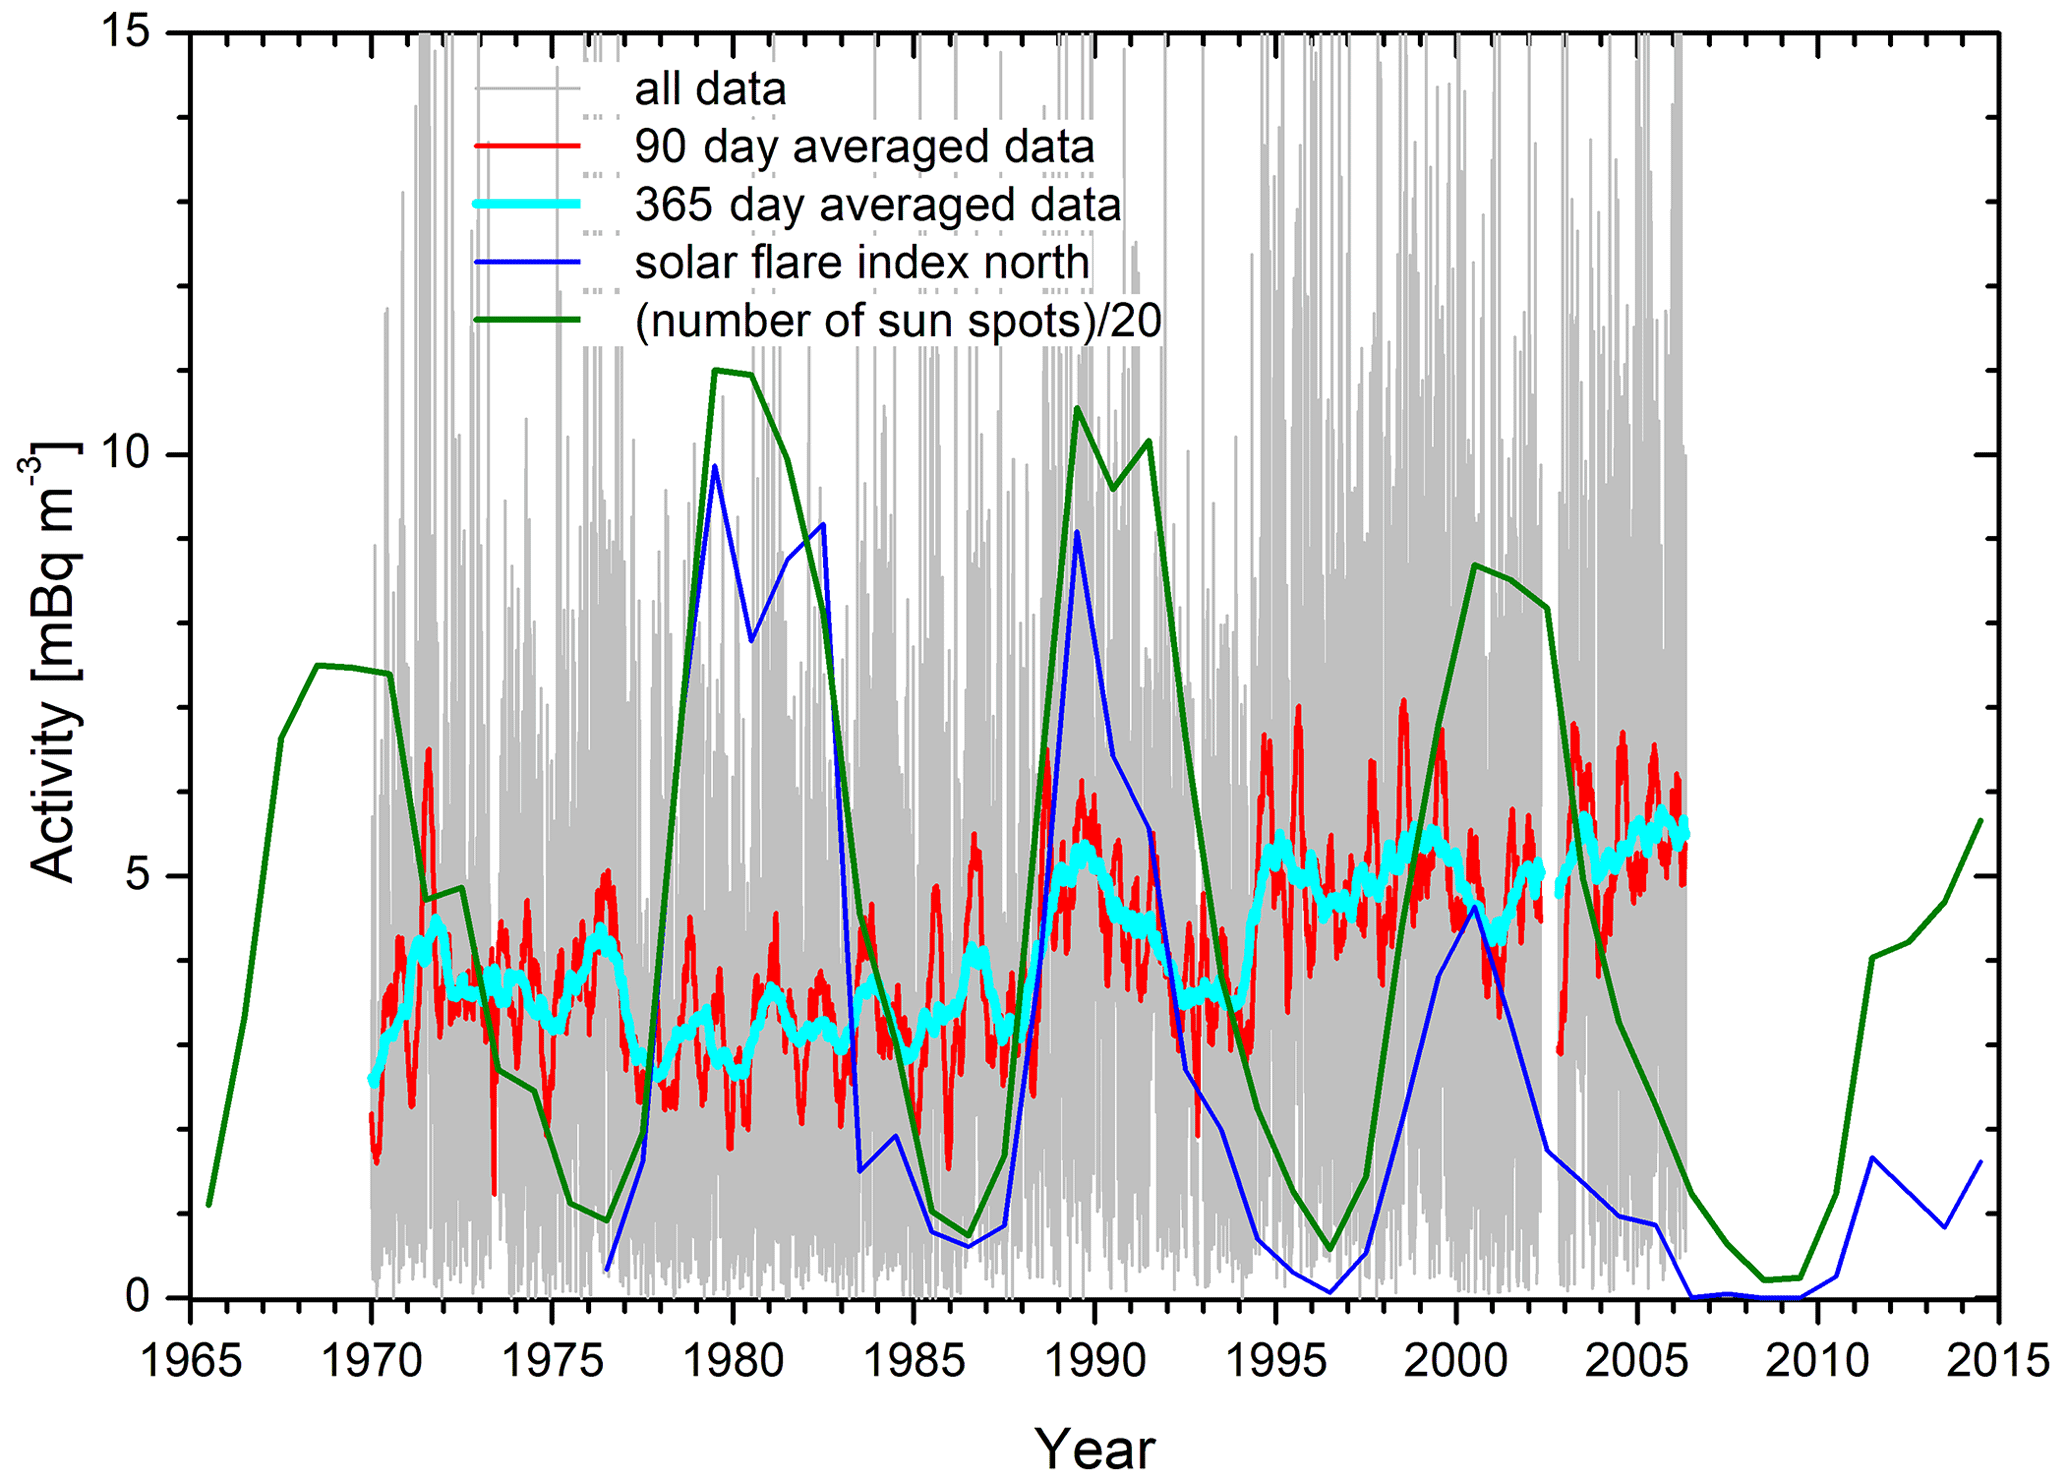
Figure 3Time series of 7Be from 1979 to April 2006. The grey curve represents all 24 h measurements, with the red and cyan showing sliding 90 and 365 d averages, respectively. In addition, we show time series of the solar flare index for the Northern Hemisphere and the annual sunspot count.
Figure 3 shows the full 7Be time series from 1970 to 2006 and the gliding 90 and 365 d arithmetic averages. An almost steady increase is visible after 1976. Reiter (1973a b, 1979) and Reiter and Littfaß (1977) point out the importance of solar flares in the 7Be data. However, the averages shown are obviously not strongly correlated with the frequency of solar flares (https://www.ngdc.noaa.gov/stp/space-weather/solar-data/solar-features/solar-flares/index/flare-index/, last access: 23 July 2023) and annual sunspot numbers (http://www.sidc.be/silso/DATA/SN_y_tot_V2.0.txt, last access: 23 July 2023), which are also displayed in Fig. 3. The increase in 7Be since 1977 has not correlated with the frequency of solar flares or the number of sunspots per year. It seems that the solar activity decreases in the new millennium, but 7Be does not diminish. We conclude that the observed 7Be values are reasonable proxies for STT. However, it makes sense to use an additional tracer such as RH for identifying intrusions.
Indeed, Herbst et al. (2017; Fig. A1) found that the global production of 10Be in the atmosphere for 1960 to 2015 predominantly consisted of a constant term plus an 11-year modulation, with an amplitude of just roughly 20 % of the constant level.
Since 7Be is attached to aerosols, it is subject to washout, which might mask the original stratospheric signature. However, Reiter et al. (1971) found that washout is relatively small for air directly transported downward to 3000 m from the tropopause due to clear-air conditions nicknamed “7Be weather” (Eisele et al., 1999). For low-lying stations, the tropospheric lifetime is estimated as 35 d, including washout (Bleichroth, 1978).
The role of the attachment of 7Be by the persistent aerosol layer in the lower stratosphere or the tropopause region could have been particularly pronounced between 1980 and 2000 due to major volcanic eruptions (Jäger, 2005; Trickl et al., 2013). However, in Fig. 3, there is no evident positive correlation of the 7Be data with the extreme eruptions of El Chichón (1982) and Mount Pinatubo (1991). It is unclear where the 7Be atoms are attached to aerosol.
The seasonal cycle may be influenced by the weather conditions. A good example is the year 1970, with a winter minimum of 7Be. That winter was characterized by never-ending snowfall, resulting in 4 m of snow in a neighbouring valley by the beginning of spring.
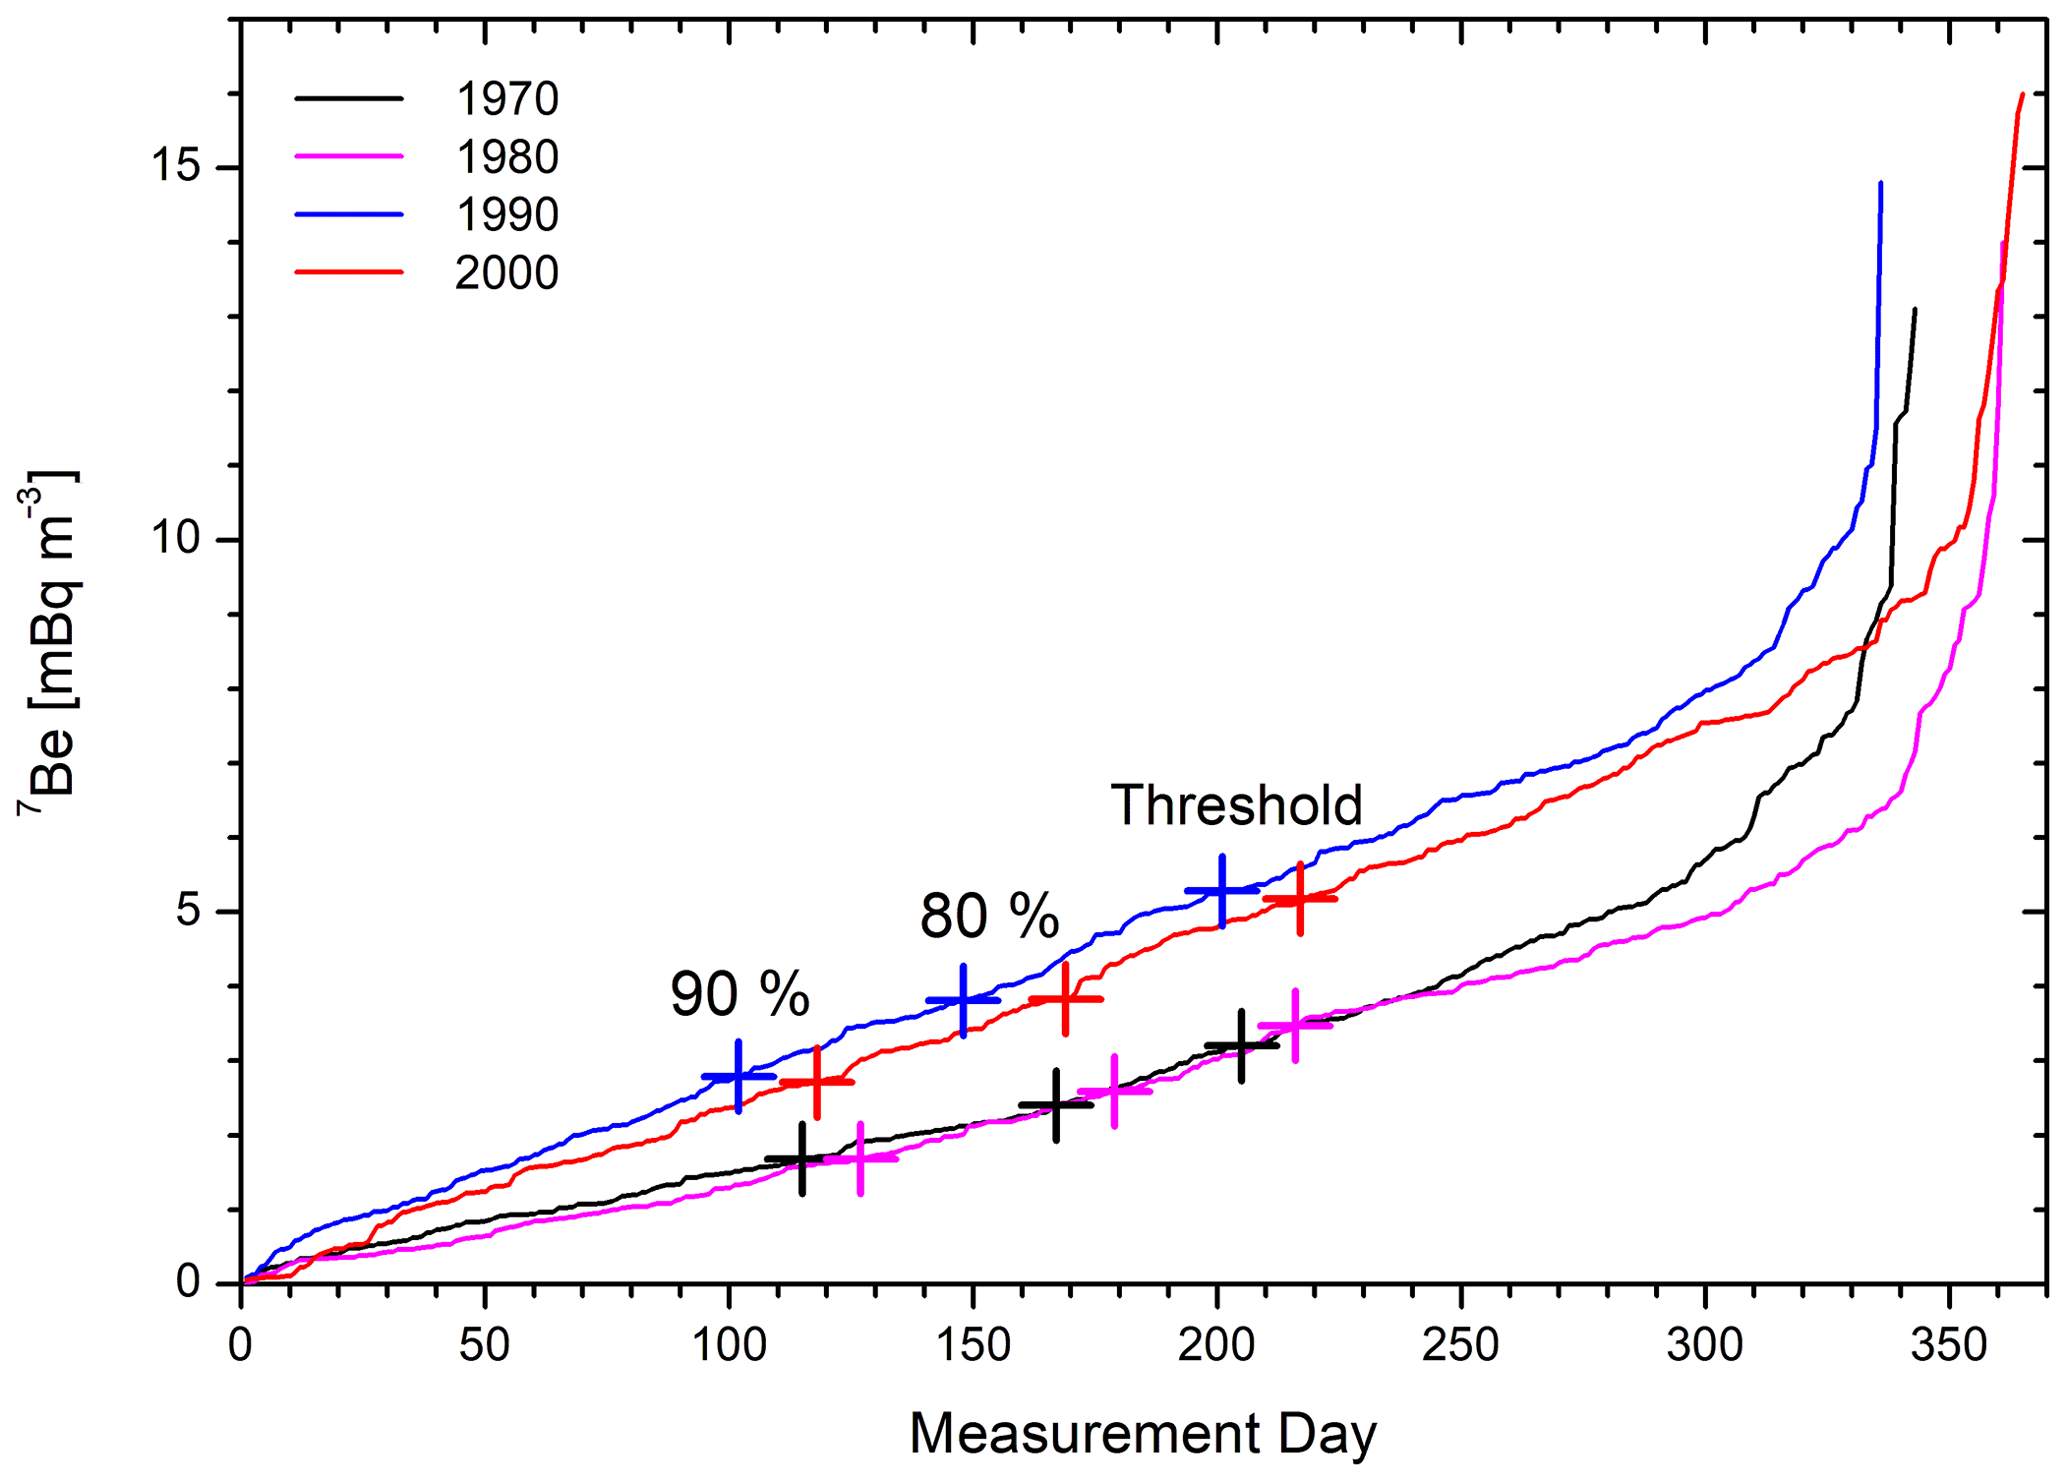
Figure 4Selected 7Be annual series for 1970, 1980, 1990, and 2000, with the values sorted from low to high as needed for calculating percentiles. The crosses mark the points where the downward integral reaches 80 % and 90 % of the full area. In addition, the 65th percentile, used as the threshold for the data filtering, is marked.
In Fig. 4, we show four examples of annual distributions of 7Be at time intervals of 10 years. The daily data are reorganized in time, according to the growing specific activity, as necessary for calculating percentiles. For all 4 years, the maximum number of measurement days is less than 365 or 366 d, as reflected by the changing position of the rise to the highest values. The curves are rather smooth. For later years, their slopes become steeper than at the beginning of the measurements in the 1970s. Based on the above information on the stratospheric fraction of 7Be, we also mark the positions of 80 % and 90 % of 7Be during the respective years, which is needed for the analysis described in Sects. 4 and 5.2.
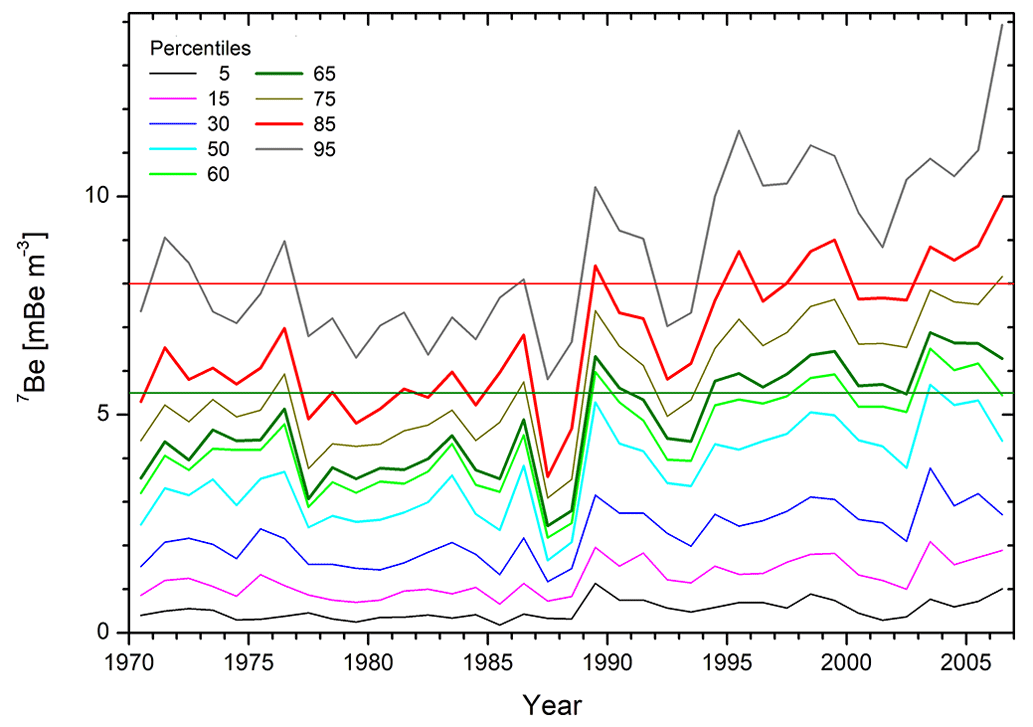
Figure 5Annual percentiles of 7Be for the entire Zugspitze measurements series from 1970 to April 2006. The horizontal lines mark the 8.0 (red) and 5.5 mBq m−3 (olive green) thresholds explained in the text.
Figure 5 shows the series of annual percentiles for the entire period from 1970 to 2006. The highest values, also representing the highest specific activities in single intrusions, change as a function of time. This behaviour is also seen for smaller values. Thus, it is reasonable to use the percentiles as thresholds for the stratospheric origin of an air mass. Scheel (2003) already replaced the 8 mBq m−3 threshold with the 85th percentile. We now use the 65th percentile, approximately corresponding to 5.5 mBq m−3, right after the year 2000.
Stratospheric air may arrive at the Zugspitze summit with much longer travel times than the 2 to 15 d found for detectable intrusions in our previous analyses. This component can no longer deliver a similarly clear signature in the data, with the exception of 7Be (Fig. 2). For the longer travel times, in principle, the limited lifetime of the isotope must be taken into consideration, but this is a difficult task in the absence of information on the respective transport path and time. In addition, we would, in principle, need to know the stratospheric fraction at the source and not at the receptor site.
3.4 Relative humidity
The signature of the air influenced by stratospheric influx also comprises a pronounced decrease in the humidity during the respective episode. Stohl et al. (2000) have discussed the advantages and drawbacks of the parameters of specific humidity and relative humidity. In conclusion, RH is preferred, and it may well serve to help identify stratospherically influenced air, at least for a fixed altitude. Indeed, Trickl et al. (2010), based on trajectory forecasts and backward trajectories, found a very high probability of identifying intrusion layers reaching the Zugspitze summit if, additionally, a minimum RH < 30 % was fulfilled in a given layer. However, in principle, it is not an unambiguous stratospheric air tracer. A combination of an RH criterion with a 7Be criterion is the best choice.
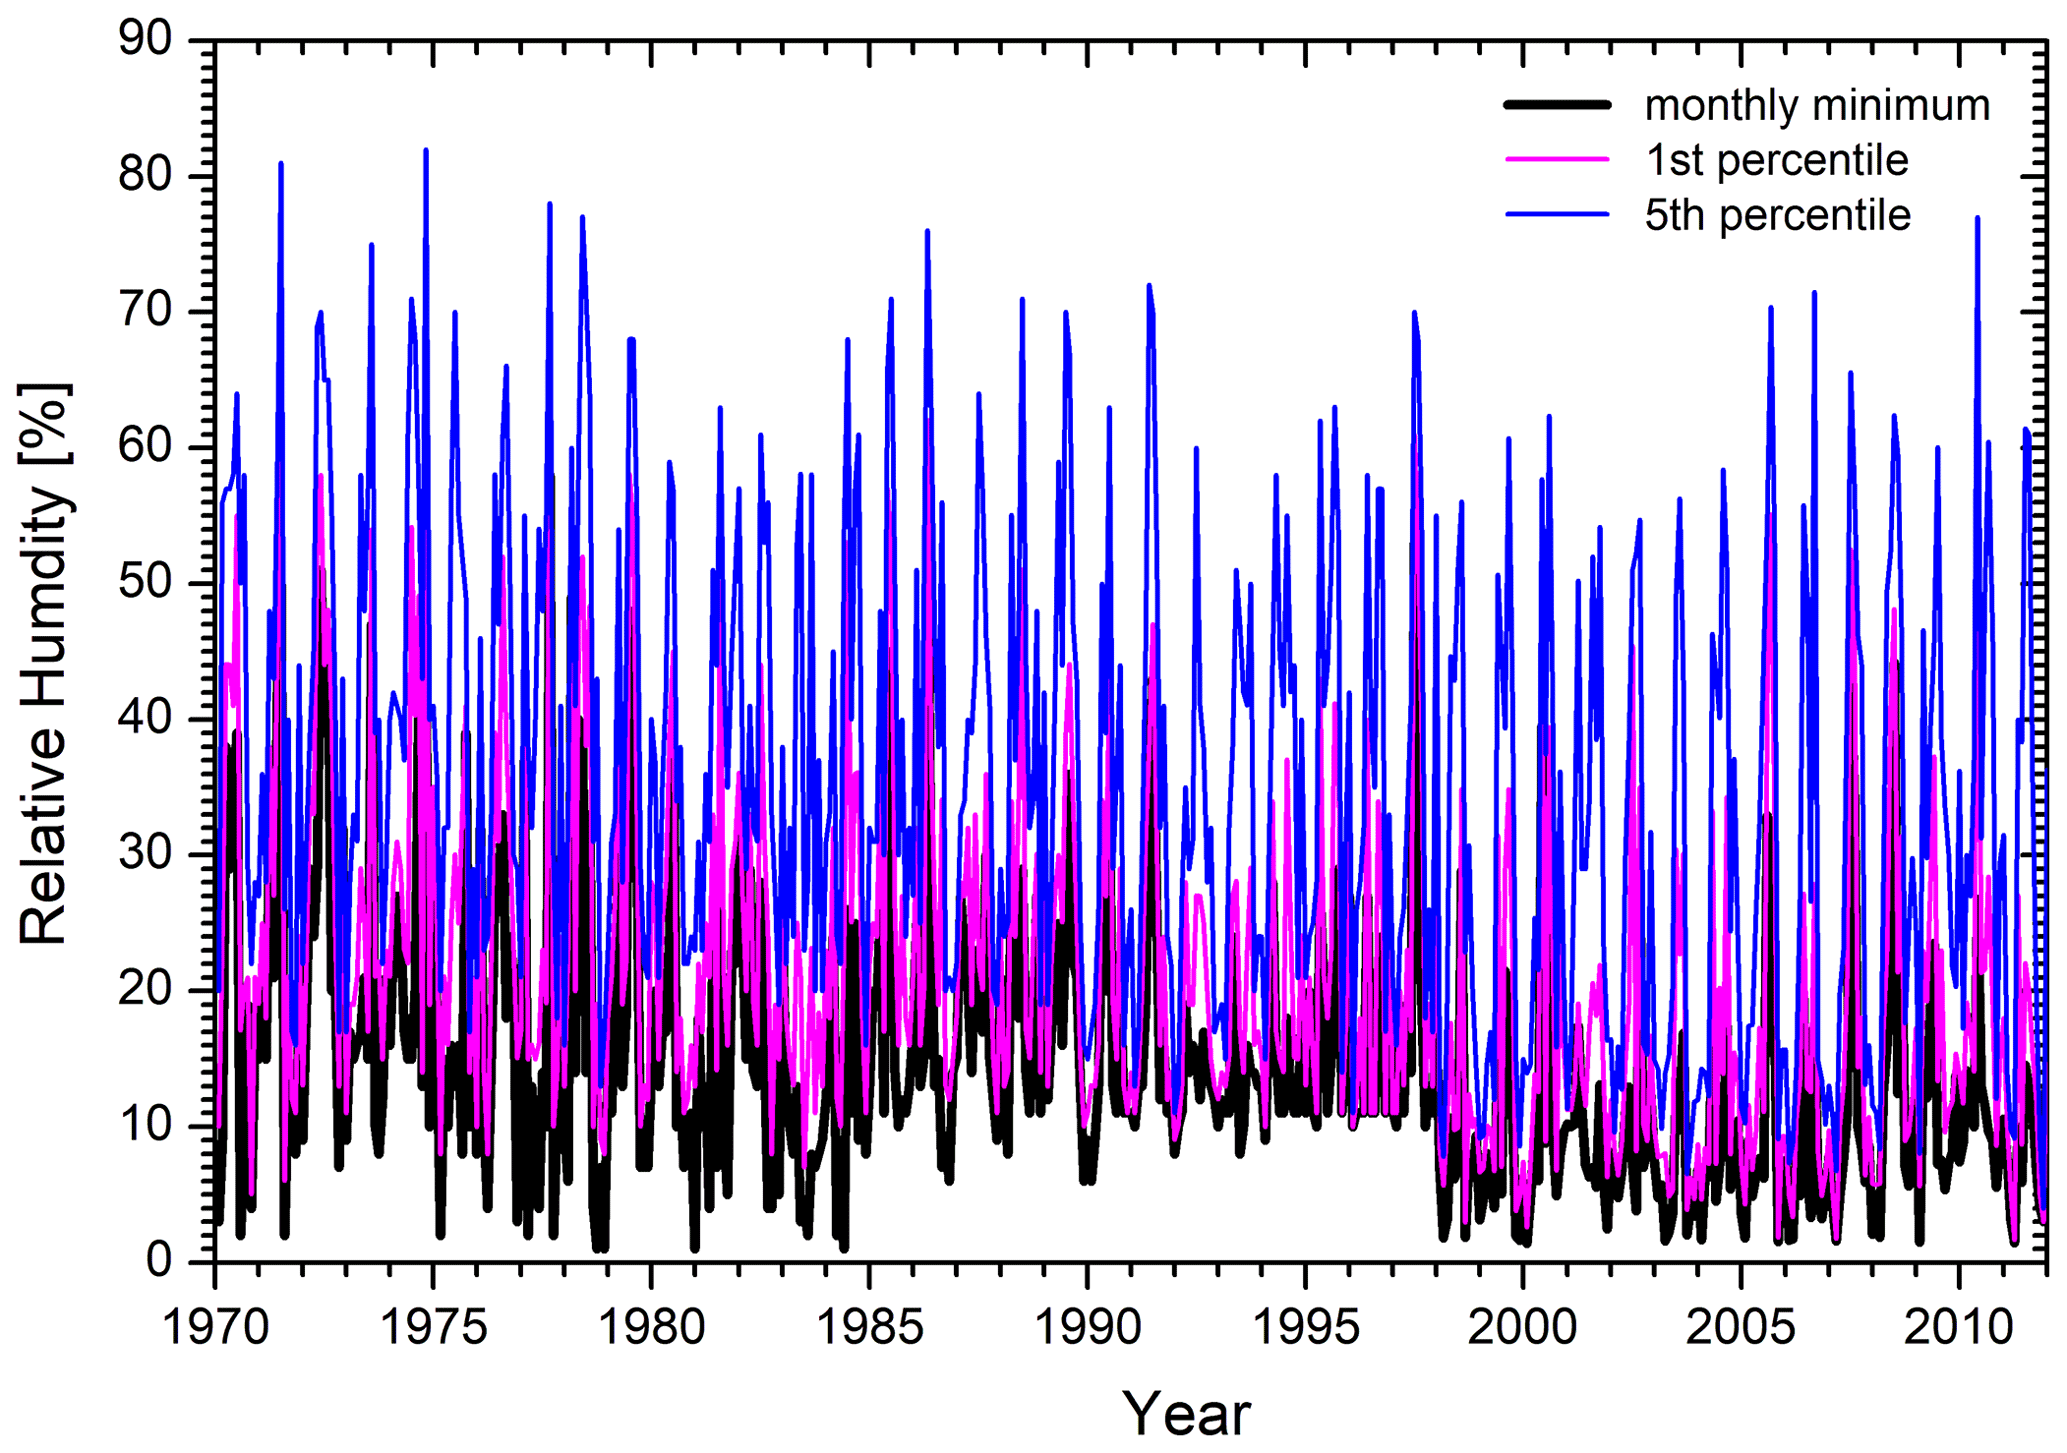
Figure 6Selected monthly percentiles of the Zugspitze relative humidity between 1970 and 2012.
Figure 6 shows monthly percentiles of the Zugspitze RH from 1978 to 2011. An obvious drying of the lower free troposphere during that period is indicated. However, deeper subsidence in more recent years must also be taken into consideration.
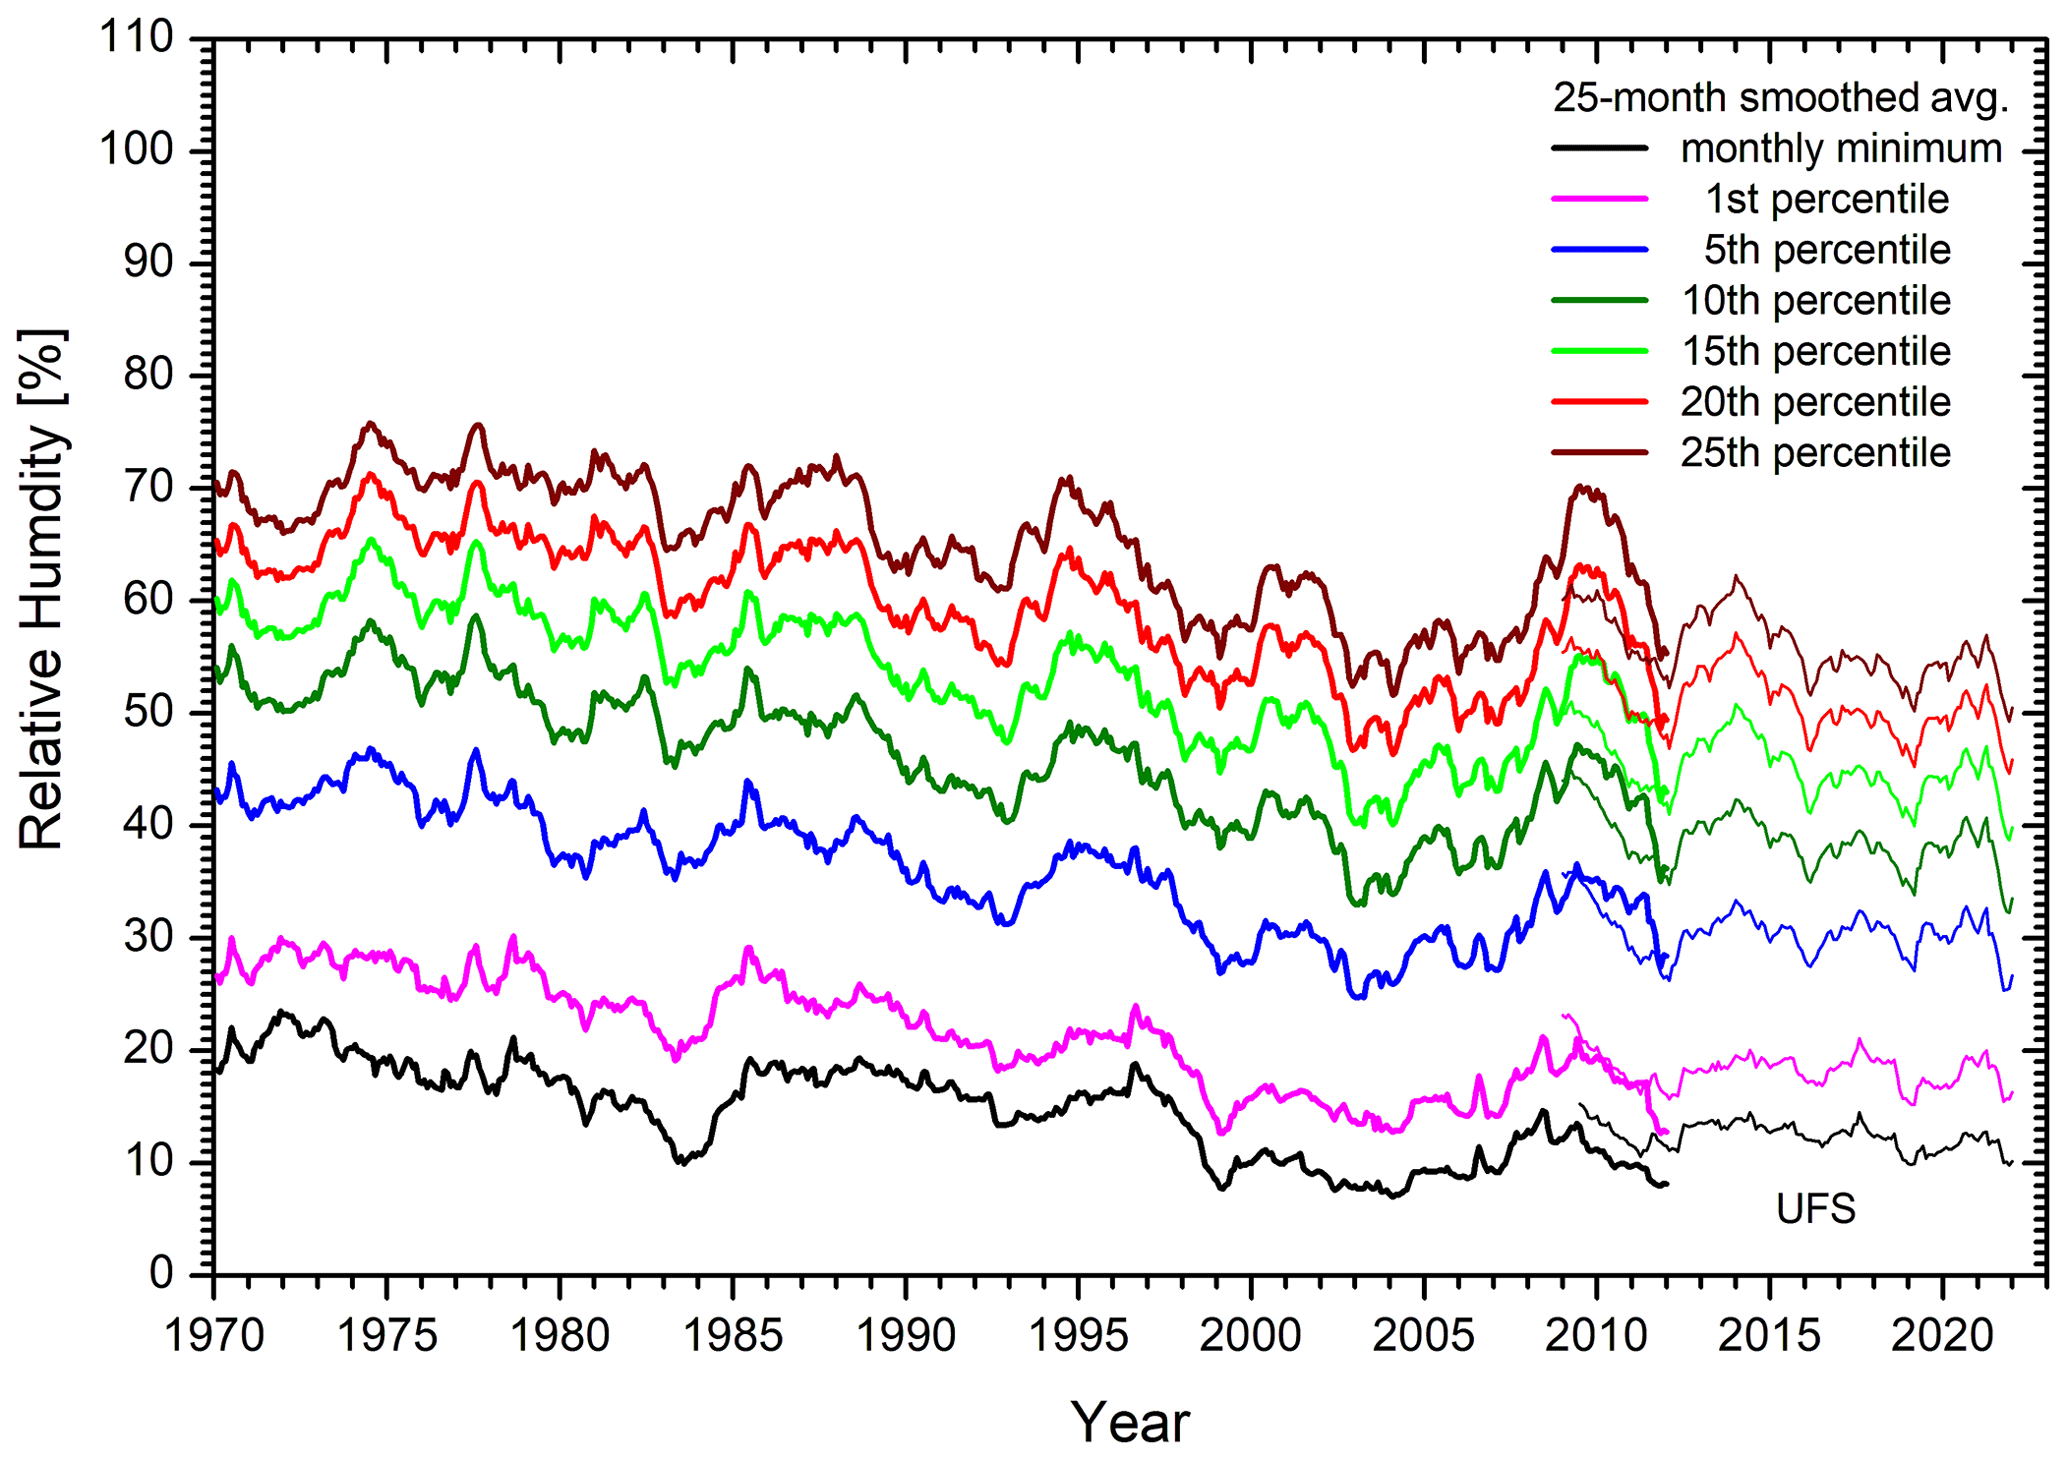
Figure 7Selected monthly percentiles of the Zugspitze relative humidity between 1970 and 2012 and arithmetically averaged over ± 12 months. For the lowest two curves, a positive offset is seen between 1986 and 1997 that can be explained by the use of a different sensor type during that period. The thin lines for the years 2009 to 2021 represent the RH measurements at UFS. The lowest two lines exhibit an offset with respect to those for the summit.
The monthly minimum RH can be as low as 1 % but is higher between 1985 and 1997. This suggests the presence of three phases, perhaps with different sensors. As pointed out above, DWD data are used for the period 1970 to 1997. Indeed, according to DWD listings, there was a change in sensors on 13 March 1986 (from a psychrometer to a MIRIAM-TDH system). This suggests that the higher winter minimum in 1985 must be accidental. The step no longer exists for the 5th and higher percentiles, as seen in the averaged percentiles in Fig. 7.
For the data filtering, we correct the data during the period from 13 March 1986 to the end of 1997 by applying the following formula:
ΔRH=5.0 (all in %). The exponent was estimated by a gradual rise from the lower values in order to fulfil the approximate disappearance of RHc above 30 % RH. This formula significantly modifies the RH values for low RH by −0.43 %, −1.26 %, and −3.24 % RH for 30 %, 20 %, and 10 % RH, respectively.
In general, the Zugspitze relative humidity is dominated by high values (mostly 100 %). This amplifies the detection capability for subsiding air masses that are associated with clear-weather conditions. The explanation is the frequent formation of an orographic updraft and cloud formation at and above this isolated high mountain.
Despite this step, it is obvious that there is also a pronounced downward trend at higher percentiles. Figure 7 shows 25-month averages for several percentiles, roughly representing a 1-year time resolution (e.g. Trickl et al., 2020b).
The humidity measurements at UFS by DWD show higher offsets of low RH. Between 2001 and late 2011, the RH minima at UFS are about 7 % RH (not shown here). Afterwards, the monthly minima are 3 % RH. This suggests the use of a different type of humidity sensor, but we do not have clear information on an instrument change. Since we do not have information on the local RH background at UFS, we do not correct for the 3 % RH offset. However, in Eq. (1) we apply ΔRH = 4.45 % until 31 July 2011 (Sect. 2.2.4) in order to shift the RH minima to 3 %. In Fig. 7, we show the corresponding smoothed RH percentiles for UFS and exclude the years before 2009, where an unrealistic rise in the curves is seen that would cause confusion in the figure. The most important message is that afterwards no trend is observed at all in most curves.
An elevated minimum RH in an intrusion layer seems to indicate the mixing of the stratospheric air with the surrounding tropospheric air during the descent to the Alpine summits. The consequence would be a severe problem for the quantification of the stratospheric component of the Zugspitze ozone. Fortunately, this not the case. In four of our earlier papers (Trickl et al., 2014, 2015, 2016, 2020a), we documented that deep intrusions are much drier than what is measured on average at the Zugspitze sites (see Sect. 3.5). We hypothesized an instrumental wet bias of up to 10 % RH for the dew point mirror instrument that has been used at the summit under dry conditions since 1998. However, the elevated minimum RH values are not restricted to this instrument (Fig. 6), which calls for a different explanation.
The lowest minima, down to 1 % to 2 %, mostly occur during the cold season and nighttime. As a matter of fact, the UFS DIAL revealed general deviations from the measurements at the summit during warm and convective conditions (Vogelmann and Trickl, 2008). We conclude that orographic transport takes place in a shallow surface layer (Fig. 5 in Carnuth and Trickl, 2000) that influences the humidity measurements at the summit station and UFS but not in the lidar measurements that probe the humidity outside of this surface layer. The Zugspitze summit could act like a chimney, where directly rising slope winds are at least slightly focussed into a dry stratospheric layer, which could be the reason for the positive bias under warm conditions. Also, the evaporation of moisture from the slopes and terraces around the stations could contribute to the elevated humidity minima.
Not only shallow slope winds can influence the humidity; a daytime upvalley flow (“valley wind”) can also make a contribution that is lifted to altitudes about 1 km above the surrounding summits in the late morning hours (Carnuth and Trickl, 2000; Carnuth et al., 2002; Yuan et al., 2018).
Local mixing of the dry stratospheric air masses with air streaming upward from the boundary layer is much more likely to influence the results at UFS, which might explain the higher minimum values. Yuan et al. (2019) examined the diurnal cycles of CO2 at three Zugspitze sites, UFS, a window in a tunnel above UFS, and the summit station, and found significant differences in the orographic influence. Of course, the probability of an intrusion to overlap fully with the station is lower at UFS than at the summit due to the limited penetration of the dry layers towards lower altitudes.
We conclude that, in most cases, the orographic admixture of humid air at the summit masks the true very low humidity level in the stratospheric layers. Thus, our analysis of STT should be rather realistic.
3.5 Lidar measurements
Lidar measurements at IMK-IFU and UFS have not been made throughout the year and around the clock. However, a large number of intrusion cases have been studied and allow us to draw important conclusions.
A good example of an intrusion case analysed with both the UFS water vapour DIAL and the Zugspitze summit in situ data is given in Figs. 10 and 11 in Trickl et al. (2016). The lidar figure shows the descent of the extremely dry layer exhibiting a stratospheric-type water vapour minimum mixing ratio (about 0 to 50 ppm or RH ≪ 1 %) across the Zugspitze summit, and the station time series verifies the elevated ozone up to 73.3 ppb. The Zugspitze RH minimized at 7.2 %; i.e. it is substantially higher than suggested by the lidar measurements (see Sect. 3.4).
A complete downward passage of an intrusion layer across the summit station was verified with the two DIAL systems in many other measurement series. However, the lidar measurements also show examples of intrusions that do not descend to altitudes below 3000 m, mostly during the warm months. Sometimes, these layers persist over several days at a rather constant altitude, which is typically around that of the Zugspitze summit.
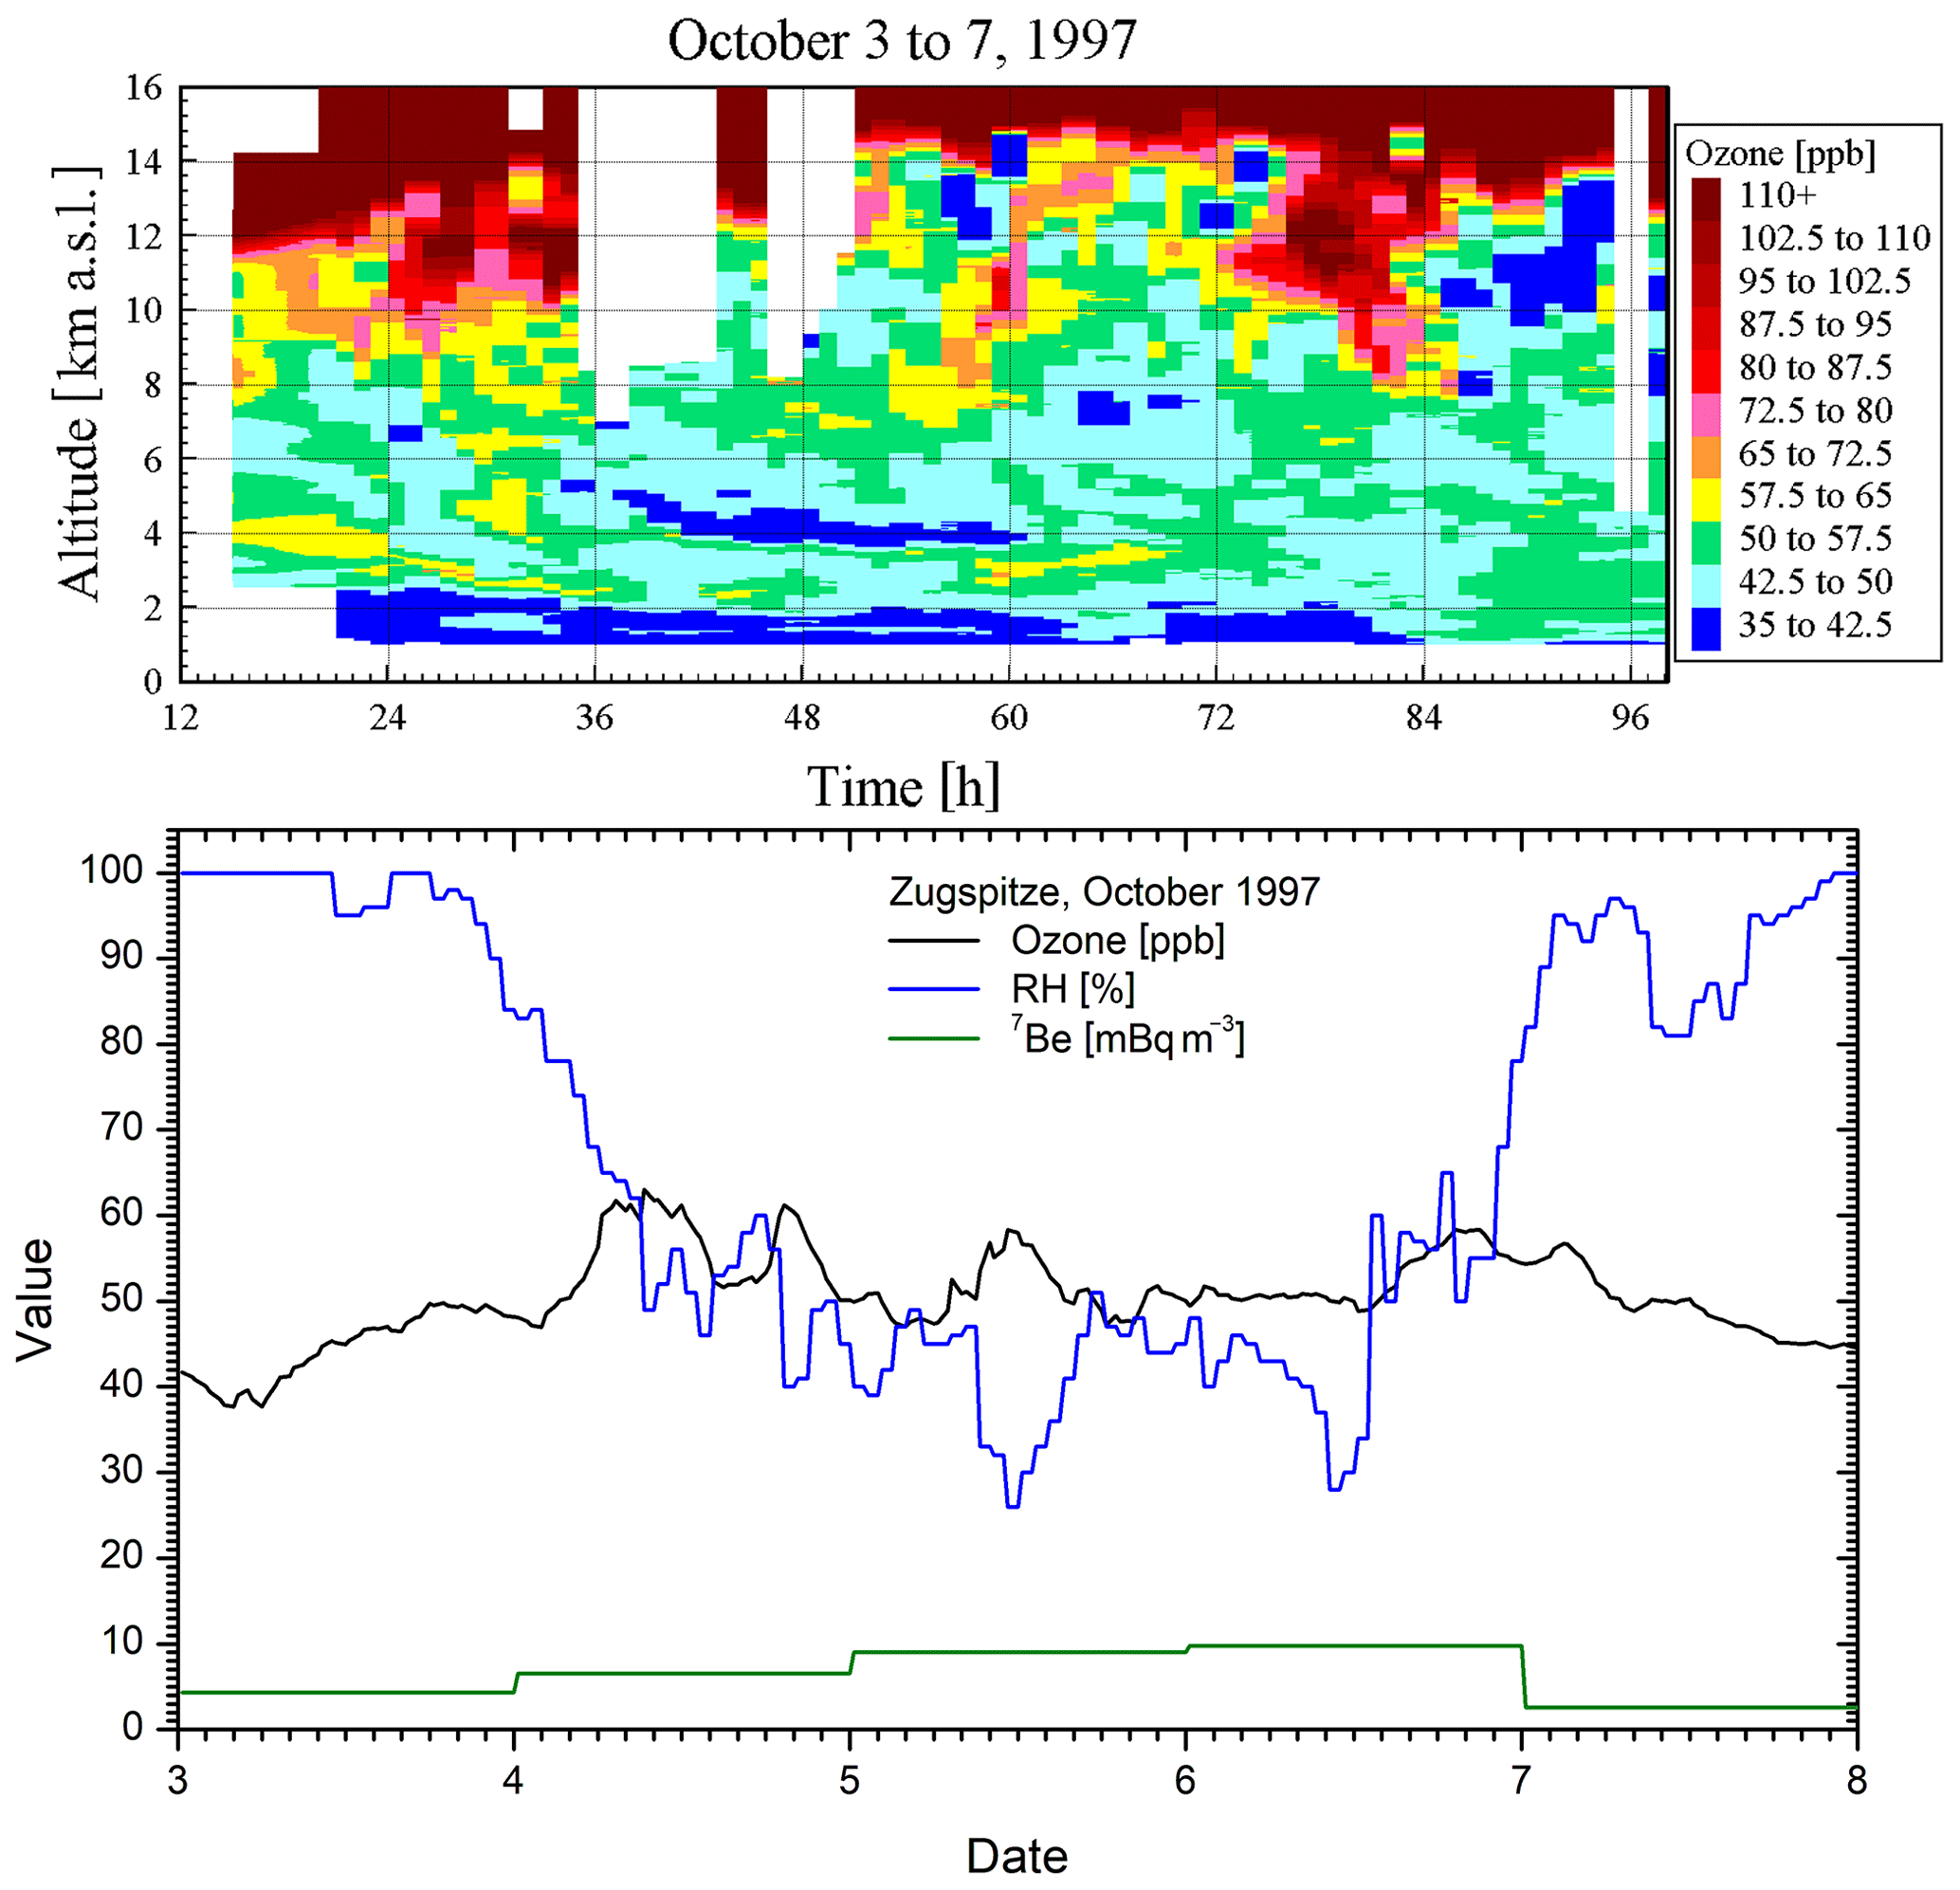
Figure 8Lidar (upper panel) and Zugspitze (lower panel) measurements on 3 to 7 October 1997. The tiny four ozone peaks in the Zugspitze ozone match the crossings of the elevated-ozone layers in the lidar measurements with 3000 m after 28 h, at 60 h, and after 87 h. The strongly elevated 7Be-specific activity on 4 to 6 October suggests the presence of stratospheric air, despite the low ozone rise.
Intrusions do not necessarily lead to a pronounced rise in ozone (Trickl et al., 2014), especially during the cold season (Trickl et al., 2020a). The upper panel in Fig. 8 shows lidar measurements of ozone from 3 to 7 October 1997 at intervals of 1 h. The intrusion structures below 4 km are not as clearly visible as in other colour-coded images presented by us. The small rise in ozone is verified in the lower panel in Fig. 8 by the corresponding Zugspitze time series that exhibits just four 60 ppb peaks residing on a 50 ppb background. On 4 October, the overlap with the intrusion is limited, however, resulting in some rise in 7Be. On the following 2 d, 7Be is substantially higher, but the RH minima are just slightly below 30 % (see Sect. 4). It is important to mention that the RH minima in the Munich, Hohenpeißenberg, and Stuttgart radiosonde data on these days are much lower and range between 5 and 15 %, sometimes at just slightly higher altitudes. Also, on the other side, to the southwest, the Innsbruck radiosonde verifies much drier conditions. HYSPLIT backward trajectories initiated at the Zugspitze summit show long descents from high altitudes over more than 10 d, in part from Siberia. Mixing with the surrounding tropospheric air is likely during this long travel of the layer and explains why the RH is not smaller than 5 %. Please note that the two most-pronounced RH dips in Fig. 8 occurred around noon, when the orographic wind system maximizes. This could be the reason for the rather high minimum RH.
Again, we conclude that the intrusion air masses fully hitting the Zugspitze summit are much more stratospheric than suggested by the in situ RH measurements. This was established from many years of comparing the in situ humidity measurements with lidar and sonde profiles. However, a bias of unknown magnitude can be introduced by intrusions just partly overlapping with the summit (i.e. with the humidity minimum located above 3 km). Such a bias cannot be determined from the available data alone. However, these cases are more likely to occur in summer, when just a few cases are registered per month.
The reanalysis of the STT fraction in Zugspitze ozone is based on the three filtering criteria of Trickl et al. (2010):
-
Criterion 1. The 7Be value corresponds to more than the 85th percentile with respect to all data in the respective year, and RH < 60 %. Criterion 1 yielded the result that Scheel obtained in 2005 (Trickl et al., 2020a).
-
Criterion 2. RH < 60 %, and RH < 30 % for at least one of the half-hour averages within ± 6 h. The second threshold is added to guarantee really dry conditions as expected for stratospheric air.
-
Criterion 3. This is the same as Criterion 1 but with 5.5 mBq m−3 as the threshold for 7Be.
The application of criteria 2 and 3 yields a rather reliable identification of stratospheric air layers, as verified by transport modelling (Trickl et al., 2010). Daily trajectory forecasts of intrusions that also include coarse-altitude information were used (Zanis et al., 2003). The number of trajectory bundles forecasted to hit the Zugspitze summit were higher than the number of intrusions identified with data filtering. This could be due to not only the filtering criteria chosen but also to uncertainties in the coarsely presented vertical positions of the trajectories in the case of missing a full overlap of an intrusion with the summit. In the case of forecast gaps or descents over more than 4 d, HYSPLIT backward trajectories based on reanalysis data were used.
Criterion 1 yielded just less than half of the intrusion cases predicted by transport modelling during the period 2001 to 2005 and is, thus, no longer used.
For the analysis presented in this paper, we exploit criteria 2 and 3 in a slightly modified way to refine the preliminary result of Scheel for 1978 to 2004 (Fig. 1 in Trickl et al., 2020a). In the reanalysis, we replace the 5.5 mBq m−3 threshold with the 65th percentile of the annual data for 2001–2005 (Fig. 5). We replace the 60 % RH threshold by 50 %, since this eliminates many very thin RH dips. Furthermore, we ignore (or interpolate) strange data that exist for very short periods if their occurrence does not exceed 2 h. Such data include RH values near 100 % interrupting an intrusion airflow from reaching the summit, which we tentatively ascribe to fog or clouds ascending from wet slopes. Finally, we search for 7Be above the threshold within ± 12 h and RH values below the 30 % threshold within ± 15 h, respectively. The additional requirement for 7Be was introduced in order to identify intrusions periods beyond midnight.
Unfortunately, there are no 7Be measurements at UFS. Thus, the data filtering for UFS is confined to the RH criterion. We compare the results for both Zugspitze sites during the period of simultaneous measurements for the RH criterion.
The 7Be data allow us to estimate the contribution of the indirect stratospheric ozone component (i.e. ozone that cannot be identified by the data filtering). As explained in Sect. 3.2, we derive the contributions by assuming that 80 % or 90 % of the beryllium is produced in the stratosphere. The 7Be-specific activities tlow for these thresholds are determined by integrating the 7Be percentile curves for all years downward (as those shown in Fig. 4), starting from the highest values. tlow is then used as a lower 7Be boundary when summing up the specific activities outside direct intrusions (named Beindir). We name tdir the 65 % threshold for direct intrusions. Two sums are formed and added. The first one adds up all the 7Be values between tlow and tdir. The second one contributes specific activities above 65 % if on a given day d all RH values RHd exceed the 50 % threshold. This contribution turned out to be significant.
The conversion of the 7Be sums related to indirect events into ozone is achieved by applying the evaluated monthly or annual averages of the ratios for direct intrusions. This is justified, since both species undergo the same mixing process. All sums are carried out on the generally used half-hour time grid over a given month or year in order to yield monthly and annual averages, respectively.
In summary,
The quantities in square brackets are the mixing ratios or specific activities. ntot is the number of half-hour bins with valid data in a given month or year, respectively.
An important question is what has determined the growth of ozone due to stratospheric influence at the Zugspitze summit. It could be an increase in the number of intrusions per year, the growth of the average length of an intrusion or an increase in the ozone per intrusion, or a combination of all of the above. We examined all three possibilities.
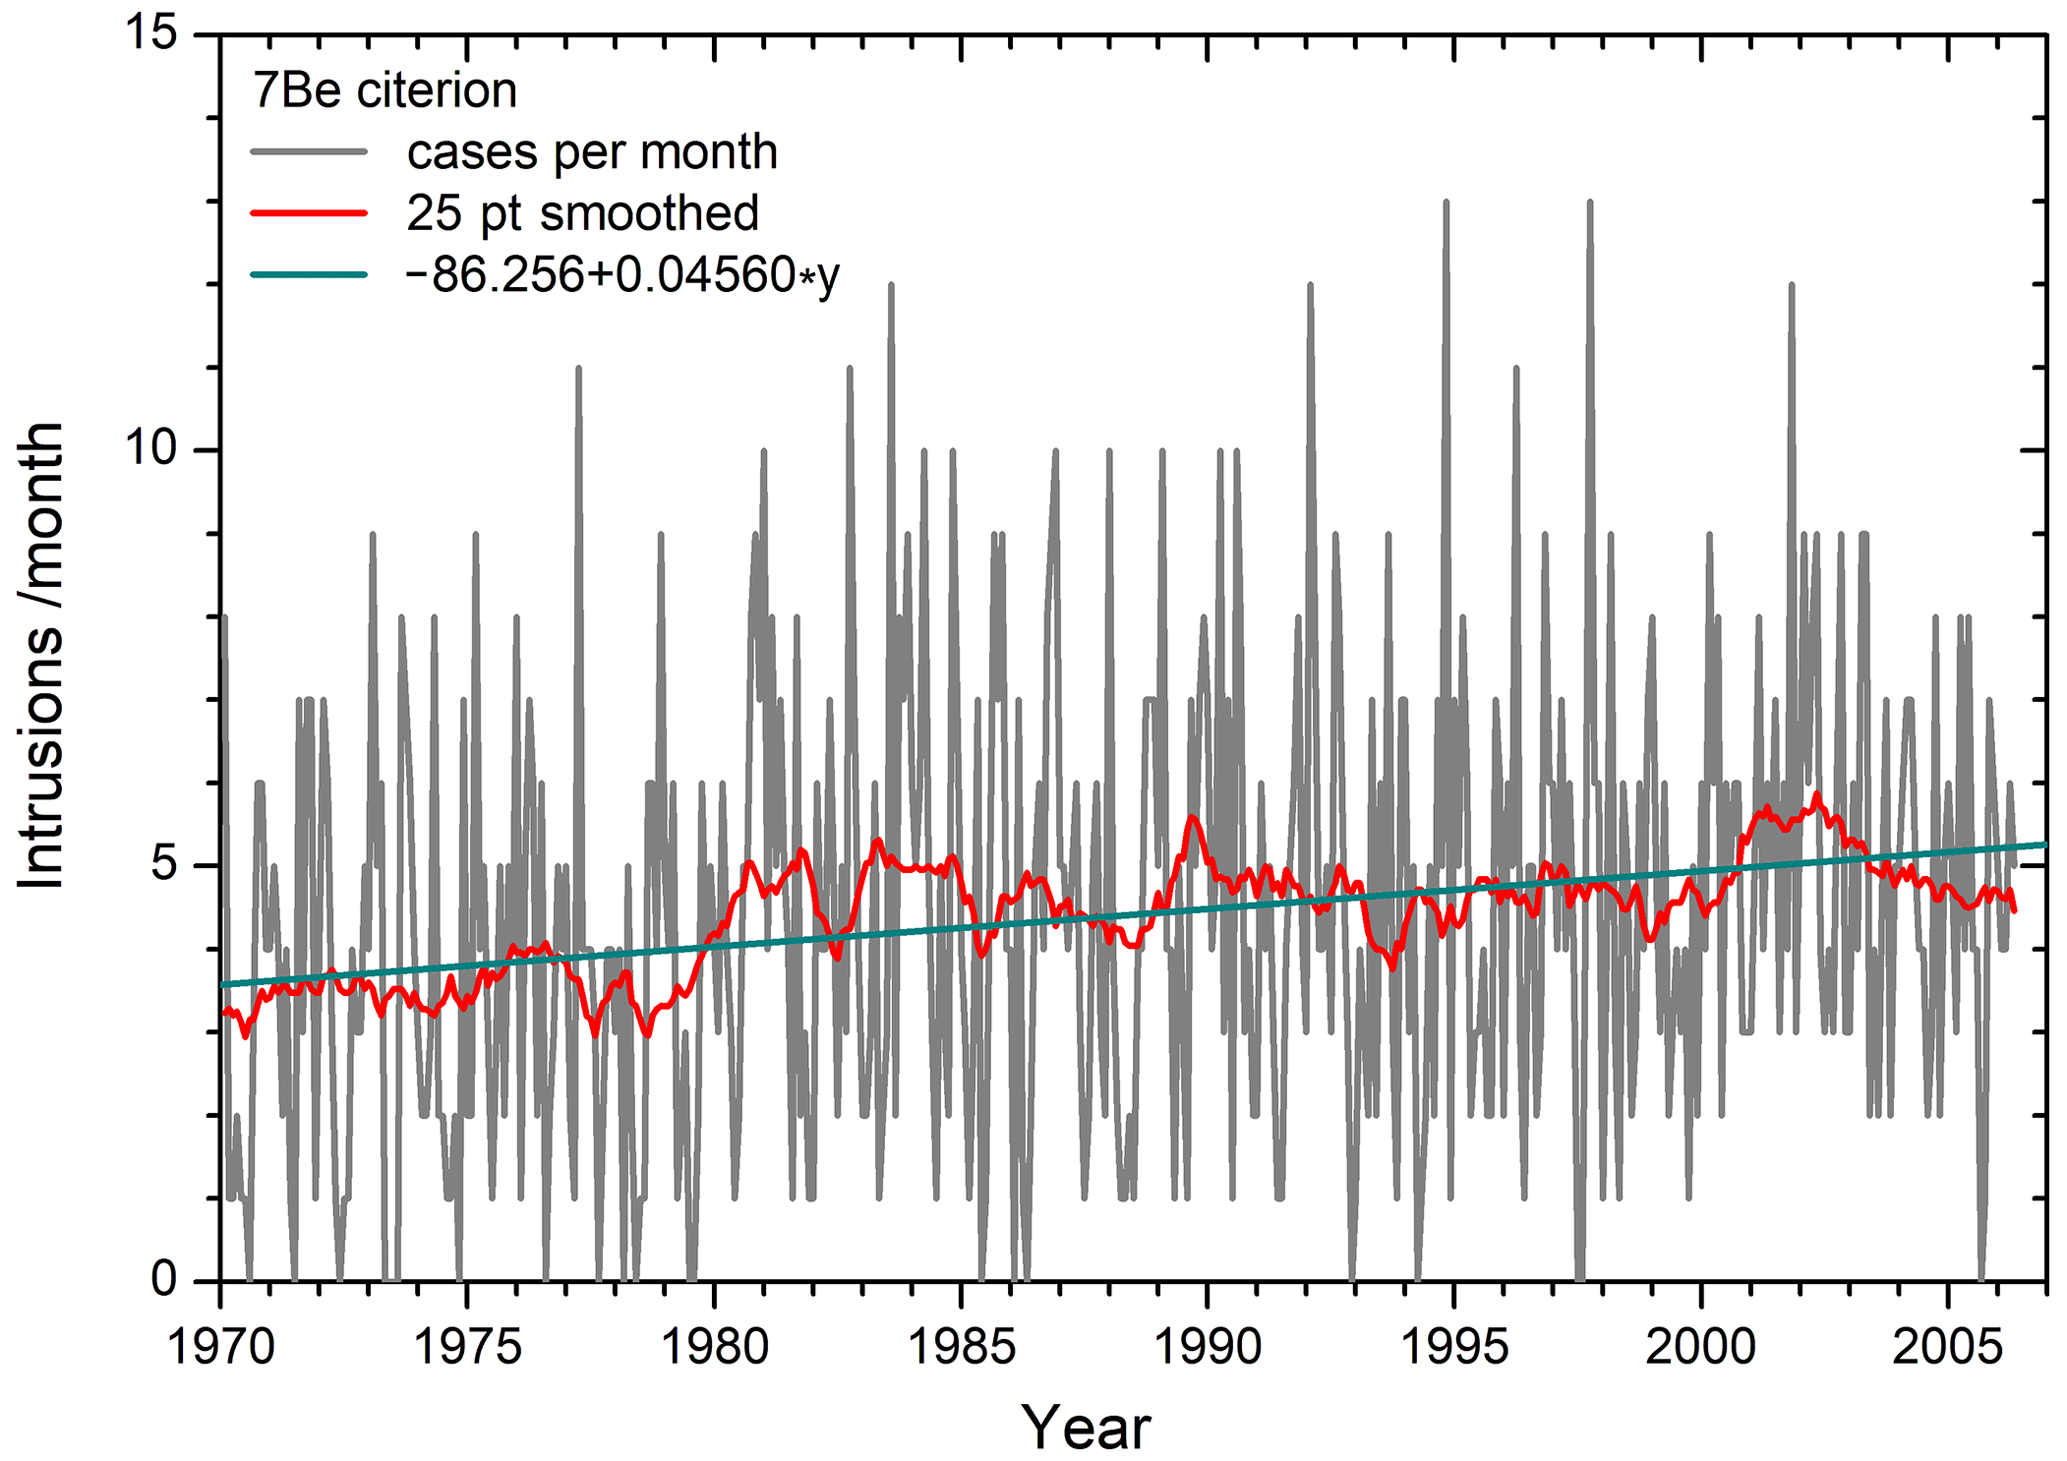
Figure 9Number of intrusions per month reaching the Zugspitze summit between 1978 and April 2006, based on the 7Be criterion. Short events (≤ 2 h) during which the criterion was fulfilled were discarded (see text).
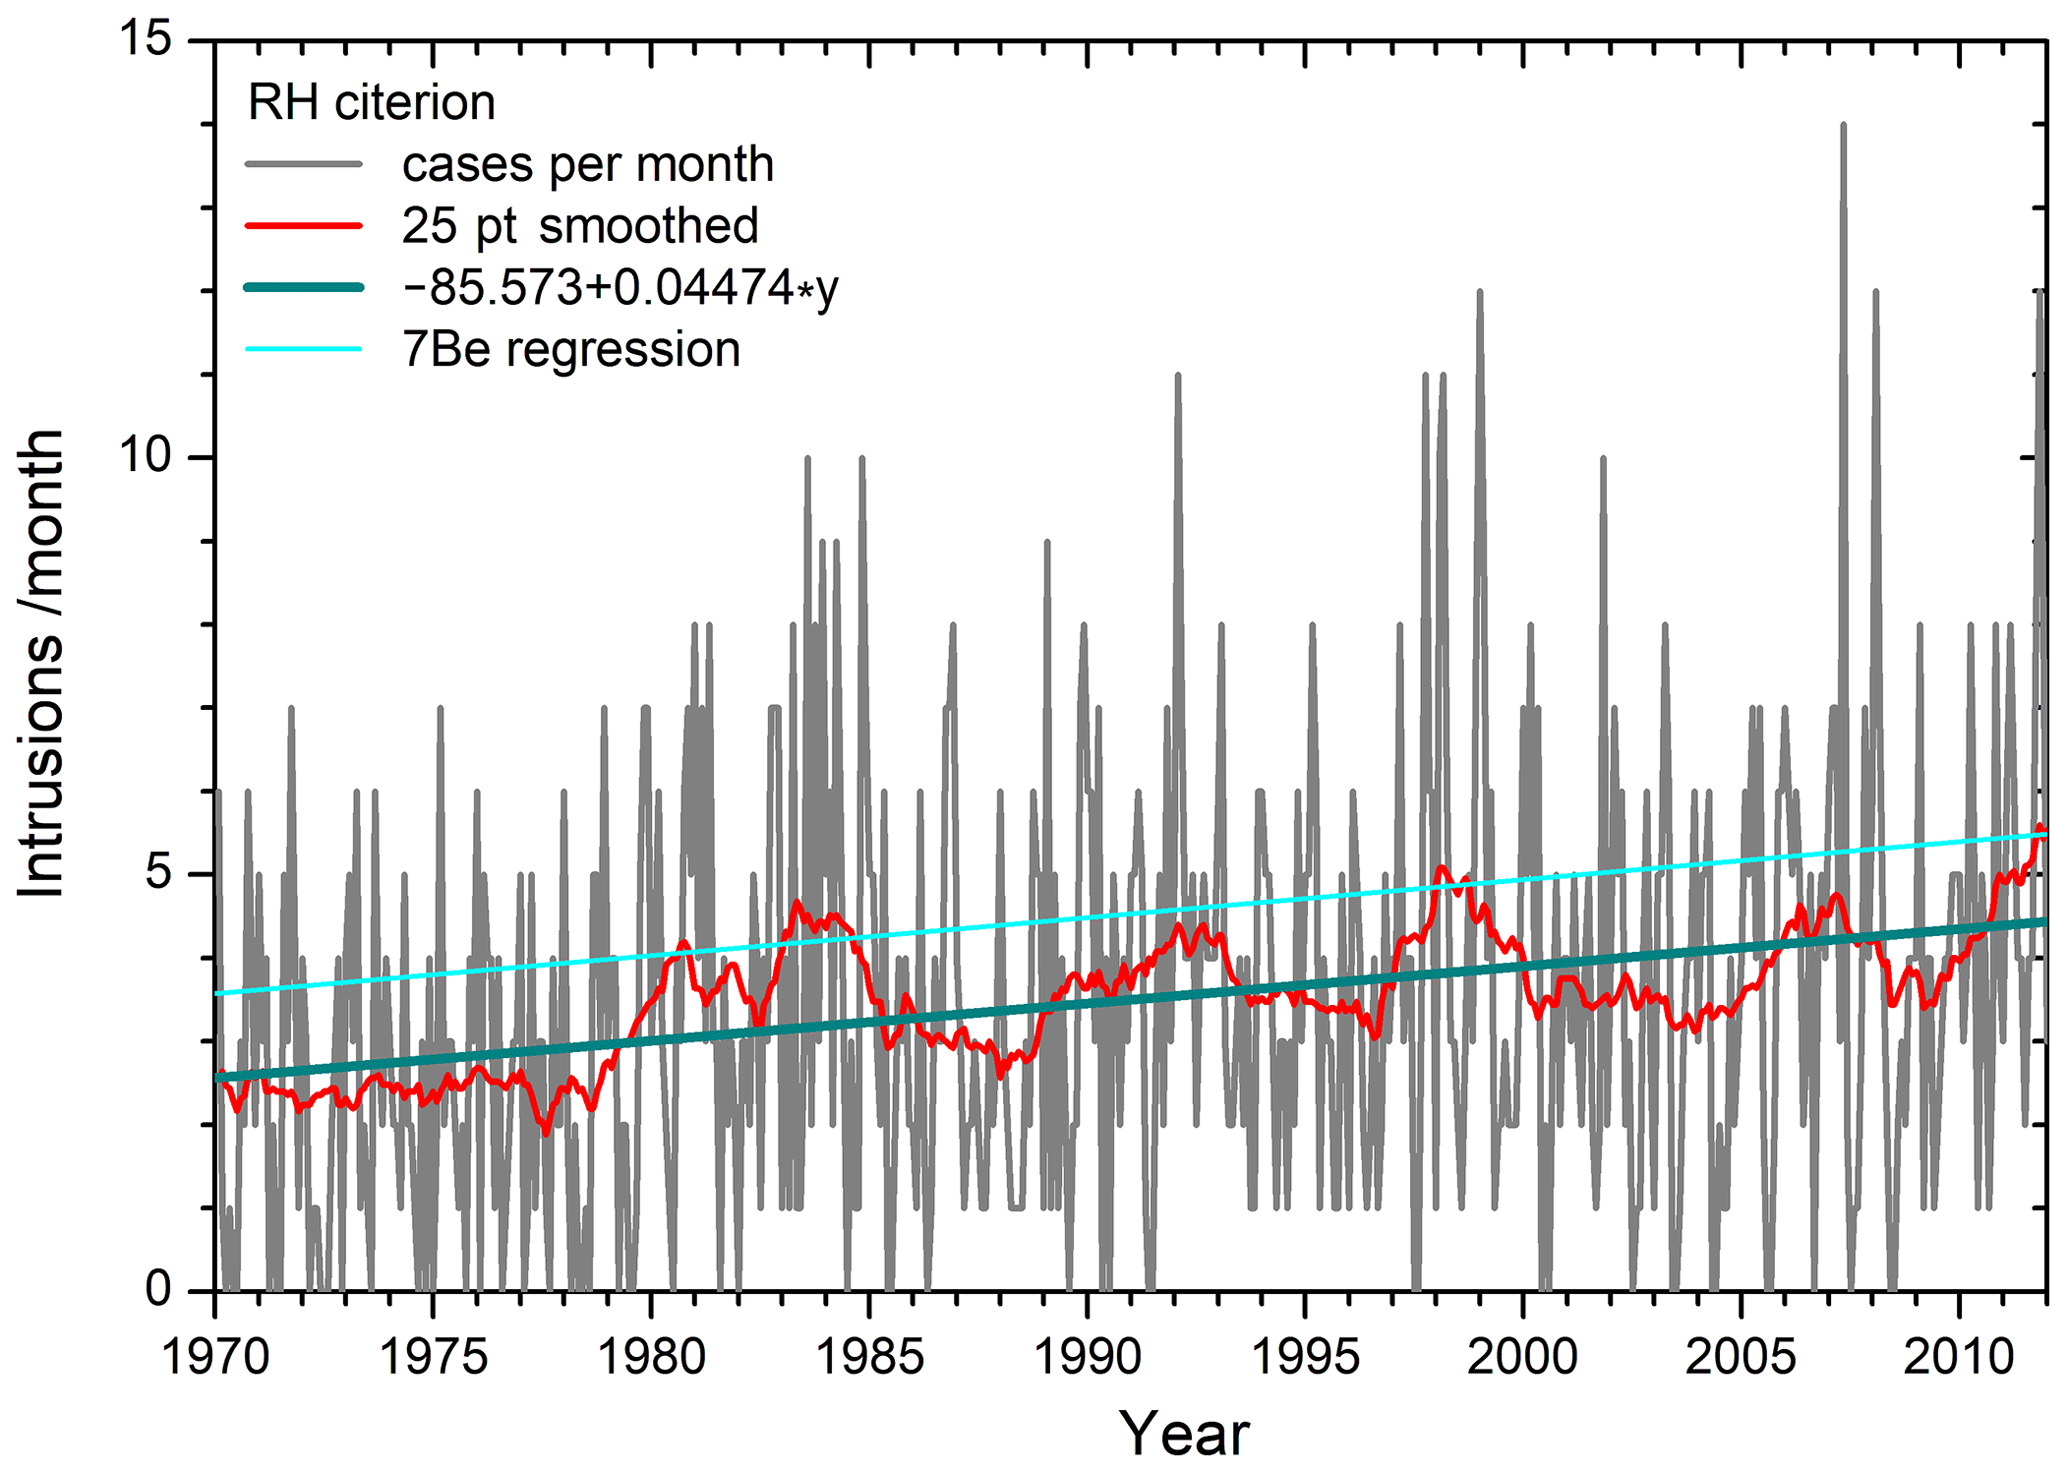
Figure 10Number of intrusions per month reaching the Zugspitze summit between 1978 and April 2006, based on the RH criterion. Short events (≤ 2 h) during which the criterion was fulfilled were discarded (see text).
5.1 Intrusion count
In a first step, we determined the monthly and annual average number of intrusions. In Fig. 9, we present the number of intrusions per month, based on the 7Be criterion (January 1970 to April 2006). We exclude short events of ≤ 2 h. A linear least-squares fit of the data yields a moderate rise in the intrusion count of 0.0456 a−1 (standard deviation 0.028 a−1). Figure 10 displays the same for the RH criterion (slope of 0.0474 a−1 ± 0.020 a−1) and the regression line for the 7Be criterion from Fig. 9. It is interesting that the slopes of the two regressions are almost equal, which is explained by the fact that most intrusion cases are the same for both criteria, at least if the minimum RH stays below 30 %. The elevated relative standard deviations are caused by the strong variability in the monthly averages that served as the input data of the least-squares fit. For the 7Be criterion, the calculated count grows from 3.57 (1970) to 5.21 (end of 2005), i.e. by 46 %. For the RH criterion, the growth is 2.56 (1970) to 4.17 (2006) and 4.44 (2012), i.e. by 63 % and 73 %, respectively.
The red curves in Figs. 9 and 10 represent the sliding ± 12-month averages, which means a single-year temporal resolution, following the definition in a VDI guideline (VDI, 1999; see Iarlori et al., 2015, Leblanc et al., 2016, and Trickl et al., 2020b, for other definitions). The residual noise is explained by the fact that the arithmetic average is not a perfect frequency filter.
As already shown for the years 2000 to 2004 by Trickl et al. (2010), there is a summer minimum and a winter maximum in the monthly intrusion count. This is verified now for the entire period of the Zugspitze measurements.
The overall result is influenced by the occasionally aperiodic behaviour of the monthly counts before 1995 and is, thus, not shown here.
The average duration of intrusions seems to be almost free of trend, which is, however, masked by variations, particularly for the RH criterion. The average duration of the intrusions for the 7Be criterion in a given year maximizes in winter (25 h ± 5 h around 1980 and 30 h ± 8 h around 2005) and stays at 12 h ± 4 h in summer. A winter maximum of the average duration with 40 to 60 h (7Be criterion) or 45 h (RH criterion) occurred between 1990 and 1995. This maximum does not appear in the corresponding annual average.
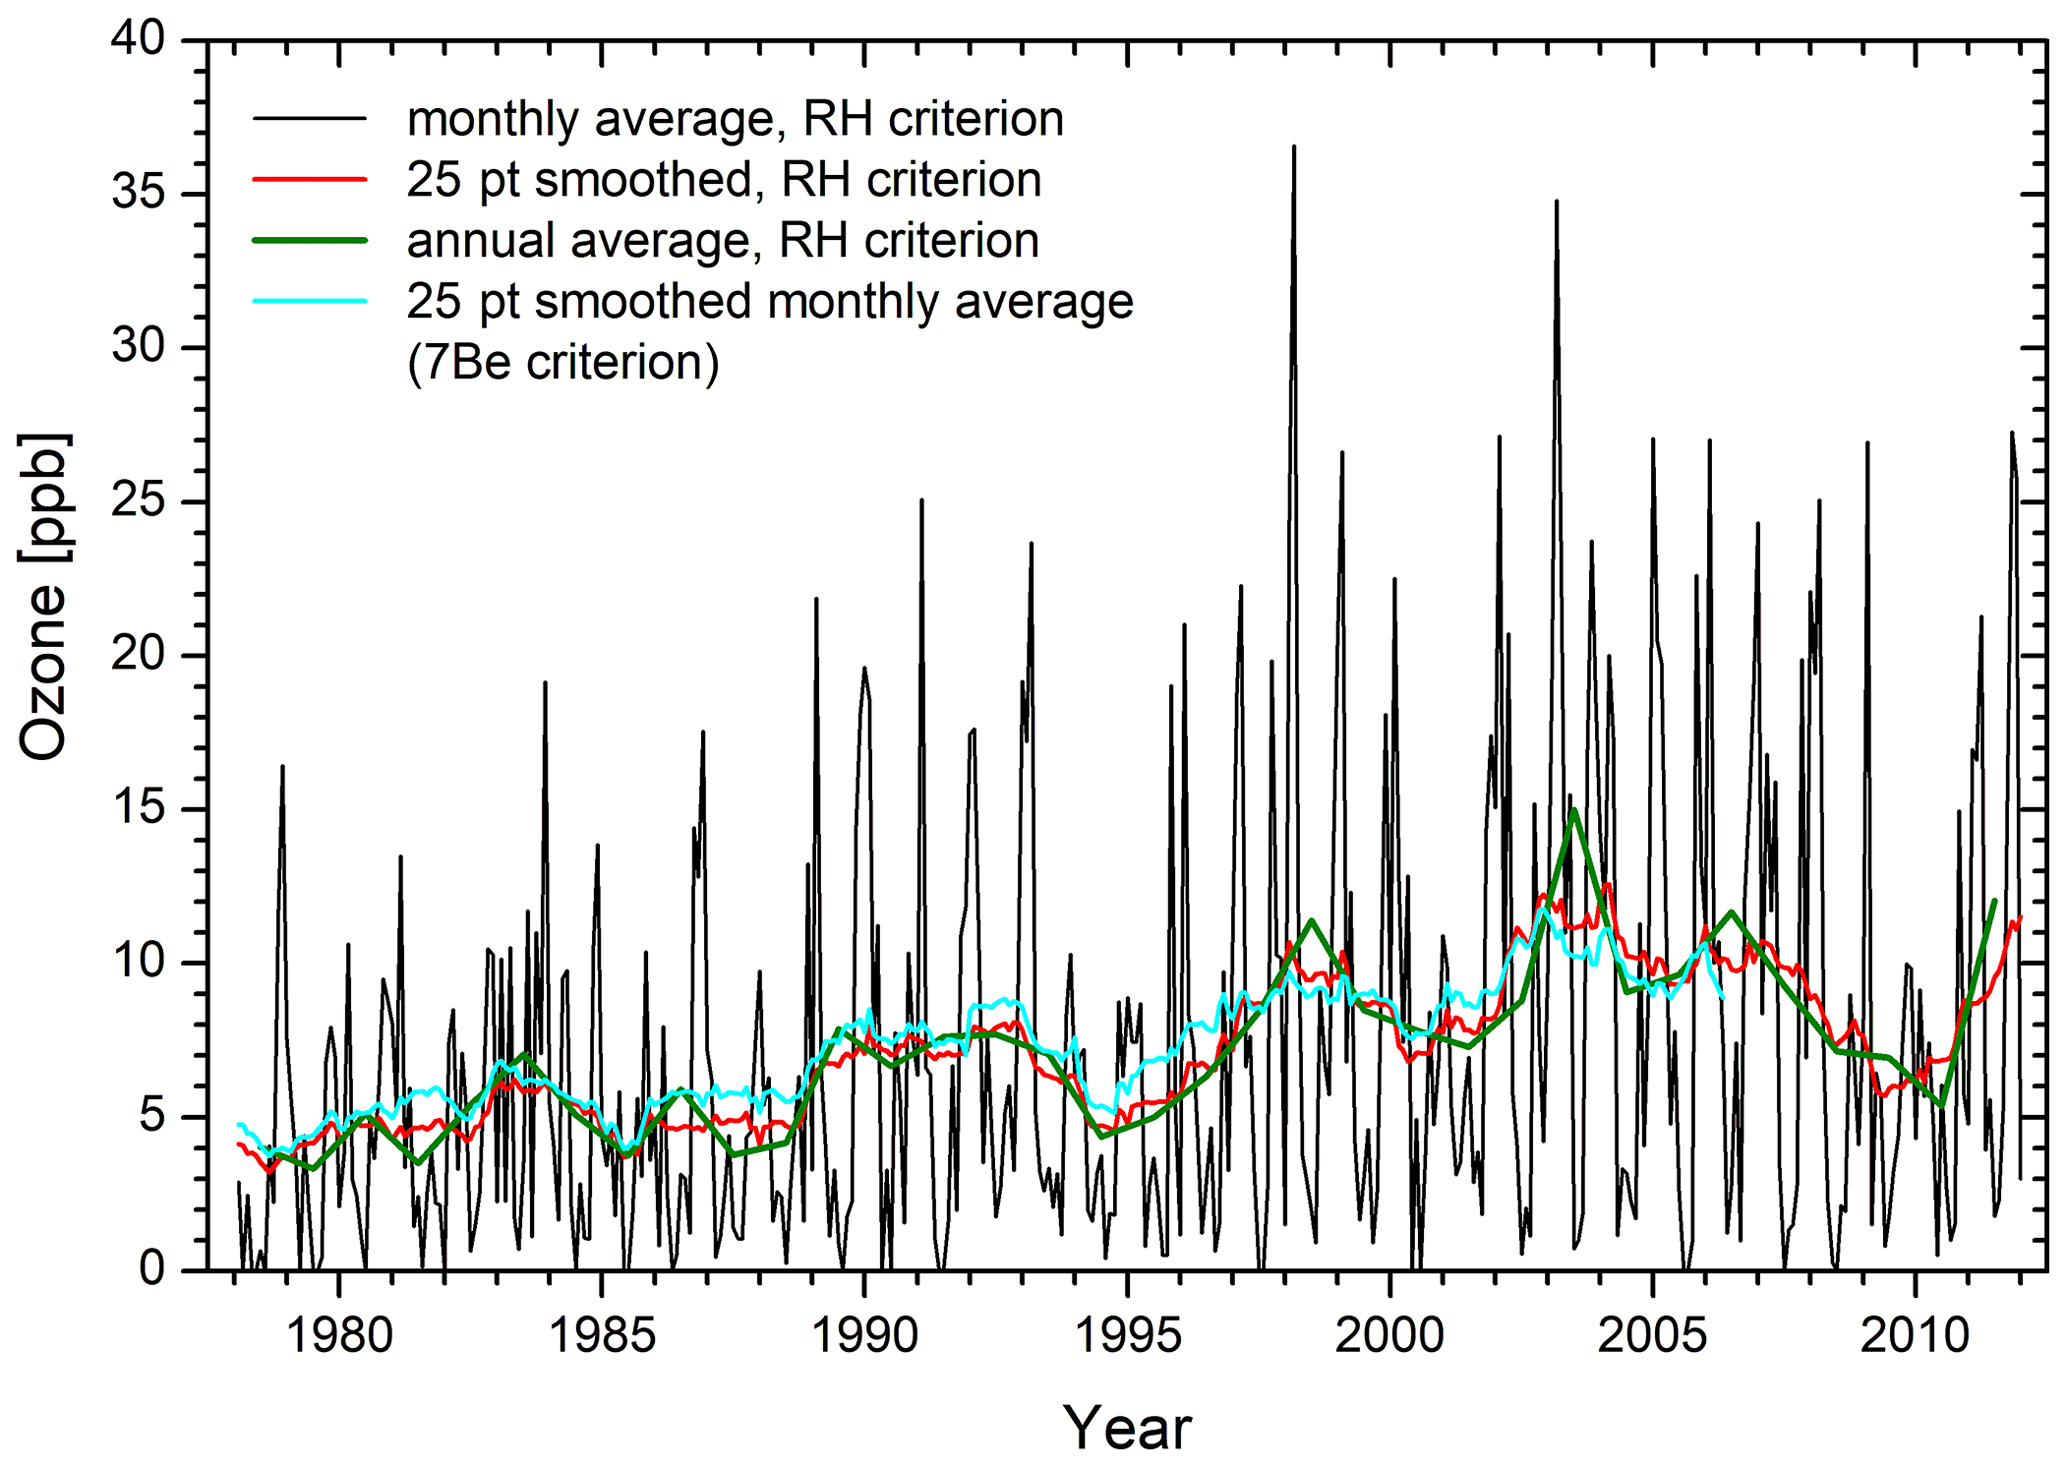
Figure 11Monthly (black) and annual (green) averages of half-hour ozone in direct intrusions for the RH criterion. In addition, running ± 12-month averages for both the RH (red) and the 7Be (1989 to 2011; cyan) criteria are given.
5.2 Ozone
In Fig. 11, we show the monthly and annual averages of ozone in direct intrusions for the RH criterion and the ± 12-month sliding arithmetic averages for both criteria. There is a pronounced positive trend of the annual peak STT ozone. The annual averages exhibit an almost periodic variation, with a period of roughly 7 years. The relative increase in the average STT ozone from 1978 to 2011 exceeds that for the intrusion count (Sect. 5.1). This means that the average amount of ozone transported in individual intrusions has also increased over the years.
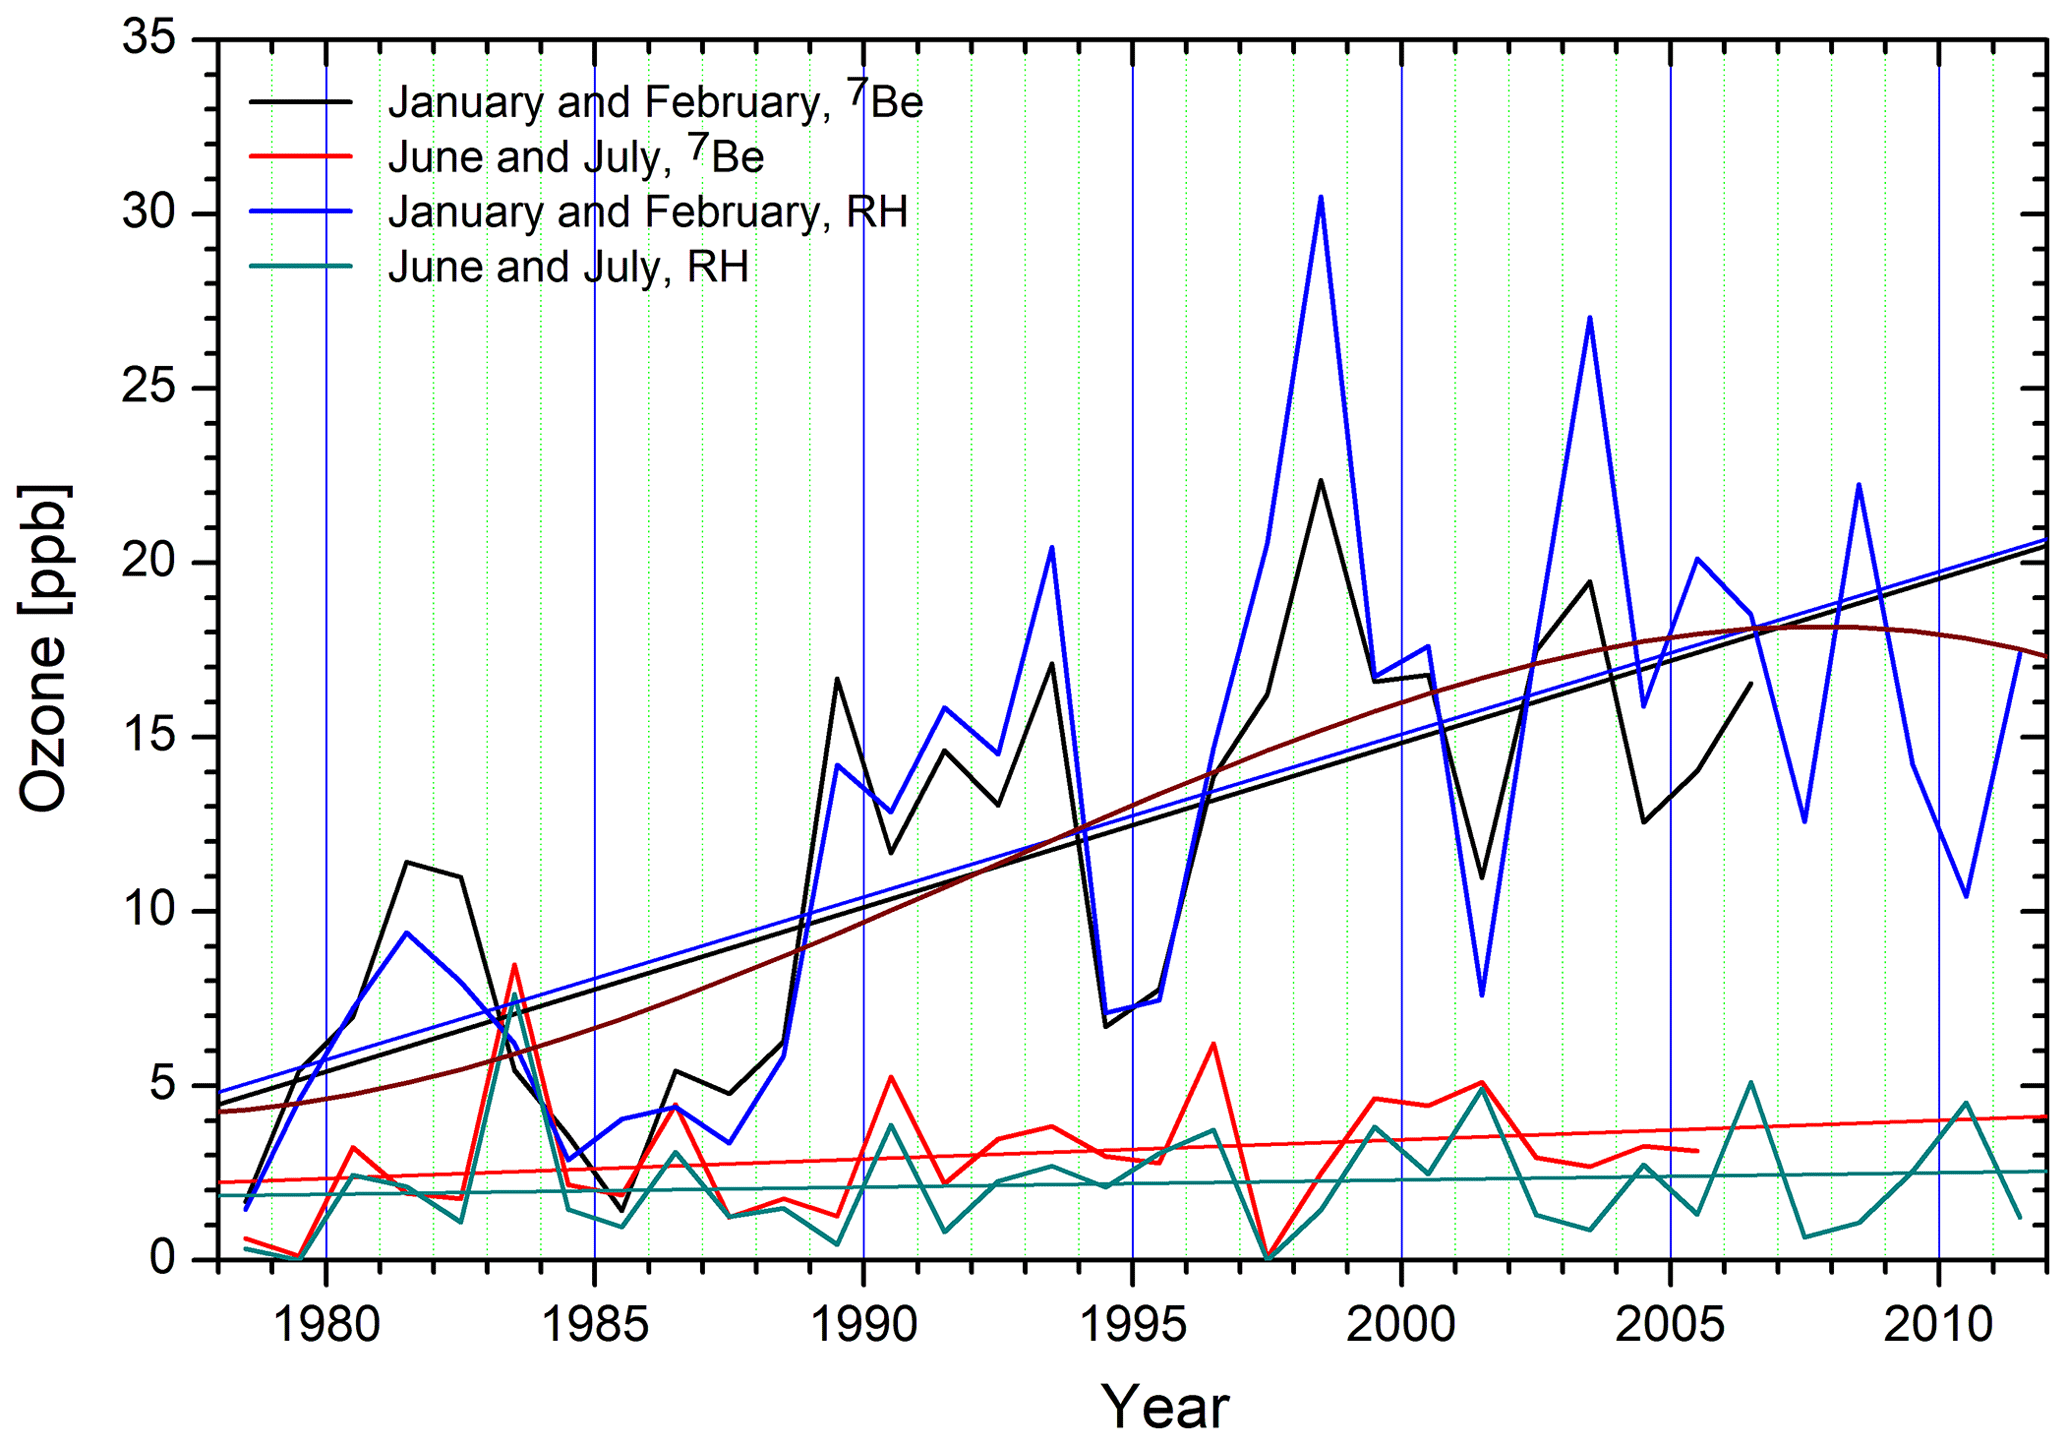
Figure 12Half-hour ozone mixing ratios in intrusions, averaged over January–February and June–July for the two filtering criteria. The results for linear regressions are shown as straight lines, using the same colour as for the values obtained from the analyses, and a curved line for a third-order polynomial fitted to the winter data for the RH criterion in dark red. The yearly scale was shifted by 0.5 years to centre the annual averages in the middle of a given year.
The seasonal cycle of the monthly averages is somewhat clearer in its structure. This allows us to present the ozone averages in the direct intrusions for January–February and June–July in Fig. 12. The winter maxima for the two filtering criteria do not differ by too much. However, the summer minima for the 7Be are higher by roughly 50 % than those for the RH criterion, due to the wet bias for low RH. The equations for the four regression lines are (in ppb) as follows:
y is the year, and the numbers in parentheses are the respective standard deviations. In order to guide the eyes, we also fitted a third-order polynomial to the winter data for the RH criterion. The four parameters are as follows:
The relative standard deviations of the four parameters are as high as about 0.45 each. This reflects the strong year-to-year variability in the data.
It is obvious that the increase in the STT ozone mostly took place during the cold season. This observation will be further discussed in Sect. 6. The new analysis for the second half of the 1990s exceeds, during the cold season, the values of the FLEXPART analysis for the years 1995 to 1999, as presented by Trickl et al. (2010) in their Fig. 1. We tentatively ascribe this fact to the excessive mixing scheme in the model (Trickl et al., 2014).
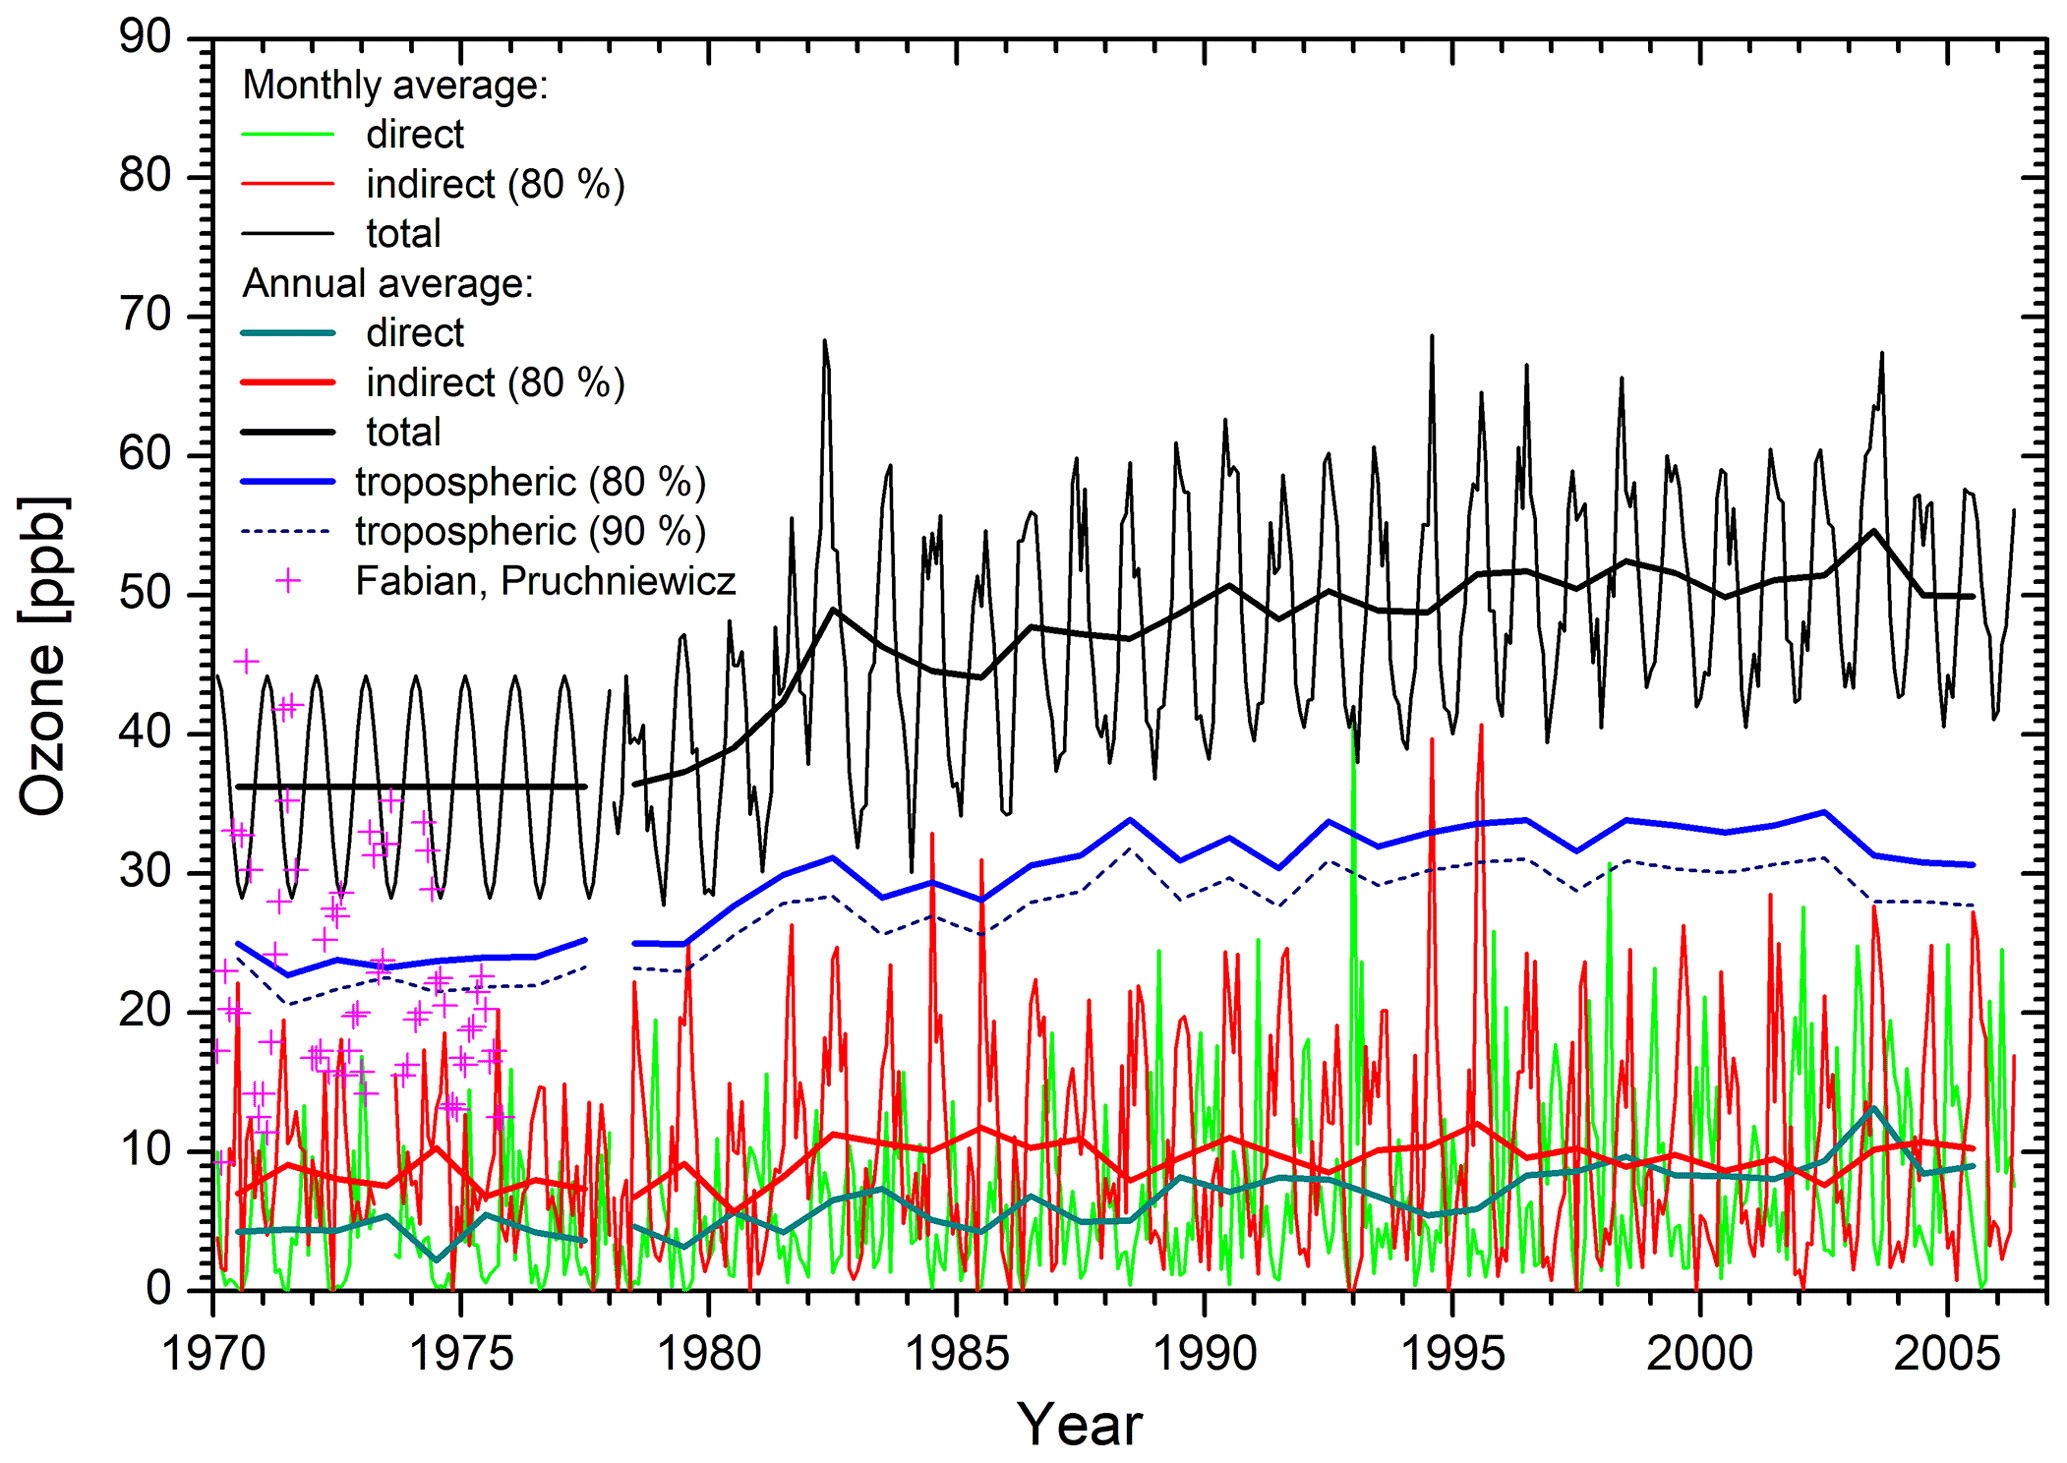
Figure 13Monthly and annual averages of ozone mixing ratios obtained for the 7Be criterion. For the period before 1978, we assume a constant mixing ratio of 36.25 ppb that matches the 1978 annual ozone average. The different curves are explained in the text.
Although high-accuracy ozone data do not exist before 1978, we attempted to estimate the situation back to 1970 by assuming a constant average ozone mixing ratio (Fig. 13). This assumption is justified by the results for the nearby Hohenpeißenberg (distance of about 41 km) sonde measurements for 1970 to 1977, as evaluated by Claude et al. (2001), for 700 mbar (about 3000 m). Claude et al. (2001) published an almost-constant average mixing ratio, which justifies our choice. However, the Hohenpeißenberg mixing ratio before 1978 is about 41 ppb. This value is higher than expected from the extrapolation of the Zugspitze measurements to earlier years, which is estimated to be 36.25 ppb.
As mentioned in the Introduction, the measurements of Fabian and Pruchniewicz (1977) yield somewhat low ozone mixing ratios. In Fig. 13, we display the monthly mean values for 1970 to 1975, which have been graphically reconstructed from their Fig. 5 as crosses.
Table 1Annual ozone averages for Zugspitze and UFS (ppb). The asterisks denote the total ozone values estimated from extrapolation.
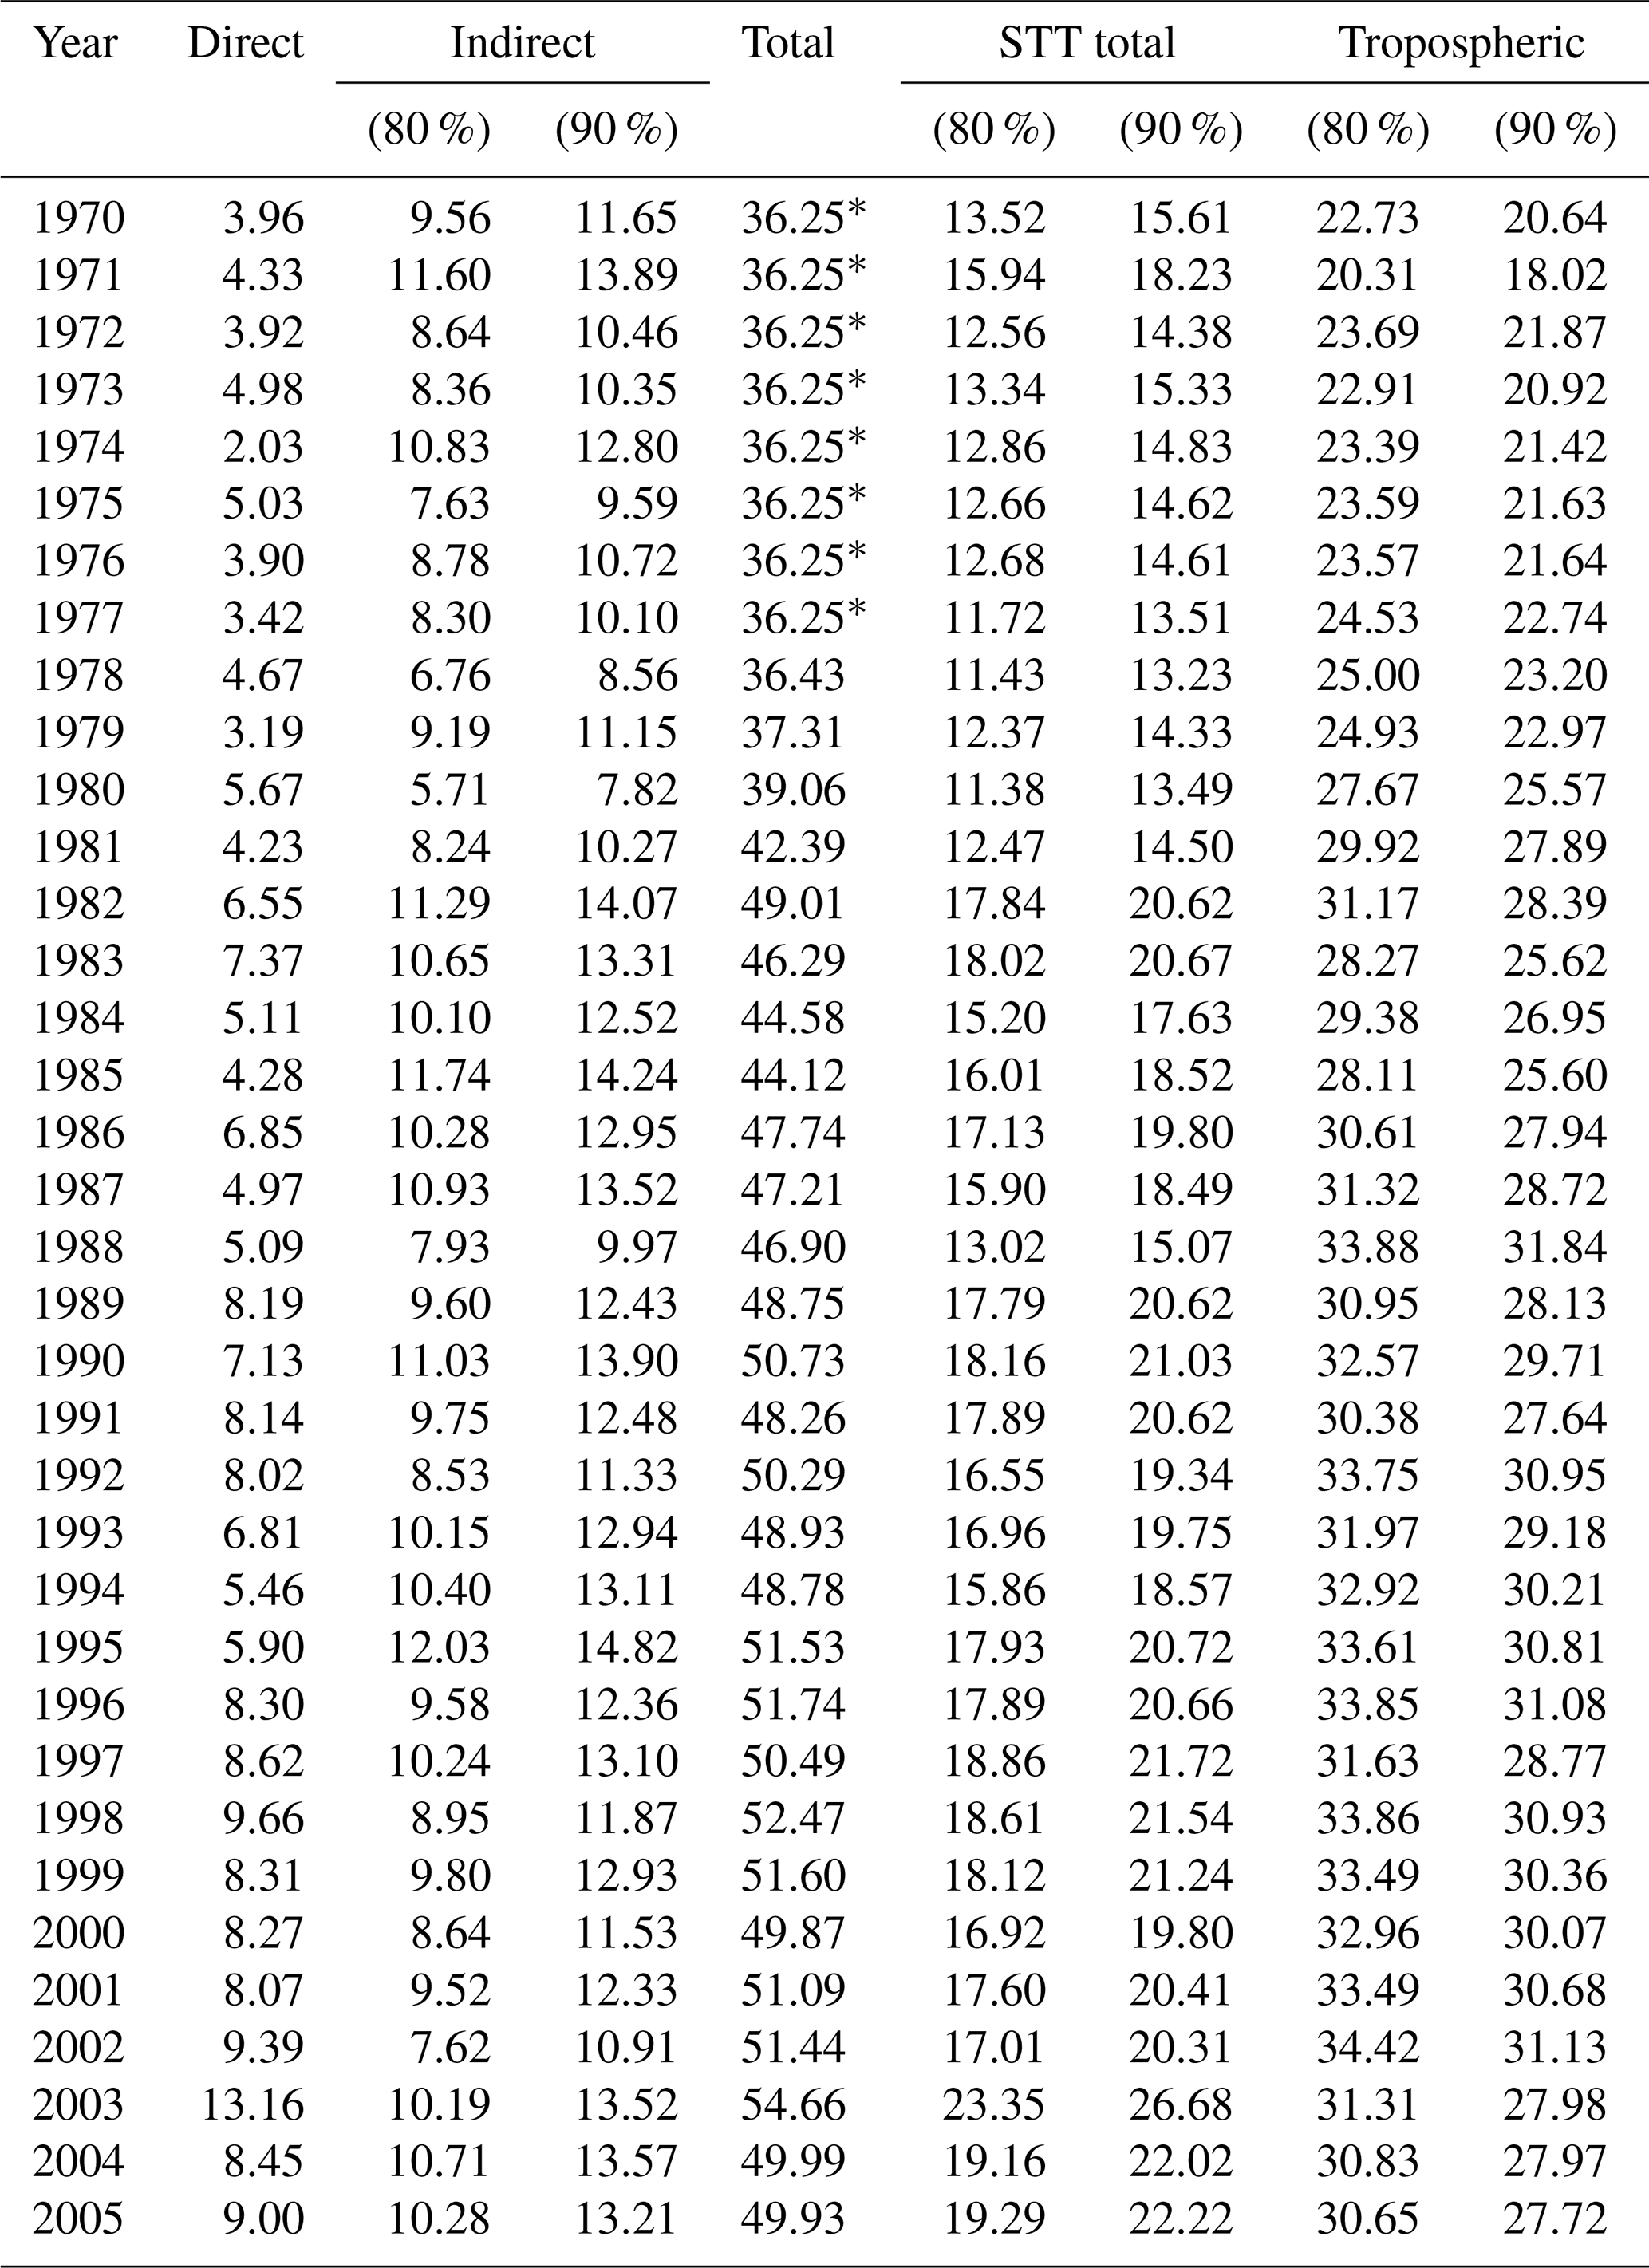
Figures 13 (monthly averages plus a few ± 12-month averages) and 14 (annual averages for all quantities) also show the curves for the indirect stratospheric contribution, calculated with Eq. (2), for assuming 80 % and 90 % of the 7Be being produced in the stratosphere. The annual averages are listed in Table 1. The values for the total STT ozone confirm the analysis by Scheel in 2005 rather well (Fig. 1 in Trickl et al., 2020a), considering that Scheel assumed a stratospheric contribution of just 66.7 % (i.e. the global average). The overall stratospheric contribution derived now is 12 or 14 ppb for the 1970s and 19 or 24 ppb around 2005 for the 80 % or 90 % threshold, respectively. The series for the direct intrusions in the 1970s can be nicely extended for the years after 1978. The rise of 7Be in the early 1970s is not reproduced by the STT ozone. The difference in the total ozone mixing ratio and the stratospheric contributions is an estimate of the tropospheric burden. Most importantly, the tropospheric contribution, calculated as the difference in the full annual average mixing ratio and the estimated total stratospheric contribution, does not exhibit a positive trend after 1990, which is the period of improving air quality. In any case, the ozone trend after 1990 is not negative as one could expect from the reduction in European emissions (see the Introduction and Sect. 5.3).
Despite the good performance of the results for the direct intrusions before 1978, the analysis of the indirect stratospheric contributions required a slight adjustment. The analysis showed that the influence of the seasonal cycle cannot be neglected when estimating the indirect stratospheric contribution. We, thus, added an artificial sinusoidal seasonal cycle with an amplitude of 8 ppb (Fig. 13). We realized that the “indirect” values for 1970 and 1971 were 2 to 3 ppb higher than those obtained from a sliding 12-month average for these 2 years. Therefore, we corrected for this bias and also modified the unrealistic calibration factor that did not agree with the (rather constant) factor for 1978 to 2006.
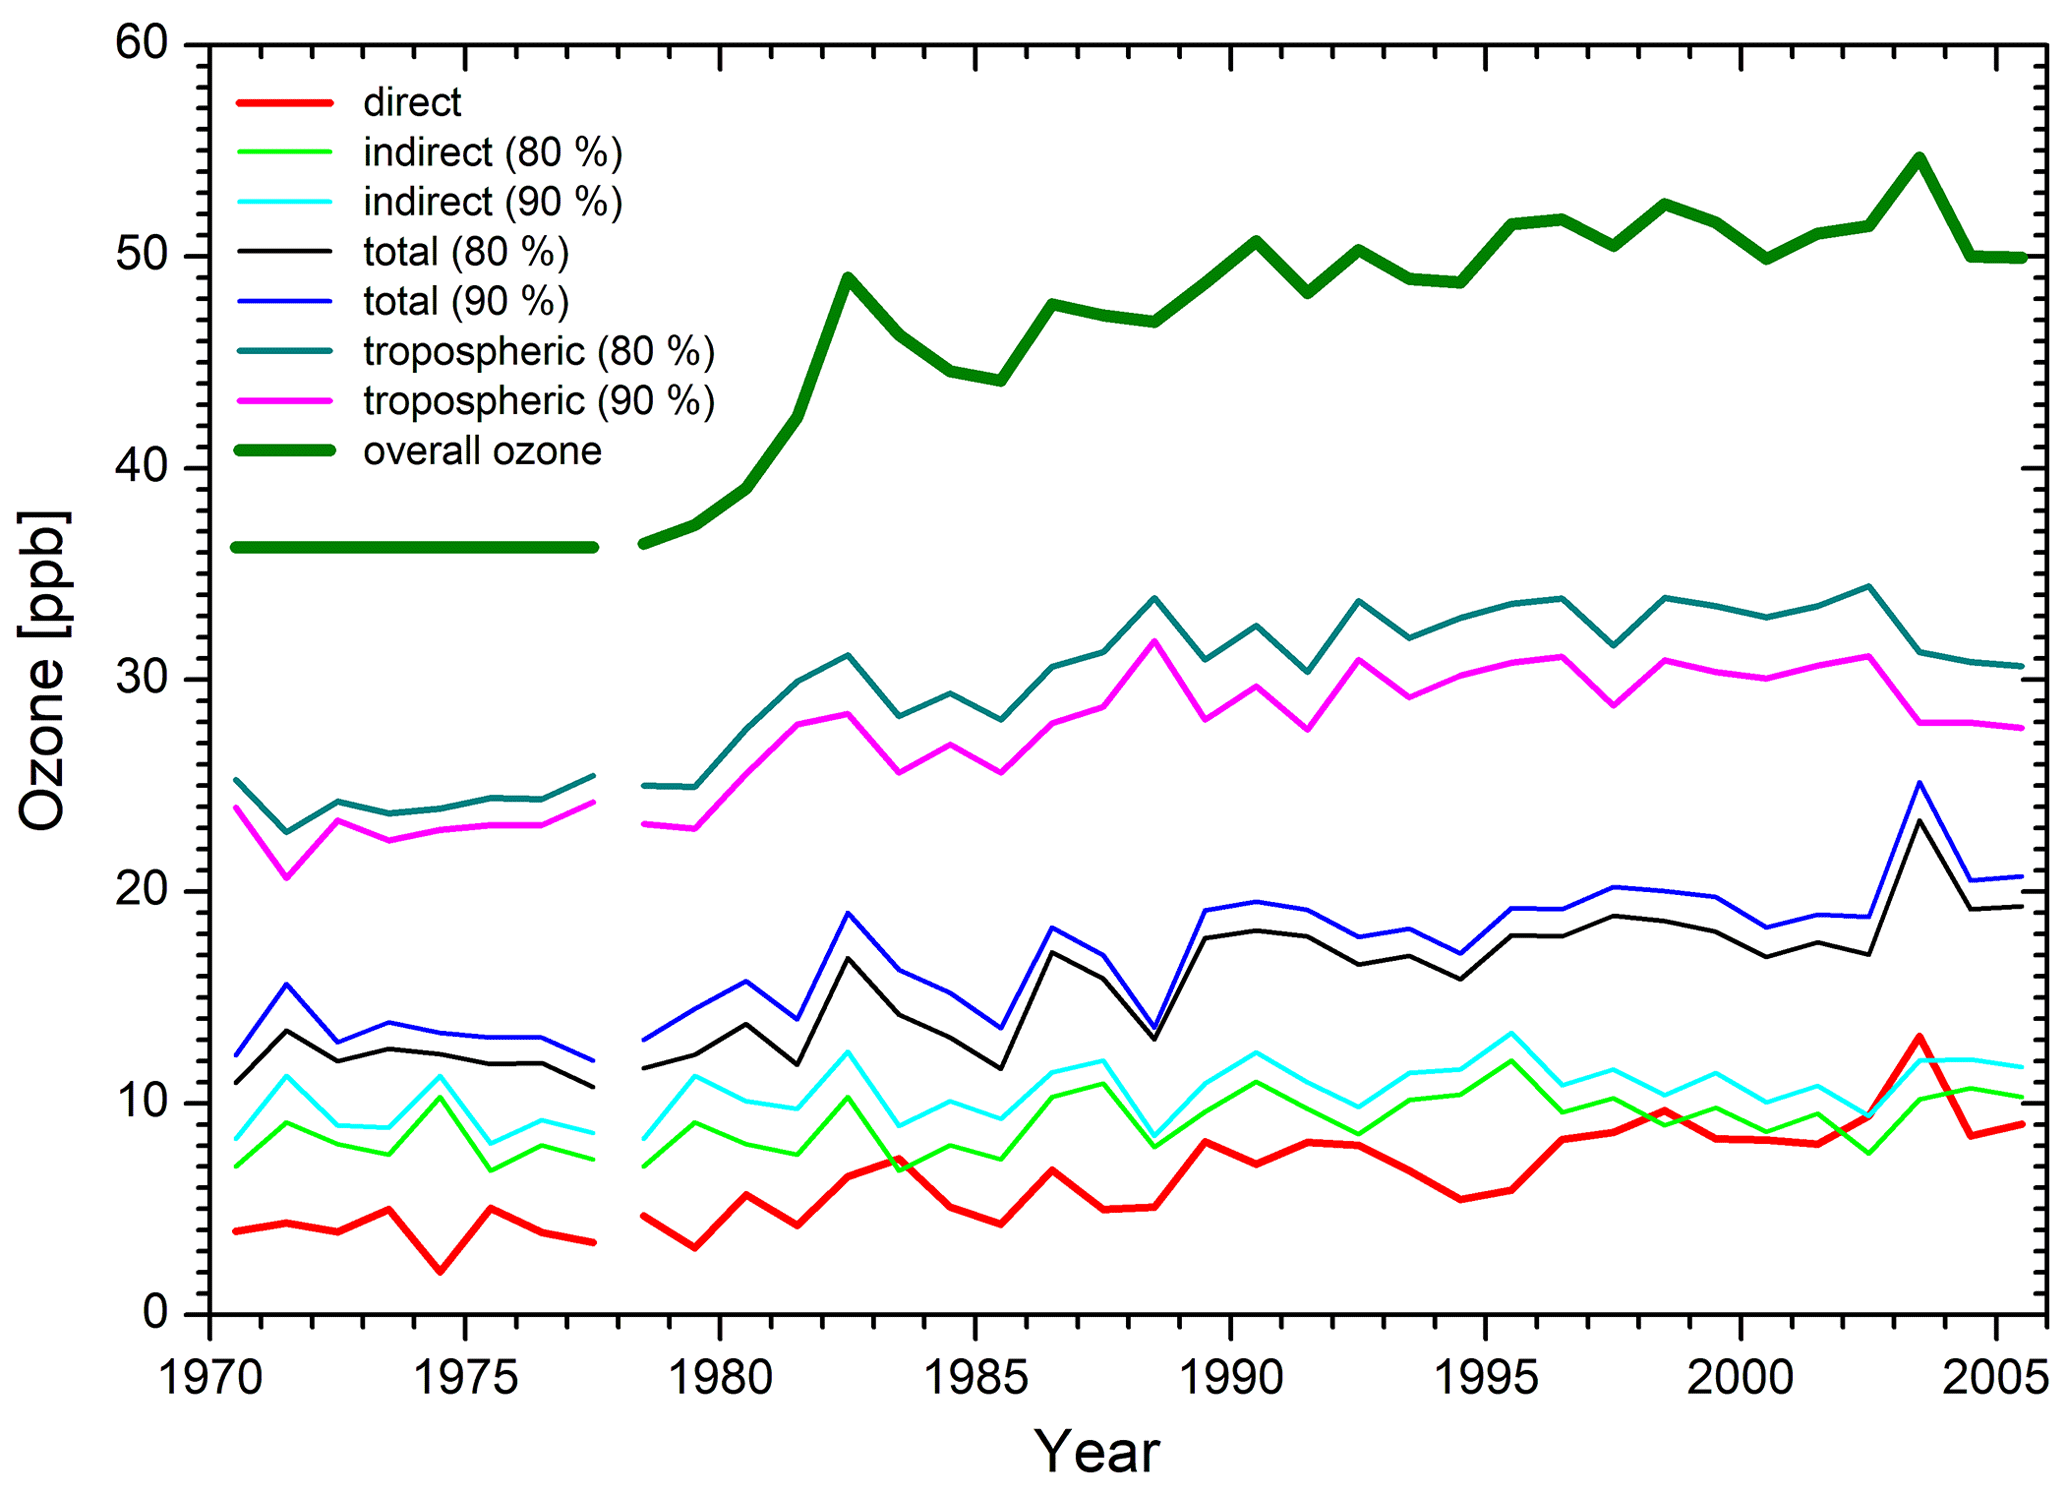
Figure 14Annual averages of ozone mixing ratios in intrusions identified with the 7Be criterion. For the period before 1978, we assume a constant annual average mixing ratio of 36.25 ppb modulated monthly, as shown in Fig. 16. The ratio of 36.25 ppb approximately matches the 1978 annual ozone average. The different curves are explained in the text.
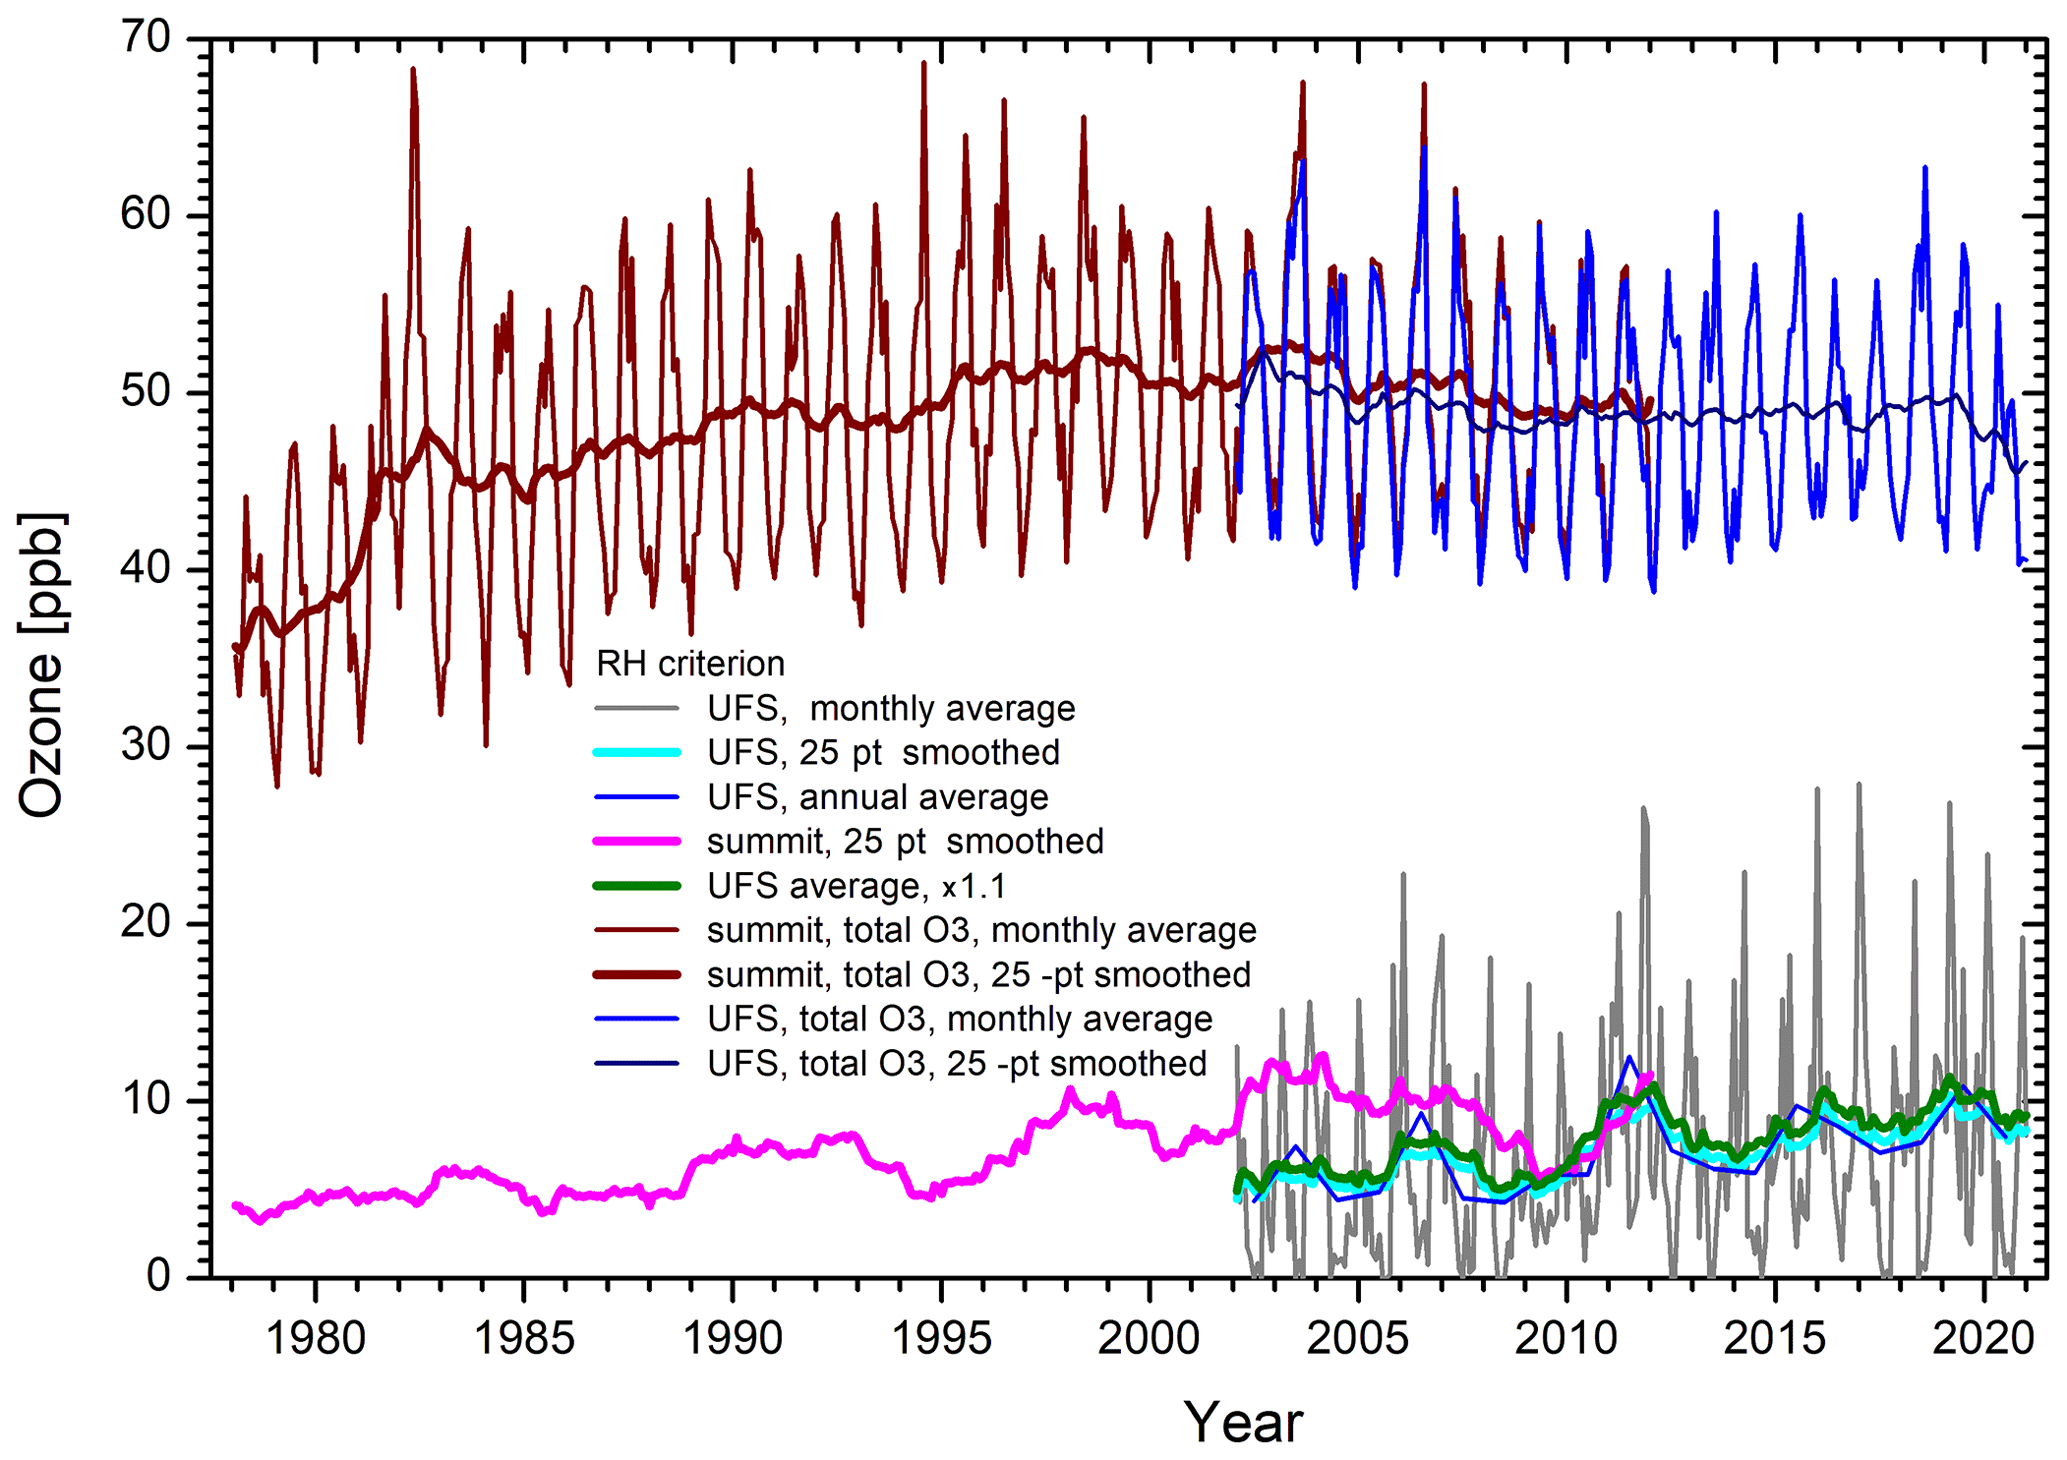
Figure 15Monthly averages of UFS half-hour ozone mixing ratio in direct intrusions (dark grey) and sliding ± 12-month averages (cyan and magenta, respectively) for both the UFS and summit from 1978 to 2020 for the RH criterion. The smoothed UFS values are also shown (multiplied by 1.1; dark green) to improve the agreement with the summit between 2009 and the end of 2011. In addition, we show the monthly ozone average for the summit (dark red) and UFS (blue), which is also smoothed over ± 12 months (25 pt; dark red and dark blue, respectively).
In order to extend the analysis beyond 2005 or 2011, respectively, we filtered the UFS values. No 7Be measurements have been performed at UFS. Here, we just apply the RH criterion. In Fig. 15, we present the results for direct intrusions for the years 2002 to 2020. We also include the smoothed 1978–2011 results for the summit. There is an obvious difference between the two stations between 2002 and 2008. This difference is that it looks rather high with regard to the small altitude difference of only 0.3 km. We found that the RH percentiles are comparatively high during that period (Sect. 3.4) and concluded that there were problems with the RH measurements of the DWD at UFS during the early phase. This could explain the low ozone mixing ratios for direct STT before 2009.
We multiply the UFS average by 1.1 to improve the agreement between UFS and the summit between 2009 and 2011 (dark green curve in Fig. 15). It is obvious that the increase in the stratospheric influence on the Zugspitze ozone came to an end at around 2003. The slightly negative trend in Fig. 1 during the first decade of the new millennium is confirmed, but it comes to an end in 2010. Apart from oscillations in the ozone from direct intrusions, the contribution from direct STT stays rather constant between 2005 and 2020.
The monthly averages of the measurements at both the summit and UFS, together with the sliding ± 12-month averages, are also displayed in Fig. 15. The UFS ozone values are slightly lower than those obtained at the summit. Scheel and Ries determined an average difference from April 2002 to June 2008 of 0.82 ppb (Fig. 1 in Zellweger et al., 2011). The difference is almost outside the combined uncertainty level for both sides. It is reasonable to conclude that this difference is caused by a lower stratospheric influence at UFS.
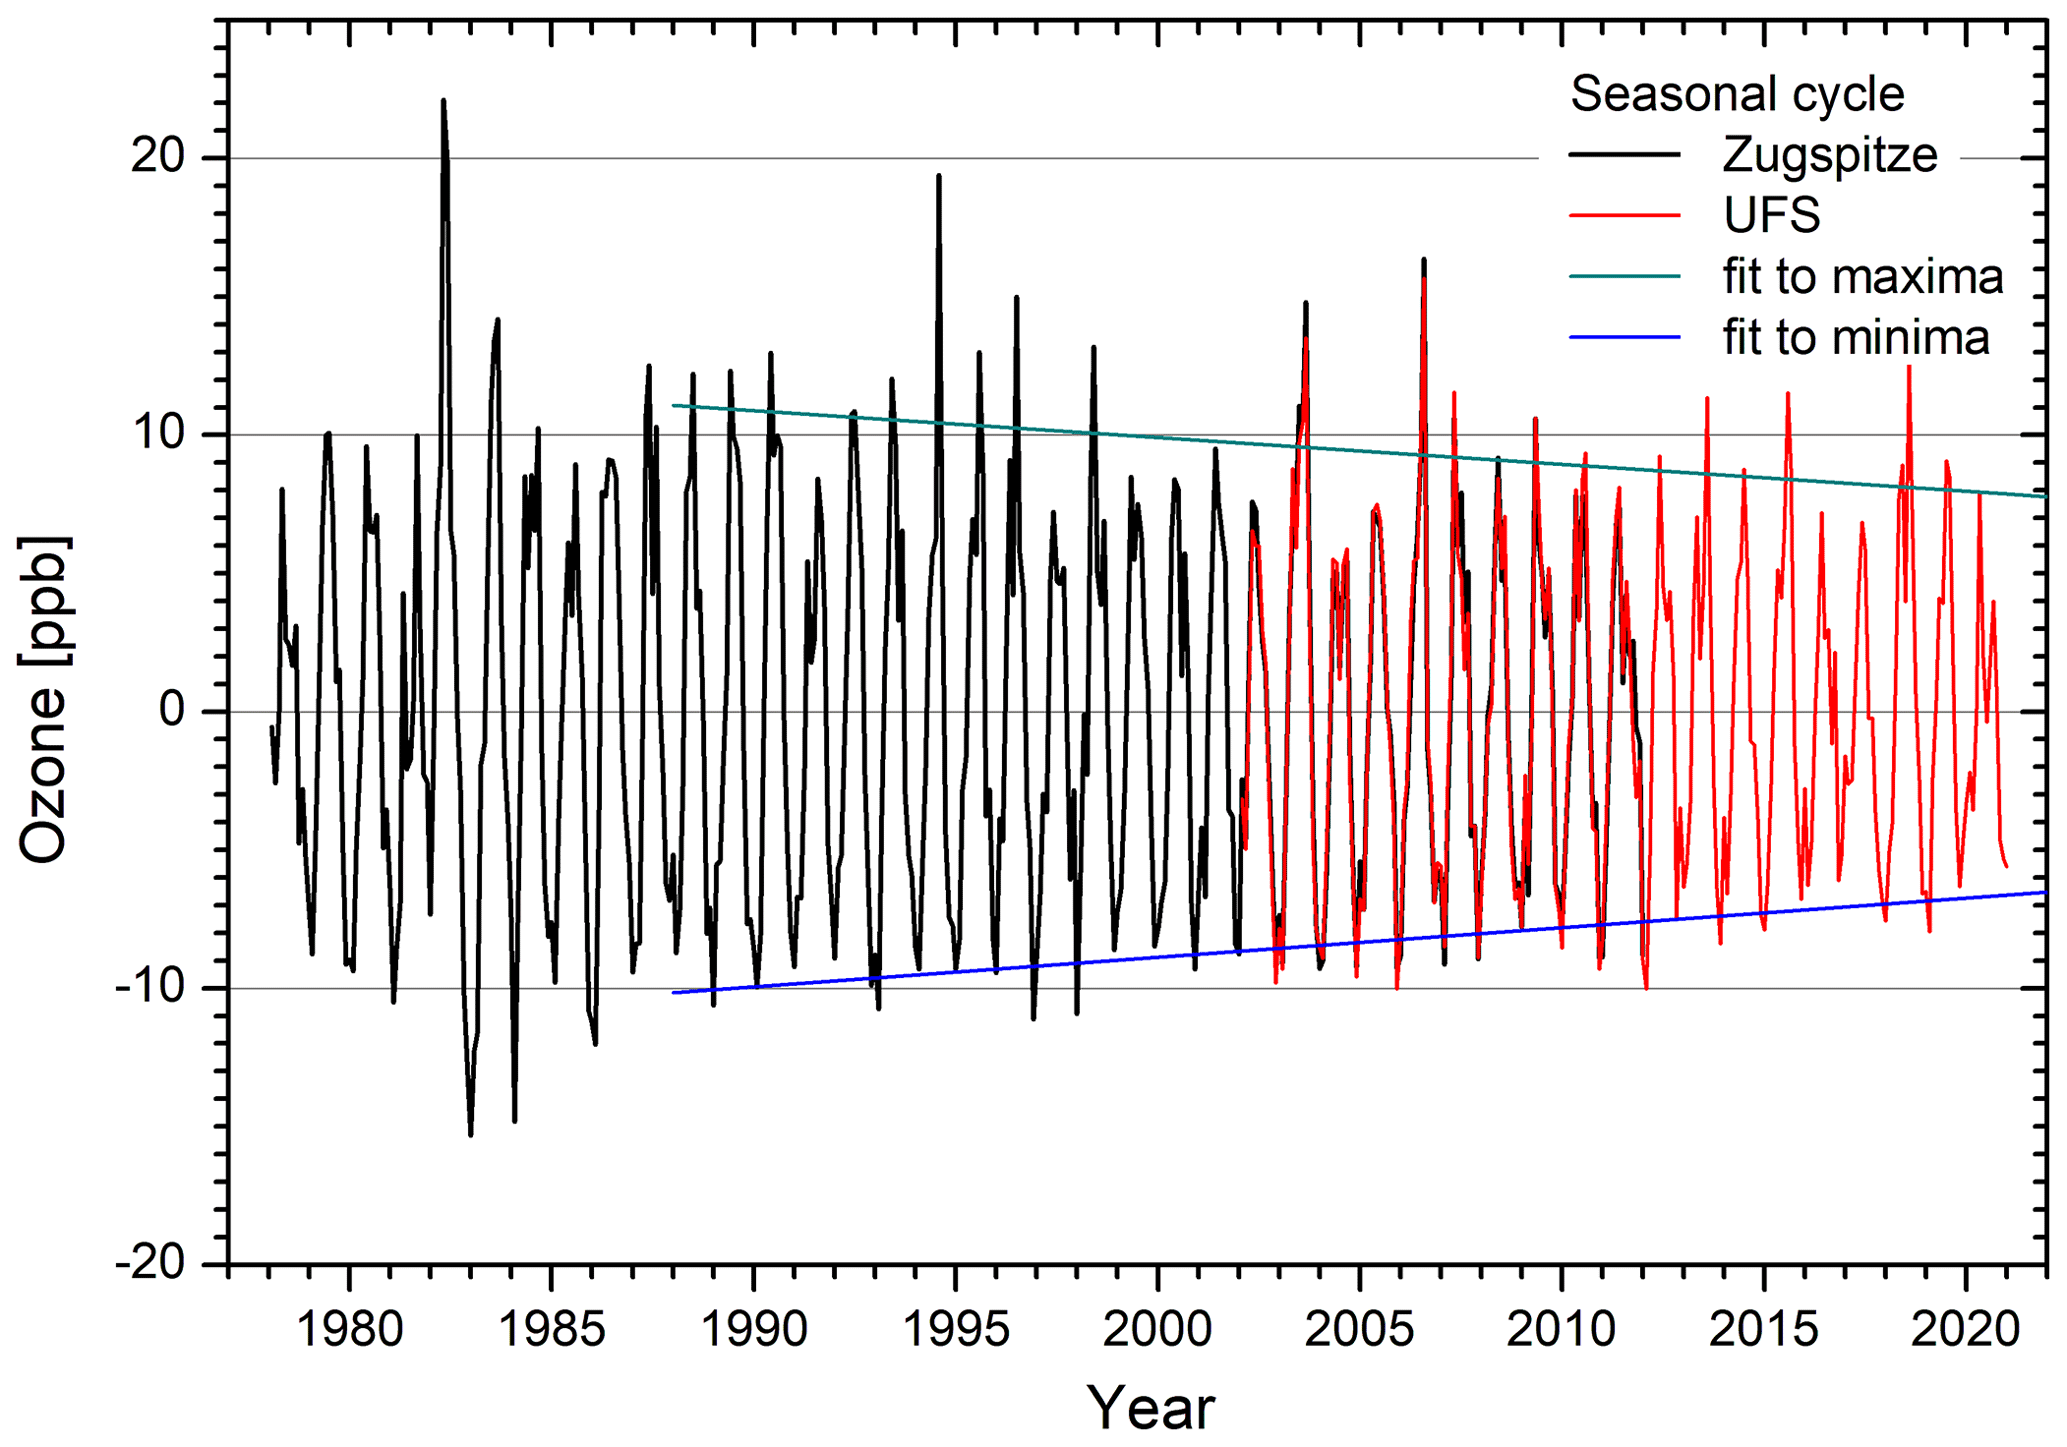
Figure 16Seasonal cycles of the monthly averages of the half-hour ozone mixing ratios for Zugspitze and UFS. The ± 12-month averages are subtracted. The linear least-squares fits for the seasonal maxima and minima are shown (1988 to 2020).
In Fig. 16, we evaluate the amplitude of the seasonal cycle of the overall Zugspitze ozone. The ±12-month averages were subtracted from the monthly averages. There has been an obvious decrease in the amplitude of the seasonal cycle since the late 1980s. We applied linear least-squares fits to the annual maxima and minima, which resulted in the following:
Again, y is the year, and the number in parentheses is the standard deviation. In order to obtain a reasonable result, we enhanced the a priori error bars of a few obvious outliers in the input data (such as the dry summer of 2003). For the period 1988 to 2021, we obtain a relative amplitude decrease by 29 % and 35 %, respectively. This means a considerable reduction in the air pollution at this near-background site.
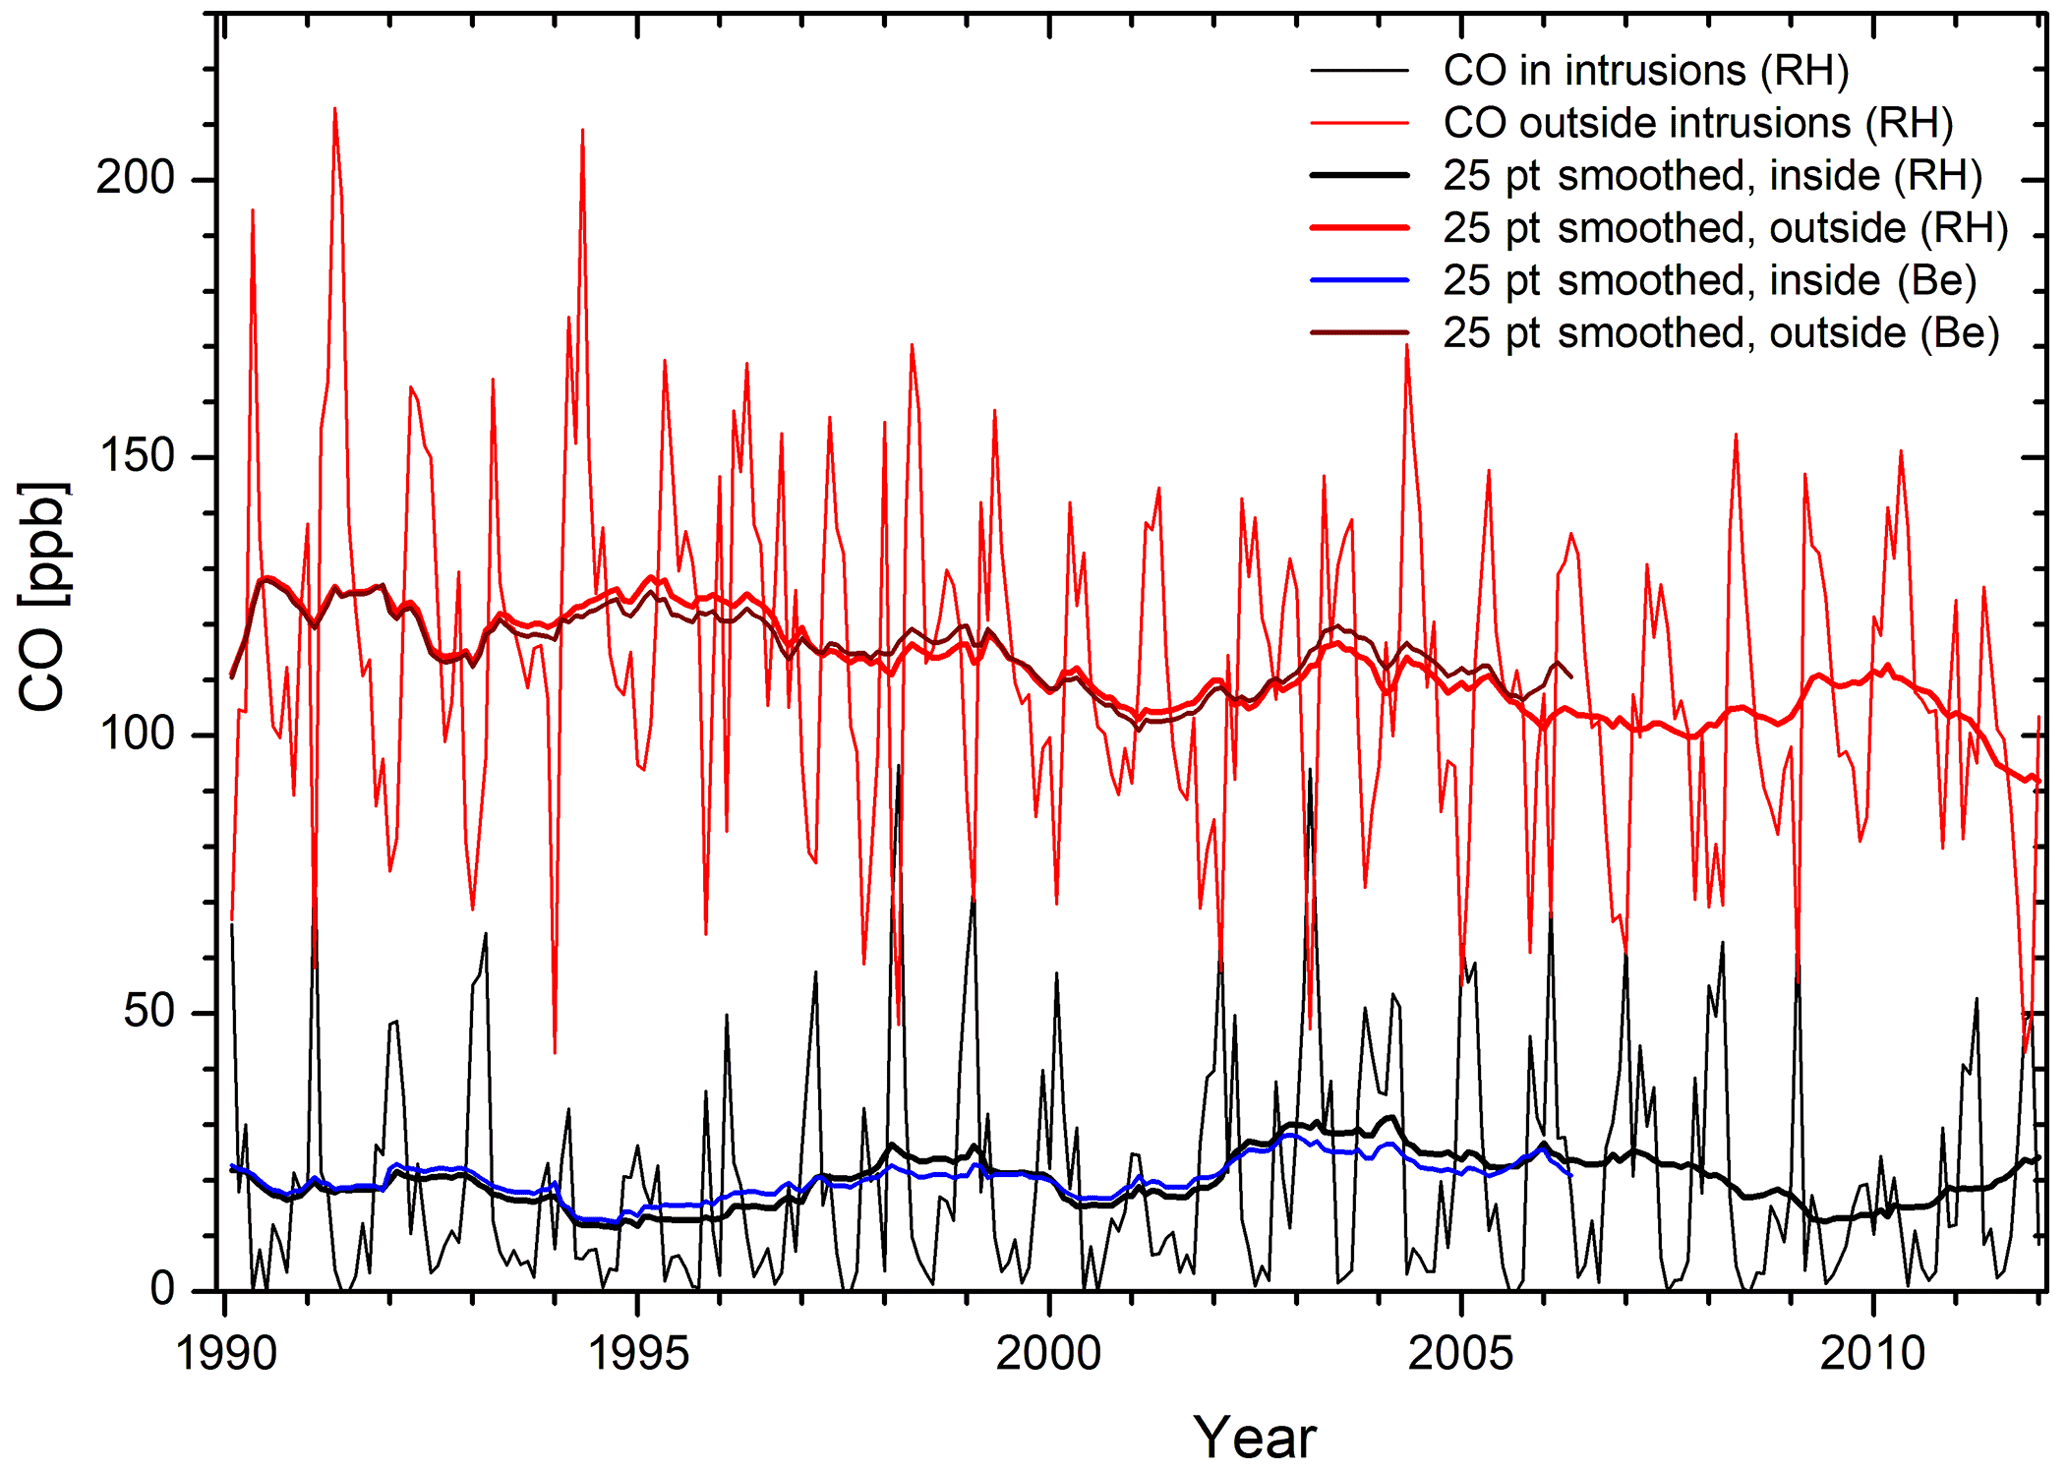
Figure 17Averaged half-hour Zugspitze CO mixing ratios for the months from 1990 to 2011, based on filtering with the RH criterion; in addition, the curves for applying a sliding ± 12-month averages are shown for both the RH and 7Be criteria. The curves for the smoothed data are unrealistically bent during the first months of 1990, due to local extrema.
5.3 Carbon monoxide
Trickl et al. (2014) show, in their Fig. 17, the behaviour of the annual average of Zugspitze carbon monoxide for air inside and outside the intrusion layers. The analysis was now repeated for the modified filtering criteria. Figure 17 shows the results for the RH criterion for 1990 to 2011; here the average monthly contributions are seen. In addition, we include the ± 12-bin sliding averages for both criteria. The slightly positive trend obtained by Scheel (Trickl et al., 2014) for CO in the direct intrusions is confirmed in the revised analysis. This becomes obvious if one connects the maxima or the minima (respectively) of the smoothed curves. Also, the negative trend for the complementary data is confirmed. From 1990 to 2011, the averaged CO outside direct intrusions dropped from about 127 to about 93 ppb. During the early 1990s, the amplitude of the seasonal cycle was clearly higher than later on, which is in agreement with the reduction in the European air pollution during that decade.
We also analysed the UFS CO data in the same way. Since the CO data are preliminary for some years, we do not show the results here. For the time being, we slightly renormalized the UFS data with the summit CO. The decrease in the averaged corrected complementary mixing ratios (not fully tropospheric) intensifies after 2011. By the end of 2020, a roughly estimated value of 72 ppb was reached (i.e. 56 % of the highest value in 1990). This means that there has been a substantial improvement in the tropospheric air quality.
In contrast, the monthly mean CO attributed to direct intrusions stays rather constant after 2011, at about 17 ppb. Thus, the slight rise seen in the summit data from 1990 to about 2005 does not continue, which is similar to the behaviour found for ozone. As stated earlier (Trickl et al., 2014), we speculate that there is an Asian contribution in the tropopause region that is being fed by the frequent offshore warm conveyor belts over the western Pacific (Stohl, 2001). This contribution could lead to a growth of carbon monoxide (or at least prevent a strong decrease). In addition, the roles of biomass burning (e.g. Fromm et al., 2010) or air traffic must be considered.
A quantification of the stratospheric contribution to the tropospheric ozone continues to be a demanding task. Although modelling efforts have made significant progress (Archibald et al., 2020, and references therein), an approach based on observational data or a combination of both is desirable. However, long-term measurements of specific quantities that allow a determination of the influence of intrusions mixed with tropospheric air such as 7Be are limited to just a few stations. We present here the analysis for the Zugspitze summit in the northern Alps, where 7Be measurements have been made since 1970. Despite remaining uncertainties, we can conclude that the contribution of STT to the ozone in the lower free troposphere above the northern Alps is rather large. In 2005, the stratospheric contribution reached 40 % of the overall ozone (Fig. 14). The direct portion, related to a descent short enough to allow identification, exceeds that seen in earlier work (Elbern et al., 1997; Stohl et al., 2000) because of the modified filtering criteria described in the analyses of Trickl et al. (2010). We successfully estimated the indirect portion, which is not accessible to data filtering, from the 7Be measurements. It seems that the total contribution of the stratospheric ozone at the Zugspitze summit (including the indirect component) is a rather robust quantity, whereas a higher uncertainty exists for the direct one. The total contribution just slightly exceeds that found in the analysis of Scheel in 2005 (Trickl et al., 2020a), although we assume that there is a larger stratospheric component of the isotope. In our effort, we obtain a higher influence from direct intrusions and a smaller one from the indirect events without much change in the total fraction.
Our measurements of water vapour allowed us to exclude the mixing of the stratospheric layers with tropospheric air as a major source of uncertainty, despite not knowing exactly what the distribution of ozone and beryllium is in the stratosphere of the source regions, what their modification is during the transport, or what the role of the radioactive decay of 7Be could be. It is believed to be attached to aerosols that can undergo scavenging during particularly long transport (Gerasopoulos et al., 2001; Zanis et al., 1999). From the missing negative trend obtained for the tropospheric ozone component after 1990, we conclude that the derived stratospheric component is more likely a conservative estimate. We do see a negative trend of the amplitude of the seasonal cycle (Fig. 16).
We have been unable to assess the degree of overlap of the intrusion layer with the stations, which is another source of uncertainty. Fortunately, the incomplete overlap prevails in summer, where just a few intrusion cases are found per month at the summit.
Also, the calibration of the indirect ozone component via 7Be is a source of uncertainty. However, since the average ozone does not vary much, this uncertainty is presumably not very high.
The positive trend for ozone of stratospheric origin came to an end after 2003. The exact year of the change is masked by oscillations. The ozonesonde measurements at Uccle (Van Malderen et al., 2021) show a slightly positive STT trend, at least until 2017. In other regions of the world, positive ozone trends have also been observed (e.g. Cooper et al., 2020). It is interesting to see that the trend change (see also RH) follows the change in solar activity (Fig. 3) with an approximate delay of 1 decade. Is there a related change in the atmospheric dynamics?
The increase in stratospheric ozone observed at the Zugspitze summit predominantly occurs in winter. We found that neither the intrusion rate nor the duration of the intrusions changed in a comparable manner during the long period of observation. Claude et al. (2003) found an increase in lower-stratospheric ozone over the Hohenpeißenberg station of the DWD (distance from the Zugspitze summit is 41 km) in winter, which could explain some of the observed increase if the same were the case over the Arctic source regions. The Hohenpeißenberg increase at 11 km altitude from 1967 to 2002 is of the order of 10 % per decade. However, if the rising wintertime ozone above the tropopause were the sole reason, then why did 7Be also rise?
The intrusions emerge from the lowest edge of the stratosphere (Trickl et al., 2014, 2016). As a consequence, we can also take into consideration the idea that increasingly wider layers have separated from the range just above the tropopause where the ozone mixing ratio steeply rises, and a small increase in the layer width can have an enormous effect on the peak concentrations. Perhaps this reflects the growing atmospheric dynamics in the warming climate. It will be interesting to see if this, together with the solar activity reversing, is the reason for the trend change in the new century. A breaking-off of the wider lower-stratospheric layers was concluded for the warm season (Trickl et al., 2020a), but the penetration of stratospheric intrusions into the lower free troposphere in summer is limited.
The summer minimum of the monthly ozone averages due to STT is of the order of 2 ppb, whereas the 2005 winter contribution is roughly 9 times higher. FLEXPART model analyses by Stohl for 1995 to 1999 show a similar winter–summer contrast for downward transport times of about 10 d and shorter (Trickl et al., 2010). The contrast is less pronounced for the higher-lying Jungfraujoch station in Switzerland, indicating that the summer minimum might be caused by a reduced penetration of the intrusions into the troposphere during the warm season and the orographic effects discussed in Sect. 3.4. Looking at the free troposphere as a whole, the summer minimum disappears, and a very high occurrence of intrusions has been reported (e.g. Beekmann et al., 1997; Dibb et al., 2003; Trickl et al., 2020a).
The level of carbon monoxide in intrusions reflects the mixing ratio just above the tropopause. This level, as concluded from the Zugspitze data, increased until 2004. Trickl et al. (2014) speculated that there was an Asian influence in the tropopause region, possibly fed by warm conveyor belt activity over the western Pacific (Stohl, 2001). Thus, just the complementary (mainly tropospheric) CO decreases, even to roughly 56 % of the value in 1990 towards the end. The tropospheric ozone component estimated in our analysis (Fig. 17) does not decrease in a similar way in the new century, which confirms the idea of a still slightly rising stratospheric fraction.
Certainly, improved modelling will be needed to quantify STT. So far, Eulerian models have had difficulties in reproducing the strong ozone rise at the Alpine sites (e.g. Parrish et al., 2014; Staehelin et al., 2017). The calculated ozone rise reported in these two publications ends almost 20 years earlier than the observed one. In most commonly used Eulerian models, the spatial resolution is too low to reproduce deep STT (Roelofs et al., 2003; Trickl et al., 2010; Rastigejev et al., 2010; Eastham and Jacob, 2017; Bartusek et al., 2023), and free-tropospheric mixing must be reduced (e.g. Trickl et al., 2014; Osman et al., 2016). Due to the limited free-tropospheric mixing, Lagrangian approaches look promising, since they have a better chance of capturing thin layers.
In any case, an extension of transport modelling to 20 d and more is desirable, implying a high spatial and temporal resolution. Our studies (e.g. Trickl et al., 2020a) have revealed that, with growing altitude, the transport pattern of the intrusions affecting the free troposphere over the northern Alps is increasingly characterized by a slow descent from Canada, Alaska, and Siberia (Type 6, as defined by Trickl et al. (2010); Figs. 16 to 18 in Trickl et al., 2015) and frequently over more than 10 d. The trajectories may exhibit horizontal, wavelike transport paths, but these are mostly without a strong vertical variation. This kind of long-range descent, its underlying dynamics, and its influence on the STT budget call for a meteorological explanation. It would also be interesting to determine how much an extension of the transport calculations (to at least 15 d, as suggested by our analyses) would change the STT budget with respect to earlier work.
The great advantage of the in situ measurements is their continuous operation, which excludes a fair-weather bias. In addition, for the Zugspitze summit, information is available from the 7Be measurements. All of this makes the data filtering a valuable approach. However, such a filtering effort must, in principle, also account for the source conditions. The atmosphere in the tropopause region was estimated to be a mixture of about 50 % stratospheric and tropospheric air each (Shapiro, 1980; Vogel et al., 2011). The stratospheric portion of the descending air mass can vary significantly, also depending on the stratospheric residence time (Reiter et al., 1975). However, for our considerations, we name an air mass stratospheric once it has resided in the stratosphere for at least a short period of time. All of this calls for refined modelling efforts.
The growth of the stratospheric influence at the Zugspitze site and elsewhere indicates a drying of the free troposphere. This can be directly seen in the RH results in Fig. 7. More generally, Paltridge et al. (2009) determined a negative humidity trend in the global free troposphere over 4 decades from analysed sonde data (via National Centers for Environmental Prediction (NCEP) reanalysis). The negative trend maximizes in the upper troposphere, where we also found the maximum of the STT (Trickl et al., 2020a). Based on our results, we conclude that STT could contribute to this negative humidity trend. STT occurs in many regions, mostly in the latitudinal bands around the jet streams and also elsewhere. We speculate on a reaction of the vertical exchange to the changing climate, in particular since the positive trend of STT almost disappeared with decreasing solar emission (Fig. 3).
Tropospheric drying would be expected from condensation and precipitation. However, for Germany, the German Weather Service (DWD) has determined almost constant precipitation since at least 1950, with year-to-year variations of up to about 25 % (https://www.dwd.de/DE/leistungen/zeitreihen/zeitreihen.html?nn=480164, last access: 23 July 2023, under the keywords of “Niederschlag” (precipitation) and “Jahr” (year)). Thus, the role of STT in the tropospheric drying until the beginning of the new century could be even rather important. The drying of the free troposphere counteracts an expected positive feedback on radiative forcing by water vapour (e.g. Harries, 1997; Allan et al., 1999) and contradicts the expectations of climate modelling. However, as mentioned above, deep STT is likely to be missed by climate models to a major extent because of their coarse grids.
The data used in this paper can be obtained on request from the authors (thomas@trickl.de; hannes.vogelmann@kit.de; cedric.couret@uba.de; ludwig.ries@gawstat.de). We follow the strict conventions in renowned international networks. The hourly Zugspitze and UFS ozone values are available from the World Data Center for Reactive Gases (WDCRG; https://ebas.nilu.no/, EBAS, 2023) and the TOAR database (Schultz et al., 2017). Most of the UFS CO data are stored by the World Data Center for Greenhouse Gases in Tokyo (WDCGG; https://gaw.kishou.go.jp/, WDCGG, 2023). Relative humidity data for both the summit and UFS are freely available from the DWD (see Sect. 2.2.3).
TT interpreted the observations and prepared most of the paper, based on studies interrupted by the death of Hans-Eckhart Scheel, with assistance from the co-authors. TT and HV carried out the lidar measurements. CC carried out GAW measurements at UFS and provided the data for the most recent years. LR led the GAW activities of UBA at UFS until 2019 and contributed with details on the GAW measurements there.
The contact author has declared that none of the authors has any competing interests.
Publishers note: Copernicus Publications remains neutral with regard to jurisdictional claims in published maps and institutional affiliations.
The authors thank the late Reinhold Reiter, Wolfgang Seiler, and Hans Peter Schmid for their support over many decades. They are indebted to the late Hans-Eckhart Scheel, who can no longer co-author this paper, and the numerous co-workers at IFU (IMK-IFU), who have contributed to maintaining the data acquisition at the in situ stations of the institute and who are listed in part in the publications cited. Samuel Oltmans kindly returned the Zugspitze ozone data for 5 of the years not yet archived. The 7Be measurements were carried out over an extended period of time by the late Hans-Joachim Kanter and by Alexander Rockmann in the final phase. At UFS, Ralf Sohmer carried out the ozone measurements over many years, while Steffen Knabe did the CO measurements. Johann Siemens provided information on the in situ humidity instrumentation from the DWD, while Birgit Wegstein and Thomas Elste provided the RH data from the DWD for the summit and UFS, respectively. Alfred Neururer sent sonde data for Innsbruck. The authors acknowledge the great support by the UFS team. The measurements at Wank and Zugspitze have been funded by numerous agencies, in particular the German Bundesministerium für Bildung and Forschung within EUROTRAC, ATMOFAST, and several other projects, UBA, the European Union within VOTALP 1 and 2 (Vertical Ozone transport in the Alps; Wotawa and Kromp-Kolb, 2000), and STACCATO (Influence of Stratosphere–Troposphere Exchange in a Changing Climate on Atmospheric Transport and Oxidation Capacity; Stohl et al., 2003). The measurements at the Wank and Zugspitze stations have contributed to EUROTRAC within the TOR (Tropospheric Ozone Research) subproject (Kley et al., 1997). Lidar measurements have contributed to TOR and EARLINET (European Aerosol Research Lidar Network, 2003), with the latter currently being partly funded within the European infrastructure of ACTRIS.
The article processing charges for this open-access publication were covered by the Karlsruhe Institute of Technology (KIT).
This paper was edited by Patrick Jöckel and reviewed by two anonymous referees.
Allan, R. P., Shine, K. P., Slingo, A., and Pamment, J. A.: The dependence of clear-sky outgoing long-wave radiation on surface temperature and relative humidity, Q. J. Roy. Meteor. Soc., 125, 2103–2126, 1999.
Archibald, A. T., Neu, J. L., Elshorbany, Y., Cooper, O. R., Young, P. J., Akiyoshi, H., Cox, R. A., Coyle, M., Derwent, R., Deushi, M., Finco, A., Frost, G. J., Galbally, I. E., Gerosa, G., Granier, C., Griffiths, P. T., Hossaini, R., Hu, L., Jöckel, P., Josse, B., Lin, M. Y., Mertens, M., Morgenstern, O., Naja, M., Naik, V., Oltmans, S., Plummer, D. A., Revell, L. E., Saiz-Lopez, A., Saxena, P., Shin, Y. M., Shahid, I., Shallcross, D., Tilmes, S., Trickl, T., Wallington, T. J., Wang, T., Worden, H. M., and Zeng, G.: Tropospheric Ozone Assessment Report: Critical Review of changes in the Tropospheric Ozone Burden and Budget from 1850–2100, Elem. Sci. Anth., 8, 53, https://doi.org/10.1525/elementa.2020.034, 2020.
ATMOFAST: Atmosphärischer Ferntransport und seine Auswirkungen auf die Spurengaskonzentrationen in der freien Troposphäre über Mitteleuropa (Atmospheric Long-range Transport and its Impact on the Trace-gas Composition of the Free Troposphere over Central Europe), Project Final Report, Trickl, T., co-ordinator, Kerschgens, M., Stohl, A., and Trickl, T., subproject co-ordinators, funded by the German Ministry of Education and Research within the programme “Atmosphärenforschung 2000”, 130 pp., revised publication list 2012, http://www.trickl.de/ATMOFAST.htm (last access: 23 July 2023), 2005.
Bartusek, S., Wu, Y., Ting, M., Zheng. C., Fiore, A., Sprenger, M., and Flemming, S.: Higher-Resolution Tropopause Folding Accounts for More Stratospheric Ozone Intrusions, Geophys. Res. Lett., 50, e2022GL101690, https://doi.org/10.1029/2022GL101690, 2023.
Beekmann, M., Ancellet, G., Blonsky, S., De Muer, D., Ebel, A., Elbern, H., Hendricks, J., Kowol, J., Mancier, C., Sladkovic, R., Smit, H. G. J., Speth, P., Trickl, T., and Van Haver, P.: Regional and Global Tropopause Fold Occurrence and Related Ozone Flux across the Tropopause, J. Atmos. Chem., 28, 29–44, 1997.
Bithell, M., Vaughan, G., and Gray, L. J.: Persistence of stratospheric ozone layers in the troposphere, Atmos. Environ., 34, 2563–2570, 2000.
Bleichroth, J. F.: Mean Tropospheric Residence time of Cosmic-Ray-Produced Beryllium 7 at North Temperate Latitudes, J. Geophys. Res., 83, 3058–3062, 1978.
Butchart, N.: The Brewer–Dobson circulation, Rev. Geophys., 52, 157–184, https://doi.org/10.1007/s00382-006-0162-4, 2014.
Butchart, N., Scaife, A. A., Bourqui, M., de Grandpré, J., Hare, S. H. E., Kettleborough, J., Langematz, U., Manzini, E., Sassi, F., Shibata, K., Shindell, D., and Sigmond, M.: Simulations of anthropogenic change in the strength of the Brewer–Dobson circulation, Clim. Dynam., 27, 727–741, 2006.
Carnuth, W. and Trickl, T.: Transport studies with the IFU three-wavelength aerosol lidar during the VOTALP Mesolcina experiment, Atmos. Environ., 34, 1425–1434, 2000.
Carnuth, W., Kempfer, U., and Trickl, T.: Highlights of the Tropospheric Lidar Studies at IFU within the TOR Project, Tellus B, 54, 163–185, 2002.
Clain, G., Baray, J. L., Delmas, R., Diab, R., Leclair de Bellevue, J., Keckhut, P., Posny, F., Metzger, J. M., and Cammas, J. P.: Tropospheric ozone climatology at two Southern Hemisphere tropical/subtropical sites (Reunion Island and Irene, South Africa) from ozonesondes, LIDAR, and in situ aircraft measurements, Atmos. Chem. Phys., 9, 1723–1734, https://doi.org/10.5194/acp-9-1723-2009, 2009.
Claude, H., Fricke, W., and Beilke, S.: Wie entwickelt sich das bodennahe und das troposphärische Ozon?, Ozonbulletin des Deutschen Wetterdienstes, Nr. 82, lower ozone values were published in Bulletin Nr. 32, 2 pp., https://www.dwd.de/DE/forschung/atmosphaerenbeob/zusammensetzung_atmosphaere/hohenpeissenberg/inh_nav/ozon_bulletins_neu.html (last access: 23 July 2023), 2001.
Claude, H., Steinbrecht, W., and Köhler, U.: Warum bringt der Winter die stärksten Ozonänderungen?, Ozonbulletin des Deutschen Wetterdienstes, Nr. 92, 2 pp., https://www.dwd.de/DE/forschung/atmosphaerenbeob/zusammensetzung_atmosphaere/hohenpeissenberg/inh_nav/ozon_bulletins_neu.html (last access: 23 July 2023), 2003.
Cooper, O. R., Schultz, M. G., Schröder, S., Chang, K.-L., Gaudel, A., Benítez, G. C., Cuevas, E., Fröhlich, M., Galbally, I. E., Molloy, S., Kubistin, D., Lu, X., McClure-Begley, A., Nédélec, P., O'Brien, J., Oltmans, S. J., Petropavlovskikh, I., Ries, L., Senik, I., Sjöberg, K., Solberg, S., Spain, G. T., Spangl, W., Steinbacher, M., Tarasick, D, Thouret, V, and Xu, X.: Multi-decadal surface ozone trends at globally distributed remote locations, Elem. Sci. Anth., 8, 23, https://doi.org/10.1525/elementa.420, 2020.
Cristofanelli, P., Bonasoni, P., Tositti, L., Bonafè, U., Calzolari, F., Evangelisti, F., Sandrini, S., and Stohl, A.: A 6-year analysis of stratospheric intrusions and their influence on ozone at Mt. Cimone (2165 m above sea level), J. Geophys. Res., 111, D03306, https://doi.org/10.1029/2005JD006553, 2006.
Cristofanelli, P., Scheel, H.-E., Steinbacher, M., Saliba, M., Azzopardi, F., Ellul, R., Fröhlich, M., Tositti, L., Brattich, E., Maione, M., Calzolari, F., Duchi, F., Landi, T. C., Marinoni, A., and Bonasoni, P.: Long-term surface ozone variability at Mt. Cimone WMO/GAW global station (2165 , Italy), Atmos. Environ., 101, 23–33, 2015.
Cristofanelli, P., Fierli, F., Graziosi, F., Steinbacher, M., Couret, C., Calzolari, F., Roccato, F., Landi, T., Putero, D., and Bonasoni, P.: Decadal O3 variability at the Mt. Cimone WMO/GAW global station (2,165 , Italy) and comparison with two high-mountain “reference” sites in Europe, Elem. Sci. Anth., 8, 00042, https://doi.org/10.1525/elementa.00042, 2020.
Davies, T. D. and Schuepbach, E.: Episodes of High Ozone Concentrations at the Earth's Surface Resulting from Transport down from the Upper Troposphere/Lower Stratosphere: A Review and Case Studies, Atmos. Environ., 28, 53–68, 1994.
Dibb, J. E., Talbot, R. W., Scheuer, E., Seid, G., DeBell, L., Lefer, B., and Ridley, B.: Stratospheric influence on the northern North American free troposphere during TOPSE, J. Geophys. Res., 108, 8363, https://doi.org/10.1029/2001JD001347, 2003.
Draxler, R. and Hess, G.: An overview of the HYSPLIT_4 modelling system for trajectories, dispersion, and deposition, Aust. Meteorol. Mag., 47, 295–308, 1998.
Duncan, B. N., Logan, J. A., Bey, I., Megretskaia, I. A., Yantosca, R. M., Novelli, P. C., Jones, N. B., and Rinsland, C. P.: Global budget of CO, 1988–1997: Source estimates and validation with a global model, J. Geophys. Res., 112, D22301, https://doi.org/10.1029/2007JD008459, 2007.
EARLINET: A European Aerosol Research Lidar Network to Establish an Aerosol Climatology, Final Report, Reporting Period February 2000 to February 2003, European Union, contract EVR1-CT1999-40003, edited by: Bösenberg, J. (Co-ordinator) and Matthias, V., Report No. 348, Max-Planck-Institut für Meteorologie, Hamburg, Germany, 212 pp., 2003.
Eastham, S. D. and Jacob, D. J.: Limits on the ability of global Eulerian models to resolve intercontinental transport of chemical plumes, Atmos. Chem. Phys., 17, 2543–2553, https://doi.org/10.5194/acp-17-2543-2017, 2017.
EBAS: https://ebas.nilu.no/ (last access: 23 July 2023), 2023.
Eisele, H., Scheel, H. E., Sladkovic, R., and Trickl, T.: High-resolution Lidar Measurements of Stratosphere-troposphere Exchange, J. Atmos. Sci., 56, 319–330, 1999.
Elbern, H., Kowol, J., Sladkovic, R., and Ebel, A.: Deep stratospheric intrusions: A statistical assessment with model guided analysis, Atmos. Environ., 31, 3207–3226, 1997.
Fabian, P. and Pruchniewicz, P. G.: Meridional Distribution of Ozone in the Troposphere and Its Seasonal Variations, J. Geophys. Res., 82, 2063–2073, 1977.
Fischer, H., Wienhold, F. G., Hoor, P., Bujok, O., Schiller, C., Siegmund, P., Ambaum, M., Scheeren H. A., and Lelieveld, J.: Tracer correlations in the northern latitude lowermost stratosphere: Influence of cross-tropopause mass exchange, Geophys. Res. Lett., 27, 97–100, 2000.
Fromm, M., Lindsey, D. T., Servranckx, R., Yue, G., Trickl, T., Sica, R., Doucet, P., and Godin-Beekmann, S.: The Untold Story of Pyrocumulonimbus, B. Am. Meterol. Soc., 91, 1193–1209, 2010.
Gaudel, A., Cooper, O. R., Ancellet, G., Barret, B., Boynard, A., Burrows, J. P., Clerbaux, C., Coheur, P.-F., Cuesta, J., Cuevas, E., Doniki, S., Dufour, G., Ebojie, F., Foret, G., Garcia, O., Granados-Muñoz, M. J., Hannigan, J., Hase, F., Hassler, B., Huang, G., Hurtmans, D., Jaffe, D., Jones, N., Kalabokas, P., Kerridge, B., Kulawik, S., Latter, B., Leblanc, T., Le Flochmoën, E., Lin, W., Liu, J., Liu, X., Mahieu, E., McClure-Begley, A., Neu, J., Osman, M., Palm, M., Petetin, H., Petropavlovskikh, I., Querel, R., Rahpoe, N., Rozanov, A., Schultz, M. G., Schwab, J., Siddans, R., Smale, D., Steinbacher, M., Tanimoto, H., Tarasick, D., Thouret, V., Thompson, A. M., Trickl, T., Weatherhead, E., Wespes, C., Worden, H., Vigouroux, C., Xu, X., Zeng, G., and Ziemke, J.: Tropospheric Ozone Assessment Report: Present-day distribution and trends of tropospheric ozone relevant to climate and global atmospheric chemistry model evaluation, Elem. Sci. Anth., 6, 39, https://doi.org/10.1525/elementa.291, 2018.
Gerasopoulos, E., Zanis, P., Stohl, A., Zerefos, C. S., Papastefanou, C., Ringer, W., Tobler, L., Hübener, S., Gäggeler, H. W., Kanter, H. J., Tositti, L., and Sandrini, S.: A climatology of 7Be at four high-altitude stations at the Alps and the northern Apennines, Atmos. Environ., 35, 6347–6360, 2001.
Harries, J. E.: Atmospheric radiation and atmospheric humidity, Q. J. Roy. Meteor. Soc., 123, 2173–2186, 1997.
Hearn, A. G.: The Absorption of Ozone in the Ultra-violet and Visible Regions of the Spectrum, P. Phys. Soc., 78, 932–940, 1961.
Hegglin, M. I., Boone, C. D., Manney, G. L., and Walker, K. A.: A global view of the extratropical tropopause transition layer from Atmospheric Chemistry Experiment Fourier Transform Spectrometer O3, H2O, and CO, J. Geophys. Res., 114, D00B11, https://doi.org/10.1029/2008JD009984, 2009.
Herbst, K., Muscheler, R., and Heber, B.: The new local interstellar spectra and their influence on the production rates of the cosmogenic radionuclides 10Be and 14C, J. Geophys. Res.-Space, 122, 23–34, https://doi.org/10.1002/2016JA023207, 2017.
Huh, C. A. and Liu, L. G.: Precision measurements of the half-lives of some electron-capture decay nuclides: 7Be, 54Mn, 83Rb, and 84Rb, J. Radioanal. Nucl. Ch., 246, 229–231, 2000.
Iarlori, M., Madonna, F., Rizi, V., Trickl, T., and Amodeo, A.: Effective resolution concepts for lidar observations, Atmos. Meas. Tech., 8, 5157–5176, https://doi.org/10.5194/amt-8-5157-2015, 2015.
Jäger, H.: Long-term record of lidar observations of the stratospheric aerosol layer at Garmisch-Partenkirchen, J. Geophys. Res., 110, D08106, https://doi.org/10.1029/2004JD005506, 2005.
Jonson, J. E., Simpson, D., Fagerli, H., and Solberg, S.: Can we explain the trends in European ozone levels?, Atmos. Chem. Phys., 6, 51–66, https://doi.org/10.5194/acp-6-51-2006, 2006.
Klausen, J., Zellweger, C., Buchmann, B., and Hofer, P.: Uncertainty and bias of surface ozone measurements at selected Global Atmospheric Watch sites, J. Geophys. Res., 108, 4622, https://doi.org/10.1029/2003JD003710, 2003.
Kley, D., Beck, J., Grennfelt, P. I., Hov, O., and Penkett, S. A.: Tropospheric Ozone Research (TOR) A Sub-Project of EUROTRAC, J. Atmos. Chem., 28, 1–9, 1997.
Lal, D. and Peters, B.: Cosmic Ray Produced Radioactivity on the Earth, Handb. Phys. (Encyclopedia of Physics), 46/2, Cosmic Rays II, edited by: Sitte, K. and Flügge, S. (Chief Ed.), Springer, Berlin, Heidelberg, New York, 551–612, 1967.
Langford, A. O., Senff, C. J., Alvarez II, R. J., Aikin, K. C., Baidar, S., Bonin, T. A., Brewer, W. A., Brioude, J., Brown, S. S., Burley, J. D., Caputi, D. J., Conley, S. A., Cullis, P. D., Decker, Z. C. J., Evan, S., Kirgis, G., Lin, M., Pagowski, M., Peischl, J., Petropavlovskikh, I., Pierce, R. B., Ryerson, T. B., Sandberg, S. P., Sterling, C. W., Weickmann, A. M., and Zhang, L.: The Fires, Asian, and Stratospheric Transport–Las Vegas Ozone Study (FAST-LVOS), Atmos. Chem. Phys., 22, 1707–1737, https://doi.org/10.5194/acp-22-1707-2022, 2022.
Leblanc, T., Sica, R. J., van Gijsel, J. A. E., Godin-Beekmann, S., Haefele, A., Trickl, T., Payen, G., and Gabarrot, F.: Proposed standardized definitions for vertical resolution and uncertainty in the NDACC lidar ozone and temperature algorithms – Part 1: Vertical resolution, Atmos. Meas. Tech., 9, 4029–4049, https://doi.org/10.5194/amt-9-4029-2016, 2016.
Logan, J. A., Prather, M. J., Wofsy, S. C., McElroy, M. B.: Tropospheric chemistry: A global perspective, J. Geophys. Res., 86, 7210–7254, 1981.
Logan, J. A., Staehelin, J., Megretskaia, I. A., Cammas, J.-P., Thouret, V., Claude, H., De Backer, H., Steinbacher, M., Scheel, H.-E., Stübi, R., Fröhlich, M., and Derwent, R.: Changes in ozone over Europe: Analysis of ozone measurements from sondes, regular aircraft (MOZAIC) and alpine surface sites, J. Geophys. Res., 117, D09301, https://doi.org/10.1029/2011JD016952, 2012.
Marenco, A., Gouget, H., Nédélec, P., Pagés, J.-P., and Karcher, F.: Evidence of a long-term increase in tropospheric ozone from Pic di Midi data series: Consequences: Positive radiative forcing, J. Geophys. Res., 99, 16617–16632, 1994.
Monks, P. S.: A review of the observations and origins of the spring ozone maximum, Atmos. Environ., 34, 3545–3561, 2000.
Oltmans, S. J., Lefohn, A. S., Harris, J. M., Galbally, I., Scheel, H. E., Bodeker, G., Brunke, E., Claude, H., Tarasick, D., Johnson, B. J., Simmonds, P., Shadwick, D., Anlauf, K., Hayden, K., Schmidlin, F., Fujimoto, F., Akagi, K., Meyer, C., Nichol, S., Davies, J., Redondas, A., and Cuevas, E.: Long-term changes in tropospheric ozone, Atmos. Environ., 40, 3156–3173, 2006.
Oltmans, S. J., Lefohn, A. S., Shadwick, D., Harris, J. M., Scheel, H. E., Galbally, I., Tarasick, D. W., Johnson, B. J., Brunke, E.-G., Claude, H., Zeng, G., Nichol, S., Schmidlin, F., Davies, J., Cuevas, E., Redondas, A., Naoe, H., Nakano, T., and Kawasato, T.: Recent tropospheric ozone changes – A pattern dominated by slow or no growth, Atmos. Environ., 67, 331–351, 2012.
Ordoñez, C., Brunner, D., Staehelin, J., Hadjinicolaou, P., Pyle, J. A., Jonas, M., Wernli, H., and Prévôt, A. S. H.: Strong influence of lowermost stratospheric ozone on lower tropospheric background ozone changes over Europe, Geophys. Res. Lett., 34, L07805, https://doi.org/10.1029/2006GL029113, 2007.
Osman, M. K., Hocking. W. K., and Tarasick, D. W.: Parametrization of large-scale turbulent diffusion in the presence of both well-mixed and weakly mixed patchy layers, J. Atmos. Sol.-Terr. Phy., 143–144, 14–36, 2016.
Ott, L. E., Duncan, B. N., Thompson, A. M., Diskin, G., Fasnacht, Z., Langford, A. O., Lin, M., Molod, A. M., Nielsen, J. E., Pusede, S. E., Wargan, K., Weinheimer, A. J., and Yoshida, Y.: Frequency and impact of summertime stratospheric intrusions over Maryland during DISCOVER-AQ (2011): New evidence from NASA's GEOS-5 simulations, J. Geophys. Res., 121, 3687–3706, https://doi.org/10.1002/2015JD024052, 2016.
Paltridge, G., Arking, A., and Pook, M.: Trends in middle- and upper-level tropospheric humidity from NCEP reanalysis data, Theor. Appl. Climatol., 98, 351–359, 2009.
Pan, L. L., Randel, W. J., Gary, B. L., Mahoney, M. J., and Hintsa, E. J.: Definitions and sharpness of the extratropical tropopause: A trace gas perspective, J. Geophys. Res., 109, D23103, https://doi.org/10.1029/2004JD004982, 2004.
Parrish, D. D., Law, K. S., Staehelin, J., Derwent, R., Cooper, O. R., Tanimoto, H., Volz-Thomas, A., Gilge, S., Scheel, H.-E., Steinbacher, M., and Chan, E.: Long-term changes in lower tropospheric baseline ozone concentrations at northern mid-latitudes, Atmos. Chem. Phys., 12, 11485–11504, https://doi.org/10.5194/acp-12-11485-2012, 2012.
Parrish, D. D., Lamarque, J.-F., Naik, V., Horowitz, L., Shindell, D. T., Staehelin, J., Derwent, R., Cooper, O. R., Tanimoto, H., Volz-Thomas, A., Gilge, S., Scheel., H.-E., Steinbacher, M., and Fröhlich, M.: Long-term changes in lower tropospheric baseline ozone concentrations: Comparing chemistry-climate models and observations at northern midlatitudes, J. Geophys. Res., 119, 5719–5736, https://doi.org/10.1002/2013JD021435, 2014.
Parrish, D. D., Derwent, R. G., Steinbrecht, W., Stübi, R., Van Malderen, R., Steinbacher, M., Trickl, T., Ries, L., and Xu, X.: Zonal Similarity of Long-term Changes and Seasonal Cycles of Baseline Ozone at Northern Mid-latitudes, J. Geophys. Res., 125, e2019JD031908, https://doi.org/10.1029/2019JD031908, 2020.
Pisso, I, Real, E., Law, K. S., Legras, B., Bousserez, N., Attié, J. L., and Schlager, H.: Estimation of mixing in the troposphere from Lagrangian trace gas reconstructions during long-range pollution-plume transport, J. Geophys. Res., 114, D19301, https://doi.org/10.1029/2008JD011289, 2009.
Rastigejev, Y., Park, R., Brenner, M., and Jacob, D.: Resolving intercontinental pollution plumes in global models of atmospheric transport. J. Geophys. Res., 115, D02302, https://doi.org/10.1029/2009JD012568, 2010.
Reiter, E. R., Carnuth, W., Kanter, H.-J., Pötzl, K., Reiter, R., and Sládkovič, R.: Measurements of Stratospheric Residence Times, Arch. Meteor. Geophy. A, 24, 41–51, 1975.
Reiter, E. R., Kanter, H.-J., Reiter, R., and Sládkovič, R.: Lower-Tropospheric Ozone of Stratospheric Origin, Arch. Meteor. Geophy. A, 26, 179–186, 1977.
Reiter, R.: Increased Influx of Stratospoheric Air into the Lower Troposphere after Solar Ha and X Ray Flares, J. Geophys. Res., 78, 6167–6172, 1973a.
Reiter, R.: Solar-terrestrial relationships of an Atmospheric-Electrical and Meteorological Nature: New Findings, Riv. Ital. Geofis., 12, 247–258, 1973b.
Reiter, R.: New Results Regarding the Influence of Solar Activity on the Stratospheric-Tropospheric Exchange, Arch. Meteor. Geophy. A, 28, 309–339, 1979.
Reiter, R.: The ozone trend in the layer of 2 to 3 since 1978 and the typical time variations of the ozone profile between ground and 3 , Meteorol. Atmos. Phys., 42, 91–104, 1990.
Reiter, R. and Littfaß, M.: Stratospheric-Tropospheric Exchange Influenced by Solar Activity. Results of a Five Years Study, Arch. Meteor. Geophy. A, 26, 127–154, 1977.
Reiter, R., Sládkovič, R., Pötzl, K., Carnuth, W., and Kanter, H.-J.: Studies on the Influx of Stratospheric Air into the Lower Troposphere Using Cosmic-Ray Produced Radionuclides and Fallout, Arch. Meteor. Geophy. A, 20, 211–246, 1971.
Reiter, R., Munzert, K., Kanter, H.-J., and Pötzl, K.: Cosmogenic radionuclides and ozone at a mountain station at 3.0 km ASL, Arch. Meteor. Geophy. B, 32, 131–160, 1983.
Reiter, R., Sladkovic, R., Kanter, H.-J.: Concentrations of trace gases in the lower troposphere, simultaneously recorded at neighbouring mountain stations, Part I. Carbon dioxide, Meteorol. Atmos. Phys., 35, 187–200, 1986.
Reiter, R., Sládkovič, R., and Kanter, H.-J.: Concentration of Trace Gases in the Lower Troposphere, Simultaneously Recorded at Neighboring Mountain Stations, Part II: Ozone, Meteorol. Atmos. Phys., 37, 27–47, 1987.
Roelofs, G. J., Kentarchos, A. S., Trickl, T., Stohl, A., Collins, W. J., Crowther, R. A., Hauglustaine, D., Klonecki, A., Law, K. S., Lawrence, M. G., von Kuhlmann, R., and van Weele, M.: Intercomparison of tropospheric ozone models: Ozone transport in a complex tropopause folding event, J. Geophys. Res., 108, 8529, https://doi.org/10.1029/2003JD003462, 2003.
Scheel, H. E.: Ozone Climatology Studies for the Zugspitze and Neighbouring Sites in the German Alps, in: Tropospheric Ozone Research 2, EUROTRAC-2 Subproject Final Report, Lindskog, A. (Co-ordinator), EUROTRAC International Scientific Secretariat, München, Germany, 134–139, http://www.trickl.de/scheel.pdf (last access: 23 July 2023), 2003.
Schultz, M. G., Schröder, S., Lyapina, O., Cooper, O., Galbally, I., Petropavlovskikh, I., von Schneidemesser, E., Tanimoto, H., Elshorbany, Y., Naja, M., Seguel, R. J., Dauert, U., Eckhardt, P., Feigenspan, S., Fiebig, M., Hjellbrekke, A.-G., Hong, Y.-D., Kjeld, P. C., Koide, H., Lear, G., Tarasick, D., Ueno, M., Wallasch, M., Baumgardner, D., Chuang, M.-T., Gillett, R., Lee, M., Molloy, S., Moolla, R., Wang, T., Sharps, K., Adame, J. A., Ancellet, G., Apadula, F., Artaxo, P., Barlasina, M. E., Bogucka, M., Bonasoni, P., Chang, L., Colomb, A., Cuevas-Agulló, E., Cupeiro, M., Degorska, A., Ding, A., Fröhlich, M., Frolova, M., Gadhavi, H., Gheusi, F., Gilge, S., Gonzalez, M. Y., Gros, V., Hamad, S. H., Helmig, D., Henriques, D., Hermansen, O., Holla, R., Hueber, J., Im, U., Jaffe, D. A., Komala, N., Kubistin, D., Lam, K.-S., Laurila, T., Lee, H., Levy, I., Mazzoleni, C., Mazzoleni, L. R., McClure-Begley, A., Mohamad, M., Murovec, M., Navarro-Comas, M., Nicodim, F., Parrish, D., Read, K. A., Reid, N., Ries, L., Saxena, P., Schwab, J. J., Scorgie, Y., Senik, I., Simmonds, P., Sinha, V., Skorokhod, A. I., Spain, G., Spangl, W., Spoor, R., Springston, S. R., Steer, K., Steinbacher, M., Suharguniyawan, E., Torre, P., Trickl, T., Weili, L., Weller, R., Xiaobin, X., Xue, L., and Zhiqiang, M.: Tropospheric Ozone Assessment Report: Database and Metrics Data of Global Surface Ozone Observations, Elem. Sci. Anth., 5, 58, https://doi.org/10.1525/elementa.244, 2017.
Shapiro, M. A.: The Role of Turbulent Heat Flux in the Generation of Potential Vorticity of Upper-Level Jet Stream Systems, Mon. Weather Rev., 104, 892–906, 1976.
Shapiro, M. A.: Further Evidence of the Mesoscale and Turbulent Structure of Upper Level Jet Stream-Frontal Zone Systems, Mon. Weather Rev., 106, 1100–1111, 1978.
Shapiro, M. A.: Turbulent Mixing within Tropopause Folds as a Mechanism for the Exchange of Chemical Constituents between the Stratosphere and Troposphere, J. Atmos. Sci., 37, 994–1004, 1980.
Škerlak, B., Sprenger, M., and Wernli, H.: A global climatology of stratosphere–troposphere exchange using the ERA-Interim data set from 1979 to 2011, Atmos. Chem. Phys., 14, 913–937, https://doi.org/10.5194/acp-14-913-2014, 2014.
Sládkovič, R.: Untersuchung über den Transport des Fallouts von der siebenten chinesischen Kernwaffenexplosion in den Alpenraum, Arch. Meteor. Geophy. A, 18, 87–110, 1969.
Sládkovič, R. and Munzert, K.: Lufthygienisch-klimatologische Überwachung im bayrischen Alpenraum, Abschnitt VI.4, Ozonspitzen auf der Zugspitze durch Zustrom aus der Stratosphäre, Final Report, Report 908080, Fraunhofer-Institut für Atmosphärische Umweltforschung, 49–50, 1990.
Sladkovic, R., Scheel, H. E., and Seiler, W.: Ozone Climatology at the Mountain Sites, Wank and Zugspitze, in: EUROTRAC, Transport and Transformation of Pollutants in the Troposphere, Proceedings of EUROTRAC Symposium '94, Garmisch-Partenkirchen, Germany, SPB Academic Publishing, Den Haag, the Netherlands, 253–258, ISBN 90-5103-095-9, 1994.
Sprenger, M., Croci Maspoli, M., and Wernli, H.: Tropopause folds and cross-tropopause exchange: A global investigation based upon ECMWF analyses for the time period March 2000 to February 2001, J. Geophys. Res., 108, 8518, https://doi.org/10.1029/2002JD002587, 2003.
Staehelin, J., Tummon, F., Revell, L., Stenke, A., and Peter, T.: Tropospheric Ozone at Northern Mid-Latitudes: Modeled and Measured Long-Term Changes, Atmosphere, 8, 163, https://doi.org/10.3390/atmos8090163, 2017.
Stein, A. F., Draxler, R. R, Rolph, G. D., Stunder, B. J. B., Cohen, M. D., and Ngan, F.: NOAA's HYSPLIT atmospheric transport and dispersion modeling system, B. Am. Meteorol. Soc., 96, 2059–2077, 2015.
Stohl, A.: A 1-year Lagrangian “climatology” of airstreams in the Northern Hemisphere troposphere and lowermost stratosphere, J. Geophys. Res., 106, 7263–7279, 2001.
Stohl, A. and Trickl, T.: A textbook example of long-range transport: Simultaneous observation of ozone maxima of stratospheric and North American origin in the free troposphere over Europe, J. Geophys. Res., 104, 30445–30462, 1999.
Stohl, A., Spichtinger-Rakowsky, N., Bonasoni, P., Feldmann, H., Memmesheimer, M., Scheel, H. E., Trickl, T., Hübener, S., Ringer, W., and Mandl, M.: The influence of stratospheric intrusions on alpine ozone concentrations, Atmos. Environ. 34, 1323–1354, 2000.
Stohl, A., Bonasoni, P., Cristofanelli, P., Collins, W., Feichter, J., Frank, A., Forster, C., Gerasopoulos, E., Gäggeler, H., James, P., Kentarchos, T., Kromp-Kolb, H., Krüger, B., Land, C., Meloen, J., Papayannis, A., Priller, A., Seibert, P., Sprenger, M., Roelofs, G. J., Scheel, H. E., Schnabel, C., Siegmund, P., Tobler, L., Trickl, T., Wernli, H., Wirth, V., Zanis, P., and Zerefos, C.: Stratosphere-troposphere exchange – a review, and what we have learned from STACCATO, J. Geophys. Res., 108, 8516, https://doi.org/10.1029/2002JD002490, 2003.
Tarasick, D., Galbally, I. E., Cooper, O. R., Schultz, M. G., Ancellet, G., Leblanc, T., Wallington, T. J., Ziemke, J., Liu, X., Steinbacher, M., Staehelin, J., Vigouroux, C., Hannigan, J., García, O., Foret, G., Zanis, P., Weatherhead, E., Petropavlovskikh, I., Worden, H., Osman, M., Liu, J., Chang, K.-L., Gaudel, A., Lin, M., Granados-Muñoz, M., Thompson, A. M., Oltmans, S. J., Cuesta, J., Dufour, G., Thouret, V., Hassler, B., Trickl, T., and Neu, J. L.: Tropospheric Ozone Assessment Report: Tropospheric ozone from 1877 to 2016, observed levels, trends and uncertainties, Elem. Sci. Anth., 7, 39, https://doi.org/10.1525/elementa.376, 2019.
Tositti, L., Hübener, S., Kanter, H.-J., Ringer, W., Sandrini, and S., and Tobler, L.: Intercomparison of sampling and measurement of 7Be in air at four high-altitude locations in Europe, Appl. Radiat. Isotop., 61, 1497–1502, 2004.
Trickl, T. and Wanner, J.: High-Resolution, Laser-Induced Fluorescence Spectroscopy of Nascent IF: Determination of X- and B-state Molecular Constants, J. Mol. Spectrosc., 104, 174–182, 1984.
Trickl, T., Proch, D., and Kompa, K. L.: Resonance-Enhanced 2 + 2 Photon Ionization of Nitrogen: The Lyman–Birge–Hopfield Band System, J. Mol. Spectrosc., 162, 184–229, 1993.
Trickl, T., Proch, D., and Kompa, K. L.: The Lyman–Birge–Hopfield System of Nitrogen: Revised Calculation of the Energy Levels, J. Mol. Spectrosc., 171, 374–384, 1995.
Trickl, T., Cooper, O. C., Eisele, H., James, P., Mücke, R., and Stohl, A.: Intercontinental transport and its influence on the ozone concentrations over central Europe: Three case studies. J. Geophys. Res., 108, 8530, https://doi.org/10.1029/2002JD002735, 2003.
Trickl, T., Feldmann, H., Kanter, H.-J., Scheel, H.-E., Sprenger, M., Stohl, A., and Wernli, H.: Forecasted deep stratospheric intrusions over Central Europe: case studies and climatologies, Atmos. Chem. Phys., 10, 499–524, https://doi.org/10.5194/acp-10-499-2010, 2010.
Trickl, T., Bärtsch-Ritter, N., Eisele, H., Furger, M., Mücke, R., Sprenger, M., and Stohl, A.: High-ozone layers in the middle and upper troposphere above Central Europe: potential import from the stratosphere along the subtropical jet stream, Atmos. Chem. Phys., 11, 9343–9366, https://doi.org/10.5194/acp-11-9343-2011, 2011.
Trickl, T., Giehl, H., Jäger, H., and Vogelmann, H.: 35 yr of stratospheric aerosol measurements at Garmisch-Partenkirchen: from Fuego to Eyjafjallajökull, and beyond, Atmos. Chem. Phys., 13, 5205–5225, https://doi.org/10.5194/acp-13-5205-2013, 2013.
Trickl, T., Vogelmann, H., Giehl, H., Scheel, H.-E., Sprenger, M., and Stohl, A.: How stratospheric are deep stratospheric intrusions?, Atmos. Chem. Phys., 14, 9941–9961, https://doi.org/10.5194/acp-14-9941-2014, 2014.
Trickl, T., Vogelmann, H., Flentje, H., and Ries, L.: Stratospheric ozone in boreal fire plumes – the 2013 smoke season over central Europe, Atmos. Chem. Phys., 15, 9631–9649, https://doi.org/10.5194/acp-15-9631-2015, 2015.
Trickl, T., Vogelmann, H., Fix, A., Schäfler, A., Wirth, M., Calpini, B., Levrat, G., Romanens, G., Apituley, A., Wilson, K. M., Begbie, R., Reichardt, J., Vömel, H., and Sprenger, M.: How stratospheric are deep stratospheric intrusions? LUAMI 2008, Atmos. Chem. Phys., 16, 8791–8815, https://doi.org/10.5194/acp-16-8791-2016, 2016.
Trickl, T., Vogelmann, H., Ries, L., and Sprenger, M.: Very high stratospheric influence observed in the free troposphere over the northern Alps – just a local phenomenon?, Atmos. Chem. Phys., 20, 243–266, https://doi.org/10.5194/acp-20-243-2020, 2020a.
Trickl, T., Giehl, H., Neidl, F., Perfahl, M., and Vogelmann, H.: Three decades of tropospheric ozone lidar development at Garmisch-Partenkirchen, Germany, Atmos. Meas. Tech., 13, 6357–6390, https://doi.org/10.5194/amt-13-6357-2020, 2020b.
Van Malderen, R., De Muer, D., De Backer, H., Poyraz, D., Verstraeten, W. W., De Bock, V., Delcloo, A. W., Mangold, A., Laffineur, Q., Allaart, M., Fierens, F., and Thouret, V.: Fifty years of balloon-borne ozone profile measurements at Uccle, Belgium: a short history, the scientific relevance, and the achievements in understanding the vertical ozone distribution, Atmos. Chem. Phys., 21, 12385–12411, https://doi.org/10.5194/acp-21-12385-2021, 2021.
Vautard, R., Szopa, S., Beekmann, M., Menut, L., Hauglustaine, D. A., Rouil, L., and Roemer, M.: Are decadal anthropogenic emission reductions in Europe consistent with surface ozone observations? Geophys. Res. Lett., 33, L13810, https://doi.org/10.1029/2006GL026080, 2006.
VDI: VDI guide line 4210, Remote Sensing, Atmospheric Measurements with LIDAR, Measuring gaseous air pollution with the DAS LIDAR, Verein Deutscher Ingenieure, Düsseldorf, Germany, 47 pp., https://www.vdi.de/richtlinien/ (last access: 23 July 2023), 1999.
Viallon, J., Lee, S., Moussay, P., Tworek, K., Petersen, M., and Wielgosz, R. I.: Accurate measurements of ozone absorption cross-sections in the Hartley band, Atmos. Meas. Tech., 8, 1245–1257, https://doi.org/10.5194/amt-8-1245-2015, 2015.
Volz, A. and Kley, D.: Evaluation of the Montsouris series of ozone measurements made in the nineteenth century, Nature, 332, 240–242, 1988.
Vogel, B., Pan, L. L., Konopka, P., Günther, G., Müller, R., Hall, W., Campos, T., Pollack, I., Weinheimer, A., Wei, J., Atlas, E. L., and Bowman, K. P.: Transport Pathways and signatures of mixing in the extratropical tropopause region derived from Lagrangian model simulations, J. Geophys. Res., 116, D05306, https://doi.org/10.1029/2010JD014876, 2011.
Vogelmann, H. and Trickl, T.: Wide-Range Sounding of Free-Tropospheric Water Vapor with a Differential-Absorption Lidar (DIAL) at a High-Altitude Station, Appl. Optics, 47, 2116–2132, 2008.
WDCGG – World Data Centre for Greenhouse Gases: About WDCGG, https://gaw.kishou.go.jp/ (last access: 23 July 2023), 2023.
Wernli, H.: A Lagrangian-based analysis of extratropical cyclones. II: A detailed case study, Q. J. Roy. Meteor. Soc., 123, 1677–1706, 1997.
Wernli, H. and Davies, H. C.: A Lagrangian-based analysis of extratropical cyclones. I. The method and some applications, Q. J. Roy. Meteor. Soc., 123, 467–489, 1997.
Wotawa, G. and Kromp-Kolb, H.: The research project VOTALP − general objectives and main results, Atmos. Environ., 34, 1319–1322, 2000.
Yuan, Y., Ries, L., Petermeier, H., Steinbacher, M., Gómez-Peláez, A. J., Leuenberger, M. C., Schumacher, M., Trickl, T., Couret, C., Meinhardt, F., and Menzel, A.: Adaptive selection of diurnal minimum variation: a statistical strategy to obtain representative atmospheric CO2 data and its application to European elevated mountain stations, Atmos. Meas. Tech., 11, 1501–1514, https://doi.org/10.5194/amt-11-1501-2018, 2018.
Yuan, Y., Ries, L., Petermeier, H., Trickl, T., Leuchner, M., Couret, C., Sohmer, R., Meinhardt, F., and Menzel, A.: On the diurnal, weekly, and seasonal cycles and annual trends in atmospheric CO2 at Mount Zugspitze, Germany, during 1981–2016, Atmos. Chem. Phys., 19, 999–1012, https://doi.org/10.5194/acp-19-999-2019, 2019.
Zahn, A., Neubert, R., Maiss, M., and Platt, U.: Fate of long-lived trace species near the Northern Hemisphere tropopause: Carbon dioxide, methane, ozone, and sulfur hexafluoride, J. Geophys Res., 104, 13923–13942, 1999.
Zanis, P., Schuepbach, E., Gaeggeler, H. W., Huebener, S., and Tobler, L.: Factors controlling beryllium-7 at Jungfraujoch in Switzerland, Tellus, 51, 789–805, 1999.
Zanis, P., Trickl, T., Stohl, A., Wernli, H., Cooper, O., Zerefos, C., Gaeggeler, H., Schnabel, C., Tobler, L., Kubik, P. W., Priller, A., Scheel, H. E., Kanter, H. J., Cristofanelli, P., Forster, C., James, P., Gerasopoulos, E., Delcloo, A., Papayannis, A., and Claude, H.: Forecast, observation and modelling of a deep stratospheric intrusion event over Europe, Atmos. Chem. Phys., 3, 763–777, https://doi.org/10.5194/acp-3-763-2003, 2003.
Zellweger, C., Buchmann, B., Klausen, J., and Hofer, P.: System and Performance Audit of Surface Ozone, Carbon Monoxide and Methane at the Global GAW Station Zugspitze/Hohenpeißenberg, Platform Zugspitze, Germany, Empa-WCC Report 01/1, February 2001, submitted to the World Meteorological Organization, 49 pp., https://www.empa.ch/documents/56101/250799/Zugspitze_Schneefernhaus01.pdf/8abd8c8a-75f7-40d4-b2bc-afd506dc2742 (last access: 24 July 2023), 2001.
Zellweger, C., Klausen, J., and Buchmann, B.: System and Performance Audit of Surface Ozone, Carbon Monoxide and Methane at the Global GAW Station Zugspitze/Schneefernerhaus, Germany, Empa-WCC Report 06/2, June 2006, submitted to the World Meteorological Organization, 51 pp., https://www.empa.ch/documents/56101/250799/Zugspitze_Schneefernhaus06.pdf/941aa2cf-9aa0-497d-9681-3a4a153bc43e (last access: 24 July 2023), 2006.
Zellweger, C., Steinbacher, M., and Buchmann, B., and Steinbrecher, R.: System and Performance Audit of Surface Ozone, Methane, Carbon Dioxide, Nitrous Oxide and Carbon Monoxide at the Global GAW Station Zugspitze-Schneefernerhaus, Germany, submitted to WMO, WCC-Empa Report 11/2, June 2011, WMO World Calibration Centre WCC-Empa Empa Dübendorf, Switzerland, 46 pp., https://www.empa.ch/documents/56101/250799/Zugspitze_Schneefernhaus11.pdf/f22a4616-5bd2-4d38-b74b-ca724da48be8 (last access: 24 July 2023), 2011.
Zellweger, C., Steinbacher, M., Buchmann, B., and Steinbrecher, R.: System and Performance Audit of Surface Ozone, Methane, Carbon Dioxide, Nitrous Oxide and Carbon Monoxide at the Global GAW Station Zugspitze-Schneefernerhaus, Germany, submitted to WMO, WCC-Empa Report 20/3, September 2020, GAW report 266, WMO World Calibration Centre WCC-Empa Empa Dübendorf, Switzerland, 54 pp., https://www.library.wmo.int/doc_num.php?explnum_id=10747 (last access: 24 July 2023), 2021.
- Abstract
- Introduction
- Observations
- Characteristics of the parameters used for data filtering to identify STT
- Filtering criteria for quantifying STT at the Zugspitze sites
- Results of the data filtering
- Discussion and conclusions
- Data availability
- Author contributions
- Competing interests
- Disclaimer
- Acknowledgements
- Financial support
- Review statement
- References