the Creative Commons Attribution 4.0 License.
the Creative Commons Attribution 4.0 License.
 | 25 Jul 2023
Variation and trend of nitrate radical reactivity towards volatile organic compounds in Beijing, China
Hejun Hu
Jie Wang
Zelong Zheng
Xuezhen Xu
Tianyu Zhai
Xiaorui Chen
Wenxing Fu
Limin Zeng
Yuanhang Zhang
Shaojia Fan
Nitrate radical (NO3) is an important nocturnal atmospheric oxidant in the troposphere that significantly affects the lifetime of pollutants emitted by anthropogenic and biogenic activities, especially volatile organic compounds (VOCs). Here, we used 1 year of VOC observation data obtained in urban Beijing in 2019 to look into the level, composition, and seasonal variation in NO3 reactivity ). We show that hourly towards measured VOC varied widely from < 10−4 to 0.083 s−1 with a campaign-average value (± standard deviation) of 0.0032 ± 0.0042 s−1. There was large seasonal difference in NO3 reactivity towards VOC with averaged values (± standard deviation) of 0.0024±0.0026 s−1 (spring), 0.0067±0.0066 s−1 (summer), 0.0042±0.0037 s−1 (autumn), and 0.0027±0.0028 s−1 (winter). Alkenes such as isoprene and styrene accounted for the majority. Isoprene was the dominant species in spring, summer, and autumn, accounting for 40.0 %, 77.2 %, and 43.2 %, respectively. Styrene only played a leading role in winter, with a percentage of 39.8 %. A sensitivity study shows monoterpenes, the species we did not measure, may account for a large fraction of . Based on the correlation between the calculated and VOC concentrations in 2019, we established localized parameterization schemes for predicting the reactivity by only using a part of VOC species. The historically published VOC data were collected using the parameterization method to reconstruct the long-term in Beijing. The lower during 2014–2021 compared with that during 2005–2013 may be attributed to anthropogenic VOC emission reduction. Finally, we revealed that NO3 dominated the nocturnal VOC oxidation, with 83 % of the annual average in Beijing in 2019, which varied seasonally and was strongly regulated by the level of , nitrogen oxide, and ozone. Our results improve the understanding of nocturnal atmospheric oxidation in urban regions and contribute to our knowledge of nocturnal VOC oxidation and secondary organic pollution.
- Article
(2231 KB) - Full-text XML
-
Supplement
(3560 KB) - BibTeX
- EndNote


A large amount of NO emitted in cities is oxidized into NO2 by O3 in the atmosphere (Reaction R1), and NO2 continues to be oxidized into nitrate radical (NO3) by O3 (Reaction R2). NO3 is the main nocturnal tropospheric oxidant (Brown and Stutz, 2012; Wayne et al., 1991) with a relatively high concentration level at night due to it has rapid loss by photolysis (Reaction R3) and the reaction with NO during the daytime (Stark et al., 2007). These two reactions return NO3 back to NOx and thus cannot contribute to effective NOx removal. In addition, NO3 reacts with NO2 to form nitrous pentoxide (N2O5) (Reaction R5), and N2O5 can be decomposed to NO3 and NO2 (Reaction R6), establishing a temperature-dependent equilibrium.
During the nighttime, there are two kinds of reactions that have a large impact on air pollution and regulate the lifetime and budget of many trace gas species. One is NO3 oxidizing volatile organic compounds and forming complex products (Reaction R8). The other is NO3 being transformed into N2O5 and removed by heterogeneous hydrolysis (Reaction R9), providing an effective way to remove NOx and produce nitrate aerosol and nitryl chloride (Brown et al., 2004; Dentener and Crutz, 1993; Osthoff et al., 2008). The competition between Reactions (R8) and (R9) determines the fate of nocturnal nitrogen oxidation chemistry, which leads to the formation of different secondary pollutants (Bertram and Thornton, 2009; Brown et al., 2006). In particular, the degradation of volatile organic compounds (VOCs) by NO3, especially biogenic VOCs (BVOCs; Ng et al., 2017), has been proven to be related to the formation of organic nitrate and secondary organic aerosols (SOAs) (Goldstein and Galbally, 2009; Kiendler-Scharr et al., 2016).
The high NO3 concentration and fast reaction rate make NO3 responsible for the sinking of many unsaturated hydrocarbons at night (Edwards et al., 2017; Ng et al., 2017; Yang et al., 2020). The NO3 reactivity () towards VOC, defined as the consuming capacity of NO3 by ambient VOC, can be calculated by Eq. (1):
where [VOCi] is VOC concentrations and ki is the corresponding reaction rate coefficients. Table S1 in the Supplement gives the reaction rate coefficients of NO3 with VOC (Atkinson and Arey, 2003). The contribution of VOC to the NO3 reactivity with respect to different VOC varies greatly, which is caused by the abundance of species and the reaction rate coefficients. Thus, NO3 reactivity towards VOC is also affected by temperature since temperature affects not only the temperature-dependent reaction rate coefficients but also the VOC emissions in the atmosphere, especially for the emission of biogenic VOCs like isoprene and monoterpenes (Wu et al., 2020), leading to the variations in VOC species that dominate towards VOC in different seasons.
Previous works showed that the VOC species that dominate the NO3 reactivity vary greatly between different regions. In forests and rural areas, such as Pabstthum outside Berlin, Germany, the lush forests emitted a large number of monoterpenes and isoprene, accounting for the majority of , which ranged from 0.0025 to 0.01 s−1 (Asaf et al., 2009). In semi-arid urban areas such as Jerusalem, Israel, the emissions of BVOCs are lower due to the sparser vegetation, and the maximum of NO3 reactivity was about 0.01 s−1, in which the phenol, cresol, and some monoolefins emitted by road traffic were the main contributors (Asaf et al., 2009). In urban regions like Houston, USA, industrial emissions, including isoprene and other alkenes, dominated the NO3 reactivity (Stutz et al., 2010). In the city's suburbs, the may be jointly affected by anthropogenic and biogenic volatile organic compounds. For example, the NO3 reactivity towards VOC in Xianghe, Beijing, China, reached 0.024 ± 0.030 s−1, with a maximum value of 0.3 s−1 and minimum value of 0.0011 s−1. Isoprene, styrene, and 2-butene contributed to most of the (Yang et al., 2020).
The above NO3 reactivities are all calculated by the measurement of VOC concentrations. In addition to this method, an instrument was developed to measure in the atmosphere directly (Liebmann et al., 2017). This presented the first direct measurement of NO3 reactivity in the Finnish boreal forest in 2017. They concluded that the NO3 reactivity was generally high, with a maximum value of 0.94 s−1, displaying a strong diel variation with a nighttime mean value of 0.11 s−1 and daytime value of 0.04 s−1 (J. Liebmann et al., 2018). In 2018, they presented the direct measurement in and above the boundary layer of a mountain site, with daytime values of up to 0.3 s−1 and nighttime values close to 0.005 s−1 (J. M. Liebmann et al., 2018). Most importantly, the direct measurement revealed the existence of missing NO3 reactivity in various regions, which indicated the missing NO3 oxidation mechanisms. These results largely improved the understanding of nighttime chemistry.
Nevertheless, the direct field determination of is currently still extremely lacking, especially in urban regions. Until now, most works about the VOC oxidation by NO3 were usually based on short-term investigations, and the analysis of the nocturnal chemical process or reactivity was carried out based on the data of a few weeks or several months. Studies of nighttime chemistry based on long-term measurement data are very scarce (Vrekoussis et al., 2007; Wang et al., 2023; Zhu et al., 2022). The details of VOC contributions to and the relationships between certain VOCs and total NO3 reactivity over a long timescale are also rarely studied. Our recent work reported that the increasing trend of the NO3 production rate is caused by anthropogenic emission changes, while the long-term and detailed NO3 loss budget is still uncertain to some extent (Wang et al., 2023). Here, we attempt to look for insight into the level, variation, and impact of NO3 reactivity by using 1 year of VOC measurements in an urban site in Beijing; the role of unmeasured VOC species (monoterpenes) in the contributions of NO3 reactivity is also discussed. The long-term trend of NO3 reactivity is estimated by collecting the published VOC data and the newly proposed parameterization method. Finally, the nocturnal VOC oxidation by NO3 during different seasons was further evaluated.
2.1 Site description and instrumentation
The measurement was conducted at the campus of Peking University (39∘99′ N, 116∘30′ E) during the whole year of 2019. The site is situated northeast of the Beijing city center and near two traffic roads, which represent a typical urban and polluted area with fresh, anthropogenic emissions (Wang et al., 2017a). The measurements were made on a building roof with a height of 20 m above the ground. Measurements of VOC concentrations were performed using an automated gas chromatograph equipped with mass spectrometry or flame ionization detectors (GC-MS/FID). The volatile organic compounds were pre-treated by pre-freezing, collected in the deactivated quartz empty capillary at extremely low temperature (−150 ∘C), heated, and then delivered into the analysis system. After separation by the double chromatographic column, the low-carbon compounds C2-C4 were detected by the FID detector, and the high-carbon compounds C5-C10 were detected by the MS detector. There are 56 kinds of VOC measured in total (listed in Table S1 and the concentrations are depicted in Fig. S1 in the Supplement), in which monoterpene measurements are not valid. NOx and O3 were monitored by chemiluminescence (Thermo Scientific, 42i-TLE) and UV photometric methods (Thermo Scientific, 49i), respectively. A tapered element oscillating microbalance analyzer (TianHong, TH-2000Z1) was used to measure the mass concentration of PM2.5. The quality assurance and quality controls of data were implemented regularly (Chen et al., 2020). Photolysis frequencies were obtained by the Tropospheric Ultraviolet and Visible (TUV) model simulation. Hourly data were processed and used in the following analysis.
2.2 Estimation of monoterpenes
Since the measurement data did not include monoterpenes (MNTs), we therefore use the measured isoprene and modeled concentration ratio of monoterpene to isoprene in the same region of the measurement site (named “factor” in Eq. 2) to estimate the ambient monoterpene concentrations (named “MNTobs” in Eq. 3). The factor was obtained by the regional model (WRF/CMAQ); more details of the model simulation setup can be found in Mao et al. (2022). Briefly, the regional model CMAQ (Community Multiscale Air Quality) version 5.2 was applied to simulate air quality in eastern China, with a horizontal resolution of 36 km. Specifically, the gas-phase mechanism of SAPRC-07 and aerosol module AERO6 were used. The meteorological fields were provided by Weather Research and Forecasting (WRF) model version 4.2. The biogenic emissions were simulated by the MEGANv2.1 model, which was driven by WRF as well, and the emissions of open burning were estimated with FINN. The MEIC emission inventory for 2019 (obtained via private communication) was used to represent anthropogenic emissions over China, while the emissions in the areas outside China were provided by the REAS v3.2 inventory simulation.
We used the factor to estimate monoterpene levels rather than modeled monoterpene concentrations due to the modeled isoprene being systematically higher than that of the observation (Fig. S2). Thus, the use of the modeled factor may be more reasonable. In Beijing, α-pinene and β-pinene were reported to have the highest abundance among monoterpenes (Cheng et al., 2018), with higher emissions in summer (Wang et al., 2018b; Xia and Xiao, 2019). Therefore, we use a weighted reaction rate coefficient approximated by the average value of α-pinene and β-pinene with NO3 in the following calculations. Since the emissions of sesquiterpenes in BVOCs are much lower than those of isoprene, monoterpenes, and other BVOCs, we did not consider the contribution of sesquiterpenes to the reactivity. The detailed average diurnal variations in factor are listed in Table S2.
2.3 VOC oxidation rate by NO3
To study the reaction of NO3 and VOC during the nighttime, we estimated the NO3 concentrations by steady-state calculation. This method is widely used to estimate the concentrations of short-lived substances by assuming its production and loss rates are balanced in a specific time range. Given sufficient time, the steady state can be reached for NO3 at night, in which the production and loss terms are approximately balanced (Brown, 2003; Crowley et al., 2010). Here the production terms of NO3 are the reaction of NO2 and O3, and the loss terms of NO3 include reactions with VOC, reaction with NO, heterogeneous reaction, and photolysis. The steady-state NO3 mixing ratios are expressed by Eq. (4) (Brown and Stutz, 2012).
where is the sum of the photolysis coefficients of the two photolysis reactions of NO3. The khet is the heterogeneous uptake rate of N2O5 on the aerosol surface, which can be calculated by Eq. (5).
where γ is the dimensionless uptake coefficient of N2O5 parameterized by Eq. (6) (Evans and Jacob, 2005; Hallquist et al., 2003; Kane et al., 2001), Sa (m2 m−3) is the aerosol surface area density estimated by the level of PM2.5 (Wang et al., 2021), and c is the mean molecular velocity of N2O5.
The reaction rate coefficients of NO2 and O3, NO and NO3, and the equilibrium constant for the forward and reverse Reactions (R4) and (R5) are temperature dependent. We have adopted Jet Propulsion Laboratory (JPL) evaluation reports for the reaction rate coefficients. The time series of hourly related parameters in estimating the steady-state NO3 and the diurnal cycle of NO3 concentrations were shown in Figs. S3 and S4, respectively. To compare the VOC oxidation by NO3 with other oxidants, we estimated OH concentrations by the slope extracted from the measured OH and (s−1) in northern China (Tan et al., 2017) (Eq. 7), where used in this study was obtained by the TUV model simulations. The VOC oxidation rate () and the ratio of VOC oxidized by NO3 to the total oxidation rate can be calculated by Eq. (8).
where ki represents the corresponding reaction rate coefficients of different VOC with oxidants.
3.1 NO3 reactivity calculated by measured VOC
During the campaign, the hourly towards measured VOC (named ) varied widely from < 10−4 to 0.083 s−1 with a campaign-average value (± standard deviation) of 0.0032 ± 0.0042 s−1. The displayed a strong diel variation in the annual average (Fig. S5). In previous studies, the NO3 reactivity towards VOC was reported to be 0.024 ± 0.030 s−1 on average at a suburban site in summer in northern China (Yang et al., 2020) and highly varied between 0.005–0.3 s−1 at a mountaintop site in summer (J. M. Liebmann et al., 2018). Our result is an order of magnitude lower, which may reflect the huge difference in in different environments and sampling time. It could certainly be attributed to the fact that calculated here did not include some species, such as monoterpenes, phenol, and cresol. The diurnal variations in had strong seasonal variability (Fig. S6). The diurnal variations in winter and spring were relatively weak, and in summer and autumn they were strong, with clear peaks at 09:00–10:00 and 15:00 LT (local time), respectively. The in spring, summer, and autumn reached the daily maximum value between 8:00 and 10:00 LT (spring: 0.0034 s−1; summer: 0.0083 s−1; autumn: 0.0057 s−1). In winter, it reached the maximum value of 0.0033 s−1 at about 22:00 LT.
As shown in Fig. 1a, the reached the highest in August and lowest in February, which was largely affected by the level of isoprene and styrene. For example, isoprene contributed ∼ 80 % to the reactivity in August. The towards isoprene reached the maximum in August and the minimum in February, which was consistent with the previously reported change in isoprene concentrations in Beijing (Cheng et al., 2018). The shows a large seasonal difference with the average values (± standard deviation) of 0.0024±0.0026 s−1 (spring), 0.0067±0.0066 s−1 (summer), 0.0042±0.0037 s−1 (autumn) and 0.0027±0.0028 s−1 (winter). Table S3 shows the specific contributions of the top six species to in different seasons. Isoprene was the dominant species, accounting for 40.0 %, 77.2 %, and 43.2 % in spring, summer, and autumn. By comparison, styrene only played a leading role in winter, accounting for 39.8 %. Among the species that contributed to in Beijing, isoprene and styrene contributed the most to the overall (60 %–90 %), followed by cis-2-butene, trans-2-butene, trans-2-pentene, and propylene (5 %–15 %), with other VOCs contributing less than 2 %. Our results are consistent with previous studies in Beijing that was mainly contributed to by isoprene (Yang et al., 2020), indicating the critical role of isoprene in NO3 reactivity in Beijing. From summer to autumn, the dominant species changed from isoprene to styrene, while from winter to spring, the dominant species changed from styrene to isoprene. This indicates AVOCs (anthropogenic volatile organic compounds) and BVOCs (biogenic volatile organic compounds) control alternately. Overall, the was high in summer and autumn and low in winter and spring.
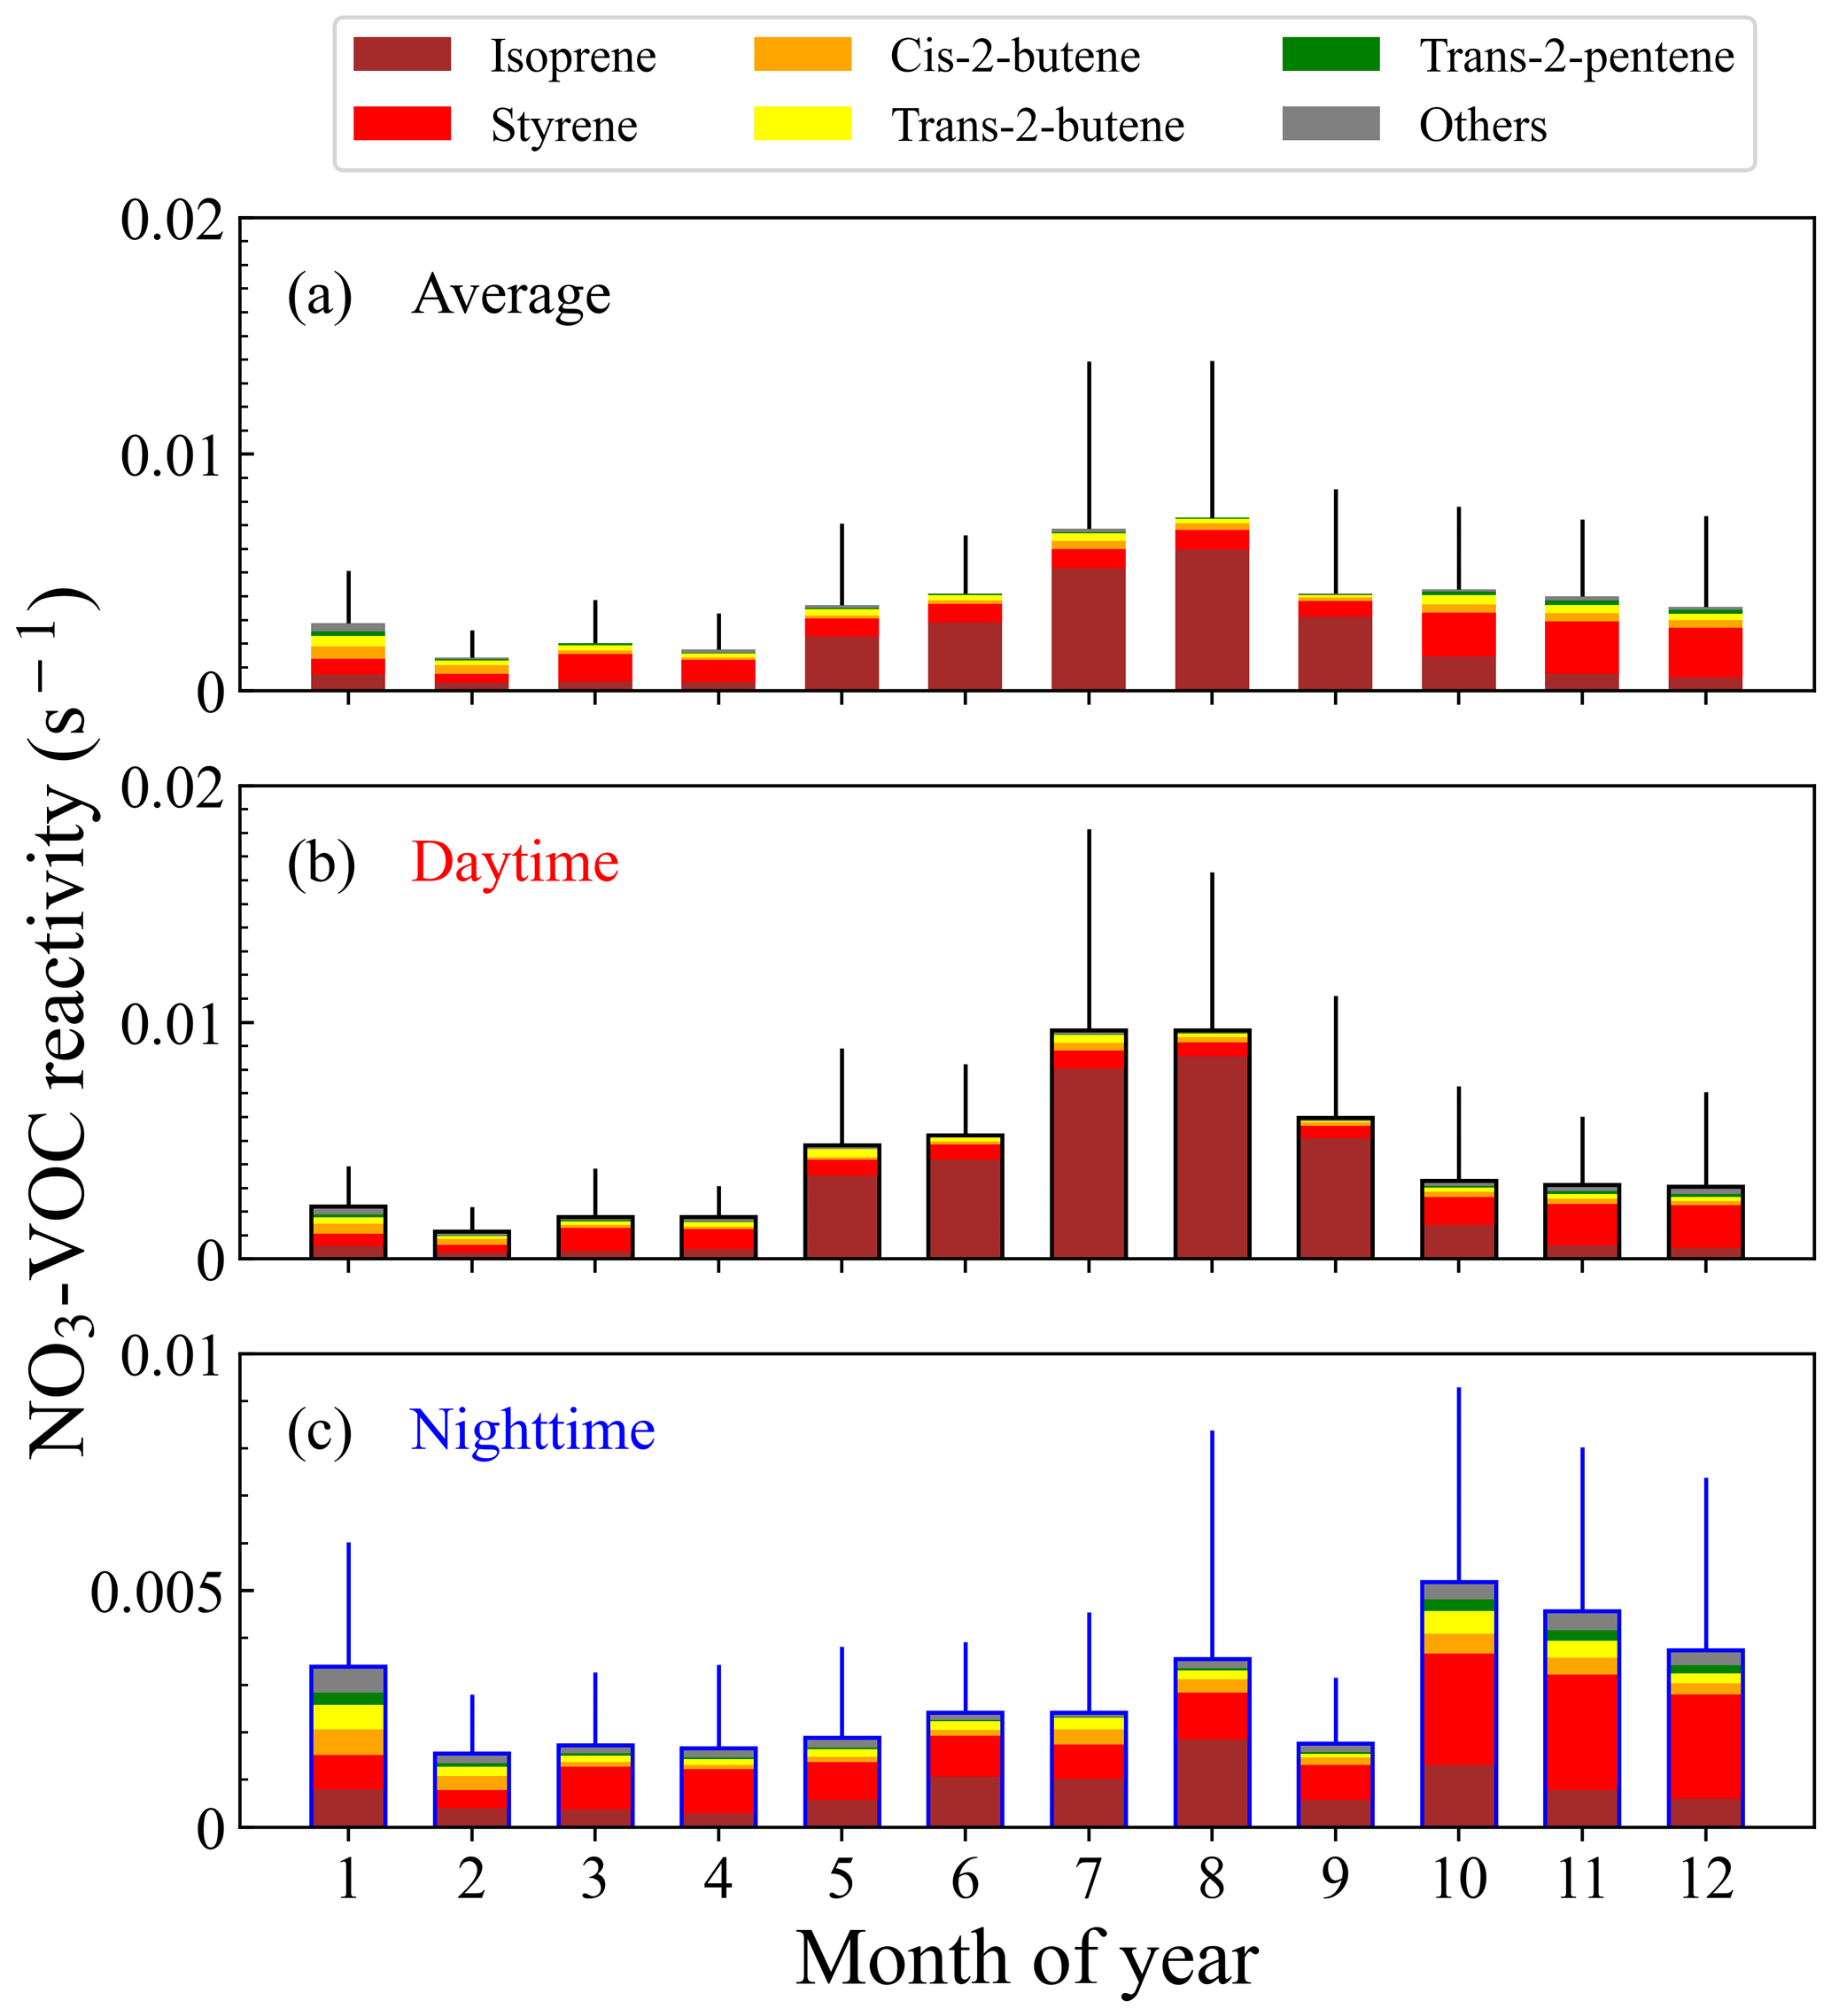
Figure 1Histograms of monthly averaged (a) and the compositions during the daytime (b) and nighttime (c). The color denotes the contributions of different VOC species. The lines represent the error bars of the reactivity (± standard deviation).
Figure 1b and c shows that the reactivity towards measured VOC displays clear day–night differences in summer and winter, especially in summer. The NO3 reactivity towards VOC in the daytime reached the value of 0.010 s−1 in July and August, which was much higher than the 0.002 s−1 in the nighttime. The variations were mainly caused by the diel variations in isoprene concentrations. Conversely, the reactivity was higher at night and lower in the daytime in winter, which was due to the high AVOC level in the morning and at night (Lee and Wang, 2006). Specifically, styrene concentrations at night increased significantly in the stable nocturnal boundary layer, resulting in relatively high reactivity.
In urban areas of Beijing, isoprene originates from anthropogenic and biogenic sources, and the anthropogenic sources of isoprene are mainly traffic emissions (Li et al., 2013; Riba et al., 1987; Zou et al., 2015). The isoprene emissions from biogenic sources in Beijing were an order of magnitude larger than those of anthropogenic sources (Yuan et al., 2009). This indicates the concentrations of isoprene at the environmental level in the urban areas of Beijing are not affected by the traffic vehicles but mainly by plants (Cheng et al., 2018). As an aromatic hydrocarbon, styrene originates from both anthropogenic and biogenic sources in the atmosphere (Miller et al., 1994; Mogel et al., 2011; Schaeffer et al., 1996; Tang et al., 2000; Zielinska et al., 1996; Zilli et al., 2001), such as the laminar flame of engine fuel (Meng et al., 2016), industrial production (Radica et al., 2021), and other human activities. The dominant source of styrene in Beijing is the local vehicle emissions (Li et al., 2014). Some vegetation, such as evergreen trees and oleander, can also release natural styrene (Wu et al., 2014); however, due to the dense industrial distribution in the urban area and the much lower level of biogenic styrene compared with isoprene, we believe that the styrene in the atmosphere in Beijing is mainly from anthropogenic origins. It is believed that human activities in winter, such as heating, gasoline, and diesel combustion, increased; meanwhile, the reduction in temperature and radiation resulted in a reduction in biogenic isoprene emissions, explaining the conversion in the dominance of NO3 reactivity from summer to winter.
The NO3 reactivity towards MNTs (named as ) was estimated by the method mentioned in Sect. 2.2. After taking MNTs into account, the total (named as ) was greatly enlarged, with a campaign-average value of 0.0061 ± 0.0088 s−1, resulting in our results being comparable with previous research results. The NO3 reactivity towards MNTs was higher in autumn and winter and lower in spring and summer (Fig. S7). Considering the corresponding reactivity towards monoterpenes, the total NO3 reactivity towards VOC changed from summer > autumn > winter > spring to autumn > winter > summer > spring, highlighting the impact of the monoterpene variations on the reactivity. The NO3 reactivity towards MNTs displayed significant differences between daytime and nighttime (Fig. S7c and d). The reactivity at night in all months was higher than that in the daytime, especially from October to January, highlighting the role of biogenic monoterpenes in nocturnal NO3 chemistry (Li et al., 2013; Riba et al., 1987). To evaluate the contribution of monoterpenes to the total , we calculated the fraction (FMNTs) using Eq. (9).
Figure 2a displays the differences between the and . Monoterpenes were very important for NO3 reactivity, and the FMNTs varied from 40 % to 80 %, with strong seasonal variations. The MNTs accounted for an NO3 reactivity of nearly 80 % in winter and spring. In the seasons when isoprene no longer dominated, the measured reactivity accounted for a small fraction, and the corresponding reactivity towards AVOC, such as styrene, was smaller than that of monoterpenes. As shown in Fig. 2b, the measured VOC had high fractions in the daytime and low fractions at night, especially in May and August. The measured VOC in the daytime accounted for more than 60 % of , which was closely related to the increasing concentrations of isoprene in the summer daytime. The reactivity towards MNTs accounted for a large fraction of reactivity at night.
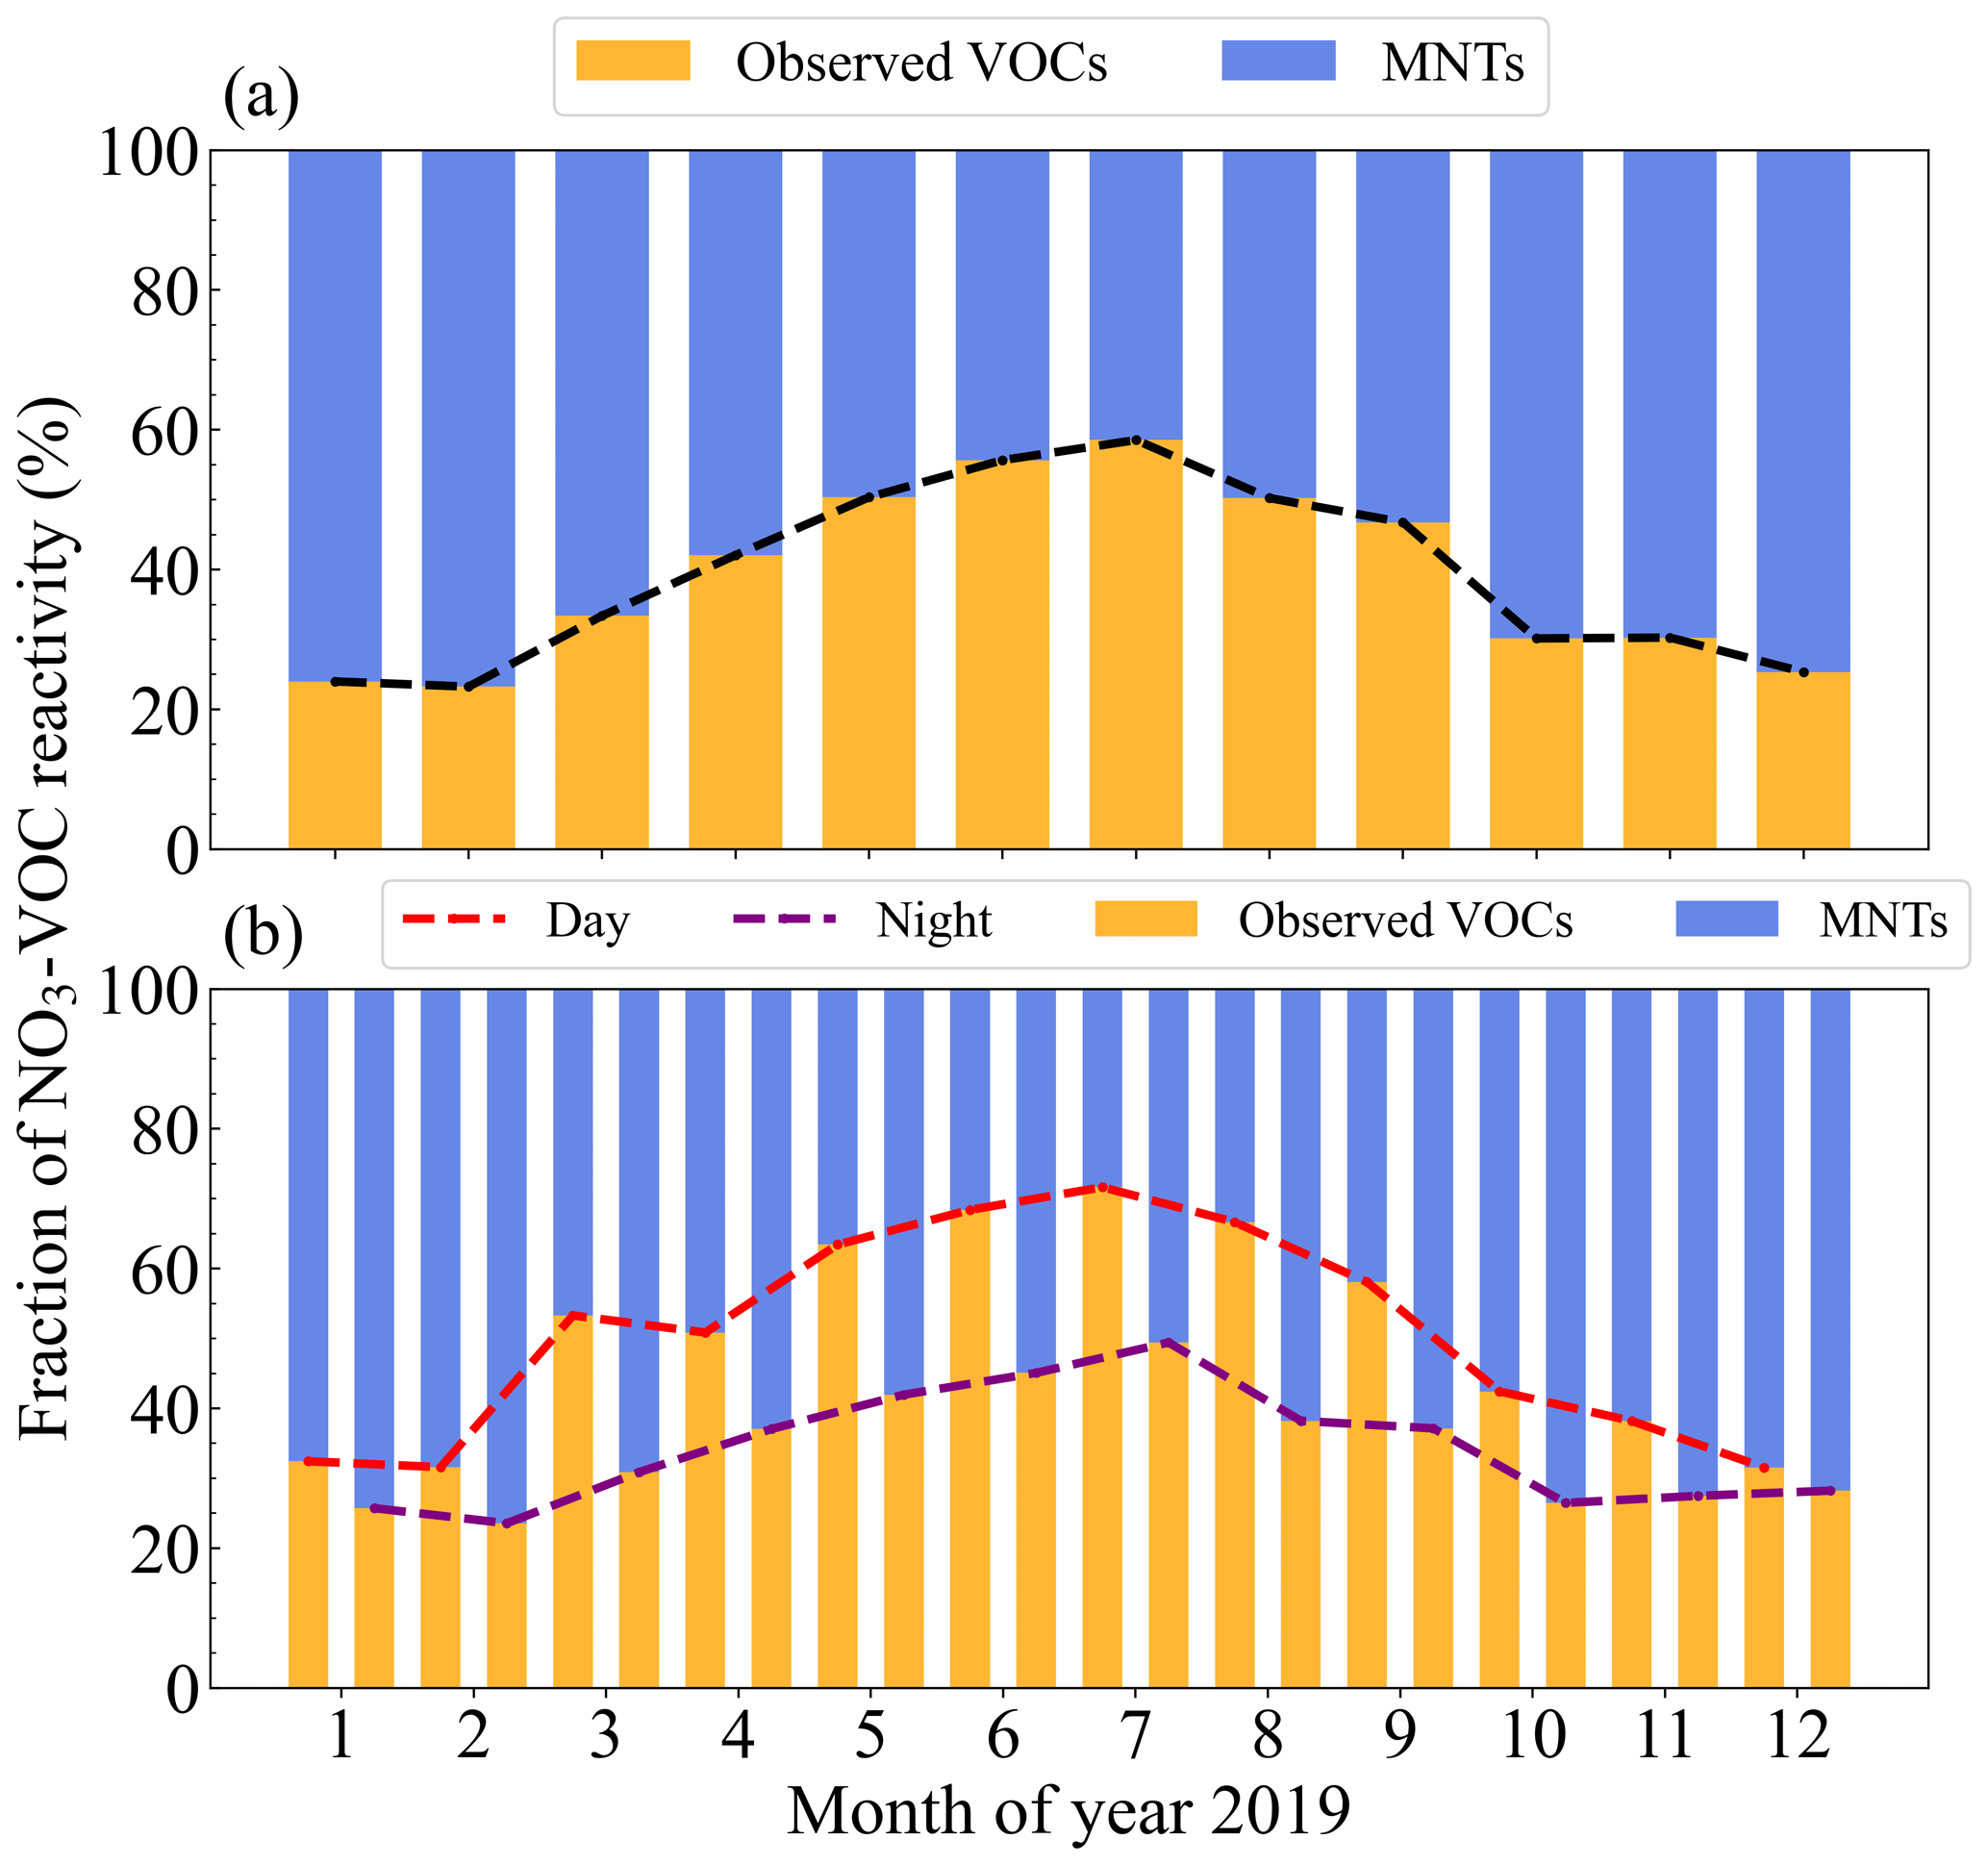
Figure 2(a) Fractions of the . (b) Fractions of the divided into daytime (left) and nighttime (right). The colors on the stacked bar plot indicate the different fractions as they are denoted in the legend. The lines represent the monthly averaged variations in the NO3 reactivity towards MNTs.
3.2 Parameterization of NO3 reactivity
We examined the correlation of key VOC concentrations and . Figure S8 gives the case in January, for example. To a certain extent, the variations in were closely linked to the variations in the concentrations of main contributors. It is worth noting that in January, trans-2-butene had a higher correlation coefficient with , which exceeded that of isoprene and styrene. This indicates that higher contributions may not imply a stronger correlation. Figure 3 shows the correlation coefficients and the fitting equations between VOC concentrations and in each month (detailed in Table S4). According to the correlation coefficients, we can select the strongest indicator corresponding to a certain month as the variable of the parameterization method. Here we did not import the VOC with small contributions into the parameterization method because these indicators had no practical significance for . In this way, we established the first parameterization method (Method 1) by using the strongest indicator in each month, which can be found in Table S4 (Eq. 10):
where a, b, and [VOC] represent the slope, the intercept, and the VOC species concentrations (ppbv) used for parameterization each month, respectively. The correlation coefficients between isoprene concentrations and were high throughout the year, ranging from 0.67 to 0.98, especially in summer. The correlation coefficients between styrene concentrations and the reactivity reached a maximum in autumn and winter, which gives an indication of the behavior of these two species (isoprene and styrene) in different seasons.
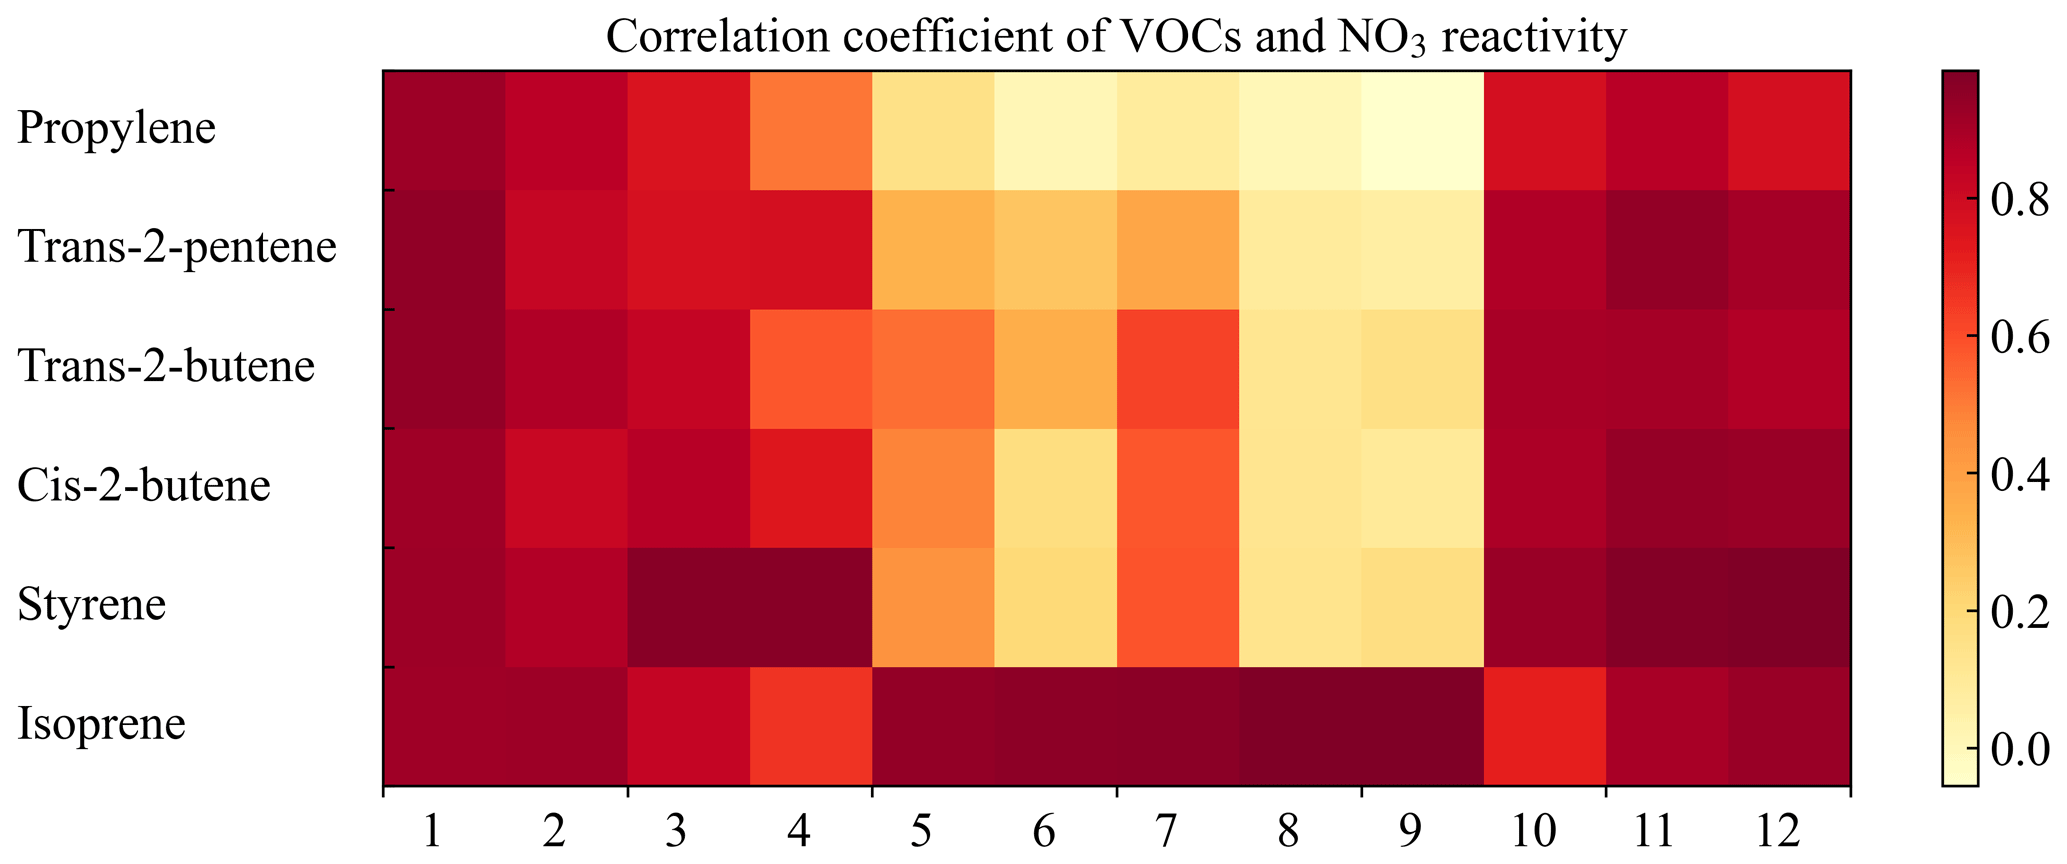
Figure 3A heat map of the monthly correlation between VOC concentrations and . Colored blocks indicate different correlations by which the best indicator can be selected for the parameterization method of each month.
Besides the indicator parameterization method, we can also select only the parts of the VOCs that contribute most of as a representative. Here we approximated NO3 reactivity towards total VOCs to the reactivity towards these top six species: isoprene, styrene, cis-2-butene, trans-2-butene, trans-2-pentene, and propylene. Thus, the second parameterization method (Method 2) can be expressed by Eq. (11):
where [VOCi] is the VOC concentrations and ki is the corresponding reaction rate coefficients with NO3. It should be noted that this parameterization method of NO3 reactivity towards VOC may be localized.
To evaluate the effectiveness of the two parameterization methods established above, we estimated the on the different timescales and compared them with the determined of all measured VOCs. As shown in Fig. S9, both methods can capture the level of and variations in well, indicating the parametrization feasibility. Method 1 can easily and quickly estimate NO3 reactivity towards VOCs using a single indicator. In areas where a single VOC species dominates NO3 reactivity towards VOCs for a long time, such as forest areas, suburbs, and rural areas (BVOC dominant), this method would have a good performance. Method 2 had a better performance, while more VOC species are needed. In urban areas, especially in urban areas where the contributors had different chemodiversity with strong seasonality, this method should be more suitable. Since the two methods lower the bar for estimating NO3 reactivity by using VOC measurement data, we can investigate the level of NO3 reactivity using the reported VOC measurement data in the past.
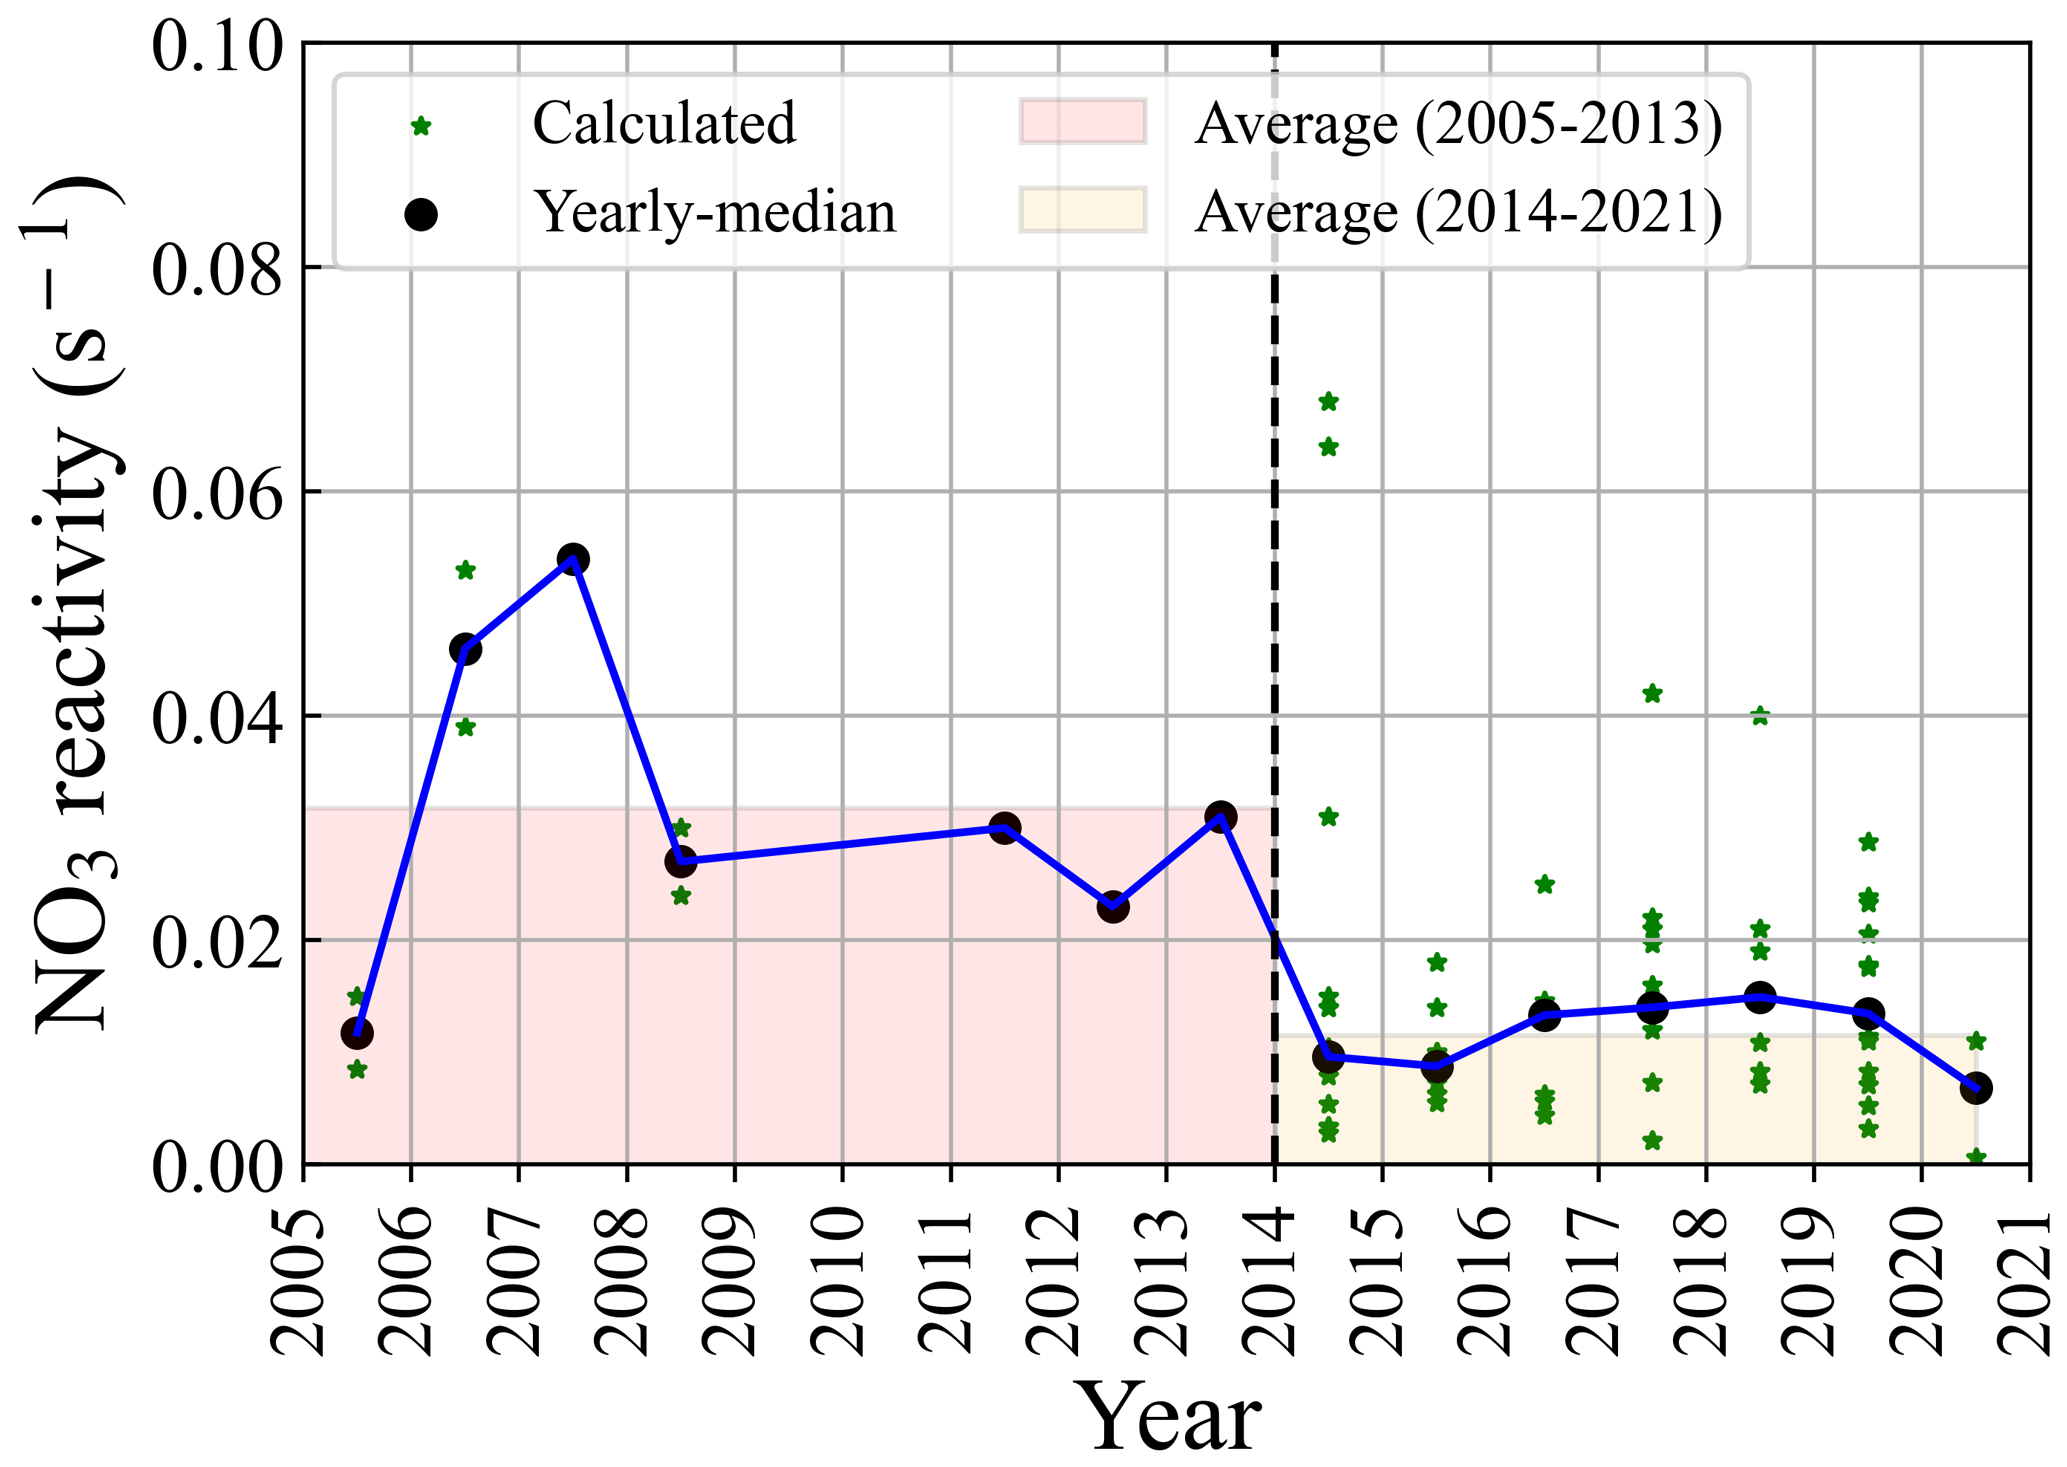
Figure 4The reported VOC concentrations in Beijing calculated using the reconstructed NO3 reactivity record from 2005–2021. The averaged NO3 reactivity calculated by the reported VOC data in each campaign is plotted as the star. The median values of NO3 reactivity (black dot) in each year show high values during 2005–2013 and relatively low values during 2014–2021. It should be noted that the monoterpenes are not considered here.
We collected the historical measurement data of VOC concentrations in Beijing (Fig. S1 in the Supplement) and estimated NO3 reactivity using parameterization methods. We found the level of NO3 reactivity mainly ranged from 0.001 to 0.1 s−1 in Beijing in the past few decades (Fig. 4). During 2014–2020, a large amount of VOC data in urban Beijing was collected in this study and are presented here. We calculated the using detailed VOC data provided by the literature and estimated the NO3 reactivity using parameterization methods if the reported data in the literature were limited. As shown in Fig. 4, NO3 reactivity was relatively low after 2014 compared to previous measurements. We inferred that the level of isoprene during this period may be small since the change in biogenic emissions may not be significant. Thus, we proposed that the lower NO3 reactivity during the past decade may be attributed to emission reductions regarding anthropogenic VOC. It should be noted that this estimation suffers from uncertainty; nevertheless, this trend and characterization of NO3 reactivity in Beijing is helpful to understand the nighttime chemistry in Beijing.
After considering MNTs, we updated the parameterization method established before by using the relationship between reactivity and VOC concentrations, including monoterpenes. The updated parameterization Method 1 used the same principle introduced in Sect. 3.2, with fitting slopes changing significantly (Fig. S10). Table S5 shows the correlation coefficients between six key VOC concentrations and . The updated Method 2 considered the sum contributions of six VOCs and the estimated MNTs by isoprene concentration. We reevaluated the two updated parameterization methods (single VOC and six VOCs, respectively). Overall, the performance of the two methods is reasonable, and the updated Method 1 is better than that of Method 2 in general (Fig. S11). We evaluated this parameterization using datasets of other years (shown in Fig. S12), and it showed a robust performance.
3.3 Nighttime VOC oxidation
Here we examined the role of NO3 in VOC oxidation in Beijing in 2019. As shown in Fig. S13, OH oxidized most of VOC during the daytime, with the oxidation rate reaching the maximum value of 0.6 pptv s−1 in the afternoon. Compared with OH, the VOC oxidation rates by O3 and NO3 in the daytime were remarkably low. From 18:00 to 06:00 LT, the ratios of VOC oxidized by NO3 kept above 80 %, and the contribution of O3 was relatively weak, which is consistent with that reported in regions of high NOx (Chen et al., 2019; Edwards et al., 2017; Wang et al., 2018a). The VOC oxidation rate by NO3 presented a single peak at 19:00 LT with a value of 0.25 pptv s−1, which is the same magnitude as that by OH in the daytime, illustrating the importance of NO3 in VOC oxidation, as shown in the previous studies (Wang et al., 2017a), implying the importance of nocturnal chemistry for organic nitrate and SOA formation.
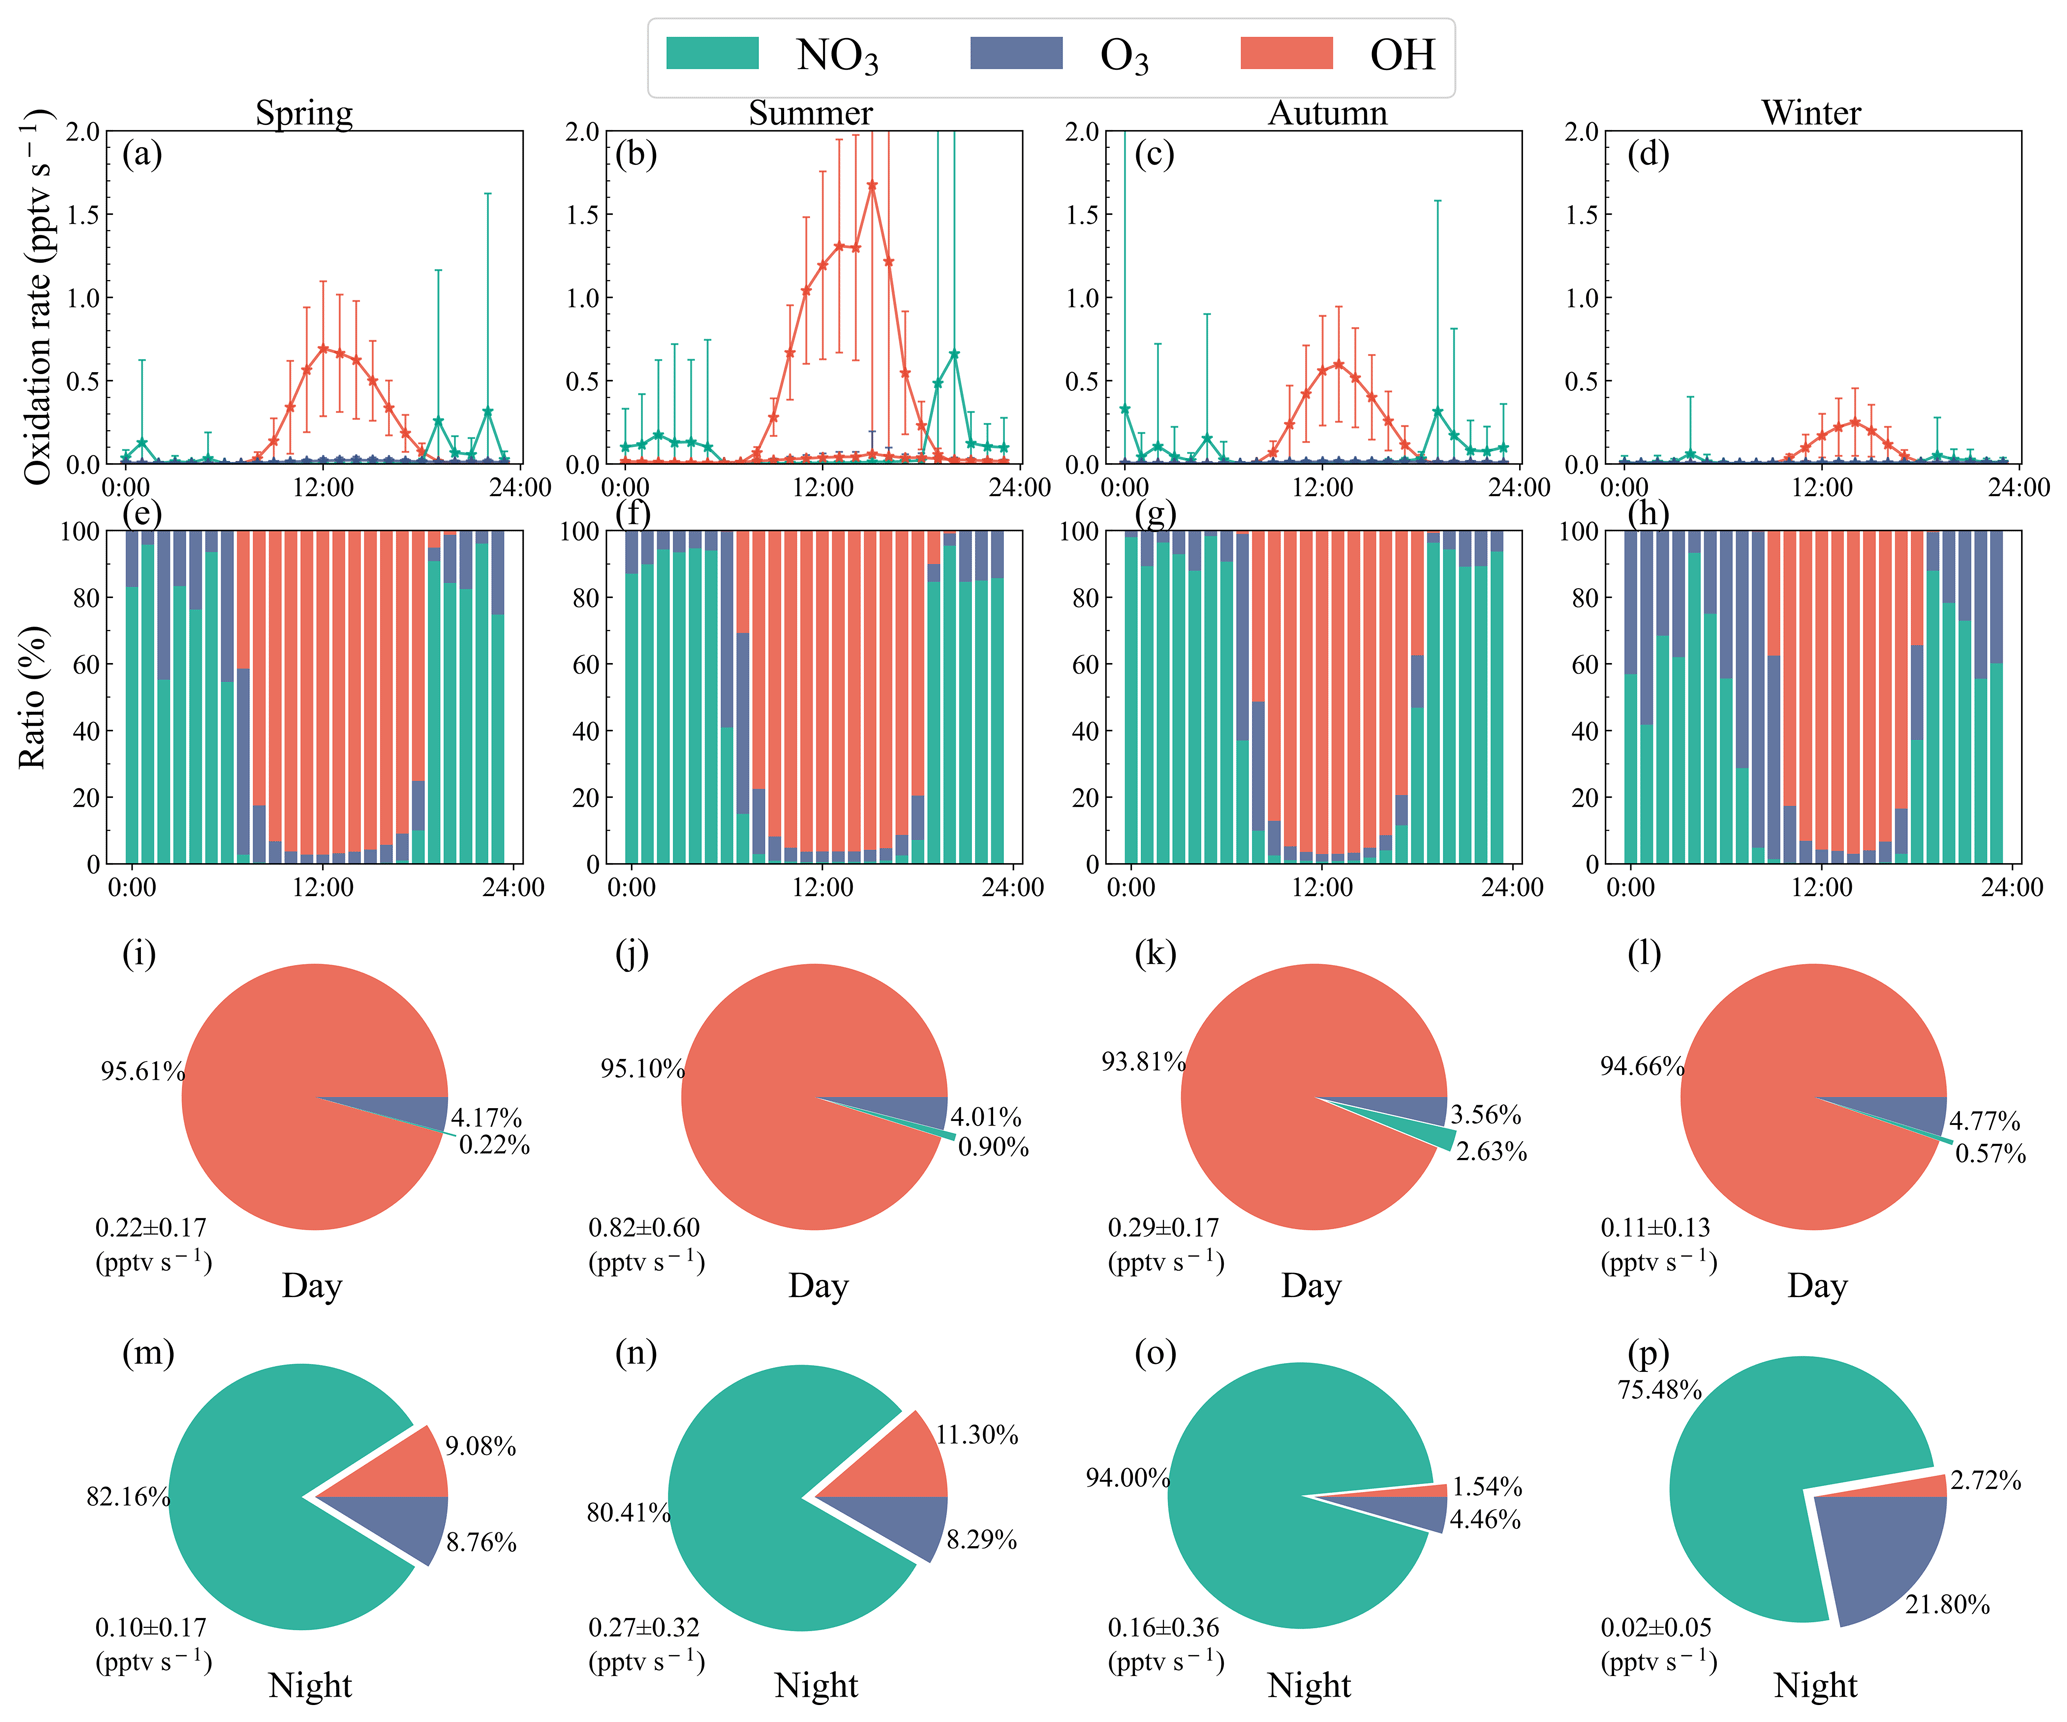
Figure 5(a–d) Median diurnal profiles (± standard deviation) of VOC oxidation rate by atmospheric oxidants in different seasons. (e–h) Fractions of VOC oxidation rate by atmospheric oxidants in different seasons. (i–p) Pie charts representing the daytime and nighttime VOC oxidation rate by OH, NO3, and O3 during different seasons, with the averaged values and standard deviations also shown.
The VOC oxidation rate by NO3 and oxidation fractions had strong seasonal variabilities in Beijing. As shown in Fig. 5, the nighttime oxidation rate (summer > spring > autumn > winter) was affected by NO3 concentrations and the total NO3 reactivity towards VOC. In summer, the NO3 oxidation rate presented a single peak, with a maximum value of 0.7 pptv s−1 at 20:00 LT, and it remained around 0.1 pptv s−1 for the rest of the night. The rate at 21:00–05:00 LT was relatively constant. The rate in winter was lower, with the two maximum values of 0.06 pptv s−1 presenting at 19:00 and 04:00 LT, which were lower than the average value of the other three seasons. The results agreed with the previous studies, in which the VOC oxidation rate by NO3 concentrations was high from 19:00–23:00 LT (Wang et al., 2017b). There was a competition between NO3 and O3 in the nighttime VOC oxidation in Beijing. Although the NO3 oxidation rate at night was higher than that of O3 throughout the year, the changes in O3 oxidation rate significantly impacted the ratios of VOC oxidized by NO3. The ratios of nighttime VOC oxidized by NO3 in Beijing were higher in autumn, spring, summer, and winter. Although the O3 concentrations in winter decreased, the competitiveness of NO3 in VOC oxidation decreased more due to the decline in NO3 concentrations. The competitiveness of O3 in VOC oxidation was relatively enhanced, resulting in a significant decline in the ratios of VOC oxidized by NO3.
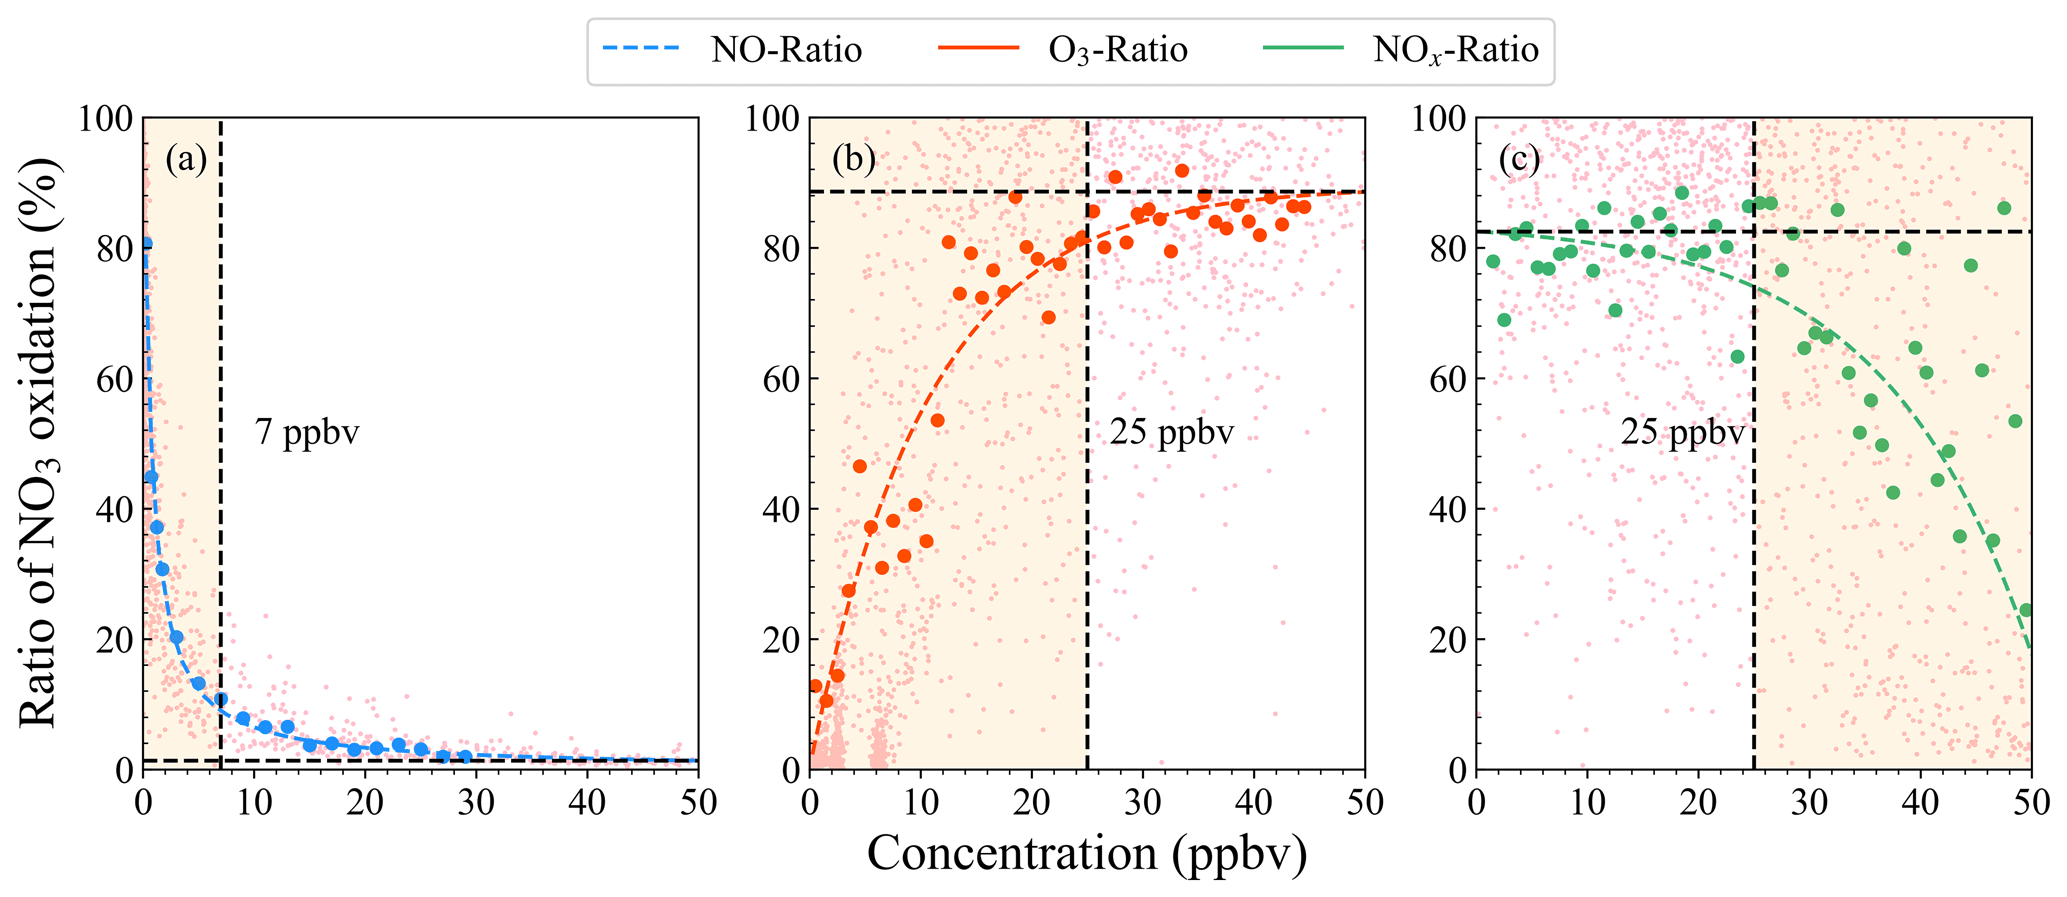
Figure 6Fitting diagrams between the ratios of nighttime VOC oxidized by NO3 and the concentrations of NO (a), O3 (b), and NOx (c). The light pink scattered dots represent the oxidation ratios at different concentrations, and the solid dots represent the median value of each bin of oxidation ratios corresponding to each concentration range. Colored dotted lines represent the fitting results of the solid median dots. The dotted black line in each panel shows a threshold to divide the curve into two regimes. In (a), the regime is divided into NO-limited (< 7 ppbv) and NO-saturated (> 7 ppbv); in (b) and (c), a threshold of 25 ppbv divides the curves into NOx-limited (O3) and NOx-saturated regimes. The results shown in (b) and (c) are representative of low-NO conditions (< 7 ppbv).
3.4 Relationship between O3 and NOx and nocturnal VOC oxidation by NO3
To understand the importance of nighttime VOC oxidized by NO3, we defined the fraction of VOC oxidation rate by NO3 to the total oxidation rate as nocturnal VOC oxidation ratio by NO3 (, see Sect. 2.3 for its calculation) and explored the relationship between the ratio and the nighttime concentrations of some species (such as O3, NOx). It is found that there is a strong nonlinear relationship between them (shown in Fig. 6). The had negative correlation coefficients with NO concentrations. With the increase in NO concentrations at night, the ratios decreased exponentially. When the NO concentrations increased under low-NO conditions, it could cause a significant decline in the ratios of VOC oxidized by NO3. Under high-NO conditions, the ratios were not sensitive to the increase in NO concentrations (Fig. S14), indicating that the nighttime NO concentrations in Beijing effectively and strongly controlled the ratios. This is expected since the increase in NO concentrations controlled the NO3 loss term and then caused the decrease in NO3 concentration. When the NO concentrations exceeded a threshold value (7 ppbv), the NO3 loss was dominated by NO.
The ratios of nighttime VOC oxidized by NO3 also had a strong nonlinear relationship with O3 and NOx concentrations. O3 concentrations have one positive and one negative contribution to the . The positive effect is that increasing the O3 concentration increases the NO3 production rate, which increases the NO3 steady-state concentrations and then increase the ratios. The negative is that increasing O3 concentrations increases the reaction rate between VOC and O3, which increases the competitiveness of O3 in terms of VOC oxidation and then decreases the ratios. Figure S14 also shows the relationship between and the concentrations of O3. While O3 concentrations were below 25 ppbv, the ratios were very sensitive to the O3 level, which quickly increased with O3 concentration. The ratio became insensitive to this and remained relatively constant when the O3 concentrations exceeded 25 ppbv. This can be explained as being due to the O3 concentrations being low and the NO3 production rate being more sensitive to the increase in O3 concentrations. In this case, O3 mainly affects the ratios positively. When the O3 concentrations were high, the positive effect of O3 tended to be constant, indicating that the two opposing effects remained in balance.
When the NOx concentrations were low (i.e., < 25 ppbv), the was less sensitive to NOx, remaining relatively constant with further increases. The increase in NO3 loss rates through the N2O5 heterogeneous reaction and the NO reaction was believed to be kept in balance with the NO3 production rate increased by NO2 concentrations. Under high-NOx conditions, the ratios sensitively decreased with the increase in NOx concentrations, which is explained by the increase in NO3 loss rates by NO, resulting in a decline in the ratios.
To better understand the nonlinear effect of NO2 and O3 on the nighttime VOC oxidation, we further explored the effect of O3 concentration on the ratios existing in different concentrations of NO2. As shown in Fig. S15, at higher concentrations of NO2, the threshold of lower O3 concentrations was required for the to become constant, which reflected the coupled influences of NO2 and O3 on nighttime VOC oxidation through the nonlinear response and indicated that nocturnal NO3 chemistry tended to be more dominant in the NO2-rich environment.
In this study, we showed that the NO3 reactivity towards measured VOC highly varied with big seasonal differences, mainly driven by isoprene concentrations. The top six contributors to the measured NO3 reactivity towards VOC were isoprene, styrene, cis-2-butene, trans-2-butene, trans-2-pentene, and propylene. Among them, isoprene and styrene contributed most of the reactivity. In addition, monoterpenes are proposed as a significant source of NO3 reactivity. Recently studies showed that anthropogenic emissions contribute significantly to the ambient MNT concentrations through biomass burning, traffic, and volatile chemical product emissions in the urban regions, it would further enhance the importance of nocturnal NO3 oxidation (Coggon et al., 2021; Nelson et al., 2021; Peng et al., 2022; Qin et al., 2020; Wang et al., 2022). It should be noted that the estimated contributions of MNTs only considered the biogenic emissions and may represent a lower bias. Thus, we highlight the importance of field observations of MNTs for advancing the understanding of nighttime NO3 chemistry. In addition, it should be noted that we did not take the contributions of OVOCs (oxygenated volatile organic compounds) into account since the reaction rate coefficients of OVOC with NO3 are small (Ambrose et al., 2007).
Looking for insight into the trend and evolution of detailed NO3 chemistry can be intimidating, but it can be helpful to understand the response of the nocturnal chemistry to the emission changes over large timescales. Limited by the non-extensive and non-continuous observations available, we cannot obtain long-term measurements of all VOC species at multiple sites. Since isoprene and styrene are good indicators of NO3 reactivity in different seasons, at least in urban Beijing, they can be used to estimate the NO3 reactivity towards VOC to re-establish the long-term trend of NO3 reactivity in urban regions for further evaluation of its history of nighttime chemistry. We admit that the estimation of the NO3 reactivity trend might be highly uncertain, but this attempt may be very helpful to determine the level of and overall change in nighttime chemistry.
We showed that NO3 dominated the nighttime VOC oxidation in Beijing, but the oxidation ratio had a strong nonlinear relationship with O3 and NOx concentrations. With the NO2 concentrations decreasing, the threshold values of O3 between the sensitive regime and non-sensitive regime tended to increase, indicating that the nighttime oxidation by NO3 would be more easily affected by the level of O3 with the implementation of sustained NOx reductions in the future. The threshold values of O3 can provide an effective basis for the measures to control nocturnal chemical and secondary organic aerosol pollution in typical urban regions.
The datasets used in this study are available from the corresponding author upon request (wanghch27@mail.sysu.edu.cn, k.lu@pku.edu.cn).
The supplement related to this article is available online at: https://doi.org/10.5194/acp-23-8211-2023-supplement.
HCW and KDL designed the study. HJH and HCW analyzed the data with input from JW, ZLZ, XZX, TYZ, XRC, XL, and SJF. WXF provided the modeled monoterpene and isoprene data. XL, LMZ, MH, and YHZ organized this field campaign and provided the field measurement dataset. HJH and HCW wrote the paper with input from KDL.
The contact author has declared that none of the authors has any competing interests.
Publisher's note: Copernicus Publications remains neutral with regard to jurisdictional claims in published maps and institutional affiliations.
The authors would like to thank the field campaign team for the data that they contributed.
This project has been supported by the National Natural Science Foundation of China (grant nos. 42175111 and 21976006); the Guangdong Major Project of Basic and Applied Basic Research (grant no. 2020B0301030004); and the Fundamental Research Funds for the Central Universities, Sun Yat-sen University (23lgbj002).
This paper was edited by Zhibin Wang and reviewed by two anonymous referees.
Ambrose, J. L., Mao, H., Mayne, H. R., Stutz, J., Talbot, R., and Sive, B. C.: Nighttime nitrate radical chemistry at Appledore island, Maine during the 2004 international consortium for atmospheric research on transport and transformation, J. Geophys. Res.-Atmos., 112, 19, https://doi.org/10.1029/2007jd008756, 2007.
Asaf, D., Pedersen, D., Matveev, V., Peleg, M., Kern, C., Zingler, J., Platt, U., and Luria, M.: Long-Term Measurements of NO3 Radical at a Semiarid Urban Site: 1. Extreme Concentration Events and Their Oxidation Capacity, Environ. Sci. Technol., 43, 9117–9123, https://doi.org/10.1021/Es900798b, 2009.
Atkinson, R. and Arey, J.: Atmospheric degradation of volatile organic compounds, Chem. Rev., 103, 4605–4638, https://doi.org/10.1021/cr0206420, 2003.
Bertram, T. H. and Thornton, J. A.: Toward a general parameterization of N2O5 reactivity on aqueous particles: the competing effects of particle liquid water, nitrate and chloride, Atmos. Chem. Phys., 9, 8351–8363, https://doi.org/10.5194/acp-9-8351-2009, 2009.
Brown, S. S.: Applicability of the steady state approximation to the interpretation of atmospheric observations of NO3 and N2O5, J. Geophys. Res., 108, 4539, https://doi.org/10.1029/2003jd003407, 2003.
Brown, S. S. and Stutz, J.: Nighttime radical observations and chemistry, Chem. Soc. Rev., 41, 6405–6447, https://doi.org/10.1039/c2cs35181a, 2012.
Brown, S. S., Dibb, J. E., Stark, H., Aldener, M., Vozella, M., Whitlow, S., Williams, E. J., Lerner, B. M., Jakoubek, R., Middlebrook, A. M., DeGouw, J. A., Warneke, C., Goldan, P. D., Kuster, W. C., Angevine, W. M., Sueper, D. T., Quinn, P. K., Bates, T. S., Meagher, J. F., Fehsenfeld, F. C., and Ravishankara, A. R.: Nighttime removal of NOx in the summer marine boundary layer, Geophys. Res. Lett., 31, 5, https://doi.org/10.1029/2004gl019412, 2004.
Brown, S. S., Ryerson, T. B., Wollny, A. G., Brock, C. A., Peltier, R., Sullivan, A. P., Weber, R. J., Dube, W. P., Trainer, M., Meagher, J. F., Fehsenfeld, F. C., and Ravishankara, A. R.: Variability in nocturnal nitrogen oxide processing and its role in regional air quality, Science, 311, 67–70, https://doi.org/10.1126/science.1120120, 2006.
Chen, S., Wang, H., Lu, K., Zeng, L., Hu, M., and Zhang, Y.: The trend of surface ozone in Beijing from 2013 to 2019: Indications of the persisting strong atmospheric oxidation capacity, Atmos. Environ., 242, 117801, https://doi.org/10.1016/j.atmosenv.2020.117801, 2020.
Chen, X., Wang, H., Liu, Y., Su, R., Wang, H., Lou, S., and Lu, K.: Spatial characteristics of the nighttime oxidation capacity in the Yangtze River Delta, China, Atmos. Environ., 208, 150–157, https://doi.org/10.1016/j.atmosenv.2019.04.012, 2019.
Cheng, X., Li, H., Zhang, Y. J., Li, Y. P., Zhang, W. Q., Wang, X. Z., Bi, F., Zhang, H., Gao, J., Chai, F. H., Lun, X. X., Chen, Y. Z., Gao, J., and Lv, J. Y.: Atmospheric isoprene and monoterpenes in a typical urban area of Beijing: Pollution characterization, chemical reactivity and source identification, J. Environ. Sci., 71, 150–167, https://doi.org/10.1016/j.jes.2017.12.017, 2018.
Coggon, M. M., Gkatzelis, G. I., McDonald, B. C., Gilman, J. B., Schwantes, R. H., Abuhassan, N., Aikin, K. C., Arend, M. F., Berkoff, T. A., Brown, S. S., Campos, T. L., Dickerson, R. R., Gronoff, G., Hurley, J. F., Isaacman-VanWertz, G., Koss, A. R., Li, M., McKeen, S. A., Moshary, F., Peischl, J., Pospisilova, V., Ren, X. R., Wilson, A., Wu, Y. H., Trainer, M., and Warneke, C.: Volatile chemical product emissions enhance ozone and modulate urban chemistry, P. Natl. Acad. Sci. USA, 118, e2026653118, https://doi.org/10.1073/pnas.2026653118, 2021.
Crowley, J. N., Schuster, G., Pouvesle, N., Parchatka, U., Fischer, H., Bonn, B., Bingemer, H., and Lelieveld, J.: Nocturnal nitrogen oxides at a rural mountain-site in south-western Germany, Atmos. Chem. Phys., 10, 2795–2812, https://doi.org/10.5194/acp-10-2795-2010, 2010.
Dentener, F. J. and Crutz, P. J.: Reaction of N2O5on tropospheric aerosols: impact on the global distributions of NOx, O3, OH, J. Geophys. Res., 98, 7149–7163, https://doi.org/10.1029/92jd02979, 1993.
Edwards, P. M., Aikin, K. C., Dube, W. P., Fry, J. L., Gilman, J. B., de Gouw, J. A., Graus, M. G., Hanisco, T. F., Holloway, J., Huber, G., Kaiser, J., Keutsch, F. N., Lerner, B. M., Neuman, J. A., Parrish, D. D., Peischl, J., Pollack, I. B., Ravishankara, A. R., Roberts, J. M., Ryerson, T. B., Trainer, M., Veres, P. R., Wolfe, G. M., Warneke, C., and Brown, S. S.: Transition from high- to low-NOx control of night-time oxidation in the southeastern US, Nat. Geosci., 10, 490–495, https://doi.org/10.1038/ngeo2976, 2017.
Evans, M. J. and Jacob, D. J.: Impact of new laboratory studies of N2O5 hydrolysis on global model budgets of tropospheric nitrogen oxides, ozone, and OH, Geophys. Res. Lett., 32, 4, https://doi.org/10.1029/2005gl022469, 2005.
Goldstein, A. H. and Galbally, I. E.: Known and unexplored organic constituents in the Earth's atmosphere, Geochim. Cosmochim. Ac., 73, A449–A449, 2009.
Hallquist, M., Stewart, D. J., Stephenson, S. K., and Cox, R. A.: Hydrolysis of N2O5 on sub-micron sulfate aerosols, Phys. Chem. Chem. Phys., 5, 3453–3463, https://doi.org/10.1039/b301827j, 2003.
Kane, S. M., Caloz, F., and Leu, M. T.: Heterogeneous Uptake of Gaseous N2O5 by (NH4)2SO4, NH4HSO4, and H2SO4 Aerosols, J. Phys. Chem. A, 105, 6465–6470, 2001.
Kiendler-Scharr, A., Mensah, A. A., Friese, E., Topping, D., Nemitz, E., Prevot, A. S. H., Aijala, M., Allan, J., Canonaco, F., Canagaratna, M., Carbone, S., Crippa, M., Dall Osto, M., Day, D. A., De Carlo, P., Di Marco, C. F., Elbern, H., Eriksson, A., Freney, E., Hao, L., Herrmann, H., Hildebrandt, L., Hillamo, R., Jimenez, J. L., Laaksonen, A., McFiggans, G., Mohr, C., O'Dowd, C., Otjes, R., Ovadnevaite, J., Pandis, S. N., Poulain, L., Schlag, P., Sellegri, K., Swietlicki, E., Tiitta, P., Vermeulen, A., Wahner, A., Worsnop, D., and Wu, H. C.: Ubiquity of organic nitrates from nighttime chemistry in the European submicron aerosol, Geophys. Res. Lett., 43, 7735–7744, https://doi.org/10.1002/2016gl069239, 2016.
Lee, B. S. and Wang, J. L.: Concentration variation of isoprene and its implications for peak ozone concentration, Atmos. Environ., 40, 5486–5495, https://doi.org/10.1016/j.atmosenv.2006.03.035, 2006.
Li, L., Wu, F., and Meng, X.: Seasonal and Diurnal Variation of Isoprene in the Atmosphere of Beijing, Environmental Monitoring in China, 29, 120–124, 2013.
Li, L., Li, H., Zhang, X. M., Wang, L., Xu, L. H., Wang, X. Z., Yu, Y. T., Zhang, Y. J., and Cao, G.: Pollution characteristics and health risk assessment of benzene homologues in ambient air in the northeastern urban area of Beijing, China, J. Environ. Sci., 26, 214–223, https://doi.org/10.1016/s1001-0742(13)60400-3, 2014.
Liebmann, J., Karu, E., Sobanski, N., Schuladen, J., Ehn, M., Schallhart, S., Quéléver, L., Hellen, H., Hakola, H., Hoffmann, T., Williams, J., Fischer, H., Lelieveld, J., and Crowley, J. N.: Direct measurement of NO3 radical reactivity in a boreal forest, Atmos. Chem. Phys., 18, 3799–3815, https://doi.org/10.5194/acp-18-3799-2018, 2018.
Liebmann, J. M., Schuster, G., Schuladen, J. B., Sobanski, N., Lelieveld, J., and Crowley, J. N.: Measurement of ambient NO3 reactivity: design, characterization and first deployment of a new instrument, Atmos. Meas. Tech., 10, 1241–1258, https://doi.org/10.5194/amt-10-1241-2017, 2017.
Liebmann, J. M., Muller, J. B. A., Kubistin, D., Claude, A., Holla, R., Plass-Dülmer, C., Lelieveld, J., and Crowley, J. N.: Direct measurements of NO3 reactivity in and above the boundary layer of a mountaintop site: identification of reactive trace gases and comparison with OH reactivity, Atmos. Chem. Phys., 18, 12045–12059, https://doi.org/10.5194/acp-18-12045-2018, 2018.
Mao, J., Li, L., Li, J., Sulaymon, I. D., Xiong, K., Wang, K., Zhu, J., Chen, G., Ye, F., Zhang, N., Qin, Y., Qin, M., and Hu, J.: Evaluation of Long-Term Modeling Fine Particulate Matter and Ozone in China During 2013–2019, Frontiers in Environmental Science, 10, 872249, https://doi.org/10.3389/fenvs.2022.872249, 2022.
Meng, X., Hu, E. J., Li, X. T., and Huang, Z. H.: Experimental and kinetic study on laminar flame speeds of styrene and ethylbenzene, Fuel, 185, 916–924, https://doi.org/10.1016/j.fuel.2016.08.019, 2016.
Miller, R. R., Newhook, R., and Poole, A.: Styrene production, use and human exposure, Crit. Rev. Toxicol., 24, S1-S10, https://doi.org/10.3109/10408449409020137, 1994.
Mogel, I., Baumann, S., Bohme, A., Kohajda, T., von Bergen, M., Simon, J. C., and Lehmann, I.: The aromatic volatile organic compounds toluene, benzene and styrene induce COX-2 and prostaglandins in human lung epithelial cells via oxidative stress and p38 MAPK activation, Toxicology, 289, 28–37, https://doi.org/10.1016/j.tox.2011.07.006, 2011.
Nelson, B. S., Stewart, G. J., Drysdale, W. S., Newland, M. J., Vaughan, A. R., Dunmore, R. E., Edwards, P. M., Lewis, A. C., Hamilton, J. F., Acton, W. J., Hewitt, C. N., Crilley, L. R., Alam, M. S., Şahin, Ü. A., Beddows, D. C. S., Bloss, W. J., Slater, E., Whalley, L. K., Heard, D. E., Cash, J. M., Langford, B., Nemitz, E., Sommariva, R., Cox, S., Shivani, Gadi, R., Gurjar, B. R., Hopkins, J. R., Rickard, A. R., and Lee, J. D.: In situ ozone production is highly sensitive to volatile organic compounds in Delhi, India, Atmos. Chem. Phys., 21, 13609–13630, https://doi.org/10.5194/acp-21-13609-2021, 2021.
Ng, N. L., Brown, S. S., Archibald, A. T., Atlas, E., Cohen, R. C., Crowley, J. N., Day, D. A., Donahue, N. M., Fry, J. L., Fuchs, H., Griffin, R. J., Guzman, M. I., Herrmann, H., Hodzic, A., Iinuma, Y., Jimenez, J. L., Kiendler-Scharr, A., Lee, B. H., Luecken, D. J., Mao, J., McLaren, R., Mutzel, A., Osthoff, H. D., Ouyang, B., Picquet-Varrault, B., Platt, U., Pye, H. O. T., Rudich, Y., Schwantes, R. H., Shiraiwa, M., Stutz, J., Thornton, J. A., Tilgner, A., Williams, B. J., and Zaveri, R. A.: Nitrate radicals and biogenic volatile organic compounds: oxidation, mechanisms, and organic aerosol, Atmos. Chem. Phys., 17, 2103–2162, https://doi.org/10.5194/acp-17-2103-2017, 2017.
Osthoff, H. D., Roberts, J. M., Ravishankara, A. R., Williams, E. J., Lerner, B. M., Sommariva, R., Bates, T. S., Coffman, D., Quinn, P. K., Dibb, J. E., Stark, H., Burkholder, J. B., Talukdar, R. K., Meagher, J., Fehsenfeld, F. C., and Brown, S. S.: High levels of nitryl chloride in the polluted subtropical marine boundary layer, Nat. Geosci., 1, 324–328, https://doi.org/10.1038/Ngeo177, 2008.
Peng, Y., Mouat, A. P., Hu, Y., Li, M., McDonald, B. C., and Kaiser, J.: Source appointment of volatile organic compounds and evaluation of anthropogenic monoterpene emission estimates in Atlanta, Georgia, Atmos. Environ., 288, https://doi.org/10.1016/j.atmosenv.2022.119324, 2022.
Qin, M., Murphy, B. N., Isaacs, K. K., McDonald, B. C., Lu, Q., McKeen, S. A., Koval, L., Robinson, A. L., Efstathiou, C., Allen, C., and Pye, H. O. T.: Criteria pollutant impacts of volatile chemical products informed by near-field modelling, Nat. Sustain., 4, 129–137, https://doi.org/10.1038/s41893-020-00614-1, 2020.
Radica, F., Della Ventura, G., Malfatti, L., Guidi, M. C., D'Arco, A., Grilli, A., Marcelli, A., and Innocenzi, P.: Real-time quantitative detection of styrene in atmosphere in presence of other volatile-organic compounds using a portable device, Talanta, 233, 7, https://doi.org/10.1016/j.talanta.2021.122510, 2021.
Riba, M. L., Tathy, J. P., Tsiropoulos, N., Monsarrat, B., and Torres, L.: Diurnal variation in the concentration of α- and β-pinene in the landes forest (France), Atmos. Environ., 21, 191–193, 1987.
Schaeffer, V., Bhooshan, B., Chen, S., Sonenthal, J., and Hodgson, A.: Characterization of Volatile Organic Chemical Emissions From Carpet Cushions, J. Air Waste Manage., 46, 813–820, 1996.
Stark, H., Lerner, B. M., Schmitt, R., Jakoubek, R., Williams, E. J., Ryerson, T. B., Sueper, D. T., Parrish, D. D., and Fehsenfeld, F. C.: Atmospheric in situ measurement of nitrate radical (NO3) and other photolysis rates using spectroradiometry and filter radiometry, J. Geophys. Res.-Atmos., 112, 11, https://doi.org/10.1029/2006jd007578, 2007.
Stutz, J., Wong, K. W., Lawrence, L., Ziemba, L., Flynn, J. H., Rappengluck, B., and Lefer, B.: Nocturnal NO3 radical chemistry in Houston, TX, Atmos. Environ., 44, 4099–4106, https://doi.org/10.1016/j.atmosenv.2009.03.004, 2010.
Tan, Z., Fuchs, H., Lu, K., Hofzumahaus, A., Bohn, B., Broch, S., Dong, H., Gomm, S., Häseler, R., He, L., Holland, F., Li, X., Liu, Y., Lu, S., Rohrer, F., Shao, M., Wang, B., Wang, M., Wu, Y., Zeng, L., Zhang, Y., Wahner, A., and Zhang, Y.: Radical chemistry at a rural site (Wangdu) in the North China Plain: observation and model calculations of OH, HO2 and RO2 radicals, Atmos. Chem. Phys., 17, 663–690, https://doi.org/10.5194/acp-17-663-2017, 2017.
Tang, W. C., Hemm, I., and Eisenbrand, G.: Estimation of human exposure to styrene and ethylbenzene, Toxicology, 144, 39–50, https://doi.org/10.1016/s0300-483x(99)00188-2, 2000.
Vrekoussis, M., Mihalopoulos, N., Gerasopoulos, E., Kanakidou, M., Crutzen, P. J., and Lelieveld, J.: Two-years of NO3 radical observations in the boundary layer over the Eastern Mediterranean, Atmos. Chem. Phys., 7, 315–327, https://doi.org/10.5194/acp-7-315-2007, 2007.
Wang, H., Lu, K., Chen, X., Zhu, Q., Chen, Q., Guo, S., Jiang, M., Li, X., Shang, D., Tan, Z., Wu, Y., Wu, Z., Zou, Q., Zheng, Y., Zeng, L., Zhu, T., Hu, M., and Zhang, Y.: High N2O5 Concentrations Observed in Urban Beijing: Implications of a Large Nitrate Formation Pathway, Environ. Sci. Tech. Let., 4, 416–420, https://doi.org/10.1021/acs.estlett.7b00341, 2017a.
Wang, H. C., Lu, K. D., Tan, Z. F., Sun, K., Li, X., Hu, M., Shao, M., Zeng, L. M., Zhu, T., and Zhang, Y. H.: Model simulation of NO3, N2O5 and ClNO2 at a rural site in Beijing during CAREBeijing-2006, Atmos. Res., 196, 97–107, https://doi.org/10.1016/j.atmosres.2017.06.013, 2017b.
Wang, H., Lu, K., Guo, S., Wu, Z., Shang, D., Tan, Z., Wang, Y., Le Breton, M., Lou, S., Tang, M., Wu, Y., Zhu, W., Zheng, J., Zeng, L., Hallquist, M., Hu, M., and Zhang, Y.: Efficient N2O5 uptake and NO3 oxidation in the outflow of urban Beijing, Atmos. Chem. Phys., 18, 9705–9721, https://doi.org/10.5194/acp-18-9705-2018, 2018a.
Wang, H., Lu, K., Guo, S., Wu, Z., Shang, D., Tan, Z., Wang, Y., Le Breton, M., Lou, S., Tang, M., Wu, Y., Zhu, W., Zheng, J., Zeng, L., Hallquist, M., Hu, M., and Zhang, Y.: Efficient N2O5 uptake and NO3 oxidation in the outflow of urban Beijing, Atmos. Chem. Phys., 18, 9705–9721, https://doi.org/10.5194/acp-18-9705-2018, 2018b.
Wang, H., Ma, X., Tan, Z., Wang, H., Chen, X., Chen, S., Gao, Y., Liu, Y., Liu, Y., Yang, X., Yuan, B., Zeng, L., Huang, C., Lu, K., and Zhang, Y.: Anthropogenic monoterpenes aggravating ozone pollution, Natl. Sci. Rev., 9, nwac103, https://doi.org/10.1093/nsr/nwac103, 2022.
Wang, H. C., Wang, H. L., Lu, X., Lu, K. D., Zhang, L., Tham, Y. J., Shi, Z. B., Aikin, K., Fan, S. J., Brown, S. S., and Zhang, Y. H.: Increased night-time oxidation over China despite widespread decrease across the globe, Nat. Geosci., 16, 217–223, https://doi.org/10.1038/s41561-022-01122-x, 2023.
Wang, H. C., Lu, K. D., Chen, S. Y., Li, X., Zeng, L. M., Hu, M., and Zhang, Y. H.: Characterizing nitrate radical budget trends in Beijing during 2013–2019, Sci. Total Environ., 795, 9, https://doi.org/10.1016/j.scitotenv.2021.148869, 2021.
Wayne, R. P., Barnes, I., Biggs, P., Burrows, J. P., Canosa-Mas, C. E., Hjorth, J., Le Bras, G., Moortgat, G. K., Perner, D., Poulet, G., Restelli, G., and Sidebottom, H.: The nitrate radical: physics, chemistry, and the atmosphere, Atmos. Environ. A-Gen., 25A, 1–203, https://doi.org/10.1016/0960-1686(91)90192-a, 1991.
Wu, K., Yang, X., Chen, D., Gu, S., Lu, Y., Jiang, Q., Wang, K., Ou, Y., Qian, Y., Shao, P., and Lu, S.: Estimation of biogenic VOC emissions and their corresponding impact on ozone and secondary organic aerosol formation in China, Atmos. Res., 231, 104656, https://doi.org/10.1016/j.atmosres.2019.104656, 2020.
Wu, L., Sun, Y., Tian, Y., and Su, D.: Composition Spectrum of Biogenic Volatile Organic Compounds Released by Typical Flowers in Beijing, Environ. Sci. Technol., 37, 154–158, 2014.
Xia, C. and Xiao, L.: Estimation of biogenic volatile organic compounds emissions in Jing-Jin-Ji, Acta Scientiae Circumstantiae, 39, 2680–2689, 2019.
Yang, Y., Wang, Y., Zhou, P., Yao, D., Ji, D., Sun, J., Wang, Y., Zhao, S., Huang, W., Yang, S., Chen, D., Gao, W., Liu, Z., Hu, B., Zhang, R., Zeng, L., Ge, M., Petäjä, T., Kerminen, V.-M., Kulmala, M., and Wang, Y.: Atmospheric reactivity and oxidation capacity during summer at a suburban site between Beijing and Tianjin, Atmos. Chem. Phys., 20, 8181–8200, https://doi.org/10.5194/acp-20-8181-2020, 2020.
Yuan, Z. B., Lau, A. K. H., Shao, M., Louie, P. K. K., Liu, S. C., and Zhu, T.: Source analysis of volatile organic compounds by positive matrix factorization in urban and rural environments in Beijing, J. Geophys. Res.-Atmos., 114, 14, https://doi.org/10.1029/2008jd011190, 2009.
Zhu, J., Wang, S., Zhang, S., Xue, R., Gu, C., and Zhou, B.: Changes in NO3 Radical and Its Nocturnal Chemistry in Shanghai From 2014 to 2021 Revealed by Long-Term Observation and a Stacking Model: Impact of China's Clean Air Action Plan, J. Geophys. Res.-Atmos., 127, e2022JD037438, https://doi.org/10.1029/2022jd037438, 2022.
Zielinska, B., Sagebiel, J. C., Harshfield, G., Gertler, A. W., and Pierson, W. R.: Volatile organic compounds up to C20 emitted from motor vehicles; Measurement methods, Atmos. Environ., 30, 2269–2286, 1996.
Zilli, M., Palazzi, E., Sene, L., Converti, A., and Del Borghi, M.: Toluene and styrene removal from air in biofilters, Process Biochem., 37, 423–429, https://doi.org/10.1016/s0032-9592(01)00228-x, 2001.
Zou, Y., Deng, X., Li, F., Wang, B., Tan, H., Deng, T., Mai, B., and Liu, X.: Variation characteristics, chemical reactivity and sources of isoprene in the atmosphere of Guangzhou, Acta Scientiae Circumstantiae, 35, 647–655, 2015.