the Creative Commons Attribution 4.0 License.
the Creative Commons Attribution 4.0 License.
 | 21 Jul 2023
Intra- and interannual changes in isoprene emission from central Amazonia
Eliane Gomes Alves
Raoni Aquino Santana
Cléo Quaresma Dias-Júnior
Santiago Botía
Tyeen Taylor
Ana Maria Yáñez-Serrano
Jürgen Kesselmeier
Efstratios Bourtsoukidis
Jonathan Williams
Pedro Ivo Lembo Silveira de Assis
Giordane Martins
Rodrigo de Souza
Sérgio Duvoisin Júnior
Alex Guenther
Anywhere Tsokankunku
Matthias Sörgel
Bruce Nelson
Davieliton Pinto
Shujiro Komiya
Diogo Martins Rosa
Bettina Weber
Cybelli Barbosa
Michelle Robin
Kenneth J. Feeley
Alvaro Duque
Viviana Londoño Lemos
Maria Paula Contreras
Alvaro Idarraga
Norberto López
Chad Husby
Brett Jestrow
Iván Mauricio Cely Toro
Isoprene emissions are a key component in biosphere–atmosphere interactions, and the most significant global source is the Amazon rainforest. However, intra- and interannual variations in biological and environmental factors that regulate isoprene emission from Amazonia are not well understood and, thereby, are poorly represented in models. Here, with datasets covering several years of measurements at the Amazon Tall Tower Observatory (ATTO) in central Amazonia, Brazil, we (1) quantified canopy profiles of isoprene mixing ratios across seasons of normal and anomalous years and related them to the main drivers of isoprene emission – solar radiation, temperature, and leaf phenology; (2) evaluated the effect of leaf age on the magnitude of the isoprene emission factor (Es) from different tree species and scaled up to canopy with intra- and interannual leaf age distribution derived by a phenocam; and (3) adapted the leaf age algorithm from the Model of Emissions of Gases and Aerosols from Nature (MEGAN) with observed changes in Es across leaf ages. Our results showed that the variability in isoprene mixing ratios was higher between seasons (max during the dry-to-wet transition seasons) than between years, with values from the extreme 2015 El Niño year not significantly higher than in normal years. In addition, model runs considering in situ observations of canopy Es and the modification on the leaf age algorithm with leaf-level observations of Es presented considerable improvements in the simulated isoprene flux. This shows that MEGAN estimates of isoprene emission can be improved when biological processes are mechanistically incorporated into the model.
- Article
(4325 KB) - Full-text XML
-
Supplement
(2434 KB) - BibTeX
- EndNote


Isoprene dominates the emission of biogenic volatile organic compounds (BVOCs) into the atmosphere, and its major global source is tropical vegetation (Guenther et al., 2012; Sindelarova et al., 2014). In the atmosphere, isoprene is a short-lived (minutes to hours) reactive BVOC species, and its photooxidation affects the atmospheric oxidation capacity contributing to the formation of ozone (O3) and secondary organic aerosols (SOAs) (Atkinson, 1997; Pöschl et al., 2010). With its high plant foliage biomass and rich plant diversity (ter Steege et al., 2013), the Amazon rainforest represents a key source of isoprene to the atmosphere (Yáñez-Serrano et al., 2020). However, model estimates of isoprene emission and its intra- and interannual variability in the Amazon still carry high uncertainty because only a few observational experiments have been conducted with mechanistic and process-based approaches, which hinders further modeling optimization (Alves et al., 2018; Yáñez-Serrano et al., 2020). One of the most critical knowledge gaps is how plants' isoprene emission differs under extremely hot and dry conditions, such as in El Niño years, and how this might affect atmospheric processes. As some studies have indicated that extreme years will become more frequent and intense with climate change (Nobre et al., 2016; Boulton et al., 2022), it is essential to understand the processes mediated by isoprene in such years to improve model estimates (Yáñez-Serrano et al., 2020; Artaxo et al., 2022).
Some reasons for uncertainties in isoprene model estimates are already known. The correct determination of the magnitude of the isoprene source – or the emission factor at leaf standard conditions (1000 photosynthetically active radiation – PAR, 30 ∘C), as it is conceptualized in models (e.g., Guenther et al., 1995) – is crucial to improve isoprene modeling estimates. The Amazonian plant biodiversity represents a considerable challenge for determining the isoprene emission factor. Although previous studies suggested that ∼ 1 % of tree species are hyperdominant – with their tree individuals responsible for half of all tree stems, carbon storage, and productivity (ter Steege et al., 2013; Fauset et al., 2015) –, it is still unclear which plant species can emit substantial amounts of isoprene (Monson et al., 2013), how these isoprene emitters are distributed throughout the Amazon basin, and how the isoprene emission factor varies seasonally and interannually as a result of changes in eco-physiological processes (Gomes Alves et al., 2022). Another source of uncertainty is related to quantifying the main sinks of isoprene. Once emitted by plant foliage, isoprene can undergo surface deposition onto the plant canopy (Karl et al., 2004) and soil (Pegoraro et al., 2006); can be oxidized at rates depending on the atmospheric concentration of other gases such as NOx, O3, and OH (Atkinson, 1997); and can be transported into and out of the atmospheric boundary layer (Wei et al., 2018). Additionally, the rapid conversion of isoprene photooxidation products can open a further sink for BVOCs in plants. This chemical and biological processing of emitted compounds may affect vertical transport processes, again influencing the biosphere (Kesselmeier et al., 2002; Canaval et al., 2020).
In addition, seasonal variation in isoprene emission from the Amazon rainforest has been reported by several in situ studies, with the indication that isoprene seasonality is driven by intra-annual variation in solar radiation, temperature, and leaf phenology (Kuhn et al., 2004a, b; Yáñez-Serrano et al., 2015; Alves et al., 2016, 2018; Wei et al., 2018; Langford et al., 2022). On a larger scale, satellite retrievals of isoprene oxidation products, like formaldehyde (Barkley et al., 2009; Bauwens et al., 2016), and direct retrieval of isoprene (Fu et al., 2019; Wells et al., 2022) have given an initial view of the long-term Amazon isoprene emission, enabling not only seasonal but also interannual comparisons. Yet, there remains a need to parameterize and evaluate the estimations with local and regional measurements and to gain a better understanding of the main processes related to sources and sinks of isoprene, since some studies have shown that satellite-derived isoprene emission values are either overestimated (Alves et al., 2016) or underestimated (Gu et al., 2017), or they even show maximum emissions in a different season when compared to in situ measurements (Alves et al., 2016, 2018).
Here we report in situ observations of isoprene mixing ratios during different seasons and in consecutive years in central Amazonia to evaluate intra- and interannual variabilities in 2 normal years (2013–2014) and 1 El Niño year (2015); in addition, we report observations of leaf-level isoprene emission factor and leaf phenology monitoring. With the intra- and interannual observations of isoprene at a central Amazonian site, this study proposes to (1) quantify the isoprene mixing ratios across seasons of normal and anomalous years and compare them with the main drivers of isoprene emission – solar radiation, temperature, and leaf phenology; (2) evaluate the effect of leaf age on the magnitude of the isoprene emission factor from different tree species and scale up with canopy intra- and interannual leaf age distribution; and (3) use the Model of Emissions of Gases and Aerosols from Nature (MEGAN) to assess the effects of the observed changes in the isoprene emission factor across leaf ages by modifying the leaf age algorithm and comparing simulations with observations at canopy level.
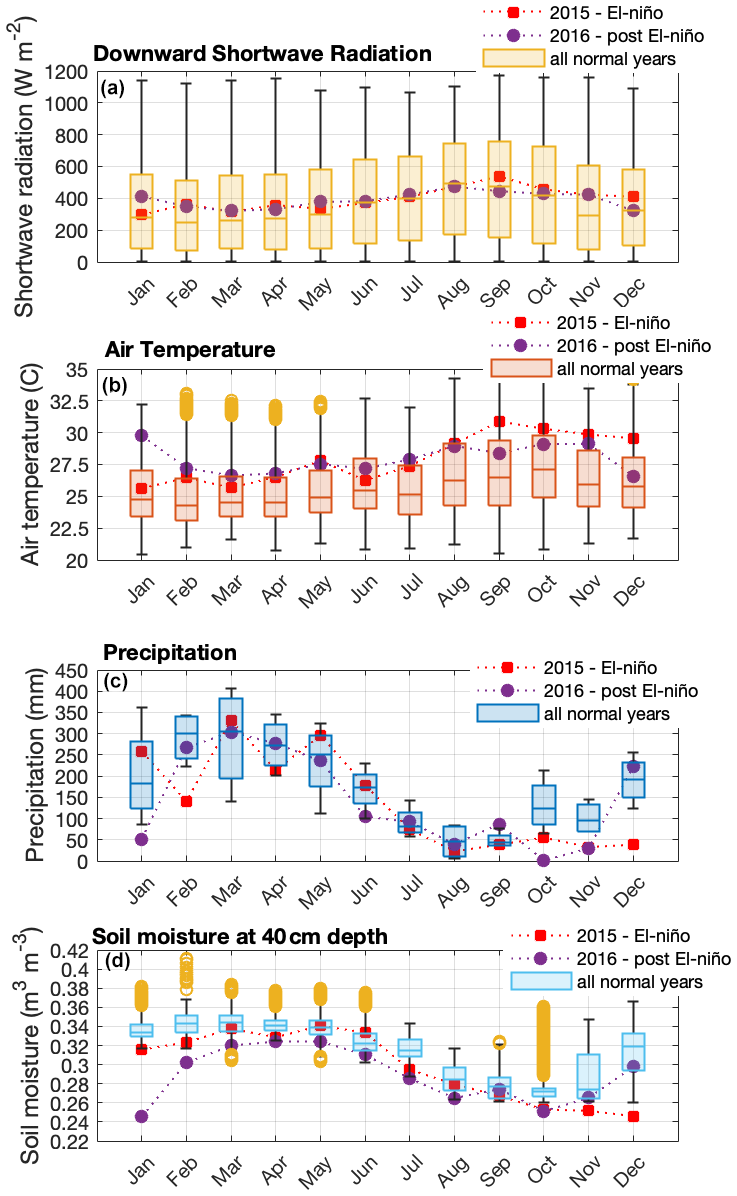
Figure 1Seasonal variation in solar radiation (a), air temperature (b), precipitation (c), and soil moisture (d) during normal years (2013, 2014, 2017, 2018, and 2019), an El Niño year (2015), and post-El Niño year (2016), measured at the ATTO site. Boxplots present the median and the lower and the upper quartiles, where the upper quartile corresponds to the 0.75 quantile and the lower quartile corresponds to the 0.25 quantile; whiskers connect the upper quartile and lower quartile to the maximum and minimum nonoutliers, respectively; and outliers are values that are more than 1.5 ⋅ IQR (interquartile range) away from the top or bottom of the box.
2.1 Amazon Tall Tower Observatory (ATTO)
We performed measurements at the ATTO site located 150 km northeast of Manaus in the Uatumã Sustainable Development Reserve (USDR) in central Amazonia. The climate is tropical humid with two distinctive seasons – wet season (December–May) and dry season (July–October) and transition seasons in between – and has a mean annual precipitation of 2380 mm (Tropical Rainfall Measuring Mission (TRMM) climatological average – 1998–2019; please see more details in Botía et al., 2022). The vegetation in this area is considered mature, mostly non-flooded rainforest (terra-firme) with a mean canopy height of 35 m, and predominantly occurs on plateaus at a maximum altitude of approximately 130 (above sea level; Andreae et al., 2015). Air masses arriving at the site predominantly come from the east (NE ∼ 20 %, ENE ∼ 27 %, E ∼ 33 %, ESE ∼ 19 %) (Zannoni et al., 2020) and have passed through 1500 km of undisturbed terra-firme rainforest, with minor intrusion of air masses from Manaus (Pöhlker et al., 2019). Figure 1 shows seasonal variation in solar radiation, air temperature, precipitation, and soil moisture from 2013 to 2019. Andreae et al. (2015) have more details on this experimental site.
2.2 Mixing ratios of isoprene – canopy level
Isoprene gradient mixing ratios were inferred by air samples collected from the INSTANT tower (80 m height, coordinates: 02∘08.7520′ S, 58∘59.9920′ W) at eight heights in and above the canopy (0.05, 0.5, 4, 12, 24, 38, 53, and 79 m) during intensive campaigns across different seasons from November 2012 to October 2015. Eight heated (50 ∘C) and insulated inlets (fluorinated ethylene propylene – FEP, o.d. in.) were connected to a quadrupole proton-transfer reaction mass spectrometer (PTRMS) (IONICON Analytic GmbH, Austria), using the primary ion H3O+ and operated under standard conditions (2.2 mbar drift pressure, 600 V drift voltage, 127 Td), which was housed in an air-conditioned container 10 m from the INSTANT tower. The inlets were guided to a valve system, switching every 2 min between the different heights, completing a full profile in 16 min. While an inlet was not sampled, it was flushed by a bypass pump at a flow rate of 16 L min−1. Humidity-dependent calibrations (using bubbled synthetic zero air to dilute the standard, regulated as close as possible to ambient humidity conditions) were performed using a gas cylinder containing isoprene ( 69). The dilution steps ranged from 22 to 0.8 ppb. To determine the background signal for isoprene, a catalytic converter (Supelco, Inc. with platinum pellets heated to > 400 ∘C) was used to convert ambient volatile organic compounds (VOCs) to CO2 + H2O. The background signal was measured once every hour and then interpolated over the time of the measurements. The detection limit for isoprene varied between 0.09 (wet season) and 0.1 ppb (dry season). The mean total uncertainty of isoprene mixing ratios was 9.9 %, within the PTRMS measurement uncertainty (∼ 10 %). For more details on the experimental setup, PTRMS conditions, and calibration, we refer the reader to Yáñez-Serrano et al. (2015).
2.3 Flux of isoprene – canopy level
During a campaign in November 2015, eddy covariance fluxes of isoprene were measured for 11 d. Isoprene concentrations were obtained with the above-described PTRMS at a time resolution of 1 s and from a separate in. inlet at 41 m height that sampled air at a flow rate of about 10 L min−1. A CSAT3 sonic anemometer (Campbell Scientific Inc., Logan, USA) measured the three-dimensional wind speed at high frequency (1 Hz) and was placed at a distance of 0.5 m from the isoprene inlet. Fluxes were then calculated by correlating fluctuations in the vertical wind vector to the fluctuations in isoprene concentrations with the software package EddyPro®(LI-COR Inc., Lincoln, USA). A method for despiking and raw data statistical screening was employed (Vickers and Mahrt, 1997). Half-hourly-averaged fluxes were flagged according to a method of data quality control (Mauder and Foken, 2004), and only data with the highest quality (flags 0 and 1) were used for further analyses. Losses for sampling frequencies between 0.1 and 0.8 Hz have been observed as below 10 % (Guenther and Hills, 1998; Spirig et al., 2005; Holst et al., 2010; Jensen et al., 2018). Footprints were calculated using a two-dimensional model for a geographic domain of 2 km × 2 km centered at the INSTANT tower (Kljun et al., 2015). The Tovi Footprint Analysis Toolbox (LI-COR Inc., Lincoln, USA) was used to calculate half-hourly footprints and to combine them for the measurement period. Mean daytime uncertainties of eddy covariance isoprene flux were at most 15 %. More details on the flux measurements and data processing are given in Pfannerstill et al. (2018).
2.4 Leaf area density – measurements with the light detection and ranging sensor (lidar)
Measurements of canopy leaf area density were carried out with a ground light detection and ranging sensor (lidar) at the ATTO site. These measurements aimed to give information on the canopy structure around the INSTANT tower. Ground-lidar surveys were conducted in October 2015 with a Riegl LD90-3100VHS-FLP system (Horn, Austria), which generated a canopy profile map in vertical and horizontal directions. We walked 10 transects of 150 m in length with the ground-lidar system. The transects were parallelly distributed at a distance of ∼ 100 m from each other, with six transects to the east-northeast, three transects to the west, and one transect to the south of the INSTANT tower. Measurements were averaged every 15 m of each transect, summing up to 10 measurements per transect. Measurements of all 10 transects were then averaged and presented with the confidence interval (95 %). More details about how the ground lidar data were analyzed can be obtained from Stark et al. (2012).
2.5 Leaf-level monitoring of leaf demography and phenology
Leaf demography and phenology of 36 trees were monitored from March 2016 to December 2017. Along 100 m of canopy walkways, canopy leaves were monitored monthly to determine leaf ages and investigate how leaf age proportions vary during the year. A total of 10 branches of each tree were randomly selected and labeled with one iron ring at their bottom end. All leaves attached from the bottom to the apical end were counted and dated according to the day of observation. For the first observation, all leaves were assigned with unknown age. In the following months, every time a new leaf was observed, the date of observation was recorded for that specific leaf. For leaf age determination, the date of the first observation of a new leaf was set back to 15 d before observation. The age was calculated by the difference, in the number of days, between the first day and the last day of observation, resulting in a number of days with a deviation of ± 15 d. For instance, if a new leaf was observed on 1 July 2017, the flushing date of this leaf was assigned for 17 June 2017 (± 15 d). Then, all subsequent measurements considered 17 June 2017 as a date for leaf flushing, and aging was counted based on the number of days that this leaf stayed attached to the branch.
2.6 Isoprene emission factor – leaf level
Leaves of 21 canopy tree species, out of the 36 trees monitored for leaf demography and phenology (described in Sect. 2.5), were measured to determine the isoprene emission factor across different leaf ages (Table S1 in the Supplement) from October to November 2017. The other 15 trees were unreachable with the sampling system and, therefore, were not measured. Leaf-level isoprene sampling was carried out in two to three leaves of each age class available for each tree during the measurement period, using a commercial portable gas exchange system GFS-3000 (Walz, Effeltrich, Germany). Each leaf was separately enclosed in the leaf chamber at standard conditions – photosynthetic photon flux density (PPFD) set to 1000 and leaf temperature to 30 ∘C – until net assimilation, stomatal conductance, and internal CO2 concentration were stable. The measurement stability criterion was assigned as 1 standard deviation of the net assimilation mean. The airflow rate going into the leaf chamber was 400 µmol s−1, and CO2 and H2O concentrations were 400 µmol mol−1 and 21 mmol mol−1 (relative humidity of ∼ 60 %), respectively. Air exiting the GFS-3000 leaf chamber was routed to fill sorbent cartridges (stainless steel tubes filled with Tenax TA and Carbograph 5TD sorbents), and a downstream pump sampled the exiting air at a rate of 200 sccm for 10 min. A hydrocarbon filter (Restek Pure Chromatography, Restek Corporations, USA) was installed at the air inlet of GFS-3000 to remove isoprene from the incoming ambient air, and all tubing in contact with the sampling air was made of PTFE. Before each measurement, a blank sample was obtained from the empty leaf chamber.
Isoprene content in the sorbent cartridges was determined in the laboratory at the University of California (Irvine, USA). All cartridges were placed into a thermally desorbing autosampler (TD100, Markes International, Inc). The isoprene was pre-concentrated at 10 ∘C followed by injection into a gas chromatograph (GC, model 7890B, Agilent Technologies, Inc) equipped with a time-of-flight mass spectrometer (Markes BenchTOF-SeV) and a flame ionization detector (TD-GC-FID/TOF-MS) (Woolfenden and McClenny, 1999; ASTM D6196-15, 2015). Internal standards tetramethylethylene and decahydronaphtalene were injected into each sample after collection and before analysis. The system was calibrated daily with a commercial isoprene standard from Apel Riemer Environmental Inc. The external gas standard was prepared using a dynamic dilution system, and the effluent was added to sorbent cartridges under conditions similar to those used for sampling. Once the volume mixing ratio of isoprene (ppbv) was obtained, leaf emission flux was determined using Eq. (1):
where F () is leaf flux of isoprene emission, Rppbv (nmol mol−1) is isoprene concentration of the sample (cartridge), Q is the flow rate of air into the leaf chamber (400 µmol s−1), and A is the area of leaf within the chamber (0.08 m2). The isoprene emission rate was then calculated and converted to milligrams per square meter per hour (). For more details on tree species, leaf age, and assigned leaf age class, see Table S1.
2.7 Tower-camera-derived leaf phenology and demography data
Upper-canopy leaf phenology was monitored with a StarDot RGB camera (model NetCam XL 3MP) installed at 81 m height on the ATTO INSTANT tower. For more details on the camera setup, radiometric calibration, and detection of phenological stages, we refer the reader to Lopes et al. (2016). Only images acquired near noon and under an overcast sky (diffuse illumination) were selected for subsequent analysis. The camera (subsequently called phenocam) monitored the upper-crown surfaces of 194 trees from July 2013 to November 2018. Images were analyzed to track the temporal trajectory of each tree crown and assign them into one of three classes: “leaf flushing” (crowns that showed a strong increase in greening), “leaf abscising” (crowns which showed a large increase in greying, which is the color of bare upper-canopy branches), or “no change”. By counting the number of individual trees per month for each category (flushing or abscission), we aggregated our census to the monthly scale. Of the monitored trees, 69 % (n = 134) had clear flushing and abscission patterns, and, using the number of days after each flushing event, we determined leaf age classes and attributed a fraction of the upper-canopy crowns to an age class at monthly intervals. We defined the following leaf age classes: (i) young leaves (0–1 month), (ii) growing (1–2 months), (iii) mature leaves (3–6 months), and (iv) old leaves (> 6 months). Then, we partitioned the age classes into classes of leaf area index (LAI) (i.e., young, growing, mature, and old LAI) by normalizing each leaf age class with the total LAI measured at ATTO. A constant LAI of 5.32 m2 m−2 was used for all months, since the variability in this number throughout the year was not statistically significant (unpublished results). For the normalization, we considered the total number of trees in the camera frame (n = 194), assuming that the 31 % that do not have clear flushing patterns are part of the old age class. For more details on the methods and assumptions for separating LAI into leaf age classes, see Wu et al. (2016). Datasets of flushing and abscission are available at https://doi.org/10.17871/atto.223.7.840 and the raw LAI age a classes at https://doi.org/10.17871/atto.230.4.842.
2.8 Isoprene emission trait – tree species level
To get more detailed information on the trees monitored with the camera, a total of 194 trees were taxonomically identified, and the isoprene emission trait was assigned. Isoprene emission data were obtained from published data and new measurements for the study species. New measurements were conducted at the ATTO research site (described in Sect. 2.6), and additional measurements were obtained using the PORCO method (Taylor et al., 2021), a customized photoionization detection system, on trees in tropical botanical gardens. Briefly, all PORCO measurements were made in situ on uncut “sun” branches by enclosing one to a few leaves inside rigid leaf cuvettes, acclimating them to darkness, and then exposing the leaves to photosynthetically active radiation controlled at 1000 and temperatures near 30 ∘C for 3.5 min of measurement time. Emission rates were corrected to a 30 ∘C equivalent based on a standard temperature response curve (Guenther et al., 1993). Emission rates exceeding 1 were considered positively indicative of isoprene emissions. See the full method validation and a discussion of the rarity of detection of other compounds as false positives for isoprene in Taylor et al. (2021). Botanic gardens used for tree measurements were A. Duque private collection, Retiro, Antioquia, Colombia; Fairchild Tropical Botanical Garden, Miami, FL, USA; Jardín Botánico de Cartagena “Guillermo Piñeres”, Turbaco, Bolívar, Colombia; Jardín Botánico “Joaquín Antonio Uribe” de Medellín, Antioquia, Colombia; Montgomery Botanical Garden, Miami, FL, USA; and Universidad Nacional de Medellín–Sede Medellín arboretum, Antioquia, Colombia.
For applying isoprene measurements from external datasets (botanic garden measurements or published literature) to our study species, we followed the methods of Taylor et al. (2018, 2019). We used data compiled from 12 literature sources (Bracho-Nunez et al., 2013; Geron et al., 2002; Harley et al., 2004; Keller and Lerdau, 1999; Klinger et al., 1998, 2002; Lerdau and Keller 1997; Padhy and Varshney, 2005; Tambunan et al., 2006; Taylor et al., 2018, 2021; Varshney and Singh, 2003). Tree species taxonomy was standardized by the Taxonomic Name Resolution Service (Boyle et al., 2013; Boyle et al., 2021). We assigned species data only in terms of the genetically determined capacity to produce isoprene (Monson et al., 2013); we did not consider the variability in the strength of emissions, for which data are more limited and potentially confounded by method variation and species plasticity. A species-level emission status – emitter or non-emitter – was applied where available in external datasets; otherwise, genus-level information was used to impute the emission status to unmeasured species. The proportion of measured species in a genus that emit isoprene was used as an estimate of the probability (pIE) that any species sampled from the genus would be an emitter. For a genus corresponding to one of our study species, for pIE ≤ , the species was estimated to be a non-emitter, and for pIE ≥ , the species was estimated to be an emitter. For values < pIE > , the genus average was considered ambiguous, and the species was excluded from the analyses. Whereas there is some expected error in the assignment of emission status to any given species, analyses of large numbers of species will tend toward the correct answer due to the tendency of genera to predominate in emitting or non-emitting species (Taylor et al., 2018). All species for which no emission data were available at the genus level were excluded from the analyses. The imputed isoprene emission status and associated information for each of our study species can be found in Table S2. The source data (literature reference or present study metadata) for each species that informed the imputation can be found in Table S3.
2.9 Modeled isoprene flux estimates – Model of Emissions of Gases and Aerosols from Nature (MEGAN)
Isoprene fluxes were simulated using the MEGAN version 2.1 model in which the flux activity factor for isoprene (γi) is proportional to the emission response to light (γP), temperature (γT), leaf age (γA), soil moisture (γSM), leaf area index (LAI), and CO2 inhibition () according to Eq. (2) (Guenther et al., 2012):
For this study, the canopy environment model of Guenther et al. (2006) was used with a canopy environment coefficient (CCE) of 0.57. MEGAN was run accounting for variations in light, temperature, and LAI separated into leaf age classes. CO2 inhibition and soil moisture activity factors were set equal to a constant of 1, assuming these parameters do not vary. For all simulations, we assumed no seasonal variation in soil moisture because the soil moisture observed in this site consistently exceeds the threshold for the isoprene drought response in MEGAN 2.1 (Guenther et al., 2012), which means that MEGAN would predict no variation in isoprene emission resulting from the observed changes in soil moisture (Fig. 1).
Solar radiation (PPFD) and air temperature inputs for all model simulations were obtained from measurements at the INSTANT tower. Air temperature at 36 m height above ground level (a.g.l.) was measured with a temperature and relative humidity sensor (CS215-L, Campbell Scientific Inc., Logan, Utah, USA). In cases where the air temperature measurement at 36 m height failed, the missing data were gap-filled with air temperature data available at other heights (73, 55, 40, 12 m), measured with CS215-L sensors installed on the INSTANT tower, or with the air temperature at 18 measured with a thermocouple (Conatex, St. Wendel, Germany), installed along one evergreen tree of the species Buchenavia parvifolia (Combretaceae), located 95 m away from the INSTANT tower. In cases where all the air temperature sensors failed for less than 4 h, the missing air temperature at 36 m height was gap-filled by linear interpolation, visually checking data quality. In cases where no air temperature measurement was available for a long time (e.g., 1 d, 2 months), occurring several times in 2013, the missing air temperature at 36 m height was gap-filled by a multiple regression model developed with three predictor variables: half-hourly variation in the soil temperature at 10 cm depth, soil heat flux, and volumetric soil water content at 40 cm depth. The model training period was from 2013 June to 2014 May because the three predictor variables were usually available through the 1-year period. The developed model was validated based on the observation dataset from June 2014 to May 2015, which showed good agreement with observed air temperature data at 36 m height during the validation period (R2 = 0.83; RMSE = 1.21; n = 7473). The developed and validated model was applied to the three predictor variables measured in 2013 for gap-filling the long-term missing data of air temperature at 36 m height. In cases where the predictor variables were unavailable in 2013, the missing data were gap-filled using Akima interpolation with visual data quality checks. Incoming and outgoing shortwave radiation was measured with a net radiometer (NR-Lite2, Kipp and Zonen, the Netherlands) at 75 In cases where the radiation measurement failed for no more than 1 h, the missing radiation data were gap-filled by linear interpolation, visually checking data quality. In cases where radiation data were unavailable for more than 1 h, the missing data were gap-filled by the mean diurnal course (over ± 15 d) method. Lastly, we used a constant value (5.32) for the LAI and normalized it with monthly leaf age fractions obtained from the phenocam observations to derive the canopy leaf age for each month (see Sect. 2.6). More details on model settings are found in Guenther et al. (2012).
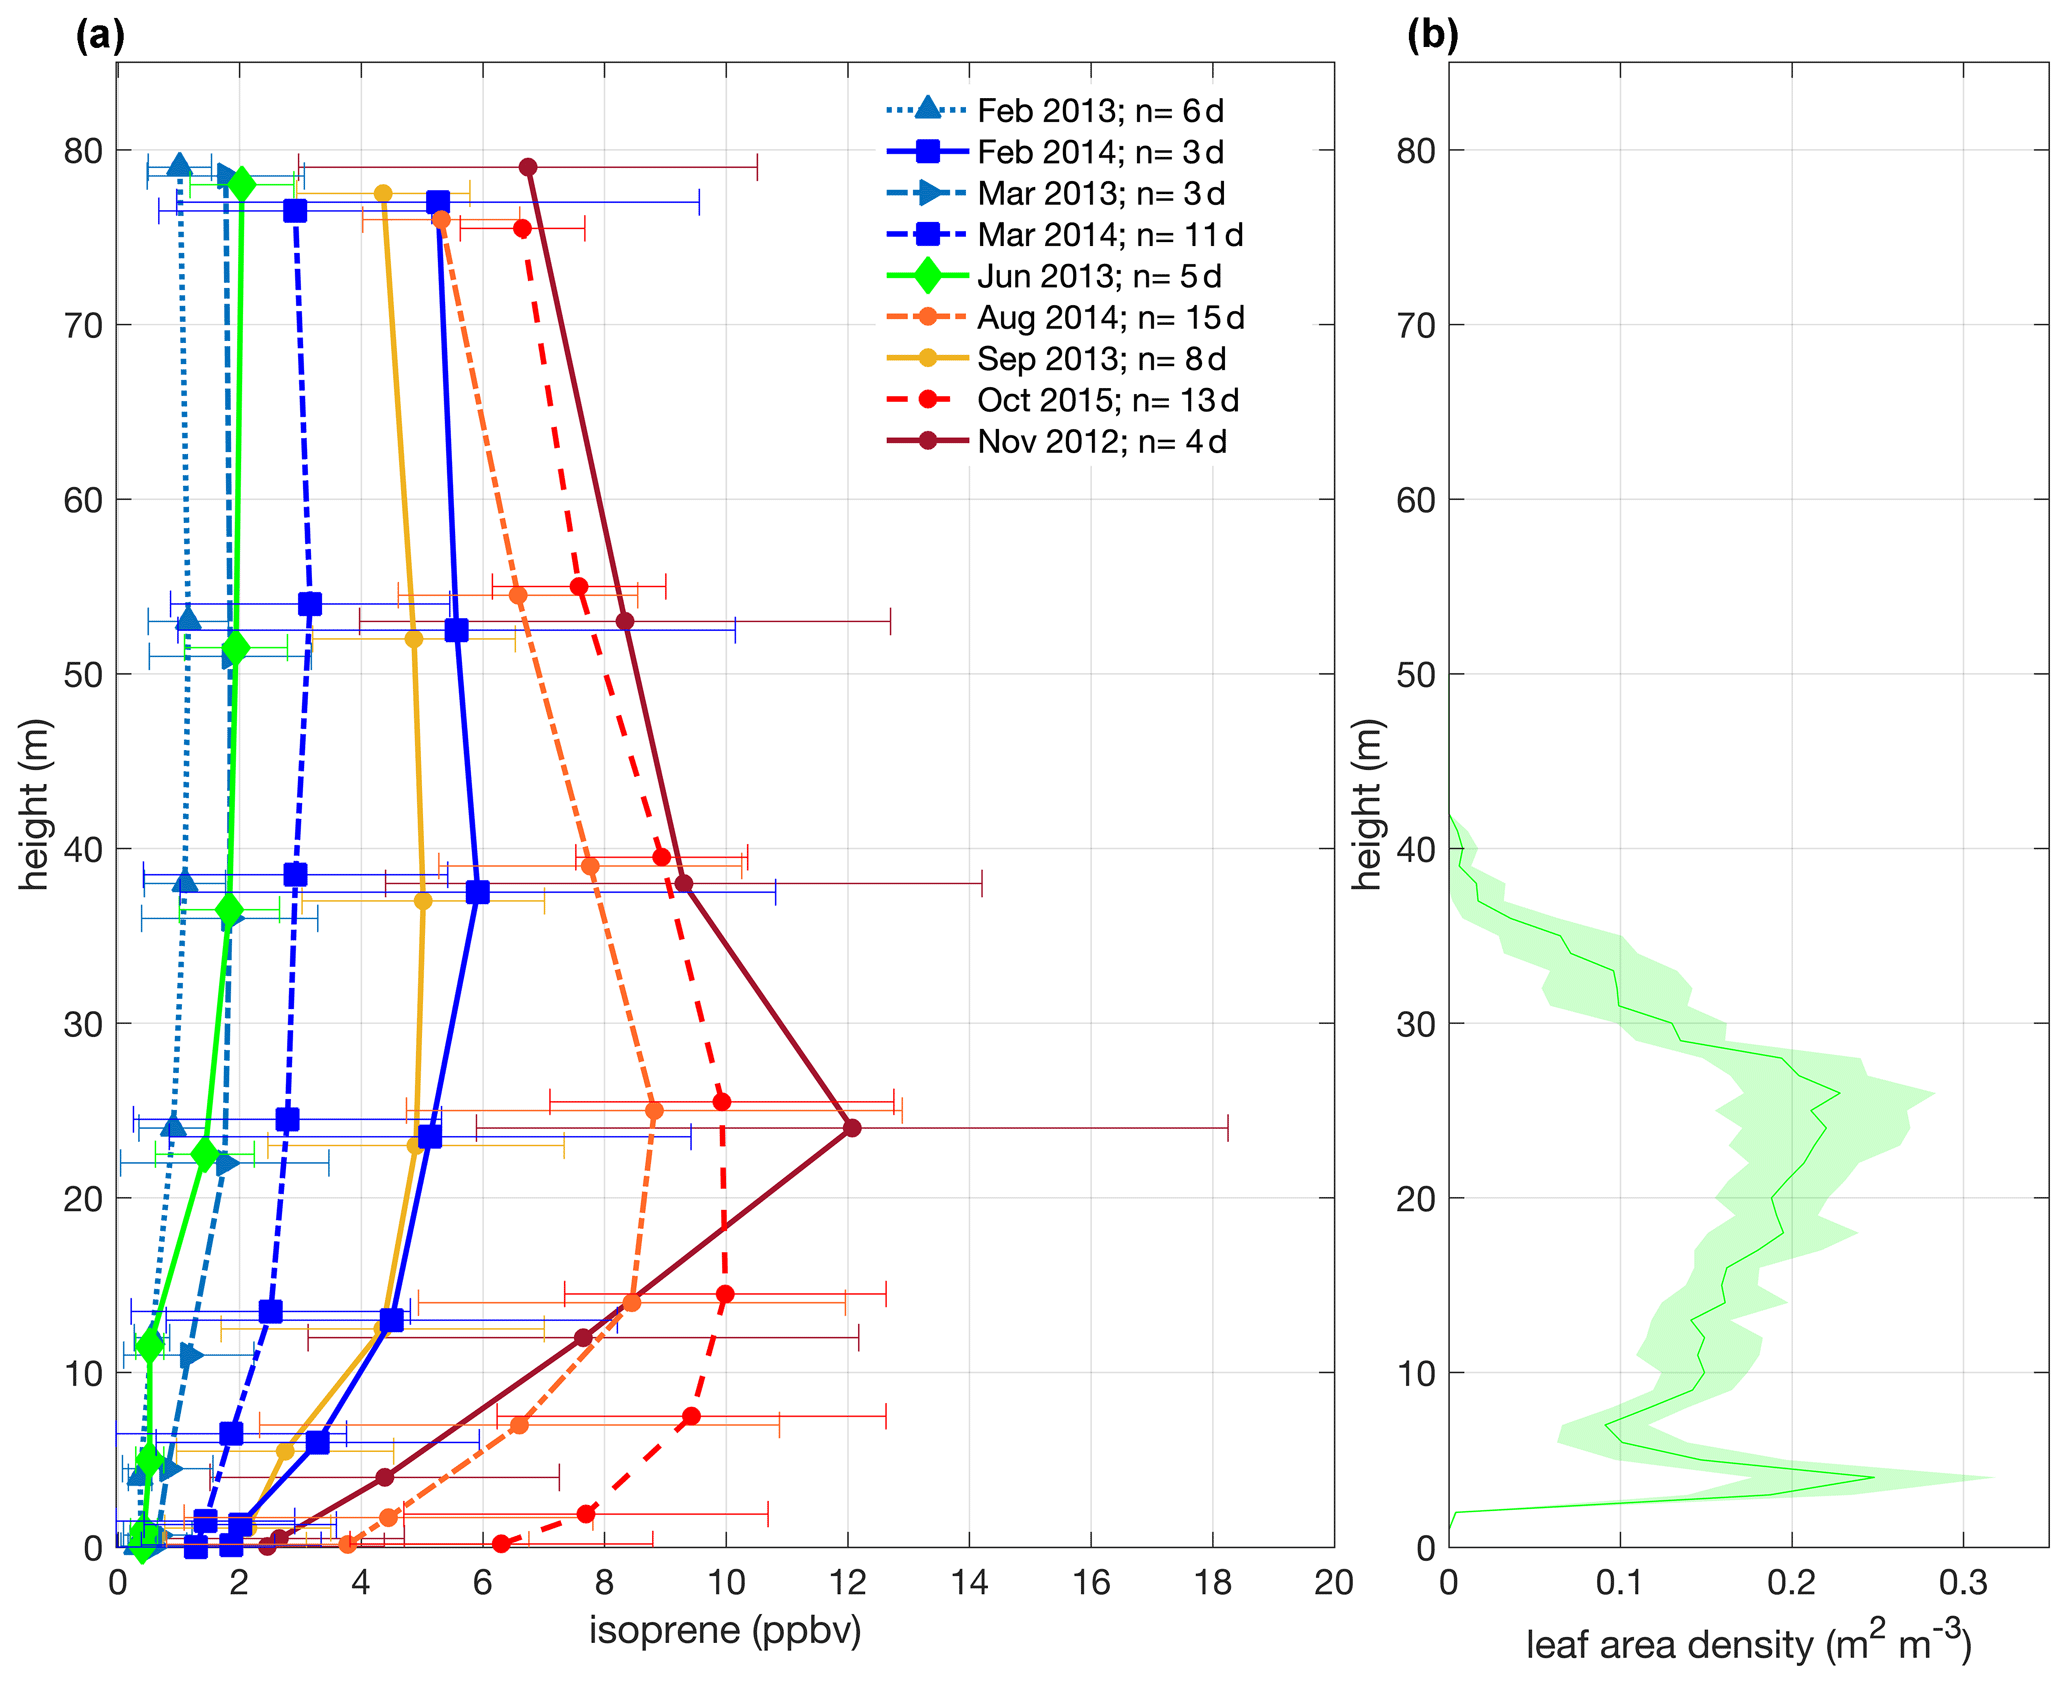
Figure 2Mean isoprene mixing ratios for all field campaigns from November 2012 to October 2015 with 1 standard deviation and from 12:00–15:00 LT (local time; UTC−4 h) – a daytime period that isoprene emission is the highest – and mean canopy leaf area density profile with a confidence interval of 95 % (b). The measurements of all intensive campaigns were collected at the same heights (0.05, 0.5, 4, 12, 24, 38, 53, and 79 m), but note that in the plot (a), the heights were shifted by 50 cm only for the better visualization of the error bars.
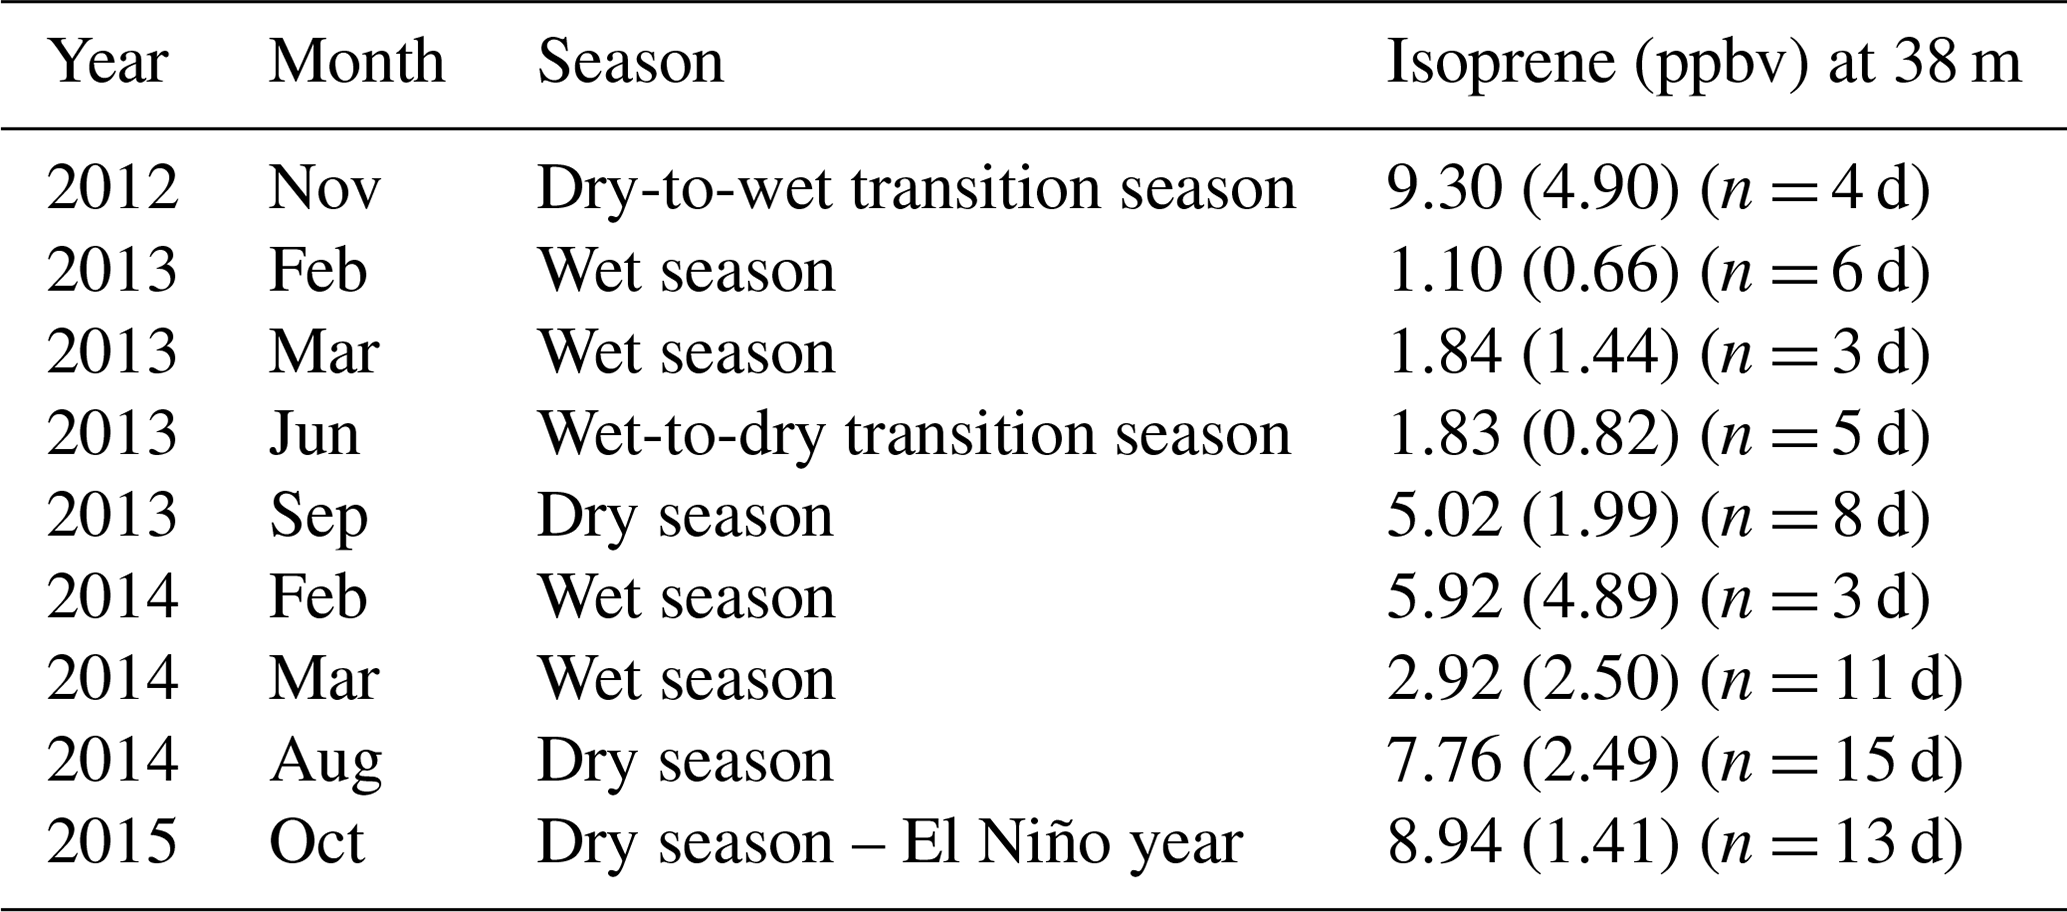
Table 1Isoprene mixing ratios (ppbv) at 38 m for all field campaigns. Mixing ratios are mean values of isoprene measured at 12:00–15:00 LT (local time; UTC−4 h). Values within brackets are 1 standard deviation of the mean and the number of sampling days for each campaign.
3.1 Observations of canopy isoprene mixing ratios
We observed intra- and interannual variability in isoprene mixing ratios in canopy profiles from nine intensive campaigns from November 2012 to October 2015 (Fig. 2a and Table 1). Figure 2b shows the leaf area density profile measured around the INSTANT tower in October 2015 and the mean canopy height. In general, isoprene mixing ratios were higher during the dry-to-wet transition season (November 2012) and the dry season (August 2014 and October 2015 and El Niño year) than the wet season (February and March in 2013 and 2014) and the wet-to-dry transition season (June 2013), with an exception for the September 2013 dry season that showed values comparable to the 2014 wet season, although still higher than the 2013 wet season. Interestingly, mean isoprene mixing ratios in October 2015 (El Niño dry season) were slightly higher than those observed in August 2014 and September 2013 (both dry seasons) but not higher than those observed in November 2012 (dry-to-wet transition) (although this was variable and not significant). Seasonal changes in isoprene mixing ratios and fluxes from central Amazonia have already been reported and were related to variations in temperature, light availability at the surface, and leaf phenology (Yáñez-Serrano et al., 2015; Alves et al., 2016, 2018; Wei et al., 2018; Langford et al., 2022), but the assessment of interannual variability in consecutive years including anomalous years was lacking. Considering the increased air temperatures observed in the 2015 El Niño dry season (Fig. 1b) and the fact that tropical plant species emit high amounts of isoprene at high temperatures (Harley et al., 2004; Alves et al., 2014; Jardine et al., 2014; Garcia et al., 2019; Rodrigues et al., 2020), one could expect considerably higher emission and thereby high air mixing ratios of isoprene during this extreme year. However, the 2015 El Niño dry season might have been stressful for plants, with the anomalous drought (see soil moisture reduction in Fig. 1d) likely offsetting the high-temperature stimulus on isoprene emission. This finding can be supported by two studies performed on this study site. Firstly, isoprene emission measured in hyperdominant tree species showed a reduction in emission from the wet to the dry season with a compensating increase in the emission of monoterpenes and sesquiterpenes that have both temperature-dependent emissions, indicating that the reduction in isoprene emission and the shift toward heavier compounds resulted from abiotic stresses (e.g., drought) during the dry season (Gomes Alves et al., 2022), which might be substantially higher in an extreme El Niño year. Secondly, the anomalous post-drought leaf flush observed in February–March 2016 suggested that trees flushed out new leaves to recover from the stress suffered during the 2015 El Niño dry season (Gonçalves et al., 2020).
Another interesting result was the seasonal variation in the shape of the isoprene mixing ratio profiles (Fig. 2a). In general, all data on wet seasons (February–March 2013/2014) and the wet-to-dry transition season (June 2013) showed a constant profile with no clear vertical gradient of isoprene. On the other hand, the dry seasons (September 2013, August 2014, and October 2015) showed maximum mixing ratios between 12 and 24 m, and the dry-to-wet transition season (November 2012) presented a well-defined peak at 24 m. This variation in the shape of the isoprene mixing ratio profiles likely resulted from changes in isoprene emission across seasons. Even though isoprene mixing ratio profiles are a combination of emission and air mixing, when we analyzed the Bowen ratio at 24 m (Fig. S2 in the Supplement) and the potential temperature profiles (4–81 m; Fig. S1) across seasons, we observed that in-canopy air mixing and the atmospheric stability were similar among seasons. This implies that changes in isoprene mixing ratio profiles were predominantly attributed to the increase in emissions in certain layers, mostly at the upper canopy, during the dry and dry-to-wet transition seasons. Furthermore, we suggest that the process that results in variation in the shape of isoprene mixing ratio profiles is a combination of variations in the canopy leaf area density profile and canopy leaf age distribution throughout the year. The total amount of LAI has a small variation over the year; still, the fractions of leaf ages that compose this total LAI change seasonally (Wu et al., 2016), as well as the shape of the canopy leaf area density profile, with significant changes at the upper canopy (Martins Rosa, 2016). During the wet-to-dry transition season (May–June) and the dry season (July–October), upper-canopy trees presented leaf abscission and leaf flushing (Lopes et al., 2016; Gonçalves et al., 2020), and the maturing process in the following months toward the beginning of the wet season (November–January) might translate into higher leaf area density at the upper canopy (Martins Rosa, 2016) and higher gross primary productivity (GPP) (Botía et al., 2022). This implies that two processes might be simultaneously occurring: one is that when there are more leaves at the upper canopy, less light penetrates the canopy, which might induce the maximum isoprene emission at the upper canopy as observed in November 2012; the other one is that leaves at the upper canopy can have higher photosynthesis rates and, consequently, a higher isoprene emission factor when they are mature (Alves et al., 2014), and more mature leaves and higher GPP were observed in this study site during the dry-to-wet transition season and the beginning of the wet season (Lopes et al., 2016; Gonçalves et al., 2020; Botía et al., 2022).
In addition, it has been suggested that seasonal variations in isoprene emissions could result from a variation in the isoprene emission factor with leaf aging, but there were not enough observational studies to support it in the Amazon (Alves et al., 2018). Therefore, in the next section, we show for the first time in situ observations of the isoprene emission factor at leaf level with known leaf age and infer how this, together with variation in canopy leaf age distribution, likely affected intra- and interannual variability in emissions during sequenced years.
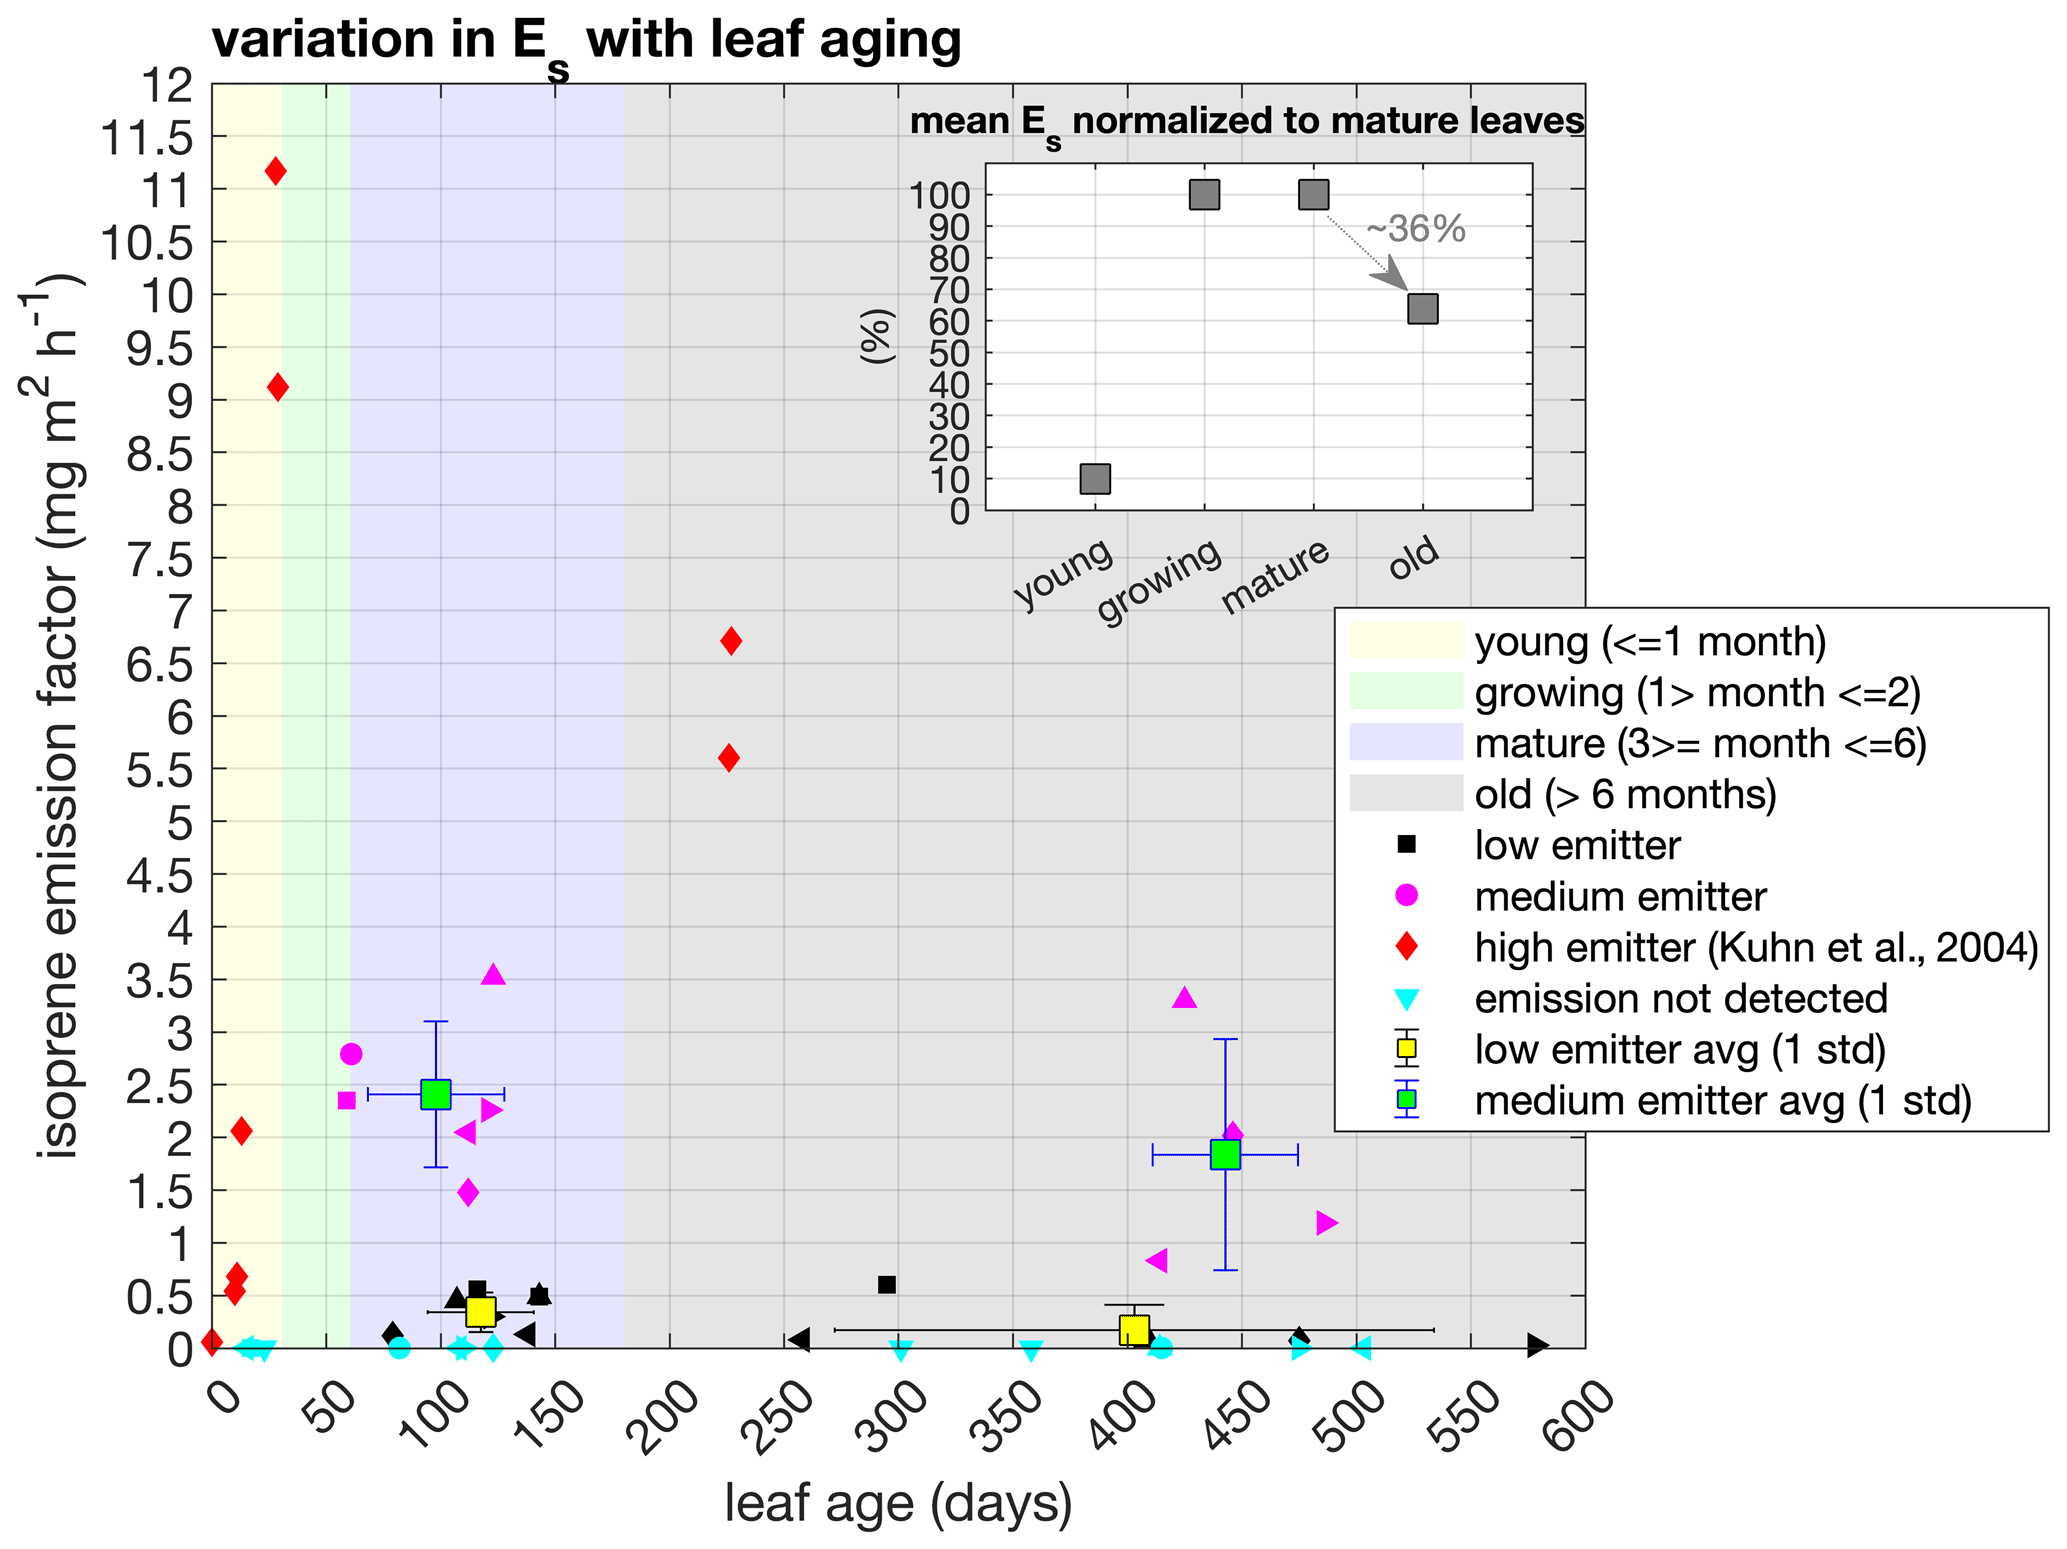
Figure 3Isoprene emission factor (Es) across leaf age classes and characterized into qualitative emission categories – low, medium, and high. Measured tree species were categorized into medium (blue) and low (black) emitters according to their Es values, and different symbols represent different tree species. The high-emitter category (red) represents a tropical species measured in Kuhn et al. (2004b). Values represent observations of individual trees and mean and 1 standard deviation for the categories of medium and low emitters in mature and old leaf age classes. Shaded areas represent the intervals of days for each leaf age class. The inset figure shows the mean Es ratios of mature (3–6 months) to young (0–1 month), growing (1–2 months), and old (> 6 months) leaves calculated from the ratio of each individual tree.
3.2 Seasonal changes in the isoprene emission factor (Es)
The isoprene emission factor (Es; parameter measured at 1000 PAR, 30 ∘C) of an ecosystem is determined by the fraction of species that emits this compound and by variations in the Es magnitude within species. Such variations may be conditioned by leaf phenological status (e.g., young leaves have no or low emission, and old leaves emit less isoprene than mature leaves) and environment (e.g., sun leaves have higher Es than shade leaves) (Niinemets, 2016). We performed measurements of Es from sun-adapted leaves across different ages in 21 trees (from 20 tree species) located at the upper canopy and around the tower, and values ranged from 0 to 3.52 (see all species and emission values in Table S1). Of these 21 trees, 60 % had isoprene emission detectable by our analytical system (TD-GC-FID/TOF-MS), while the other 40 % did not. To evaluate whether the Es changes with leaf aging, we calculated the Es ratios of mature (3–6 months) to young (0–1 month), growing (1–2 months), and old (> 6 months) leaves within the same tree individual. We observed that, for some trees, Es can be reduced by half when leaves are older than 6 months (Fig. 3 and Table S1), but the average of all trees combined showed a statistically significant Es reduction of 36 % in old leaves compared to mature leaves (paired t test, p value < 0.05).
As tropical species represent a mix of phenotypes with the predominance of non-deciduous plants, it was impossible to sample all leaf age classes for all tree species measured. Nevertheless, our dataset covers leaf ages from 15 to 578 d (Table S1), and we observed that all leaves measured at the young leaf age class did not show detectable isoprene emission, and two leaves measured at the growing leaf age class showed emissions similar to the mature leaf age class (Fig. 3 and Table S1). As our sampling did not cover a broad range of leaf ages below 60 d, especially among isoprene emitters, to improve the robustness of our analysis, we added another species that had the Es measured from the leaf flushing day until 30 d (young class) and at 226–227 d (old class) in southwestern Amazonia (Kuhn et al., 2004b). With this tree species added, we calculated that the emission activity of Es of young (0–1 month) and old (> 6 months) leaves were, respectively, 1 % and 64 % of the Es observed in growing (1–2 months) and mature leaves (3–6 months) (paired t test, p value < 0.05) and that there was no statistically significant difference between growing and mature leaves (paired t test, p value > 0.05) (Fig. 3 and Table S1).
Furthermore, we observed that emitter species from our dataset could be combined into two qualitative emission categories – medium emitter and low emitter – given their Es magnitude compared to other leaf-level measurements in Amazonia (see a detailed compilation in Yáñez-Serrano et al., 2020), as well as high emitter, with the data from the tree species measured in southwestern Amazonia (Kuhn et al., 2004b) (Fig. 3). The maximum Es occurred in different leaf ages for each emitter category. Still, both high and medium emitters had an Es maximum before 150 d (mature). In contrast, the low-emitter category showed an Es maximum in 295 d (old) for one species, but that was not statistically significant when compared to all low-emitter species (paired t test, p value > 0.05). Therefore, this indicates that species that emit considerable amounts of isoprene have maximum Es when their leaves are mature.
The variation in Es across leaf ages is already known, also for tropical tree species (Kuhn et al., 2004b; Alves et al., 2014); however, the quantification of these variations across different species is still a challenge given the high biodiversity in the Amazon rainforest, and, although our results show the variation in Es across leaf ages for more species than previously reported, it is still necessary to further develop tools to upscale these results to the ecosystem level. Earlier studies indicated that the capacity to emit isoprene is more common, and the Es magnitudes are expected to be the highest in deciduous tree species (Harrison et al., 2013; Dani et al., 2014). In fact, the high emitter (Fig. 3) is a tropical deciduous tree species with a large range of variation in Es within 30 d after leaf flushing and with the maximum Es observed in mature leaves at the end of the dry season (Kuhn et al., 2004b). However, the number of deciduous trees that have regular leaf abscission and leaf flushing during the dry season in central Amazonia may represent less than 15 % of the whole tree assembly (Gonçalves et al., 2020), which means that the effect of high variability in the Es with leaf aging from those trees might be low at the ecosystem level, especially when we compare it with the other trees that showed less variability in the Es (Fig. 3, Table S1).
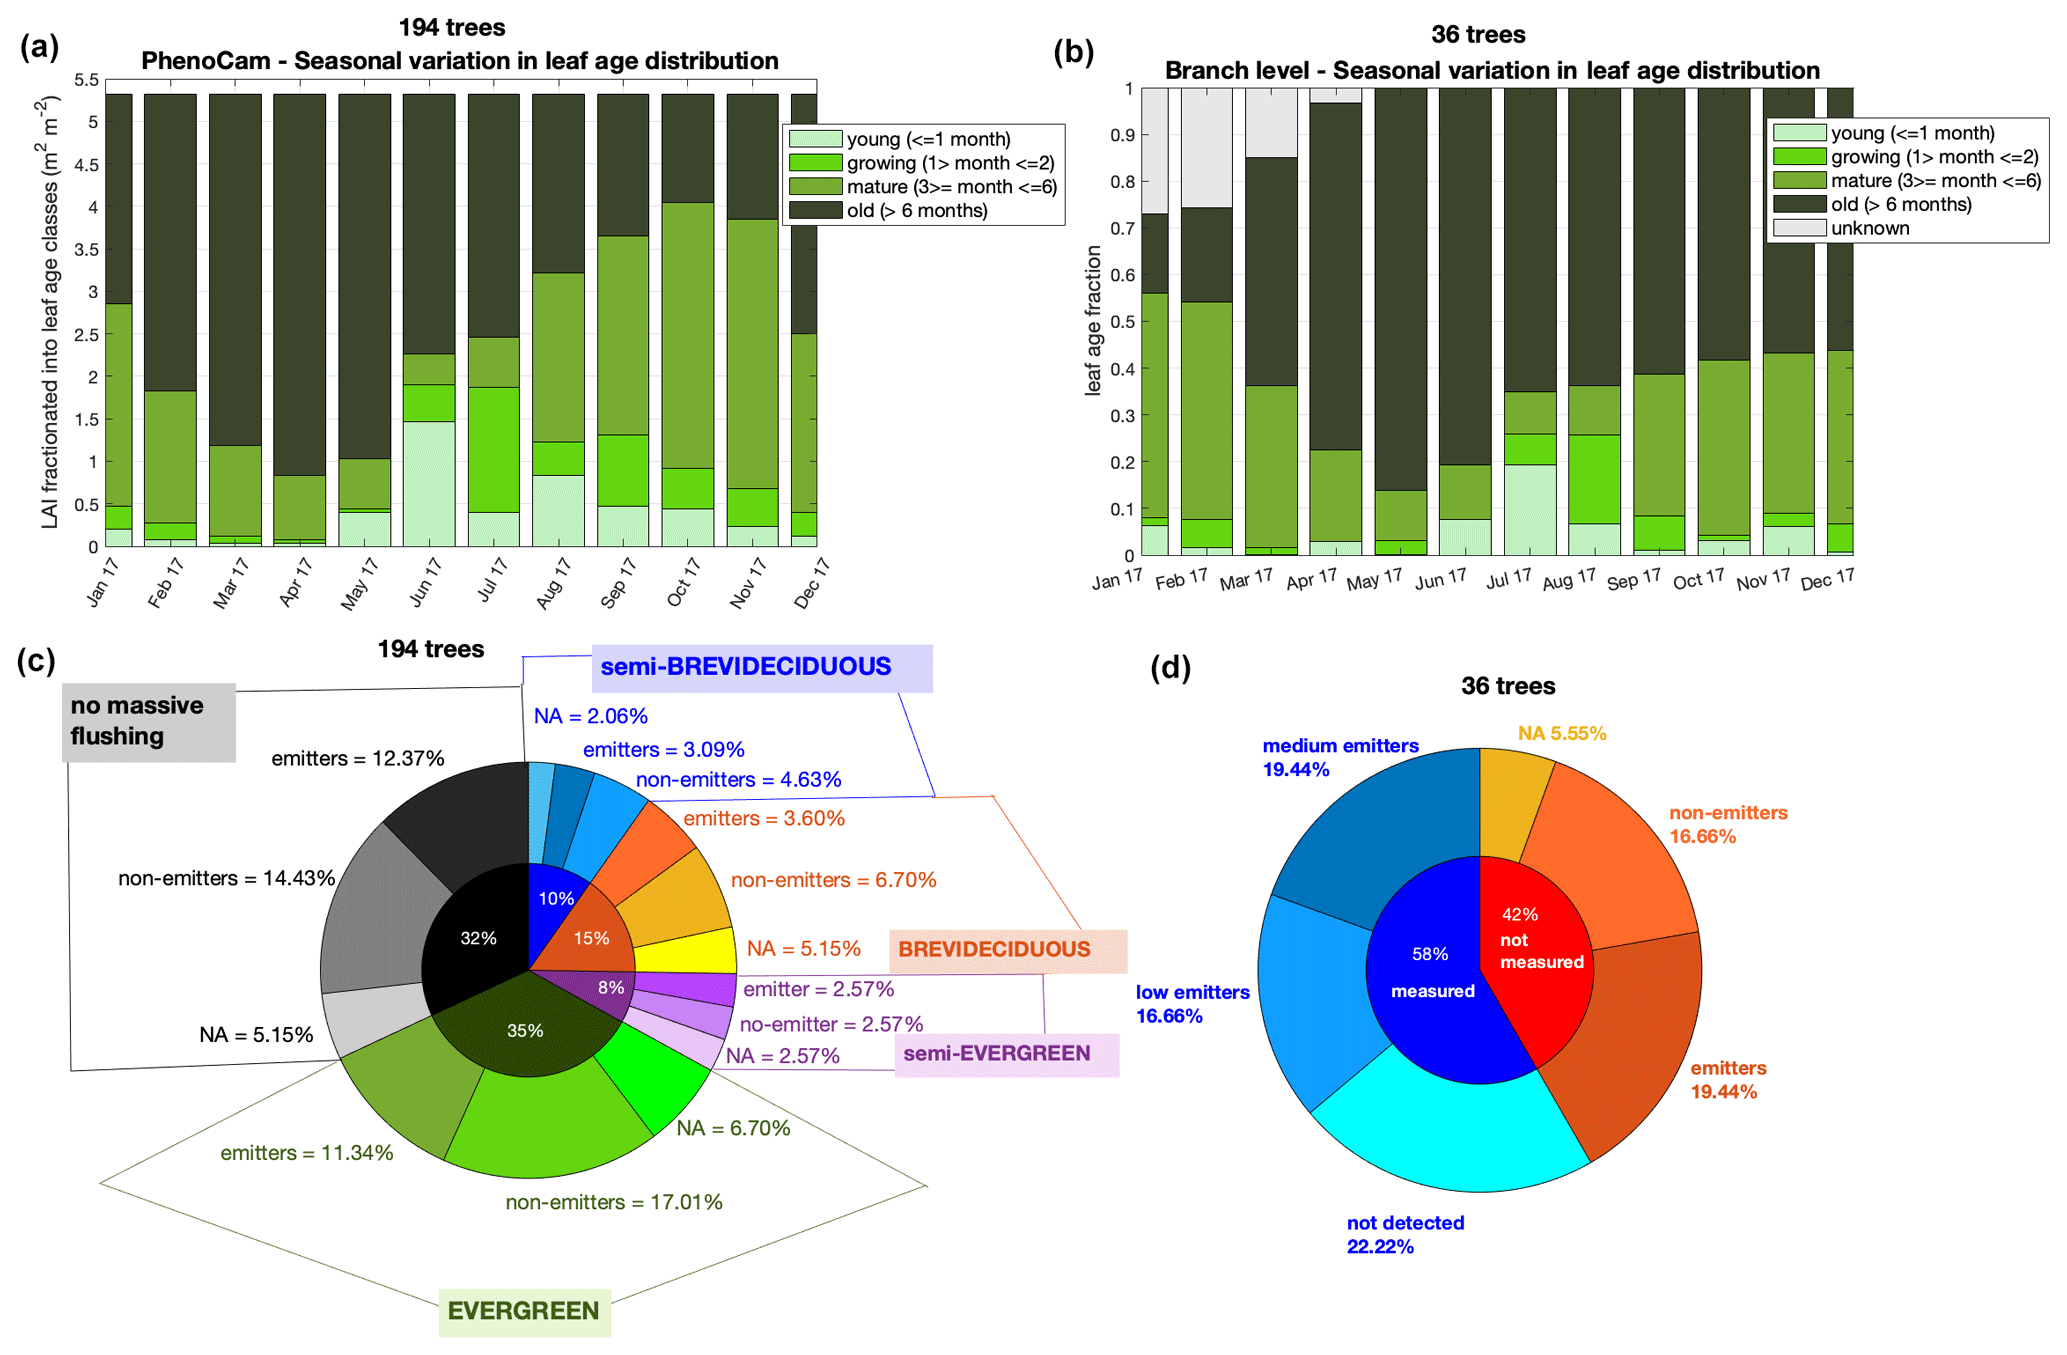
Figure 4Leaf phenology and demography and isoprene emission trait. Panel (a) shows the leaf age distribution separated into LAI that was observed with the phenocam in 2017, and (b) shows the leaf age distribution observed at branch level for 36 trees in 2017 – note that unknown age refers to leaves that were attached to the branch at the beginning of monitoring and therefore could not be assigned to an age class. Panel (c) shows the percent distribution of the phenotypes assigned to the 194 trees observed with the phenocam – no massive flushing, evergreen, semi-evergreen, deciduous, and semi-brevideciduous – and the emission trait assigned to each tree species within these phenotypes – emitters, non-emitters, and NA (NA = no data available). Panel (d) presents the percent distribution of the isoprene trait estimated to the non-measured trees (red) and the isoprene emission trait within measured tree species (blue), with measured tree species being categorized in classes of medium emission, low emission, and not detected emission.
Furthermore, for Amazonian tree species, the categorization of phenological habits goes beyond evergreen and deciduous. Here, with a dataset of 194 trees (Fig. 4 and Table S2) monitored with a phenocam for leaf phenology and demography from 2013 to 2018, we derived (i) the camera-based canopy leaf area index (LAI) separated into four leaf age classes – young (≤ 1 month), growing (1–2 months), mature (3–6 months), and old (> 6 months) (Fig. 4a) – and (ii) four classes of phenology (phenotypes) – evergreen, semi-evergreen, brevi-deciduous, and semi-brevideciduous (Fig. 4c) – based on the frequency of events of leaf abscission and leaf flushing (more details in Supplement). Then, we assigned the isoprene trait for these tree species with measurements and literature data and imputed the trait to non-measured species by following the method described in Taylor et al. (2018) (Fig. 4c). We observed that the isoprene trait did not have a higher percentage within brevi-deciduous and semi-brevideciduous phenotypes, which have regular and seasonal leaf abscission and leaf flushing. Instead, all phenotypes had a similar fraction of isoprene emitters (Fig. 4c). This implies that leaf age is an important factor for the magnitude of Es regardless of phenotype.
Although we do not have enough data to infer the phenotypes for the species monitored at the branch level, we observed that the leaf age distribution of the 36 trees (Fig. 4b) was similar to the 194 trees monitored with the phenocam (Fig. 4a) and that the fraction of isoprene emitters was also similar when measured (21 trees – 60 % emitters; Fig. 3) and non-measured (15 trees – 47 % emitters) were combined (56 % emitters; Fig. 4d) and compared to the phenocam trees (60 % emitters; Fig. 4c). Note that the tree species that had no isoprene emission trait reported in the literature and did not fulfill the assumptions necessary to input the trait, according to Taylor et al. (2018), were assigned the unknown flag (NA).
The similarity found in the seasonal leaf age distribution between the 194 trees monitored by the phenocam and the 36 trees monitored at the branch level (Fig. 4) is in agreement with the results presented by Gonçalves et al. (2020), which showed that the leaf phenology and demography of the 194 trees are representative of the region of this study by comparing it to corresponding satellite vegetation indices retrieved from MODIS-MAIAC (Multi-Angle Implementation of Atmospheric Correction). Also, this, together with the fact that the isoprene trait distribution was similar among the scales (leaf level and upper canopy), implies that the Es variation with leaf age measured here can be used to optimize model estimates for intra- and interannual isoprene emission.
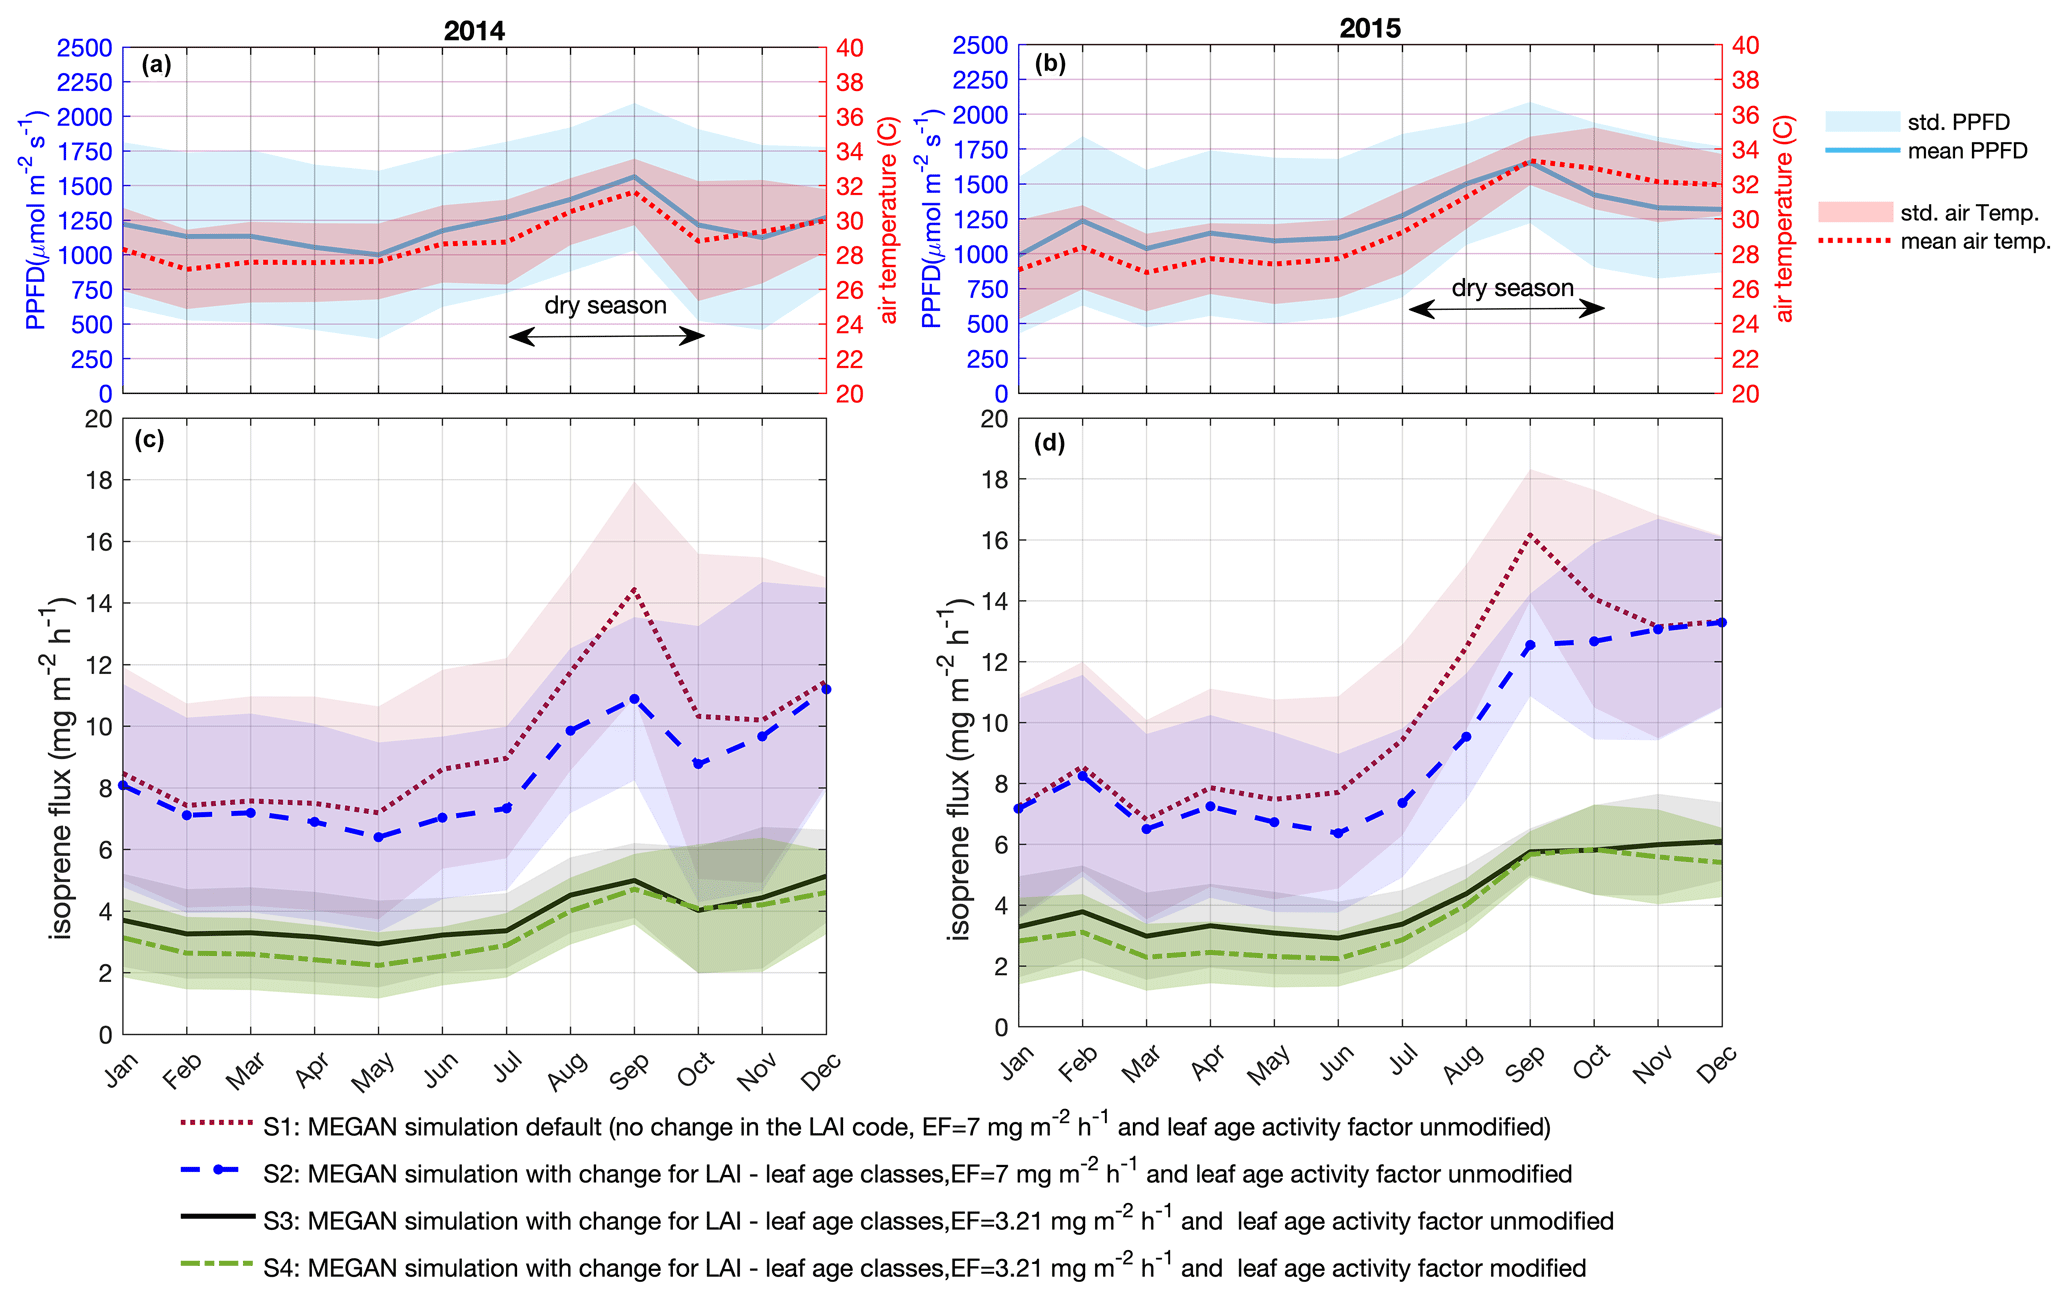
Figure 5Simulated isoprene emission flux for 2014 and 2015. Monthly average of PPFD and air temperature (a, b) measured at the INSTANT tower. Simulations for 2014 (c) and 2015 (d) are MEGAN simulation default, no change in the LAI code, emission factor equals to 7 , and leaf age activity factor unmodified – S1; MEGAN simulation with change for LAI – leaf age classes, emission factor equals to 7 , and leaf age activity factor unmodified – S2; MEGAN simulation with change for LAI – leaf age classes, emission factor equals to 3.21 , and leaf age activity factor unmodified – S3; MEGAN simulation with change for LAI – leaf age classes, emission factor equals to 3.21 , and leaf age activity factor modified – S4. Solid lines are means, and shaded areas represent 1 standard deviation of the mean.
Table 2Model parameters for all simulations for the years 2014 and 2015.
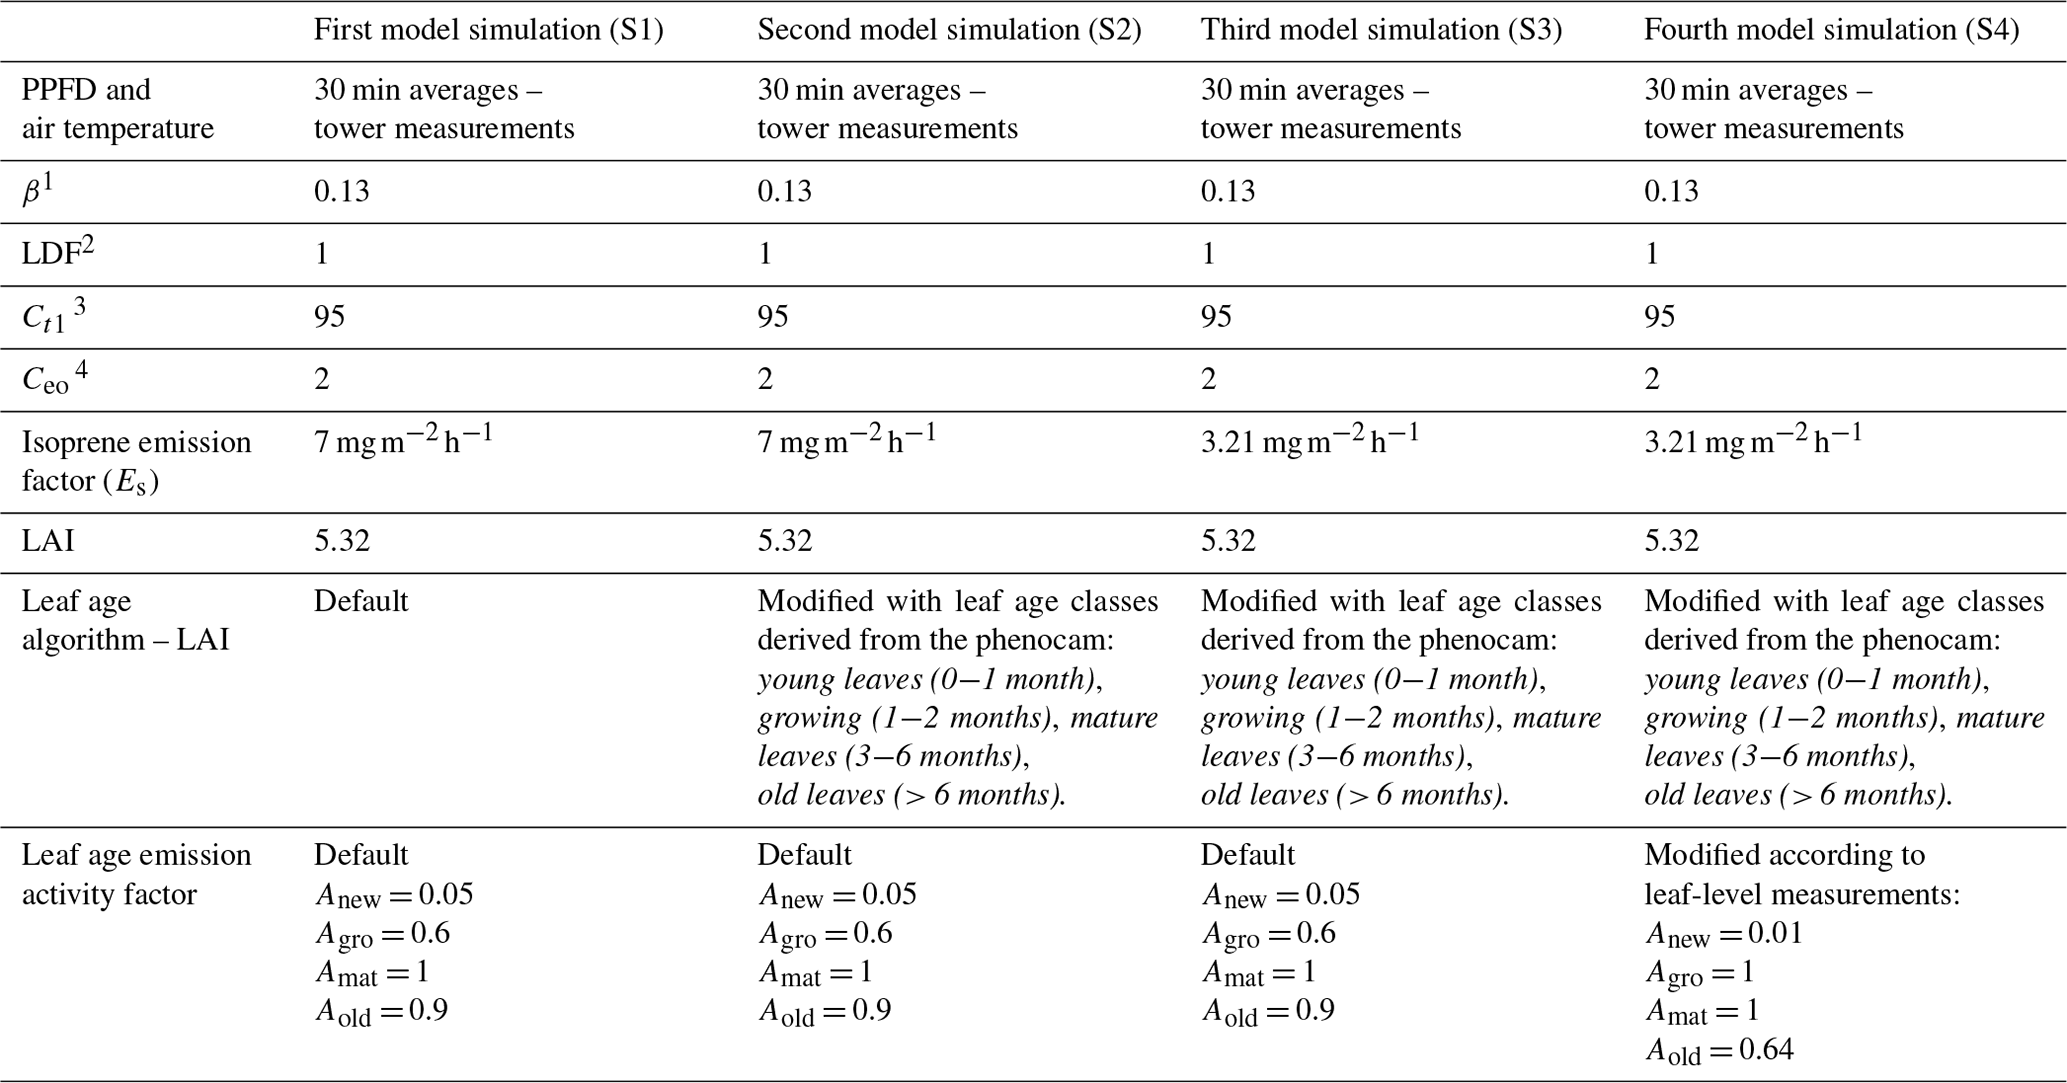
Note: empirical coefficients are from Guenther et al. (2012). 1 Temperature empirical coefficient. 2 Light-dependent fraction. 3 Temperature empirical coefficient. 4 Emission-class-dependent empirical coefficient.
3.3 Modeling of isoprene emission
We used MEGAN to estimate isoprene emissions for the periods for which we have in situ observations of isoprene and model inputs without considerable gaps, i.e., the years 2014 and 2015. We performed four different simulations (Fig. 5 and Table 2). For our first simulation (S1), we applied MEGAN's default settings for tropical vegetation (Fig. 5c and d), which means that we used the Es assigned to the broadleaf evergreen tropical tree and the broadleaf deciduous tropical tree that is equal to 7 (Guenther et al., 2012), half-hourly averages of air temperature and PPFD data measured at the same tower as the isoprene observations (Fig. 5a and b), and no change in the leaf age algorithm. For the second simulation (S2), we used a modified leaf age algorithm by adding the monthly distribution of the LAI separated into leaf age classes (young, growing, mature, and old) as described in the section above (Fig. 5c and d).
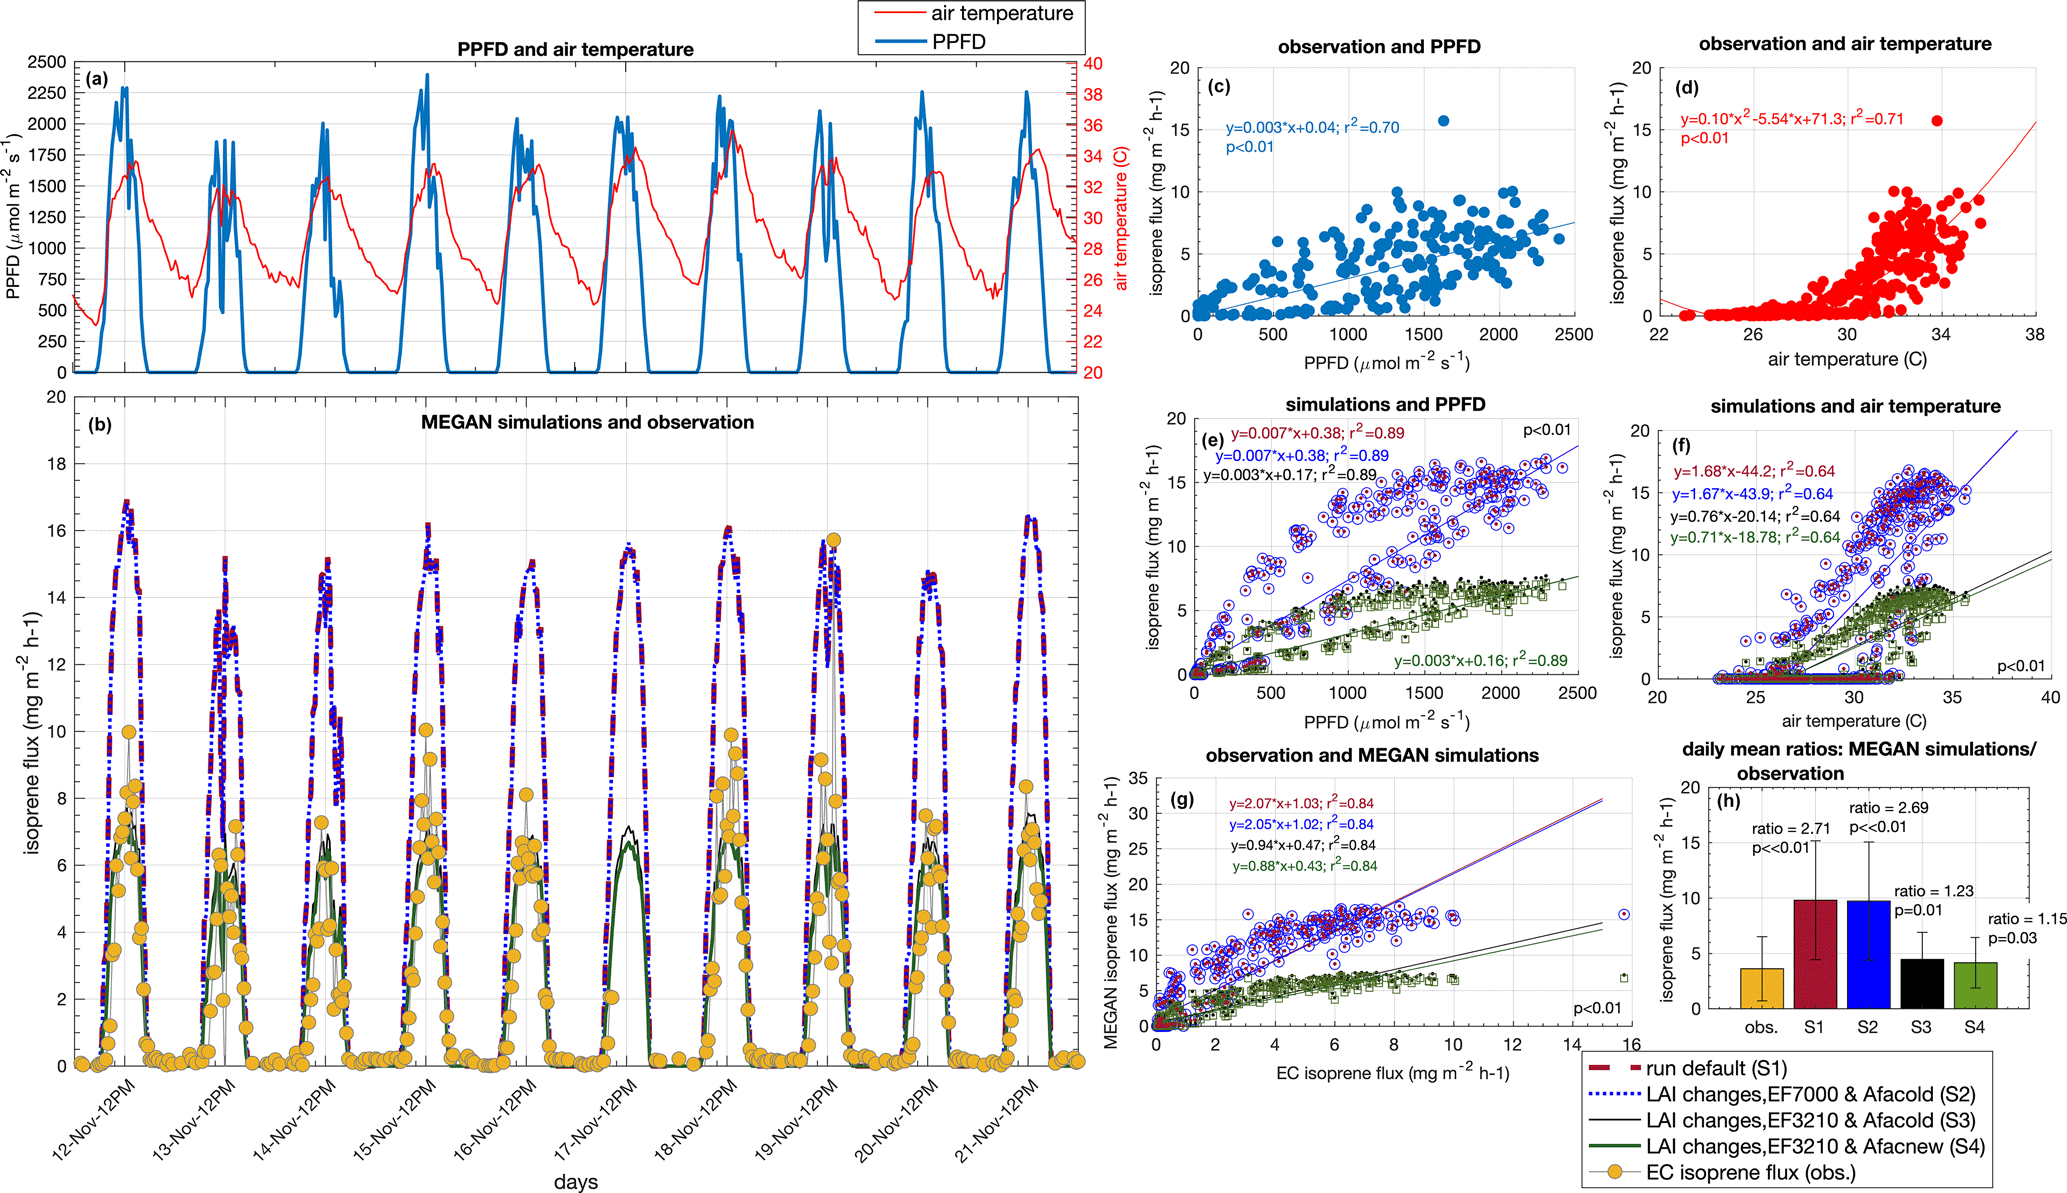
Figure 6Observation of isoprene flux (eddy covariance) and MEGAN simulation for 11 d in November 2015. Half-hourly averages of PPFD and air temperature (a), EC isoprene flux and MEGAN simulations (b), linear regression between EC isoprene flux and PPFD (c), quadratic regression between EC isoprene flux and air temperature (d), linear regression between simulations and PPFD (e), linear regression between simulations and air temperature (f), linear regression between EC isoprene flux and simulations (g), and daily mean ratios between simulations and observation (h).
For a direct comparison between observations and model simulations, we performed eddy covariance (EC) isoprene flux measurements for 11 d during November 2015 and compared them with the simulations (Fig. 6). The isoprene emission sensitivity to the PPFD circadian cycle was well simulated by MEGAN when estimates were compared with EC isoprene flux (r2 = 0.84, p value < 0.01) (Fig. 6g). However, MEGAN simulations (S1 and S2) overestimated the magnitude of emissions when compared with EC isoprene flux around noontime (Fig. 6b); S1 and S2 had a daily average flux 2.71 and 2.68 times higher than EC isoprene flux (p < 0.01), respectively (Fig. 6h). This overestimation was a result of a high value for Es in the model setup (7 ). To support this finding, we calculated Es from the observed EC isoprene flux data from 06:00 to 18:00 UTC−4 with the G93 algorithm (Guenther et al., 1993), and Es resulted in 3.21 ± 1.76 . We then ran a third simulation (S3) with the corrected Es (3.21 ) (Figs. 5c, d and 6b), and S3 estimates presented a daily average flux 1.23 time higher than EC isoprene flux (p = 0.013) (Fig. 6b and h). The mean Es calculated from EC isoprene flux is in the same range as the Es observed for the leaf-level emissions of 21 trees (Fig. 3 and Table S1), indicating that Es from this study site is lower than the one set in the model default.
Another modification in the model was done based on our leaf-level measurements. In Sect. 3.2, we present the Es variation across leaf ages and suggest that the seasonal variation in canopy leaf age distribution results in an emergent property to canopy seasonal variation in Es. With the LAI separated into leaf age classes (phenocam data) throughout the year and the ratios of Es (leaf-level measurements) between mature and young leaves, mature and old leaves, and mature and growing leaves, we modified the leaf age emission activity factor of the leaf age algorithm in MEGAN. The modified leaf age emission activity factor accounts for lower values of Es in young and old leaves compared to mature and growing leaves (Table 2). In our fourth simulation (S4) (Figs. 5c, d and 6b), we added the modification in the leaf age emission activity factor, which led to a daily average 1.15 times higher than the EC isoprene flux (p = 0.03) (Fig. 6h).
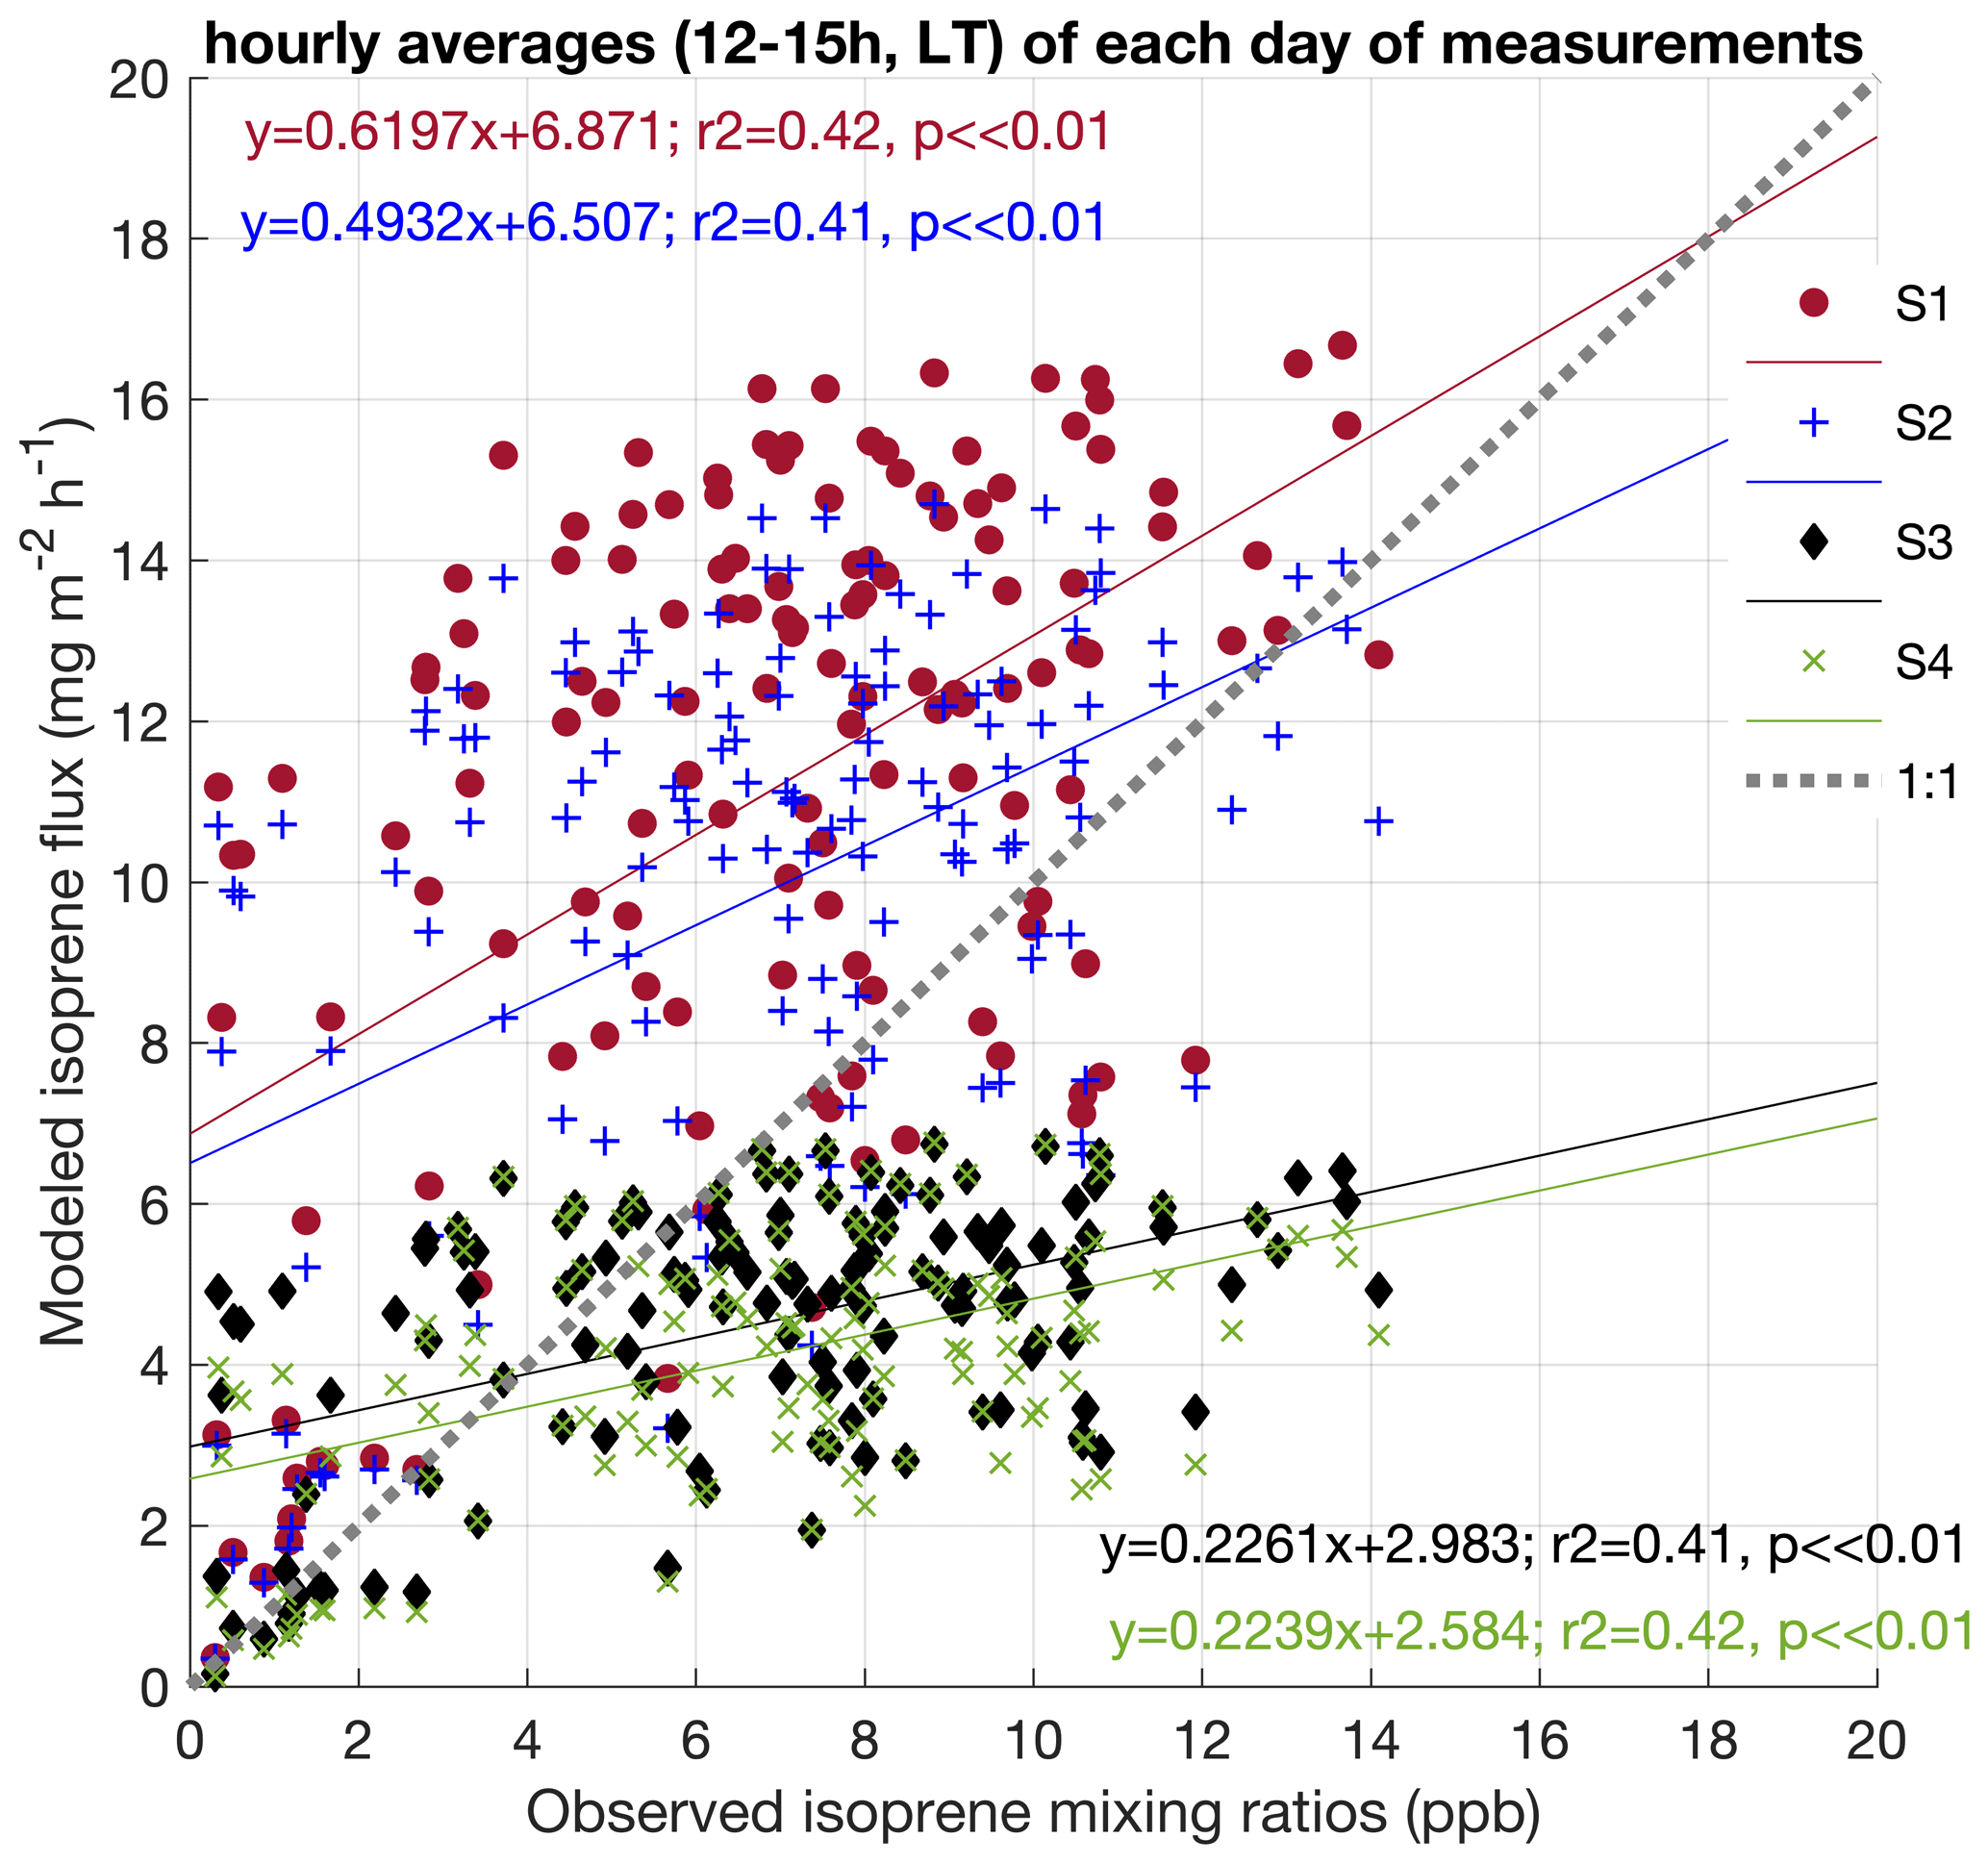
Figure 7Correlation between isoprene mixing ratios observed at 38 m during February and March 2014, August 2014, and October 2015 and the four simulations done for the respective periods. Data represent hourly averages (12:00–15:00 LT) of each day of measurements (a).
To evaluate the effectiveness of our modifications in the model on intra- and interannual timescales, we compared the isoprene mixing ratios observed at 38 m height in all campaigns performed in 2014 and 2015 with the four simulations. As our observations, except for November 2015, are mixing ratios, it is only possible to indirectly compare with MEGAN using an atmospheric model. However, considering that air mixing and atmospheric stability were similar among the seasons (Figs. S2 and S3); isoprene emission is primarily driven by changes in light, temperature, and leaf phenology (Alves et al., 2018); and the variability in these factors was included in the model, we can still test the comparability of the changes in the magnitudes from our measurements and simulations that resulted from intra- and interannual variations. In Fig. 7, we show linear regressions between observations and simulations. All datasets were filtered to the period between 12:00–15:00 LT (local time; UTC−4 h) to evaluate the time of the day with maximum emission and high mixing in the surface layer and to reduce variability in photochemical isoprene loss rates. Figure 7 shows that, apart from the slope, all simulations were similarly and significantly comparable to observations (r2 = 0.41 and r2 = 0.42, p ≪ 0.01). However, it is important to note that the finding of observed reduced Es, compared to the model default settings, and its changing across leaf ages may have an important effect on isoprene intra-annual variation. Therefore, we expect that if more isoprene flux data, especially from long-term measurements, were available for comparison with our simulations, we could have more significant results in comparing observations and the simulations with all modifications in MEGAN (S4). Additionally, as significant day-to-day isoprene variability was observed – also over other Amazon regions, with isoprene concentrations of similar magnitudes occurring during both wet and dry seasons, likely resulting from the longer wet season lifetimes of isoprene (Wells et al., 2022) – long-term flux measurements could help by offering a direct comparison between observations and modeling, as well as the possibility to evaluate atmospheric chemical processes.
In general, the modifications for the Es (S3 and S4) and the leaf age activity factor (S4) improved the estimates because they account for biological factors that have intra- and interannual variations in this study site (Gonçalves et al., 2020), which represent a major source of uncertainty in MEGAN (Niinemets et al., 2010). In this light, the main improvement presented here resulted from the Es correction, since our observations showed that Es was less than half of the value in the model default settings and that Es varies significantly among leaf ages. This is important because Es is a crucial factor in determining the magnitudes of the emissions of a specific site, which may vary substantially in Amazonia. Although a long-term canopy flux measurement study in central Amazonia indicated that Es does not vary seasonally and argued that intra-annual changes in isoprene emission resulted only from micrometeorological and LAI variations (Langford et al., 2022), other studies in central Amazonia have shown that the emission varies substantially in a relatively small spatial scale and on topographic gradients (Gu et al., 2017; Batista et al., 2019); and, more recently, leaf-level measurements have shown that Es varies within tree species both seasonally and spatially, in particular when these species occur in different forest types and topography (Gomes Alves et al., 2022).
3.4 Implications of intra- and interannual variabilities in isoprene emission for modeling
Despite the high variability within seasons, our results showed significant changes between seasons. Previous studies have shown the strong seasonality of isoprene emission in central Amazonia, and we corroborate these studies that indicated changes in solar radiation, temperature, and leaf phenology as the important drivers of isoprene intra-annual variability (e.g., Yáñez-Serrano et al., 2015; Alves et al., 2016, 2018). However, here we further develop our understanding concerning the effect of leaf phenology by suggesting that there is seasonal variation in the ecosystem Es resulting from changes in canopy leaf age distribution, which may significantly contribute to the seasonality in the magnitude of actual emission rates. This is supported by our leaf-level Es measurements, which showed significant differences among leaf ages, with maximum values for mature leaves, and by our results on canopy leaf age distribution changes. Furthermore, it is important to note that leaf-level Es from October–November 2017 showed maximum values for mature leaves, and those were similar to the canopy Es measured in November 2015. October and November (dry season and dry-to-wet transition season) are months with a substantially higher fraction of mature leaves in the canopy compared to those from the wet and wet-to-dry transition seasons, meaning that the highest values of Es from mature leaves are likely predominant in the ecosystem Es in October–November. In this sense, understanding how the Es changes over seasons due to leaf age composition within LAI will considerably improve model estimates of intra-annual variations in isoprene. However, more long-term measurements of canopy isoprene flux are needed to test it.
Surprisingly, interannual variabilities were less pronounced than intra-annual variability when comparing normal years with the 2015 El Niño year. Our air temperature measurements showed a significant increase during the dry season of the 2015 El Niño year compared to normal years. On a larger scale, regional land surface temperature retrieved by satellite showed an increase of up to +4 ∘C from October to December 2015 in the Amazon basin (Jiménez-Muñoz et al., 2016), and that was accompanied by a significant negative maximum climatological water deficit in 43 % of the whole Amazon rainforest (Aragão et al., 2018). Such stresses were expected to provide a stimulus for isoprene emission, as it is already largely known that isoprene emission can increase with increasing temperature and that some studies have also shown that emissions increase after moderate drought (e.g., Werner et al., 2021; Byron et al., 2022). However, our results did not show a significant increase in isoprene mixing ratios in October 2015 compared to the dry seasons of previous years, indicating that emissions were lower in October 2015, with the isoprene mixing ratio profiles unlikely affected by in-canopy air mixing changes as suggested by the in-canopy atmospheric stability analysis (Fig. S3). Understanding mechanisms of intra- and interannual variations in canopy emissions of isoprene is essential for predicting their influence on atmospheric chemical–physical processes. For example, the contribution of isoprene as a sink for hydroxyl radical (OH) varied seasonally (Nölscher et al., 2016); however, it did not vary significantly when a normal year and the 2015 El Niño year were compared in this study site (Pfannerstill et al., 2018), leading to the conclusion that these forests contributed to the emission of other compounds to cope with the stress during the 2015 El Niño year, resulting in an effect on the atmospheric oxidative capacity (Pfannerstill et al., 2021).
Some models predicted that higher temperatures and extended drought periods resulting from climate change might increase global isoprene emissions (Pegoraro et al., 2006). However, more recently, a synthesis of studies performed in the Amazon suggested that, as the increase in temperature comes along with biomass loss given deforestation and forest degradation, a decrease in isoprene emission from Amazonia may be expected (Yáñez-Serrano et al., 2020). Interestingly, although isoprene mixing ratios were not considerably higher in the dry season of the 2015 El Niño year, previous studies observed higher monoterpene mixing ratios compared to other dry seasons (Yáñez-Serrano et al., 2018) and even higher monoterpene mixing ratios in drier and warmer days of the 2015 El Niño dry season (Pfannerstill et al., 2018). In addition, another study conducted in central Amazonia reported that the heat in 2015/16 led to a shift in plant emissions to more reactive monoterpenes such as β-ocimene and that at high temperatures, monoterpene emissions can be decoupled from photosynthesis (Jardine et al., 2017). Recently, leaf-level Es measurements in hyperdominant tree species in this study site showed that photosynthesis and isoprene decreased, while monoterpenes and sesquiterpenes proportionally increased in the dry season, suggesting that plants might have emitted heavier compounds to cope with the stress caused by high temperatures and potentially drought (Gomes Alves et al., 2022). We suggest that anomalies in isoprene emission during extreme years are less expected than anomalies in emissions of monoterpenes and sesquiterpenes, since plants may also emit compounds from their storage pools when there is a limited carbon supply to produce isoprene, as might be the case for plants reducing photosynthesis under heat and drought stresses.
Understanding mechanisms of intra- and interannual variations in canopy emissions of isoprene from Amazonia is essential for predicting their influence on atmospheric chemical–physical processes, especially when considering the role of Amazonia in the global BVOC emission budget. Earlier studies presented seasonal isoprene emissions and related them to the seasonality of temperature, solar radiation, and leaf phenology. Nevertheless, to the best of our knowledge, this is the first study showing the Es variation across leaf ages for several Amazonian tree species and the first attempt to represent the effect on seasonal isoprene flux with a model parameterization. Also, by comparing observations of normal years to the extreme 2015 El Niño year, we were able to show that isoprene emission does not substantially increase as a result of higher temperatures. We suggest that the stress caused by elevated temperatures and droughts in extreme years might reduce the isoprene temperature dependence, which is not currently well represented in modeling.
Even though there are uncertainties related to measurements and model simulations, the results presented here suggest that Es varied seasonally and that this is a key factor in improving model predictions. Additionally, previous studies showed that a distinguished high monoterpene emission accompanies a non-pronounced increase in isoprene emission in extreme years during the dry season at this study site, which is interesting to investigate further since monoterpenes have higher reactivity in the atmosphere. Therefore, more detailed and long-term measurements of isoprene and other BVOCs are encouraged to improve our understanding of the intra- and interannual variability in BVOC emissions in Amazonia, especially measurements that also account for biological factors that might contribute to more mechanistic surface emission modeling and subsequently lead to better predictions of atmospheric chemical–physical processes.
Datasets are available upon request on https://attodata.org (ATTO, 2023).
The supplement related to this article is available online at: https://doi.org/10.5194/acp-23-8149-2023-supplement.
EGA designed this study and performed the leaf-level measurements, the statistical analysis of observational datasets, and the MEGAN simulations. RAS and CQDJ contributed to the analysis of the datasets of canopy isoprene mixing ratios and of micrometeorology. SB contributed to the analysis of the phenocam dataset and performed the MEGAN simulations. TT contributed new measurements of isoprene emissions from tropical tree species and the imputation modeling of isoprene trait to the tree species monitored by the phenocam. AMYS and JK provided the canopy isoprene mixing ratios dataset. PILSdA and GM contributed with the leaf age monitoring at the branch level. RdS and SDJ contributed to the collection of isoprene samples measured at leaf level. AG and DG contributed with the chemical analysis of isoprene samples measured at leaf level and the MEGAN simulations. AT, MS, EB, and JW contributed with the dataset of eddy covariance isoprene flux. BN and DP contributed to the collection and the analysis of the phenocam dataset. SK contributed to analyzing the micrometeorology dataset to run the MEGAN simulations. DMR contributed to the surface lidar data collection and analysis. BW and CB contributed with the temperature dataset to run the MEGAN simulations. MR contributed new measurements of isoprene emissions from tropical tree species. KJF, AD, VLL, MPC, AI, NL, CH, and BJ contributed expert guidance, specimen curation, field assistance, and botanical identifications for isoprene measurements from trees in botanic gardens and private collections. IMCT contributed to in-canopy micrometeorology analysis. All authors contributed to the writing of the manuscript.
The contact author has declared that none of the authors has any competing interests.
Publisher's note: Copernicus Publications remains neutral with regard to jurisdictional claims in published maps and institutional affiliations.
We thank the National Institute of Amazonian Research (INPA) and the Max Planck Institute for Biogeochemistry (MPI-BGC) for their continuous support. We also truly thank Marta Sá and Paulo Ricardo Teixeira for their work on checking the quality of the micrometeorology dataset and the INPA's Micrometeorology Lab for providing the dataset. We acknowledge the helpful support for isoprene measurements in botanic gardens by Santiago Madriñan of the Jardín Botánico “Guillermo Piñeres”; Ana María Benavides and Juan David Fernandes of the Jardín Botánico de Medellín; Carl Lewis of the Fairchild Botanic Garden; and Patrick Griffith, Joanna Tucker Lima, and Michelle Barros of the Montgomery Botanical Garden. We would like to especially thank the field assistants and all the people involved in the logistic support of the ATTO project, who were all imperative for the development of this study. We also thank all the indigenous communities that have been bravely protecting the forest, as well as the riverside communities that have always helped us to do our science. Without the “mateiros” we could never accomplish our scientific goals.
This research was supported by the German Federal Ministry of Education and Research, BMBF funds 01LB1001A; Brazilian Ministry of Science, Technology, Innovation and Communication; FINEP/MCTIC contract 01.11.01248.00); UEA; FAPEAM; LBA/INPA; and SDS/CEUC/RDS-Uatumã. It was also supported by grant nos. NSF-PRFB-1711997 and NSF-1754163.
The article processing charges for this open-access publication were covered by the Max Planck Society.
This paper was edited by Thomas Karl and reviewed by three anonymous referees.
Alves, E. G., Harley, P., Gonçalves, J. F. C., Moura, C. E. S., and Jardine, K.: Effects of light and temperature on isoprene emission at different leaf developmental stages of Eschweilera coriacea in central Amazon, Acta Amazon., 44, 9–18, https://doi.org/10.1590/S0044-59672014000100002, 2014.
Alves, E. G., Jardine, K., Tota, J., Jardine, A., Yãnez-Serrano, A. M., Karl, T., Tavares, J., Nelson, B., Gu, D., Stavrakou, T., Martin, S., Artaxo, P., Manzi, A., and Guenther, A.: Seasonality of isoprenoid emissions from a primary rainforest in central Amazonia, Atmos. Chem. Phys., 16, 3903–3925, https://doi.org/10.5194/acp-16-3903-2016, 2016.
Alves, E. G., Tóta, J., Turnipseed, A., Guenther, A. B., Vega Bustillos, J. O. W., Santana, R. A., Cirino, G. G., Tavares, J. V., Lopes, A. P., Nelson, B. W., de Souza, R. A., Gu, D., Stavrakou, T., Adams, D. K., Wu, J., Saleska, S., and Manzi, A. O.: Leaf phenology as one important driver of seasonal changes in isoprene emissions in central Amazonia, Biogeosciences, 15, 4019–4032, https://doi.org/10.5194/bg-15-4019-2018, 2018.
Andreae, M. O., Acevedo, O. C., Araùjo, A., Artaxo, P., Barbosa, C. G. G., Barbosa, H. M. J., Brito, J., Carbone, S., Chi, X., Cintra, B. B. L., da Silva, N. F., Dias, N. L., Dias-Júnior, C. Q., Ditas, F., Ditz, R., Godoi, A. F. L., Godoi, R. H. M., Heimann, M., Hoffmann, T., Kesselmeier, J., Könemann, T., Krüger, M. L., Lavric, J. V., Manzi, A. O., Lopes, A. P., Martins, D. L., Mikhailov, E. F., Moran-Zuloaga, D., Nelson, B. W., Nölscher, A. C., Santos Nogueira, D., Piedade, M. T. F., Pöhlker, C., Pöschl, U., Quesada, C. A., Rizzo, L. V., Ro, C.-U., Ruckteschler, N., Sá, L. D. A., de Oliveira Sá, M., Sales, C. B., dos Santos, R. M. N., Saturno, J., Schöngart, J., Sörgel, M., de Souza, C. M., de Souza, R. A. F., Su, H., Targhetta, N., Tóta, J., Trebs, I., Trumbore, S., van Eijck, A., Walter, D., Wang, Z., Weber, B., Williams, J., Winderlich, J., Wittmann, F., Wolff, S., and Yáñez-Serrano, A. M.: The Amazon Tall Tower Observatory (ATTO): overview of pilot measurements on ecosystem ecology, meteorology, trace gases, and aerosols, Atmos. Chem. Phys., 15, 10723–10776, https://doi.org/10.5194/acp-15-10723-2015, 2015.
Aragão, L. E. O. C., Anderson, L. O., Fonseca, M. G., Rosan, T. M., Vedovato, L. B., Wagner, F. H., Silva, C. V. J., Silva Junior, C. H. L., Arai, E., Aguiar, A. P., Barlow, J., Berenguer, E., Deeter, M. N., Domingues, L. G., Gatti, L., Gloor, M., Malhi, Y., Marengo, J. A., Miller, J. B., Phillips, O. L., and Saatchi, S.: 21st Century drought-related fires counteract the decline of Amazon deforestation carbon emissions, Nat. Commun., 9, 1–12, https://doi.org/10.1038/s41467-017-02771-y, 2018.
Artaxo, P., Mohr, C., and Pöschl, U.: Tropical and Boreal Forest – Atmosphere Interactions: A Review, Tellus B, 74, 24–163, https://doi.org/10.16993/tellusb.34, 2022.
Atkinson, R.: Gas-Phase Tropospheric Chemistry of Volatile Organic Compounds: 1. Alkanes and Alkenes, J. Phys. Chem. Ref. Data, 26, 215–290, https://doi.org/10.1063/1.556012, 1997.
ATTO: ATTO data portal, data sets available upon request, https://attodata.org, last access: 15 July 2023.
Barkley, M. P., Palmer, P. I., de Smedt, I., Karl, T., Guenther, A., and van Roozendael, M.: Regulated large-scale annual shutdown of Amazonian isoprene emissions?, Geophys. Res. Lett., 36, L04803, https://doi.org/10.1029/2008GL036843, 2009.
Batista, C. E., Ye, J., Ribeiro, I. O., Guimarães, P. C., Medeiros, A. S. S., Barbosa, R. G., Oliveira, R. L., Duvoisin, S., Jardine, K. J., Gu, D., Guenther, A. B., McKinney, K. A., Martins, L. D., Souza, R. A. F., and Martin, S. T.: Intermediate-scale horizontal isoprene concentrations in the near-canopy forest atmosphere and implications for emission heterogeneity, P. Natl. Acad. Sci. USA, 116, 19318–19323, https://doi.org/10.1073/pnas.1904154116, 2019.
Bauwens, M., Stavrakou, T., Müller, J.-F., De Smedt, I., Van Roozendael, M., van der Werf, G. R., Wiedinmyer, C., Kaiser, J. W., Sindelarova, K., and Guenther, A.: Nine years of global hydrocarbon emissions based on source inversion of OMI formaldehyde observations, Atmos. Chem. Phys., 16, 10133–10158, https://doi.org/10.5194/acp-16-10133-2016, 2016.
Botía, S., Komiya, S., Marshall, J., Koch, T., Gałkowski, M., Lavric, J., Gomes-Alves, E., Walter, D., Fisch, G., Pinho, D. M., Nelson, B. W., Martins, G., Luijkx, I. T., Koren, G., Florentie, L., Carioca de Araújo, A., Sá, M., Andreae, M. O., Heimann, M., Peters, W., and Gerbig, C.: The CO2 record at the Amazon Tall Tower Observatory: A new opportunity to study processes on seasonal and inter-annual scales, Glob. Change Biol., 28, 588–611, https://doi.org/10.1111/gcb.15905, 2022.
Boulton, C. A., Lenton, T. M., and Boers, N.: Pronounced loss of Amazon rainforest resilience since the early 2000s, Nat. Clim. Change, 12, 271–278, https://doi.org/10.1038/s41558-022-01287-8, 2022.
Boyle, B., Hopkins, N., Lu, Z., Raygoza Garay, J. A., Mozzherin, D., Rees, T., Matasci, N., Narro, M. L., Piel, W. H., Mckay, S. J., Lowry, S., Freeland, C., Peet, R. K., and Enquist, B. J.: The taxonomic name resolution service: an online tool for automated standardization of plant names, BMC Bioinform., 14, 16, https://doi.org/10.1186/1471-2105-14-16, 2013.
Boyle, B. L., Matasci, N., Mozzherin, D., Rees, T., Barbosa, G. C., Kumar Sajja, R., and Enquist, B. J.: Taxonomic Name Resolution Service, version 5.0, Botanical Information and Ecology Network, https://tnrs.biendata.org/ (last access: 25 January 2023), 2021.
Bracho-Nunez, A., Knothe,, N. M., Welter, S., Staudt, M., Costa, W. R., Liberato, M. A. R., Piedade, M. T. F., and Kesselmeier, J.: Leaf level emissions of volatile organic compounds (VOC) from some Amazonian and Mediterranean plants, Biogeosciences, 10, 5855–5873, https://doi.org/10.5194/bg-10-5855-2013, 2013.
Byron, J., Kreuzwieser, J., Purser, G., van Haren, J., Ladd, S. N., Meredith, L. K., Werner, C., and Williams, J.: Chiral monoterpenes reveal forest emission mechanisms and drought responses, Nature, 609, 7926, https://doi.org/10.1038/s41586-022-05020-5, 2022.
Canaval, E., Millet, D. B., Zimmer, I., Nosenko, T., Georgii, E., Partoll, E. M., Fischer, L., Alwe, H. D., Kulmala, M., Karl, T., Schnitzler, J., and Hansel, A.: Rapid conversion of isoprene photooxidation products in terrestrial plants, Commun. Earth Environ., 1, 44, https://doi.org/10.1038/s43247-020-00041-2, 2020.
Dani, K. G. S., Jamie, I. M., Prentice, I. C., and Atwell, B. J.: Evolution of isoprene emission capacity in plants, Trends Plant Sci., 19, 439–446, https://doi.org/10.1016/j.tplants.2014.01.009, 2014.
Fauset, S., Johnson, M. O., Gloor, M., Baker, T. R., Monteagudo M., A., Brienen, R. J. W., Feldpausch, T. R., Lopez-Gonzalez, G., Malhi, Y., ter Steege, H., Pitman, N. C. A., Baraloto, C., Engel, J., Pétronelli, P., Andrade, A., Camargo, J. L. C., Laurance, S. G. W., Laurance, W. F., Chave, J., Allie, E., Vargas, P. N., Terborgh, J. W., Ruokolainen, K., Silveira, M., Aymard C., G. A., Arroyo, L., Bonal, D., Ramirez-Angulo, H., Araujo-Murakami, A., Neill, D., Hérault, B., Dourdain, A., Torres-Lezama, A., Marimon, B. S., Salomão, R. P., Comiskey, J. A., Réjou-Méchain, M., Toledo, M., Licona, J. C., Alarcón, A., Prieto, A., Rudas, A., van der Meer, P. J., Killeen, T. J., Marimon Junior, B. H., Poorter, L., Boot, R. G. A., Stergios, B., Torre, E. V., Costa, F. R. C., Levis, C., Schietti, J., Souza, P., Groot, N., Arets, E., Moscoso, V. C., Castro, W., Coronado, E. N. H., Peña-Claros, M., Stahl, C., Barroso, J., Talbot, J., Vieira, I. C. G., van der Heijden, G., Thomas, R., Vos, V. A., Almeida, E. C., Davila, E. Á., Aragão, L. E. O. C., Erwin, T. L., Morandi, P. S., de Oliveira, E. A., Valadão, M. B. X., Zagt, R. J., van der Hout, P., Loayza, P. A., Pipoly, J. J., Wang, O., Alexiades, M., Cerón, C. E., Huamantupa-Chuquimaco, I., di Fiore, A., Peacock, J., Camacho, N. C. P., Umetsu, R. K., de Camargo, P. B., Burnham, R. J., Herrera, R., Quesada, C. A., Stropp, J., Vieira, S. A., Steininger, M., Rodríguez, C. R., Restrepo, Z., Muelbert, A. E., Lewis, S. L., Pickavance, G. C., and Phillips, O. L.: Hyperdominance in Amazonian forest carbon cycling, Nat. Commun., 6, 1–9, https://doi.org/10.1038/ncomms7857, 2015.
Fu, D., Millet, D. B., Wells, K. C., Payne, V. H., Yu, S., Guenther, A., and Eldering, A.: Direct retrieval of isoprene from satellite-based infrared measurements, Nat. Commun., 10, 3811, https://doi.org/10.1038/s41467-019-11835-0, 2019.
Garcia, S., Jardine, K., de Souza, V. F., de Souza, R. A. F., Junior, S. D., and Gonçalves, J. F. de C.: Reassimilation of leaf internal CO2 contributes to isoprene emission in the neotropical species inga edulis Mart, Forests, 10, 472, https://doi.org/10.3390/f10060472, 2019.
Geron, C., Guenther, A., Greenberg, J., Loescher, H. W., Clark, D., and Baker, B.: Biogenic volatile organic compound emissions from a lowland tropical wet forest in Costa Rica, Atmos. Environ., 36, 3793–3802, https://doi.org/10.1016/S1352-2310(02)00301-1, 2002.
Gomes Alves, E., Taylor, T., Robin, M., Pinheiro Oliveira, D., Schietti, J., Duvoisin Júnior, S., Zannoni, N., Williams, J., Hartmann, C., Gonçalves, J. F. C., Schöngart, J., Wittmann, F., and Piedade, M. T. F.: Seasonal shifts in isoprenoid emission composition from three hyperdominant tree species in central Amazonia, Plant Biol., 24, 721–733, https://doi.org/10.1111/plb.13419, 2022.
Gonçalves, N., Pontes, A., Dalagnol, R., Wu, J., Mesquita, D., and Walker, B.: Remote Sensing of Environment Both near-surface and satellite remote sensing confirm drought legacy effect on tropical forest leaf phenology after 2015/2016 ENSO drought, Remote Sens. Environ., 237, 111489, https://doi.org/10.1016/j.rse.2019.111489, 2020.
Gu, D., Guenther, A. B., Shilling, J. E., Yu, H., Huang, M., Zhao, C., Yang, Q., Martin, S. T., Artaxo, P., Kim, S., Seco, R., Stavrakou, T., Longo, K. M., Tóta, J., de Souza, R. A. F., Vega, O., Liu, Y., Shrivastava, M., Alves, E. G., Santos, F. C., Leng, G., and Hu, Z.: Airborne observations reveal elevational gradient in tropical forest isoprene emissions, Nat. Commun., 8, 15541, https://doi.org/10.1038/ncomms15541, 2017.
Guenther, A., Nicholas, C., Fall, R., Klinger, L., Mckay, W. A., and Scholes, B.: A global model of natural volatile organic compound emissions s Raja the balance Triangle changes in the atmospheric accumulation rates of greenhouse Triangle Several inventories of natural and Exposure Assessment global scales have been two classes Fores, J. Geophys. Res., 100, 8873–8892, 1995.
Guenther, A., Karl, T., Harley, P., Wiedinmyer, C., Palmer, P. I., and Geron, C.: Estimates of global terrestrial isoprene emissions using MEGAN (Model of Emissions of Gases and Aerosols from Nature), Atmos. Chem. Phys., 6, 3181–3210, https://doi.org/10.5194/acp-6-3181-2006, 2006.
Guenther, A. B. and Hills, A. J.: Eddy covariance measurement of isoprene fluxes, J. Geophys. Res.-Atmos., 103, 13145–13152, https://doi.org/10.1029/97JD03283, 1998.
Guenther, A. B., Zimmerman, P. R., Harley, P. C., Monson, R. K., and Fall, R.: Isoprene and monoterpene emission rate variability – Model evaluation and sensitivity analyses., J. Geophys. Res.-Atmos., 98, 12609–12617, 1993.
Guenther, A. B., Jiang, X., Heald, C. L., Sakulyanontvittaya, T., Duhl, T., Emmons, L. K., and Wang, X.: The Model of Emissions of Gases and Aerosols from Nature version 2.1 (MEGAN2.1): an extended and updated framework for modeling biogenic emissions, Geosci. Model Dev., 5, 1471–1492, https://doi.org/10.5194/gmd-5-1471-2012, 2012.
Harley, P., Vasconcellos, P., Vierling, L., Pinheiro, C. C. D. S., Greenberg, J., Guenther, A., Klinger, L., Almeida, S. S. de, Neill, D., Baker, T., Phillips, O., and Malhi, Y.: Variation in potential for isoprene emissions among Neotropical forest sites, Glob. Change Biol., 10, 630–650, https://doi.org/10.1111/j.1529-8817.2003.00760.x, 2004.
Harrison, S. P., Dani, K. G. S., Prentice, I. C., Atwell, B. J., Leishman, M. R., Medlyn, B. E., Wright, I. J., Morfopoulos, C., Arneth, A., Barkley, M. P., Loreto, F., Niinemets, Ü., Possell, M., and Peñuelas, J.: Volatile isoprenoid emissions from plastid to planet, New Phytol., 197, 49–57, https://doi.org/10.1111/nph.12021, 2013.
Holst, T., Arneth, A., Hayward, S., Ekberg, A., Mastepanov, M., Jackowicz-Korczynski, M., Friborg, T., Crill, P. M., and Bäckstrand, K.: BVOC ecosystem flux measurements at a high latitude wetland site, Atmos. Chem. Phys., 10, 1617–1634, https://doi.org/10.5194/acp-10-1617-2010, 2010.
Jardine, K., Chambers, J., Alves, E. G., Teixeira, A., Garcia, S., Holm, J., Higuchi, N., Manzi, A., Abrell, L., Fuentes, J. D., Nielsen, L. K., Torn, M. S., and Vickers, C. E.: Dynamic Balancing of Isoprene Carbon Sources Reflects Photosynthetic and Photorespiratory Responses to Temperature Stress, Plant Physiol., 166, 2051–2064, https://doi.org/10.1104/pp.114.247494, 2014.
Jardine, K. J., Jardine, A. B., Holm, J. A., Lombardozzi, D. L., Negron-Juarez, R. I., Martin, S. T., Beller, H. R., Gimenez, B. O., Higuchi, N., and Chambers, J. Q.: Monoterpene `thermometer' of tropical forest-atmosphere response to climate warming, Plant Cell Environ., 40, 441–452, https://doi.org/10.1111/pce.12879, 2017.
Jensen, N. R., Gruening, C., Goded, I., Müller, M., Hjorth, J., and Wisthaler, A.: Eddy-covariance flux measurements in an Italian deciduous forest using PTR-ToF-MS, PTR-QMS and FIS, Int. J. Environ. An. Ch., 98, 758–788, https://doi.org/10.1080/03067319.2018.1502758, 2018.
Jiménez-Muñoz, J. C., Mattar, C., Barichivich, J., Santamaría-Artigas, A., Takahashi, K., Malhi, Y., Sobrino, J. A., and van der Schrier, G.: Record-breaking warming and extreme drought in the Amazon rainforest during the course of El Niño 2015–2016, Sci. Rep., 6, 33130, https://doi.org/10.1038/srep33130, 2016.
Karl, T., Potosnak, M., Guenther, A., Clark, D., Walker, J., Herrick, J. D., and Geron, C.: Exchange processes of volatile organic compounds above a tropical rain forest: Implications for modeling tropospheric chemistry above dense vegetation, J. Geophys. Res., 109, D18306, https://doi.org/10.1029/2004JD004738, 2004.
Keller, M. and Lerdau, M.: Isoprene emission from tropical forest canopy leaves, Global Biogeochem. Cy., 13, 19–29, 1999.
Kesselmeier, J., Ciccioli, P., Kuhn, U., Stefani, P., Biesenthal, T., Rottenberger, S., Wolf, A., Vitullo, M., Valentini, R., Nobre, A., Kabat, P., and Andreae, M. O.: Volatile organic compound emissions in relation to plant carbon fixation and the terrestrial carbon budget, Global Biogeochem. Cy., 16, 73–1-73–9, https://doi.org/10.1029/2001GB001813, 2002.
Klinger, L. F., Greenberg, J., Guenther, A., Zimmerman, P., M'Bangui, M., and Kenfack, D.: Patterns in volatile organic compound emissions along a savanna‐rainforest gradient in central Africa, J. Geophys. Res., 103, 1443–1454, https://doi.org/10.1029/97JD02928, 1998.
Klinger, L. F., Li, Q. J., Guenther, A. B., Greenberg, J. P., Baker, B., and Bai, J. H.: Assessment of volatile organic compound emissions from ecosystems of China, J. Geophys. Res., 107, 4603, https://doi.org/10.1029/2001JD001076, 2002.
Kljun, N., Calanca, P., Rotach, M. W., and Schmid, H. P.: A simple two-dimensional parameterisation for Flux Footprint Prediction (FFP), Geosci. Model Dev., 8, 3695–3713, https://doi.org/10.5194/gmd-8-3695-2015, 2015.
Kuhn, U., Rottenberger, S., Biesenthal, T., Wolf, a., Schebeske, G., Ciccioli, P., Brancaleoni, E., Frattoni, M., Tavares, T. M., and Kesselmeier, J.: Seasonal differences in isoprene and light-dependent monoterpene emission by Amazonian tree species, Glob. Change Biol., 10, 663–682, https://doi.org/10.1111/j.1529-8817.2003.00771.x, 2004a.
Kuhn, U., Rottenberger, S., Biesenthal, T., Wolf, A., Schebeske, G., Ciccioli, P., and Kesselmeier, J.: Strong correlation between isoprene emission and gross photosynthetic capacity during leaf phenology of the tropical tree species Hymenaea courbaril with fundamental changes in volatile organic compounds emission composition during early leaf development, Plant Cell Environ., 27, 1469–1485, https://doi.org/10.1111/j.1365-3040.2004.01252.x, 2004b.
Langford, B., House, E., Valach, A., Hewitt, C. N., Artaxo, P., Barkley, M. P., Brito, J., Carnell, E., Davison, B., MacKenzie, A. R., Marais, E. A., Newland, M. J., Rickard, A. R., Shaw, M. D., Yáñez-Serrano, A. M., and Nemitz, E.: Seasonality of isoprene emissions and oxidation products above the remote Amazon, Environmental Science: Atmospheres, 2, 230–240, https://doi.org/10.1039/D1EA00057H, 2022.
Lerdau, M. and Keller, M.: Controls on isoprene emission from trees in a subtropical dry forest, Plant Cell Environ., 20, 569–578, https://doi.org/10.1111/j.1365-3040.1997.00075.x, 1997.
Lopes, A. P., Nelson, B. W., Wu, J., Graça, P. M. L. de A., Tavares, J. V., Prohaska, N., Martins, G. A., and Saleska, S. R.: Leaf flush drives dry season green-up of the Central Amazon, Remote Sens. Environ., 182, 90–98, https://doi.org/10.1016/j.rse.2016.05.009, 2016.
Martins Rosa, D.: ESTRUTURA DO DOSSEL E SAZONALIDADE DO ÍNDICE DE ÁREA FOLIAR EM AMBIENTES DE TERRA FIRME NA AMAZÔNIA CENTRAL, COM USO DO LIDAR PORTÁTIL TERRESTRE, Dissertação (Mestrado) — INPA, Manaus, https://repositorio.inpa.gov.br/handle/1/5148 (last access: 15 July 2023), 2016.
Mauder, T. and Foken, T.: Documentation and Instruction Manual of the Eddy Covariance Software Package TK2, Universität Bayreuth, Bayreuth, 2004.
Monson, R. K., Jones, R. T., Rosenstiel, T. N., and Schnitzler, J. P.: Why only some plants emit isoprene, Plant Cell Environ., 36, 503–516, https://doi.org/10.1111/pce.12015, 2013.
Niinemets, Ü.: Leaf age dependent changes in within-canopy variation in leaf functional traits: a meta-analysis, J. Plant Res., 129, 313–338, https://doi.org/10.1007/s10265-016-0815-2, 2016.
Niinemets, Ü., Monson, R. K., Arneth, A., Ciccioli, P., Kesselmeier, J., Kuhn, U., Noe, S. M., Peñuelas, J., and Staudt, M.: The leaf-level emission factor of volatile isoprenoids: caveats, model algorithms, response shapes and scaling, Biogeosciences, 7, 1809–1832, https://doi.org/10.5194/bg-7-1809-2010, 2010.
Nobre, C. A., Sampaio, G., Borma, L. S., Castilla-Rubio, J. C., Silva, J. S., and Cardoso, M.: Land-use and climate change risks in the Amazon and the need of a novel sustainable development paradigm, P. Natl. Acad. Sci. USA, 113, https://doi.org/10.1073/pnas.1605516113, 2016.
Nölscher, A. C., Yañez-Serrano, A. M., Wolff, S., de Araujo, A. C., Lavrič, J. v, Kesselmeier, J., and Williams, J.: Unexpected seasonality in quantity and composition of Amazon rainforest air reactivity, Nat. Commun., 7, 10383, https://doi.org/10.1038/ncomms10383, 2016.
Padhy, P. K. and Varshney, C. K.: Isoprene emission from tropical tree species, Environ. Pollut., 135, 101–109, https://doi.org/10.1016/j.envpol.2004.10.003, 2005.
Pegoraro, E., Rey, A., Abrell, L., Haren, J., and Lin, G.: Drought effect on isoprene production and consumption in Biosphere 2 tropical rainforest, Glob. Change Biol., 12, 456–469, https://doi.org/10.1111/j.1365-2486.2006.01112.x, 2006.
Pfannerstill, E. Y., Nölscher, A. C., Yáñez-Serrano, A. M., Bourtsoukidis, E., Keßel, S., Janssen, R. H. H., Tsokankunku, A., Wolff, S., Sörgel, M., Sá, M. O., Araújo, A., Walter, D., Lavrič, J., Dias-Júnior, C. Q., Kesselmeier, J., and Williams, J.: Total OH Reactivity Changes Over the Amazon Rainforest During an El Niño Event, Frontiers in Forests and Global Change, 1, 12, https://doi.org/10.3389/ffgc.2018.00012, 2018.
Pfannerstill, E. Y., Reijrink, N. G., Edtbauer, A., Ringsdorf, A., Zannoni, N., Araújo, A., Ditas, F., Holanda, B. A., Sá, M. O., Tsokankunku, A., Walter, D., Wolff, S., Lavrič, J. V., Pöhlker, C., Sörgel, M., and Williams, J.: Total OH reactivity over the Amazon rainforest: variability with temperature, wind, rain, altitude, time of day, season, and an overall budget closure, Atmos. Chem. Phys., 21, 6231–6256, https://doi.org/10.5194/acp-21-6231-2021, 2021.
Pöhlker, C., Walter, D., Paulsen, H., Könemann, T., Rodríguez-Caballero, E., Moran-Zuloaga, D., Brito, J., Carbone, S., Degrendele, C., Després, V. R., Ditas, F., Holanda, B. A., Kaiser, J. W., Lammel, G., Lavrič, J. V., Ming, J., Pickersgill, D., Pöhlker, M. L., Praß, M., Löbs, N., Saturno, J., Sörgel, M., Wang, Q., Weber, B., Wolff, S., Artaxo, P., Pöschl, U., and Andreae, M. O.: Land cover and its transformation in the backward trajectory footprint region of the Amazon Tall Tower Observatory, Atmos. Chem. Phys., 19, 8425–8470, https://doi.org/10.5194/acp-19-8425-2019, 2019.
Pöschl, U., Martin, S. T., Sinha, B., Chen, Q., Gunthe, S. S., Huffman, J. A., Borrmann, S., Farmer, D. K., Garland, R. M., Helas, G., Jimenez, J. L., King, S. M., Manzi, A., Mikhailov, E., Pauliquevis, T., Petters, M. D., Prenni, A. J., Roldin, P., Rose, D., Schneider, J., Su, H., Zorn, S. R., Artaxo, P., and Andreae, M. O.: Rainforest Aerosols as Biogenic Nuclei of Clouds and Precipitation in the Amazon, Science, 329, 1513–1516, https://doi.org/10.1126/science.1191056, 2010.
Rodrigues, T. B., Baker, C. R., Walker, A. P., McDowell, N., Rogers, A., Higuchi, N., Chambers, J. Q., and Jardine, K. J.: Stimulation of isoprene emissions and electron transport rates as key mechanisms of thermal tolerance in the tropical species Vismia guianensis, Glob. Change Biol., 26, 5928–5941, https://doi.org/10.1111/gcb.15213, 2020.
Sindelarova, K., Granier, C., Bouarar, I., Guenther, A., Tilmes, S., Stavrakou, T., Müller, J.-F., Kuhn, U., Stefani, P., and Knorr, W.: Global data set of biogenic VOC emissions calculated by the MEGAN model over the last 30 years, Atmos. Chem. Phys., 14, 9317–9341, https://doi.org/10.5194/acp-14-9317-2014, 2014.
Spirig, C., Neftel, A., Ammann, C., Dommen, J., Grabmer, W., Thielmann, A., Schaub, A., Beauchamp, J., Wisthaler, A., and Hansel, A.: Eddy covariance flux measurements of biogenic VOCs during ECHO 2003 using proton transfer reaction mass spectrometry, Atmos. Chem. Phys., 5, 465–481, https://doi.org/10.5194/acp-5-465-2005, 2005.
Stark, S. C., Leitold, V., Wu, J. L., Hunter, M. O., de Castilho, C. V, Costa, F. R. C., McMahon, S. M., Parker, G. G., Shimabukuro, M. T., Lefsky, M. a, Keller, M., Alves, L. F., Schietti, J., Shimabukuro, Y. E., Brandão, D. O., Woodcock, T. K., Higuchi, N., de Camargo, P. B., de Oliveira, R. C., Saleska, S. R., and Chave, J.: Amazon forest carbon dynamics predicted by profiles of canopy leaf area and light environment, Ecol. Lett., 15, 1406–1414, https://doi.org/10.1111/j.1461-0248.2012.01864.x, 2012.
Tambunan, P., Baba, S., Kuniyoshi, A., Iwasaki, H., Nakamura, T., Yamasaki, H., and Oku, H.: Isoprene emission from tropical trees in Okinawa Island, Japan, Chemosphere, 65, 2138–2144, https://doi.org/10.1016/j.chemosphere.2006.06.013, 2006.
Taylor, T. C., McMahon, S. M., Smith, M. N., Boyle, B., Violle, C., van Haren, J., Simova, I., Meir, P., Ferreira, L. v., de Camargo, P. B., da Costa, A. C. L., Enquist, B. J., and Saleska, S. R.: Isoprene emission structures tropical tree biogeography and community assembly responses to climate, New Phytol., 220, 435–446, https://doi.org/10.1111/nph.15304, 2018.
Taylor, T. C., Smith, M. N., Slot, M., and Feeley, K. J.: The capacity to emit isoprene differentiates the photosynthetic temperature responses of tropical plant species, Plant Cell Environ., 42, 2448–2457, https://doi.org/10.1111/pce.13564, 2019.
Taylor, T. C., Wisniewski, W. T., Alves, E. G., Oliveira Junior, R. C., and Saleska, S. R.: A New Field Instrument for Leaf Volatiles Reveals an Unexpected Vertical Profile of Isoprenoid Emission Capacities in a Tropical Forest, Frontiers in Forests and Global Change, 4, 1–22, https://doi.org/10.3389/ffgc.2021.668228, 2021.
ter Steege, H., Pitman, N. C. A., Sabatier, D., et al.: Hyperdominance in the Amazonian Tree Flora, Science, 342, 1243092–1243092, https://doi.org/10.1126/science.1243092, 2013.
Varshney, C. K. and Singh, A. P.: Isoprene emission from Indian trees, J. Geophys. Res., 108, 4803, https://doi.org/10.1029/2003JD003866, 2003.
Vickers, D. and Mahrt, L.: Quality control and flux sampling problems for tower and aircraft data, J. Atmos. Ocean. Tech., 14, 512–526, https://doi.org/10.1175/1520-0426(1997)014<0512:QCAFSP>2.0.CO;2, 1997.
Wei, D., Fuentes, J. D., Gerken, T., Chamecki, M., Trowbridge, A. M., Stoy, P. C., Katul, G. G., Fisch, G., Acevedo, O., Manzi, A., von Randow, C., and dos Santos, R. M. N.: Environmental and biological controls on seasonal patterns of isoprene above a rain forest in central Amazonia, Agr. Forest Meteorol., 256–257, 391–406, https://doi.org/10.1016/j.agrformet.2018.03.024, 2018.
Wells, K. C., Millet, D. B., Payne, V. H., Vigouroux, C., Aquino, C. A. B., Mazière, M., Gouw, J. A., Graus, M., Kurosu, T., Warneke, C., and Wisthaler, A.: Next-Generation Isoprene Measurements From Space: Detecting Daily Variability at High Resolution, J. Geophys. Res.-Atmos., 127, e2021JD036181, https://doi.org/10.1029/2021JD036181, 2022.
Werner, C., Meredith, L. K., Ladd, S. N., Ingrisch, J., Kübert, A., van Haren, J., Bahn, M., Bailey, K., Bamberger, I., Beyer, M., Blomdahl, D., Byron, J., Daber, E., Deleeuw, J., Dippold, M. A., Fudyma, J., Gil-Loaiza, J., Honeker, L. K., Hu, J., Huang, J., Klüpfel, T., Krechmer, J., Kreuzwieser, J., Kühnhammer, K., Lehmann, M. M., Meeran, K., Misztal, P. K., Ng, W.-R., Pfannerstill, E., Pugliese, G., Purser, G., Roscioli, J., Shi, L., Tfaily, M., and Williams, J.: Ecosystem fluxes during drought and recovery in an experimental forest, Science, 374, 1514–1518, https://doi.org/10.1126/science.abj6789, 2021.
Woolfenden, E. A. and McClenny, W. A.: Compendium Method TO-17: Determination of Volatile Organic Compounds in Ambient Air Using Active Sampling Onto Sorbent Tubes, US EPA, Cincinnati, OH, 1999.
Wu, J., Albert, L. P., Lopes, A. P., Restrepo-Coupe, N., Hayek, M., Wiedemann, K. T., Guan, K., Stark, S. C., Christoffersen, B., Prohaska, N., Tavares, J. v., Marostica, S., Kobayashi, H., Ferreira, M. L., Campos, K. S., Silva, R. da, Brando, P. M., Dye, D. G., Huxman, T. E., Huete, A. R., Nelson, B. W., and Saleska, S. R.: Leaf development and demography explain photosynthetic seasonality in Amazon evergreen forests, Science, 351, 972–976, https://doi.org/10.1126/science.aad5068, 2016.
Yáñez-Serrano, A. M., Nölscher, A. C., Williams, J., Wolff, S., Alves, E., Martins, G. A., Bourtsoukidis, E., Brito, J., Jardine, K., Artaxo, P., and Kesselmeier, J.: Diel and seasonal changes of biogenic volatile organic compounds within and above an Amazonian rainforest, Atmos. Chem. Phys., 15, 3359–3378, https://doi.org/10.5194/acp-15-3359-2015, 2015.
Yáñez-Serrano, A. M., Nölscher, A. C., Bourtsoukidis, E., Gomes Alves, E., Ganzeveld, L., Bonn, B., Wolff, S., Sa, M., Yamasoe, M., Williams, J., Andreae, M. O., and Kesselmeier, J.: Monoterpene chemical speciation in a tropical rainforest:variation with season, height, and time of dayat the Amazon Tall Tower Observatory (ATTO), Atmos. Chem. Phys., 18, 3403–3418, https://doi.org/10.5194/acp-18-3403-2018, 2018.
Yáñez-Serrano, A. M., Bourtsoukidis, E., Alves, E. G., Bauwens, M., Stavrakou, T., Llusià, J., Filella, I., Guenther, A., Williams, J., Artaxo, P., Sindelarova, K., Doubalova, J., Kesselmeier, J., and Peñuelas, J.: Amazonian biogenic volatile organic compounds under global change, Glob. Change Biol., 26, 4722–4751, https://doi.org/10.1111/gcb.15185, 2020.
Zannoni, N., Leppla, D., Lembo Silveira de Assis, P. I., Hoffmann, T., Sá, M., Araújo, A., and Williams, J.: Surprising chiral composition changes over the Amazon rainforest with height, time and season, Commun. Earth. Environ., 1, 1–11, https://doi.org/10.1038/s43247-020-0007-9, 2020.