the Creative Commons Attribution 4.0 License.
the Creative Commons Attribution 4.0 License.
 | 18 Jul 2023
Complex refractive index and single scattering albedo of Icelandic dust in the shortwave part of the spectrum
Clarissa Baldo
Paola Formenti
Claudia Di Biagio
Gongda Lu
Congbo Song
Mathieu Cazaunau
Edouard Pangui
Jean-Francois Doussin
Pavla Dagsson-Waldhauserova
Olafur Arnalds
David Beddows
A. Robert MacKenzie
Zongbo Shi
Icelandic dust can impact the radiative budget in high-latitude regions directly by affecting light absorption and scattering and indirectly by changing the surface albedo after dust deposition. This tends to produce a positive radiative forcing. However, the limited knowledge of the spectral optical properties of Icelandic dust prevents an accurate assessment of these radiative effects. Here, the spectral single scattering albedo (SSA) and the complex refractive index () of Icelandic dust from five major emission hotspots were retrieved between 370–950 nm using online measurements of size distribution and spectral absorption (βabs) and scattering (βsca) coefficients of particles suspended in a large-scale atmospheric simulation chamber. The SSA(λ) estimated from the measured βabs and βsca increased from 0.90–0.94 at 370 nm to 0.94–0.96 at 950 nm in Icelandic dust from the different hotspots, which falls within the range of mineral dust from northern Africa and eastern Asia. The spectral complex refractive index was retrieved by minimizing the differences between the measured βabs and βsca and those computed using the Mie theory for spherical and internally homogeneous particles, using the size distribution data as input. The real part of the complex refractive index (n(λ)) was found to be 1.60–1.61 in the different samples and be independent of wavelength. The imaginary part (k(λ)) was almost constant with wavelength and was found to be around 0.004 at 370 nm and 0.002–0.003 at 950 nm. The estimated complex refractive index was close to the initial estimates based on the mineralogical composition, also suggesting that the high magnetite content observed in Icelandic dust may contribute to its high absorption capacity in the shortwave part of the spectrum. The k(λ) values retrieved for Icelandic dust are at the upper end of the reported range for low-latitude dust (e.g., from the Sahel). Furthermore, Icelandic dust tends to be more absorbing towards the near-infrared. In Icelandic dust, k(λ) between 660–950 nm was 2–8 times higher than most of the dust samples sourced in northern Africa and eastern Asia. This suggests that Icelandic dust may have a stronger positive direct radiative forcing on climate that has not been accounted for in climate predictions.
- Article
(5665 KB) - Full-text XML
- Companion paper
-
Supplement
(4508 KB) - BibTeX
- EndNote


Iceland is a major contributor to the dust aerosol loading over high-latitude (> 60∘ N) regions in the Northern Hemisphere (Arnalds et al., 2016; Baddock et al., 2017; Bullard et al., 2016; Dagsson-Waldhauserova et al., 2019; Groot Zwaaftink et al., 2017, 2016; Meinander et al., 2022; Prospero et al., 2012). With an area of more than 45 000 km2, the Icelandic desert is the largest in the Arctic (Arnalds et al., 2016), and, being subject to intense wind erosion, Iceland is one of the most active dust source areas in the world, producing about 4.6–40 Tg of dust per year (Arnalds et al., 2016; Groot Zwaaftink et al., 2016) and 34–135 dust events per year (Dagsson-Waldhauserova et al., 2014; Nakashima and Dagsson-Waldhauserová, 2019). Near glaciers, dust hotspots cover about 500 km2 and are fed by fluvial–glacial processes acting on volcanic deposits and can produce millions of tonnes of dust during single dust events (Arnalds et al., 2016).
Icelandic dust can reach several kilometers in altitude, as shown in a study by Dagsson-Waldhauserova et al. (2019). They conducted six winter balloon launches in southwest Iceland during 2013–2016. Vertical profile measurements were collected using the Light Optical Aerosol Counter (LOAC) instrument, which provided aerosol size number distributions, concentrations, typologies, and basic meteorological parameters. LOAC estimates particle typologies for black carbon, mineral dust, volcanic dust, volcanic ash, ice particles, sea salt, and liquid particles, based on a specific range referred to as the “speciation zone”, retrieved during laboratory experiments with different aerosols (Renard et al., 2016). The speciation zone of Icelandic volcanic dust was established based on laboratory simulations using volcanic dust and ash samples collected in Iceland. Volcanic dust particles up to 10 µm were detected within 900 m altitude and those up to 5 µm mostly within 3.5 km altitude, while submicron particles were detected at altitudes up to 6 km. LOAC measurements were confirmed by surface measurements at the Environment Agency of Iceland's monitoring stations, CALIPSO and HYSPLIT models at different altitudes, and MODIS images with dust plumes, pointing to the local Icelandic dust sources during the polar vortex conditions above Iceland.
Icelandic dust can also be transported over long distances to the high Arctic (Baddock et al., 2017; Groot Zwaaftink et al., 2017, 2016; Moroni et al., 2018; Prospero et al., 2012). Arctic dust events typically occur during summer/autumn in northeastern Iceland (Dagsson-Waldhauserova et al., 2013, 2014; Meinander et al., 2022; Nakashima and Dagsson-Waldhauserová, 2019), while sub-Arctic dust events mainly occur during winter/spring in southern Iceland (Dagsson-Waldhauserova et al., 2014, 2015, 2019).
A modeling study by Groot Zwaaftink et al. (2016) estimated that Iceland accounts for approximatively 2 % of the total atmospheric dust load in the Arctic. According to that study, high-latitude dust contributes to about 27 % of the dust load, while the remaining amount is dominated by low-latitude dust from Africa and Asia. High-latitude dust is confined to low altitudes due to the stratified atmosphere in cold climates, and it dominates dust surface concentrations (Bullard, 2017; Groot Zwaaftink et al., 2016; Shi et al., 2022). Dust concentration and dust load have important consequences for the radiative balance in the Arctic, where the radiative effect of light-absorbing particles is enhanced by the presence of snow and ice (Schmale et al., 2021). Icelandic dust absorbs solar – shortwave (SW) – radiation (Zubko et al., 2019). Absorbing aerosol particles in the Arctic upper troposphere tend to cool the surface, whereas those located at lower altitudes tend to warm the surface (Schmale et al., 2021). The estimated instantaneous radiative forcing (IRF) of Icelandic dust is 0.005 W m−2 at the top of the atmosphere (TOA) via dust–radiation interaction, which is lower but still significant compared to the IRF at the bottom of the atmosphere (BOA) via dust deposition onto snow-covered areas, i.e., 0.02 W m−2 (Kylling et al., 2018).
Icelandic dust accounts for around 5.8 % of the total dust deposition in the Arctic. Experiments have shown that the deposition of volcanic dust particles from Iceland onto snow and ice can reduce the surface albedo and influence melting (Dragosics et al., 2016; Gunnarsson et al., 2021; Meinander et al., 2014; Möller et al., 2016, 2018; Peltoniemi et al., 2015; Wittmann et al., 2017). Peltoniemi et al. (2015) found that volcanic sand from the Mýrdalssandur hotspot in southern Iceland reduced the snow albedo in the wavelength (λ) range 400–2500 nm similarly to black carbon (BC). Laboratory measurements conducted on pure volcanic sand (deposited particles) showed a spectral reflectance of less than 0.04, which is close to a blackbody (0.0) (Dagsson-Waldhauserova, 2014; Peltoniemi et al., 2015).
In addition, Icelandic dust is a source of ice-nucleating particles (e.g., Sanchez-Marroquin et al., 2020; Shi et al., 2022). Sanchez-Marroquin et al. (2020) estimated that during summer days, Icelandic dust is the dominant source of ice-nucleating dust particles over areas near the eastern coast of Greenland. The increase in ice-nucleating particles can reduce the amount of supercooled liquid water and consequently the albedo of mixed-phase clouds (Vergara-Temprado et al., 2018), which have a large impact on the radiative budget in the Arctic (Morrison et al., 2012; Murray et al., 2021). Icelandic dust also contributes to the deposition of dissolved iron (Fe) to the subpolar North Atlantic Ocean (Arnalds et al., 2014; Baldo et al., 2020), which has the potential to alter nutrient biogeochemical cycling and primary production in the surface ocean (Achterberg et al., 2013, 2018). The deposition of nutrients such as phosphorus (P) and Fe from mineral dust can also promote the blooming of algae in ice, which consequently reduces the ice albedo and accelerates melting (Cook et al., 2020; Lutz et al., 2015; McCutcheon et al., 2021).
The mineralogical composition of Icelandic dust is considerably different from typical low-latitude dust such as northern African and eastern Asian dust (Baldo et al., 2020), and the absorption of solar radiation by mineral dust is strongly related to the content of total Fe and Fe oxide minerals (Caponi et al., 2017; Derimian et al., 2008; Di Biagio et al., 2019; Engelbrecht et al., 2016; Formenti et al., 2014; Lafon et al., 2006; Moosmuller et al., 2012; Sokolik and Toon, 1999). Icelandic dust primarily consists of amorphous basaltic material, but it is also enriched in Fe, contributing to over 10 % of the total dust mass, with relatively high magnetite (Fe3O4) content (Baldo et al., 2020). This suggests that the optical properties of Icelandic dust may also be different from that of low-latitude dust.
The complex refractive index, represented by , links the particle chemical composition and optical properties, with the real part n defining the scattering properties and the imaginary part k defining the absorption properties (Bohren and Hufmann, 1998). In a study by Zubko et al. (2019), the index k of suspended particles from the Mýrdalssandur hotspot was found to be 0.01 at 647 nm, which is around 1 order of magnitude higher than the average values reported for mineral dust from northern Africa and eastern Asia by Di Biagio et al. (2019). However, the spectral dependence of k is unknown to date.
In Baldo et al. (2020), we studied the chemical and mineralogical composition of Icelandic dust from several major emission hotspots and found that it is distinctive and could be highly light-absorbing. Here, we go a step further and, for the first time, determine the complex refractive index and single scattering albedo (SSA) of Icelandic dust over a broad range of λ (370–950 nm) based on in situ measurements of the size distribution and optical properties of suspended particles generated from natural parent soils.
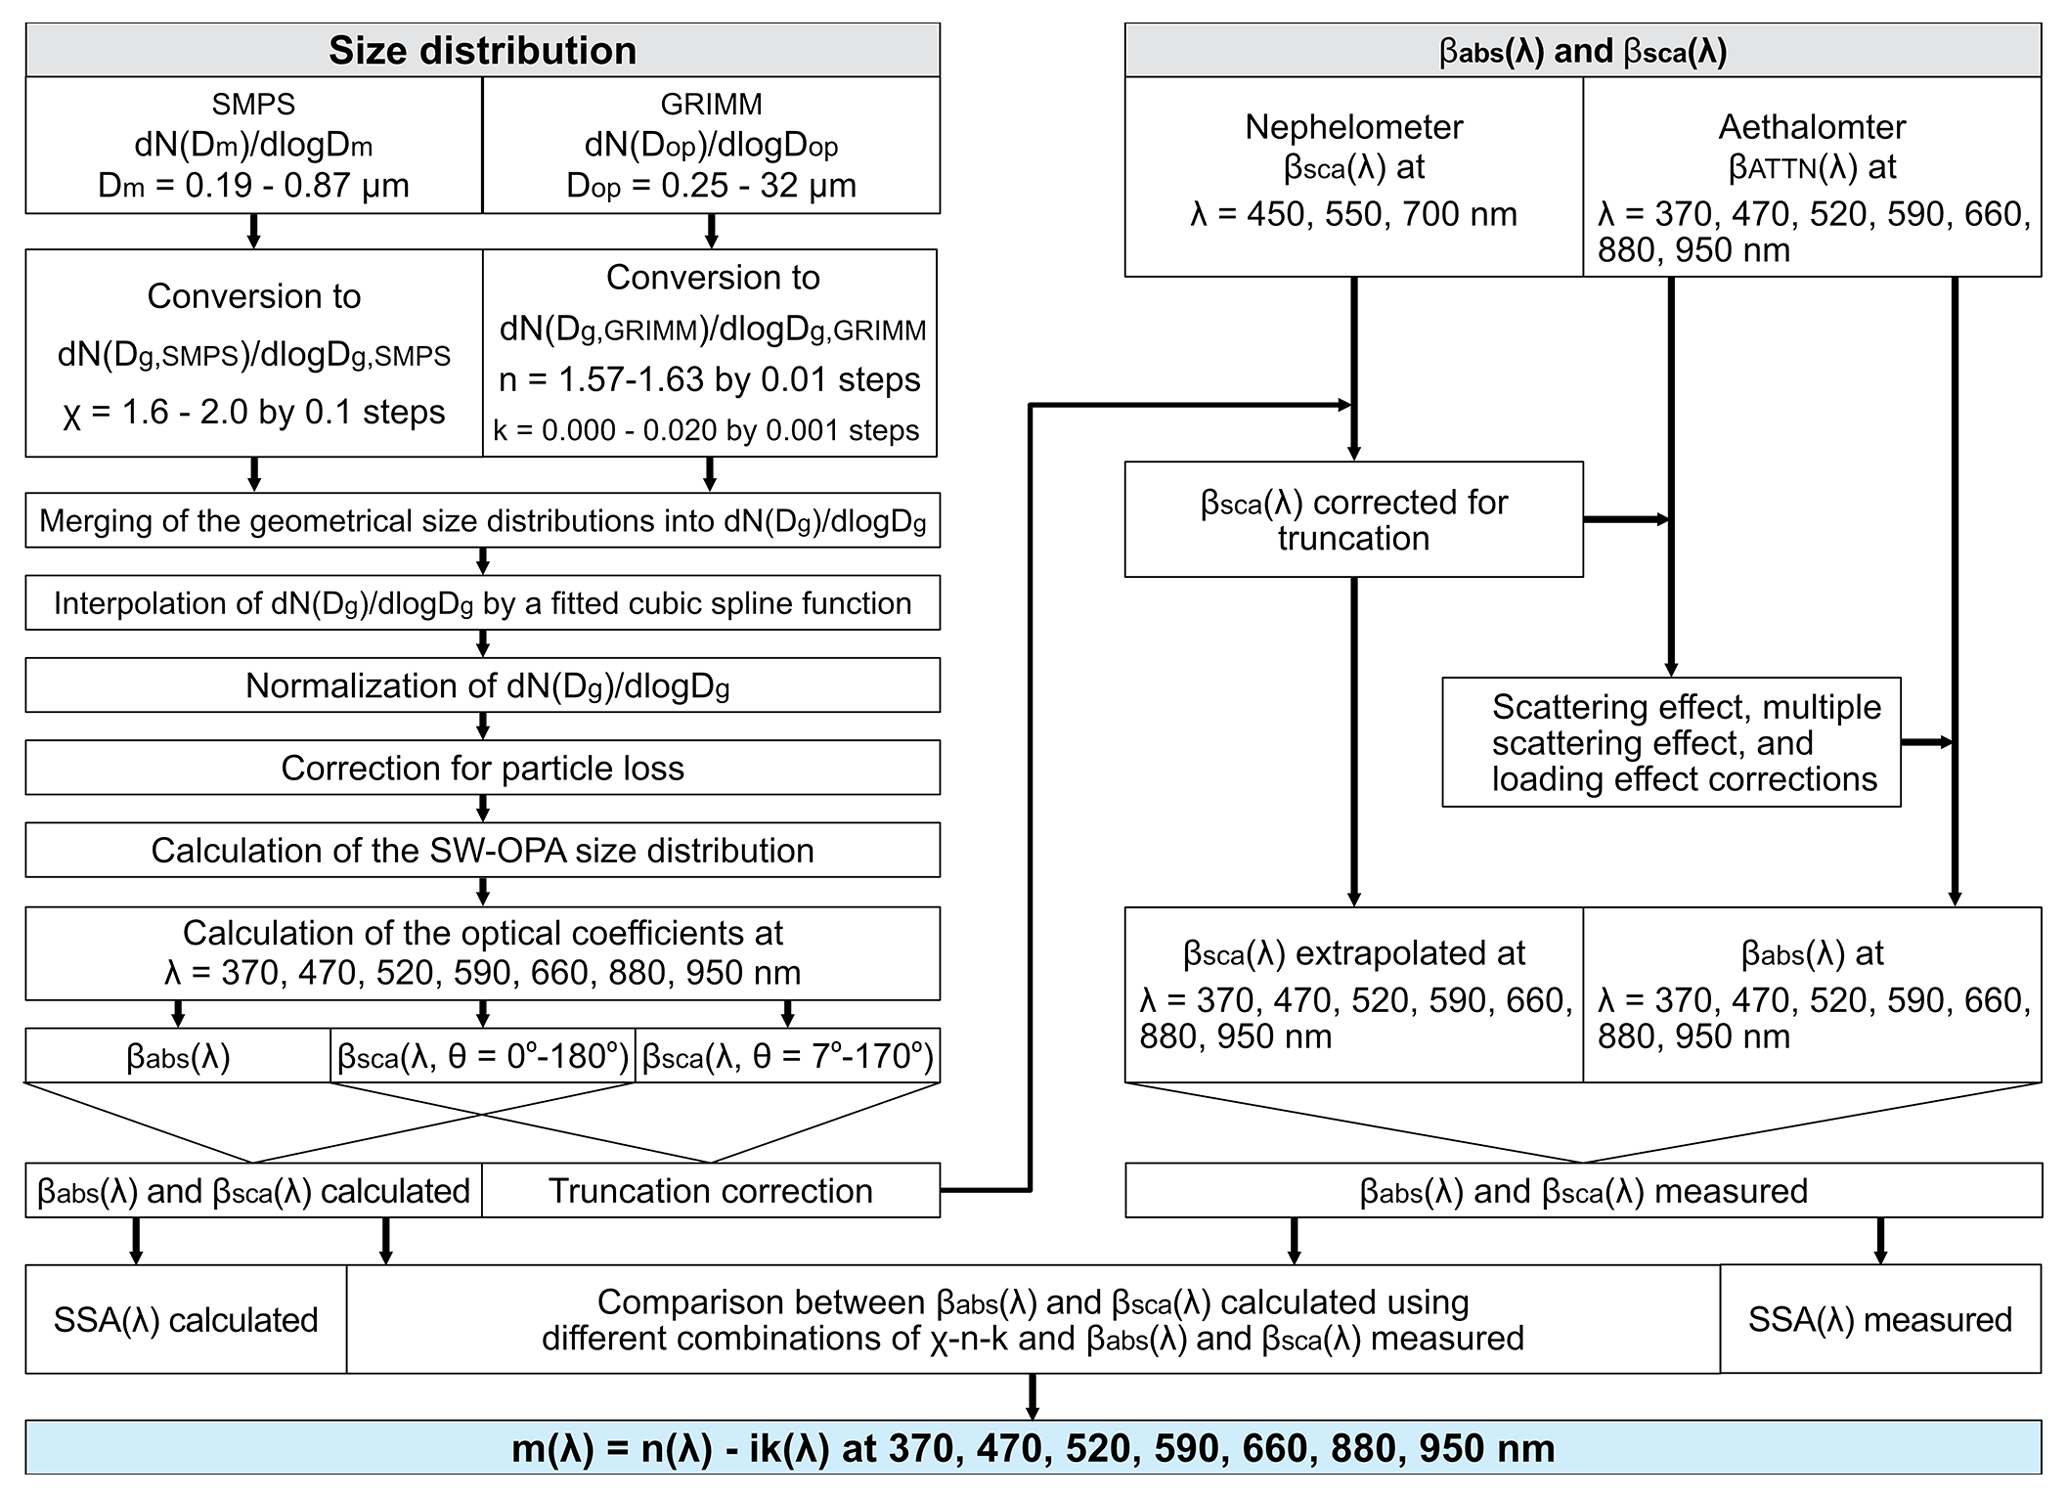
Figure 1Schematic diagram of the method used to retrieve the shortwave (SW) single scattering albedo (SSA) and complex refractive index () of Icelandic dust for λ from 370 to 950 nm. See the main text for details. βsca(λ) is the spectral scattering coefficient retrieved from the nephelometer measurements, and θ is the light scattering angle. βATTN(λ) and βabs(λ) are, respectively, the spectral attenuation and absorption coefficients retrieved from the Aethalometer measurements. is the particle number concentration measured by the SMPS (scanning mobility particle sizer), where Dm is the electrical mobility diameter. is the particle number concentration measured by GRIMM (optical particle counter), where Dop is the optical-equivalent diameter. is the geometrical size distribution retrieved from the SMPS or GRIMM measurements, where Dg is the geometrical diameter obtained from Dm or Dop using selected intervals for the dust particle dynamic shape factor (χ) and the real (n) and imaginary (k) parts of the complex refractive index, respectively. The term SW-OPAs (Shortwave Optical Properties Analyzers) refers to the Aethalometer and nephelometer.
This section illustrates the approach used to retrieve the SSA and complex refractive index of Icelandic dust in the SW range, which was based on the method by Di Biagio et al. (2019). SSA is the ratio of the scattering coefficient (βsca) to the extinction coefficient (βext) – the sum of βsca and the absorption coefficient (βabs). The spectral coefficients βabs and βsca and the size distribution of suspended dust particles were measured using the multi-instrument atmospheric simulation chamber CESAM – French acronym for Experimental Multiphasic Atmospheric Simulation Chamber (Wang et al., 2011). The complex refractive index was retrieved from the comparison between the spectral coefficients βabs and βsca measured and computed with the Mie theory, assuming that the particles are spherical and internally homogeneous, using the size distribution data as input. Although mineral dust aerosol is neither spherical nor internally homogeneous (e.g., Kandler et al., 2007; Okada et al., 2001), we have simplified the calculations of the optical properties to allow for comparison with previous studies (Deguine et al., 2020; Di Biagio et al., 2019; Kylling et al., 2018; Reed et al., 2018; Zubko et al., 2019). A schematic diagram of the method used to retrieve the complex refractive index is shown in Fig. 1.
2.1 Experimental setup
The size distribution and optical properties of Icelandic dust were measured by the use of CESAM, a 4.2 m3 stainless-steel atmospheric simulation chamber (Wang et al., 2011). The experiments were conducted using surface sediment samples from five major dust hotspots in Iceland (Baldo et al., 2020) – D3 (Dyngjusandur), H55 (Hagavatn), Land1 (Landeyjasandur), Maeli2 (Mælifellssandur), and MIR45 (Mýrdalssandur). Table S1 in the Supplement contains the information on sampling sites. As described in Baldo et al. (2020), 15 g of sediments (previously sieved to < 1 mm) was placed in a Büchner flask; this was shaken for 5 min at 70 Hz on a sieve shaker (Retsch AS200), then mixed with nitrogen carrier gas, and injected into the CESAM chamber at 10 L min−1 for 10 min. Once injected in CESAM, the aerosolized dust particles were allowed to mix for around 10 min inside the chamber. A four-blade stainless-steel fan located at the bottom of the chamber ensured that the particle concentration was homogeneous inside the chamber. All experiments were conducted at ambient temperature and relative humidity < 2 %. A particle-free mixture was continuously injected into the chamber to balance the proportion of air flow sampled by the different instruments. The chamber was manually cleaned between experiments with different samples to avoid any cross-contamination. The background mass concentrations of dust aerosol in the chamber varied from 0.1 to 3.0 µg m−3.
Instrumentation
The physical and chemical properties of the suspended dust were monitored over the duration of the experiments (approximatively 3 h) using different instruments connected to the chamber (Fig. S1 in the Supplement).
The particle number size distribution of dust aerosols (in units of cm−3) was measured using a scanning mobility particle sizer (SMPS) (TSI Inc., DMA model 3080, CPC model 3772; 2.0 and 0.2 L min−1 sheath–aerosol flow rates; 3 min time resolution) and two optical particle counters (OPCs): GRIMM (Grimm Aerosol Technik GmbH, model 1.109; 655 nm operating λ; 1.2 L min−1 flow rate; 6 s time resolution) and SkyGRIMM (Grimm Inc., model 1.129; 655 nm operating λ; 1.2 L min−1 flow rate; 6 s time resolution). The SMPS measured the particle number concentration in the electrical mobility diameter (Dm) range from 0.019 to 0.870 µm. The OPC instruments GRIMM and SkyGRIMM measured the particle number concentration in the optical-equivalent diameter (Dop) range from 0.25 to 32 µm. The SMPS and SkyGRIMM were located at the bottom of the chamber, while GRIMM was installed at the top of the chamber (about 1 m above the SMPS and the SkyGRIMM) to verify that the concentration of dust aerosols in the chamber was spatially uniform. The percentage difference between the number concentrations in the size range measured by GRIMM and SkyGRIMM was < 10 % for samples D3 and MIR45, < 5 % for samples Land1 and Maeli2, and < 2 % for sample H55, suggesting that homogeneous conditions were obtained during the experiments.
The scattering coefficient βsca (in units of Mm−1; Mm−1 = 10−6 m−1) of the suspended particles was measured by a three-wavelength integrating nephelometer (TSI Inc., model 3563; operating at 450, 550, and 700 nm; 2 L min−1 flow rate, 1 s time resolution). The absorption coefficient βabs (in units of Mm−1) was retrieved by a seven-wavelength Aethalometer (Magee Scientific, model AE31; operating at 370, 470, 520, 590, 660, 880, and 950 nm; 2 L min−1 flow rate, 2 min time resolution). As detailed in Baldo et al. (2020), dust aerosol samples were also collected for 1 to 3 h, each with a flow rate of 7 L min−1, using custom-made filter samplers. The collected filter samples were analyzed offline to determine the chemical and mineralogical compositions of the suspended particles (Baldo et al., 2020).
The sampling system consisted of stainless-steel tubes (∼ 14–58 cm length, 9.5 mm inner diameter) located inside the chamber extracting air. For some instruments, conductive silicone tubing (TSI Inc., ∼ 30–65 cm length, 5 mm inner diameter) was also used as an external connection between the chamber and the instrument. The sampling lines were designed to be as straight and direct as possible to minimize particle loss. The total length of the sampling line varied depending on the instrument: 100 cm for the nephelometer, 86 cm for the Aethalometer, 79 cm for the SMPS, 58 cm for the SkyGRIMM and the aerosol filter samplers, and 14 cm for GRIMM.
To allow for the comparison of measurements from different instruments, all data in the following analysis were averaged over 12 min intervals from the start of the filter sampling. The data analysis was conducted on the measurements starting 30 min after the injection peak.
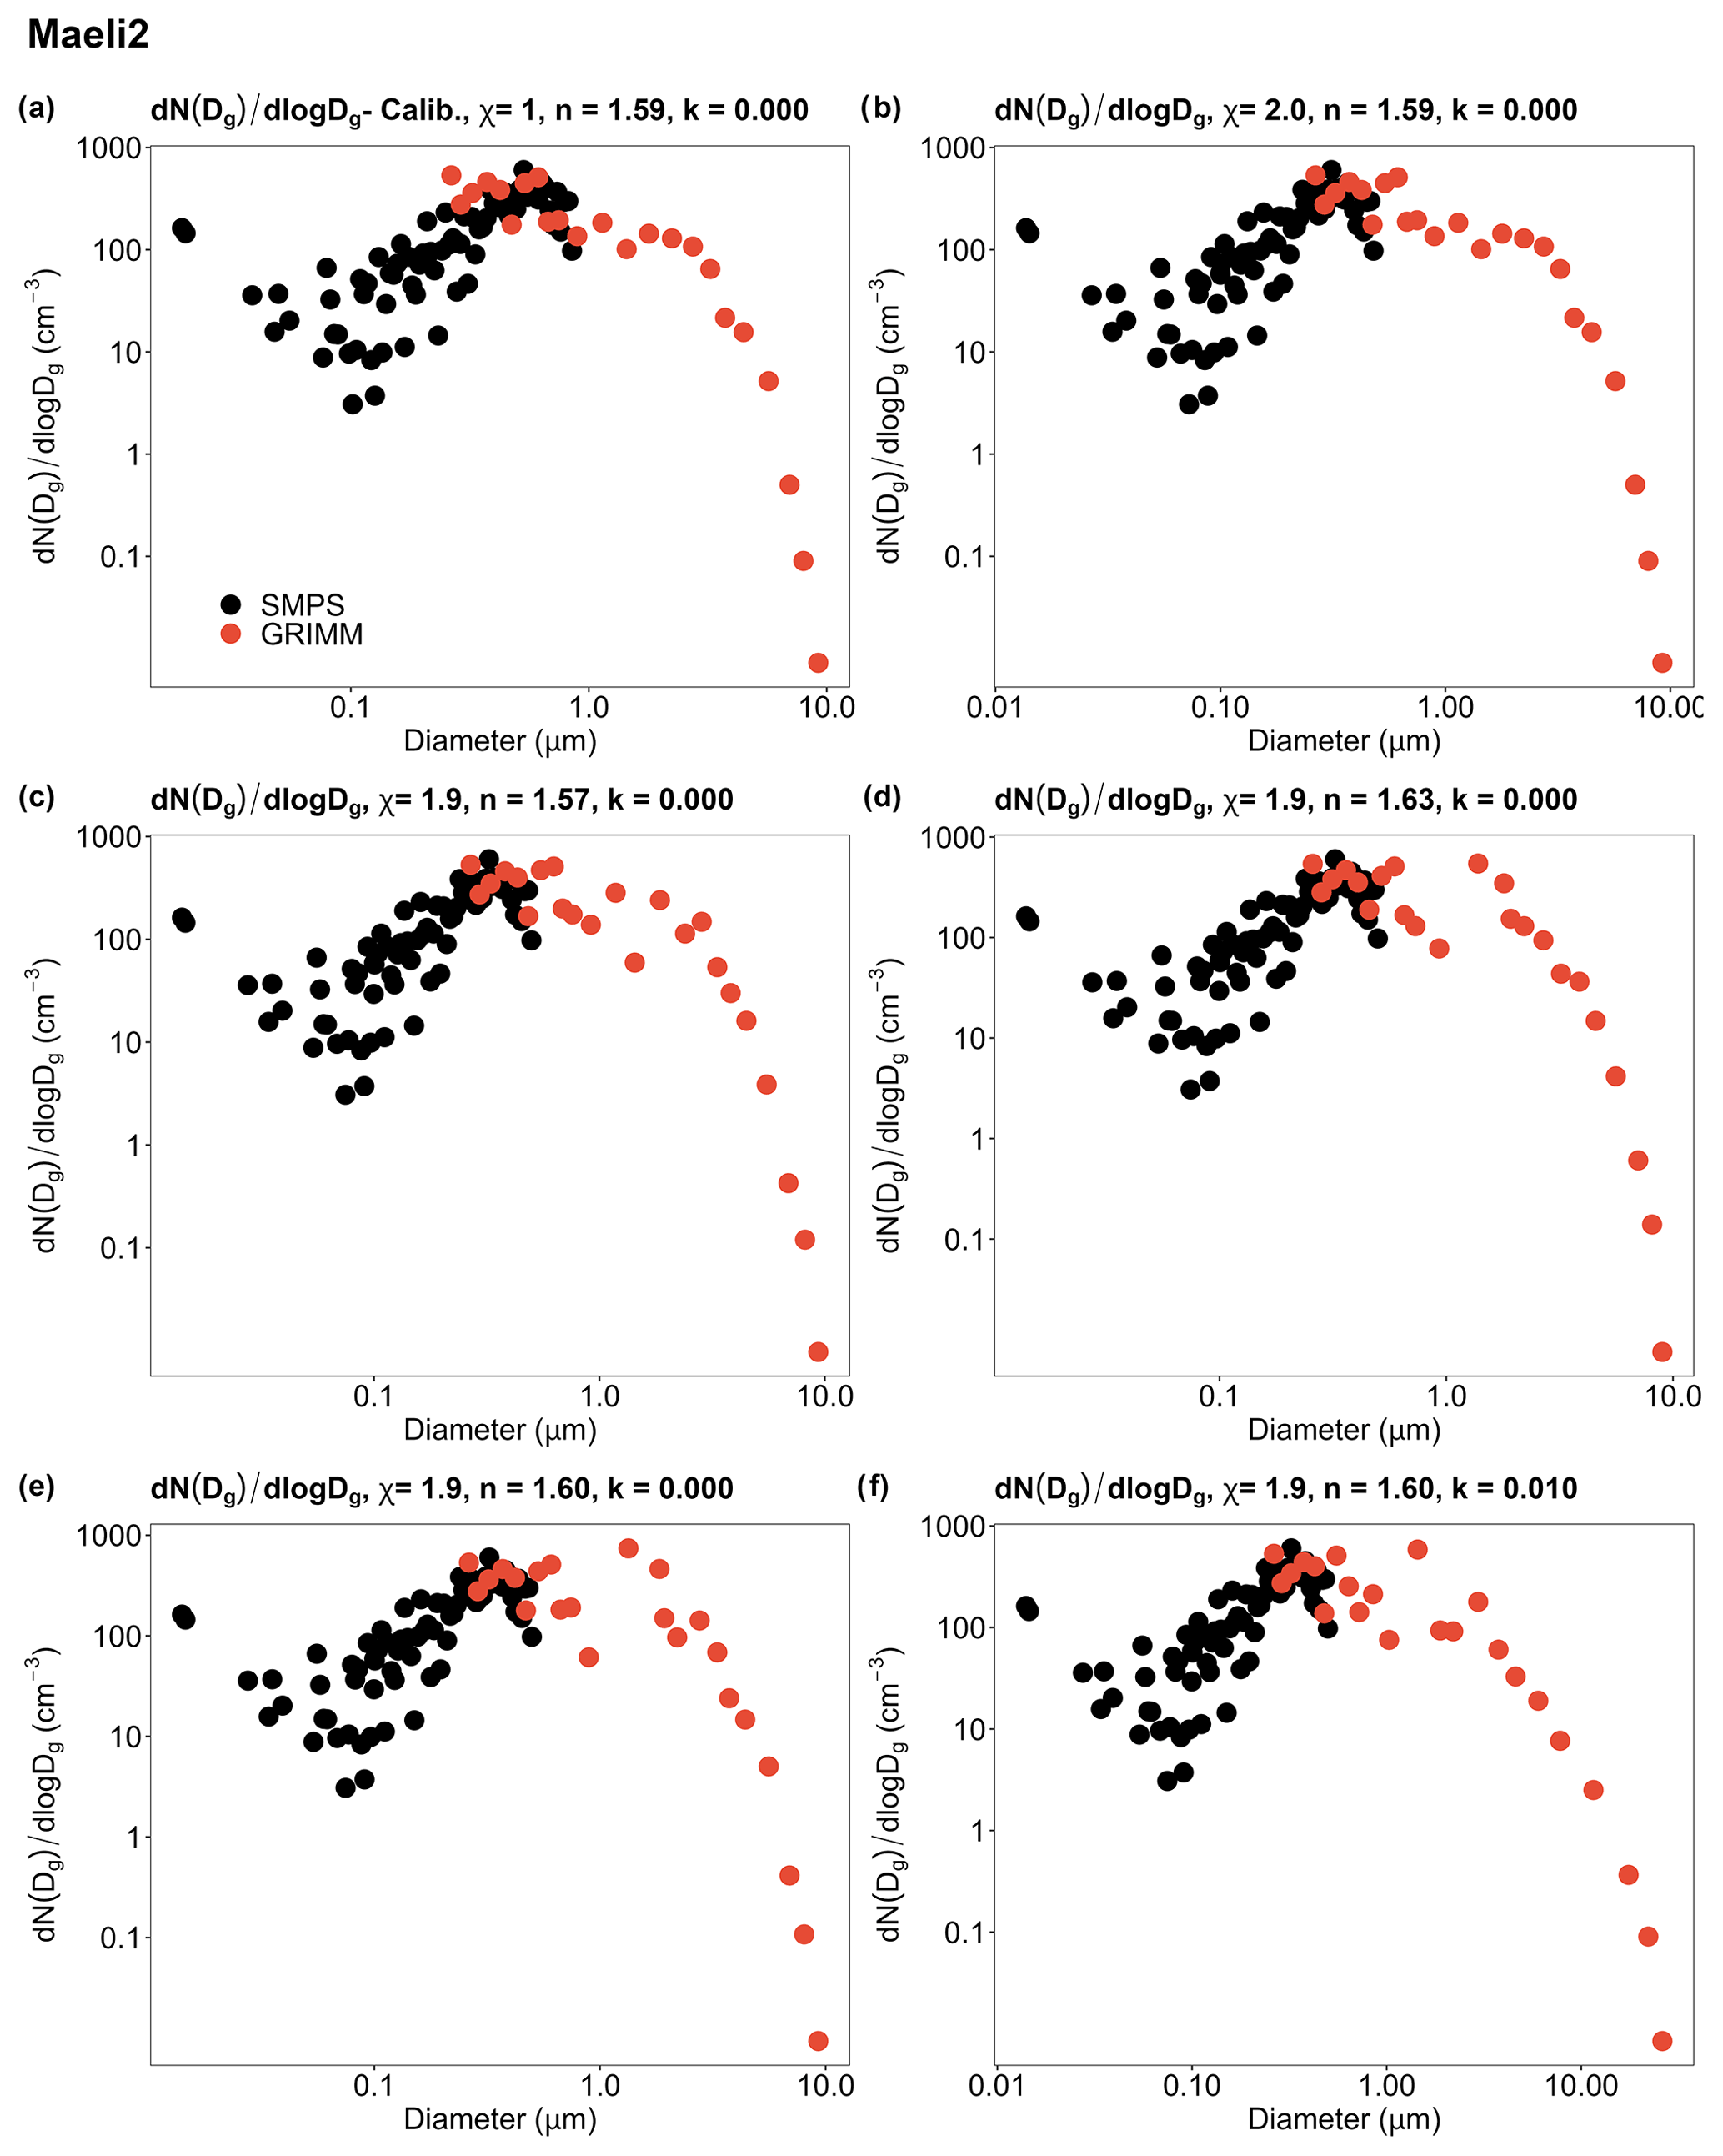
Figure 2Geometrical size distributions at 30 min after the injection peak obtained (a) using the calibration values of χ, n, and k; (b–f) for different χ–n–k combinations. χ is the dynamic shape factor used to convert the mobility diameter Dm measured by the SMPS into geometrical diameters Dg; n and k are, respectively, the real and imaginary parts of the complex refractive index used to convert the optical diameter Dop measured by GRIMM into Dg. Sample ID: Maeli2. Note that the size ranges shown are before correcting the size distributions for particle loss along the instrument sampling systems. In the end, particles suspended in CESAM were up to 20 µm in size, while particles sampled by the SW-OPAs were up to 9 µm in size. Details of the particle loss correction can be found in Appendix B.
2.2 Data analysis
2.2.1 Calculation of the aerosol geometrical size distribution from SMPS and GRIMM measurements
The measurements from the SMPS and GRIMM were combined into a single geometrical size distribution. Appendix A describes in detail the SMPS and GRIMM corrections. To combine SMPS and GRIMM measurements, first the SMPS particle number concentration, , and GRIMM particle number concentration, , were both converted into geometrical size distributions and , respectively (see Fig. 2). For the SMPS, the volume-equivalent diameters (Dg) were retrieved from the mobility diameters Dm using a range of dynamic shape factors χ in Eq. (A1). The interval of χ values (from 1.6 to 2.0 by 0.1 steps) was selected according to the aspect ratios observed in fine Icelandic dust particles ≤ 2.5 µm in diameter (Butwin et al., 2020). Iterative calculations were performed to calculate Dg using Eqs. (A1)–(A3).
For the GRIMM optical diameters Dop, we used the correction factors calculated by Formenti et al. (2021) by applying the Mie theory and by assuming that the particles are homogeneous spheres. The Dop / Dg range measured by GRIMM is from 0.25 to 32 µm, assuming the complex refractive index of polystyrene latex sphere (PSL) reference particles (n=1.59 and k=0.000). For the Icelandic dust samples, we selected a range of potential complex refractive indices with the index n varying from 1.57 to 1.63 by 0.01 steps and the index k varying from 0.000 to 0.020 by 0.001 steps. The range of n and k values was chosen according to the initial guess of the complex refractive index of the Icelandic dust samples examined in this study, estimated on the basis of their mineralogical composition (Baldo et al., 2020).
Merging of the SMPS and GRIMM size distributions
The SMPS geometrical size distributions, calculated assuming χ from 1.6 to 2.0 by 0.1 steps, and the GRIMM geometrical size distributions, calculated assuming 147 potential complex refractive indices (n from 1.57 to 1.63 by 0.01 steps, and k from 0.000 to 0.020 by 0.001 steps), were combined into 735 different geometrical size distributions . Figure 2 shows the good agreement between SMPS and GRIMM in their size overlapping region. Since the size resolution of the SMPS measurements is higher than that of the GRIMM measurements, we assumed the SMPS size distribution as a better representative in the overlapping region.
The merged geometrical size distributions were interpolated at a constant dlogDg interval of using a fitted cubic smoothing spline and normalized so that the total number of particles before and after interpolation is conserved. The “smooth.spline” function from core CRAN R software was used to perform the interpolation following Beddows et al. (2010). The total number of particles was calculated as follows:
After interpolation, the merged geometrical size distributions were corrected for the particle loss along the instrument sampling lines. The particle loss calculator (PLC) software (von der Weiden et al., 2009) was used to calculate the particle loss percentage for each instrument. The details of the method used in the particle loss correction process are described in Appendix B. The geometrical size distributions were first corrected for particle loss along the sampling lines of SMPS and GRIMM to obtain the size distributions of the particles suspended in CESAM. Subsequently, the particle loss correction was applied to the size distribution of particles within the chamber to determine the size distributions of particles sampled by the Aethalometer and nephelometer. Furthermore, since the size distributions of the two instruments were similar (the percentage difference between the loss correction estimated for the Aethalometer and that obtained for the nephelometer was < 11 %), a common size distribution was calculated as the mean of the size distributions of the Aethalometer and nephelometer. The resulting size distribution, referred to as NSW-OPAs(Dg), represents the size distribution detected by the Shortwave Optical Properties Analyzers (SW-OPAs). The size distribution of particles sampled by the SW-OPAs is more representative of transported particles than of local aerosols near the source region, due to the loss of larger particles through the nephelometer and Aethalometer sampling lines (Di Biagio et al., 2019, 2017a). In agreement with the size analysis of Di Biagio et al. (2017a, 2019), the results of this study would be more suitable for understanding the radiative effects of Icelandic dust in regions affected by its long-range transport.
Based on the combinations of χ, n, and k size corrections, a total of 735 geometrical size distributions were calculated. These were used to correct the spectral coefficients βabs and βsca measured, respectively, by the Aethalometer and nephelometer and to retrieve the complex refractive index of Icelandic dust. An example of the procedure used to process the size distribution data is shown in Fig. S2 in the Supplement.
Furthermore, two sensitivity simulations were performed to account for the potential error in measured particle number concentrations – according to the Poisson statistics – in the retrieval of the complex refractive index. The observed particle number concentrations plus or minus 1 standard deviation (SD), N(Dg), ± , were used as upper and lower limits of the SMPS and GRIMM measurements. In Test 1, corrections and calculations were performed using the SMPS and GRIMM data plus 1 SD uncertainty. In Test 2, we used the SMPS and GRIMM data minus 1 SD uncertainty.
Further uncertainty arises from the use of the Mie theory, which assumes homogeneous spherical particles. The particle morphology was not measured during the experiments, but previous research found that Icelandic dust particles can be irregular and present internal pores (Butwin et al., 2020; Richards-Thomas et al., 2020). In particular, the results of Butwin et al. (2020) indicate that the morphological characteristics of Icelandic dust particles equal or less than 20 µm in diameter tend to be similar to those of mineral dust from global source regions, while larger particles exhibited morphological properties of volcanic ash. In this study, since the particle size distribution effectively measured by GRIMM corresponds to around the PM20 fraction, we can assume that Icelandic dust has similar morphological properties to typical mineral dust. Despite the fact that mineral dust largely exhibits irregular shapes (Huang et al., 2021), our calculations are based on homogeneous equivalent spheres. However, previous studies have shown that not considering the asphericity of dust aerosols when converting Dop into Dg can lead to an underestimation of the coarse sizes (Formenti et al., 2021; Huang et al., 2021), as aspherical particles have a larger single-particle scattering cross-section Csca compared to the volume-equivalent spheres. This effect is greater as the imaginary index k of the dust particles increases (Huang et al., 2021). The uncertainty resulting from using the Mie theory was not estimated in this study.
Calculation of the effective diameter
The effective diameter (Deff) can be used as a measure of the aerosol size distribution as defined by Eq. (2) (Hansen, 1971):
Deff differs from the simple mean diameter, because the particle surface area is included as a weight factor. Since light scattering is proportional to the particle surface area, Deff is relevant for describing the scattering properties of size distributions (Hansen, 1971). In this study, Deff was calculated for the aerosol fine fractions (Dg ≤ 1 µm), Deff,fine, and the coarse fractions (Dg) > 1 µm), Deff,coarse, by varying the input parameters χ, n, and k in the examined ranges.
2.2.2 Spectral scattering coefficient measured by the nephelometer
The aerosol scattering coefficient βsca was measured by the nephelometer at 450, 550, and 700 nm. The nephelometer can only detect scattering angles (θ) from about 7 to 170∘ rather than from 0 to 180∘, causing a systematic underestimation of the total scattering known as angular truncation error (Anderson et al., 1996; Anderson and Ogren, 1998). The truncation correction Ctrunc for total scattering was estimated from Mie calculations using NSW-OPAs(Dg) as input as described in Appendix C.
The average of the Ctrunc(λ) values obtained for different NSW-OPAs(Dg) was used to correct the data. The Ctrunc decreased with increasing λ, as well as with the dust residence time in the chamber following the decrease in the contribution of the coarse fraction to the aerosol size distribution. Ctrunc(λ) was similar for different Icelandic dust samples and varied between 1.3–1.9. These results are comparable to the range of Ctrunc values (from 1.2 to 1.7) reported by Di Biagio et al. (2019). The uncertainty in Ctrunc(λ) was estimated from the relative standard deviation (RSD) of Ctrunc(λ) obtained for different NSW-OPAs(Dg) values. The uncertainty in Ctrunc(λ) was in the range 7 %–17 %.
The scattering coefficient at a given λ was corrected by multiplying βsca by Ctrunc. The uncertainty in βsca at 450, 550, and 700 nm was calculated using the error propagation method considering the photon counting and gas calibration uncertainty (5 %), the SD over 12 min intervals, and the uncertainty in Ctrunc. The uncertainty in βsca corrected for truncation varied between 9 % and 19 %. Once corrected for truncation, βsca was extrapolated at the Aethalometer operating λ (370, 470, 520, 590, 660, 880, and 950 nm) using the scattering Ångström exponent (åsca) which was obtained from the power-law fitting of βsca(λ) versus λ weighted by the inverse of the variance of βsca(λ). The uncertainty in βsca at 370, 470, 520, 590, 660, 880, and 950 nm was estimated as the quadratic combination of the average error in βsca corrected for truncation and the root-mean-square error (RMSE) of βsca predicted at 450, 550, and 700 nm. The uncertainty in βsca predicted was 11 %–18 %.
2.2.3 Spectral absorption coefficient measured by the Aethalometer
The aerosol absorption coefficient βabs was retrieved from the Aethalometer measurements at 370, 470, 520, 590, 660, 880, and 950 nm. The Aethalometer measures the spectral attenuation (ATTN) of light passing through an aerosol-laden quartz filter, which is then converted into the attenuation coefficient (e.g., Weingartner et al., 2003):
where I0 is the intensity of light passing through the blank portion of the filter, and I is the intensity of light passing through the loaded filter. From the measured ATTN, the attenuation coefficient (βATTN, m−1) is retrieved as
where A is the area of the aerosol collection spot (0.00005 ± 0.00001 m2), V is the sampling flow rate (0.002 m3 min−1), and is the variation of ATTN over 2 min time intervals (Δt) that corresponds to the time resolution of the Aethalometer.
The spectral coefficient βATTN contains the contributions of light absorption by the aerosol particles deposited on the filter and is affected by scattering by the filter material itself. The aerosol absorption coefficient βabs was obtained by correcting βATTN for measurements artifacts according to the correction scheme from Collaud Coen et al. (2010):
where α(λ)βsca(λ) is the scattering effect correction. βsca(λ) is the scattering coefficient weighted by the α(λ) parameter. This term represents the scattered radiation by the aerosol particles deposited on the filter and miscounted as attenuation. Cref(λ) is the multiple scattering effect correction, representing multiple scattering by the filter fibers. R(λ) is the loading effect correction, which accounts for the reduced Aethalometer response with time due to light-absorbing particles accumulating on the filter. The details of the calculations of the parameters in Eq. (5) are described in Appendix D.
The uncertainty in βabs(λ) corrected according to Eq. (5) was calculated using the error propagation method considering the uncertainty in α(λ), βsca(λ), Cref, and R(λ). The uncertainty in βabs(λ) as 2 min intervals varied between 25 %–78 %. Ultimately, βabs(λ) was averaged over 12 min intervals, and the final uncertainty was calculated as the quadratic combination of SD and the average systematic error over 12 min intervals. The uncertainty in βabs(λ) as 12 min intervals varied between 27 %–75 %.
2.3 Derivation of the aerosol optical properties
2.3.1 Calculation of the aerosol spectral single scattering albedo
The spectral coefficients βsca(λ) and βabs(λ) obtained from the nephelometer and Aethalometer measurements were used to calculate 12 min average values of the extinction coefficient βext(λ) (in Mm−1) at 370, 470, 520, 590, 660, 880, and 950 nm:
SSA(λ) was also calculated at a 12 min resolution:
The uncertainty in βext(λ) was 10 %–17 %, while the uncertainty in SSA(λ) varied between 15 %–25 %, which were estimated by the error propagation through Eqs. (6) and (7), respectively, considering the uncertainty in βsca(λ) and βabs(λ).
In addition, the experiment-averaged single scattering albedo SSAavg at 370, 470, 520, 590, 660, 880, and 950 nm was retrieved from the slope (mRMA) of the linear regression between βsca(λ) and βabs(λ) starting from 30 min after the dust injection peak to 2.5 h (Di Biagio et al., 2019; Moosmuller et al., 2012):
The linear fitting was performed using the reduced major-axis (RMA) regression, because both variables (x and y) come from measurements and are subject to errors (Ayers, 2001; Smith, 2009). Overall, a strong correlation between βsca(λ) and βabs(λ) was observed (R2 > 0.99). The uncertainty in SSAavg(λ) calculated considering the error in mRMA in Eq. (8) was ≤ 8 %.
2.3.2 Retrieval of the spectral complex refractive index
The spectral coefficients βabs(λ) and βsca(λ) were computed using the SW-OPA geometrical size distributions NSW-OPAs(Dg) for the 735 different combinations of the input parameters (X, n, and k), and they are hereinafter referred to as βabs,model(λ) and βsca,model(λ), respectively (see Appendix C). Subsequently, the complex refractive index at 370, 470, 520, 590, 660, 880, and 950 nm was determined through the comparison between βabs,model(λ) and βsca,model(λ) and those measured by the nephelometer and Aethalometer, which are referred to as βabs,meas(λ) and βsca,meas(λ), at individual time points throughout the time series. For each βabs,model(λ) and βsca,model(λ) scenario, we estimated the model error as the percentage difference (% diff), respectively, with βabs,meas(λ) and βsca,meas(λ). To account for the uncertainty in βabs,meas(λ) and βsca,meas(λ), we used βabs,meas(λ) ± 1 SD and βsca,meas(λ) ± 1 SD as the upper and lower limits of the measurements. We selected βabs,model(λ) and βsca,model(λ) scenarios with the lowest model error corresponding to the 0.1–0.5 quantile of % diff. Subsequently, the results for βabs,meas(λ) ± 1 SD and βsca,meas(λ) ± 1 SD (consisting of three datasets for each spectral optical coefficient) were examined, and only the βabs,model(λ) and βsca,model(λ) scenarios common to all six datasets were kept. The indices k(λ) and n(λ) were retrieved from the selected scenarios. Since the comparison between calculation and measurements resulted in multiple solutions for k(λ) and n(λ), we calculated the mean of the k solutions and of the n solutions.
In addition, the experiment-averaged spectral complex refractive index was determined based on the analysis of the linear correlation between βabs,meas(λ) vs. βabs,model(λ) and βsca,meas(λ) vs. βsca,model(λ) scenarios starting from 30 min after the dust injection peak to 2.5 h. To retrieve the experiment-averaged real index navg(λ) and imaginary index kavg(λ), we updated the method applied to determine k(λ) and n(λ) at a 12 min resolution, as described in the preceding paragraph. For each βabs,model(λ) and βsca,model(λ) scenarios, we assumed that the input parameters χ, k(λ) and n(λ) are constant throughout the experimental run. From the analysis of the linear correlation between βabs,meas(λ) ± 1 SD and βabs,model(λ) scenarios and between βsca,meas(λ) ± 1 SD and βsca,model(λ) scenarios, we selected only the model estimates which showed a high correlation with observations (R2 > 0.70). The modeled and measured spectral coefficients were then compared based on the RMSE instead of using the % diff at individual time points. The uncertainty in kavg(λ) and navg(λ) was estimated from the RSD of the k and n solutions. The uncertainty in kavg(λ) was up to 99 %, while the uncertainty in navg(λ) was < 2 %.
These calculations were repeated in Test 1 and Test 2, i.e., the sensitivity simulations to account for the uncertainty resulting from the size distribution measurements which were used to correct the spectral coefficients measured by the Aethalometer and nephelometer, as well as to calculate the βabs,model(λ) and βsca,model(λ) scenarios.
3.1 Aerosol size distribution and effective diameter
Figure 2 shows examples of geometrical size distributions that were obtained using various dynamic shape factors χ and complex refractive indices for the dust particles. For spherical particles (χ = 1 and Dm = Dg), the Dg range measured by the SMPS was from 0.019 to 0.87 µm. For non-spherical particles (χ > 1), Dg decreased with increasing χ as defined by Eq. (A1). After the conversion of Dm to Dg, the Dg range of the SMPS was around 0.015–0.58 µm for χ = 1.6, 0.015–0.56 µm for χ = 1.7, 0.014–0.53 µm for χ = 1.8, 0.014–0.51 µm for χ = 1.9, and 0.013–0.49 µm for χ = 2.0.
The correction factors used to convert Dop into Dg had a considerable impact on Dg > 0.6 µm. Dg increased with k, while the variability of n mainly affected Dg at around 1 µm. The minimum Dg varied around 0.24–0.25 µm. For k ≤ 0.003, the maximum Dg sharply increased with k from 31.5–32.5 to 85.6–90.4 µm. For k > 0.003, the maximum Dg showed only a small variation, reaching up to around 94 µm (Fig. S3).
The overlapping interval between the SMPS and GRIMM data decreased as χ increased. The GRIMM size distributions tend to spread out between 0.6–2 µm (Fig. 2), consequently reducing the smoothness of the fitted size distributions within this size range, which is likely due to the larger uncertainty of the correction factors at these Dg values (Formenti et al., 2021). After correcting the data for the loss along the instrument sampling lines, the size distribution of the particles suspended in CESAM was in the Dg range up to 20 µm, while the size distribution of the particles sampled by the SW-OPAs was in the Dg range up to 9 µm.
The average of the Deff values derived from different χ–n–k combinations was reported as the Deff of the Icelandic dust samples, with the RSD as the uncertainty in Deff. The effective diameter of the coarse fractions, Deff,coarse, showed a strong positive correlation with the input parameter k (R2 = 0.6–0.8), while the correlation between Deff,coarse and χ or n was low (R2 < 0.1). The correlation between the effective diameter of the fine fractions, Deff,fine, and all input parameters was low. Figure S4 shows an example of the correlation between Deff determined from the SW-OPA size distributions and χ, n, and k.
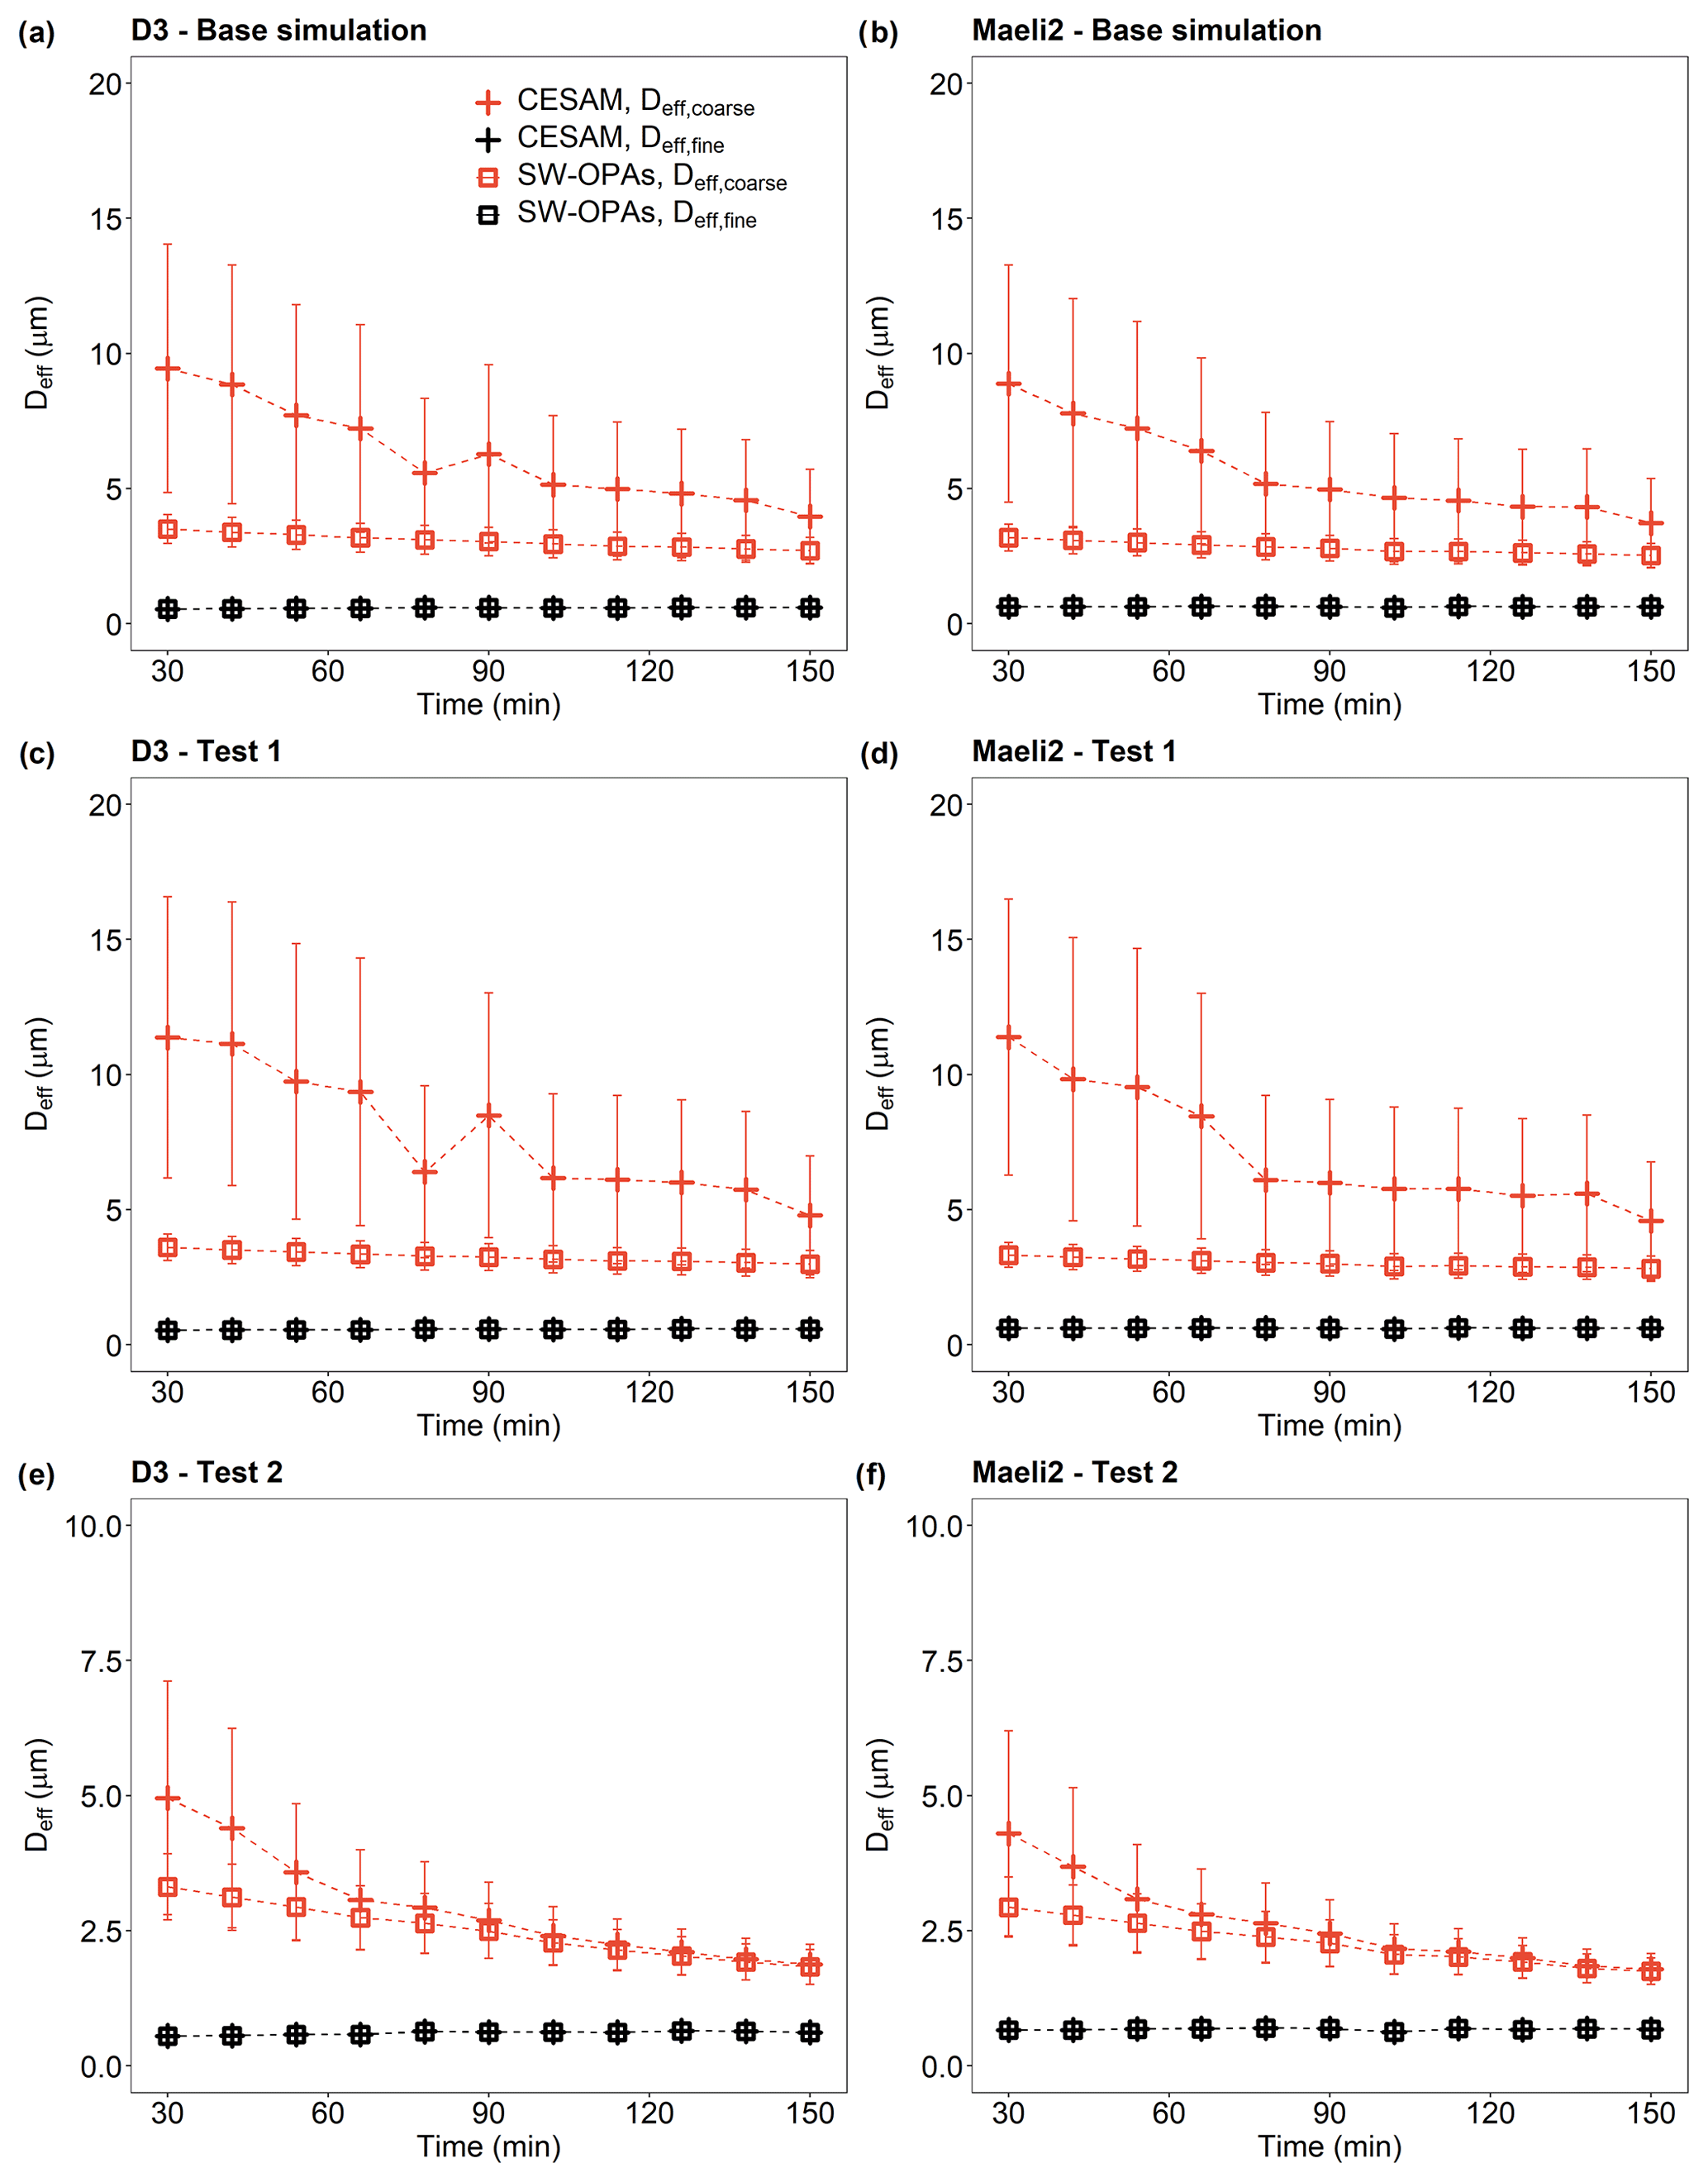
Figure 3Effective diameters Deff of dust particles sampled by the SW-OPAs and in CESAM from 30 min after the injection peak to 2.5 h. (a, b) Base simulation; (c, d) Test 1; (e, f) Test 2. Deff was calculated for particles > 1 µm (Deff,coarse) and ≤ 1 µm (Deff,fine). Data were reported as 12 min averages. In Test 1, corrections and calculations were performed using the SMPS and GRIMM data plus 1 SD uncertainty. In Test 2, we used the SMPS and GRIMM data minus 1 SD uncertainty (see Sect. 2.2.1 in the main text for details). Sample IDs: D3 and Maeli2.
The parameter Deff was used as an indication of the stability of the size distribution in the chamber. Figure 3 shows an example of how Deff changed over time. The Deff,coarse value decreased with time due to the rapid deposition of the largest particles in the chamber. In Icelandic dust samples, Deff,coarse calculated using the SW-OPA size distributions varied from ∼ 3.1–3.5 µm around 30 min after the injection peak to 2.5–2.7 µm around 2.5 h after the injection peak. For the particles suspended in CESAM, Deff,coarse varied from 8.4–11 µm (30 min after the injection peak) to 3.7–4.4 µm (2.5 h after the injection peak). The Deff,fine remained relatively constant over the duration of the experiments, varying between 0.5 and 0.7 µm in different samples. The uncertainty in Deff,coarse was < 14 %–19 % for the SW-OPA size distributions and 44 %–56 % for the particles suspended in CESAM, while the uncertainty in Deff,fine was less than 3 %. The Deff values for all the samples are shown in Fig. 3, as well as Figs. S5–S9.
The Deff results from the sensitivity studies (Tests 1–2) to account for the error in the SMPS and GRIMM measurements were consistent (within the uncertainties) with the results from the base simulation (Figs. 3 and S5–S9). The difference between the Deff results from the sensitivity studies and Deff from the base simulation was not significant as it was less than 3 times the square root of the sum of their squared uncertainties. For the SW-OPA size distributions, Deff,coarse decreased from ∼ 3.3–3.6 µm (30 min after the injection peak) to 2.8–3.0 µm (2.5 h after the injection peak) in Test 1 and from 2.8–3.3 (30 min after the injection peak) to 1.4–1.9 (2.5 h after the injection peak) in Test 2. For the particles suspended in CESAM, Deff,coarse decreased from ∼ 10–12 µm (30 min after the injection peak) to 4.6–5.7 µm (2.5 h after the injection peak) in Test 1 and from 3.3–5.8 (30 min after the injection peak) to 1.6–2.0 (2.5 h after the injection peak) in Test 2. The uncertainty in Deff,coarse was 12 %–17 % in Test 1 and 9 %–22 % in Test 2 for the SW-OPA size distributions and 41 %–55 % in Test 1 and 9 %–50 % in Test 2 for the particles suspended in CESAM. The results of Deff,fine were not considerably affected by the sensitivity studies.
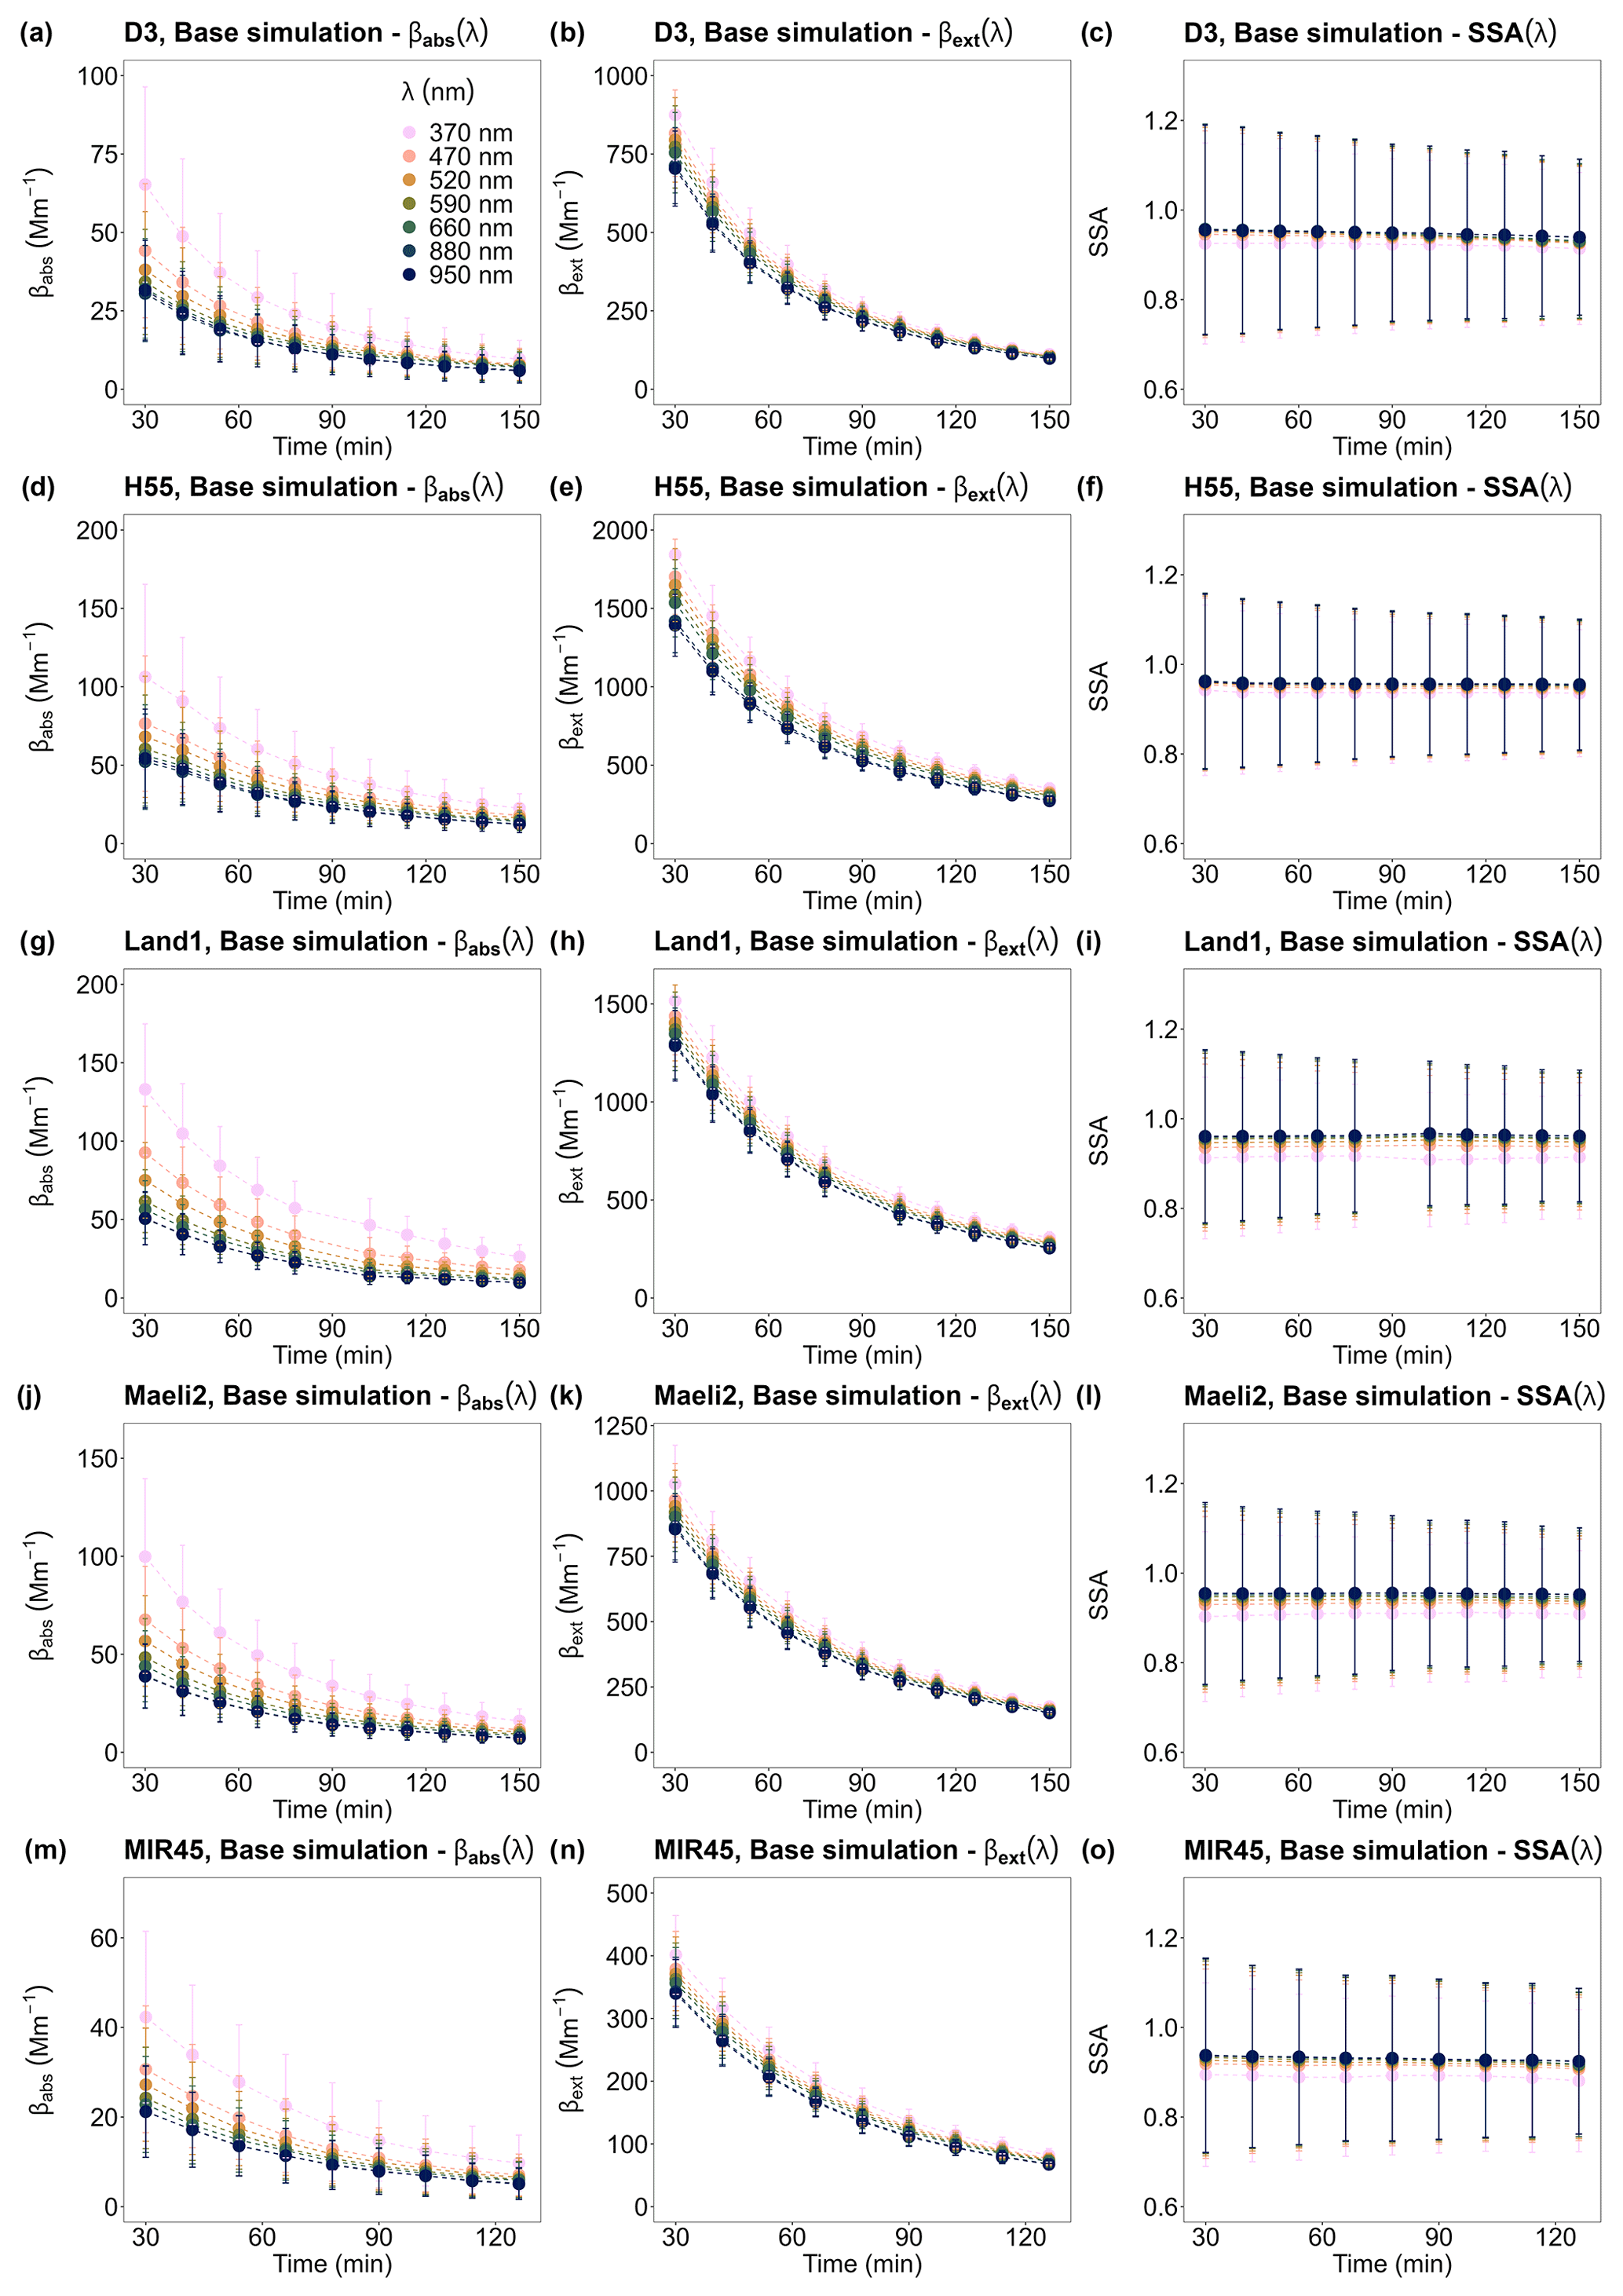
Figure 4Extinction coefficient βext(λ), absorption coefficient βabs(λ), and single scattering albedo SSA(λ) of Icelandic dust at λ = 370, 470, 520, 590, 660, 880, and 950 nm from 30 min after the injection peak to 2.5 h. The reported results as 12 min averages refer to the base simulation.
3.2 Spectral extinction and absorption coefficients, single scattering albedo, and complex refractive index
Figure 4 presents the temporal variation of βext(λ), βabs(λ), and SSA(λ) of the Icelandic dust samples, as derived from the base simulation. The coefficients βext(λ) and βabs(λ) decreased with λ, with the largest variation observed for βabs(λ) between 370 and 590 nm. On the other hand, SSA(λ) increased marginally with λ, within the error bars. Both βext(λ) and βabs(λ) decreased with time at all values of λ, while SSA(λ) was relatively constant. The results of the sensitivity studies for βext(λ), βabs(λ), and SSA(λ) were in agreement with the results of the base simulation within their respective uncertainties (Figs. S10–S14).
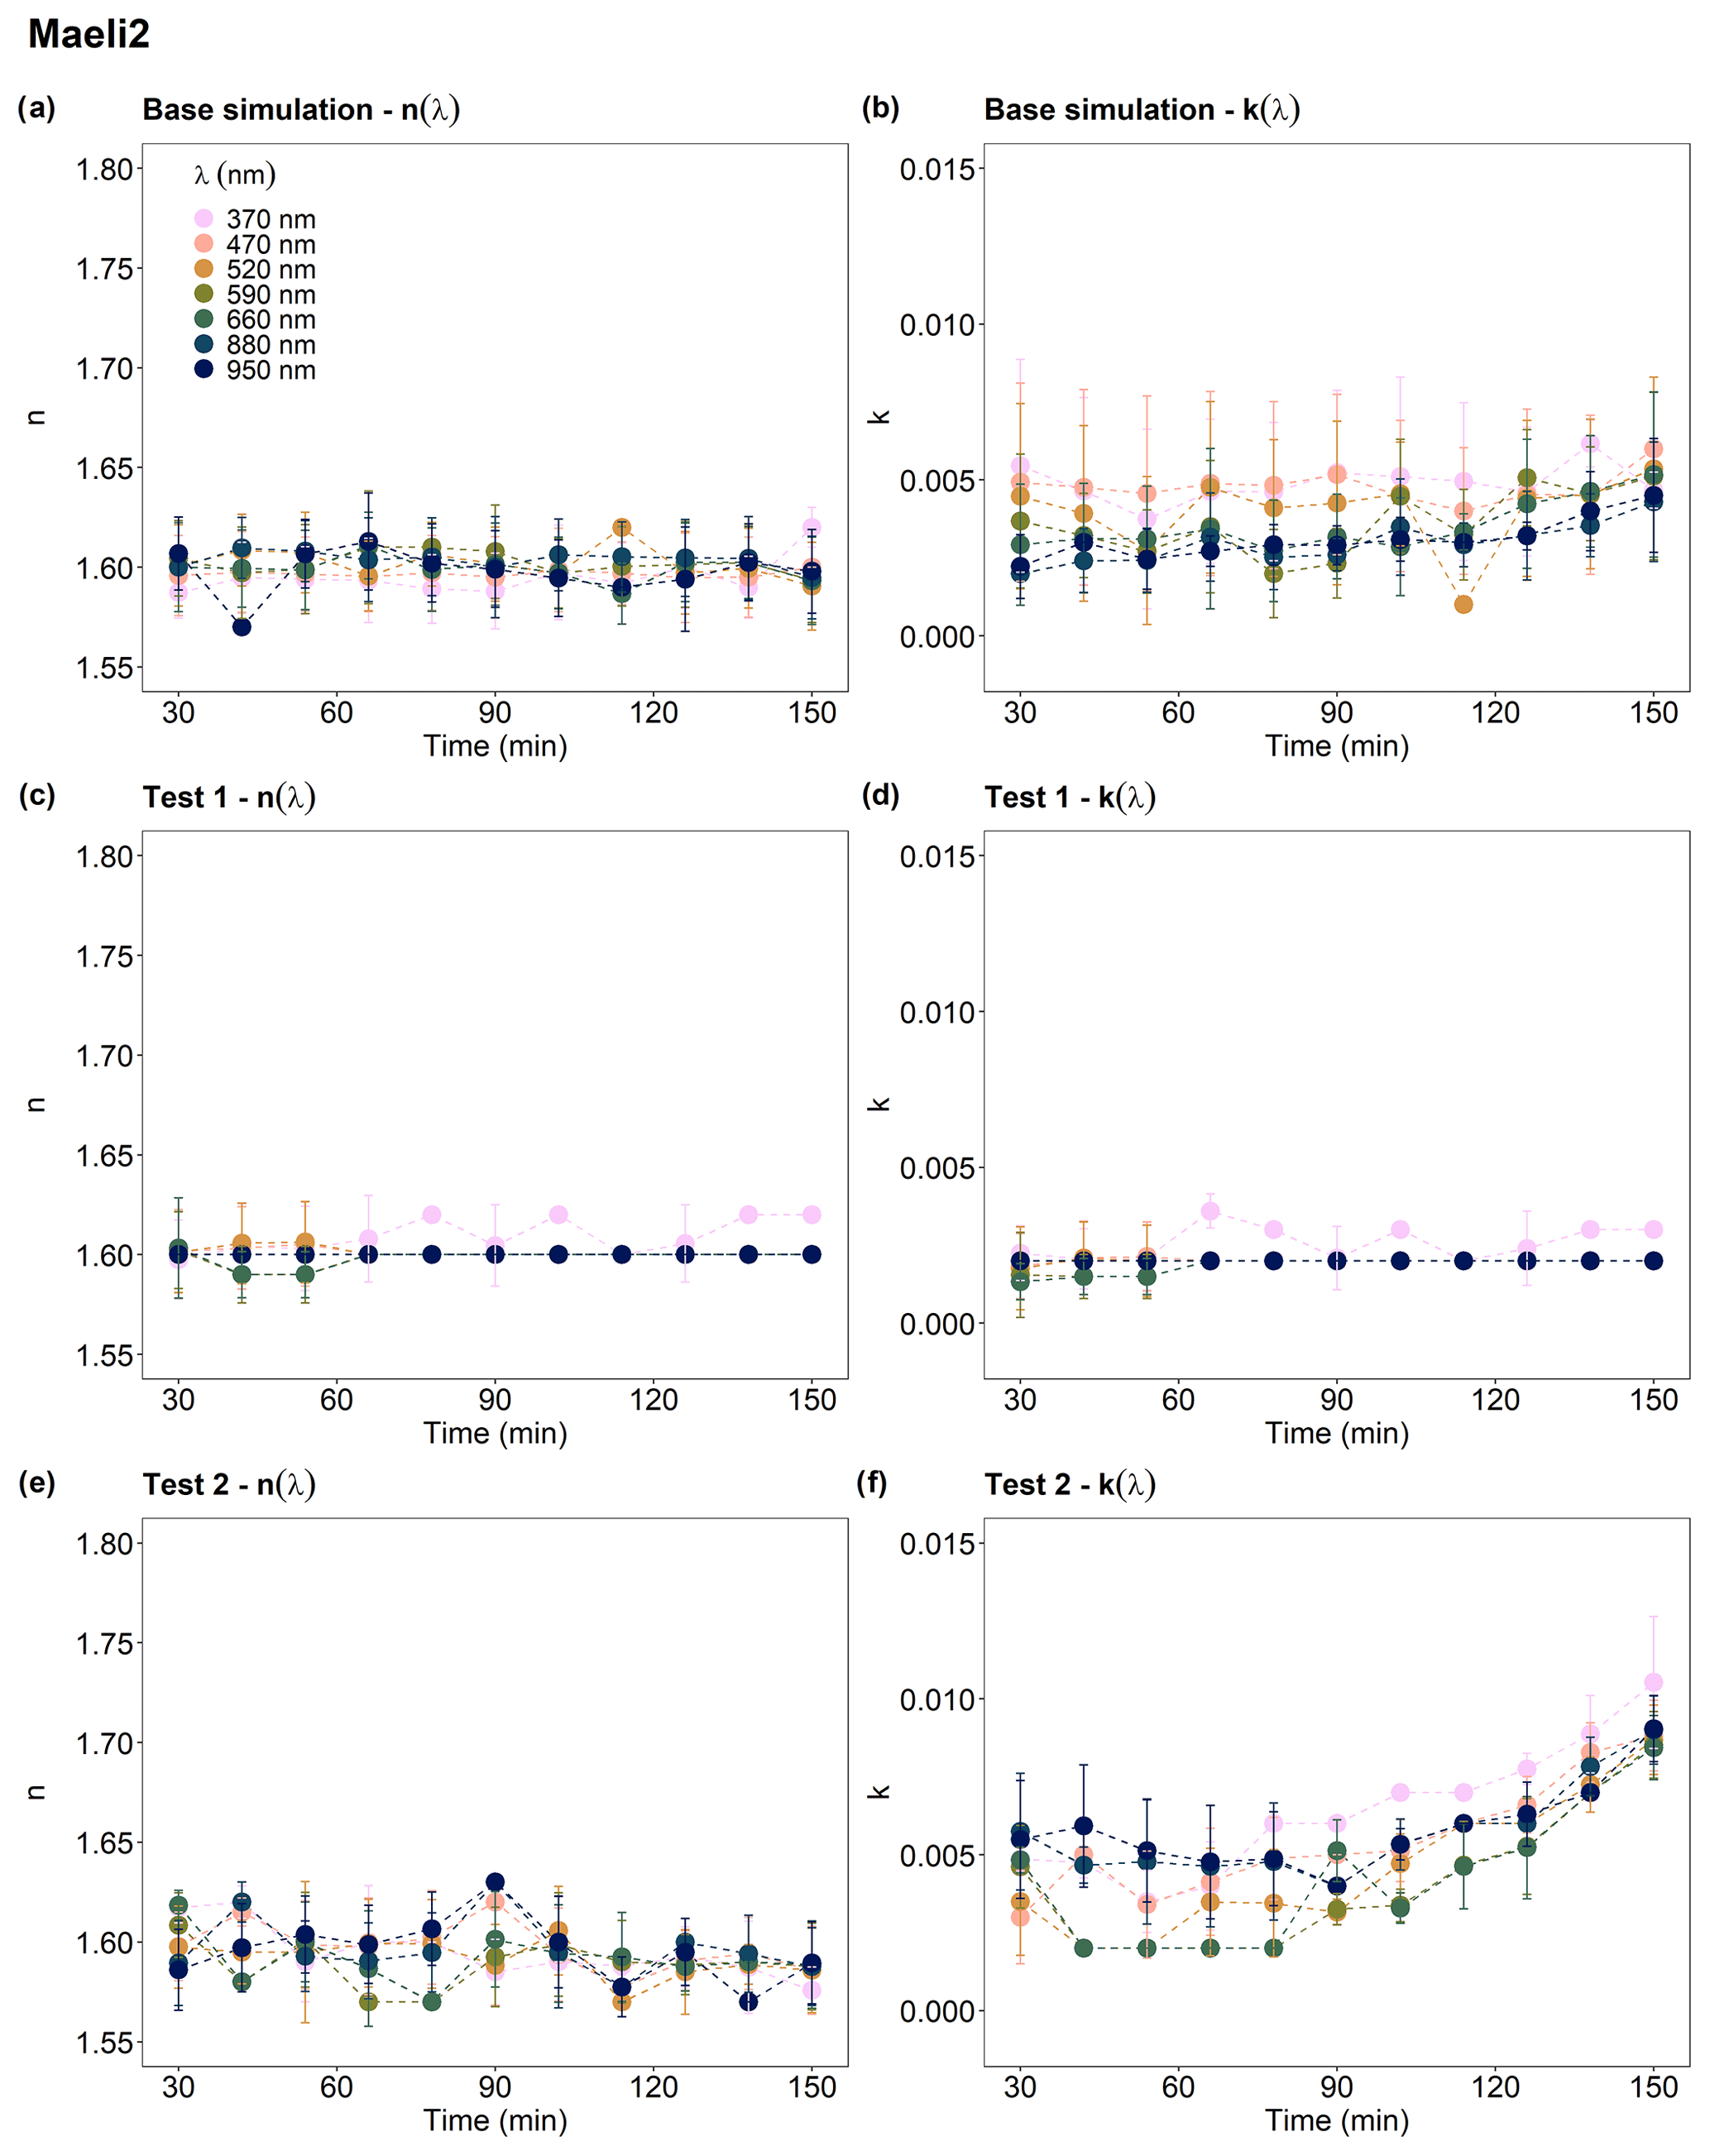
Figure 5Real index n(λ) and imaginary index k(λ) at λ = 370, 470, 520, 590, 660, 880, and 950 nm from 30 min after the injection peak to 2.5 h. (a, b) Base simulation; (c, d) Test 1; (e, f) Test 2. In Test 1, corrections and calculations were performed using the SMPS and GRIMM data plus 1 SD uncertainty. In Test 2, we used the SMPS and GRIMM data minus 1 SD uncertainty (see Sect. 2.2.1 in the main text for details). Sample ID: Maeli2.
Figure 5 provides an example of the temporal variation of n(λ) and k(λ) in two Icelandic dust samples, including the results from both the base simulation and the sensitivity studies. The parameter n(λ) showed no dependence on λ or time and varied within the range of examined n values (from 1.57 to 1.63 by 0.01 steps) with an uncertainty of < 3 % in the base simulation, Test 1, and Test 2 (Figs. S15–S19). For the parameter k(λ), the data at 12 min resolution were too noisy to identify a clear relationship with time or λ (Figs. S15–S19). In Test 1, k(λ) was almost constant with time and λ. In Test 2, k did not show a clear dependence on λ. For sample MIR45, k(λ) exhibited an increasing trend over time. For D3 and Maeli2, k(λ) increased after around 1.5 h from the dust injection peak. For H55 and Land1, k(λ) did not show a temporal trend. The uncertainty in k(λ) at 12 min resolution varied up to 99 % in the base simulation, 198 % in Test 1, and 79 % in Test 2. We compared k(λ) and Deff,coarse to determine the impact of the reduction in the particle coarse fraction over time on the complex refractive index. However, a clear correlation between Deff,coarse and k(λ) was not observed. The k(λ) results at a 12 min resolution were noisy, making it challenging to establish a meaningful relationship between the two parameters, as the slopes of the regression lines between Deff,coarse and k(λ) were close to zero.
Table 1Experiment-averaged single scattering albedo SSAavg(λ) ± estimated uncertainty at λ = 370, 470, 520, 590, 660, 880, and 950 nm of Icelandic dust for the base simulation. SSAavg(λ) results from the base simulation are consistent with the results from Test 1 and Test 2 (see Table S2).
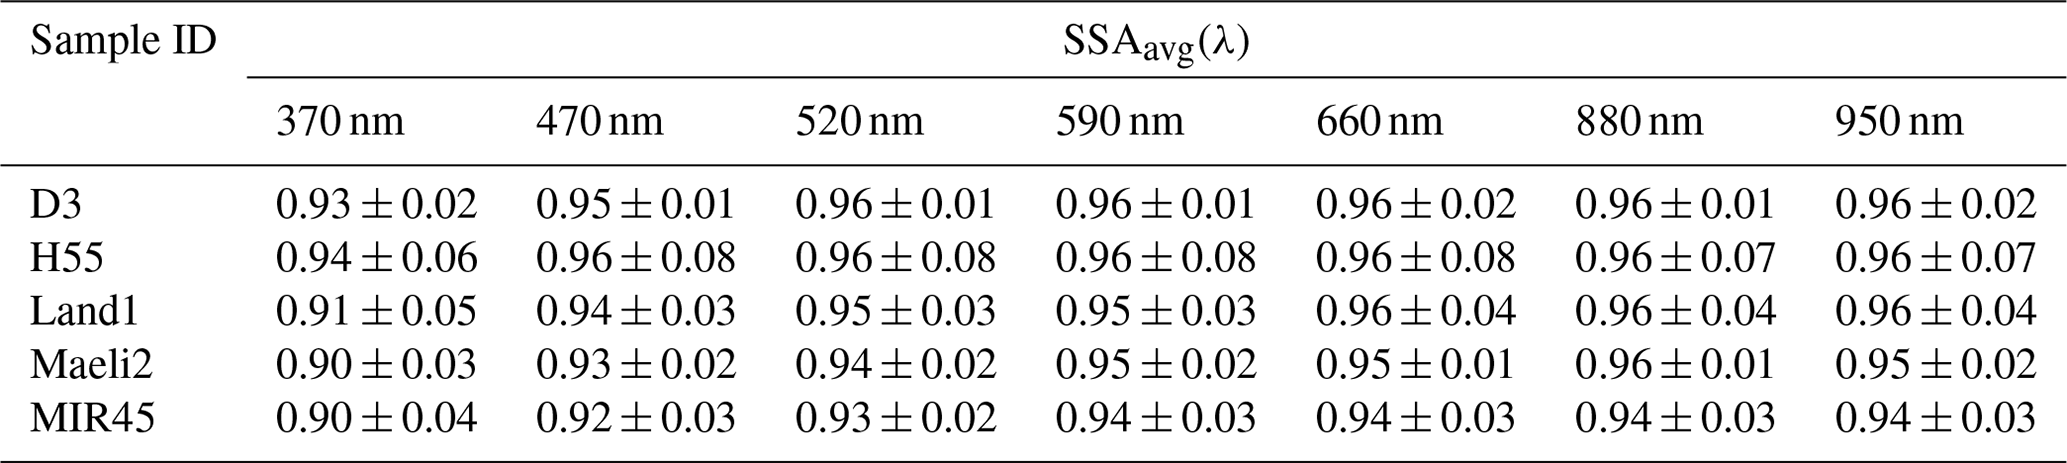
The experiment-averaged single scattering albedo SSAavg increased with λ from 370 to 590 nm, though with some uncertainty, but remained relatively constant between 590 and 950 nm (Fig. 6). SSAavg(λ) varied from 0.93 at 370 nm to 0.96 at 950 nm for sample D3, from 0.94 to 0.96 for H55, from 0.91 to 0.96 for Land 1, from 0.90 to 0.95 for Maeli2, and from 0.90 to 0.94 for MIR45 (Table 1). The uncertainty in SSAavg(λ) was ≤ 8 %. The SSAavg(λ) results from the sensitivity studies were within the uncertainty for the base simulation (Table S2).
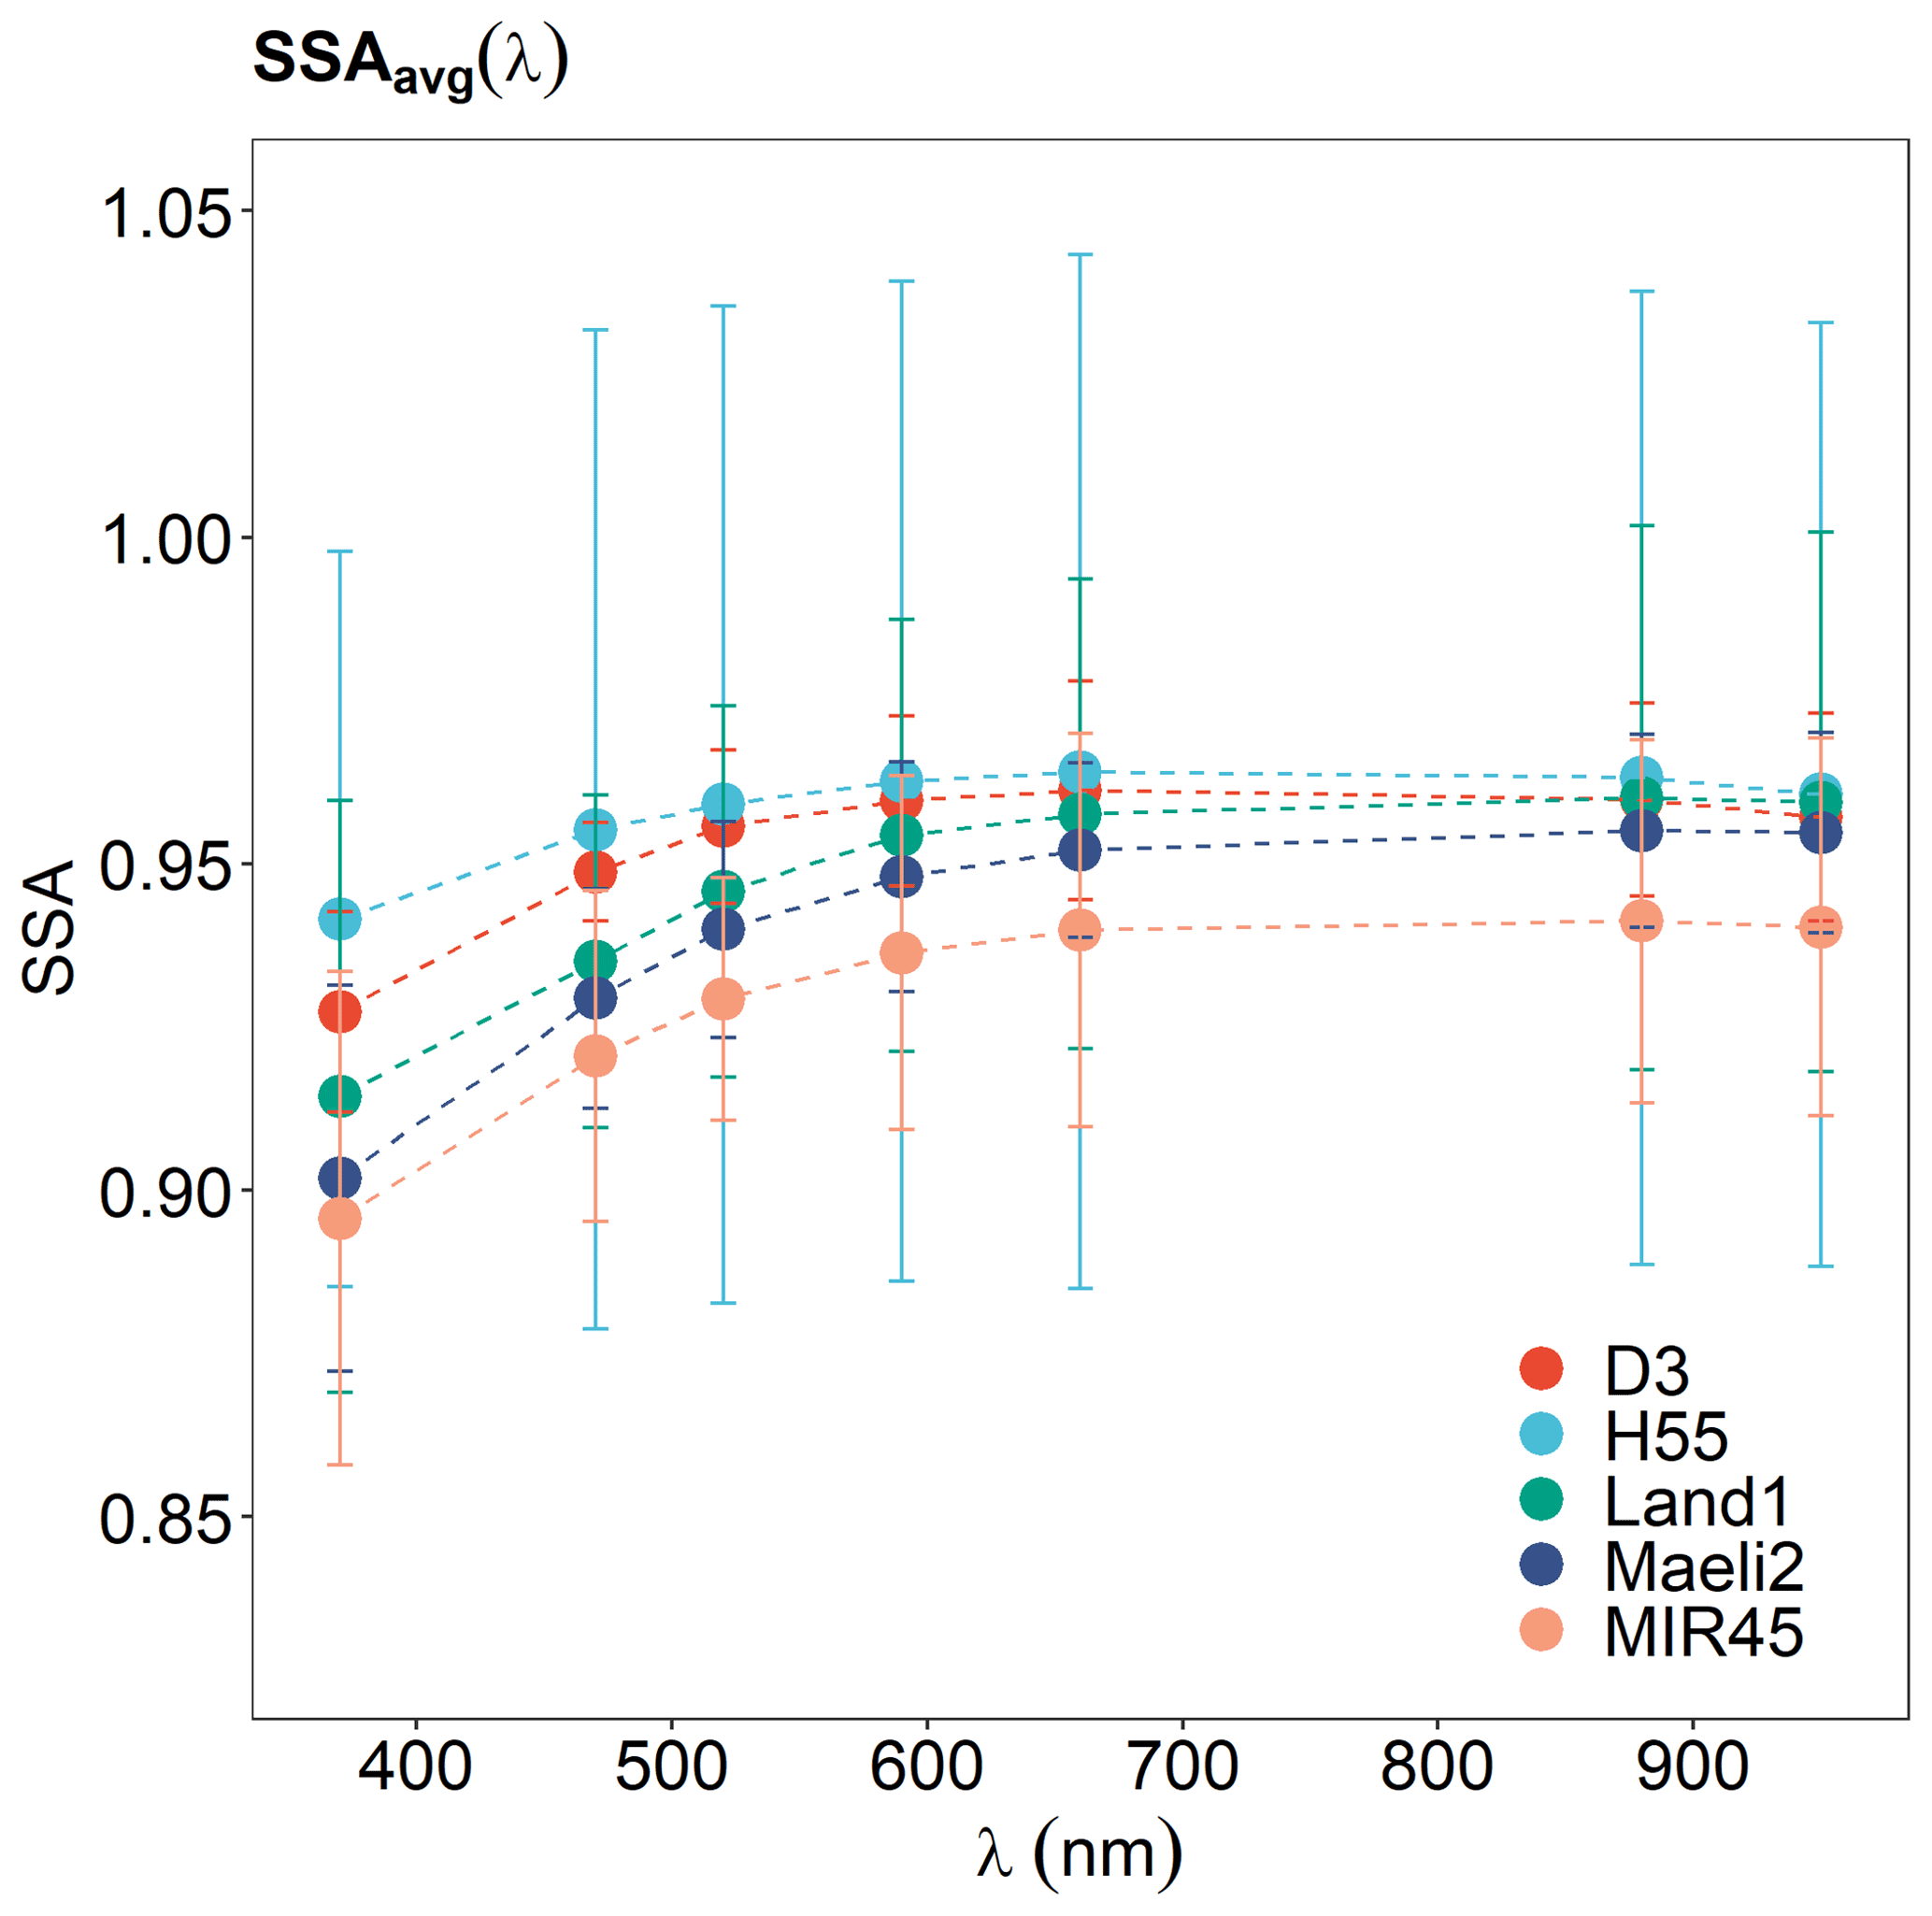
Figure 6Experiment-averaged single scattering albedo SSAavg(λ) at λ = 370, 470, 520, 590, 660, 880, and 950 nm of Icelandic dust samples for the base simulation (Table 1). SSAavg(λ) results from the base simulation are consistent with the results from Test 1 and Test 2 (see Table S2).
The experiment-averaged imaginary index, kavg(λ), decreased with λ from 0.006 at 370 nm to 0.002 at 950 nm for sample D3; from 0.005 to 0.003 for H55, Land1, and Maeli2; and from 0.005 to 0.003 for MIR45, as determined from the base simulation (Table S3). kavg(λ) was sensitive to the particle size distribution. The variation of kavg with respect to λ was less evident in Test 1 compared to the base simulation (Table S3). The kavg(λ) values varied between 0.003 and 0.001 for H55 and Land1, while they remained relatively constant at around 0.002 for Maeli2 and MIR45. For sample D3, kavg(λ) was 0.002 at 370 nm and around 0.001 for all other λ values. In Test 2, kavg increased with λ from 0.002 at 370 nm to 0.007 at 950 nm for sample H55. For all the other Icelandic dust samples, the relationship between kavg and λ was not monotonic, and kavg varied in the range 0.002–0.007 for D3, 0.003–0.006 for Land1, 0.002–0.005 for Maeli2, and 0.005–0.007 for MIR45. Overall, kavg(λ) estimates of Test 1 were lower than those of the base simulation and Test 2 (Table S3). The uncertainty in kavg(λ) was generally < 85 % in the base simulation and Test 1, and it was < 70 % in Test 2.
The experiment-averaged real index, navg(λ), showed no trend with λ, and navg(λ) varied in the range 1.59–1.62 in the base simulation, 1.58–1.61 in Test 1, and 1.57–1.63 in Test 2 (Table S4). Overall, the uncertainty in navg(λ) was < 2 %.
Table 2Experiment-averaged imaginary index kavg(λ) ± estimated uncertainty at λ = 370, 470, 520, 590, 660, 880, and 950 nm of Icelandic dust. kavg(λ) data are the mean of the results of the base simulation and Test 1 in Table S3.
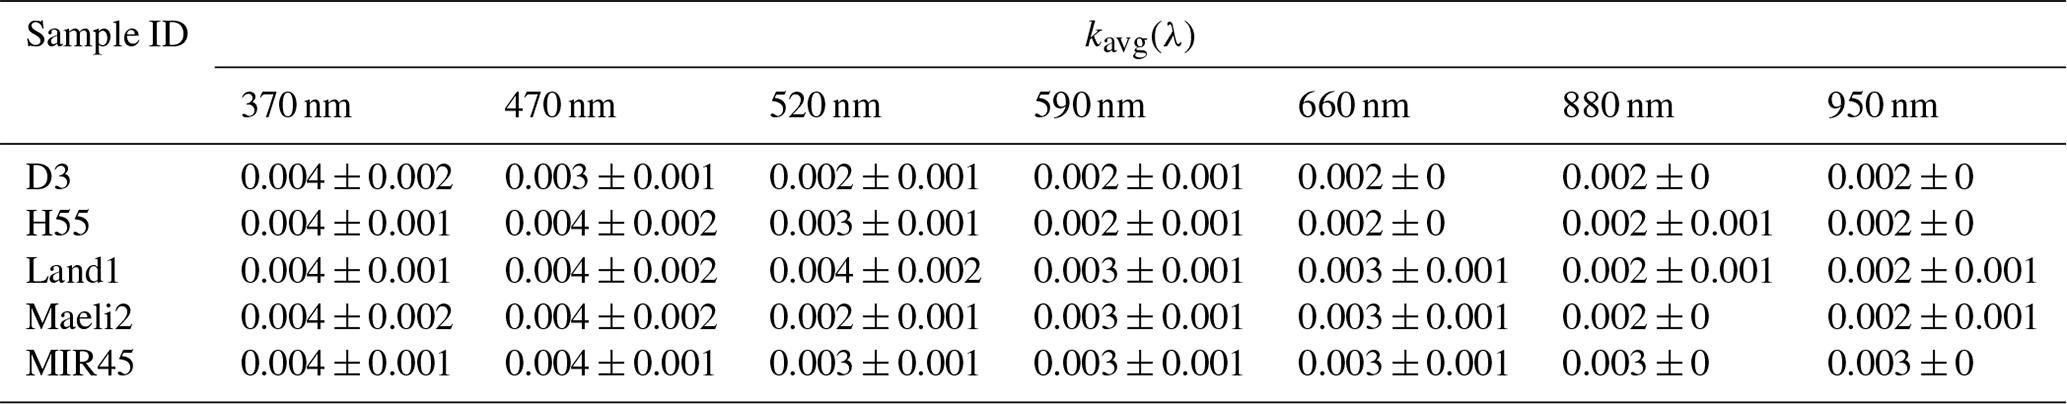
Table 3Experiment-averaged real index navg(λ) ± estimated uncertainty at λ = 370, 470, 520, 590, 660, 880, and 950 nm of Icelandic dust. navg(λ) data are the mean of the results of the base simulation and Test 1 in Table S4.
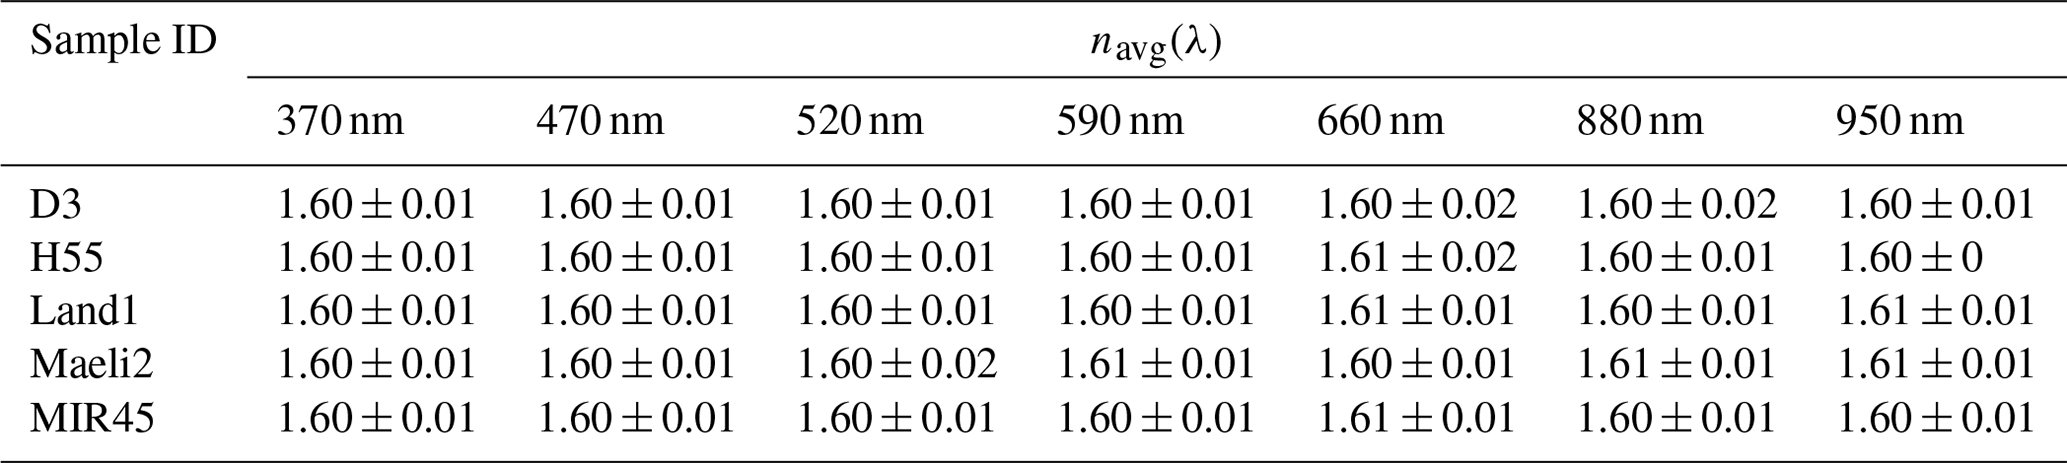
Table S5 reports a summary of the comparison between SSAavg(λ) obtained from the measured and computed spectral coefficients for the base simulation, Test 1, and Test 2. Although the RMSE values were generally low, the correlation between the measured and modeled SSAavg(λ) tends to be higher in the base simulation and Test 1 compared to Test 2 (Table S5). Di Biagio et al. (2019) chose to average the k values from all three scenarios. Here the increase of kavg with λ in Test 2 is hard to explain, suggesting that Test 2 results are not realistic. Based on this, we chose to combine the results from the base simulation and Test 1 to obtain a single set of values for k(λ) (Table 2) and n(λ) (Table 3). While the results obtained from averaging the baseline simulation and Test 1 may have a bias towards high particle number concentration, no significant difference was observed when the results of Test 2 were also included for both parameters n and k. Although the mean values of k tended to be higher when Test 2 was included in the average, particularly in the wavelength range of 660–950 nm, the difference between the average with Test 2 included and the average without Test 2 is less than 3 times the square root of the sum of their squared uncertainties. For these reasons, it was decided to use the more conservative approach.
The Icelandic dust samples examined in this study showed similar spectral optical properties. The spectral single scattering albedo SSA(λ) (Table 1) and imaginary index k(λ) (Table 2) showed opposite trends, as expected. SSA(λ) increased from 0.90–0.94 at 370 nm to 0.94–0.96 at 950 nm in different samples, while k(λ) decreased slightly from 0.004 at 370 nm to 0.002–0.003 at 950 nm. The real index n(λ) was rather constant with λ at 1.60–1.61 (Table 3).
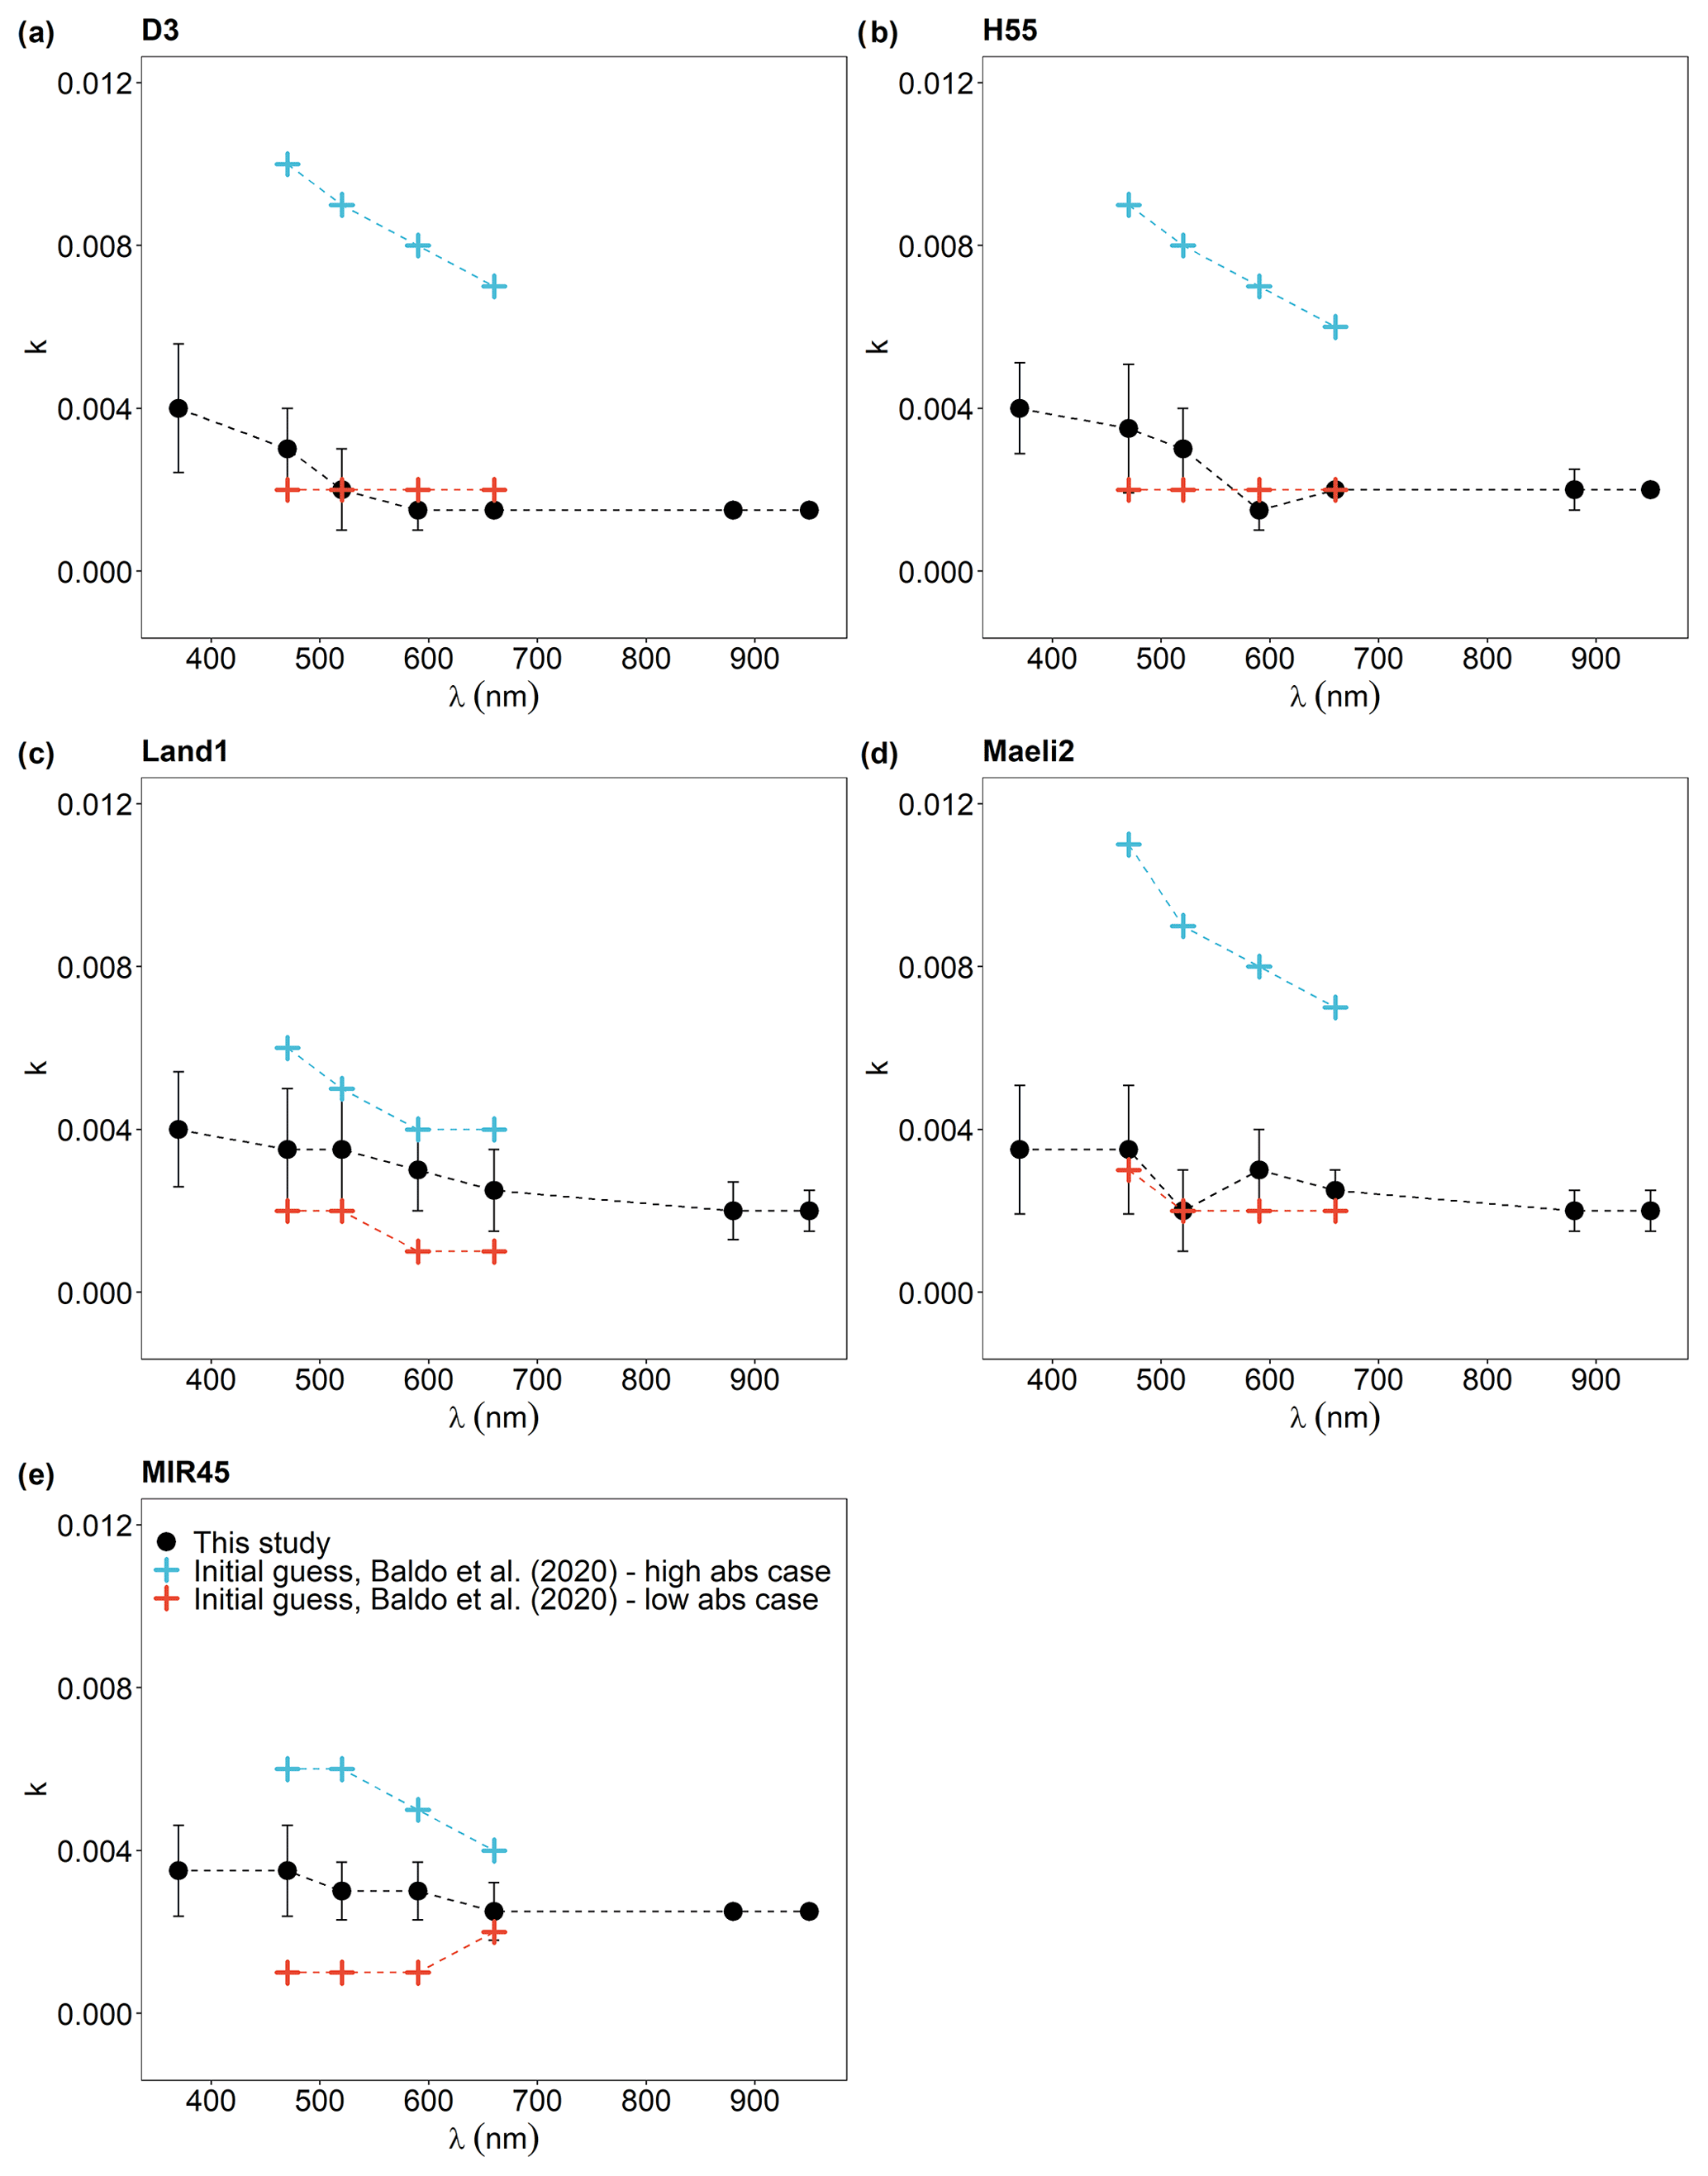
Figure 7Comparison between the experiment-averaged imaginary index kavg(λ) at λ = 370, 470, 520, 590, 660, 880, and 950 nm of Icelandic dust (Table 2) and the initial estimates by Baldo et al. (2020) based on the mineralogical composition (low and high absorption cases).
4.1 Spectral complex refractive index and single scattering albedo of Icelandic dust comparison with literature data, volcanic ash, and low-latitude dust
The complex refractive index of Icelandic dust is consistent with the initial estimate of Baldo et al. (2020) based on the volume-averaged mineralogical composition and reference complex refractive indices of individual minerals. In Baldo et al. (2020), n(λ) ranged from 1.57 to 1.63 between 470 and 660 nm, while k(λ) was sensitive to the reference refractive indices of magnetite applied in the calculations and varied up to 1 order of magnitude in different absorption scenarios. In this study, n(λ) (Table 3) is comparable to the average value of the initial estimate, and k(λ) (Table 2 and Fig. 7) is within or at the lower end of the range of k(λ) values estimated by Baldo et al. (2020).
The value of k at 660 nm of the Icelandic dust sample from the Mýrdalssandur hotspot (MIR45, southern Iceland) is lower than that reported in the literature by Zubko et al. (2019). In Zubko et al. (2019), the complex refractive index of Icelandic dust was retrieved based on the measurements of the angular scattered-light intensity and degree of linear polarization of aerosol particles generated from volcanic sand from the Mýrdalssandur area. They estimated a value of 1.60 for n and 0.01 for k at 647 nm (Zubko et al., 2019); the latter is around 3 times higher than the value observed in this study at 660 nm (Table 2).
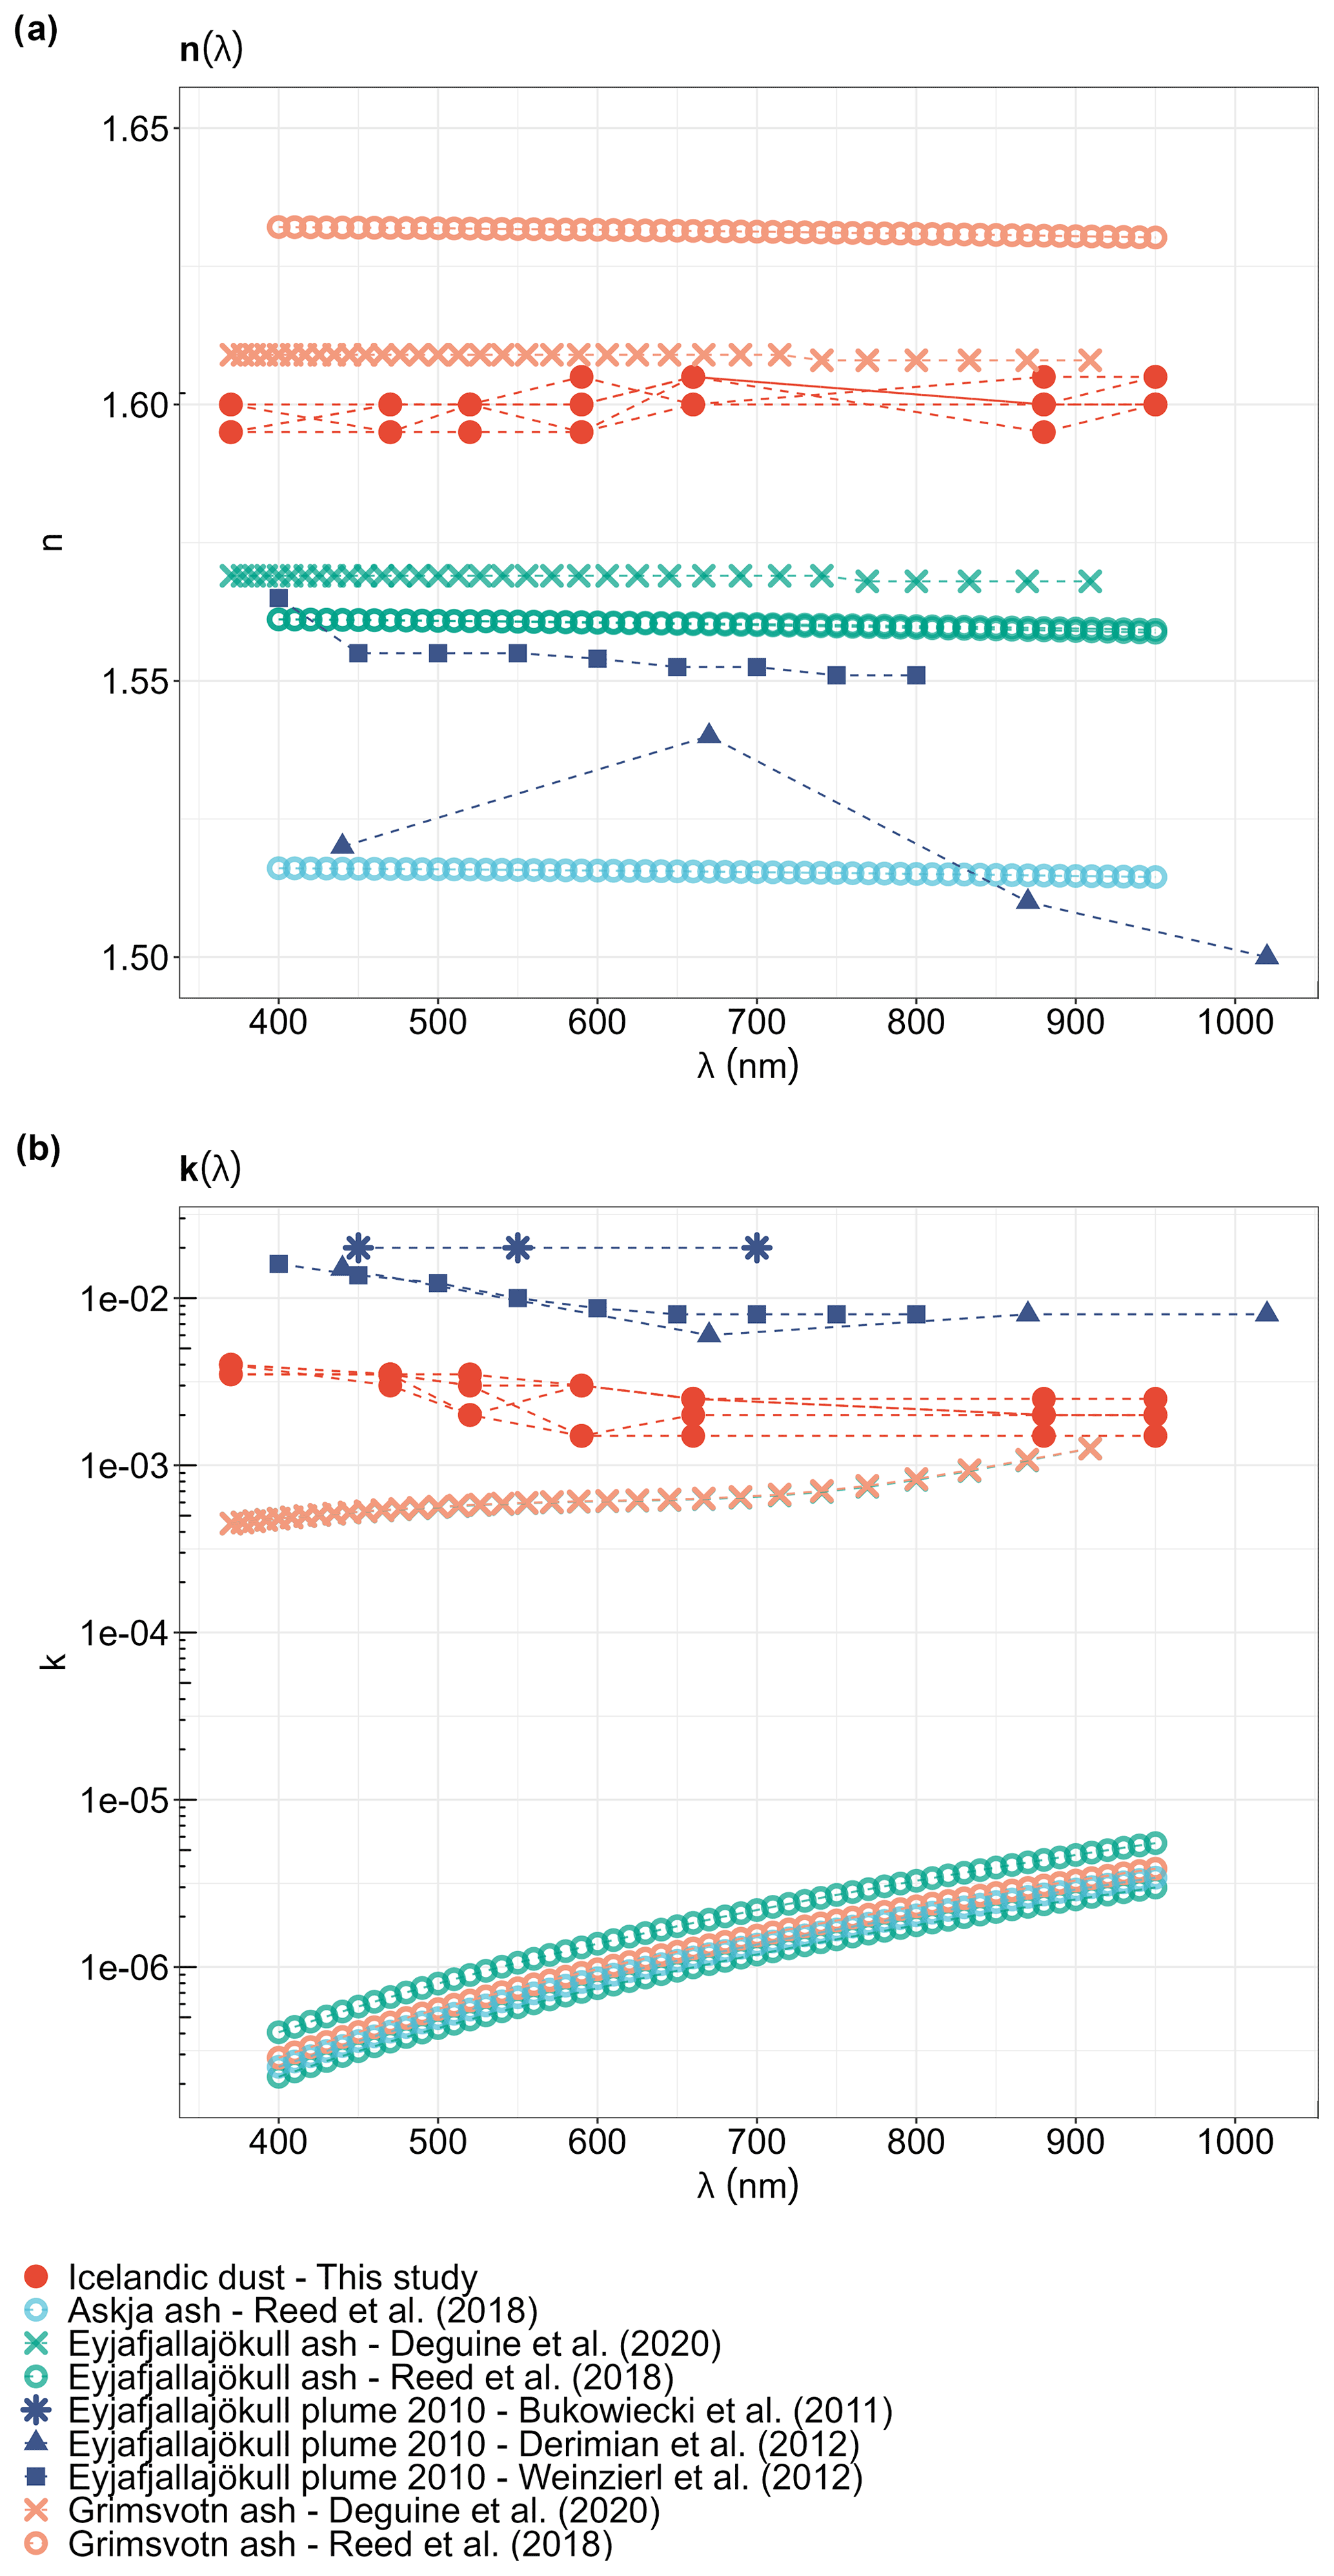
Figure 8Comparison between the experiment-averaged (a) real index navg(λ) and (b) imaginary index kavg(λ) at λ = 370, 470, 520, 590, 660, 880, and 950 nm of Icelandic dust (Tables 2 and 3) and Icelandic volcanic ash (Bukowiecki et al., 2011; Deguine et al., 2020; Derimian et al., 2012; Reed et al., 2018; Weinzierl et al., 2012). Note that n(λ) and k(λ) data of Deguine et al. (2020) and Reed et al. (2018) were downloaded from http://eodg.atm.ox.ac.uk/ (last access: 5 January 2023). Bukowiecki et al. (2011) reported an average k value of 0.02 between 450–700 nm, while n ranged from 1.60 to 1.80 (not shown).
Icelandic dust shares a similar origin with volcanic ash; however, it is difficult to assess the complex refractive index of Icelandic dust based on what has been observed for Icelandic volcanic ash. This is because the literature reports a wide range of values for k and n in the SW part of the spectrum for Icelandic ash (Fig. 8). The values of n(λ) for Icelandic ash vary from 1.50 to 1.65 (Bukowiecki et al., 2011; Deguine et al., 2020; Derimian et al., 2012; Reed et al., 2018; Weinzierl et al., 2012). Laboratory studies conducted on resuspended ash samples found that k(λ) of Icelandic ash remains below 0.001 in the UV–visible part of the spectrum and tends to increase towards the near-IR region (Deguine et al., 2020; Reed et al., 2018). The k(λ) values resulting from direct measurements of the Eyjafjallajökull plume in 2010 (e.g., Bukowiecki et al., 2011; Derimian et al., 2012; Weinzierl et al., 2012) are considerably different from the results of laboratory measurements (Deguine et al., 2020; Reed et al., 2018). In Derimian et al. (2012), the range of k(λ) values for Eyjafjallajökull ash varied from around 0.015 at 440 nm to 0.008 at 870 nm, which is similar to what was reported by Weinzierl et al. (2012), whereas Bukowiecki et al. (2011) reported an average value of 0.02 between 450–700 nm. Here, n(λ) of Icelandic dust (Table 3) falls within the range of n values reported for Icelandic ash (Fig. 8a) (Bukowiecki et al., 2011; Deguine et al., 2020; Derimian et al., 2012; Reed et al., 2018; Weinzierl et al., 2012), while the values of k(λ) of Icelandic dust (Table 2) are higher than the k(λ) values of Icelandic ash from laboratory measurements (Deguine et al., 2020; Reed et al., 2018) but lower than ambient observations (Bukowiecki et al., 2011; Derimian et al., 2012; Weinzierl et al., 2012) (Fig. 8b). The difference between observational data and laboratory measurements could be due to several factors, including, for example, the different methods used and the different types of samples analyzed, as the physical and chemical properties of resuspended volcanic ash deposited in situ could be different from those of volcanic ash plumes, which could change further during atmospheric transport. On the other hand, our results for the SSA(λ) of Icelandic dust (Table 1 and Fig. 6) are within the range of values observed in Icelandic ash plumes (e.g., Derimian et al., 2012; Toledano et al., 2012). During the 2010 eruptions of Eyjafjallajökull, the values of SSA(λ) of a volcanic ash plume over France (17 April 2010) varied from 0.81 at 440 nm to 0.92 at 870 nm from AErosol RObotic NETwork (AERONET) observations (Derimian et al., 2012), whereas SSA(λ) derived from AERONET measurements of the ash plumes over Spain and Portugal (6–12 May 2010) was found to be 0.95 at 440 nm but slightly decreased with λ (Toledano et al., 2012).
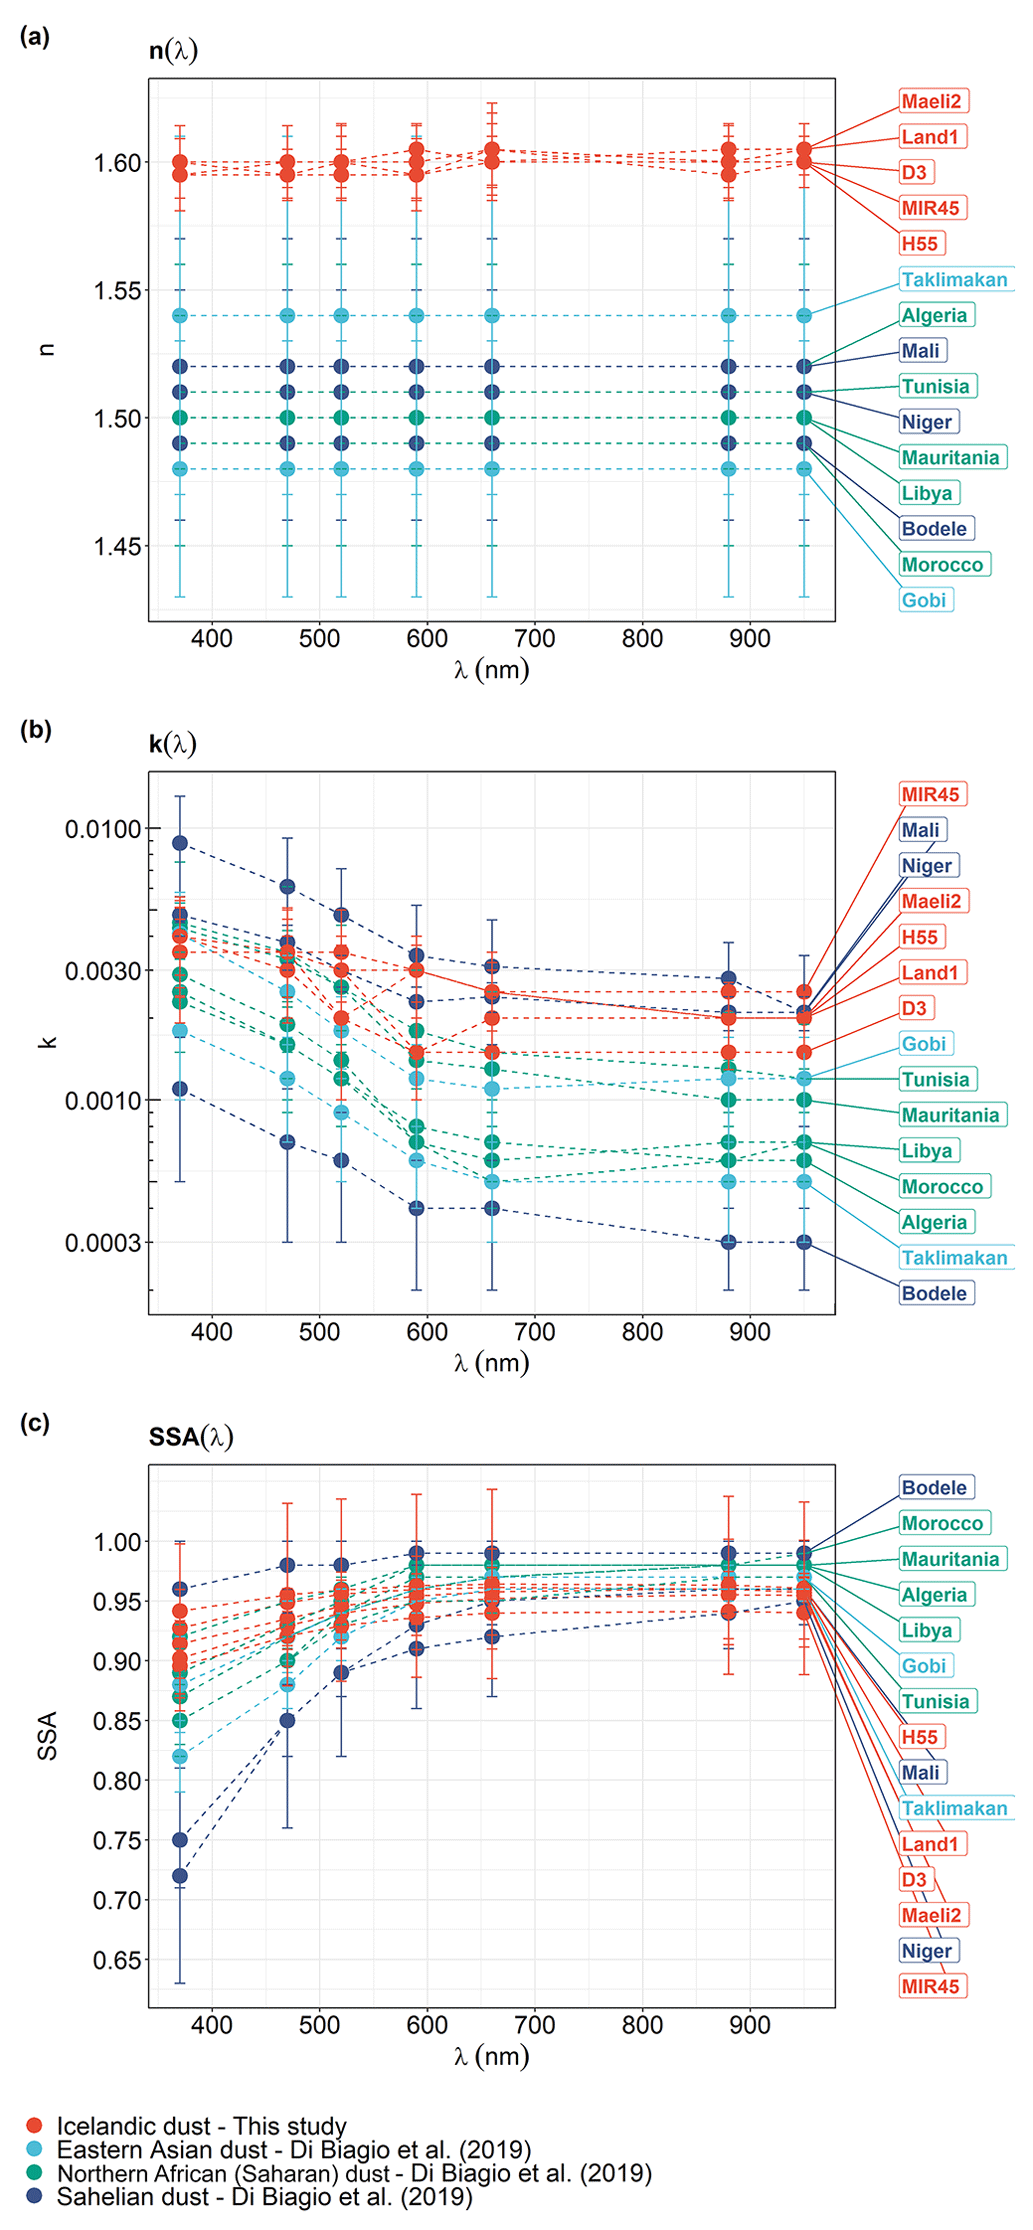
Figure 9Comparison between the experiment-averaged (a) real index navg(λ), (b) imaginary index kavg(λ), and (c) single scattering albedo SSAavg(λ) at λ = 370, 470, 520, 590, 660, 880, and 950 nm of Icelandic dust (Tables 1–3) and mineral dust from major dust source regions at low-latitude (Di Biagio et al., 2019), including northern Africa (Sahara), the Sahel, and eastern Asia. Note that we reported the real index of low-latitude mineral dust as the average value in the range 370–950 nm according to Table 4 of Di Biagio et al. (2019).
In Fig. 9, the complex refractive index and SSA(λ) of Icelandic dust were compared with those of low-latitude dust from major source regions such as northern Africa (Sahara), the Sahel, and eastern Asia analyzed by Di Biagio et al. (2019), where the same method as in this study was applied. Therefore, the differences between Icelandic dust and low-latitude dust that we discuss are primarily due to the different physical and chemical properties of the different types of samples. The real index n(λ) of Icelandic dust, at around 1.6 (Table 3), is slightly higher than that of typical low-latitude dust, averaging 1.51 in the spectral range 370–950 nm (Di Biagio et al., 2019) (Fig. 9a). Figure 9b shows that the mean value of k(λ) of Icelandic dust (Table 2) is at the upper end of the range of typical low-latitude dust (Di Biagio et al., 2019). The values of k(λ) decreased from around 0.002–0.005 at 370 nm to 0.001 at 950 nm in northern African (Saharan) dust, from 0.001–0.009 at 370 nm to 0.0003–0.002 at 950 nm in Sahelian dust, and from 0.002–0.004 at 370 nm to 0.0005–0.001 at 950 nm in eastern Asian dust (Di Biagio et al., 2019). In the spectral range between 370 and 590 nm, the difference between k(λ) of Icelandic dust (Table 2) and the k(λ) values of northern African (Saharan) dust, Sahelian dust, and eastern Asian dust was less than 3 times the square root of the sum of their squared uncertainties. The largest difference between Icelandic dust and low-latitude dust samples was observed from 660 to 950 nm (Fig. 9b). In particular, at these wavelengths, the values of k(λ) of samples D3 and MIR45, representative of the two major dust hotspots in Iceland (e.g., Arnalds et al., 2016), showed a significant difference compared to several low-latitude dust samples and were around 2–5 times higher than the k(λ) values of mineral dust from Morocco, Libya, and Algeria in northern Africa (Sahara) and the Taklimakan Desert in eastern Asia, and they were 5–8 times higher than the k(λ) values of dust from the Bodélé Depression in the Sahel (Fig. 9b).
Although SSA(λ) of Icelandic dust (Table 1 and Fig. 6) is within the range of values of low-latitude dust (Di Biagio et al., 2019), an absorption of 4 %–6 % can still be observed at 950 nm (Fig. 9c), which is relatively high, despite the uncertainty, considering that absorption in mineral dust at these wavelengths is generally around 2 % (Di Biagio et al., 2019). The SSA is affected by particle size and chemical composition. The particle size of Icelandic dust is quite comparable to that of low-latitude dust (Di Biagio et al., 2019), according to the Deff values for both the coarse and fine fractions of the particles sampled by the SW-OPAs. This suggests that the differences between the two may be mainly related to mineralogy.
Di Biagio et al. (2019) reported that there is a large variability in the SW imaginary index of mineral dust in the literature. The data from their study fall within the lower range of values reported in previous studies, which could be attributed to different types of samples analyzed and methodologies employed. However, the range of the real index and single scattering albedo were consistent with the literature.
When considering the imaginary index of Icelandic dust, this is close to the upper end of the imaginary index of northern African and eastern Asian dust estimated by Di Biagio et al. (2019) (Fig. 9b). It falls within the range of values reported in studies conducted on low-latitude dust, e.g., by Formenti et al. (2011) (from the AMMA campaign); Müller et al. (2011) (from the SAMUM campaign); Balkanski et al. (2007) (calculated from mineralogy); Dubovik et al. (2002) (from AERONET measurements); and Sinyuk et al. (2003) (from satellite observations), Volz (1972) (from laboratory experiments), and Patterson et al. (1977) (from laboratory experiments), as shown in Fig. S20.
4.2 Optical properties and mineralogy
The chemical and mineralogical composition of the Icelandic dust samples examined in this study was determined by Baldo et al. (2020). The Icelandic dust showed a basaltic composition, with relatively high total Fe content, ranging from around 11 wt % in sample H55 to 13 wt % in MIR45, compared to low-latitude dust (1 wt %–8 wt %; e.g., Di Biagio et al., 2019; Jeong, 2008; Shi et al., 2011). The samples were primarily composed of amorphous basaltic materials ranging from 8 wt % in H55 to 60 wt %–90 wt % in the other Icelandic dust. MIR45 had the highest proportion of amorphous glass. The magnetite fraction (1 wt %–2 wt %) was considerably higher than in low-latitude dust (generally < 0.1 wt % or undetectable in northern African dust and < 0.8 wt % in eastern Asian dust source regions; Jia et al., 2019; Lazaro et al., 2008; Maher et al., 2009; Moskowitz et al., 2016; Song et al., 2014), contributing to 7 %–15 % of total Fe. Fe oxide minerals accounted for 9 %–20 % of the total Fe, while most of the iron was contained in other mineral phases (e.g., pyroxene, feldspars, and olivine) and in the amorphous glass (Baldo et al., 2020).
The differences between Icelandic dust and low-latitude dust could be related to the presence of different Fe oxide minerals. Hematite (Fe2O3) and goethite (FeO(OH)) are the main Fe oxides in low-latitude dust (Di Biagio et al., 2019; Formenti et al., 2014) and have specific absorption bands in the UV–visible part of the spectrum (Caponi et al., 2017; Derimian et al., 2008; Di Biagio et al., 2019; Dubovik et al., 2002; Engelbrecht et al., 2016; Formenti et al., 2014; Lafon et al., 2006; Moosmuller et al., 2012; Redmond et al., 2010). However, we have shown that Icelandic dust is rich in magnetite (Baldo et al., 2020), which also absorbs light in the UV–visible part of the spectrum but has relatively high absorption even in the near-IR with k > 0.2 at 950 nm (Table S6). Di Biagio et al. (2019) found a linear relationship between SSA(λ) and k(λ) and the mass concentrations of Fe oxides and total Fe. In this study, the sample size was too small to reach statistical significance, and the values of SSA(λ) and k(λ) were similar among different samples (Tables 1 and 2) and did not show a clear pattern. In addition, since amorphous basaltic material is dominant but has main absorption bands in the IR region (Deguine et al., 2023; Deguine et al., 2020), we do not expect a good correlation. Overall, the values of k(λ) of Icelandic dust samples (Table 2) appear to be more similar to those of mineral dust from the Sahel region in Niger and Mali (Fig. 9b), which have relatively high Fe oxide contents, e.g., 5.8 wt % and 3.7 wt %, respectively (Di Biagio et al., 2019). However, it is important to note that the total Fe oxide content in Icelandic dust is lower, ranging from 1.2 wt %–2.6 wt % (Baldo et al., 2020). Additionally, it is worth noting that the Bodélé sample was classified as part of the Sahel in Di Biagio et al. (2019), but samples from the Bodélé Depression are often dominated by diatoms, with extremely low Fe oxide content (e.g., Bristow et al., 2009; Shi et al., 2011).
The high magnetite content may contribute to the high absorption capacity of Icelandic dust. In Fig. 7, the k(λ) values estimated in this study tend to be closer to the volume-averaged imaginary indices calculated by Baldo et al. (2020), assuming the spectral refractive index of magnetite from Querry (1985) compared to the values predicted using the refractive index of magnetite from Huffman and Stapp (1973). This suggest that the dataset from Querry (1985) may be more representative of the complex refractive index of magnetite in Icelandic dust. Table S6 reports the reference complex refractive indices of mineral components of Icelandic dust in the spectral range 370–950 nm. The average value of k(λ) of magnetite between 660 and 950 nm, which is 0.18 when estimated using data from Querry (1985) and is 0.43 when using data from Huffman and Stapp (1973), is greater than the reference index of any other mineral component, up to 270 times and 640 times, respectively. This suggests that magnetite may be one of the main minerals contributing to light absorption in Icelandic dust between 660 and 950 nm.
Here, we provide for the first time a dataset with the spectral SW SSA (Table 1) and complex refractive index (Tables 2 and 3) of mineral dust from five major dust hotspots in Iceland. The spectral imaginary index k(λ) of Icelandic dust (Table 2) is at the upper end of the range of typical low-latitude dust. However, in Icelandic dust, absorption between 660 and 950 nm can be 2–8 times higher than in several low-latitude dust samples (Fig. 9b).
Previous research by Kylling et al. (2018) estimated that Icelandic dust produces a positive direct radiative forcing in the Arctic via dust–radiation interaction and deposition onto snow and ice. This estimation was based on the dust load estimates by Groot Zwaaftink et al. (2016) and assumed the same optical properties, in line with the dataset of Balkanski et al. (2007), for all mineral dust from different regions. The dust radiative effect is very sensitive to the complex refractive index, which is a major uncertainty (e.g., Di Biagio et al., 2020; Li et al., 2021). In the dataset used by Kylling et al. (2018), k(λ) was around 0.002 at 555 nm, which is comparable to the values of k(λ) of Icelandic dust at 590 nm observed in this study (Table 2). However, k(λ) in the Icelandic dust samples was found to be 0.002–0.003 in the range of 660 to 950 nm (Table 2), while the results from Balkanski et al. (2007) indicated that k(λ) decreases to below 0.001 in the same λ range. This implies that the positive direct radiative forcing of Icelandic dust in the Arctic could be stronger than previously estimated. Although the 700–1000 nm wavelength band is characterized by lower solar irradiance than the visible band, it still contributes approximatively 25 % of the total spectral solar irradiance (e.g., Woods et al., 2009). Therefore, the increased absorption of Icelandic dust in this range may still influence the radiative balance and regional climate. The measurements conducted at CESAM on the longwave optical properties of Icelandic dust will provide additional valuable insights into its radiative effect and contribution to Arctic warming. As glaciers retreat and expose more ice-free land as potential dust sources (Meinander et al., 2022), this effect is expected to increase. While these new results on the optical properties of Icelandic dust will contribute to reducing the uncertainty in its radiative effect, additional data on the size distribution and emissions are also crucial to advance our understanding.
The aerosol size distribution was obtained by combining the measurements from SMPS and GRIMM into a single geometrical size distribution. Several corrections were applied to the SMPS and GRIMM measurements because of the differences in operating principles and diameter definitions between the instruments.
The SMPS measures the size distribution of submicron particles. The operating principle of the SMPS is the balance between the electrical force on a charged particle due to a constant electric field and the drag force experienced by that particle at terminal velocity, which is used to derive the particle size (DeCarlo et al., 2004; Hinds, 1999). The relationship between the electrical mobility diameter Dm (the diameter of a single-charged spherical particle with the same terminal velocity in a constant electric field as the single-charged particle under consideration), as measured by the SMPS and the volume-equivalent diameter Dg (the diameter of a spherical particle of the same volume as the particle under consideration) is described by Eq. (A1):
where χ is the dynamic shape factor, and Cc is the Cunningham slip correction factor assuming a mean free path of 66 nm (air conditions) (Hinds, 1999):
where Dg-m represents either the volume-equivalent diameter Dg or the electrical mobility diameter Dm.
The OPCs measure the size distribution across a wide range of sizes including submicron and supermicron particles. The OPC operating principle is the dependence of angular light scattering on particle size (Hinds, 1999; Wendisch and Brenguier, 2013). The particle size measured by OPCs is therefore referred to as optical-equivalent diameter Dop, i.e., the diameter of a spherical particle with a given complex refractive index which has the same scattering efficiency (Qsca) and cross-sectional area (A) as the particle under consideration. In this study, the volume-equivalent diameter Dg of natural aerosols was retrieved using look-up tables from Formenti et al. (2021), which convert Dop into Dg. These look-up tables are calculated for a wide range of complex refractive indices to determine the diameter that would give the same (or closest) single-particle scattering cross-section, Csca = Qsca × A, as that calculated using calibration reference PSL particles referring to Dop. For GRIMM, increasing the imaginary index k, the scattering cross-section curve tends to become flat at around 1 µm as shown in Fig. 2 of Formenti et al. (2021). This leads to large uncertainty when calculating the volume-equivalent diameters Dg of light-absorbing aerosols in the range between 0.6 and 2 µm (Formenti et al., 2021). Consequently, increasing the value of Dop does not always correspond to increasing Dg, which may produce negative or very small dlogDg = logDg2−logDg1, where Dg1 and Dg2 are the lower and upper cut-off diameters of each size range. This generates unusual spikes in the calculated geometrical size distributions . Two common strategies to address this issue are widening or grouping the OPC bin size (Johnson and Osborne, 2011) or fitting the corrected Dg curve (Hand and Kreidenweis, 2002; Johnson et al., 2008). Here, the corrected Dg values which return dlogDg < 0.01 were replaced with the average of the bin before and after.
The particle loss correction accounts for the loss of particles along the instrument sampling lines. The particle loss calculation was performed using the PLC software (von der Weiden et al., 2009). The input parameters for the PLC software included the geometry of the sampling line, the sampling flow rate, the particle density, and the dynamic shape factor χ. The particle bulk density was set to 2.90 ± 0.01 g cm−3 as measured using a helium pycnometer for particles less than 63 µm in diameter (Baldo et al., 2020), a value that is consistent with the results of a recent study by Richards-Thomas et al. (2020). However, from the analysis conducted on larger size fractions, less than 125 µm in diameter, using the water penetration method, Butwin et al. (2020) found an average density value of 2.25 g cm−3 for Icelandic dust. For each instrument, the particle loss percentage was calculated assuming χ from 1.6 to 2.0 by 0.1 steps.
To retrieve the size distribution of the particles suspended in CESAM, the merged geometrical size distributions were divided into two size ranges which were corrected for particle loss in the sampling systems of SMPS and GRIMM, respectively. The particle size domain was assigned based on the geometrical size distributions of GRIMM and SMPS used to merge the data:
For the SMPS, the loss of particles with Dg < 1 µm was less than 5 %. For GRIMM, the particle loss was up to 15 % in the range 1–2.5 µm, within 50 % in the range 2.5–5 µm, and reached 100 % at Dg around 20 µm. The variation in particle loss calculated using the examined χ values was generally below 10 % but over 50 % at Dg around 20 µm. The size distributions were corrected as follows:
where is the size distribution measured by the SMPS or GRIMM, and L(Dg,SMPS-GRIMM) is the proportion of particles lost as a function of Dg in the size range measured by the SMPS or GRIMM. Finally, the size distribution of the particles suspended in CESAM was obtained by summing up the contributions of the SMPS and GRIMM in their specific size range:
Subsequently, the size distribution of the particles suspended in CESAM was used to evaluate the size-dependent correction factor in the sampling lines of the Aethalometer and nephelometer. For the Aethalometer, the particle loss was below 5 % at Dg < 1 µm, up to 20 % in the range 1–2.5 µm, below 60 % in the range 2.5–5 µm, and reached 100 % at Dg around 9 µm. The variation in particle loss calculated using the examined χ values was generally below 10 % but over 50 % at Dg around 9 µm. The percentage difference between the loss correction estimated for the Aethalometer and that obtained for the nephelometer was < 11 %. The data were corrected as follows:
where is the size distribution measured by the Aethalometer or nephelometer, and L(Dg)Aet-Nep is the particle loss as a function of Dg estimated for the two instruments. Since the size distributions of the Aethalometer and nephelometer were very similar, we decided to estimate a common size distribution that would be representative of the dust particles sampled by these instruments. NSW-OPAs(Dg) is the size distribution of the SW-OPAs which was calculated as the average of and .
The nephelometer measurements were corrected for light-scattered truncation for scattering angles (θ) between 0–7 and 170–180∘ (Anderson et al., 1996; Anderson and Ogren, 1998). The truncation correction Ctrunc for total scattering was estimated as follows:
where is the scattering coefficient calculated for θ between 0 and 180∘, and is the scattering coefficient calculated for θ between 7 and 170∘. The Python PyMieScatt package (Sumlin et al., 2018) was used to retrieve and at a given λ by Mie calculation for homogeneous spheres by varying the particle size distribution N(Dg) based on the complex refractive index. The SW-OPA geometrical size distribution NSW-OPAs(Dg) was used in the calculation.
For single homogeneous spherical particles, the scattering intensity function at given θ can be calculated using the Mie theory, where Xs is the size parameter (), and m is the complex refractive index of particles of geometrical diameter Dg. The scattering intensity function can be integrated over θ from 0 to 180∘ to obtain the single-particle total scattering efficiency (e.g., Anderson et al., 1996; Bohren and Hufmann, 1998):
Finally, βsca can be calculated as the integral of Qsca over the particle size distribution N(Dg) multiplied by the particle cross-sectional area (e.g., Anderson et al., 1996; Bohren and Hufmann, 1998):
In this study, was computed at a given λ by the Mie_SD function for polydisperse size distributions in the Python PyMieScatt package by inputting the calculated NSW-OPAs(Dg), as the particle size distribution, and the corresponding complex refractive index. To determine , first the angular scattering intensities for θ between 7 and 170∘ were computed by the “ScatteringFunction” angular function, and then they were used in Eqs. (C2) and (C3) to obtain Qsca and βsca.
This section provides a description of the calculation of the parameters in Eq. (5) which were used to retrieve the absorption coefficient βabs(λ) from the attenuation coefficient βATTN (λ).
The parameter α(λ) was calculated using the formula from Arnott et al. (2005):
where A and åsca were obtained from the power-law fitting of βsca(λ) (m−1) versus λ (nm) weighted by the inverse of the variance of βsca(λ). The scattering coefficient βsca(λ) measured by the nephelometer, corrected for truncation, and extrapolated at the Aethalometer λ was used in the calculation. We assumed c = 3.29 × 10⁻⁴ and d = 0.564 as reported in Collaud Coen et al. (2010).
The obtained α(λ) increased with time as the particles were accumulating on the filter. Different wavelengths showed similar values of the α parameters. In the Icelandic dust samples, α(λ) ranged from around 0.005 to 0.02, which is within the range (0.002 to 0.02) reported by Di Biagio et al. (2019) for coarse mineral dust. The uncertainty in α(λ) varied between 17 %–76 % and was estimated by the error propagation through Eq. (D1), considering the uncertainty in the fitted parameters A and åsca. The uncertainty in α(λ) was 35 %–76 % for samples D3 and MIR45, which showed the largest errors in the fitted parameters; 29 %–45 % for samples Maeli2 and H55; and 17 %–27 % for sample Land1.
The multiple scattering effect correction Cref was extrapolated at 370, 470, 520, 590, 660, 880, and 950 nm by the linear regression of Cref at 450 and 660 nm estimated for mineral dust by Di Biagio et al. (2017b). Cref varied from 4.3 at 370 nm to 3.3 at 950 nm. The uncertainty in Cref determined by Di Biagio et al. (2017b) was 10 %.
The loading effect correction R(λ) was calculated from the spectral attenuation ATTN measured by the Aethalometer using the formula from Collaud Coen et al. (2010):
where f(λ) depends on the aerosol absorption properties and is a function of SSA(λ):
We assumed a = 0.74 as reported in Collaud Coen et al. (2010). As an initial guess for R(λ), the single scattering albedo in Eq. (D3) was estimated using βsca(λ) (measured by the nephelometer, corrected for truncation, and extrapolated at the Aethalometer λ) and βabs(λ)∗, which is the absorption coefficient corrected only for the scattering effect (Di Biagio et al., 2019):
R(λ) increased with λ but decreased with time as particles were loaded onto a new filter. R(λ) obtained after the second iteration varied between 0.7 and 1 in different Icelandic dust samples, which is within the range reported by Di Biagio et al. (2019) for mineral dust, from 0.5 to 1. The uncertainty in R(λ) was also estimated by applying the error propagation method and was generally ≤ 10 % but varied between 10 %–50 % within the first 10 min that the particles were loaded onto a new filter.
Datasets for this research are included in this paper (and the Supplement). The data will also be made available in the future through the EUROCHAMP data center (https://data.eurochamp.org/data-access, last access: 10 July 2023; EUROCHAMP, 2023). Example research code are available at https://doi.org/10.5281/zenodo.8135133 (Baldo and Lu, 2023).
The supplement related to this article is available online at: https://doi.org/10.5194/acp-23-7975-2023-supplement.
CB, ZS, CDB, PF, and JFD designed the experiments and discussed the results. ZS supervised the experimental and data analyses. CB performed the experiments at CESAM, with support from ZS, CDB, PF, MC, EP, and JFD, and carried out the data analysis, with contributions from ZS, ARM, GL, CS, DB, CDB, and PF. GL refined the research codes. The soil samples used for the experiments were collected by OA and PDW. CB prepared the manuscript with contributions from all co-authors.
At least one of the (co-)authors is a member of the editorial board of Atmospheric Chemistry and Physics. The peer-review process was guided by an independent editor, and the authors also have no other competing interests to declare.
Publisher's note: Copernicus Publications remains neutral with regard to jurisdictional claims in published maps and institutional affiliations.
The authors wish to acknowledge the reviewers for their valuable feedback and insightful comments.
Clarissa Baldo has been funded by the Natural Environment Research Council CENTA studentship (grant no. NE/L002493/1). This research has also been supported by the Natural Environment Research Council (grant no. NE/S00579X/1); the European Commission, Horizon 2020 (EUROCHAMP-2020 (grant no. 730997)); and the European Cooperation in Science and Technology (grant no. CA16202). Support for this research was provided to Olafur Arnalds and Pavla Dagsson-Waldhauserova from the Czech Science Foundation (grant no. 20-06168Y). Gongda Lu was supported by the PhD studentships funded by the China Scholarship Council. CNRS-INSU supported the CESAM chamber as a national facility as part of the French ACTRIS research infrastructure as well as the AERIS data center (http://www.aeris-data.fr; last access: 10 July 2023) for distributing and curating the data produced by the CESAM chamber through hosting of the EUROCHAMP data center data (https://data.eurochamp.org; last access: 10 July 2023).
This paper was edited by Allan Bertram and reviewed by two anonymous referees.
Achterberg, E. P., Moore, C. M., Henson, S. A., Steigenberger, S., Stohl, A., Eckhardt, S., Avendano, L. C., Cassidy, M., Hembury, D., Klar, J. K., Lucas, M. I., Macey, A. I., Marsay, C. M., and Ryan-Keogh, T. J.: Natural iron fertilization by the Eyjafjallajökull volcanic eruption, Geophys. Res. Lett., 40, 921–926, https://doi.org/10.1002/grl.50221, 2013.
Achterberg, E. P., Steigenberger, S., Marsay, C. M., LeMoigne, F. A. C., Painter, S. C., Baker, A. R., Connelly, D. P., Moore, C. M., Tagliabue, A., and Tanhua, T.: Iron Biogeochemistry in the High Latitude North Atlantic Ocean, Sci. Rep., 8, 1283, https://doi.org/10.1038/s41598-018-19472-1, 2018.
Anderson, T. L. and Ogren, J. A.: Determining Aerosol Radiative Properties Using the TSI 3563 Integrating Nephelometer, Aerosol Sci. Tech., 29, 57–69, https://doi.org/10.1080/02786829808965551, 1998.
Anderson, T. L., Covert, D. S., Marshall, S. F., Laucks, M. L., Charlson, R. J., Waggoner, A. P., Ogren, J. A., Caldow, R., Holm, R. L., Quant, F. R., Sem, G. J., Wiedensohler, A., Ahlquist, N. A., and Bates, T. S.: Performance Characteristics of a High-Sensitivity, Three-Wavelength, Total Scatter/Backscatter Nephelometer, J. Atmos. Ocean. Tech., 13, 967–986, https://doi.org/10.1175/1520-0426(1996)013<0967:Pcoahs>2.0.Co;2, 1996.
Arnalds, O., Olafsson, H., and Dagsson-Waldhauserova, P.: Quantification of iron-rich volcanogenic dust emissions and deposition over the ocean from Icelandic dust sources, Biogeosciences, 11, 6623–6632, https://doi.org/10.5194/bg-11-6623-2014, 2014.
Arnalds, O., Dagsson-Waldhauserova, P., and Olafsson, H.: The Icelandic volcanic aeolian environment: Processes and impacts – A review, Aeolian Res., 20, 176–195, https://doi.org/10.1016/j.aeolia.2016.01.004, 2016.
Arnott, W. P., Hamasha, K., Moosmüller, H., Sheridan, P. J., and Ogren, J. A.: Towards Aerosol Light-Absorption Measurements with a 7-Wavelength Aethalometer: Evaluation with a Photoacoustic Instrument and 3-Wavelength Nephelometer, Aerosol Sci. Tech., 39, 17–29, https://doi.org/10.1080/027868290901972, 2005.
Ayers, G. P.: Comment on regression analysis of air quality data, Atmos. Environ., 35, 2423–2425, https://doi.org/10.1016/S1352-2310(00)00527-6, 2001.
Baddock, M. C., Mockford, T., Bullard, J. E., and Thorsteinsson, T.: Pathways of high-latitude dust in the North Atlantic, Earth Planet. Sc. Lett., 459, 170–182, https://doi.org/10.1016/j.epsl.2016.11.034, 2017.
Baldo, C., Formenti, P., Nowak, S., Chevaillier, S., Cazaunau, M., Pangui, E., Di Biagio, C., Doussin, J.-F., Ignatyev, K., Dagsson-Waldhauserova, P., Arnalds, O., MacKenzie, A. R., and Shi, Z.: Distinct chemical and mineralogical composition of Icelandic dust compared to northern African and Asian dust, Atmos. Chem. Phys., 20, 13521–13539, https://doi.org/10.5194/acp-20-13521-2020, 2020.
Baldo, C. and Lu, G.: Research code supporting “Complex refractive index and single scattering albedo of Icelandic dust in the shortwave spectrum” (v1.0.0), Zenodo [code and data set], https://doi.org/10.5281/zenodo.8135133, 2023.
Balkanski, Y., Schulz, M., Claquin, T., and Guibert, S.: Reevaluation of Mineral aerosol radiative forcings suggests a better agreement with satellite and AERONET data, Atmos. Chem. Phys., 7, 81–95, https://doi.org/10.5194/acp-7-81-2007, 2007.
Beddows, D. C. S., Dall'osto, M., and Harrison, R. M.: An Enhanced Procedure for the Merging of Atmospheric Particle Size Distribution Data Measured Using Electrical Mobility and Time-of-Flight Analysers, Aerosol Sci. Tech., 44, 930–938, https://doi.org/10.1080/02786826.2010.502159, 2010.
Bohren, C. F. and Hufmann, D. R.: Absorption and Scattering by a Sphere, in: Absorption and Scattering of Light by Small Particles, Wiley-VCH Verlag GmbH & Co. KGaA, Weinheim, 82–129, https://doi.org/10.1002/9783527618156, 1998.
Bristow, C. S., Drake, N., and Armitage, S.: Deflation in the dustiest place on Earth: The Bodélé Depression, Chad, Geomorphology, 105, 50–58, https://doi.org/10.1016/j.geomorph.2007.12.014, 2009.
Bukowiecki, N., Zieger, P., Weingartner, E., Jurányi, Z., Gysel, M., Neininger, B., Schneider, B., Hueglin, C., Ulrich, A., Wichser, A., Henne, S., Brunner, D., Kaegi, R., Schwikowski, M., Tobler, L., Wienhold, F. G., Engel, I., Buchmann, B., Peter, T., and Baltensperger, U.: Ground-based and airborne in-situ measurements of the Eyjafjallajökull volcanic aerosol plume in Switzerland in spring 2010, Atmos. Chem. Phys., 11, 10011–10030, https://doi.org/10.5194/acp-11-10011-2011, 2011.
Bullard, J. E.: The distribution and biogeochemical importance of high-latitude dust in the Arctic and Southern Ocean–Antarctic regions, J. Geophys. Res.-Atmos., 122, 3098–3103, https://doi.org/10.1002/2016jd026363, 2017.
Bullard, J. E., Baddock, M., Bradwell, T., Crusius, J., Darlington, E., Gaiero, D., Gasso, S., Gisladottir, G., Hodgkins, R., McCulloch, R., McKenna-Neuman, C., Mockford, T., Stewart, H., and Thorsteinsson, T.: High-latitude dust in the Earth system, Rev. Geophys., 54, 447–485, https://doi.org/10.1002/2016rg000518, 2016.
Butwin, M. K., Pfeffer, M. A., von Löwis, S., Støren, E. W. N., Bali, E., and Thorsteinsson, T.: Properties of dust source material and volcanic ash in Iceland, Sedimentology, 67, 3067–3087, https://doi.org/10.1111/sed.12734, 2020.
Caponi, L., Formenti, P., Massabó, D., Di Biagio, C., Cazaunau, M., Pangui, E., Chevaillier, S., Landrot, G., Andreae, M. O., Kandler, K., Piketh, S., Saeed, T., Seibert, D., Williams, E., Balkanski, Y., Prati, P., and Doussin, J.-F.: Spectral- and size-resolved mass absorption efficiency of mineral dust aerosols in the shortwave spectrum: a simulation chamber study, Atmos. Chem. Phys., 17, 7175–7191, https://doi.org/10.5194/acp-17-7175-2017, 2017.
Collaud Coen, M., Weingartner, E., Apituley, A., Ceburnis, D., Fierz-Schmidhauser, R., Flentje, H., Henzing, J. S., Jennings, S. G., Moerman, M., Petzold, A., Schmid, O., and Baltensperger, U.: Minimizing light absorption measurement artifacts of the Aethalometer: evaluation of five correction algorithms, Atmos. Meas. Tech., 3, 457–474, https://doi.org/10.5194/amt-3-457-2010, 2010.
Cook, J. M., Tedstone, A. J., Williamson, C., McCutcheon, J., Hodson, A. J., Dayal, A., Skiles, M., Hofer, S., Bryant, R., McAree, O., McGonigle, A., Ryan, J., Anesio, A. M., Irvine-Fynn, T. D. L., Hubbard, A., Hanna, E., Flanner, M., Mayanna, S., Benning, L. G., van As, D., Yallop, M., McQuaid, J. B., Gribbin, T., and Tranter, M.: Glacier algae accelerate melt rates on the south-western Greenland Ice Sheet, The Cryosphere, 14, 309–330, https://doi.org/10.5194/tc-14-309-2020, 2020.
Dagsson-Waldhauserova, P.: Variability, origin and physical characteristics of dust aerosol in Iceland, PhD dissertation, Faculty of Physical Sciences Agricultural University of Iceland, Reykjavik, 163 pp., 2014.
Dagsson-Waldhauserova, P., Arnalds, O., and Olafsson, H.: Long-term frequency and characteristics of dust storm events in Northeast Iceland (1949–2011), Atmos. Environ., 77, 117–127, https://doi.org/10.1016/j.atmosenv.2013.04.075, 2013.
Dagsson-Waldhauserova, P., Arnalds, O., and Olafsson, H.: Long-term variability of dust events in Iceland (1949–2011), Atmos. Chem. Phys., 14, 13411–13422, https://doi.org/10.5194/acp-14-13411-2014, 2014.
Dagsson-Waldhauserova, P., Arnalds, O., Olafsson, H., Hladil, J., Skala, R., Navratil, T., Chadimova, L., and Meinander, O.: Snow–Dust Storm: Unique case study from Iceland, March 6–7, 2013, Aeolian Res., 16, 69–74, https://doi.org/10.1016/j.aeolia.2014.11.001, 2015.
Dagsson-Waldhauserova, P., Renard, J.-B., Olafsson, H., Vignelles, D., Berthet, G., Verdier, N., and Duverger, V.: Vertical distribution of aerosols in dust storms during the Arctic winter, Sci. Rep., 9, 16122, https://doi.org/10.1038/s41598-019-51764-y, 2019.
DeCarlo, P. F., Slowik, J. G., Worsnop, D. R., Davidovits, P., and Jimenez, J. L.: Particle Morphology and Density Characterization by Combined Mobility and Aerodynamic Diameter Measurements. Part 1: Theory, Aerosol Sci. Tech., 38, 1185–1205, https://doi.org/10.1080/027868290903907, 2004.
Deguine, A., Petitprez, D., Clarisse, L., Guđmundsson, S., Outes, V., Villarosa, G., and Herbin, H.: Complex refractive index of volcanic ash aerosol in the infrared, visible, and ultraviolet, Appl. Optics, 59, 884–895, https://doi.org/10.1364/AO.59.000884, 2020.
Deguine, A., Petitprez, D., Clarisse, L., Deschutter, L., Fontijn, K., and Herbin, H.: Retrieval of refractive indices of ten volcanic ash samples in the infrared, visible and ultraviolet spectral region, J. Aerosol Sci., 167, 106100, https://doi.org/10.1016/j.jaerosci.2022.106100, 2023.
Derimian, Y., Karnieli, A., Kaufman, Y. J., Andreae, M. O., Andreae, T. W., Dubovik, O., Maenhaut, W., and Koren, I.: The role of iron and black carbon in aerosol light absorption, Atmos. Chem. Phys., 8, 3623–3637, https://doi.org/10.5194/acp-8-3623-2008, 2008.
Derimian, Y., Dubovik, O., Tanre, D., Goloub, P., Lapyonok, T., and Mortier, A.: Optical properties and radiative forcing of the Eyjafjallajökull volcanic ash layer observed over Lille, France, in 2010, J. Geophys. Res.-Atmos., 117, D00U25, https://doi.org/10.1029/2011jd016815, 2012.
Di Biagio, C., Formenti, P., Balkanski, Y., Caponi, L., Cazaunau, M., Pangui, E., Journet, E., Nowak, S., Caquineau, S., Andreae, M. O., Kandler, K., Saeed, T., Piketh, S., Seibert, D., Williams, E., and Doussin, J.-F.: Global scale variability of the mineral dust long-wave refractive index: a new dataset of in situ measurements for climate modeling and remote sensing, Atmos. Chem. Phys., 17, 1901–1929, https://doi.org/10.5194/acp-17-1901-2017, 2017a.
Di Biagio, C., Formenti, P., Cazaunau, M., Pangui, E., Marchand, N., and Doussin, J.-F.: Aethalometer multiple scattering correction Cref for mineral dust aerosols, Atmos. Meas. Tech., 10, 2923–2939, https://doi.org/10.5194/amt-10-2923-2017, 2017b.
Di Biagio, C., Formenti, P., Balkanski, Y., Caponi, L., Cazaunau, M., Pangui, E., Journet, E., Nowak, S., Andreae, M. O., Kandler, K., Saeed, T., Piketh, S., Seibert, D., Williams, E., and Doussin, J.-F.: Complex refractive indices and single-scattering albedo of global dust aerosols in the shortwave spectrum and relationship to size and iron content, Atmos. Chem. Phys., 19, 15503–15531, https://doi.org/10.5194/acp-19-15503-2019, 2019.
Di Biagio, C., Balkanski, Y., Albani, S., Boucher, O., and Formenti, P.: Direct Radiative Effect by Mineral Dust Aerosols Constrained by New Microphysical and Spectral Optical Data, Geophys. Res. Lett., 47, e2019GL086186, https://doi.org/10.1029/2019GL086186, 2020.
Dragosics, M., Meinander, O., Jónsdóttír, T., Dürig, T., De Leeuw, G., Pálsson, F., Dagsson-Waldhauserová, P., and Thorsteinsson, T.: Insulation effects of Icelandic dust and volcanic ash on snow and ice, Arab. J. Geosci., 9, 126, https://doi.org/10.1007/s12517-015-2224-6, 2016.
Dubovik, O., Holben, B., Eck, T. F., Smirnov, A., Kaufman, Y. J., King, M. D., Tanre, D., and Slutsker, I.: Variability of absorption and optical properties of key aerosol types observed in worldwide locations, J. Atmos. Sci., 59, 590–608, https://doi.org/10.1175/1520-0469(2002)059<0590:voaaop>2.0.co;2, 2002.
Engelbrecht, J. P., Moosmüller, H., Pincock, S., Jayanty, R. K. M., Lersch, T., and Casuccio, G.: Technical note: Mineralogical, chemical, morphological, and optical interrelationships of mineral dust re-suspensions, Atmos. Chem. Phys., 16, 10809–10830, https://doi.org/10.5194/acp-16-10809-2016, 2016.
EUROCHAMP: Data access, https://data.eurochamp.org/data-access, last access: 10 July 2023.
Formenti, P., Rajot, J. L., Desboeufs, K., Saïd, F., Grand, N., Chevaillier, S., and Schmechtig, C.: Airborne observations of mineral dust over western Africa in the summer Monsoon season: spatial and vertical variability of physico-chemical and optical properties, Atmos. Chem. Phys., 11, 6387–6410, https://doi.org/10.5194/acp-11-6387-2011, 2011.
Formenti, P., Caquineau, S., Chevaillier, S., Klaver, A., Desboeufs, K., Rajot, J. L., Belin, S., and Briois, V.: Dominance of goethite over hematite in iron oxides of mineral dust from Western Africa: Quantitative partitioning by X-ray absorption spectroscopy, J. Geophys. Res.-Atmos., 119, 12740–12754, https://doi.org/10.1002/2014jd021668, 2014.
Formenti, P., Di Biagio, C., Huang, Y., Kok, J., Mallet, M. D., Boulanger, D., and Cazaunau, M.: Look-up tables resolved by complex refractive index to correct particle sizes measured by common research-grade optical particle counters, Atmos. Meas. Tech. Discuss. [preprint], https://doi.org/10.5194/amt-2021-403, 2021.
Groot Zwaaftink, C. D., Grythe, H., Skov, H., and Stohl, A.: Substantial contribution of northern high-latitude sources to mineral dust in the Arctic, J. Geophys. Res.-Atmos., 121, 13678–13697, https://doi.org/10.1002/2016jd025482, 2016.
Groot Zwaaftink, C. D., Arnalds, Ó., Dagsson-Waldhauserova, P., Eckhardt, S., Prospero, J. M., and Stohl, A.: Temporal and spatial variability of Icelandic dust emissions and atmospheric transport, Atmos. Chem. Phys., 17, 10865–10878, https://doi.org/10.5194/acp-17-10865-2017, 2017.
Gunnarsson, A., Gardarsson, S. M., Pálsson, F., Jóhannesson, T., and Sveinsson, Ó. G. B.: Annual and inter-annual variability and trends of albedo of Icelandic glaciers, The Cryosphere, 15, 547–570, https://doi.org/10.5194/tc-15-547-2021, 2021.
Hand, J. L. and Kreidenweis, S. M.: A New Method for Retrieving Particle Refractive Index and Effective Density from Aerosol Size Distribution Data, Aerosol Sci. Tech., 36, 1012–1026, https://doi.org/10.1080/02786820290092276, 2002.
Hansen, J. E.: Multiple Scattering of Polarized Light in Planetary Atmospheres Part II. Sunlight Reflected by Terrestrial Water Clouds, J. Atmos. Sci., 28, 1400–1426, https://doi.org/10.1175/1520-0469(1971)028<1400:Msopli>2.0.Co;2, 1971.
Hinds, W. C.: Aerosol Technology: Properties, Behavior, and Measurement of Airborne Particles, John Wiley & Sons, Incorporated, Somerset, United States, ISBN 9781118591970, 1999.
Huang, Y., Adebiyi, A. A., Formenti, P., and Kok, J. F.: Linking the Different Diameter Types of Aspherical Desert Dust Indicates That Models Underestimate Coarse Dust Emission, Geophys. Res. Lett., 48, e2020GL092054, https://doi.org/10.1029/2020GL092054, 2021.
Huffman, D. R. and Stapp, J. L.: Optical measurements on solids of possible interstellar importance, in: Interstellar dust and related topics, International Astronomical Union/Union Astronomique Internationale, Springer, Dordrecht, 297–301, https://doi.org/10.1007/978-94-010-2661-1_44, 1973.
Jeong, G. Y.: Bulk and single-particle mineralogy of Asian dust and a comparison with its source soils, J. Geophys. Res.-Atmos., 113, D02208, https://doi.org/10.1029/2007jd008606, 2008.
Jia, J., Wang, Y. J., Xia, D. S., Lu, H., and Gao, F. Y.: Dust Sources of Last Glacial Chinese Loess Based on the Iron Mineralogy of Fractionated Source Samples, Geophys. Res. Lett., 46, 2103–2110, https://doi.org/10.1029/2018gl080909, 2019.
Johnson, B. T. and Osborne, S. R.: Physical and optical properties of mineral dust aerosol measured by aircraft during the GERBILS campaign, Q. J. Roy. Meteor. Soc., 137, 1117–1130, https://doi.org/10.1002/qj.777, 2011.
Johnson, B. T., Osborne, S. R., Haywood, J. M., and Harrison, M. A. J.: Aircraft measurements of biomass burning aerosol over West Africa during DABEX, J. Geophys. Res.-Atmos., 113, D00C06, https://doi.org/10.1029/2007JD009451, 2008.
Kandler, K., Benker, N., Bundke, U., Cuevas, E., Ebert, M., Knippertz, P., Rodriguez, S., Schutz, L., and Weinbruch, S.: Chemical composition and complex refractive index of Saharan Mineral Dust at Izana, Tenerife (Spain) derived by electron microscopy, Atmos. Environ., 41, 8058–8074, https://doi.org/10.1016/j.atmosenv.2007.06.047, 2007.
Kylling, A., Zwaaftink, C. D. G., and Stohl, A.: Mineral Dust Instantaneous Radiative Forcing in the Arctic, Geophys. Res. Lett., 45, 4290–4298, https://doi.org/10.1029/2018gl077346, 2018.
Lafon, S., Sokolik, I. N., Rajot, J. L., Caquineau, S., and Gaudichet, A.: Characterization of iron oxides in mineral dust aerosols: Implications for light absorption, J. Geophys. Res.-Atmos., 111, D21207, https://doi.org/10.1029/2005jd007016, 2006.
Lazaro, F. J., Gutierrez, L., Barron, V., and Gelado, M. D.: The speciation of iron in desert dust collected in Gran Canaria (Canary Islands): Combined chemical, magnetic and optical analysis, Atmos. Environ., 42, 8987–8996, https://doi.org/10.1016/j.atmosenv.2008.09.035, 2008.
Li, L., Mahowald, N. M., Miller, R. L., Pérez García-Pando, C., Klose, M., Hamilton, D. S., Gonçalves Ageitos, M., Ginoux, P., Balkanski, Y., Green, R. O., Kalashnikova, O., Kok, J. F., Obiso, V., Paynter, D., and Thompson, D. R.: Quantifying the range of the dust direct radiative effect due to source mineralogy uncertainty, Atmos. Chem. Phys., 21, 3973–4005, https://doi.org/10.5194/acp-21-3973-2021, 2021.
Lutz, S., Anesio, A. M., Edwards, A., and Benning, L. G.: Microbial diversity on Icelandic glaciers and ice caps, Front. Microbiol., 6, 307, https://doi.org/10.3389/fmicb.2015.00307, 2015.
Maher, B. A., Mutch, T. J., and Cunningham, D.: Magnetic and geochemical characteristics of Gobi Desert surface sediments: Implications for provenance of the Chinese Loess Plateau, Geology, 37, 279–282, https://doi.org/10.1130/g25293a.1, 2009.
McCutcheon, J., Lutz, S., Williamson, C., Cook, J. M., Tedstone, A. J., Vanderstraeten, A., Wilson, S. A., Stockdale, A., Bonneville, S., Anesio, A. M., Yallop, M. L., McQuaid, J. B., Tranter, M., and Benning, L. G.: Mineral phosphorus drives glacier algal blooms on the Greenland Ice Sheet, Nat. Commun., 12, 570, https://doi.org/10.1038/s41467-020-20627-w, 2021.
Meinander, O., Kontu, A., Virkkula, A., Arola, A., Backman, L., Dagsson-Waldhauserová, P., Järvinen, O., Manninen, T., Svensson, J., de Leeuw, G., and Leppäranta, M.: Brief communication: Light-absorbing impurities can reduce the density of melting snow, The Cryosphere, 8, 991–995, https://doi.org/10.5194/tc-8-991-2014, 2014.
Meinander, O., Dagsson-Waldhauserova, P., Amosov, P., Aseyeva, E., Atkins, C., Baklanov, A., Baldo, C., Barr, S. L., Barzycka, B., Benning, L. G., Cvetkovic, B., Enchilik, P., Frolov, D., Gassó, S., Kandler, K., Kasimov, N., Kavan, J., King, J., Koroleva, T., Krupskaya, V., Kulmala, M., Kusiak, M., Lappalainen, H. K., Laska, M., Lasne, J., Lewandowski, M., Luks, B., McQuaid, J. B., Moroni, B., Murray, B., Möhler, O., Nawrot, A., Nickovic, S., O'Neill, N. T., Pejanovic, G., Popovicheva, O., Ranjbar, K., Romanias, M., Samonova, O., Sanchez-Marroquin, A., Schepanski, K., Semenkov, I., Sharapova, A., Shevnina, E., Shi, Z., Sofiev, M., Thevenet, F., Thorsteinsson, T., Timofeev, M., Umo, N. S., Uppstu, A., Urupina, D., Varga, G., Werner, T., Arnalds, O., and Vukovic Vimic, A.: Newly identified climatically and environmentally significant high-latitude dust sources, Atmos. Chem. Phys., 22, 11889–11930, https://doi.org/10.5194/acp-22-11889-2022, 2022.
Möller, R., Möller, M., Kukla, P. A., and Schneider, C.: Impact of supraglacial deposits of tephra from Grímsvötn volcano, Iceland, on glacier ablation, J. Glaciol., 62, 933–943, https://doi.org/10.1017/jog.2016.82, 2016.
Möller, R., Möller, M., Kukla, P. A., and Schneider, C.: Modulation of glacier ablation by tephra coverage from Eyjafjallajökull and Grímsvötn volcanoes, Iceland: an automated field experiment, Earth Syst. Sci. Data, 10, 53–60, https://doi.org/10.5194/essd-10-53-2018, 2018.
Moosmuller, H., Engelbrecht, J. P., Skiba, M., Frey, G., Chakrabarty, R. K., and Arnott, W. P.: Single scattering albedo of fine mineral dust aerosols controlled by iron concentration, J. Geophys. Res.-Atmos., 117, D11210, https://doi.org/10.1029/2011jd016909, 2012.
Moroni, B., Arnalds, O., Dagsson-Waldhauserova, P., Crocchianti, S., Vivani, R., and Cappelletti, D.: Mineralogical and Chemical Records of Icelandic Dust Sources Upon Ny-angstrom lesund (Svalbard Islands), Front. Earth Sci., 6, UNSP 187, https://doi.org/10.3389/feart.2018.00187, 2018.
Morrison, H., de Boer, G., Feingold, G., Harrington, J., Shupe, M. D., and Sulia, K.: Resilience of persistent Arctic mixed-phase clouds, Nat. Geosci., 5, 11–17, https://doi.org/10.1038/ngeo1332, 2012.
Moskowitz, B. M., Reynolds, R. L., Goldstein, H. L., Berquo, T. S., Kokaly, R. F., and Bristow, C. S.: Iron oxide minerals in dust-source sediments from the Bodele Depression, Chad: Implications for radiative properties and Fe bioavailability of dust plumes from the Sahara, Aeolian Res., 22, 93–106, https://doi.org/10.1016/j.aeolia.2016.07.001, 2016.
Müller, T., Schladitz, A., Kandler, K., and Wiedensohler, A.: Spectral particle absorption coefficients, single scattering albedos and imaginary parts of refractive indices from ground based in situ measurements at Cape Verde Island during SAMUM-2, Tellus B, 63, 573–588, https://doi.org/10.1111/j.1600-0889.2011.00572.x, 2011.
Murray, B. J., Carslaw, K. S., and Field, P. R.: Opinion: Cloud-phase climate feedback and the importance of ice-nucleating particles, Atmos. Chem. Phys., 21, 665–679, https://doi.org/10.5194/acp-21-665-2021, 2021.
Nakashima, M. and Dagsson-Waldhauserová, P.: A 60 Year Examination of Dust Day Activity and Its Contributing Factors From Ten Icelandic Weather Stations From 1950 to 2009, Front. Earth Sci., 6, UNSP 245, https://doi.org/10.3389/feart.2018.00245, 2019.
Okada, K., Heintzenberg, J., Kai, K. J., and Qin, Y.: Shape of atmospheric mineral particles collected in three Chinese arid-regions, Geophys. Res. Lett., 28, 3123–3126, https://doi.org/10.1029/2000gl012798, 2001.
Patterson, E. M., Gillette, D. A., and Stockton, B. H.: Complex index of refraction between 300 and 700 nm for Saharan aerosols, J. Geophys. Res., 82, 3153–3160, https://doi.org/10.1029/JC082i021p03153, 1977.
Peltoniemi, J. I., Gritsevich, M., Hakala, T., Dagsson-Waldhauserová, P., Arnalds, Ó., Anttila, K., Hannula, H.-R., Kivekäs, N., Lihavainen, H., Meinander, O., Svensson, J., Virkkula, A., and de Leeuw, G.: Soot on Snow experiment: bidirectional reflectance factor measurements of contaminated snow, The Cryosphere, 9, 2323–2337, https://doi.org/10.5194/tc-9-2323-2015, 2015.
Prospero, J. M., Bullard, J. E., and Hodgkins, R.: High-Latitude Dust Over the North Atlantic: Inputs from Icelandic Proglacial Dust Storms, Science, 335, 1078–1082, https://doi.org/10.1126/science.1217447, 2012.
Querry, M. R.: Magnetite, Refractive index database, https://refractiveindex.info/?shelf=main&book=Fe3O4& (last access: 2 January 2020), 1985.
Redmond, H. E., Dial, K. D., and Thompson, J. E.: Light scattering and absorption by wind blown dust: Theory, measurement, and recent data, Aeolian Res., 2, 5–26, https://doi.org/10.1016/j.aeolia.2009.09.002, 2010.
Reed, B. E., Peters, D. M., McPheat, R., and Grainger, R. G.: The Complex Refractive Index of Volcanic Ash Aerosol Retrieved From Spectral Mass Extinction, J. Geophys. Res.-Atmos., 123, 1339–1350, https://doi.org/10.1002/2017jd027362, 2018.
Renard, J.-B., Dulac, F., Berthet, G., Lurton, T., Vignelles, D., Jégou, F., Tonnelier, T., Jeannot, M., Couté, B., Akiki, R., Verdier, N., Mallet, M., Gensdarmes, F., Charpentier, P., Mesmin, S., Duverger, V., Dupont, J.-C., Elias, T., Crenn, V., Sciare, J., Zieger, P., Salter, M., Roberts, T., Giacomoni, J., Gobbi, M., Hamonou, E., Olafsson, H., Dagsson-Waldhauserova, P., Camy-Peyret, C., Mazel, C., Décamps, T., Piringer, M., Surcin, J., and Daugeron, D.: LOAC: a small aerosol optical counter/sizer for ground-based and balloon measurements of the size distribution and nature of atmospheric particles – Part 1: Principle of measurements and instrument evaluation, Atmos. Meas. Tech., 9, 1721–1742, https://doi.org/10.5194/amt-9-1721-2016, 2016.
Richards-Thomas, T., McKenna-Neuman, C., and Power, I. M.: Particle-scale characterization of volcaniclastic dust sources within Iceland, Sedimentology, 68, 1137–1158, https://doi.org/10.1111/sed.12821, 2020.
Sanchez-Marroquin, A., Arnalds, O., Baustian-Dorsi, K. J., Browse, J., Dagsson-Waldhauserova, P., Harrison, A. D., Maters, E. C., Pringle, K. J., Vergara-Temprado, J., Burke, I. T., McQuaid, J. B., Carslaw, K. S., and Murray, B. J.: Iceland is an episodic source of atmospheric ice-nucleating particles relevant for mixed-phase clouds, Sci. Adv., 6, eaba8137, https://doi.org/10.1126/sciadv.aba8137, 2020.
Schmale, J., Zieger, P., and Ekman, A. M. L.: Aerosols in current and future Arctic climate, Nat. Clim. Change, 11, 95–105, https://doi.org/10.1038/s41558-020-00969-5, 2021.
Shi, Y., Liu, X., Wu, M., Zhao, X., Ke, Z., and Brown, H.: Relative importance of high-latitude local and long-range-transported dust for Arctic ice-nucleating particles and impacts on Arctic mixed-phase clouds, Atmos. Chem. Phys., 22, 2909–2935, https://doi.org/10.5194/acp-22-2909-2022, 2022.
Shi, Z., Krom, M. D., Bonneville, S., Baker, A. R., Bristow, C., Drake, N., Mann, G., Carslaw, K., McQuaid, J. B., Jickells, T., and Benning, L. G.: Influence of chemical weathering and aging of iron oxides on the potential iron solubility of Saharan dust during simulated atmospheric processing, Global Biogeochem. Cy., 25, GB2010, https://doi.org/10.1029/2010gb003837, 2011.
Sinyuk, A., Torres, O., and Dubovik, O.: Combined use of satellite and surface observations to infer the imaginary part of refractive index of Saharan dust, Geophys. Res. Lett., 30, 1081, https://doi.org/10.1029/2002GL016189, 2003.
Smith, R. J.: Use and misuse of the reduced major axis for line-fitting, Am. J. Phys. Anthropol., 140, 476–486, https://doi.org/10.1002/ajpa.21090, 2009.
Sokolik, I. N. and Toon, O. B.: Incorporation of mineralogical composition into models of the radiative properties of mineral aerosol from UV to IR wavelengths, J. Geophys. Res.-Atmos., 104, 9423–9444, https://doi.org/10.1029/1998jd200048, 1999.
Song, Y. G., Chen, X. L., Qian, L. B., Li, C. X., Li, Y., Li, X. X., Chang, H., and An, Z. S.: Distribution and composition of loess sediments in the Ili Basin, Central Asia, Quatern. Int., 334, 61–73, https://doi.org/10.1016/j.quaint.2013.12.053, 2014.
Sumlin, B. J., Heinson, W. R., and Chakrabarty, R. K.: Retrieving the aerosol complex refractive index using PyMieScatt: A Mie computational package with visualization capabilities, J. Quant. Spectrosc. Ra., 205, 127–134, https://doi.org/10.1016/j.jqsrt.2017.10.012, 2018.
Toledano, C., Bennouna, Y., Cachorro, V., de Galisteo, J. P. O., Stohl, A., Stebel, K., Kristiansen, N. I., Olmo, F. J., Lyamani, H., Obregon, M. A., Estelles, V., Wagner, F., Baldasano, J. M., Gonzalez-Castanedo, Y., Clarisse, L., and de Frutos, A. M.: Aerosol properties of the Eyjafjallajökull ash derived from sun photometer and satellite observations over the Iberian Peninsula, Atmos. Environ., 48, 22–32, https://doi.org/10.1016/j.atmosenv.2011.09.072, 2012.
Vergara-Temprado, J., Miltenberger, A. K., Furtado, K., Grosvenor, D. P., Shipway, B. J., Hill, A. A., Wilkinson, J. M., Field, P. R., Murray, B. J., and Carslaw, K. S.: Strong control of Southern Ocean cloud reflectivity by ice-nucleating particles, P. Natl. Acad. Sci. USA, 115, 2687–2692, https://doi.org/10.1073/pnas.1721627115, 2018.
Volz, F. E.: Longwave refractive index of atmospheric aerosol substances, Appl. Optics, 11, 755–759, 1972.
von der Weiden, S.-L., Drewnick, F., and Borrmann, S.: Particle Loss Calculator – a new software tool for the assessment of the performance of aerosol inlet systems, Atmos. Meas. Tech., 2, 479–494, https://doi.org/10.5194/amt-2-479-2009, 2009.
Wang, J., Doussin, J. F., Perrier, S., Perraudin, E., Katrib, Y., Pangui, E., and Picquet-Varrault, B.: Design of a new multi-phase experimental simulation chamber for atmospheric photosmog, aerosol and cloud chemistry research, Atmos. Meas. Tech., 4, 2465–2494, https://doi.org/10.5194/amt-4-2465-2011, 2011.
Weingartner, E., Saathoff, H., Schnaiter, M., Streit, N., Bitnar, B., and Baltensperger, U.: Absorption of light by soot particles: determination of the absorption coefficient by means of aethalometers, J. Aerosol Sci., 34, 1445–1463, https://doi.org/10.1016/S0021-8502(03)00359-8, 2003.
Weinzierl, B., Sauer, D., Minikin, A., Reitebuch, O., Dahlkotter, F., Mayer, B., Emde, C., Tegen, I., Gasteiger, J., Petzold, A., Veira, A., Kueppers, U., and Schumann, U.: On the visibility of airborne volcanic ash and mineral dust from the pilot's perspective in flight, Phys. Chem. Earth, 45–46, 87–102, https://doi.org/10.1016/j.pce.2012.04.003, 2012.
Wendisch, M. and Brenguier, J.-L.: Airborne Measurements for Environmental Research: Methods and Instruments, Wiley-VCH Verlag GmbH & Co. KGaA, Weinheim, https://doi.org/10.1002/9783527653218, 2013.
Wittmann, M., Groot Zwaaftink, C. D., Steffensen Schmidt, L., Guðmundsson, S., Pálsson, F., Arnalds, O., Björnsson, H., Thorsteinsson, T., and Stohl, A.: Impact of dust deposition on the albedo of Vatnajökull ice cap, Iceland, The Cryosphere, 11, 741–754, https://doi.org/10.5194/tc-11-741-2017, 2017.
Woods, T. N., Chamberlin, P. C., Harder, J. W., Hock, R. A., Snow, M., Eparvier, F. G., Fontenla, J., McClintock, W. E., and Richard, E. C.: Solar Irradiance Reference Spectra (SIRS) for the 2008 Whole Heliosphere Interval (WHI), Geophys. Res. Lett., 36, L01101, https://doi.org/10.1029/2008GL036373, 2009.
Zubko, N., Munoz, O., Zubko, E., Gritsevich, M., Escobar-Cerezo, J., Berg, M. J., and Peltoniemi, J.: Light scattering from volcanic-sand particles in deposited and aerosol form, Atmos. Environ., 215, 116813, https://doi.org/10.1016/j.atmosenv.2019.06.051, 2019.
- Abstract
- Introduction
- Methodology
- Results
- Discussion
- Concluding remarks: implications for the radiative effect
- Appendix A: Retrieval of the aerosol size distribution
- Appendix B: Particle loss correction
- Appendix C: Truncation correction for total scattering
- Appendix D: Calculation of relevant parameters to correct the attenuation coefficient
- Code and data availability
- Author contributions
- Competing interests
- Disclaimer
- Acknowledgements
- Financial support
- Review statement
- References
- Supplement