the Creative Commons Attribution 4.0 License.
the Creative Commons Attribution 4.0 License.
 | 17 Jul 2023
Examining TROPOMI formaldehyde to nitrogen dioxide ratios in the Lake Michigan region: implications for ozone exceedances
Juanito Jerrold Mariano Acdan
Robert Bradley Pierce
Angela F. Dickens
Zachariah Adelman
Tsengel Nergui
Surface-level ozone (O3) is a secondary air pollutant that has adverse effects on human health. In the troposphere, O3 is produced in complex cycles of photochemical reactions involving nitrogen oxides (NOx) and volatile organic compounds (VOCs). Determining if O3 levels will be decreased by lowering NOx emissions (“NOx-sensitive”), VOC emissions (“VOC-sensitive”), or both (“the transition zone”) can be done by using the formaldehyde (HCHO; a VOC species) to nitrogen dioxide (NO2; a component of NOx) concentration ratio (; “FNR”). Generally, lower FNR values indicate VOC sensitivity, while higher values indicate NOx sensitivity. Despite being a highly populated region with coastal O3 air quality issues, the Lake Michigan region in the United States, including the Chicago, Illinois, metropolitan area (CMA), remains relatively understudied, especially from the satellite perspective. In this work, we present the first study that utilizes TROPOspheric Monitoring Instrument (TROPOMI) satellite data over the Lake Michigan region from 2019–2021 to assess changes in O3 precursor levels and the inferred O3 chemistry sensitivity between (1) O3 season days and CMA O3 exceedance days and (2) weekdays and weekends. Higher NO2 vertical column densities (VCDs), HCHO VCDs, and FNR values are seen throughout the study domain on exceedance days, indicating generally more NOx-sensitive O3 chemistry. The largest change occurs in the areal extent of the transition zone, which decreases by 40 % during exceedance days. Major urban cores in the domain (e.g., Chicago, Illinois; Gary, Indiana; and Milwaukee, Wisconsin) remain VOC-sensitive on exceedance days as the higher NO2 VCDs in these areas counterbalance the regionally higher HCHO VCDs. Utilizing 10 m wind analysis data, we show that the lake breeze circulation is stronger on exceedance days. The strengthening of the lake breeze causes stronger convergence of the wind field along the southwestern Lake Michigan coastline, which can concentrate NO2 emissions originating in this area. This finding provides a possible explanation for the higher TROPOMI NO2 VCDs over the urban core of Chicago on exceedance days. Investigation of 2 m air temperature analysis data reveals that temperatures are higher on exceedance days, which explains the stronger lake breeze circulation and provides a possible cause for the higher TROPOMI HCHO VCDs over the entire region (due to increased temperature-dependent biogenic VOC emissions). Comparing weekdays and weekends, higher FNR values throughout much of the region indicate increasingly NOx-sensitive O3 chemistry on weekends. These changes are driven by lower NO2 VCDs in urban areas, particularly in Chicago, and higher HCHO VCDs in the southern part of the domain on weekends. Overall, our analyses suggest that VOC emissions controls in major urban areas and NOx emissions controls throughout the entire domain are necessary to decrease O3 levels in the Lake Michigan region.
- Article
(13650 KB) - Full-text XML
-
Supplement
(3330 KB) - BibTeX
- EndNote


Ground-level ozone (O3) is an air pollutant that is known for its harmful effects on public health. Acute exposure to elevated O3 levels can cause respiratory problems (e.g., asthma attacks), while chronic exposure can lead to premature death from respiratory and circulatory system illnesses (Jerrett et al., 2009; Turner et al., 2016; Nuvolone et al., 2018). To prevent such adverse effects, the United States Environmental Protection Agency (U.S. EPA) sets a National Ambient Air Quality Standard (NAAQS) for O3, which is currently 70 ppbv (parts per billion by volume) for the fourth-highest daily maximum 8 h average concentration (MDA8), averaged across 3 consecutive years (U.S. EPA, 2022a). The U.S. EPA designates counties in the US where O3 concentrations exceed the NAAQS as O3 nonattainment areas (NAAs), and these areas are required by law to develop State Implementation Plans (SIPs) to address the problem. One such region of the US that continues to be in violation of the O3 NAAQS is the Lake Michigan region, including NAAs in the states of Illinois, Indiana, Michigan, and Wisconsin (U.S. EPA, 2022b).
Developing strategies to decrease surface O3 levels is complicated because O3 is a secondary pollutant not directly emitted into the atmosphere. Tropospheric O3 production depends on a series of chain reactions involving the catalytic cycling of nitrogen oxides (NOx = NO + NO2) between nitric oxide (NO) and nitrogen dioxide (NO2) and reactive hydrogen species (HOx = OH + HO2 + RO2) between hydroxyl radicals (OH), hydroperoxyl radicals (HO2), and peroxy radicals (RO2) (National Research Council, 1991). The chain begins with reactions that produce HOx, most notably OH and HO2. The OH can then react with volatile organic compounds (VOCs) to produce RO2 or additional HO2. Finally, RO2 and HO2 can oxidize NO to NO2, which can be photolyzed to produce O3.
The termination of the O3 production chain is dependent on the relative levels of NOx and HOx. When NOx is low and HOx is high, HOx cycling is terminated by HOx + HOx reactions, one of which produces hydrogen peroxide (H2O2). In this “NOx-sensitive” regime, O3 production increases linearly with NOx (Milford et al., 1989; Sillman, 1999). NOx emissions reductions in this regime decrease the amount of NO available to react with RO2 and HO2, thus decreasing the rate of O3 production. When NOx is high and HOx is low, the O3 production chain is terminated by NOx + HOx reactions, one of which forms nitric acid (HNO3). In this “VOC-sensitive” regime, VOC emissions reductions decrease RO2 formation, leading to decreased O3 production; meanwhile, increased NOx emissions in this regime can suppress the rate of O3 formation through more NOx + HOx termination reactions (Milford et al., 1989; Sillman, 1999). In a third regime between VOC and NOx sensitivities (“the transition zone”), O3 production can be reduced by decreasing either or both VOC and NOx emissions (Duncan et al., 2010). More details about the O3 producing chemical cycles involving NOx and VOCs can be found in Jacob (1999, 2000), Thornton et al. (2002), Schroeder et al. (2017), and Vermeuel et al. (2019).
Overall, the production rate of O3 can be represented as a nonlinear function of the concentrations of NOx and VOCs (Haagen-Smit, 1952; Milford et al., 1989; Sillman, 1995). Knowing the O3 chemistry sensitivity within a geographical area is informative for regulatory agencies that develop NAAQS attainment strategies through NOx and VOC emissions control programs. In the Lake Michigan region, NOx emissions primarily come from anthropogenic fossil fuel combustion, such as diesel and gasoline vehicle usage and electricity generation (U.S. EPA, 2021a). VOC emissions come from both anthropogenic sources (e.g., industrial solvent application) and natural biogenic emissions from plants and crops (U.S. EPA, 2021a).
Ozone chemistry sensitivities can be identified through chemical concentration-based indicator ratios. Sillman (1995) identified as one of the most robust indicators for describing the loss of RO2 and HO2 () to the loss of NOx (), which are the processes that control ozone–NOx–VOC sensitivity. However, measurements of H2O2 and HNO3 are not regularly made (i.e., they are limited to a few field campaigns). Sillman (1995) also found that the formaldehyde (HCHO) to reactive nitrogen (NOy) ratio () is another viable indicator, though less robust than . HCHO can be used as a proxy for VOC reactivity because many VOC oxidation reactions in the O3 chemistry cycles produce HCHO (Sillman, 1995; Valin et al., 2016). Building upon Sillman's work, Tonnesen and Dennis (2000) found that (“FNR” for the rest of this paper) is another useful indicator of ozone–NOx–VOC sensitivity since HCHO and NO2 have similar lifetimes on the order of hours. Using species with similar lifetimes in the indicator ratio can represent the competing interactions between the various species that determine the sensitivity of local O3 production (Tonnesen and Dennis, 2000).
Table 1J20 FNR threshold values indicating different high O3 chemistry sensitivities for Chicago, Illinois, US.
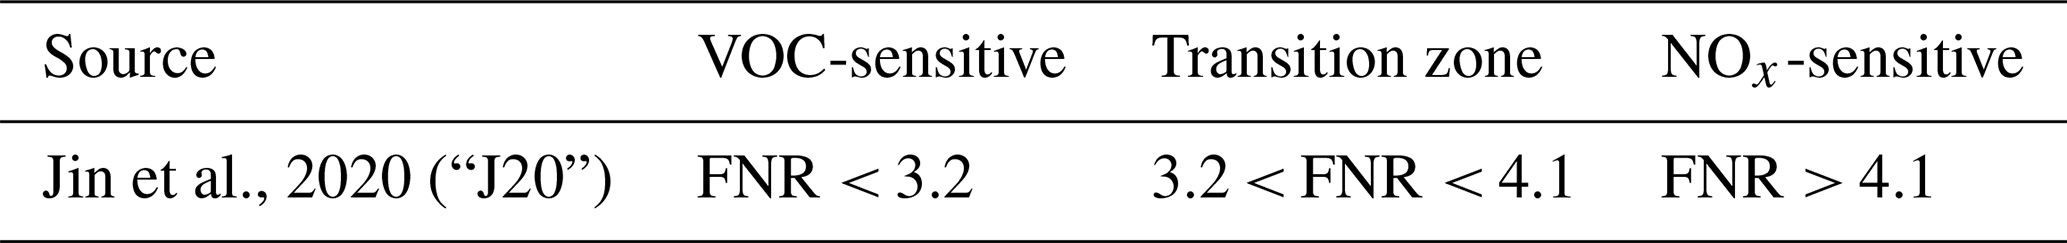
The FNR indicator ratio is well-suited for satellite data analyses because HCHO and NO2 column densities are both measurable from space. Satellite-derived FNRs from the Global Ozone Monitoring Experiment (GOME), SCanning Imaging Absorption spectroMeter for Atmospheric CartograpHY (SCIAMACHY), and Ozone Monitoring Instrument (OMI) have been used to infer ozone–NOx–VOC sensitivity for many regions around the world (Martin et al., 2004; Duncan et al., 2010; Jin and Holloway, 2015; Chang et al., 2016; Jin et al., 2017, 2020). Despite being applied in many analyses, the threshold FNR values used to distinguish between VOC-sensitive and NOx-sensitive O3 chemistry varies by study. Much of the early work in this line of research (e.g., Martin et al., 2004; Duncan et al., 2010) used models to estimate FNR threshold values. A more recent study by Jin et al. (2020; referred to as “J20” for the rest of this work) took a different approach by connecting satellite FNRs directly to ground monitoring data. The authors defined the transitional regime as the top 10 % of a third-order polynomial curve fitted by associating OMI-derived FNRs to in situ O3 exceedance probabilities (i.e., the number of surface observations exceeding 70 ppbv divided by the total number of observations). This approach determines threshold values that describe the sensitivity of high O3 levels to NOx and VOCs, which is different than previous modeling studies that reported thresholds describing the sensitivity of O3 production () to precursor levels. Table 1 displays the J20 FNR threshold values for different high O3 chemistry sensitivities.
In this work, we calculate 2019–2021 mean FNR values in the Lake Michigan region using retrievals from the TROPOspheric Monitoring Instrument (TROPOMI) on board the Sentinel-5 Precursor (S5P) satellite. We then analyze changes in the satellite-derived HCHO, NO2, and FNR values between O3 season days and O3 exceedance days as well as weekdays and weekends. We define May to September as the O3 season because this is the period in which most O3 exceedance days occur in the Chicago–Naperville–Elgin, Illinois–Indiana–Wisconsin, core-based statistical area (hereafter the Chicago metropolitan area, or “CMA” for short), which is the part of the Lake Michigan region that experiences the most exceedances. An O3 exceedance day is defined as a day in which at least one ground monitor measures an MDA8 O3 level above the U.S. EPA NAAQS (70 ppbv). We apply the J20 thresholds to the satellite FNRs to assess changes in the spatial distribution of O3 chemistry sensitivities. Further discussion on the use of the J20 thresholds is provided in the “Data and methodology” section. We supplement the FNR analyses with analyses of 10 m winds and 2 m air temperatures to provide meteorological context to the satellite-based results.
2.1 Satellite data: S5P TROPOMI
The S5P satellite was launched in October 2017 and has a polar, sun-synchronous orbit, providing global daily data approximately at 13:30 LST (local solar time) (Ludewig et al., 2020). TROPOMI is an ultraviolet–visible–near-infrared–shortwave-infrared nadir-viewing grating spectrometer on board the S5P satellite that measures trace gases in the atmosphere as well as cloud and aerosol properties (Veefkind et al., 2012; van Geffen et al., 2020). The original spatial resolution of TROPOMI data was 3.5 km × 7 km. Since August 2019, the spatial resolution has been upgraded to 3.5 km × 5.5 km (van Geffen et al., 2020). To calculate satellite FNRs, we utilize level 2 (L2) TROPOMI NO2 and HCHO tropospheric vertical column density (VCD) retrievals for the O3 seasons of 2019, 2020, and 2021.
For TROPOMI NO2, we used S5P Product Algorithm Laboratory (PAL) retrievals (S5P-PAL; Koninklijk Nederlands Meteorologisch Instituut, 2021). The S5P-PAL NO2 dataset is a reprocessing of the official TROPOMI NO2 data product using the v02.03.01 processor to provide a harmonized dataset from April 2018 to September 2021 (the official product switched processor versions in December 2020, introducing a discontinuity). Details regarding the TROPOMI NO2 tropospheric VCD retrieval algorithm are found in van Geffen et al. (2022a). The total uncertainty in satellite NO2 tropospheric VCD retrievals is estimated to be between 15 %–50 % for larger columns over continental areas (Boersma et al., 2018; van Geffen et al., 2022a). Van Geffen et al. (2022b) found that version 1 of TROPOMI NO2 tropospheric VCD data had an average bias of −32 % and version 2 had an average bias of −23 % (i.e., are 32 % and 23 % too low, respectively) when compared to ground-based tropospheric column measurements. This improvement is largely due to a significant increase in tropospheric NO2 for cloud-free scenes (Eskes and Eichmann, 2022).
For HCHO, we used versions 1 and 2 of the official TROPOMI data product (German Aerospace Center, 2019, 2020). The TROPOMI HCHO processor changed from version 1 to 2 in July 2020, with the major changes including an improved background correction and an updated quality assurance value (qa_value) determination (De Smedt et al., 2022). Unlike NO2, no harmonized TROPOMI HCHO data product is available that includes our entire study period, restricting us to use both versions. Specifics regarding the TROPOMI HCHO tropospheric VCD retrieval algorithm can be found in De Smedt et al. (2018). The total uncertainty in HCHO tropospheric VCD retrievals is currently estimated to be between 30 %–60 % in polluted conditions (De Smedt et al., 2021). TROPOMI HCHO data are systematically biased by approximately −25 % (i.e., are 25 % too low) for HCHO columns larger than 8 × 10¹⁵ (molecules per square centimeter) when compared to ground-based column measurements (De Smedt et al., 2021).
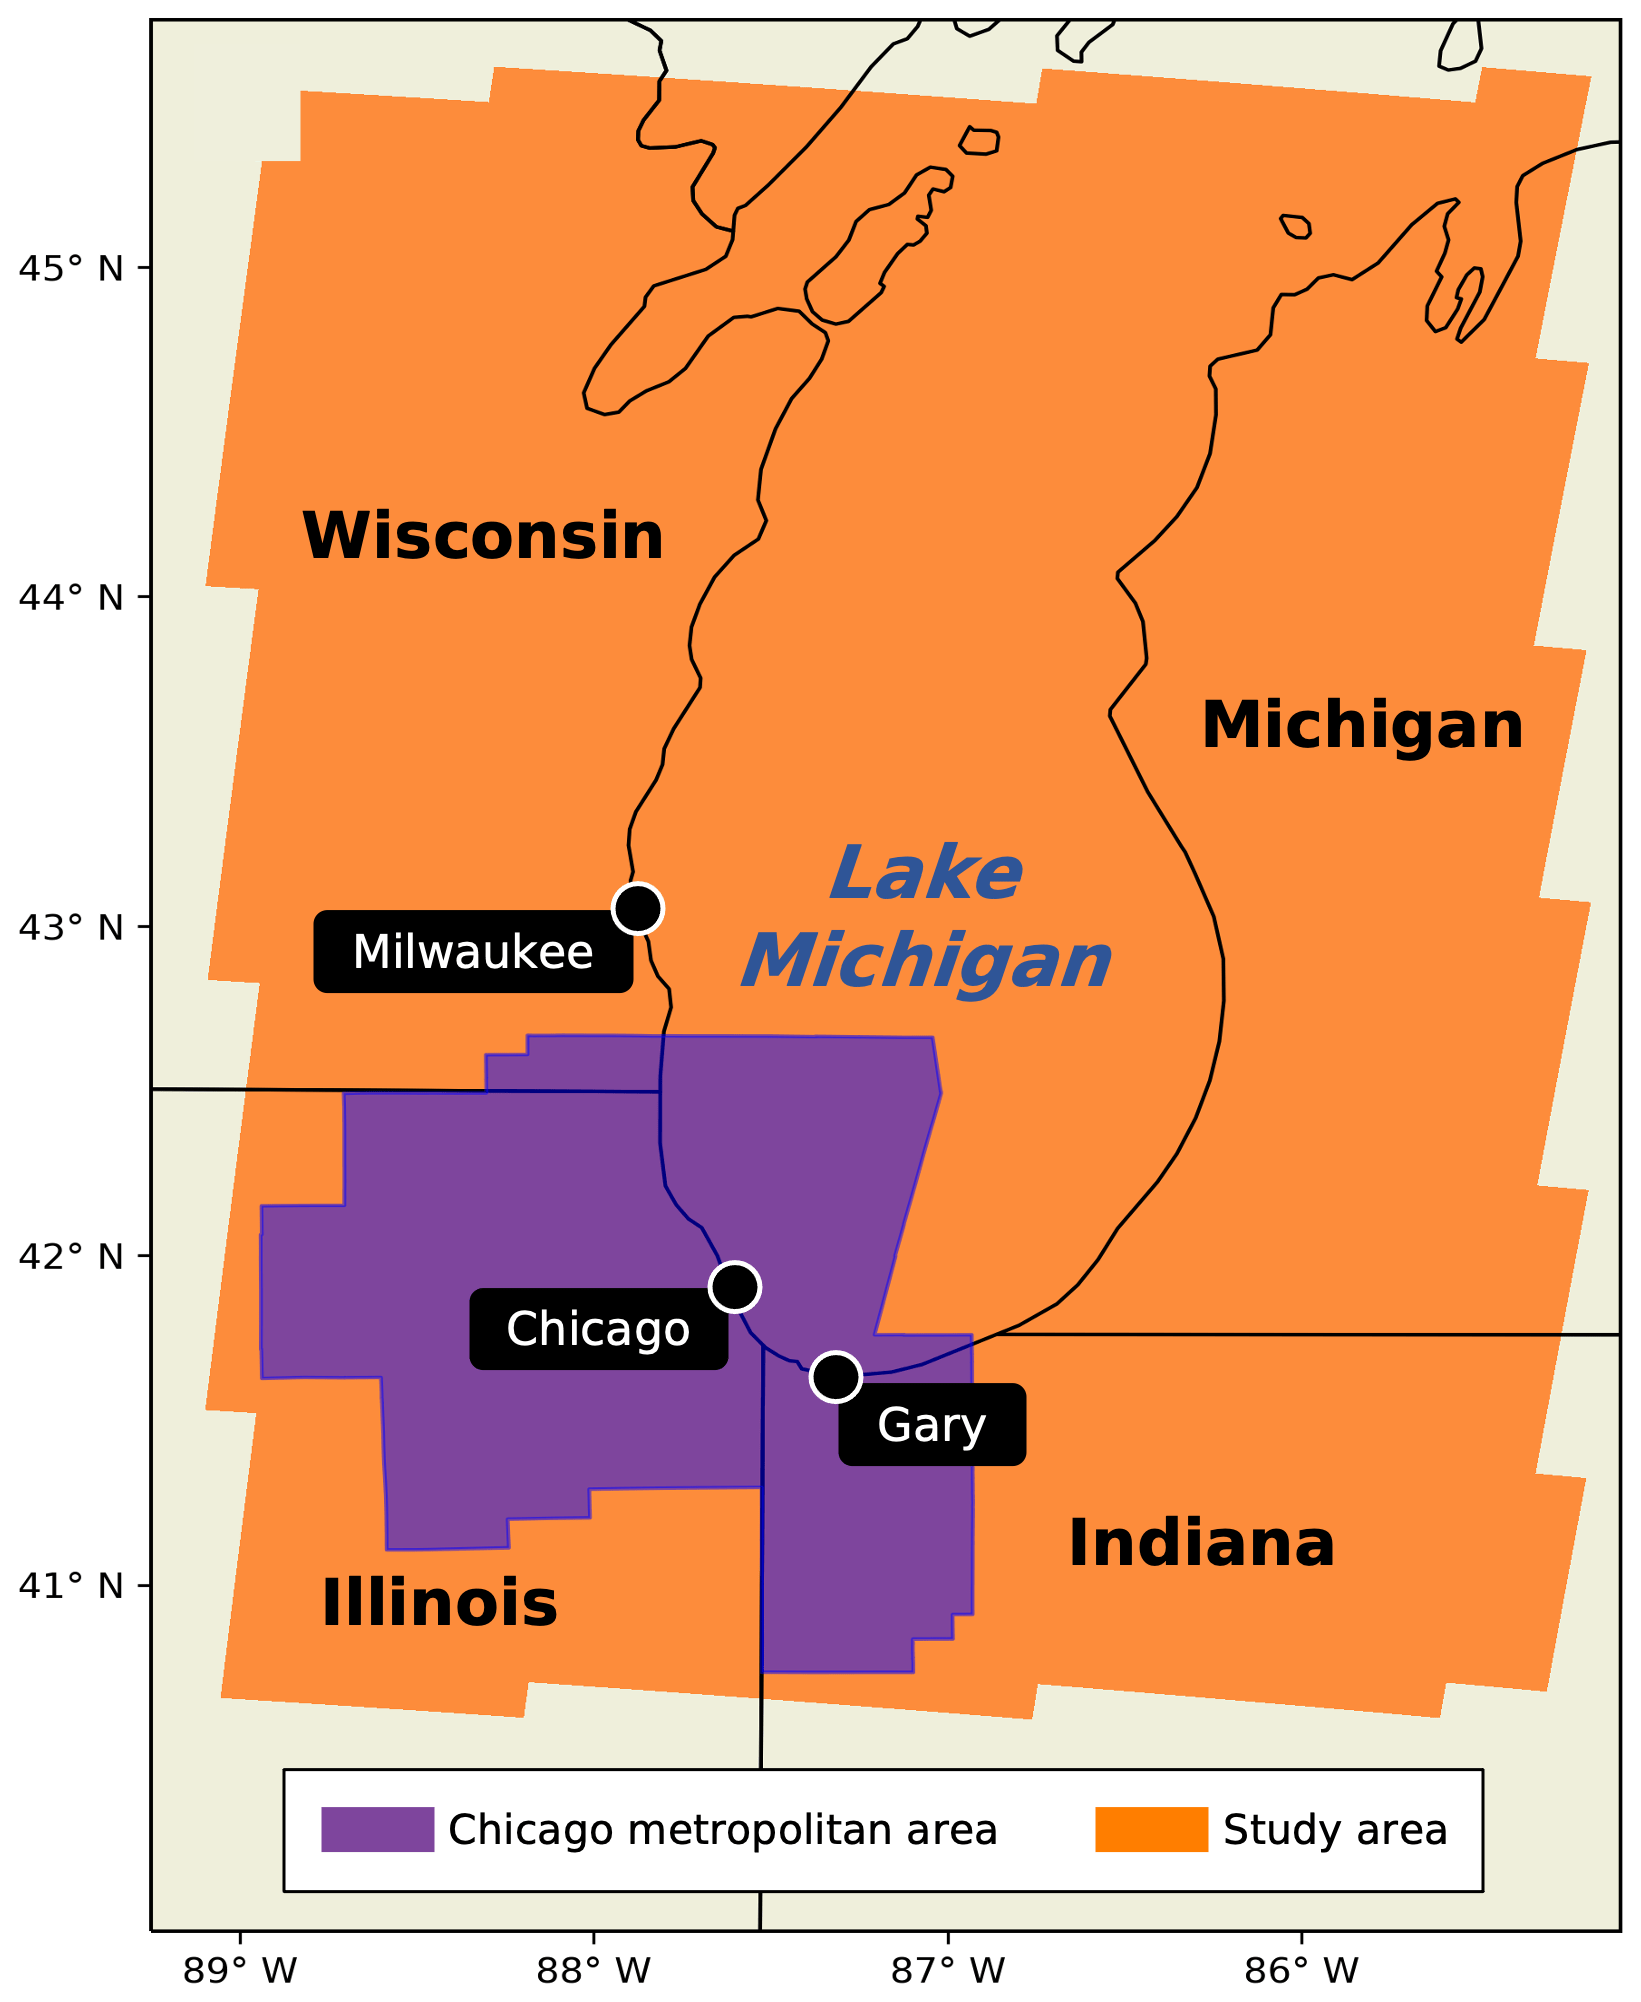
Figure 1Map of the Lake Michigan region with the study area highlighted in orange. The Chicago metropolitan area, highlighted in purple, is part of the study area. The locations of cities mentioned in this work are denoted by black dots outlined in white.
2.1.1 Errors associated with FNRs derived from S5P TROPOMI data
The average negative bias of TROPOMI HCHO VCD data results in lower FNR values, which would incorrectly indicate more VOC-sensitive O3 chemistry than what is “true”. Oppositely, the average negative bias of TROPOMI NO2 VCD data results in higher FNR values, which would incorrectly indicate more NOx sensitivity. Souri et al. (2023) provide a robust discussion on the errors associated with using satellite-derived FNRs to indicate O3 sensitivity, which they break down into four parts: (1) chemistry error, (2) the column-to-planetary boundary layer transition, (3) the spatial representation error, and (4) the satellite retrieval error. They find that the satellite retrieval error is often the largest contributor to the overall error in FNR values, which can be estimated using Eq. (15) in Souri et al. (2023). Using the average bias values for HCHO (−25 %) and NO2 (−23 %) in that equation, we expect the average relative error in the FNR values presented in this work (due to retrieval error) to be approximately 34 %. Souri et al. (2023) also report that the total combined error in FNRs in urban areas was relatively small (< 50 %) compared to those of more “pristine” environments (> 100 %). For our study, this implies that FNRs over urban areas, such as Chicago, have lower errors than those over more rural areas with less pollution.
2.2 Satellite data processing: S5P TROPOMI composites
TROPOMI retrievals of HCHO are primarily derived from the instrument's spectral Band 3 (range: 310–405 nm), while NO2 retrievals are derived from spectral Band 4 (range: 405–500 nm) (Veefkind et al., 2012; De Smedt et al., 2018; van Geffen et al., 2022a). Both bands have a minimum signal-to-noise ratio (SNR) between 800 and 1000 (Veefkind et al., 2012). However, HCHO has an optical density that is an order of magnitude smaller than that of NO2 because the spectral band its retrieval is derived from is in the UV range where Rayleigh scattering and O3 absorption occur (De Smedt et al., 2018). As a result, individual HCHO retrievals are noisier than NO2 retrievals. Despite lower-quality individual retrievals, Vigouroux et al. (2020) found that monthly mean TROPOMI HCHO VCD composites correlate well with ground-based Fourier-transform infrared station measurements of HCHO VCDs, providing confidence that the precision of TROPOMI measurements allows the seasonal variability in HCHO levels to be captured. To reduce the impacts of noisy TROPOMI HCHO retrievals and to allow for the analysis of general spatial patterns in FNR values, we composited TROPOMI HCHO and NO2 data on seasonal timescales (see Table 2 for more details). We constructed gridded mean TROPOMI HCHO and NO2 “clear sky” (cloud radiance fraction < 0.5) tropospheric VCD composites using quality-controlled L2 retrievals based on the recommended qa_value > 0.50 for HCHO (De Smedt et al., 2022) and qa_value > 0.75 for NO2 (Eskes and Eichmann, 2022). The grid onto which the TROPOMI data were composited has a spatial resolution of 12 km × 12 km covering the continental United States with a Lambert conformal conic projection. The composites were subset to the Lake Michigan region (latitude bounds: 40.6 to 45.5∘ N; longitude bounds: 89.1 to 85.35∘ W) for analysis (Fig. 1). Note that we used a grid with a coarser spatial resolution than the original TROPOMI pixel footprint based on a sensitivity test using a 4 km × 4 km grid. This sensitivity test involved identifying a region of fairly uniform HCHO and NO2 in the 12 km composites and then comparing absolute differences between nearest neighbors (“noise”) to the mean value within that region in both the 4 and 12 km composites. The estimated “noise” level was 3.6 times higher for HCHO, 2.6 times higher for NO2, and 3 times higher for FNR in the 4 km composites compared to the 12 km composites.
Table 2Categories of TROPOMI data composites created in this study.
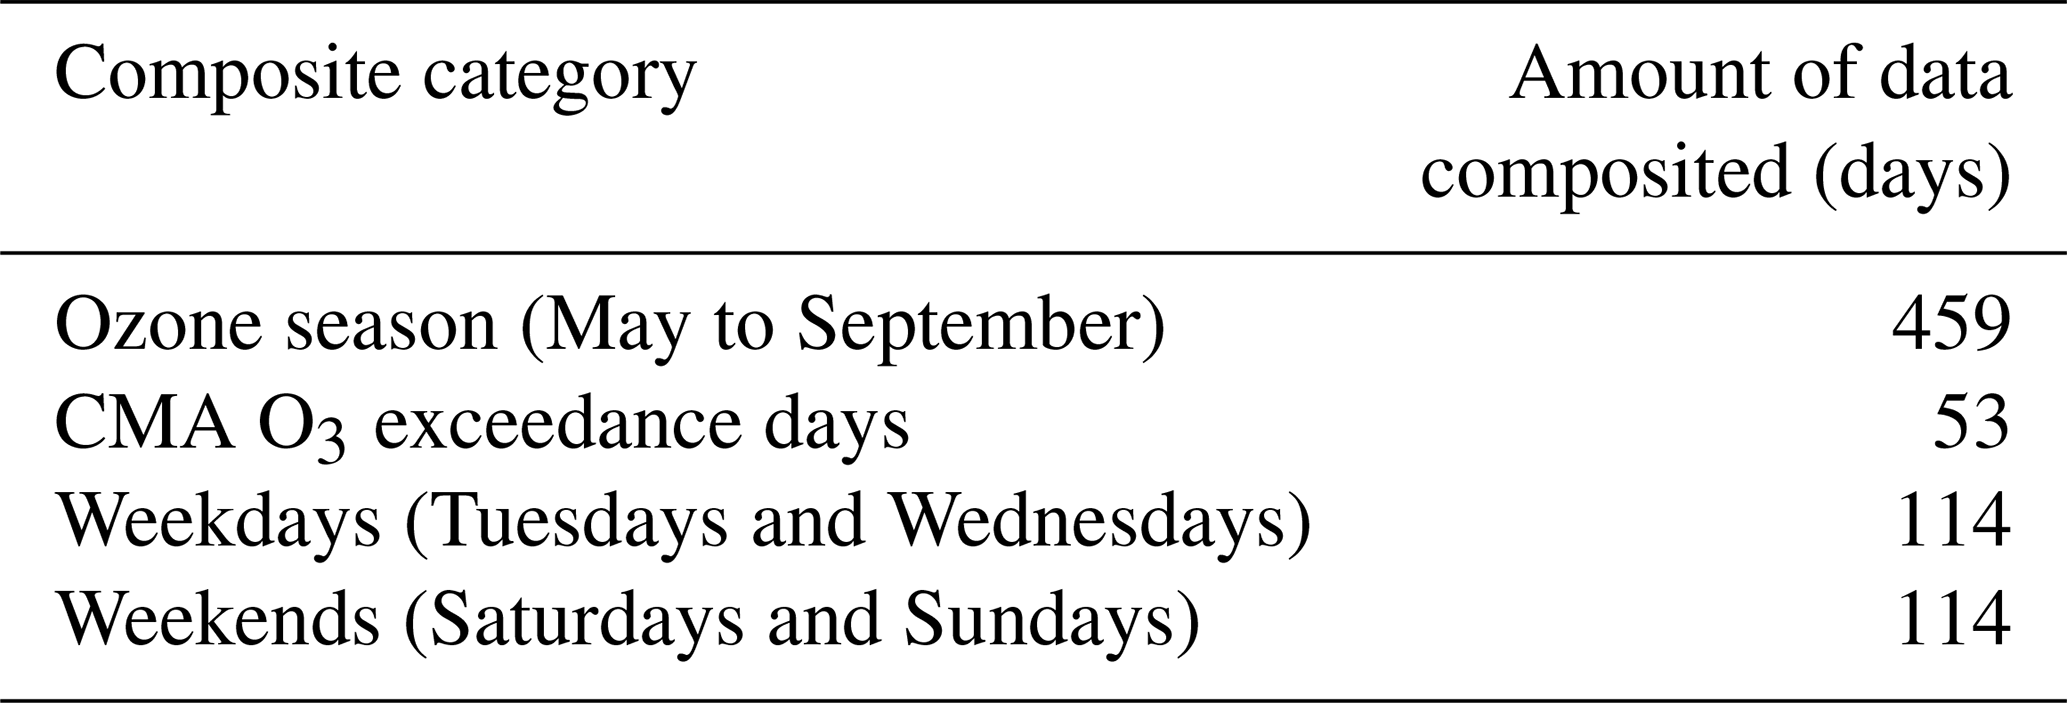
We produced TROPOMI HCHO and NO2 tropospheric VCD composites for four distinct categories: (1) all O3 season days, (2) O3 exceedance days, (3) weekdays, and (4) weekends (Table 2). In the compositing process, the value assigned to each grid cell is the average of all TROPOMI pixels that fall into the grid cell using a nearest-neighbor approach. To create the O3 season composite, we used TROPOMI data from the O3 seasons (May to September) for the years 2019, 2020, and 2021. Next, we created the O3 exceedance day composite by using satellite data only on days in which at least one ground monitor in the U.S. EPA Air Quality System (AQS) within the Chicago metropolitan area (CMA) measured an MDA8 O3 value greater than the NAAQS 70 ppbv standard (U.S. EPA, 2021b). For this composite, we deemed the CMA as representative of the Lake Michigan domain since it is the area that experiences the most O3 exceedances in the region. The exceedance day composite included 53 d of TROPOMI data. See Tables S1 and S2 in the Supplement for the individual dates of O3 exceedance days and their distributions by year and day of week. The weekday and weekend composites were created following a similar procedure as that for the O3 season but using Tuesday and Wednesday data for the weekday composite and Saturday and Sunday data for the weekend composite. Finally, FNR composites for all categories were generated by dividing the HCHO composite values by the NO2 composite values.
2.3 Meteorological data composites
To provide meteorological context to the FNR analyses, we created composites of 2 m air temperatures and 10 m winds using the same methodology described in Sect. 2.2. The temperature data come from the National Centers for Environmental Prediction (NCEP) North American Mesoscale (NAM) 12 km Analysis dataset (NCEP, 2015). The 10 m east–west (U) and north–south (V) wind data originally come from the European Centre for Medium-Range Weather Forecasts (ECMWF) Analysis dataset and are provided for each pixel within the TROPOMI L2 retrieval files (Eskes and Eichmann, 2022). We used the wind data to calculate the divergence of the composited wind field (units: s−1; Eq. 1) using fourth-order accurate approximations of the horizontal derivatives of U and V (Eqs. 2 and 3; adapted from Kalnay-Rivas and Hoitsma, 1979).
2.4 Analysis of data composites
The primary method of analysis is taking the difference between composites and interpreting what that means in terms of O3 chemistry sensitivity. Through analyzing difference plots, we can determine if changes in FNR values and O3 chemistry sensitivities are due to changes in HCHO or NO2 levels (or both). We also apply the J20 thresholds (Table 1) to the FNR composites. It must be noted that the J20 thresholds describe high O3 sensitivity to precursors (as opposed to sensitivity). This makes these thresholds less robust because O3 levels are affected by physical processes, such as transport and dry deposition, that vary in time and space. However, we still apply the J20 thresholds because we are primarily interested in providing a qualitative picture of the spatial differences in ozone chemistry sensitivity between all O3 season days and exceedance days and identifying the causes of those changes on the most polluted days. Furthermore, the J20 thresholds were derived using OMI data, which have different errors than TROPOMI data. Van Geffen et al. (2022b) found that TROPOMI NO2 VCDs are lower than OMI VCDs, which can lead to higher TROPOMI FNRs than those derived from OMI (and thus incorrect interpretations of more NOx sensitivity). TROPOMI data also have a higher spatial resolution than OMI data. We acknowledge that these differences may impact our interpretations of O3 chemistry sensitivity when we apply the J20 OMI-based thresholds to TROPOMI FNRs. Finally, we recognize that our 3-year composites contain data from years affected by the COVID-19 pandemic (e.g., 2020). We chose to combine 3 years of data so that the number of exceedance days is higher, making the composites more statistically robust. Where appropriate, we highlight any differences among the individual years and describe the possible impacts of the pandemic on O3 precursor levels.
2.4.1 Significance testing
We utilize the non-parametric Kolmogorov–Smirnoff (K-S) test to determine the significance of the differences between the O3 season and O3 exceedance day composites and the weekday and weekend composites. The null hypothesis of the test is that two sample distributions come from the same population, which we reject when the p-value is < 0.02 (98 % confidence level). We adopt the random sampling approach used by Lin et al. (2015) to conduct the K-S tests. More specifically, we conduct 1000 individual K-S tests on a random subsample of one-fourth of the total number of domain values (without replacement) for each paired composite. When the median p-value of the 1000 K-S tests is < 0.02, we interpret the results as indicating a significant difference between the two distributions. Tables S3 and S4 contain detailed results, including the number of K-S tests with a significant difference, the median p-value of the 1000 tests, and subsample sizes.
3.1 Comparison of O3 season days and CMA O3 exceedance days
In this section we compare the O3 season and Chicago metropolitan area (CMA) O3 exceedance day composites. For context, there were 13, 20, and 20 ozone exceedance days in the CMA in 2019, 2020, and 2021, respectively (Table S1).
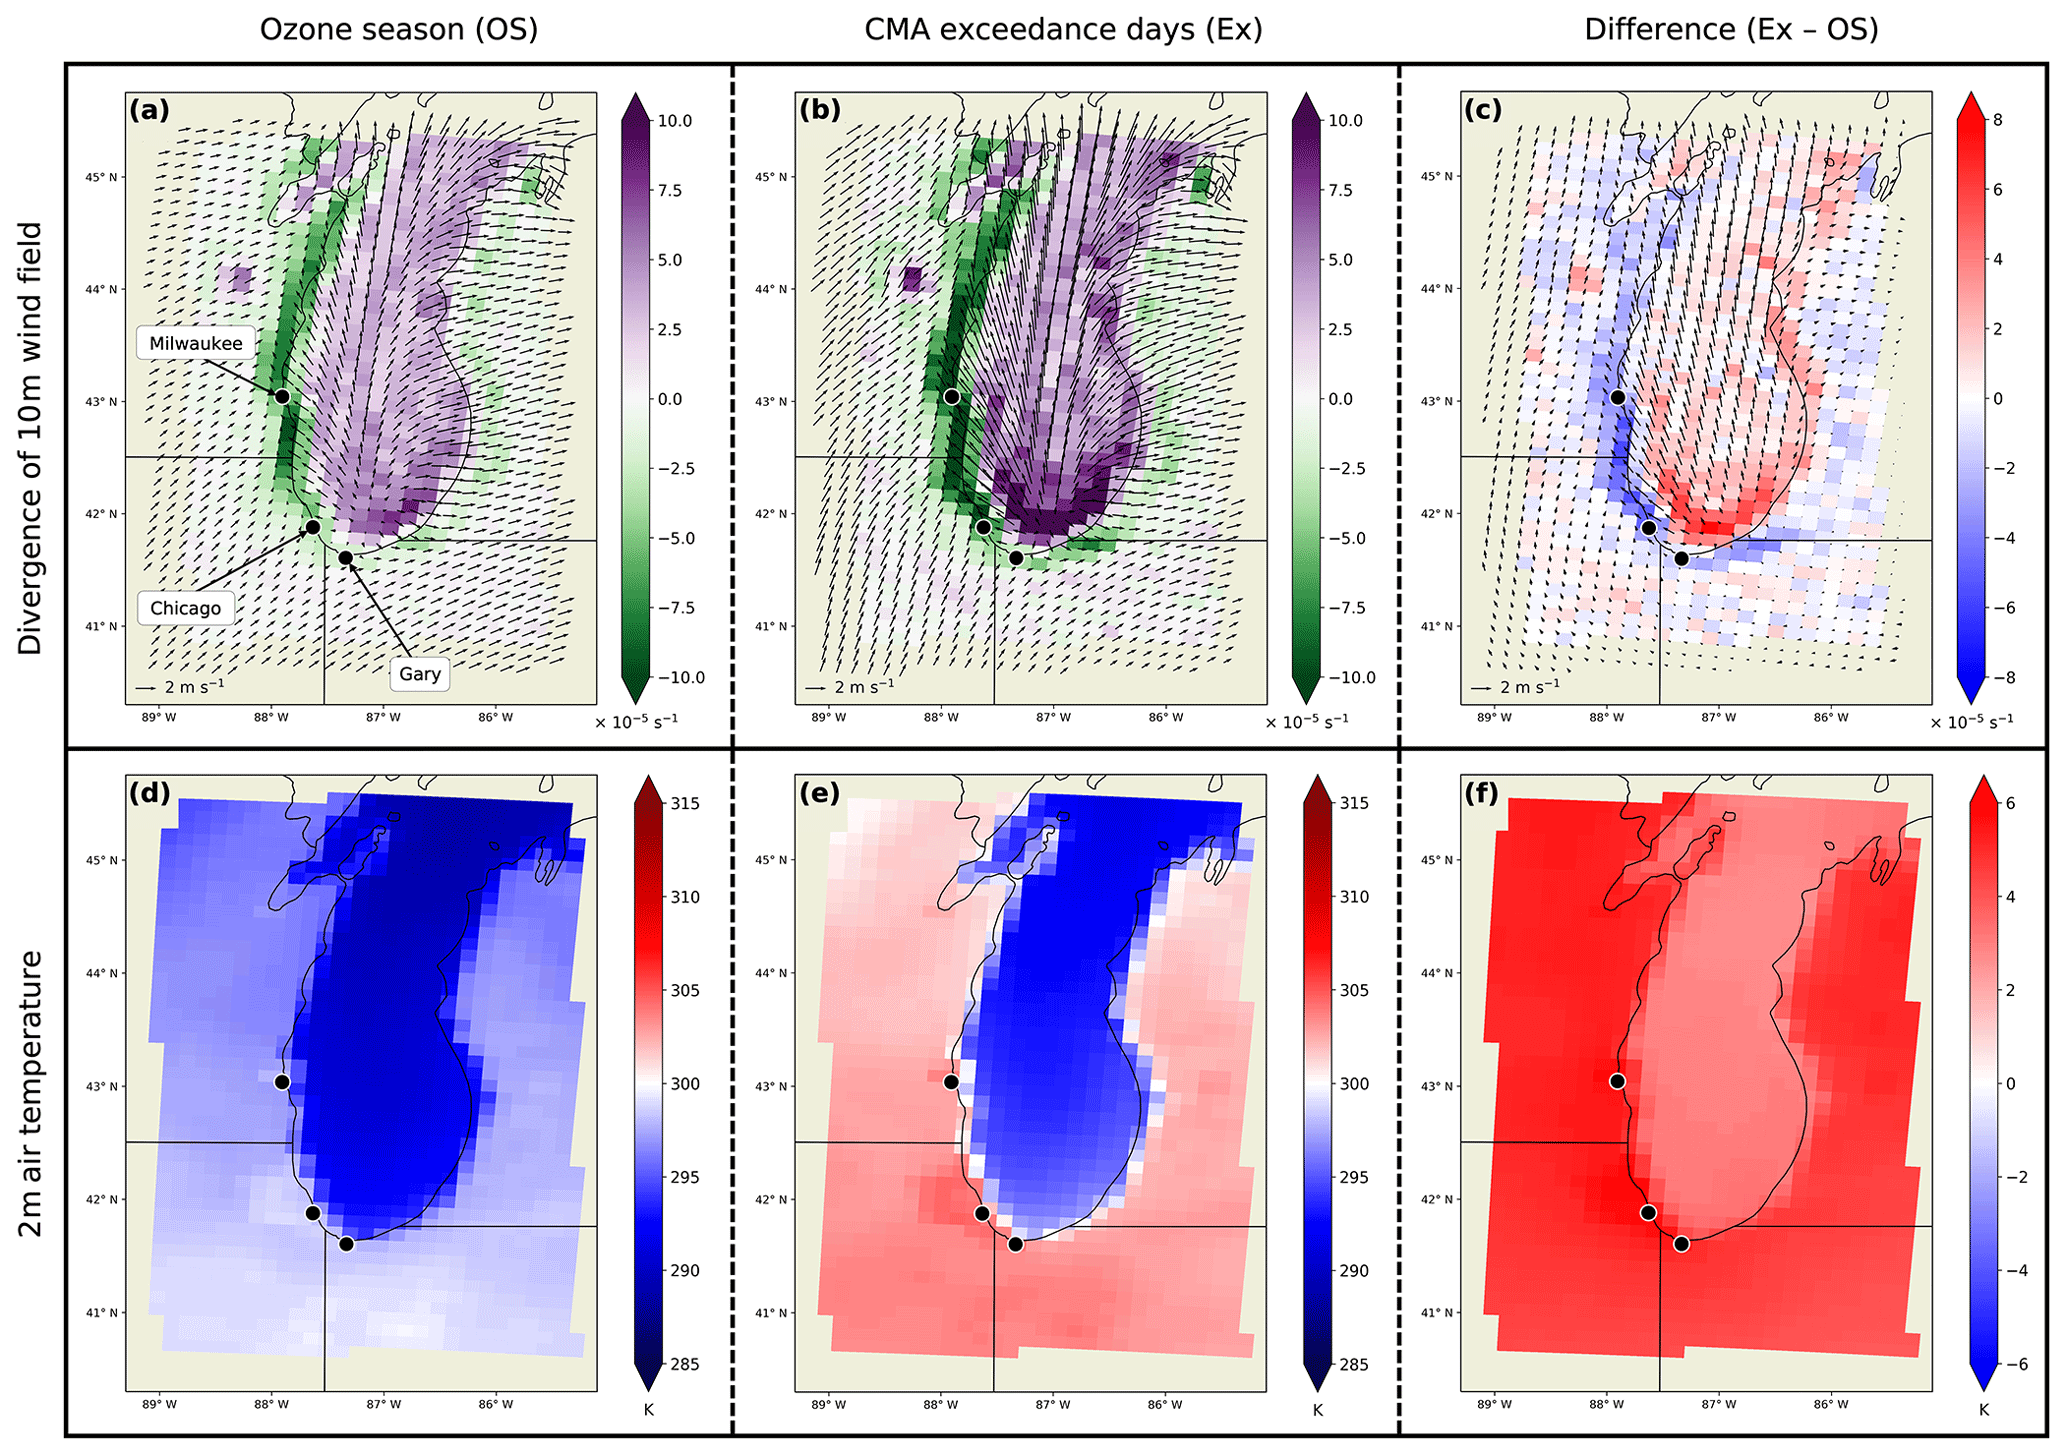
Figure 2Divergence values of the mean 10 m wind field (a–c) and mean 2 m air temperatures (d–f) in the Lake Michigan region during (a, d) the ozone season (OS) and (b, e) Chicago metropolitan area (CMA) ozone exceedance days (Ex), as well as (c, f) the difference between them (Ex − OS). In (a) and (b), positive (purple) values indicate divergence, while negative (green) values indicate convergence. Mean 10 m winds are represented by arrows.
3.1.1 Meteorological composites
Figure 2 displays plots of mean 10 m wind vectors and the mean divergence of the wind field during the ozone season (Fig. 2a) and CMA exceedance days (Fig. 2b). In both composites, the average wind pattern along the Lake Michigan coastline (during the TROPOMI 13:30 local overpass time) is consistent with a thermally direct lake breeze circulation in which the wind blows from over the lake and onto the land due to differential heating rates between the lake and land surfaces (Lyons, 1972; Laird et al., 2001). The mean wind field divergence values occur in two regimes: (1) positive values indicating divergence, which occurs most strongly over the lake, and (2) negative values indicating convergence, which occurs most strongly along the western Lake Michigan coastline during the study period. In the difference plot (Fig. 2c), mean divergence values are more negative along the western Lake Michigan coastline and more positive over the southern part of the lake during exceedance days. This indicates that the lake breeze circulation is stronger during CMA exceedance days relative to all days across the O3 season. Additionally, these findings are also in alignment with other studies that find that O3 is often produced when both NOx and VOCs are present in a shallow marine boundary layer above Lake Michigan; the high O3 concentrations are then pushed onshore by the lake breeze, resulting in counties along the lakeshore having elevated O3 levels (Dye et al., 1995; Stanier et al., 2021; Cleary et al., 2022; Wagner et al., 2022). When we performed K-S tests allowing any of the domain values to be sampled, the results indicated no significant difference between the wind divergence composites (median p-value = 0.117; Table S3). However, these results are biased because of the inclusion of very small and zero-valued divergence occurring over-land areas away from coastlines. Because we are most interested in how the strength of wind divergence and convergence changes, which are the larger absolute values at the ends of the distribution, we performed the K-S tests again while restricting the sampling to values greater and less than 1 standard deviation from the mean. This time the tests indicated a significant difference (median p-value = 0.001; Table S3), supporting the idea that the lake breeze circulation, particularly along the western Lake Michigan coastline, is stronger on CMA exceedance days.
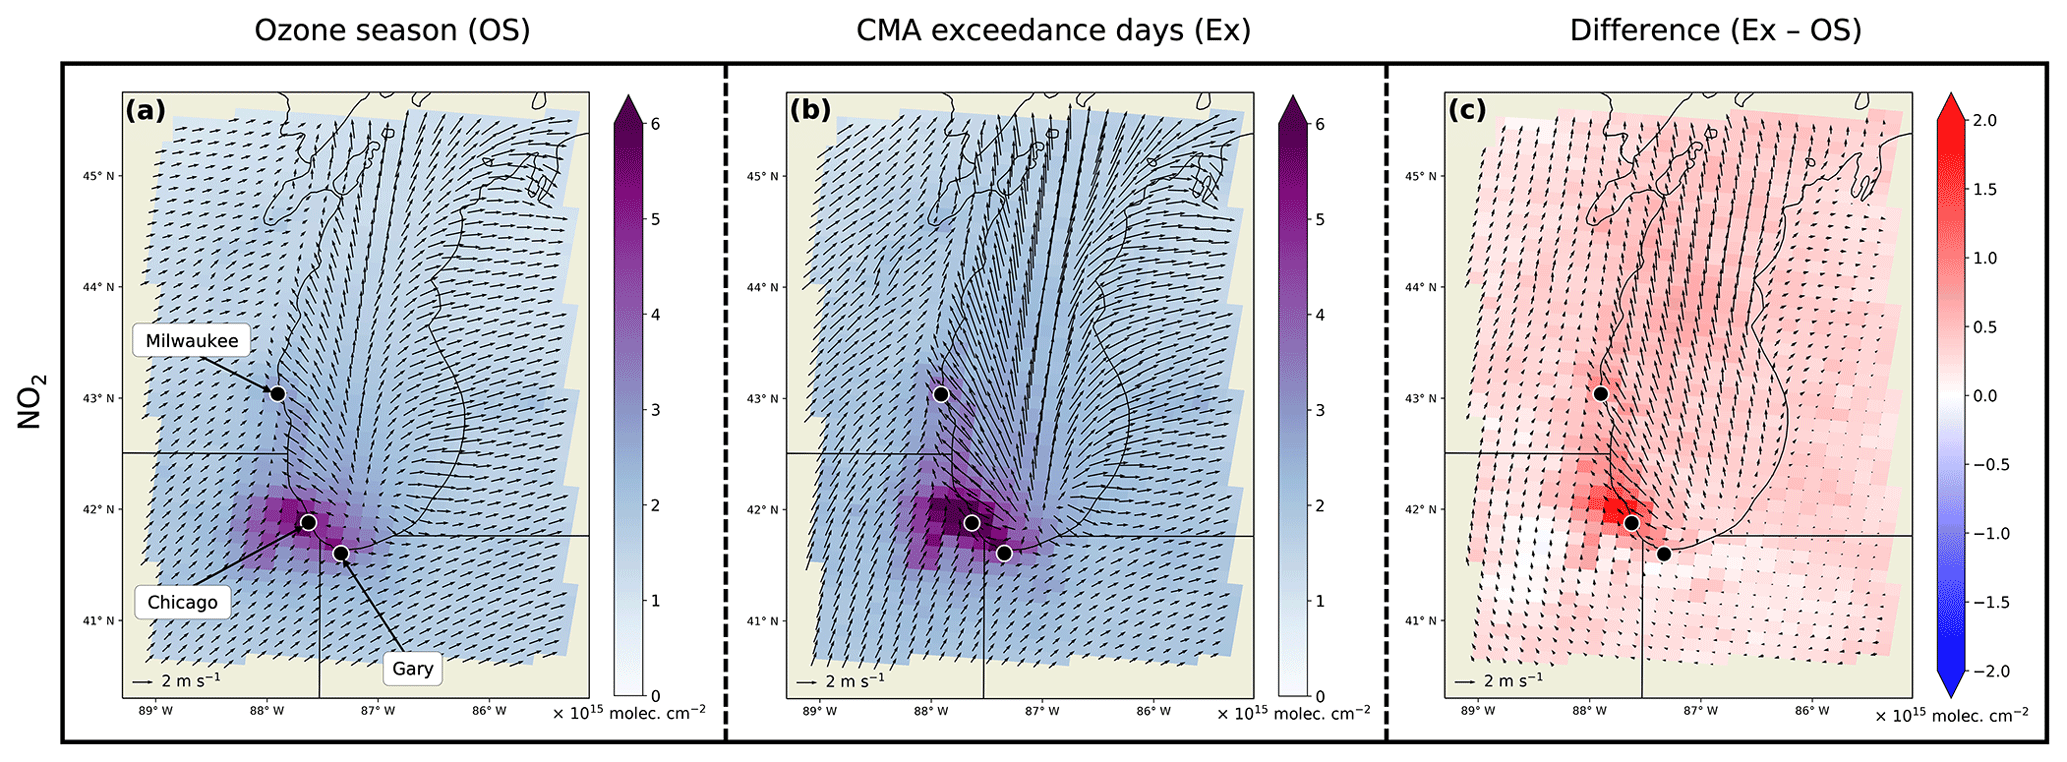
Figure 3TROPOMI-derived composites of 2019–2021 mean tropospheric NO2 vertical column densities in the Lake Michigan region during (a) the ozone season (OS) and (b) Chicago metropolitan area (CMA) ozone exceedance days (Ex), as well as (c) the difference between them (Ex − OS). Mean 10 m winds are represented by arrows.
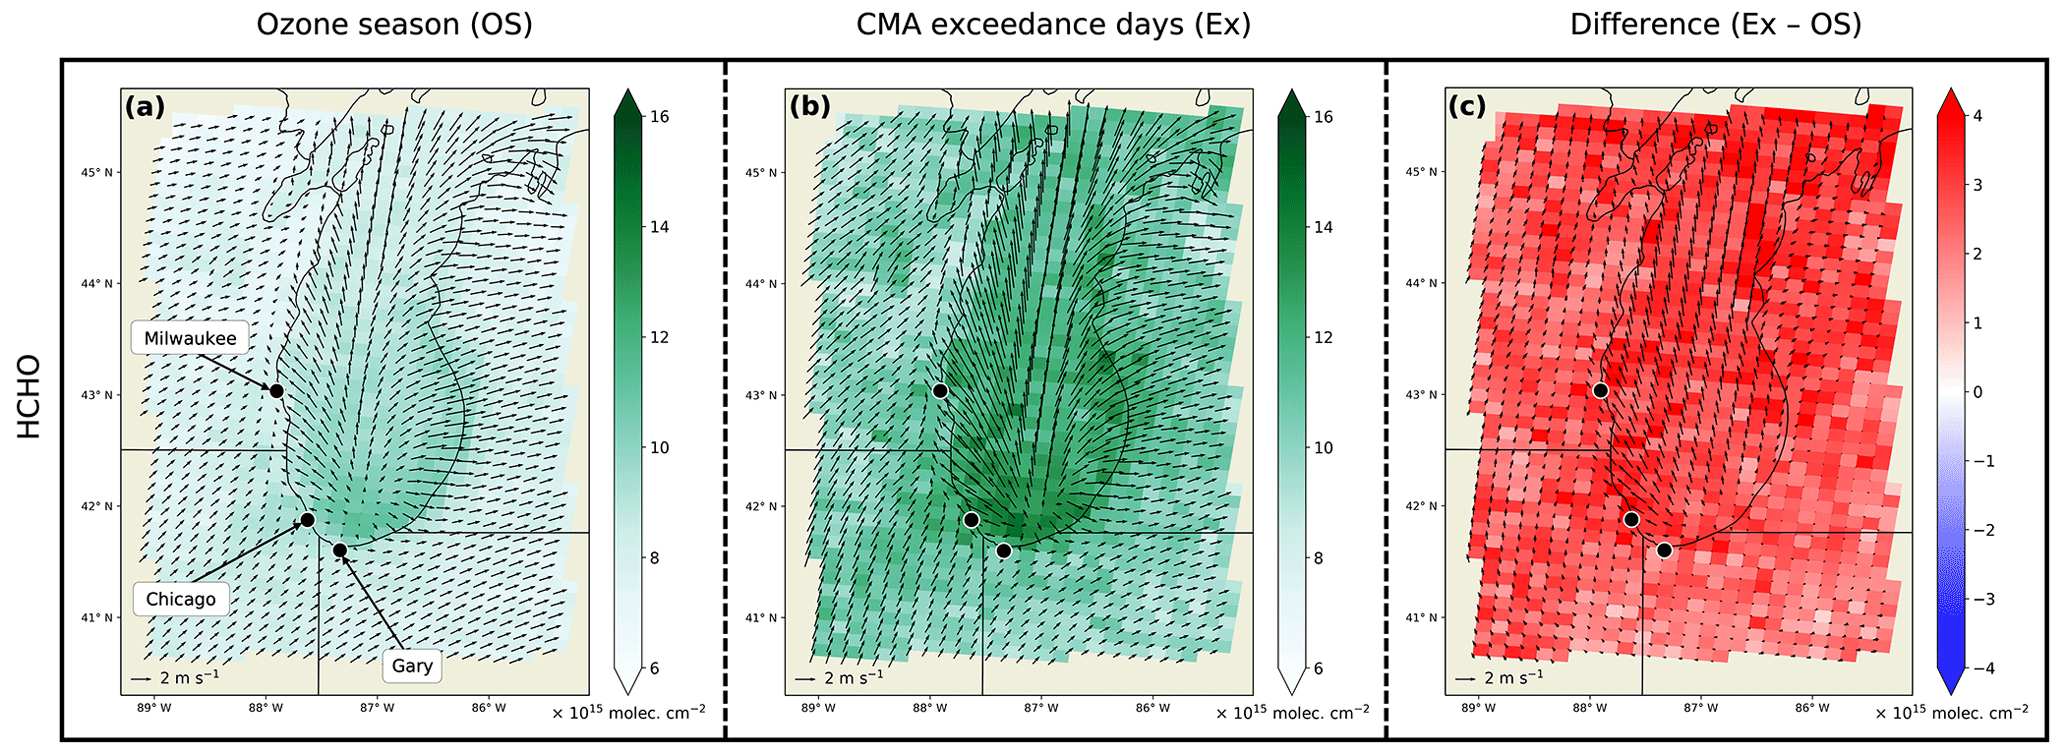
Figure 4TROPOMI-derived composites of 2019–2021 mean tropospheric HCHO vertical column densities in the Lake Michigan region during (a) the ozone season (OS) and (b) Chicago metropolitan area (CMA) ozone exceedance days (Ex), as well as (c) the difference between them (Ex − OS). Mean 10 m winds are represented by arrows.
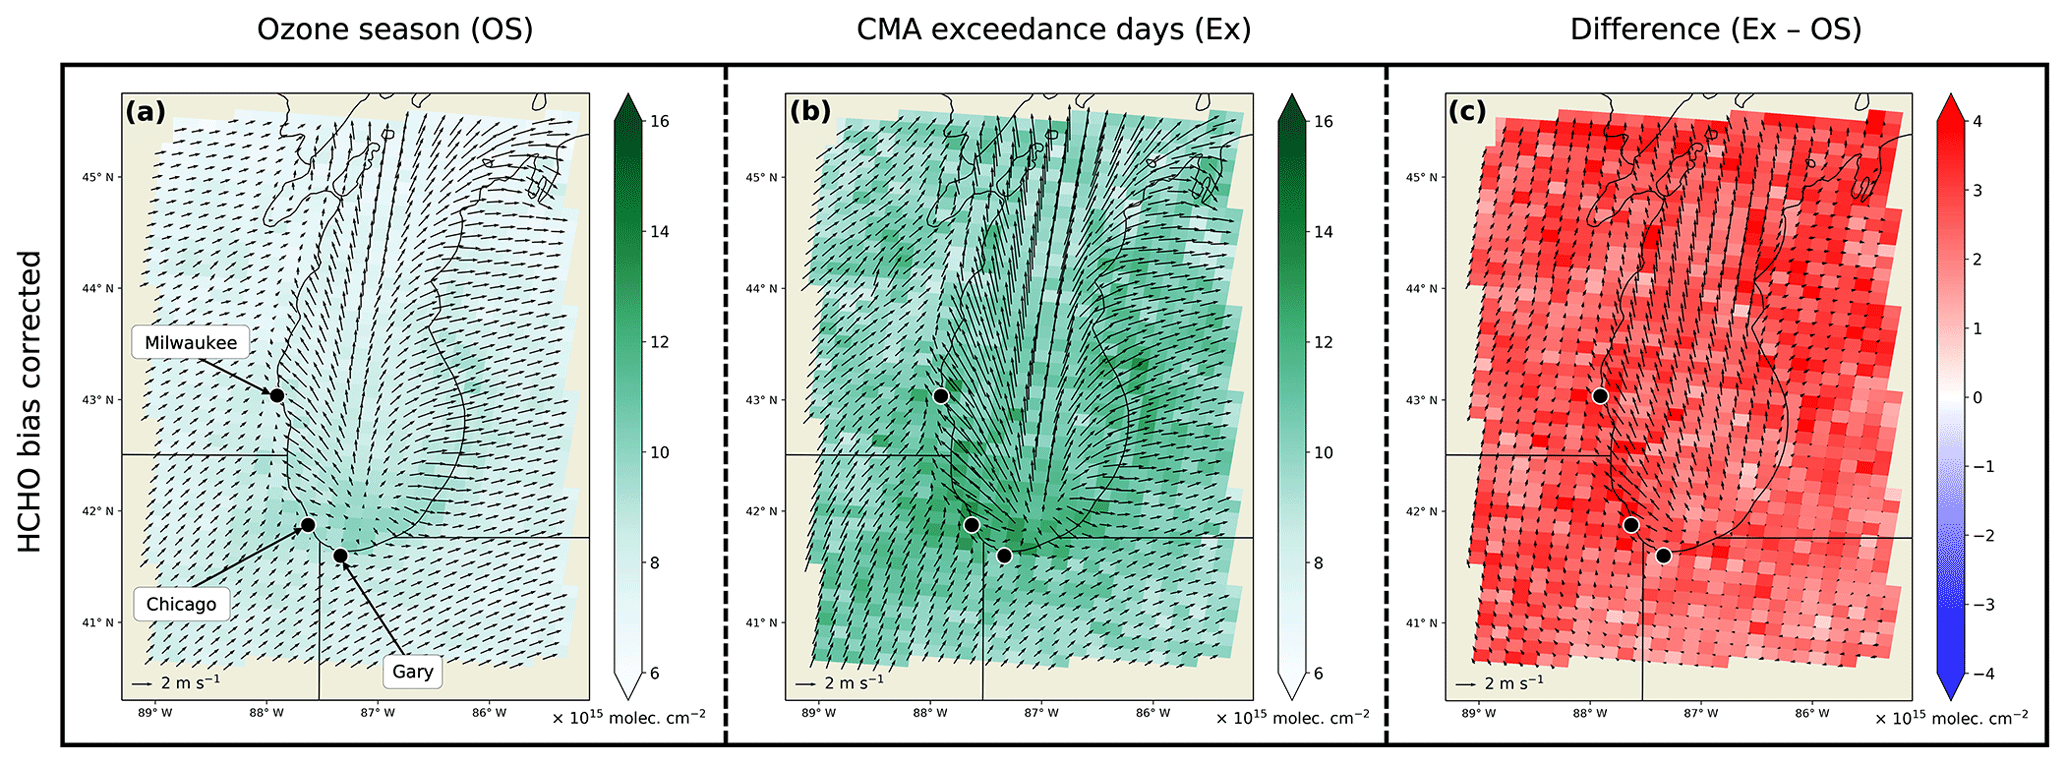
Figure 5TROPOMI-derived composites of 2019–2021 bias-corrected mean tropospheric HCHO vertical column densities in the Lake Michigan region during (a) the ozone season (OS) and (b) Chicago metropolitan area (CMA) ozone exceedance days (Ex), as well as (c) the difference between them (Ex − OS). Mean 10 m winds are represented by arrows.
One important thing to note is that because the strength of the lake breeze is different, it is possible that the vertical profiles of NO2 and HCHO are different between exceedance days and non-exceedance days. The TROPOMI NO2 and HCHO retrieval algorithms rely on forecasted model vertical profiles to produce VCD data (De Smedt et al., 2018; van Geffen et al., 2022a). Therefore, the satellite retrievals used to create the ozone season and CMA exceedance day composites below (Figs. 3–5) may have different biases depending on how well the model forecasts vertical profiles of NO2 and HCHO on exceedance days versus non-exceedance days in which the strength of the lake breeze circulation varies.
The strengthening of the lake breeze during CMA exceedance days suggests that either land temperatures are warmer or lake temperatures are colder during exceedance days because the lake breeze is a thermally direct circulation. This hypothesis is supported by Fig. 2d–f, which show plots of 2 m air temperatures. During both the ozone season (Fig. 2d) and CMA exceedance days (Fig. 2e), temperatures over land are warmer than over the lake, and the Milwaukee, Chicago, and Gary urban heat islands stand out as having higher temperatures than surrounding land areas. The difference plot shows that temperatures are warmer throughout the entire domain on exceedance days, with the temperatures over land showing greater warming than over the lake (Fig. 2f). K-S tests indicate a significant difference between the composites (median p-value = 0; Table S3). Looking at years individually, 2020 and 2021 had higher average 2 m air temperatures during exceedance days than 2019. Correspondingly, the wind divergence and convergence values are greater in 2020 and 2021. These meteorological factors likely played a role in why the CMA had more O3 exceedances in 2020 and 2021 (20 each) than in 2019 (13).
Another important thing to note is that the significant differences in temperature between the ozone season and CMA exceedance day composites may also lead to different biases in the satellite retrievals used to create the NO2 and HCHO composites below (Figs. 3–5). The absorption cross sections of various chemical species used in the TROPOMI retrieval algorithms are temperature dependent. This can lead to retrieval biases if the cross sections are not adjusted for temperature. To mitigate the potential bias for NO2, a correction factor is applied to the NO2 absorption cross section by calculating the difference between the effective temperature of the NO2 and the temperature of the baseline cross section and assuming the temperature dependence is linear (van Geffen et al., 2022a). The other species used in the NO2 retrieval algorithm (O3, the O2–O2 collision complex, and H2O) use fixed cross sections, but the temperature dependence of these cross sections has little effect in the retrieval of NO2 (van Geffen et al., 2022a). In the HCHO retrieval algorithm, the cross sections of most of the species (HCHO, BrO, NO2, and the O2–O2 collision complex) are fixed, while the O3 cross section is adjusted by fitting two absorption cross sections at different temperatures and assuming a linear dependence on temperature (Hilboll et al., 2022). Retrieval biases stemming from using absorption cross sections at fixed temperatures may be larger in the CMA exceedance day composites of NO2 and HCHO (Figs. 3–5) since temperatures tend to be warmer than usual, as shown in Fig. 2.
3.1.2 Chemical composites
Figure 3 displays composite mean tropospheric NO2 VCDs during the ozone season (Fig. 3a) and CMA exceedance days (Fig. 3b), along with mean 10 m wind vectors. The spatial distribution of tropospheric NO2 VCDs in both composites shows a clear hotspot of emissions in the CMA. During exceedance days, we also see higher NO2 VCDs extending along the coastline between Chicago and Milwaukee. Figure 3c, the difference between the composites, shows that NO2 VCDs are higher throughout the entire domain on exceedance days, with the greatest increase of 2.26 × 10¹⁵ near the urban core of Chicago. K-S tests indicate that these differences are statistically significant (median p-value = 0; Table S3). The increased NO2 VCDs on exceedance days found along the coastline between Milwaukee and Chicago can be partially explained by the stronger convergence of the wind field (Fig. 2c), which concentrates emissions originating in these areas along the southwestern shore of Lake Michigan. Further research is needed to determine why NO2 VCDs are higher for the whole domain during exceedance days (e.g., examining emissions inventories/datasets, looking for temperature-dependent natural sources of NOx). We note that surface NO2 observations at 13:00 LT from the average of eight AQS monitoring sites (U.S. EPA, 2021b) also indicate higher NO2 levels on CMA exceedance days compared to the average across all O3 season days during the 2019–2021 study period (Table S5; Fig. S1 in the Supplement). Investigating individual years, we see a COVID-19 pandemic signal in the TROPOMI data. The maximum NO2 values are about 20 % lower in 2020 and 2021 than in 2019. Interestingly, the mean NO2 VCDs for all composites (including the difference) are relatively consistent for all 3 years.
Figure 4 displays composite mean tropospheric HCHO VCDs during the ozone season (Fig. 4a), Chicago exceedance days (Fig. 4b), and the difference between them (Fig. 4c), along with mean 10 m wind vectors. In general, the spatial distribution of HCHO in both composites is relatively homogeneous (compared to NO2), though higher VCDs can be seen over the Lake Michigan water surface. In both the ozone season and exceedance day composites, the mean over-water HCHO VCD is higher than the over-land mean value. However, this pattern is highly suspect because HCHO is a relatively well-mixed gas without significant sources over the lake. HCHO emissions come from both anthropogenic (e.g., industrial processes) and biogenic sources (i.e., plants) on land. Therefore, we believe this over-water bias is unrealistic, especially since it is found over all the Great Lakes (Fig. S2). As noted in the TROPOMI HCHO algorithm theoretical basis document (Hilboll et al., 2022), the coarse resolution of the OMI-derived surface albedo climatology dataset used in the retrieval (Kleipool et al., 2008) can induce errors in VCD calculations for coastal regions. The high HCHO bias over the Great Lakes may be in part due to the Kleipool dataset being too coarse to fully resolve the complex surface albedo properties that are common to lake surfaces. We also acknowledge that the resolution of the Kleipool climatology may also affect TROPOMI HCHO observations over urban cores since urban areas can also have complex surface albedo properties. However, TROPOMI validation studies (e.g., De Smedt et al., 2021) have been performed for urban sites, providing estimates of the TROPOMI retrieval biases for such areas (see Sect. 2.1). Validation over-water surfaces is more difficult to conduct since the necessary instruments are not routinely deployed over lakes. Further research is needed to assess the impact of albedo changes between lake surfaces and the surrounding coastal areas on TROPOMI HCHO retrieval performance.
To address the over-water HCHO artifact, we “bias correct” the composites under the assumption that the mean HCHO VCD should be equal over water and land. To calculate the bias, we subtract the mean over-land HCHO VCD from the mean over-water HCHO VCD. Then, we subtract this bias value from all water grid box values. During the ozone season, the absolute bias is approximately 1.1 × 10¹⁵ (relative bias of +14.05 %). During CMA exceedance days, the absolute bias is about 1.6 × 10¹⁵ (relative bias of +15.6 %). These calculations are summarized in Fig. S3 and Table S6. Looking at individual years, the bias value for both the ozone season and exceedance day composites is about 10 % for both 2019 and 2020, but this value jumps to 25 % in 2021. We see a similar jump in the 2021 bias value for the weekday and weekend composites as well. We use the bias-corrected HCHO values when calculating FNRs in this work.
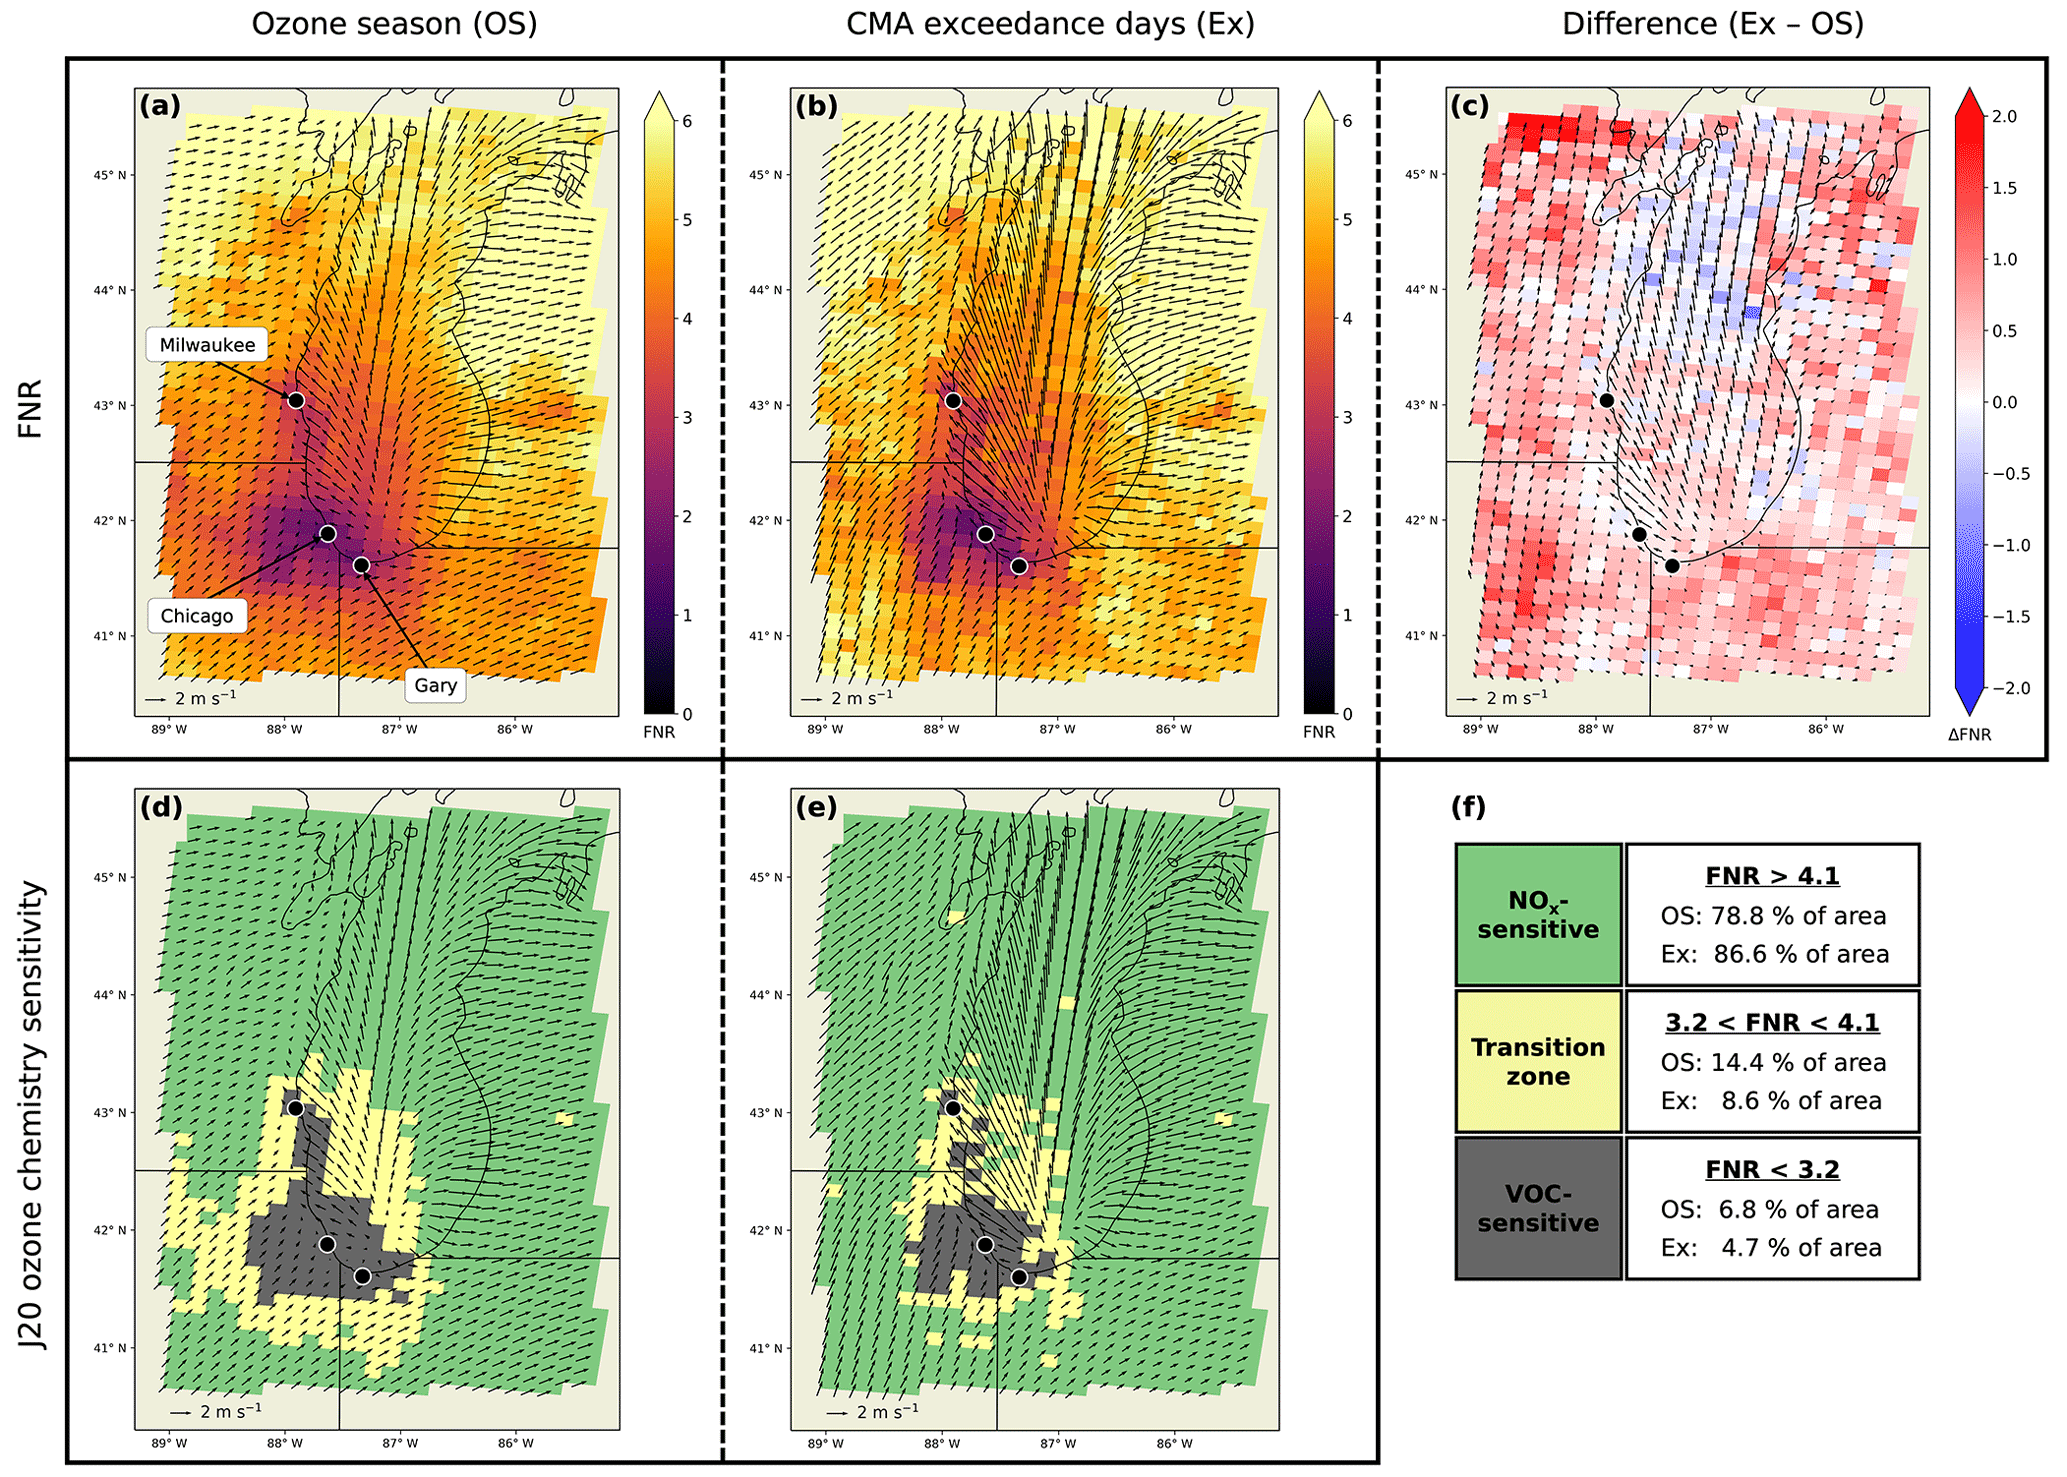
Figure 6TROPOMI-derived 2019–2021 FNR values in the Lake Michigan region during (a) the ozone season (OS) and (b) Chicago metropolitan area (CMA) ozone exceedance days (Ex), as well as (c) the difference between them (Ex − OS). J20 threshold interpretation of 2019–2021 ozone chemistry sensitivity during (d) the ozone season and (e) CMA ozone exceedance days, as well as (f) the percent of the domain area classified as each J20 sensitivity regime. Mean 10 m winds are represented by arrows.
Figure 5 displays bias-corrected composite mean tropospheric HCHO VCDs during the ozone season (Fig. 5a) and CMA exceedance days (Fig. 5b), along with mean 10 m wind vectors. The spatial distributions of HCHO in both the non-bias-corrected and bias-corrected composites are relatively homogeneous compared to the distribution of NO2. In the bias-corrected composite, we still see slightly higher HCHO VCDs over the southern part of the lake and near the eastern coastline, but the difference between these pixels and the surrounding land pixels is much smaller than before. Figure 5c displays the difference between the composites. Because positive differences occur over the entire domain, the higher HCHO abundances are likely due to increased temperatures during O3 exceedance events (Fig. 2f), which lead to increased biogenic VOC emissions and thus increased O3 production in regions with VOC-sensitive chemistry (Sillman and Samson, 1995). K-S test results show that the differences between the composites are statistically significant (median p-value = 0; Table S3). From an individual year perspective, 2019 had higher mean HCHO VCDs than 2020 and 2021 during both the O3 season and exceedance days. This is opposite to the 2 m air temperature differences between the years (2020 and 2021 were slightly warmer than 2019), which suggests that anthropogenic HCHO emissions were lower during the years impacted by the COVID-19 pandemic.
Figure 6 displays composite FNR values during the ozone season (Fig. 6a) and CMA exceedance days (Fig. 6b), along with mean 10 m wind vectors. In both composites, the lowest FNR values occur in the CMA, its surroundings, and along the eastern Illinois and Wisconsin shorelines. The highest values are in the northern parts of Wisconsin and Michigan, which are more rural and forested. Figure 6c, the difference between composites, shows that mean FNR values are higher on exceedance days for much of the domain, indicating increasingly NOx-sensitive O3 chemistry. However, the FNR values in the urban cores of Chicago and Milwaukee do not change much during exceedance days. In some grid boxes over northern portions of the Lake Michigan water surface, FNR values decrease, indicating increasing VOC sensitivity. K-S test results show that the differences between the composites are statistically significant (median p-value = 0; Table S3).
To investigate spatial patterns in O3 chemistry sensitivities, we applied the J20 thresholds to the ozone season (Fig. 6d) and exceedance day (Fig. 6e) FNR composites. During the ozone season, the areas in the CMA and north along the coastline to Milwaukee have VOC-sensitive chemistry. Surrounding these VOC-sensitive regions are areas of transition zone chemistry, most notably the traffic corridors that extend westward from the CMA toward southern Wisconsin. The rest of the domain is NOx-sensitive. During exceedance days, the urban cores of Milwaukee, Chicago, and Gary remain VOC-sensitive because higher NO2 VCDs in these urban areas counterbalance the regionally higher HCHO VCDs. The area classified as transitional changes from 14.4 % to 8.6 % during exceedance days, which is a decrease in transition zone area of 40 % (Fig. 6f). This is due to increased HCHO VCDs that shift transition zone areas in the ozone season composite (in particular, the CMA–Wisconsin traffic corridor and the areas surrounding the CMA) to NOx-sensitive areas in the exceedance day composite. The rest of the domain remains largely NOx-sensitive on exceedance days. These analyses are approximately the same for individual years; the main finding that the transition zone area decreases during exceedance days occurs in 2019, 2020, and 2021. Figure S4 shows the FNR results and J20 interpretations using the non-bias-corrected HCHO composites. Bias correcting led to lower HCHO VCDs and FNR values over water and thus more grid boxes classified as VOC-sensitive or transitional in Fig. 6 compared to Fig. S4. However, the spatial patterns in the FNR difference plots appear the same.
It is important to discuss here whether the differences between the O3 season and CMA exceedance day composites are caused by intra-seasonal changes or episodic changes inherent to O3 exceedance days. Because 94 % of ozone exceedance days occur in June, July, and August (Table S1) in the Chicago metropolitan area (CMA), it is possible that the differences we see between the ozone season and CMA exceedance day composites are due to intra-seasonal changes. More specifically, the inclusion of May and September data in the ozone season composite may be the cause of the composite differences because the data used in the exceedance day composites mostly come from June–August TROPOMI observations. To estimate the effects of intra-seasonal changes, we created boxplot distributions by month for TROPOMI NO2 and HCHO composite values and NAM temperature composite values (Figs. S5–S7). Both TROPOMI HCHO VCDs and NAM 2 m air temperatures follow a strong intra-seasonal cycle, but TROPOMI NO2 VCDs do not. By comparing intra-seasonal differences in these monthly composites (Figs. S5–S7) to the differences we see between the O3 season and CMA exceedance day composites (Figs. 2f, 3c, and 5c), we estimate that about 50 % of the HCHO and temperature changes are due to intra-seasonal changes (and the other 50 % due to O3 exceedance day conditions), while 100 % of the NO2 changes are due to exceedance day conditions (Table S7). More information about our methodology to separate intra-seasonal and episodic changes can be found in the text below Table S7.
The results of this section are similar to those of Vermeuel et al. (2019) and Acdan et al. (2020), who used chemical box modeling to investigate the O3 chemistry sensitivity of air parcels as they traveled on O3 exceedance days (2, 4, 11, 12, and 15 June 2017) from their Chicago–Gary (Illinois–Indiana) urban source regions to over Lake Michigan and then north along the western Lake Michigan coastline. Their findings show that O3 production within the plumes transitioned from having more VOC-sensitive O3 chemistry in the Chicago–Gary urban source regions to having more NOx-sensitive O3 chemistry as they advected north along the Lake Michigan coastline. Our results and those of Vermeuel et al. (2019) and Acdan et al. (2020) find a general south–north gradient in O3 chemistry on exceedance days that transitions toward less VOC sensitivity and more NOx sensitivity starting from the south in the Chicago metropolitan area and going north along the western Lake Michigan shoreline. The results of this work are also very similar to Tao et al. (2022), who used TROPOMI FNRs to compare O3 exceedance and non-exceedance days for summer 2018 over New York City. Both studies find regionally higher HCHO VCDs, higher NO2 VCDs over urban centers, regionally higher FNR values, and warmer temperatures on exceedance days. These similarities suggest that the results presented here are broadly applicable to other coastal urban environments with O3 exceedance problems. Future work could investigate FNRs over Detroit, Michigan, and Los Angeles, California, to see if this implication is true.
3.2 Comparison of weekdays and weekends
In this section we compare the weekday and weekend composites. For context, Table S2 displays the distribution of CMA O3 exceedance days by day of week. During 2019–2021, 85 % of the exceedances occurred on weekdays and 15 % on weekends. Interestingly, O3 exceedances occurred most on Fridays (15), while none occurred on Sundays.
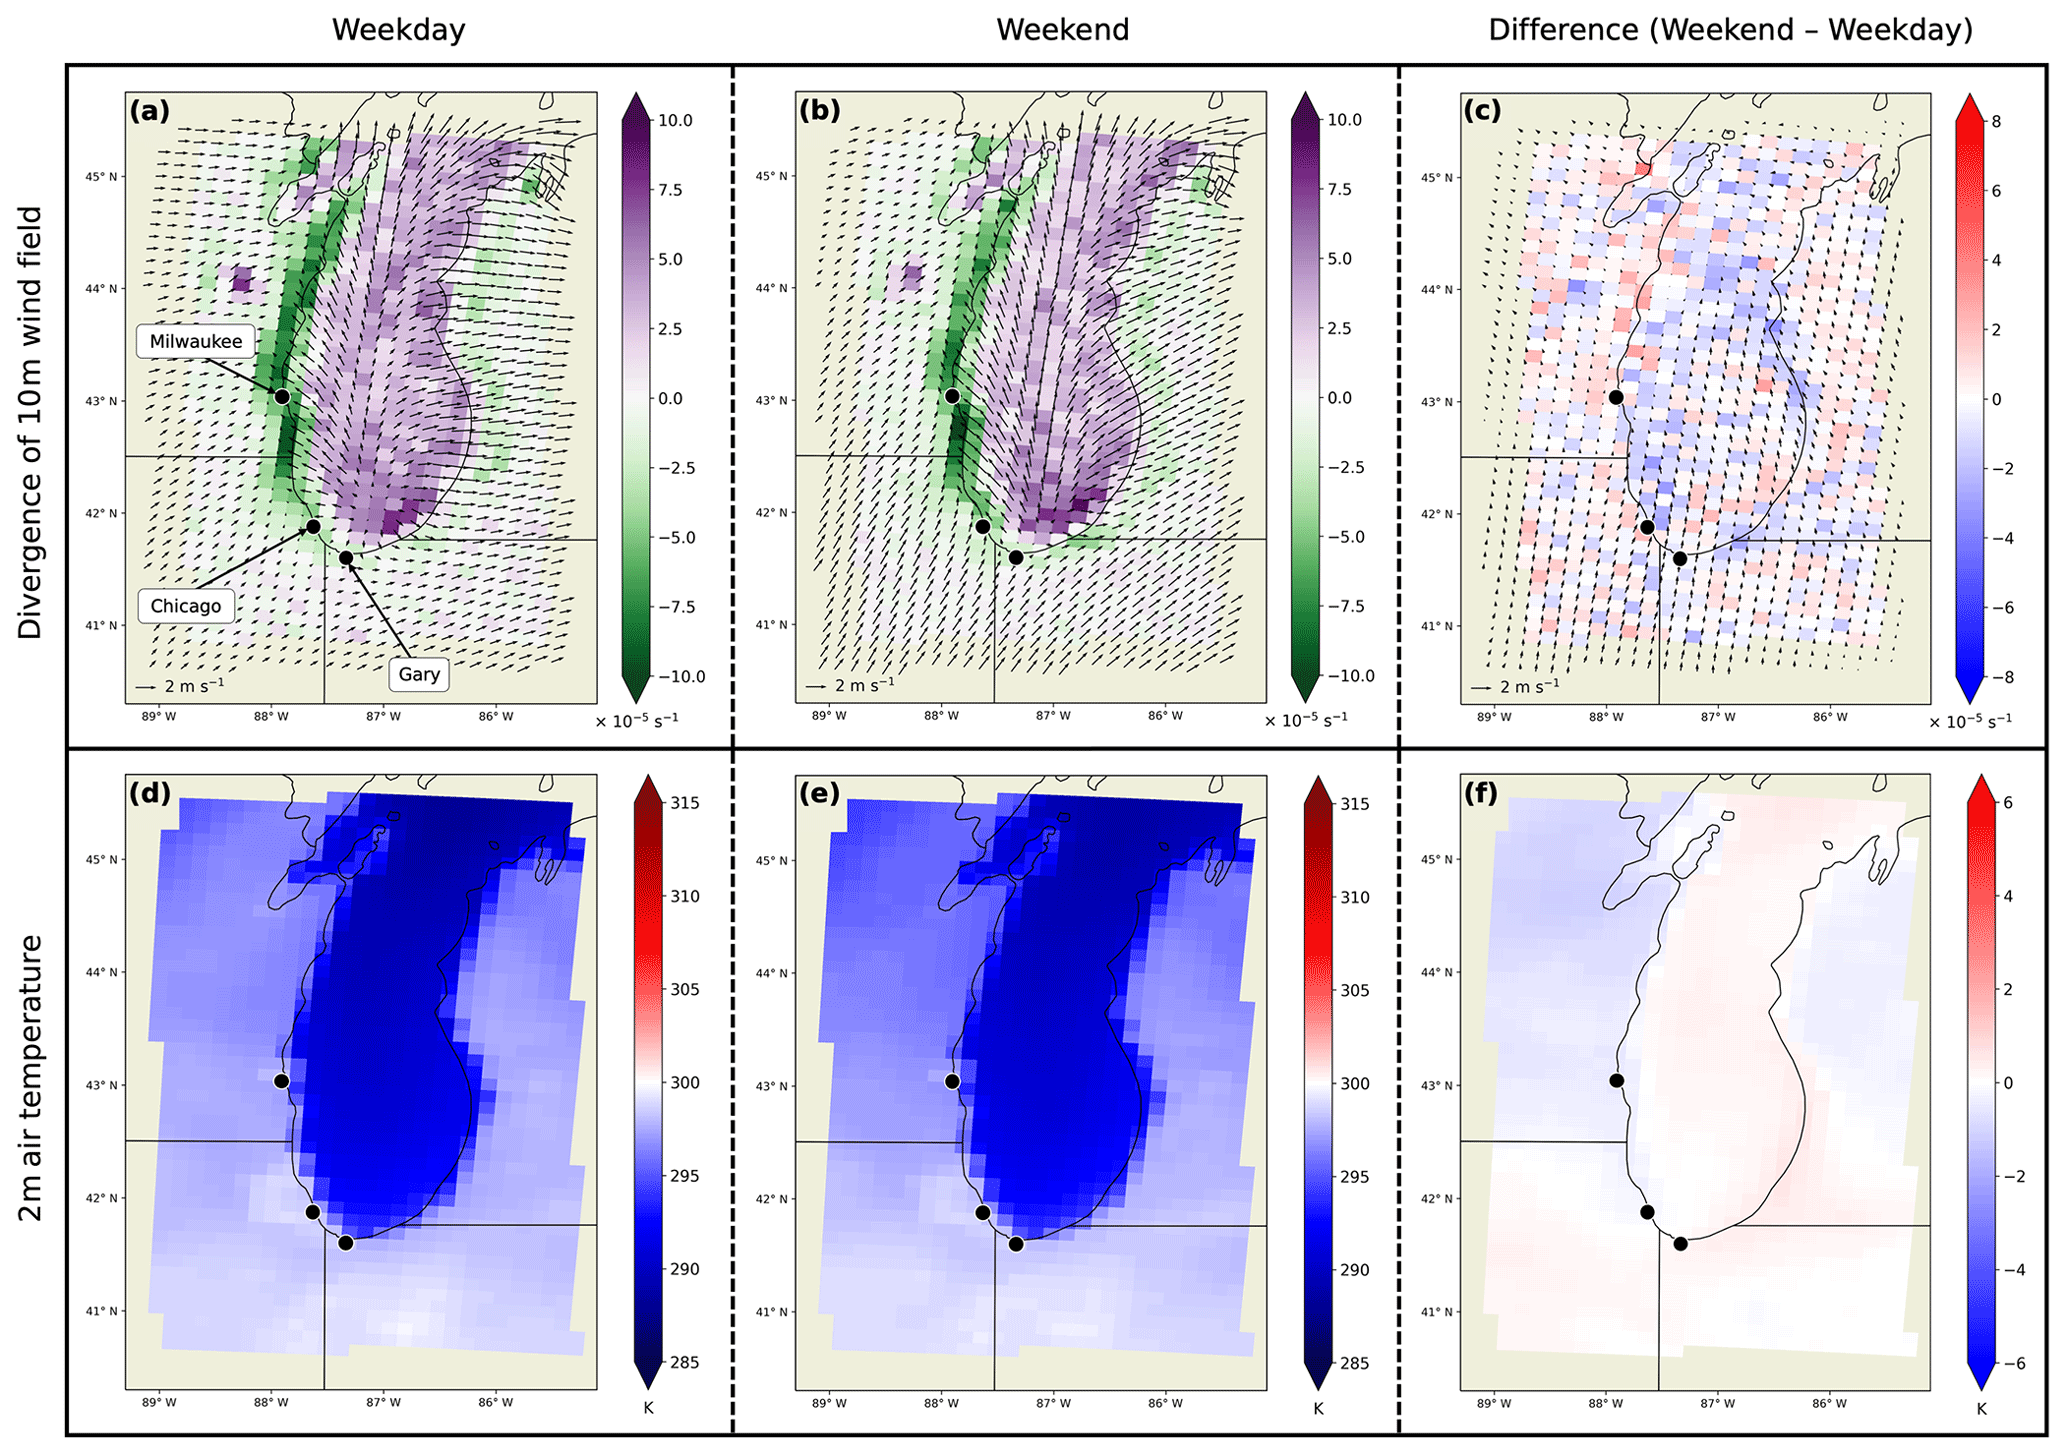
Figure 7Divergence values of the mean 2019–2021 10 m wind field (a–c) and 2 m air temperatures (d–f) in the Lake Michigan region during (a, d) weekdays and (b, e) weekends, as well as (c, f) the difference between them (weekend − weekday). Mean 10 m winds are represented by arrows. In (a) and (b), positive (purple) values indicate divergence, while negative (green) values indicate convergence.
3.2.1 Meteorological composites
Figure 7 displays plots of mean 10 m wind vectors and the mean divergence of the wind field during weekdays (Fig. 7a) and weekends (Fig. 7b). Similar to the ozone season and CMA exceedance day composites, the weekday and weekend composites indicate that the average wind pattern along the Lake Michigan coastline (during the TROPOMI overpass time) is consistent with a lake breeze circulation. The difference plot (Fig. 7c) reveals relatively small differences between weekends and weekdays in the mean divergence of the wind field. Additionally, the average wind speed and direction is approximately the same between weekdays and weekends, as expected. K-S tests allowing the sampling of the full domain indicated that the differences between the composites are not statistically significant (median p-value = 0.607; Table S4). When we limit the K-S tests to the divergence and convergence values at the ends of the distribution, the differences are still not significant (median p-value = 0.821; Table S4). These results are similar for each year individually.
Figure 7d and e are plots of 2 m air temperature during weekdays and weekends, respectively. The plot in Fig. 7f shows that the temperature differences between weekdays and weekends are much smaller in magnitude than the differences between the O3 season and exceedance days (Fig. 2f). Temperatures appear to be slightly warmer over the southern part of the domain and the lake surface, while they are slightly cooler over Wisconsin and much of Michigan on weekends. About 66 % of the individual K-S tests indicated that the differences are significant (Table S4). However, the median p-value = 0.023, which we interpret as indicating overall non-statistically significant differences at the 98 % confidence level. The difference pattern is quite variable when looking at individual years. In 2019 and 2020, the over-land 2 m air temperatures are generally cooler on weekends, while in 2021 most of domain is warmer on weekends.
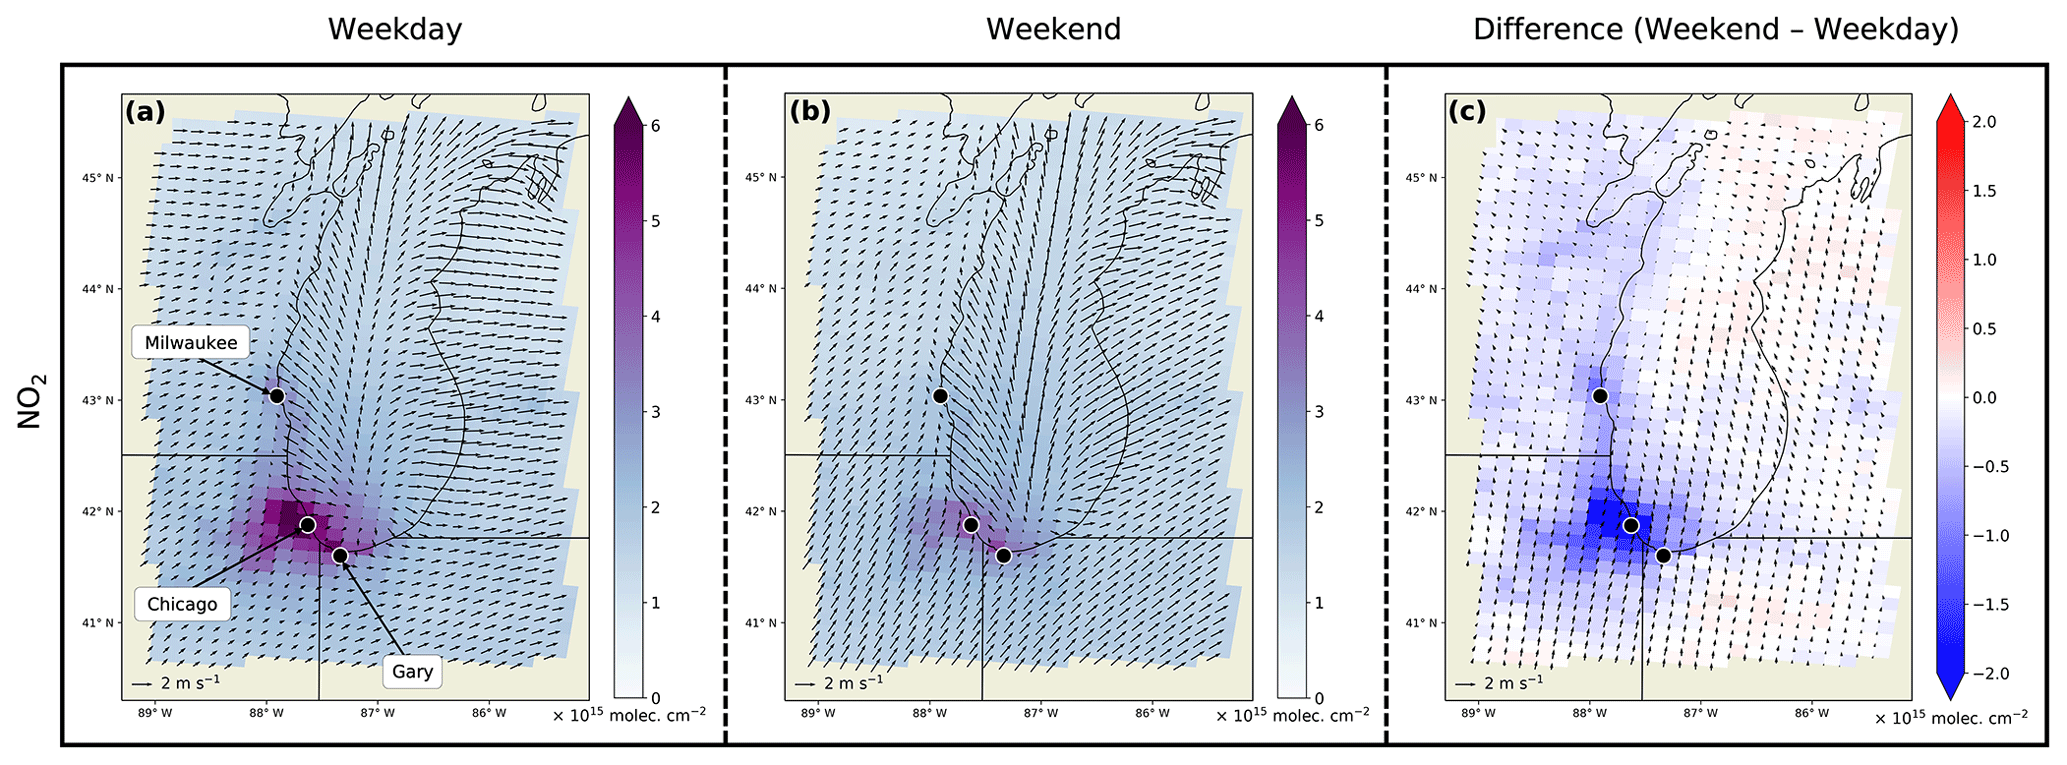
Figure 8TROPOMI-derived composites of 2019–2021 mean tropospheric NO2 vertical column densities in the Lake Michigan region during (a) weekdays and (b) weekends, as well as (c) the difference between them (weekend − weekday). Mean 10 m winds are represented by arrows.
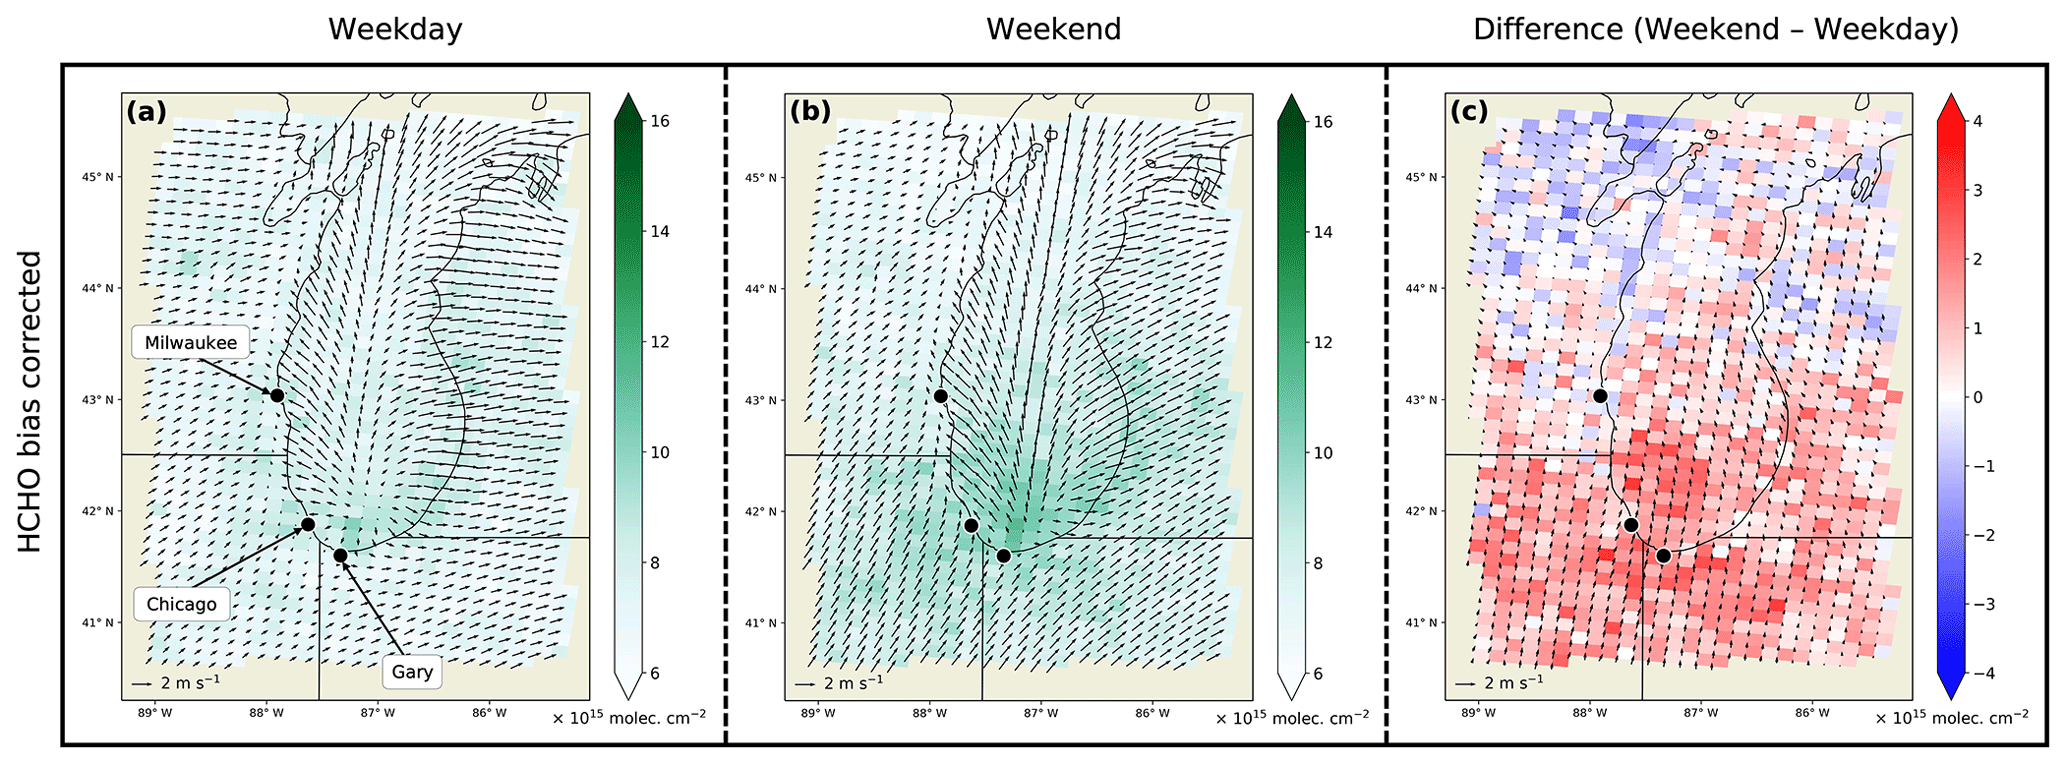
Figure 9TROPOMI-derived composites of 2019–2021 bias-corrected mean tropospheric HCHO vertical column densities in the Lake Michigan region during (a) weekdays and (b) weekends, as well as (c) the difference between them (weekend − weekday). Mean 10 m winds are represented by arrows.
3.2.2 Chemical composites
Figure 8 displays composite mean tropospheric NO2 vertical column densities (VCDs) during weekdays (Fig. 8a) and weekends (Fig. 8b), along with mean 10 m wind vectors. During weekdays, there is a clear hotspot of emissions in the CMA and a slightly smaller area of elevated NO2 VCDs in Milwaukee. Figure 8c, the difference between the weekend and weekday composites, shows lower mean NO2 VCDs in the CMA and Milwaukee on weekends. The regional average change is a decrease of 0.19 × 10¹⁵ on weekends, with the greatest decrease of 3.19 × 10¹⁵ occurring in the urban core of Chicago. This result is expected as NOx emissions generally decrease due to less road traffic volume on weekends, especially from heavy-duty diesel trucks (Demetillo et al., 2021). The decreases in weekend NO2 VCDs occur largely over the western part of the domain, while differences over Michigan and Indiana are much closer to zero. About 72 % of the K-S tests indicated that the differences are significant with a median p-value = 0.013 (Table S4). Looking at individual years, we once again see a COVID-19 pandemic signal in the weekday composites (Fig. S8a–c). The maximum NO2 VCD in 2019 was 9.42 × 10¹⁵ , which dropped by 33 % and 24 % in 2020 and 2021, respectively. The difference pattern is also different in 2019 compared to 2020 and 2021 (Fig. S8d–f). Although all 3 years have lower weekend NO2 VCDs in the CMA and Milwaukee, there is slightly higher weekend NO2 VCDs in other parts of the domain in 2019. The plots for 2020 and 2021 have east–west spatial patterns that are like the one seen in the 3-year-composite difference plot (Fig. 8c).
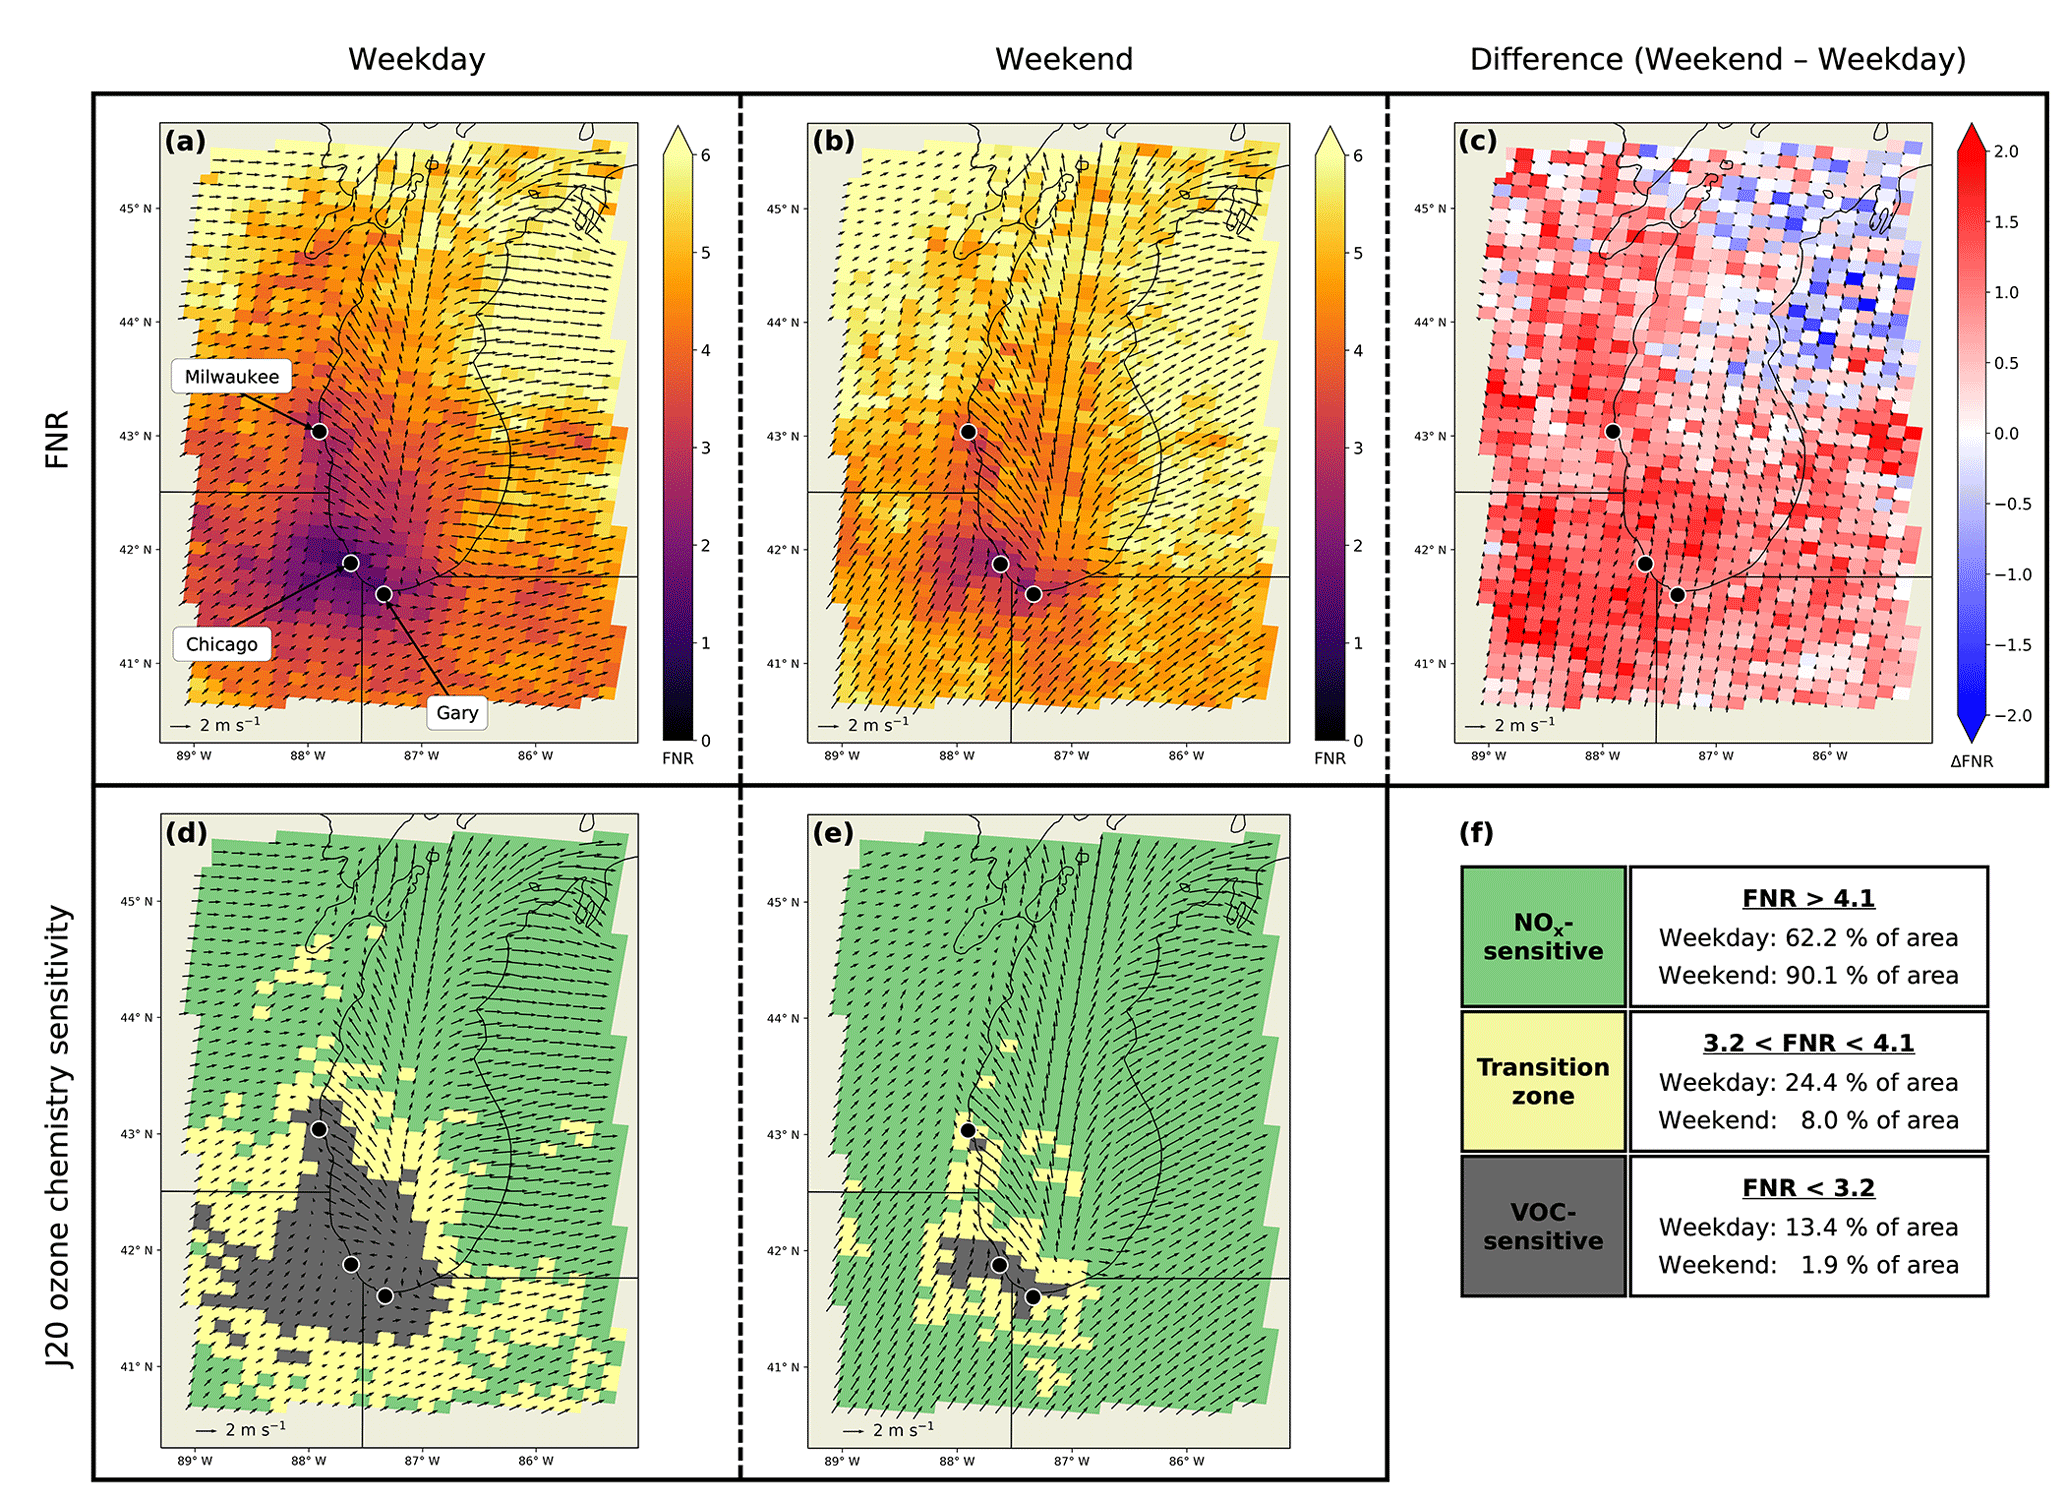
Figure 10TROPOMI-derived 2019–2021 FNR values in the Lake Michigan region during (a) weekdays and (b) weekends, as well as (c) the difference between them (weekend − weekday). J20 threshold interpretation of 2019–2021 ozone chemistry sensitivity during (d) weekdays and (e) weekends, as well as (f) the percent of the domain area classified as each J20 sensitivity regime. Mean 10 m winds are represented by arrows.
Figure 9 displays bias-corrected composite mean tropospheric HCHO VCDs during weekdays and weekends, along with mean 10 m wind vectors. Figure S9 and Table S8 detail the results of the bias correcting procedure. The spatial distribution of weekday HCHO VCDs is relatively homogenous (Fig. 9a), while on weekends there are higher HCHO VCDs over the southern part of the domain (Fig. 9b). Figure 9c, the difference between the composites, shows a north–south change in the sign of the differences. Weekend HCHO VCDs are higher over the southern part of the domain and lower over some northern parts of the domain. K-S test results show that the differences between the composites are statistically significant (median p-value = 0; Table S4). The spatial pattern in the 3-year-composite difference plot can be explained by looking at the plots for individual years (Fig. S10). In 2019 and 2021, weekend HCHO VCDs are higher throughout most of the domain but particularly in the south. In 2020, the northern part of the domain clearly has lower weekend HCHO VCDs. Overall, the average difference in the 3-year composite is an increase of 0.59 × 10¹⁵ on weekends. This increase could be due to NOx emissions differences between weekdays and weekends. For example, the principal sink of NOx is oxidation by hydroxyl radicals (OH) to nitric acid (Jacob, 1999); therefore, lower weekend NOx levels in the CMA could lead to increased OH concentrations and thus increased production of secondary HCHO in the southern part of the domain. Further research is needed to investigate this hypothesis.
Figure 10 displays composite FNR values during weekdays (Fig. 10a) and weekends (Fig. 10b), along with mean 10 m winds. In both composites, the lowest FNR values occur in the CMA, its surroundings, and north along the eastern Illinois and Wisconsin shorelines. Figure 10c, the difference between composites, shows that mean FNR values increase for much of the domain on weekends, indicating greater O3 chemistry sensitivity to NOx. K-S test results show that the differences between the composites are statistically significant (median p-value = 0; Table S4). When the FNR values are interpreted using the J20 thresholds, we see notable geographical differences in O3 chemistry sensitivity between weekdays (Fig. 10d) and weekends (Fig. 10e). The area classified as VOC-sensitive decreases from 13.4 % on weekdays to 1.9 % on weekends (Fig. 10f). Only the urban core of Chicago, industrial areas near Gary, and a single grid box to the south of Milwaukee remain VOC-sensitive on weekends. The transition zone also decreases from 24.4 % to 8.0 % on weekends (Fig. 10f). The area classified as NOx-sensitive increases from 62.2 % to 90.1 % on weekends (Fig. 10f), largely due to the areas in southern Wisconsin, northern Indiana, and the CMA surroundings changing from VOC-sensitive or transitional to becoming NOx-sensitive. These changes can be explained by lower NO2 VCDs in the western part of the domain, particularly in the CMA, and higher HCHO VCDs in the southern part of the domain, resulting in higher FNR values and increasingly NOx-sensitive O3 chemistry. Similar differences between weekdays and weekends are seen for individual years. Figure S11 shows the FNR results and J20 interpretations using the non-bias-corrected HCHO composites. Bias correcting led to more grid boxes classified as VOC-sensitive or transitional in Fig. 10 compared to Fig. S11. However, the spatial patterns in the FNR difference plots appear the same.
3.3 Limitations
The use of FNRs derived from TROPOMI satellite retrievals to indicate surface O3 chemistry sensitivity has limitations. First, to minimize the impacts of noisy TROPOMI HCHO retrievals, we temporally aggregated the data into seasonal composites. Through this process we lose the ability to detect day-to-day changes in O3 sensitivity chemistry. Furthermore, S5P is a sun-synchronous polar-orbiting satellite, and TROPOMI provides daily measurements at about 13:30 LST (local solar time). However, the sensitivity of O3 levels to NOx and VOCs can change as the atmospheric concentrations of these gases change on shorter timescales (e.g., hourly). Higher temporal- and spatial-resolution satellite measurements are needed to analyze the hourly fluctuations in O3 chemistry sensitivity from space-based instruments. Additionally, TROPOMI data represent tropospheric vertical column densities, which are influenced by the vertical profiles of HCHO and NO2. FNRs of the full tropospheric column are often different than the boundary layer FNRs that better represent surface O3 chemistry sensitivity (Jin et al., 2017; Souri et al., 2023). Finally, as discussed in the methodology section, we use the J20 OMI-derived thresholds to interpret TROPOMI FNRs. There are many differences between the OMI and TROPOMI instruments and their errors. As such, our interpretations of the changes in O3 chemistry sensitivity between composite categories are best viewed through a qualitative lens.
Despite being a highly populated area that experiences coastal O3 air quality problems, the Lake Michigan region is relatively understudied, especially from a satellite perspective. To address this research gap, we created mean formaldehyde to nitrogen dioxide ratio (; “FNR”) composites using 2019–2021 S5P TROPOMI satellite data over the Lake Michigan region to assess changes in ozone precursor levels and the inferred O3 chemistry sensitivity between (1) O3 season days and Chicago metropolitan area (CMA) O3 exceedance days and (2) weekdays and weekends. During the compositing process, we identified a high HCHO artifact over the Lake Michigan water surface, possibly due to the coarse resolution of the surface albedo dataset used in the TROPOMI HCHO retrieval. After bias correcting the artifact, we compared O3 season days to CMA exceedance days and found that higher NO2 VCDs, HCHO VCDs, and FNR values are seen throughout the study domain on exceedance days. TROPOMI FNR composites interpreted using the Jin et al. (2020; “J20”) thresholds show that the urban cores of Milwaukee, Chicago, and Gary remain VOC-sensitive on exceedance days as the higher NO2 VCDs in these areas counterbalance the regionally higher HCHO VCDs. The areal extent of the domain classified as having transitional O3 chemistry drops in value by 40 % during exceedance days, mostly due to the CMA–Wisconsin traffic corridor and the areas surrounding the CMA becoming more NOx-sensitive. The rest of the region is still NOx-sensitive during CMA exceedance days but even more so (as indicated by higher FNR values) due to increased HCHO VCDs. The 10 m wind analysis data show that the lake breeze circulation along the southwestern Lake Michigan coastline is stronger during CMA exceedance days, which causes stronger convergence of the wind field and the concentration of NO2 emissions originating in the area. Thus, the strengthening of the lake breeze is a possible cause for the higher TROPOMI composite NO2 VCDs in the urban core of Chicago on exceedance days. This analysis demonstrates the potential of using the model analysis wind data included in the TROPOMI data files to gain new insights into the transport patterns underlying the changes in chemical vertical column densities observed by TROPOMI. Both higher TROPOMI HCHO composite VCDs and the stronger lake breeze can be explained by higher temperatures on exceedance days, which we showed to be true using model analysis 2 m air temperature data. Overall, our analyses suggest that VOC emissions controls in major urban areas and NOx emissions controls throughout the entire domain are necessary to decrease O3 levels in the Lake Michigan region. Furthermore, our findings are comparable to those of Tao et al. (2022), who conducted identical analyses for New York City. This implies that the results of this work are applicable to other coastal urban environments with similar O3 exceedance problems.
When comparing weekdays and weekends, we see higher FNR values throughout much of the domain on weekends, indicating increasingly NOx-sensitive O3 chemistry. The areas classified as transitional and VOC-sensitive decrease by 67 % and 86 %, respectively. These changes are driven by lower NO2 VCDs in urban areas, particularly in Chicago, and higher HCHO VCDs in the southern part of the domain on weekends. Although lower weekend NO2 VCDs can mostly be explained by lower traffic volumes on weekends, the cause of higher weekend HCHO VCDs requires further research. This weekday versus weekend analysis complements the ozone season versus exceedance day analysis because it shows that differences in NO2 VCDs can also lead to substantial changes in FNR values and O3 chemistry sensitivity (e.g., in the urban core of Chicago). This is opposite to the ozone season versus exceedance day analysis in which the largest changes in FNR values and O3 chemistry sensitivity are dominated by HCHO differences. Additionally, opposite to the ozone season versus exceedance day analysis, we find no significant differences in 2 m air temperature and 10 m wind speed, direction, and divergence between weekdays and weekends.
We also analyzed composites for 2019, 2020, and 2021 individually to look for any impacts due to the COVID-19 pandemic. There is a clear COVID-19 signal in NO2 as the maximum VCDs in all composites are higher in 2019 compared to 2020 and 2021. We see another possible signal in the difference between weekday and weekend HCHO VCDs. In 2019 and 2021, HCHO VCDs are higher on average during weekends, while they are slightly lower on average during weekends in 2020. Despite these differences among individual years, the general spatial distribution of FNRs and O3 chemistry sensitivities largely remains the same from 2019–2021. Jing and Goldberg (2022) found that meteorology, as opposed to reduced NOx emissions alone, explains a lot of the differences in O3 production between 2020 (“the COVID-year”) and the two previous “non-COVID” years (2018 and 2019).
Future geostationary satellite instruments, such as the NASA Tropospheric Emissions: Monitoring of Pollution (TEMPO) set to launch in 2023 (Zoogman et al., 2017) and the ESA SENTINEL-4 set to launch in 2024 (Gulde et al., 2017), will make measurements of HCHO and NO2 in hourly intervals over the United States and Europe, respectively. The datasets produced by these instruments will provide researchers with new opportunities to explore the viability of using satellite-derived FNRs to infer surface ozone–NOx–VOC sensitivity at unprecedented spatiotemporal scales.
Python scripts used to generate composites of TROPOMI data as well as the TROPOMI composite data files we created in netCDF format are available upon request (send correspondence to Juanito Jerrold Mariano Acdan: acdan@wisc.edu). We downloaded TROPOMI HCHO data from the NASA Goddard Earth Sciences Data and Information Services Center (GES DISC) website: https://disc.gsfc.nasa.gov/ (last access: 11 October 2021; https://doi.org/10.5270/S5P-tjlxfd2, German Aerospace Center, 2019; https://doi.org/10.5270/S5P-vg1i7t0, German Aerospace Center, 2020). The reprocessed S5P-PAL TROPOMI NO2 data can be downloaded from https://data-portal.s5p-pal.com/products/no2.html (https://doi.org/10.5270/S5P-9bnp8q8, Koninklijk Nederlands Meteorologisch Instituut, 2021). Ground-based AQS surface O3 and NO2 monitor data can be downloaded from the U.S. EPA Air Data website: https://www.epa.gov/outdoor-air-quality-data (U.S. EPA, 2021b).
The supplement related to this article is available online at: https://doi.org/10.5194/acp-23-7867-2023-supplement.
JJMA's contributions include (1) acquiring and processing TROPOMI data; (2) identifying O3 exceedance days from surface data; (3) visualizing all data; (4) developing the methodologies; (5) interpreting the results; and (6) writing, reviewing, and editing drafts of the manuscript. RBP's contributions include (1) participating in the conceptualization of the study, (2) developing the methodologies, (3) supervising the project, (4) interpreting the results, and (5) reviewing and editing drafts of the manuscript. AFD's, ZA's, and TN's contributions include (1) conceptualizing the research project, (2) supervising the project, (3) reviewing and editing drafts of the manuscript, and (4) providing funding support. AFD was additionally involved in the interpretation of the results.
The contact author has declared that none of the authors has any competing interests.
Publisher's note: Copernicus Publications remains neutral with regard to jurisdictional claims in published maps and institutional affiliations.
This research has been supported by the Lake Michigan Air Directors Consortium (LADCO) (grant no. MSN236465).
This paper was edited by Bryan N. Duncan and reviewed by four anonymous referees.
Acdan, J., Vermeuel, M., Bertram, T. H., and Pierce, R. B.: Observation-based analyses of the sensitivity of ozone formation in the Lake Michigan region to NOx and VOC Emissions, Final report prepared for the Lake Michigan Air Directors Consortium, https://www.ladco.org/wp-content/uploads/Projects/Ozone/2020_WI-DNR_OBM_Analysis/LADCO_FinalReport_2020.pdf (last access: 21 September 2022), 2020.
Boersma, K. F., Eskes, H. J., Richter, A., De Smedt, I., Lorente, A., Beirle, S., van Geffen, J. H. G. M., Zara, M., Peters, E., Van Roozendael, M., Wagner, T., Maasakkers, J. D., van der A, R. J., Nightingale, J., De Rudder, A., Irie, H., Pinardi, G., Lambert, J.-C., and Compernolle, S. C.: Improving algorithms and uncertainty estimates for satellite NO2 retrievals: results from the quality assurance for the essential climate variables (QA4ECV) project, Atmos. Meas. Tech., 11, 6651–6678, https://doi.org/10.5194/amt-11-6651-2018, 2018.
Chang, C. Y., Faust, E., Hou, X., Lee, P., Kim, H. C., Hedquist, B. C., and Liao, K. J.: Investigating ambient ozone formation regimes in neighboring cities of shale plays in the Northeast United States using photochemical modeling and satellite retrievals, Atmos. Environ., 142, 152–170, https://doi.org/10.1016/j.atmosenv.2016.06.058, 2016.
Cleary, P. A., Dickens, A., McIlquham, M., Sanchez, M., Geib, K., Hedberg, C., Hupy, J., Watson, H. W., Fuoco, M., Olson, E. R., Pierce, R. B., Stanier, C., Long, R., Valin, L., Conley, S., and Smith, M.: Impacts of lake breeze meteorology on ozone gradient observations along Lake Michigan shorelines in Wisconsin, Atmos. Environ., 269, 118834, https://doi.org/10.1016/j.atmosenv.2021.118834, 2022.
De Smedt, I., Theys, N., Yu, H., Danckaert, T., Lerot, C., Compernolle, S., Van Roozendael, M., Richter, A., Hilboll, A., Peters, E., Pedergnana, M., Loyola, D., Beirle, S., Wagner, T., Eskes, H., van Geffen, J., Boersma, K. F., and Veefkind, P.: Algorithm theoretical baseline for formaldehyde retrievals from S5P TROPOMI and from the QA4ECV project, Atmos. Meas. Tech., 11, 2395–2426, https://doi.org/10.5194/amt-11-2395-2018, 2018.
De Smedt, I., Pinardi, G., Vigouroux, C., Compernolle, S., Bais, A., Benavent, N., Boersma, F., Chan, K.-L., Donner, S., Eichmann, K.-U., Hedelt, P., Hendrick, F., Irie, H., Kumar, V., Lambert, J.-C., Langerock, B., Lerot, C., Liu, C., Loyola, D., Piters, A., Richter, A., Rivera Cárdenas, C., Romahn, F., Ryan, R. G., Sinha, V., Theys, N., Vlietinck, J., Wagner, T., Wang, T., Yu, H., and Van Roozendael, M.: Comparative assessment of TROPOMI and OMI formaldehyde observations and validation against MAX-DOAS network column measurements, Atmos. Chem. Phys., 21, 12561–12593, https://doi.org/10.5194/acp-21-12561-2021, 2021.
De Smedt, I., Romahn, F., and Eichmann, K.-U.: S5P mission performance centre formaldehyde [L2__HCHO___] readme, https://sentinel.esa.int/documents/247904/3541451/Sentinel-5P-Formaldehyde-Readme.pdf (last access: 19 February 2023), 2022.
Demetillo, M. A. G., Harkins, C., McDonald, B. C., Chodrow, P. S., Sun, K., and Pusede, S. E.: Space-based observational constraints on NO2 air pollution inequality from diesel traffic in major US cities, Geophys. Res. Lett., 48, e2021GL094333, https://doi.org/10.1029/2021GL094333, 2021.
Duncan, B. N., Yoshida, Y., Olson, J. R., Sillman, S., Martin, R. V., Lamsal, L., Hu, Y., Pickering, K. E., Retscher, C., Allen, D. J., and Crawford, J. H.: Application of OMI observations to a space-based indicator of NOx and VOC controls on surface ozone formation. Atmos. Environ., 44, 2213–2223, https://doi.org/10.1016/j.atmosenv.2010.03.010, 2010.
Dye, T. S., Roberts, P. T., and Korc, M. E.: Observations of transport processes for ozone and ozone precursors during the 1991 Lake Michigan Ozone Study, J. Appl. Meteorol. Clim., 34, 1877–1889, https://doi.org/10.1175/1520-0450(1995)034%3C1877:OOTPFO%3E2.0.CO;2, 1995.
Eskes, H. J. and Eichmann, K.-U.: S5P mission performance centre nitrogen dioxide [L2__NO2___] readme, https://sentinel.esa.int/documents/247904/3541451/Sentinel-5P-Nitrogen-Dioxide-Level-2-Product-Readme-File (last access: 19 February 2023), 2022.
German Aerospace Center (DLR): Sentinel-5P TROPOMI Tropospheric Formaldehyde HCHO 1-Orbit L2 7 km × 3.5 km (Copernicus Sentinel data processed by ESA), Goddard Earth Sciences Data and Information Services Center (GES DISC), Greenbelt, MD, USA, https://doi.org/10.5270/S5P-tjlxfd2, 2019.
German Aerospace Center (DLR): Sentinel-5P TROPOMI Tropospheric Formaldehyde HCHO 1-Orbit L2 5.5 km × 3.5 km (Copernicus Sentinel data processed by ESA), Goddard Earth Sciences Data and Information Services Center (GES DISC), Greenbelt, MD, USA, https://doi.org/10.5270/S5P-vg1i7t0, 2020.
Gulde, S. T., Kolm, M. G., Smith, D. J., Maurer, R., Bazalgette Courrèges-Lacoste, G., Sallusti, M., and Bagnasco, G.: Sentinel 4: a geostationary imaging UVN spectrometer for air quality monitoring: status of design, performance and development, in: International Conference on Space Optics — ICSO 2014, October 2014, Tenerife, Canary Islands, Spain, Proceedings Volume 10563, 1056341, https://doi.org/10.1117/12.2304099, 2017.
Haagen-Smit, A. J.: Chemistry and physiology of Los Angeles smog, Ind. Eng. Chem., 44, 1342–1346, https://doi.org/10.1021/ie50510a045, 1952.
Hilboll, A., Richter, A., Wittrock, F., Martin, R., Barkley, M., Compernolle, S., and Eichmann, K.-U.: S5P/TROPOMI HCHO ATBD, BIRA IASB/Royal Netherlands Meteorological Institute/DLR, https://sentinels.copernicus.eu/documents/247904/2476257/Sentinel-5P-ATBD-HCHO-TROPOMI.pdf/db71e36a-8507-46b5-a7cc-9d67e7c53f70?t=1658313806426 (last access: 15 May 2023), 2022.
Jacob, D. J. (Ed.): Introduction to atmospheric chemistry, Princeton University Press, https://doi.org/10.1515/9781400841547, 1999.
Jacob, D. J.: Heterogeneous chemistry and tropospheric ozone, Atmos. Environ., 34, 2131–2159, https://doi.org/10.1016/S1352-2310(99)00462-8, 2000.
Jerrett, M., Burnett, R. T., Pope III, C. A., Ito, K., Thurston, G., Krewski, D., Shi, Y., Calle, E., and Thun, M.: Long-term ozone exposure and mortality, New Engl. J. Med., 360, 1085–1095, https://doi.org/10.1056/NEJMoa0803894, 2009.
Jin, X. and Holloway, T.: Spatial and temporal variability of ozone sensitivity over China observed from the Ozone Monitoring Instrument, J. Geophys. Res.-Atmos., 120, 7229–7246, https://doi.org/10.1002/2015JD023250, 2015.
Jin, X., Fiore, A. M., Murray, L. T., Valin, L. C., Lamsal, L. N., Duncan, B., Boersma, K. F., De Smedt, I., Gonzalez Abad, G., Chance, K., and Tonnesen, G. S.: Evaluating a space-based indicator of surface ozone-NOx-VOC sensitivity over midlatitude source regions and application to decadal trends, J. Geophys. Res.-Atmos., 122, 10439–10461, https://doi.org/10.1002/2017JD026720, 2017.
Jin, X., Fiore, A. M., Boersma, K. F., De Smedt, I., and Valin, L.: Inferring changes in summertime surface ozone–NOx–VOC chemistry over U.S. urban areas from two decades of satellite and ground-based observations, Environ. Sci. Technol., 54, 6518–6529, https://doi.org/10.1021/acs.est.9b07785, 2020.
Jing, P. and Goldberg, D.: Influence of conducive weather on ozone in the presence of reduced NOx emissions: a case study in Chicago during the 2020 lockdowns, Atmos. Pollut. Res., 13, 101313, https://doi.org/10.1016/j.apr.2021.101313, 2022.
Kalnay-Rivas, E. and Hoitsma, D.: Documentation of the fourth order band model, NASA technical memorandum 80608, https://ntrs.nasa.gov/api/citations/19800009376/downloads/19800009376.pdf (last access: 6 June 2022), 1979.
Kleipool, Q. L., Dobber, M. R., de Haan, J. F., and Levelt, P. F.: Earth surface reflectance climatology from 3 years of OMI data, J. Geophys. Res., 113, D18308, https://doi.org/10.1029/2008JD010290, 2008.
Koninklijk Nederlands Meteorologisch Instituut (KNMI): Sentinel-5P Product Algorithm Laboratory (S5P-PAL) Nitrogen Dioxide v02.03.01, Copernicus Sentinel data processed by ESA, KNMI [data set], https://doi.org/10.5270/S5P-9bnp8q8, 2021 (data available at: https://data-portal.s5p-pal.com/products/no2.html, last access: 19 January 2023).
Laird, N. F., Kristovich, D. A. R., Liang, X.-Z., Arritt, R. W., and Labas, K.: Lake Michigan lake breezes: climatology, local forcing, and synoptic environment, J. Appl. Meteorol. Clim., 40, 409–424, https://doi.org/10.1175/1520-0450(2001)040<0409:LMLBCL>2.0.CO;2, 2001.
Lin, M., Fiore, A., Horowitz, L. W., Langford, A. O., Oltmans, S. J., Tarasick, D., and Rieder, H. E.: Climate variability modulates western US ozone air quality in spring via deep stratospheric intrusions, Nat. Commun., 6, 7105, https://doi.org/10.1038/ncomms8105, 2015.
Ludewig, A., Kleipool, Q., Bartstra, R., Landzaat, R., Leloux, J., Loots, E., Meijering, P., van der Plas, E., Rozemeijer, N., Vonk, F., and Veefkind, P.: In-flight calibration results of the TROPOMI payload on board the Sentinel-5 Precursor satellite, Atmos. Meas. Tech., 13, 3561–3580, https://doi.org/10.5194/amt-13-3561-2020, 2020.
Lyons, W. A.: The climatology and prediction of the Chicago lake breeze, J. Appl. Meteorol. Clim., 11, 1259–1270, https://doi.org/10.1175/1520-0450(1972)011<1259:TCAPOT>2.0.CO;2, 1972.
Martin, R. V., Fiore, A. M., and Van Donkelaar, A.: Space-based diagnosis of surface ozone sensitivity to anthropogenic emissions, Geophys. Res. Lett., 31, L06120, https://doi.org/10.1029/2004GL019416, 2004.
Milford, J. B., Russell, A. G., and McRae, G. J.: A new approach to photochemical pollution control: implications of spatial patterns in pollutant responses to reductions in nitrogen oxides and reactive organic gas emissions, Environ. Sci. Technol., 23, 1290–1301, https://doi.org/10.1021/es00068a017, 1989.
National Research Council: Rethinking the ozone problem in urban and regional air pollution, The National Academies Press, Washington, DC, https://doi.org/10.17226/1889, 1991.
NCEP: NCEP North American Mesoscale (NAM) 12 km analysis (updated daily) [dataset], National Centers for Environmental Prediction (NCEP), National Weather Service, NOAA, U.S. Department of Commerce, Research Data Archive at the National Center for Atmospheric Research, Computational and Information Systems Laboratory, https://doi.org/10.5065/G4RC-1N91 (last access: 19 January 2023), 2015.
Nuvolone, D., Petri, D., and Voller, F.: The effects of ozone on human health, Environ. Sci. Pollut. R., 25, 8074–8088, https://doi.org/10.1007/s11356-017-9239-3, 2018.
Schroeder, J. R., Crawford, J. H., Fried, A., Walega, J., Weinheimer, A., Wisthaler, A., Muller, M., Mikoviny, T., Chen, G., Shook, M., Blake, D. R., and Tonnesen, G. S.: New insights into the column ratio as an indicator of near-surface ozone sensitivity, J. Geophys. Res.-Atmos., 122, 8885–8907, https://doi.org/10.1002/2017JD026781, 2017.
Sillman, S.: The use of NOy, H2O2, and HNO3 as indicators for ozone-NOx-hydrocarbon sensitivity in urban locations, J. Geophys. Res.-Atmos., 100, 14175–14188, https://doi.org/10.1029/94JD02953, 1995.
Sillman, S.: The relation between ozone, NOx and hydrocarbons in urban and polluted rural environments, Atmos. Environ., 33, 1821–1845, https://doi.org/10.1016/S1352-2310(98)00345-8, 1999.
Sillman, S. and Samson, P. J.: Impact of temperature on oxidant photochemistry in urban, polluted rural and remote environments, J. Geophys. Res.-Atmos., 100, 11497–11508, https://doi.org/10.1029/94JD02146, 1995.
Souri, A. H., Johnson, M. S., Wolfe, G. M., Crawford, J. H., Fried, A., Wisthaler, A., Brune, W. H., Blake, D. R., Weinheimer, A. J., Verhoelst, T., Compernolle, S., Pinardi, G., Vigouroux, C., Langerock, B., Choi, S., Lamsal, L., Zhu, L., Sun, S., Cohen, R. C., Min, K.-E., Cho, C., Philip, S., Liu, X., and Chance, K.: Characterization of errors in satellite-based tropospheric column ratios with respect to chemistry, column-to-PBL translation, spatial representation, and retrieval uncertainties, Atmos. Chem. Phys., 23, 1963–1986, https://doi.org/10.5194/acp-23-1963-2023, 2023.
Stanier, C. O., Pierce, R. B., Abdi-Oskouei, M., Adelman, Z. E., Al-Saadi, J., Alwe, H. D., Bertram, T. H., Carmichael, G. R., Christiansen, M. B., Cleary, P. A., Czarnetzki, A. C., Dickens, A. F., Fuoco, M. A., Hughes, D. D., Hupy, J. P., Janz, S. J., Judd, L. M., Kenski, D., Kowalewski, M. G., Long, R. W., Millet, D. B., Novak, G., Roozitalab, B., Shaw, S. L., Stone, E. A., Szykman, J., Valin, L., Vermeuel, M., Wagner, T. J., Whitehill, A. R., and Williams, D. J.: Overview of the Lake Michigan Ozone Study 2017, B. Am. Meteorol. Soc., 102, E2207–E2225, https://doi.org/10.1175/BAMS-D-20-0061.1, 2021.
Tao, M., Fiore, A. M., Jin, X., Schiferl, L. D., Commane, R., Judd, L. M., Janz, S., Sullivan, J. T., Miller, P. J., Karambelas, A., Davis, S., Tzortziou, M., Valin, L., Whitehill, A., Civerolo, K., and Tian, Y.: Investigating changes in ozone formation chemistry during summertime pollution vents over the northeastern United States, Environ. Sci. Technol., 56, 15312–15327, https://doi.org/10.1021/acs.est.2c02972, 2022.
Thornton, J. A., Wooldridge, P. J., Cohen, R. C., Martinez, M., Harder, H., Brune, W. H., Williams, E. J., Roberts, J. M., Fehsenfeld, F. C., Hall, S. R., Shetter, R. E., Wert, B. P., and Fried, A.: Ozone production rates as a function of NOx abundances and HOx production rates in the Nashville urban plume, J. Geophys. Res., 107, 4146, https://doi.org/10.1029/2001JD000932, 2002.
Tonnesen, G. S. and Dennis, R. L.: Analysis of radical propagation efficiency to assess ozone sensitivity to hydrocarbons and NOx 2. Long-lived species as indicators of ozone concentration sensitivity, J. Geophys. Res., 105, 9227–9241. https://doi.org/10.1029/1999JD900372, 2000.
Turner, M. C., Jerrett, M., Pope II, C. A., Krewski, D., Gapstur, S. M., Diver, W. R., Beckerman, B. S., Marshall, J. D., Su, J., Crouse, D. L., and Burnett, R. T.: Long-term ozone exposure and mortality in a large prospective study, Am. J. Resp. Crit. Care, 193, 1134–1142. https://doi.org/10.1164/rccm.201508-1633OC, 2016.
U.S. EPA: 2017 National Emissions Inventory (NEI) data, United States Environmental Protection Agency, https://www.epa.gov/air-emissions-inventories/2017-national-emissions-inventory-nei-data (last access: 29 June 2022), 2021a.
U.S. EPA: Ozone (44201) and NO2 (42602) hourly data, United States Environmental Protection Agency, Air Quality System Data Mart, https://www.epa.gov/outdoor-air-quality-data (last access: 21 April 2023), 2021b.
U.S. EPA: NAAQS table, United States Environmental Protection Agency, https://www.epa.gov/criteria-air-pollutants/naaqs-table (last access: 27 June 2022), 2022a.
U.S. EPA: 8-hour ozone nonattainment areas (2015 standard), United States Environmental Protection Agency, https://www3.epa.gov/airquality/greenbook/map8hr_2015.html (last access: 27 June 2022), 2022b.
Valin, L. C., Fiore, A. M., Chance, K., and González Abad, G.: The role of OH production in interpreting the variability of CH2O columns in the southeast U.S., J. Geophys. Res.-Atmos., 121, 478–493. https://doi.org/10.1002/2015JD024012, 2016.
van Geffen, J., Boersma, K. F., Eskes, H., Sneep, M., ter Linden, M., Zara, M., and Veefkind, J. P.: S5P TROPOMI NO2 slant column retrieval: method, stability, uncertainties and comparisons with OMI, Atmos. Meas. Tech., 13, 1315–1335, https://doi.org/10.5194/amt-13-1315-2020, 2020.
van Geffen, J. Eskes, H. J., Boersma, K. F., and Veefkind, J. P.: TROPOMI ATBD of the total and tropospheric NO2 data products, Royal Netherlands Meteorological Institute, https://sentinel.esa.int/documents/247904/2476257/Sentinel-5P-TROPOMI-ATBD-NO2-data-products (last access: 21 February 2023), 2022a.
van Geffen, J., Eskes, H., Compernolle, S., Pinardi, G., Verhoelst, T., Lambert, J.-C., Sneep, M., ter Linden, M., Ludewig, A., Boersma, K. F., and Veefkind, J. P.: Sentinel-5P TROPOMI NO2 retrieval: impact of version v2.2 improvements and comparisons with OMI and ground-based data, Atmos. Meas. Tech., 15, 2037–2060, https://doi.org/10.5194/amt-15-2037-2022, 2022b.
Veefkind, J. P., Aben, I., McMullan, K., Förster, H., de Vries, J., Otter, G., Claas, J., Eskes, H. J., de Haan, J. F., Kleipool, Q., van Weele, M., Hasekamp, O., Hoogeveen, R., Landgraf, J., Snel, R., Tol, P., Ingmann, P., Voors, R., Kruizinga, B., Vink, R., Visser, H., and Levelt, P. F.: TROPOMI on the ESA Sentinel-5 Precursor: A GMES mission for global observations of the atmospheric composition for climate, air quality and ozone layer applications, Remote Sens. Environ., 120, 70–83, https://doi.org/10.1016/j.rse.2011.09.027, 2012.
Vermeuel, M. P., Novak, G. A., Alwe, H. D., Hughes, D. D., Kaleel, R., Dickens, A. F., Kenski, D., Czarnetzki, A. C., Stone, E. A., Stanier, C. O., Pierce, R. B., Millet, D. B., and Bertram, T. H.: Sensitivity of ozone production to NOx and VOC along the Lake Michigan coastline, J. Geophys. Res.-Atmos., 124, 10989–11006. https://doi.org/10.1029/2019JD030842, 2019.
Vigouroux, C., Langerock, B., Bauer Aquino, C. A., Blumenstock, T., Cheng, Z., De Mazière, M., De Smedt, I., Grutter, M., Hannigan, J. W., Jones, N., Kivi, R., Loyola, D., Lutsch, E., Mahieu, E., Makarova, M., Metzger, J.-M., Morino, I., Murata, I., Nagahama, T., Notholt, J., Ortega, I., Palm, M., Pinardi, G., Röhling, A., Smale, D., Stremme, W., Strong, K., Sussmann, R., Té, Y., van Roozendael, M., Wang, P., and Winkler, H.: TROPOMI–Sentinel-5 Precursor formaldehyde validation using an extensive network of ground-based Fourier-transform infrared stations, Atmos. Meas. Tech., 13, 3751–3767, https://doi.org/10.5194/amt-13-3751-2020, 2020.
Wagner, T. J., Czarnetzki, A. C., Christiansen, M., Pierce, R. B., Stanier, C. O., Dickens, A. F., and Eloranta, E. W.: Observations of the development and vertical structure of the lake-breeze circulation during the 2017 Lake Michigan Ozone Study, J. Atmos. Sci., 79, 1005–1020, https://doi.org/10.1175/JAS-D-20-0297.1, 2022.
Zoogman, P., Liu, X., Suleiman, R. M., Pennington, W. F., Flittner, D. E., Al-Saadi, J. A., Hilton, B. B., Nicks, D. K., Newchurch, M. J., Carr, J. L., Janz, S. J., Andraschko, M. R., Arola, A., Baker, B. D., Canova, B. P., Chan Miller, C., Cohen, R. C., Davis, J. E., Dussault, M. E., Edwards, D. P., Fishman, J., Ghulam, A., González Abad, G., Grutter, M., Herman, J. R., Houck, J., Jacob, D. J., Joiner, J., Kerridge, B. J., Kim, J., Krotkov, N. A., Lamsal, L., Li, C., Lindfors, A., Martin, R. V., McElroy, C. T., McLinden, C., Natraj, V., Neil, D. O., Nowlan, C. R., O'Sullivan, E. J., Palmer, P. I., Pierce, R. B., Pippin, M. R., Saiz-Lopez, A., Spurr, R. J. D., Szykman, J. J., Torres, O., Veefkind, J. P., Veihelmann, B., Wang, H., Wang, J., and Chance, K.: Tropospheric emissions: Monitoring of pollution (TEMPO), J. Quant. Spectrosc. Ra., 186, 17–39, https://doi.org/10.1016/j.jqsrt.2016.05.008, 2017.