the Creative Commons Attribution 4.0 License.
the Creative Commons Attribution 4.0 License.
 | 11 Jul 2023
Evolution and chemical characteristics of organic aerosols during wintertime PM2.5 episodes in Shanghai, China: insights gained from online measurements of organic molecular markers
Shuhui Zhu
Min Zhou
Liping Qiao
Dan Dan Huang
Qiongqiong Wang
Shan Wang
Yaqin Gao
Shengao Jing
Qian Wang
Hongli Wang
Changhong Chen
Organic aerosol (OA) is a significant part of urban fine particulate matter (PM2.5), and a lack of detailed knowledge of their sources has increasingly hindered the improvement of air quality in China in recent years, as significant reductions have been achieved in inorganic ion constituents. In this study, a wide range of organic molecular markers in PM2.5 were monitored with a bi-hourly time resolution using a thermal desorption aerosol gas chromatograph system (TAG) in urban Shanghai in winter 2019. The molecular marker data have provided a unique source tracking ability in characterizing the evolution of organic aerosols during nine wintertime episodic events. Episodes primarily influenced by local air masses were characterized with higher proportions in PM2.5 and mass increments of both primary and secondary OA. Rapid increases in both the absolute mass concentration and relative proportion were observed for primary and secondary OA markers, indicative of vehicle emissions (e.g., alkanes, hopanes, and 2,3-dihydroxy-4-oxopentanoic acid) and cooking activities (e.g., saturated and unsaturated fatty acids and C9 acids). In comparison, episodes under significant influences of transported air mass were typically associated with a predominant PM2.5 contribution from secondary inorganic aerosols and enhanced OA contribution from biomass burning activities. The latter was evident from the tracer data (e.g., levoglucosan, aromatic polycarboxylic acids, and nitroaromatic compounds). Secondary OA markers associated with later-generation products of the hydrocarbon oxidation process, such as C3−5 dicarboxylic acids, were the most deficient during local episodes, while notably enhanced during the episodes under the influence of transported air masses, reflecting the different extent and pathways of atmospheric aging processing. The ability to distinguish the variations in the OA evolution during different types of episodes demonstrates the value of online organic molecular measurements for episodic analysis. The results indicate that control of local urban sources such as vehicular and cooking emissions would lessen severity of local episodes, while regional control of precursors for secondary inorganic aerosols and biomass burning activities would reduce PM2.5 episodes under synoptic conditions conducive for regional transport.
- Article
(6833 KB) - Full-text XML
-
Supplement
(2828 KB) - BibTeX
- EndNote


Fine particulate matter (PM2.5) pollution has been one of the most prominent environmental issues in recent decades due to rapid industrialization and urbanization worldwide. In China, the high concentration of PM2.5 has resulted in a significant drop in the visibility (Zhang et al., 2012) and has had adverse impacts on mortality (Chen et al., 2017; Liu et al., 2017). The annual PM2.5 concentration in China has been decreasing gradually over the past years, with the implementation of a series of emission control measures focusing on reducing pollution from energy usage, industrial processes, and road transportation (Ding et al., 2019); however, haze episodes, accompanied with the abrupt elevation of the PM2.5 concentration, still occur frequently in the cold season (Fan et al., 2021; Guo et al., 2020; Mao et al., 2019; Sun et al., 2019). According to the Ministry of Ecology and Environment, the People’s Republic of China (2019), on a daily average, nearly 5 out of the 337 prefectural-level cities in China were under heavy or very heavy pollution, with PM2.5 as the leading pollutant.
The accumulation of PM2.5 is a combined result of source emissions, atmospheric dynamics, chemical transformation, and wet/dry deposition. Many studies have shown that either local emissions or regional transport coupled with secondary processes under certain meteorological conditions are major contributors to short-term haze episodes in China (Cai et al., 2017; Chen and Wang, 2015; Huang et al., 2014; Li et al., 2016; Liu et al., 2017; RenHe et al., 2014; Wang et al., 2015, 2014a; Zhao et al., 2013). For example, Liu et al. (2014) and Wang et al. (2015) investigated several cases of severe haze pollution in northern China and identified that local traffic emissions together with enhanced coal combustion activities were the main causes of the winter haze episodes. Besides primary emissions, a significant contribution of secondary chemical transformation to haze episodes is also documented in the literature (Huang et al., 2014; Tao et al., 2017). Huang et al. (2014) reported that secondary species contributed 30–77 % and 44 %–71 % of PM2.5 and of organic aerosol, respectively, during haze episodes in China. They also found that the contribution of secondary organic aerosol (SOA) to PM2.5 episodes was on average of similar importance to the secondary inorganic aerosol (SIA), suggesting that organic aerosols (OAs) have played an important role in controlling China's PM2.5 levels.
The chemical characteristics and formation mechanisms of OAs during episodic events have been extensively investigated by a number of studies, with the application of state-of-the-art online measurement techniques (He et al., 2020; Zeng et al., 2022; W. Zhu et al., 2021). For example, Zeng et al. (2022) adopted an aerosol mass spectrometer (AMS) to analyze the OA compositions in Shanghai during different episodic events. Their results showed that aged OA from long-range transport (aged in space) had a similar degree of oxygenation compared to the prolonged local oxidation (aged in time). W. Zhu et al. (2021) also employed an AMS to investigate OA evolution in urban Shanghai. They found that aqueous-phase processing played a more important role in aged SOA formation in summer and winter, while during PM episodes in spring, both aqueous-phase and photochemical processing contributed significantly to fresh SOA formation. In these studies, however, the important molecular information of OA compositions was missing, which hinders our development of a deeper understanding of OA sources and the formation mechanisms that connect with specific precursors or precursor groups.
In this work, a field campaign was conducted at an urban site in Shanghai to characterize the evolution of haze episodes during the winter of 2019. During this campaign, 98 organic compounds in PM2.5 were continuously monitored using a thermal desorption aerosol gas chromatograph system (TAG) with a bi-hourly time resolution, along with hourly measurements of the PM2.5 major components and trace elements. The continuous online measurements of primary and secondary OA tracers by TAG have enabled the observation of episodic variations in the organic aerosols, providing molecular-level insights into the formation and evolution of OA during winter haze episodes in the urban atmosphere. While studying evolution processes, previous research predominantly deploys an aerosol mass spectrometer, which relies on molecular fragments for differentiation of OA sources. In comparison, this study has a unique advantage in source tracking due to using more source-specific organic molecular markers. Our observations reveal notable diversity in OA transformations between haze episodes under the influence of different air masses, providing measurement-based evidence for prioritizing the control strategies for future air quality improvement.
2.1 Sampling site and online measurements
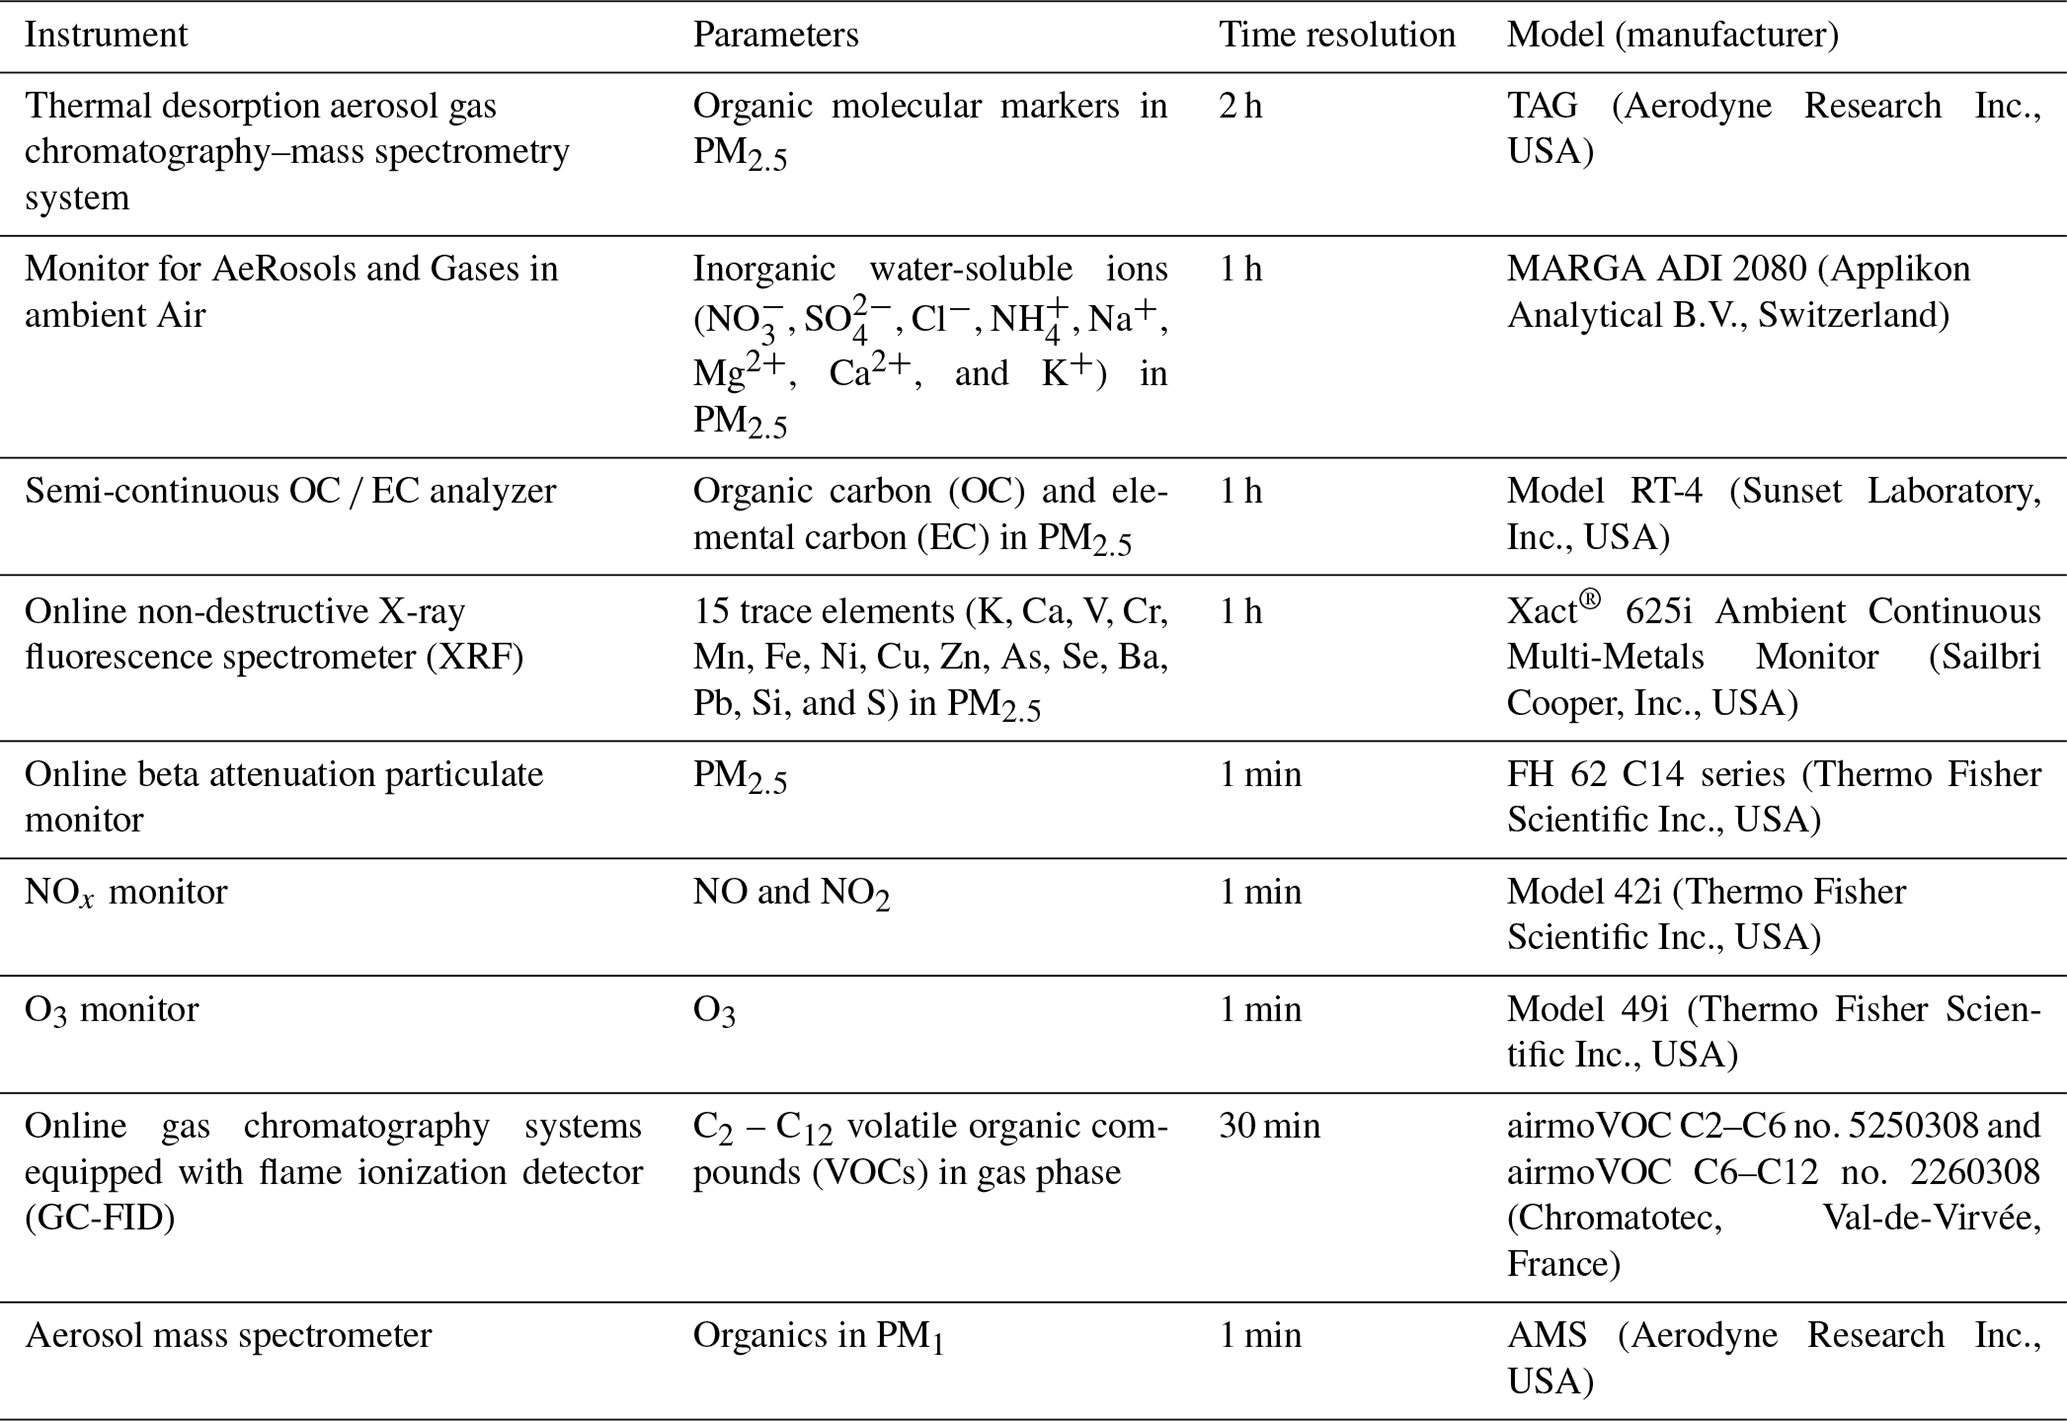
The winter campaign was conducted at the site of Shanghai Academy of Environmental Sciences (SAES) site ( N, E) from 25 November 2019 to 23 January 2020. Detailed descriptions of this urban site can be found in several published papers (Liu et al., 2021; Wang et al., 2020; He et al., 2020; S. Zhu et al., 2021). A comprehensive set of online instruments (Table 1) were operated on the roof of an eight-story building (∼ 25 m above ground) at SAES, including the TAG system (TAG, Aerodyne Research, Inc.). The measurement principle and operational procedure of the TAG system have been detailed in previous studies (He et al., 2020; Kreisberg et al., 2009; Wang et al., 2020; Williams et al., 2006; S. Zhu et al., 2021). In brief, the TAG system was operated with a time resolution of 2 h. During the first hour, aerosol was collected at a flow rate of 10 L min−1, and during the second hour, gas chromatography–mass spectrometry (GC-MS) analysis was performed. After sampling at room temperature and subsequent addition of 5 µL internal standard (IS) mixtures, the thermal desorption cell (CTD) was kept at 45 ∘C for 2 min, then increased to 330 ∘C in 6 min, and thereafter kept at 330 ∘C for 12 min. During this thermal desorption step, the polar organic compound in the PM2.5 deposit on the CTD underwent in situ derivatization under a helium stream saturated with derivatization agent N-methyl-N-(trimethylsilyl) trifluoroacetamide (MSTFA). Subsequently, the organic compounds were reconcentrated onto a focusing trap (FT) cooled by a fan. Afterwards, the CTD was purged with pure helium to vent the excess MSTFA, and the FT was heated to 330 ∘C to transfer the organic compounds into the valveless injection (VLI) system, which employs a restrictive capillary tube to connect with the inlet of the gas chromatograph (GC). Then the GC/MS analysis started, and concurrently, the next ambient sample was collected via the abovementioned steps. In this study, a total of 98 polar and nonpolar organic compounds were identified and quantified (Text S1 in the Supplement), and the full list is provided in Table S1 in the Supplement. The detailed quality control measures and results for the TAG measurements have also been reported in S. Zhu et al. (2021) and given in Sect. 2.2.1.
Additionally, multiple high-time-resolution instruments for the measurements of organic fragments in PM1, major components and trace elements in PM2.5, in addition to gaseous and particulate pollutants were also available in this campaign (Table 1). The performance of AMS in measuring PM1 organics during this field campaign has been reported in Huang et al. (2021), and its PMF analysis results are given in Fig. S1 in the Supplement. More detailed descriptions of these instruments employed during the campaign have been given in Text S1 and can also be referred to in our previous studies (Qiao et al., 2014; Wang et al., 2013; S. Zhu et al., 2021). Meteorological parameters including temperature, relative humidity (RH), wind direction (WD), wind speed (WS), and solar radiation (RS) were measured concurrently at this site.
Table 1Comprehensive online instruments adopted for this campaign.
2.2 Data analysis
2.2.1 Data quality and control
A total of 638 valid samples were measured by TAG throughout the field campaign. A mixture of 20 deuterated compounds was added as internal standards in the analysis of each sample and in the calibration to track and correct the changes in instrumental sensitivity. Table S1 in the Supplement lists the range and average concentrations of the 98 quantified organic compounds, together with their respective quantification ions and internal standards. For ease of discussion, the 98 TAG-measured organic compounds are sorted into 18 compound groups in the following discussions and labeled as alkanes, hopanes, polycyclic aromatic hydrocarbons (PAHs), primary sugars (PSs), biomass burning tracers (BBtracers), unsaturated fatty acids (uFAs), saturated fatty acids (sFAs), aromatic polycarboxylic acids (Ar-PCAs), nitroaromatic compounds (NACs), C9 acids, C6−8 hydroxyl dicarboxylic acids (H_hDCAs), C6−8 dicarboxylic acids (H_DCAs), C3−5 hydroxyl dicarboxylic acids (L_hDCAs), C3−5 dicarboxylic acids (L_DCAs), phthalic acid (Pht), 2,3-dihydroxy-4-oxopentanoic acid (DHOPA), β-caryophyllene tracers (βCaryT), and α-pinene tracers (αPinT), considering both the compound structures and the commonality in source origins. Molecules lumped into the same group normally show correlations with each other, with Rp higher than 0.6 (Fig. S2). We further evaluated the quality of the hourly dataset by conducting multiple cross-comparisons among independent measurements, and the scatter correlation plots are illustrated in Fig. S3. For example, the summed mass of 98 TAG-measured organic molecules is well correlated with organic carbon (OC) measured by the OC EC analyzer (R2=0.73) and total organics measured by AMS (R2=0.74). TAG-measured hopanes and fatty acids are well correlated with the hydrocarbon-like OA (HOA; R2=0.60) and cooking OA (COA; R2=0.74) resolved from the mass spectra by AMS, respectively, thereby reflecting vehicular emissions (VEs) and cooking activities as their respective common source. And those secondary organic molecules (e.g., pinic acid, DHOPA, phthalic acid, DCAs, and hDCAs) measured by TAG showed moderate to strong correlations (R2=0.21–0.68) with nitrate, sulfate measured by MARGA, and secondary source factors (e.g., more-oxidized organic aerosol, MO-OOA, and less-oxidized organic aerosol, LO-OOA) derived from the AMS. Besides, the inorganic ions (NO, SO, and NH) measured by the AMS are fairly well correlated with those measured by MARGA (R2=0.59–0.79). The summed secondary source factors derived from the AMS also showed strong correlations (R2=0.87) with secondary organic matter (SOM) estimated by the OC EC ratio method, and its summed primary source factors correlated well with estimated primary organic matter (POM; R2=0.44). Overall, the data consistency checks indicate that the TAG system and other online instruments have provided good quality measurements.
2.2.2 Estimation of primary and secondary organic aerosol mass concentrations
OC in the ambient PM2.5 can be apportioned into primary OC (POC) and secondary OC (SOC), according to their source origins. As it is analytically infeasible for the direct measurement of POC and SOC, an estimation method based on the OC EC ratio is widely adopted (Castro et al., 1999; Turpin and Huntzicker, 1995). Specifically, elemental carbon (EC) serves as a tracer to track the portion of co-emitted POC, and the following equations are used to calculate the POC and SOC values:
where OC and EC are the measured hourly concentrations of OC and EC, and (OC EC)pri is the average OC-to-EC ratio from primary emission sources. In this study, the minimum OC EC ratio of 1.5 during the campaign was adopted to represent (OC EC)pri (Lim and Turpin, 2002). This value fell in the range reported in other studies (1.4–1.9) when estimating the POC and SOC concentrations in Shanghai (Wang et al., 2016; Yao et al., 2020; Zhao et al., 2015). Subsequently, POM and SOM were calculated from POC and SOC by multiplying conversion factors of 1.4 and 2.0, respectively. The multipliers were previously reported in W. Zhu et al. (2021), based on the 2016–2017 AMS data measured at the same site.
2.3 Clustering analysis and concentration-weighted trajectory (CWT)
Backward trajectories for air masses arriving at the observation site and their clustering analysis were calculated every hour by HYSPLIT software (http://ready.arl.noaa.gov/HYSPLIT.php, last access: 18 June 2022), with 6 h archived GDAS (Global Data Assimilation System) data. Based on the change in total spatial dissimilarity (TSV; Fig. S4) and variations in the PM2.5 chemical composition under each cluster (Fig. S5), an optimal solution of four clusters (Fig. S5), representing marine, local, Yangtze River Delta (YRD)-transported, and long-range-transported air masses, was determined. The information derived from HYSPLIT was then used to determine the potential source areas for PM2.5 under the influence of different air mass clusters, and the results are illustrated by a concentration-weighted trajectory (CWT) approach, with the adoption of ZeFir software (Petit et al., 2017). A more detailed description of these analyses is given in Text S2 in the Supplement.
3.1 General descriptions
Figure 1 shows the time series of meteorological parameters, gaseous pollutants, and PM2.5 and its chemical components during the campaign. The average PM2.5 mass loading was 49.9 ± 36.9 µg m−3, and the significant hour-to-hour variation was recorded. PM2.5 episodes were identified to be periods of hourly concentrations exceeding 35 µg m−3 and durations over 20 h. A total of nine PM2.5 episodes (EP no. 1 to EP no. 9) thus emerged throughout the study period and are individually labeled in Fig. 1. Among them, EP no. 1, EP no. 7, and EP no. 8, which lasted from 31 to 105 h, were categorized into “transport episodes” on the basis that their trajectories with high particle concentrations originated from Shandong province and passed over the YRD region before reaching Shanghai (Fig. 2a). EP no. 3, EP no. 4, and EP no. 6 were categorized as “local episodes”, as they were characterized by a significantly lower moving speed of polluted air parcels circling around Shanghai (Fig. 2a). Compared with transport episodes, the durations of local episodes were normally much shorter, ranging from 21 to 38 h. EP no. 2, no. 5, and no. 9, each lasting over 4 d with high PM2.5 concentrations and originating from both the YRD region and local areas (Fig. 2a), were thus termed “mixed-influence episodes”. The remaining days were classified as non-episodic periods, characterized by notably lower concentrations of most ambient pollutants (e.g., PM2.5, NOx, and volatile organic compounds or VOCs). Consistent with previous studies (Li et al., 2019; Wang et al., 2014b; Wei et al., 2019), the occurrences of haze episodes in Shanghai during the wintertime were associated with air parcels originating from the YRD region or local areas under stagnant meteorological conditions, while the clean periods were characterized by prevailing air masses that were long-range transported from Mongolia or clean marine areas. These long-range transported air masses were associated with higher wind speed (WS > 4 m s−1), thus favoring the diffusion and dilution of air pollutants. More detailed statistics related to the average values of meteorological parameters, ambient pollutants, PM2.5 major components, and diagnostic ratios during individual episode categories and non-episodic periods are summarized in Table 2.
Among the three types of episodes, the PM2.5 concentration showed the highest average level during transport episodes (83.5 ± 37.0 µg m−3), with the hourly concentration fluctuating from 32 to 178 µg m−3, followed by the mixed-influence episodes (78.0 ± 29.5 µg m−3) and local episodes (62.4 ± 25.3 µg m−3; Table 2). During the transport and mixed-influence episodes, high concentrations of PM2.5 were observed, along with a relatively higher concentration of O3 under a lower level of RH (< 70 %) and higher intensity of solar radiance (RS > 80 W m−2). Local episodes generally occurred, with a notable drop in the WS (2.3 ± 1.4 m s−1) and a relatively higher level of RH (83.7 ± 9.3 %). Apparently, the stagnant meteorological conditions were favorable for the accumulation of pollutants from local emissions. Significantly higher levels of NOx (98.2 ± 46.6 ppbv) and VOCs (74.5 ± 31.5 ppbv), in addition to NO NO2 (1.30 ± 1.09) and toluene benzene (T B, 3.8 ± 1.7) ratios, were also observed during local episodes, reflecting their origin of local vehicular and combustion sources, with less influence from aging processes.
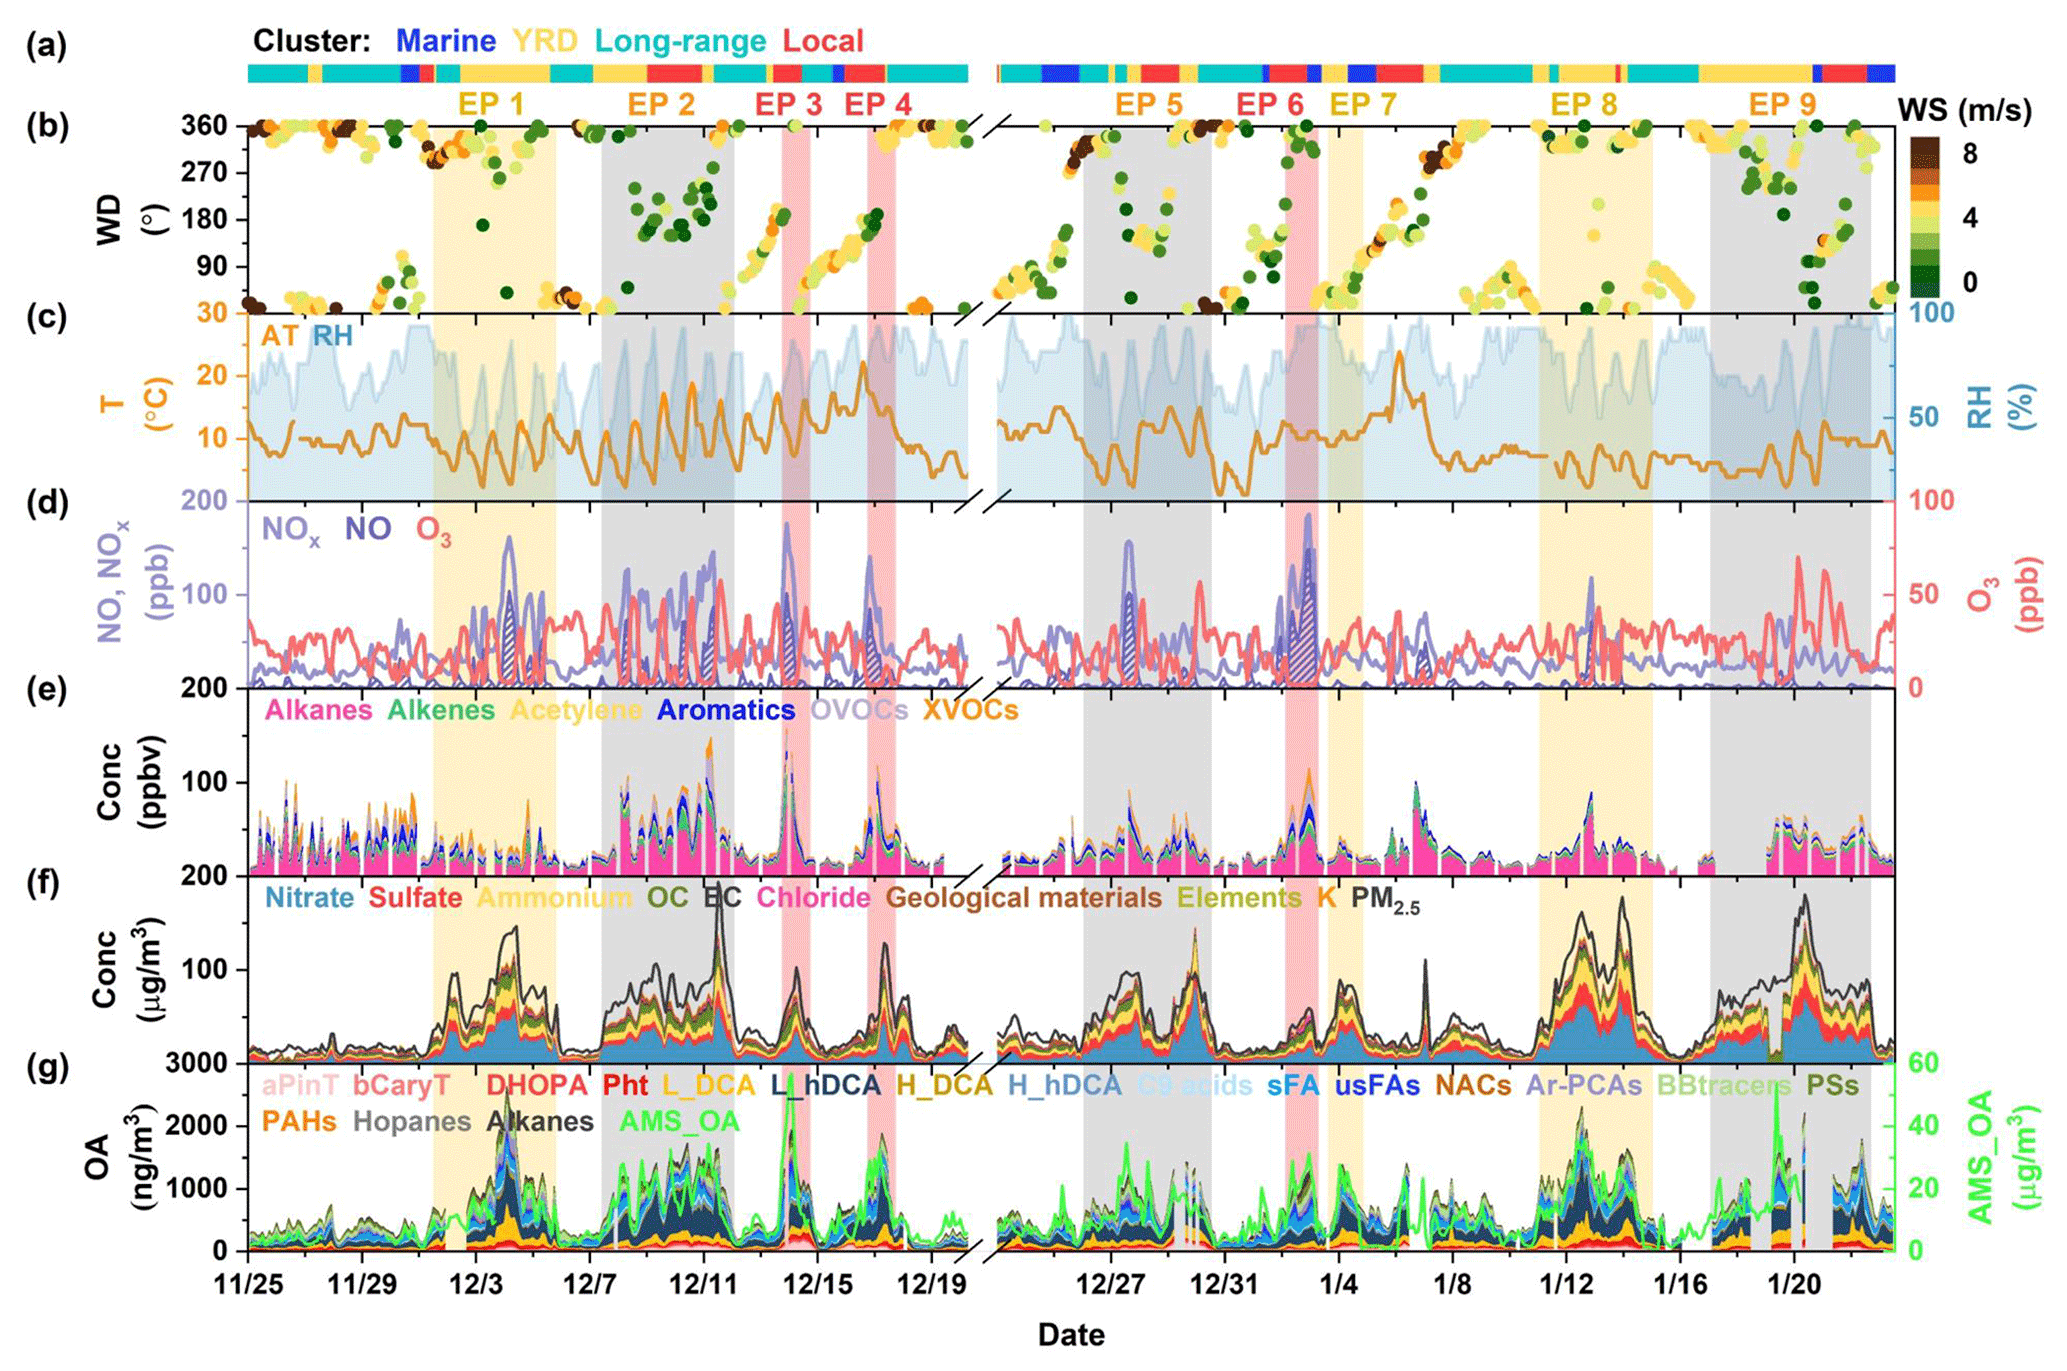
Figure 1Time series of (a) air mass clusters, (b) wind direction (WD) and wind speed (WS), (c) temperature (T) and relative humidity (RH), (d) NO and NOx, O3, (e) VOCs measured by GC-MS (see Table S2 for the VOC groups and individual VOCs), (f) major components of PM2.5 and total PM2.5 (dark line), and (g) organic molecular groups in PM2.5 measured by TAG and total OA (green line) in PM1 measured by AMS during the campaign. The concentration of geological materials was calculated to be 2.49[Si] + 1.63[Ca] + 2.42[Fe], and the concentration of elements was calculated as the sum of V, Cr, Mn, Ni, Cu, Zn, As, Se, Ba, and Pb. The nine episodic events were shaded in yellow, gray and red, representing transport, mixed-influence episodes, and local episodes, respectively.
Table 2Summary of meteorological parameters, ambient pollutants, PM2.5 major components, and diagnostic ratios for different types of episodes and non-episodic periods. Note that ppbv is for parts per billion by volume.
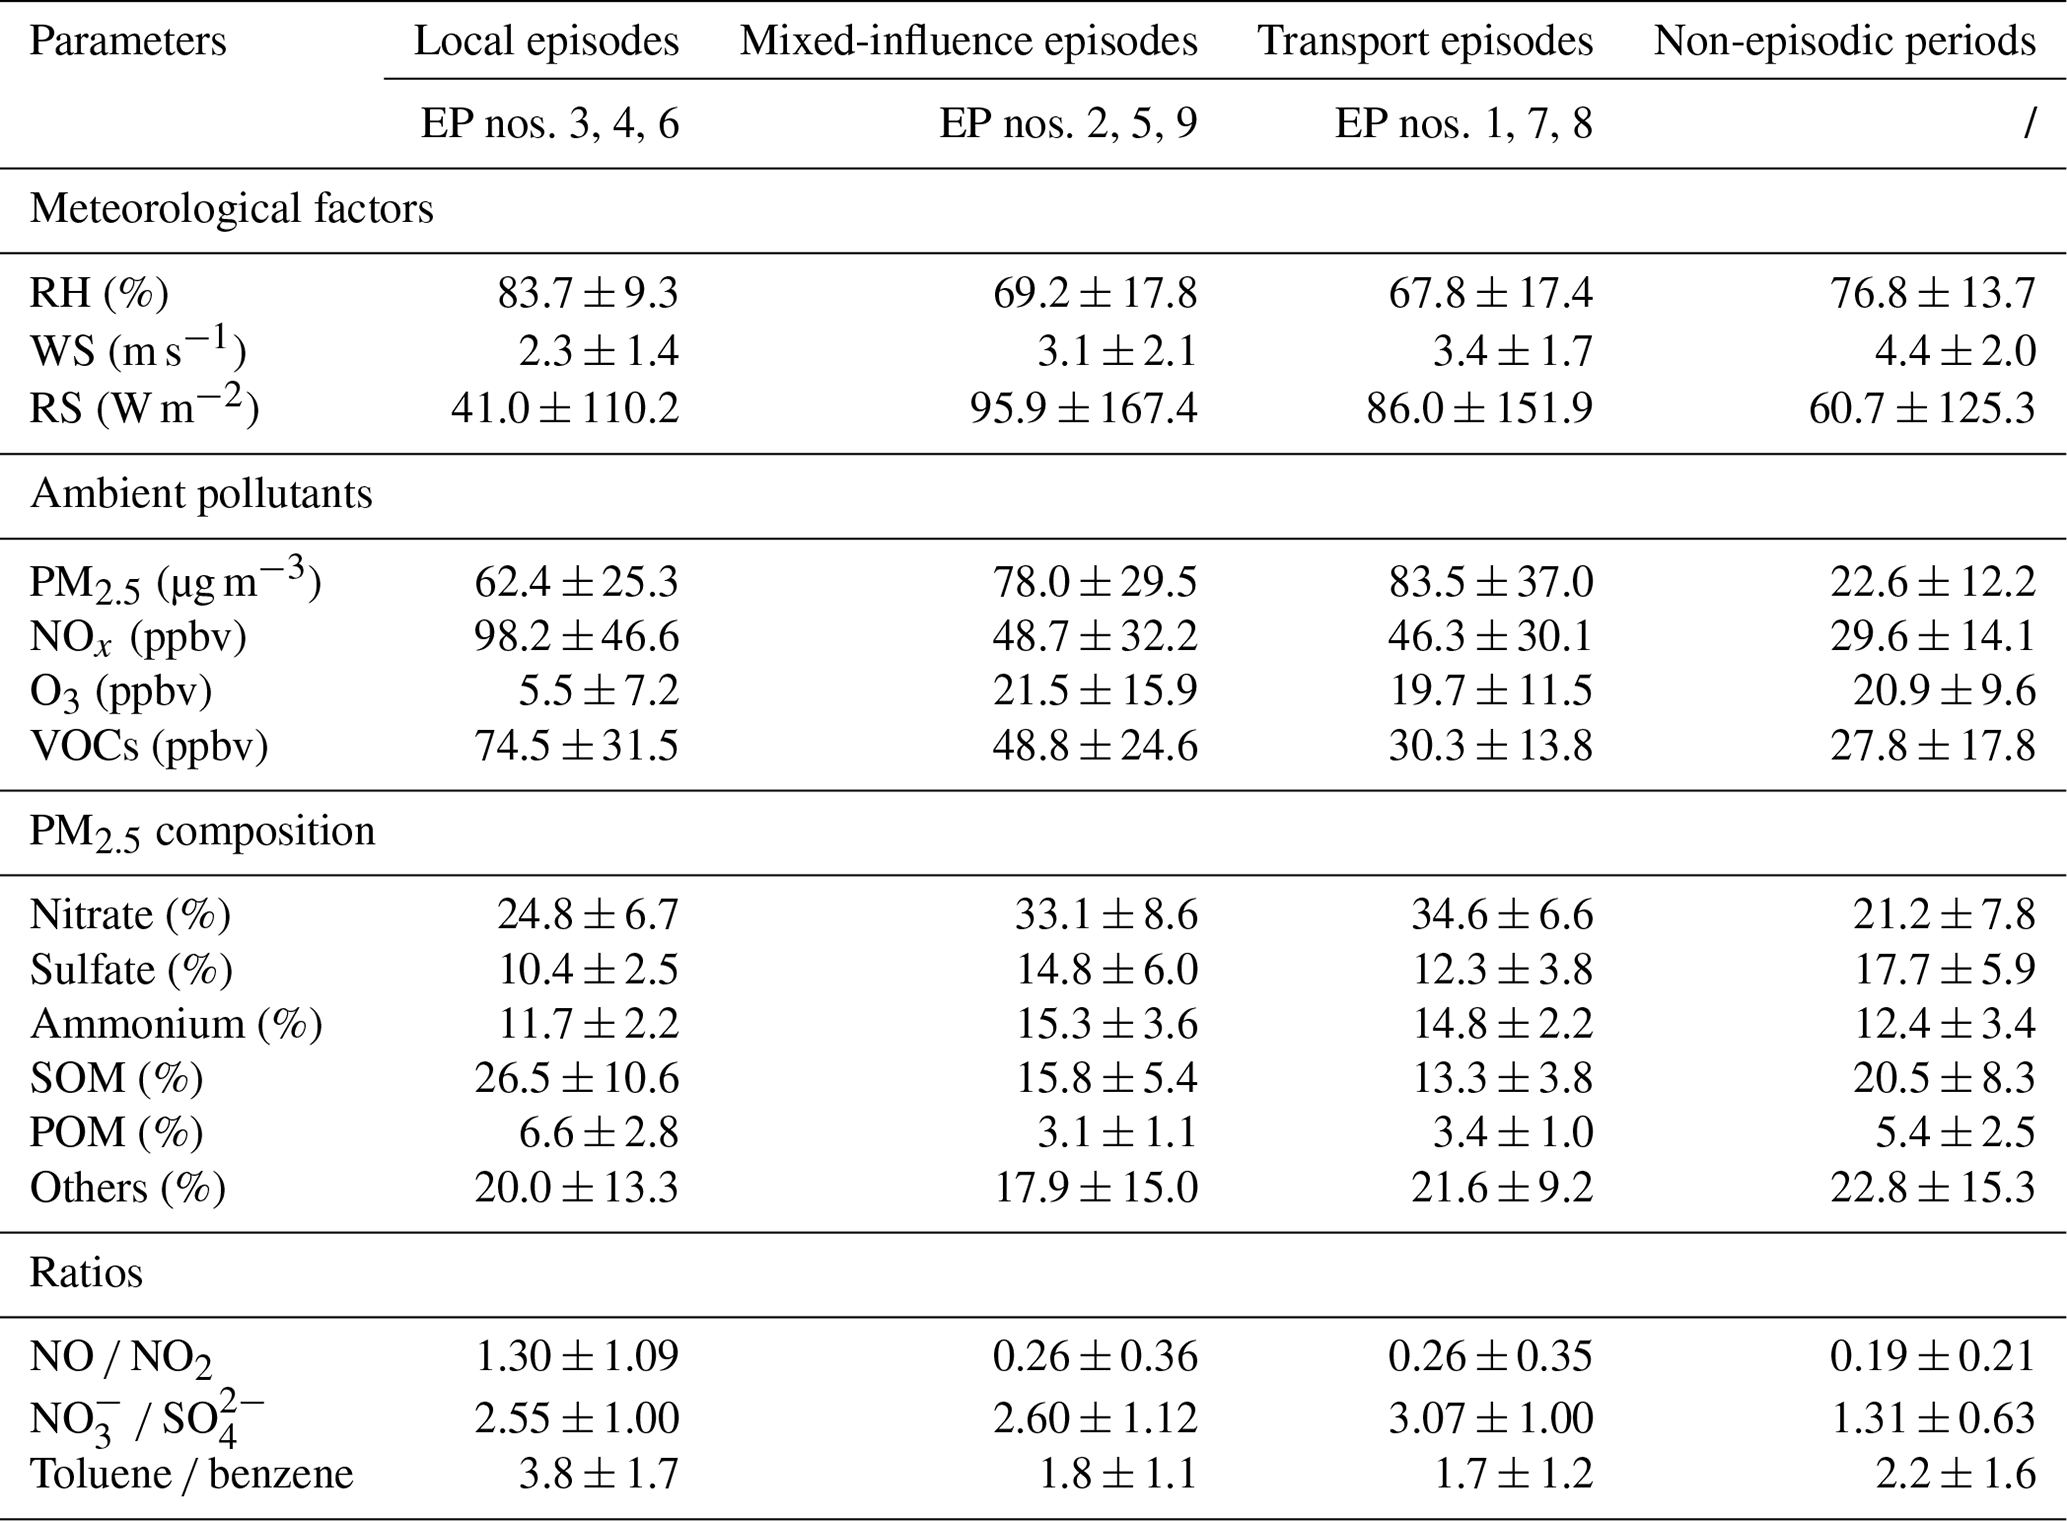
Figure 2b shows the chemical compositions in PM2.5 and mass percentages of SOM during the nine episodes, in addition to non-episodic periods, and Fig. 2c compares the mass increment ratios and mass percentages of SOM with that of combined secondary inorganic aerosols (SIA; including NO, SO ,and NH) among different episodes. In general, secondary species (e.g., NO, SO, NH, and SOM) constituted the largest fraction of PM2.5 during both polluted (68 %–86 %) and clean (75 %) periods, yet the composition was substantially different. Mass contributions of secondary inorganic aerosol to PM2.5 were much higher during transport episodes and mixed-influence episodes. Especially for nitrate, which accounted for 31 %–40 % of the PM2.5 average concentration during transport episodes versus 23 %–28 % of the PM2.5 mass concentration during local episodes and non-episodic days. In contrast, SOM took up a more prominent portion in PM2.5 during local episodes and ranged from 22 % to 27 %. The highest portion of SOM (27 %) occurred during the local episode (EP no. 6), and this fraction even exceeded nitrate (26 %).
While SIA had comparable percentage contributions to PM2.5 during all episodes (46 %–72 %), a higher mass increment of SOM was observed during local haze episodes, with a ratio of 2.8–3.9 to non-episodic periods, highlighting the importance of secondary organic aerosol formation in local PM2.5 pollution. Indeed, primary species (e.g., POM, EC, potassium, chloride, geological material matters, and other trace elements) also showed noticeable increases, with summed contributions up to 29 % during local episodes, while their percent contributions during the transport and mixed-influence episodes were in the range of 8 %–14 %. The higher proportions of primary species together with significantly higher values of NO NO2 and T B ratios indicate that local PM2.5 episodes in Shanghai were largely influenced by freshly emitted primary pollutants in local areas. These results suggest largely different sources for and chemical processing of PM2.5 being formed under different haze types.
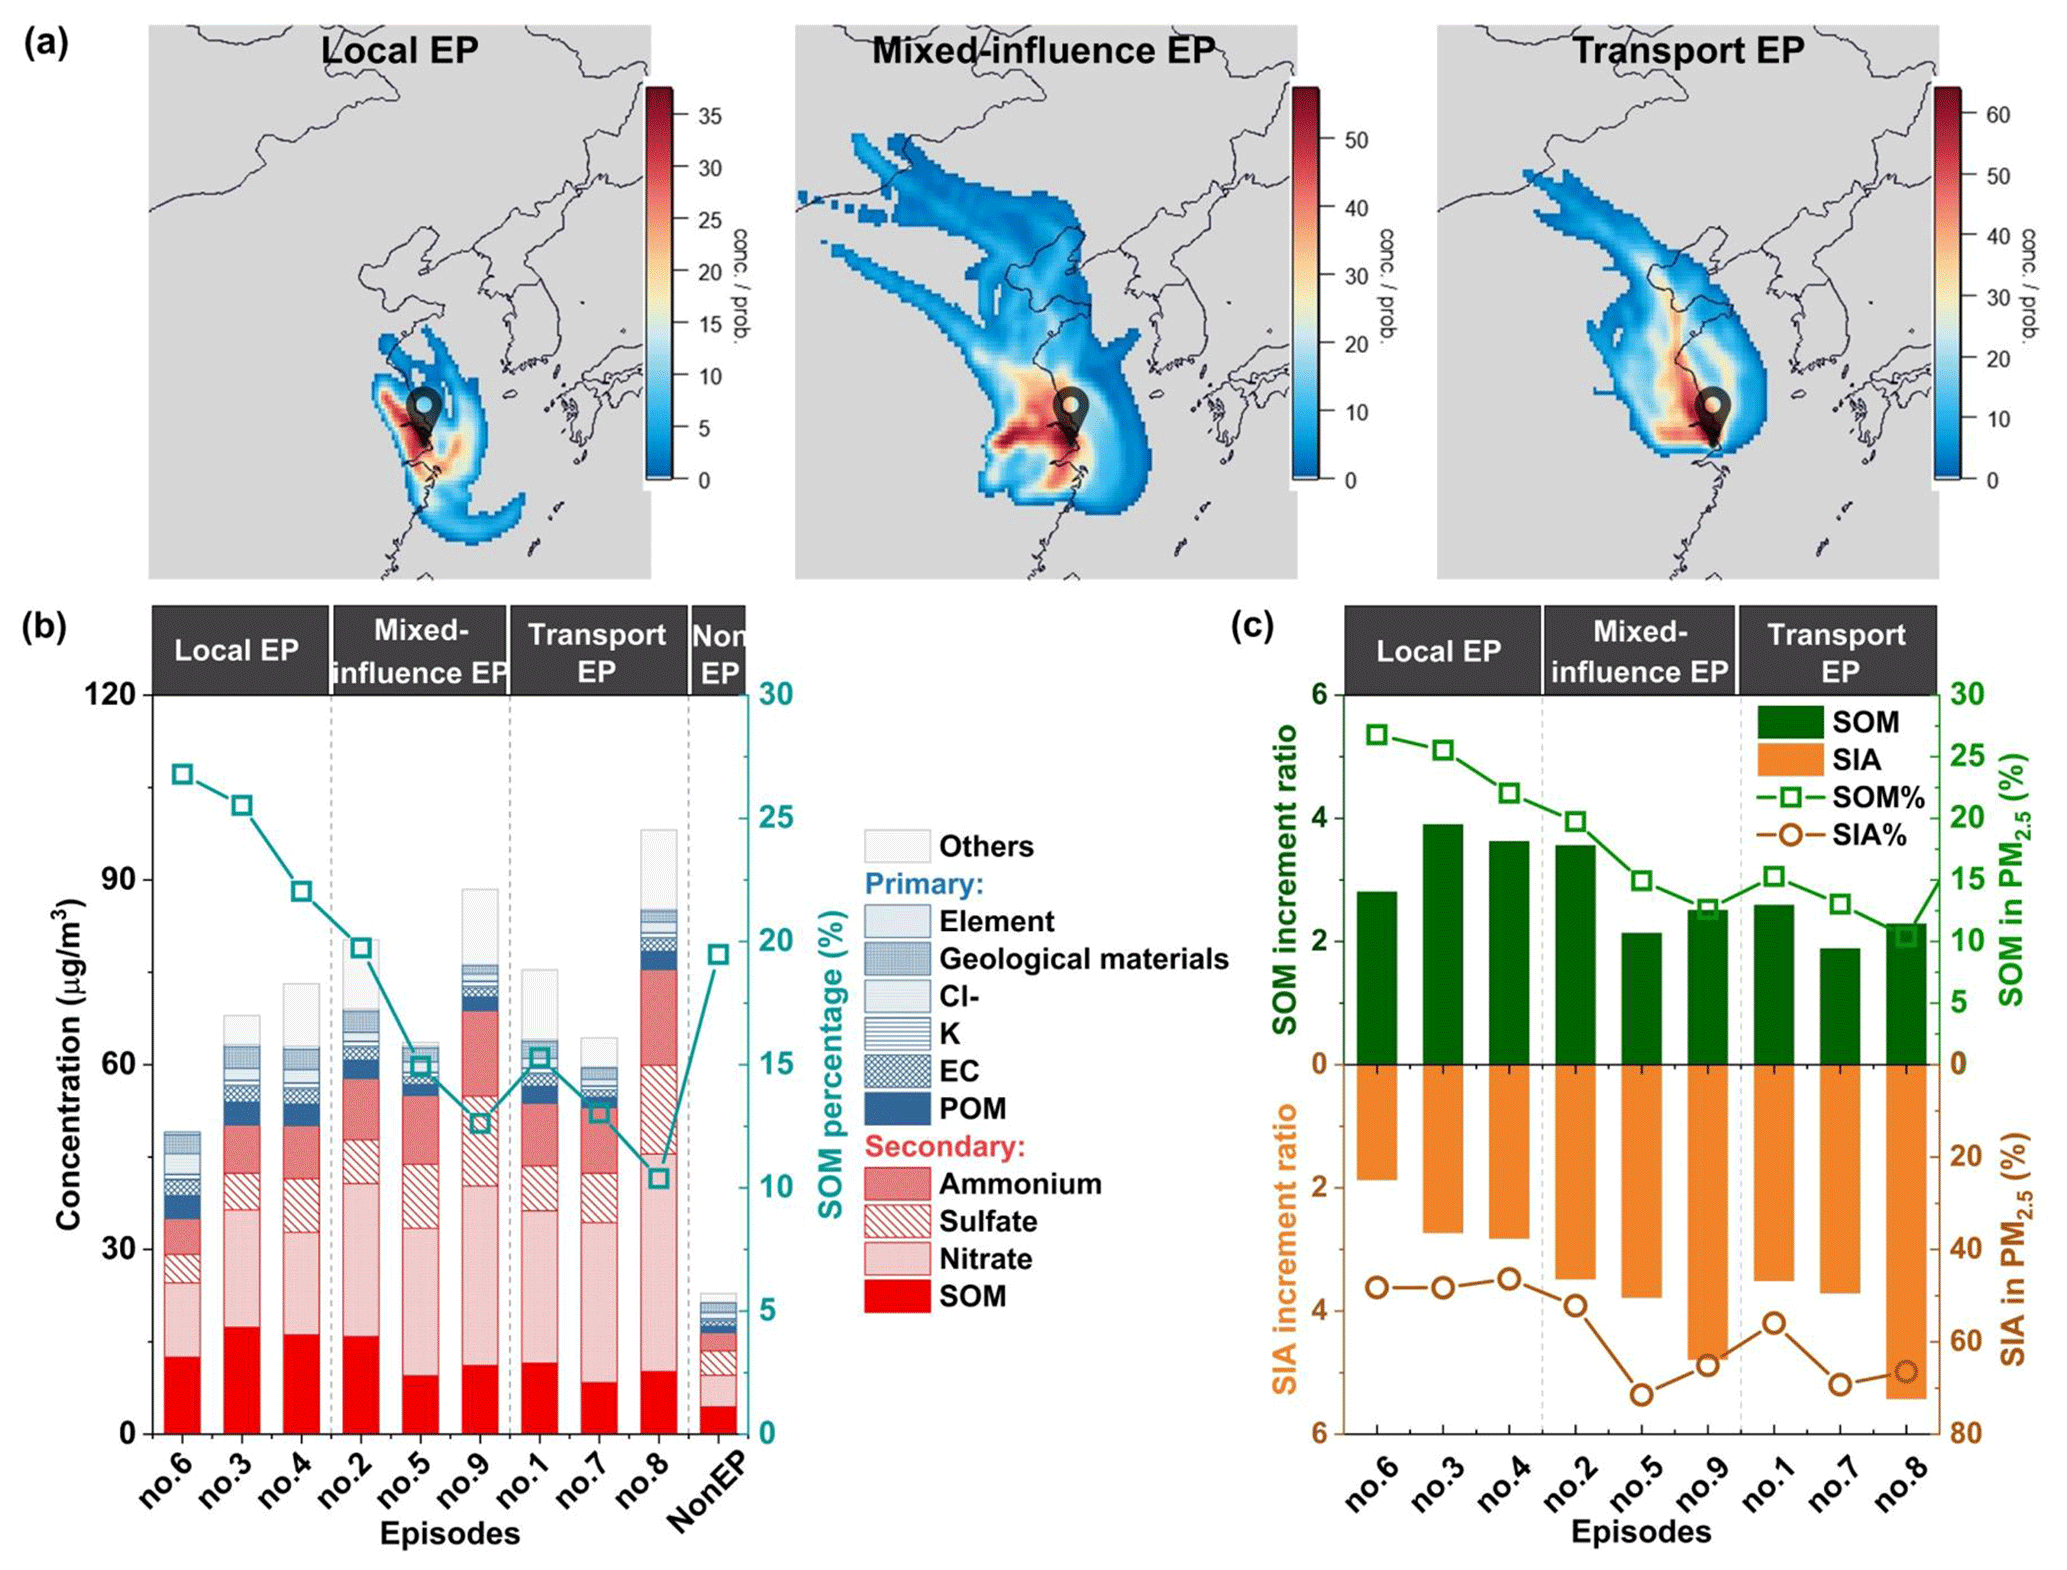
Figure 2(a) Concentration-weighted trajectory (CWT) maps for PM2.5 (the droplet icon in the maps represents the location of the observation site) and (b) its chemical compositions during different episodes. (c) Comparisons of mass increment ratios of SOM and combined SIA during different episodes, with reference to non-episodic periods. A mass increment ratio close to 1 indicates no obvious increment.
3.2 Characteristics of organic compound groups during haze episodes
3.2.1 Major classes of organic compounds in PM2.5
The average concentration of 98 total organic compounds measured by the TAG system during the campaign was 809 ± 499 ng m−3. Among the quantified OA markers, the L_hDCAs group exhibited the highest concentration (264 ± 187 ng m−3), which was dozens to hundreds of times higher than those of the other groups. Malic acid and glyceric acid were the main components of L_hDCAs, the former of which was also the most abundant individual compound among all 98 measured compounds. The average concentrations of malic acid and glyceric acid during the campaign were 156 ± 112 and 54 ± 44 ng m−3, respectively. These levels were at the same magnitude as those observed at urban sites in Hong Kong (Hu et al., 2008; Hu and Yu, 2013; Lyu et al., 2020). The concentration level of L_DCAs was only second to that of L_hDCAs, with an average value of 95 ± 83 ng m−3. The high mass concentrations and proportions of these highly oxidized organic molecules (L_hDCAs and L_DCAs) indicate that aerosols measured at this site were frequently aged. Of comparable concentration to L_DCAs was saturated fatty acids (sFAs; 93 ± 80 ng m−3), signaling the influence of cooking activities on PM2.5 at this urban site. As listed in Table S1, BBtracers, which are specific organic molecular tracers for biomass burning, had an abundance level of (72 ± 41 ng m−3). Ar-PCAs were indicators for secondary products of biomass burning emissions (He et al., 2018; Schauer et al., 2002). The sum concentration of Ar-PCAs was 40 ± 33 ng m−3 during the campaign. Ar-PCAs were well correlated with both BBtracers (Fig. S2) and secondary inorganic ions (Fig. S6). The relatively high concentrations of BBtracers and Ar-PCAs among the 18 groups imply that biomass burning activities during wintertime still persisted and were transported to urban Shanghai, despite the prohibition of field fires being implemented in recent years. The unambiguous molecular information offered by the TAG system also enables us to interpret OA aging processes through specific SOA tracers and their formation chemistry established in controlled chamber experiments. Among the SOA groups, L_DCAs and L_hDCAs were regarded as aging SOA tracers, since their formations require multiple oxidation steps in the chamber experiments (Ervens et al., 2004; Yang et al., 2008). While for some other SOA tracers, such as pinic acid and pinonic acid, which were classified into αPinT, they were interpreted as fresh SOA, since they have been confirmed by a number of chamber studies that are early-generation SOA products of α-pinene ozonolysis (Kristensen et al., 2014; Ma et al., 2008; Szmigielski et al., 2007). The strong correlations of L_DCAs and L_hDCAs with more-oxidized organic aerosol (MO-OOA) derived from AMS measurements and αPinT with less-oxidized organic aerosol (LO-OOA; Fig. S3) further support our interpretations of aging and non-aging SOA.
3.2.2 Comparison of OA variations between local and transport episodes
Table 3 reveals the distinct concentration levels of organic markers for different air pollution types, and Fig. S7 shows their mass percentages. In general, the proportions of organic molecular groups in PM2.5 differed among different episodic types. During local episodes, the TAG-measured OA (average 1409 ng m−3) was characterized by sizable contributions from primary and secondary anthropogenic organic molecules, including alkanes, PAHs, hopanes, uFAs, sFAs, C9 acids, DHOPA, and Pht, which contributed 47 % of the mean mass concentration. On the contrary, the TAG-measured OA during transport episodes (average of 1164 ng m−3) was dominated by secondary organic molecular groups such as L_DCAs (167 ± 103 ng m−3) and L_hDCAs (358 ± 176 ng m−3) when examining the relative proportion of primary and secondary organic molecules. These two groups have been highlighted as the later oxidation products of primary precursors with a wide range of sources, and they made up 45 % of the mean mass concentration. Despite the notably lower contributions (32 %) from the sum of primary organic molecules (sFAs, uFAs, BBtracers, PSs, alkanes, PAHs, and hopanes) during transport episodes, the average proportion of BBtracers in TAG-measured OA ascended from 5 % during local episodes to 10 % during transport episodes. Higher contributions from Ar-PCAs and NACs were also observed during the mixed-influence episodes and the transport episodes, when compared with the local episodes, suggesting that biomass burning played an important role in the accumulation of transported PM2.5. Overall, TAG-measured OA was over 20 % more abundant in the mass concentration in the atmosphere during local episodes when compared to the mixed-influence episodes and the transport episodes.
Table 3Mean levels of TAG-measured organic molecular groups and total OA during different types of PM2.5 pollution episodes.
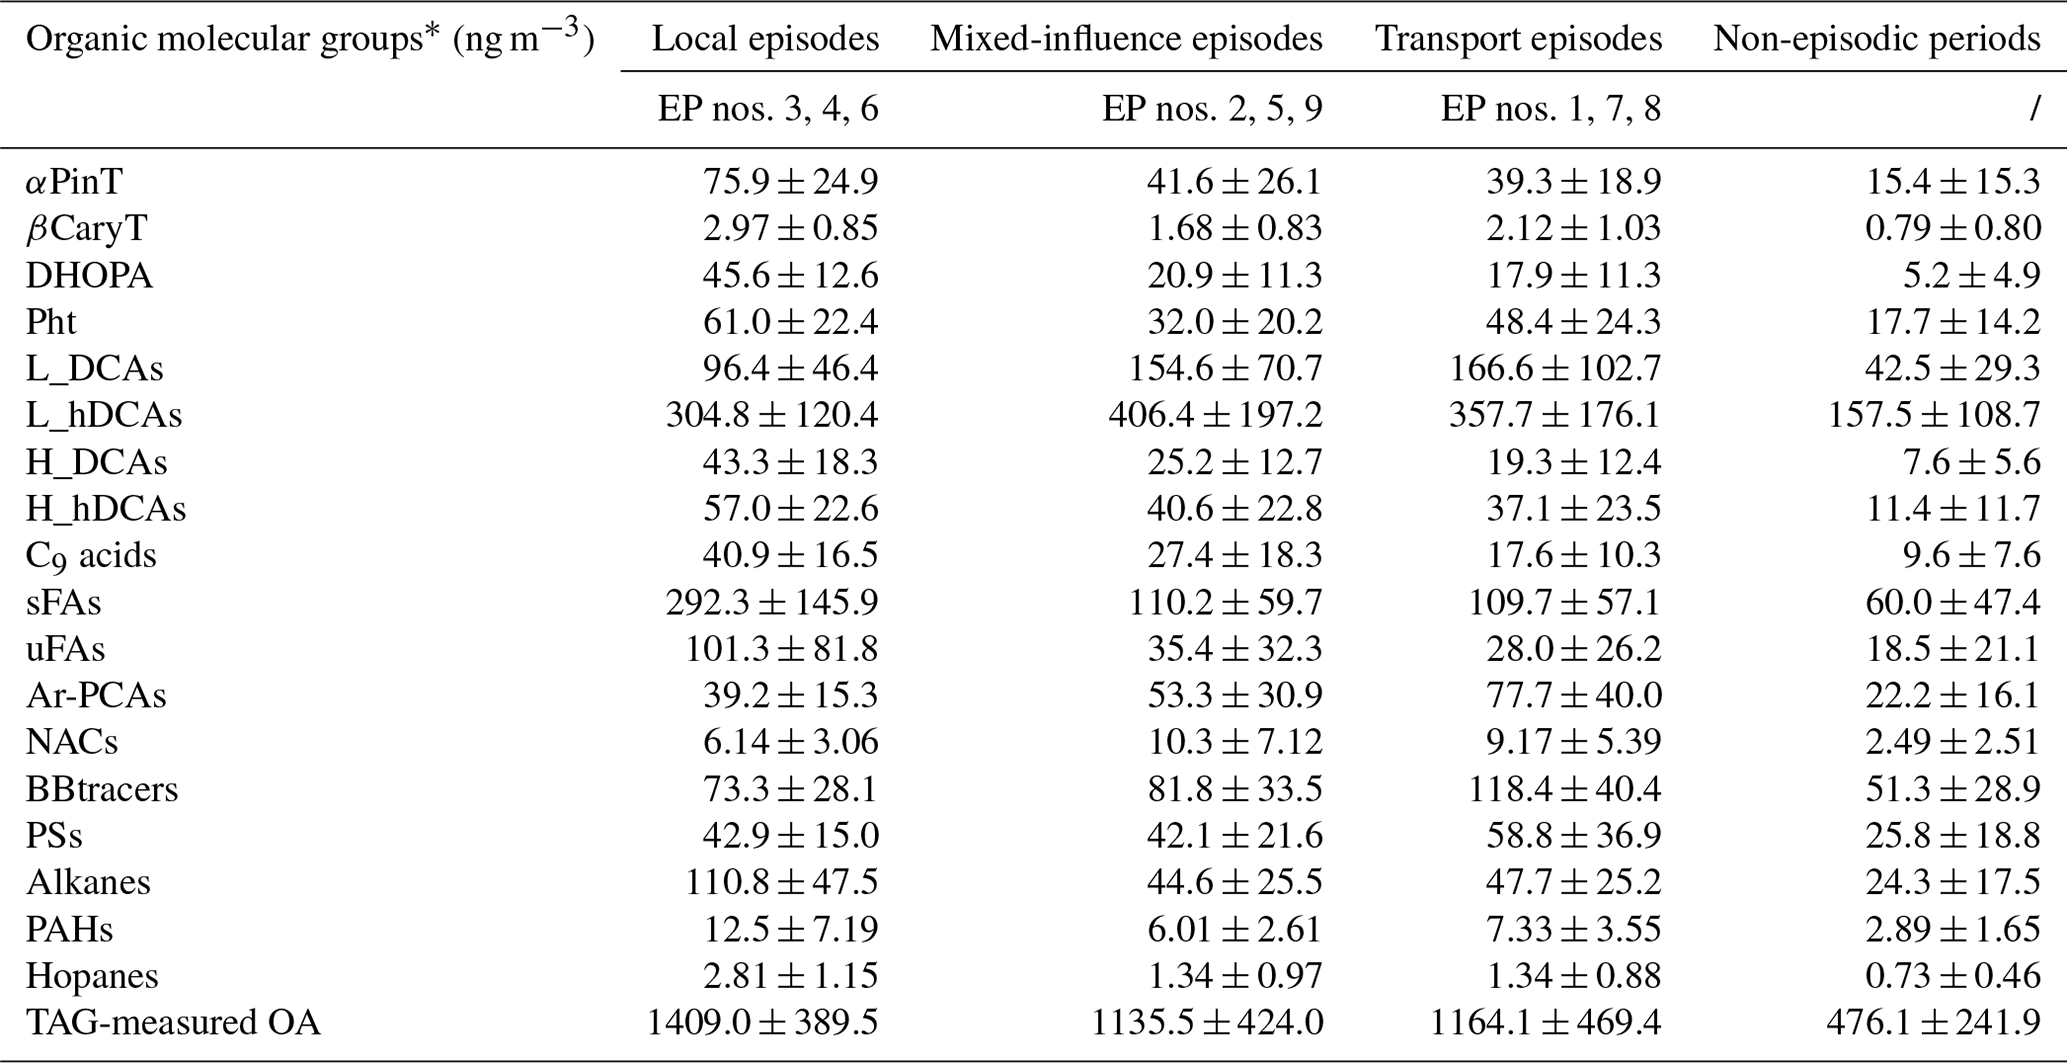
* The full names of the listed organic molecular groups and their included compounds can be found in Sect. 2.2.1 and Table S1.
Figure 3 compares the mass abundances of four groups of species between episodic periods and non-episodic periods, including (1) individual TAG-measured organic molecules from the total TAG-measured OA, (2) major components in PM2.5, (3) subgroups of OA in PM1, as resolved by a positive matrix factorization (PMF) analysis of the AMS data, and (4) a single VOC out of the sum of a select set of VOCs, OVOCs, and XVOCs, where OVOCs denote oxygenated volatile organic compounds, and XVOCs refer to halogenated VOCs. Species positioned above the 1:1 line indicate enhancement during episodes. The results show that different sets of species were enhanced during the three episode types. During local episodes, the OA mass increments were mainly attributable to those from vehicular emissions (e.g., hopanes) and cooking activities (e.g., fatty acids). The mass percentages of primary vehicular-emitted tracers, such as PAHs, alkanes, and hopanes increased from 0.6 %, 5.1 %, and 0.1 % in the total TAG-measured OA during clean periods to 0.9 %, 7.9 %, and 0.2 % during local episodes, respectively. Saturated and unsaturated fatty acids showed a drastic increase from 16 % (non-episodes) to 28 % (local episodes). Other inorganic species, including EC, chloride, and elements also exhibited higher mass proportions in PM2.5 during local episodes, indicating that local primary emissions such as vehicle exhaust and cooking played an important role in the formation of hazes. In addition to these primary components, vehicular and industrial-source-related secondary compounds, such as DHOPA and phthalic acid also showed elevated contributions in the total TAG-measured OA, with percentages of 3.2 % and 4.3 %, respectively, during local episodes. These results suggest that local anthropogenic sources were major contributors to elevating PM2.5 pollution. Note that, unlike sFAs and uFAs, the C9 acids, which were mainly ozone oxidation products of uFAs, did not show a drastic increase during the local episodes in their mass proportions in TAG-measured OA and AMS-derived OCOA in PM1. This could be explained by the significantly higher NOx concentrations and NO NO2 mass ratios during local episodes (Table 2), which likely suppressed O3 chemistry to a large extent. This hypothesis is also supported by the smaller increases in the mass concentrations of other ozonolysis SOA products, such as αPinT and βCaryT, which increased by 393 % and 276 % during local episodes in reference to non-episodic periods, respectively (Table 2). In comparison, DHOPA, which is a typical SOA product of monoaromatics reacting with OH radicals, showed a much more drastic increase of 777 % in the mass concentration during local episodes (Table 2). Such contrasts between SOA products from OH-initiated vs. O3-initiated oxidation pathways appear to suggest that the SOA formed during local episodes were more influenced by pathways other than ozonolysis (e.g., OH oxidation).
Different to local episodes, the majority of primary components during mixed-influence episodes and transport episodes decreased in mass percentage when compared with non-episodic periods. The mass percentages of sFAs, uFAs, alkanes, and hopanes in the total TAG-measured OA decreased to 9.4 %, 2.4 %, 4.1 %, and 0.11 % during the transport episodes from 12.6 %, 3.9 %, 5.1 %, and 0.15 % during clean periods, respectively. Exceptions were BBtracers, PSs, and PAHs, which exhibited comparable proportions during transport episodes and non-episodic periods. Similarly, primary inorganic species and AMS-derived primary OAs in PM1 also decreased in mass abundance during the mixed-influence episodes and transport episodes. On the other hand, the mass proportions of most secondary organic molecular groups elevated, with the summed values reaching 68 % during transport episodes and 72 % during mixed-influence episodes, which were remarkably higher than 55 % during local episodes and 61 % during non-episodic periods. It is noticeable that those TAG-measured organic molecules that increased in their mass percentages during local episodes were generally less oxidized when compared with that during mixed-influence episodes and transport episodes, which is consistent with the observation that transported PM1 contained higher proportions of MO-OOA, while LO-OOA accounted for more PM1 mass during local episodes (Fig. S7). In other words, the higher mass concentrations and mass percentages of OA in PM2.5 during local episodes were mainly contributed by primary OA and less-oxidized SOA, while aerosols during the mixed-influence episodes and transport episodes were generally influenced by more aged SOA.
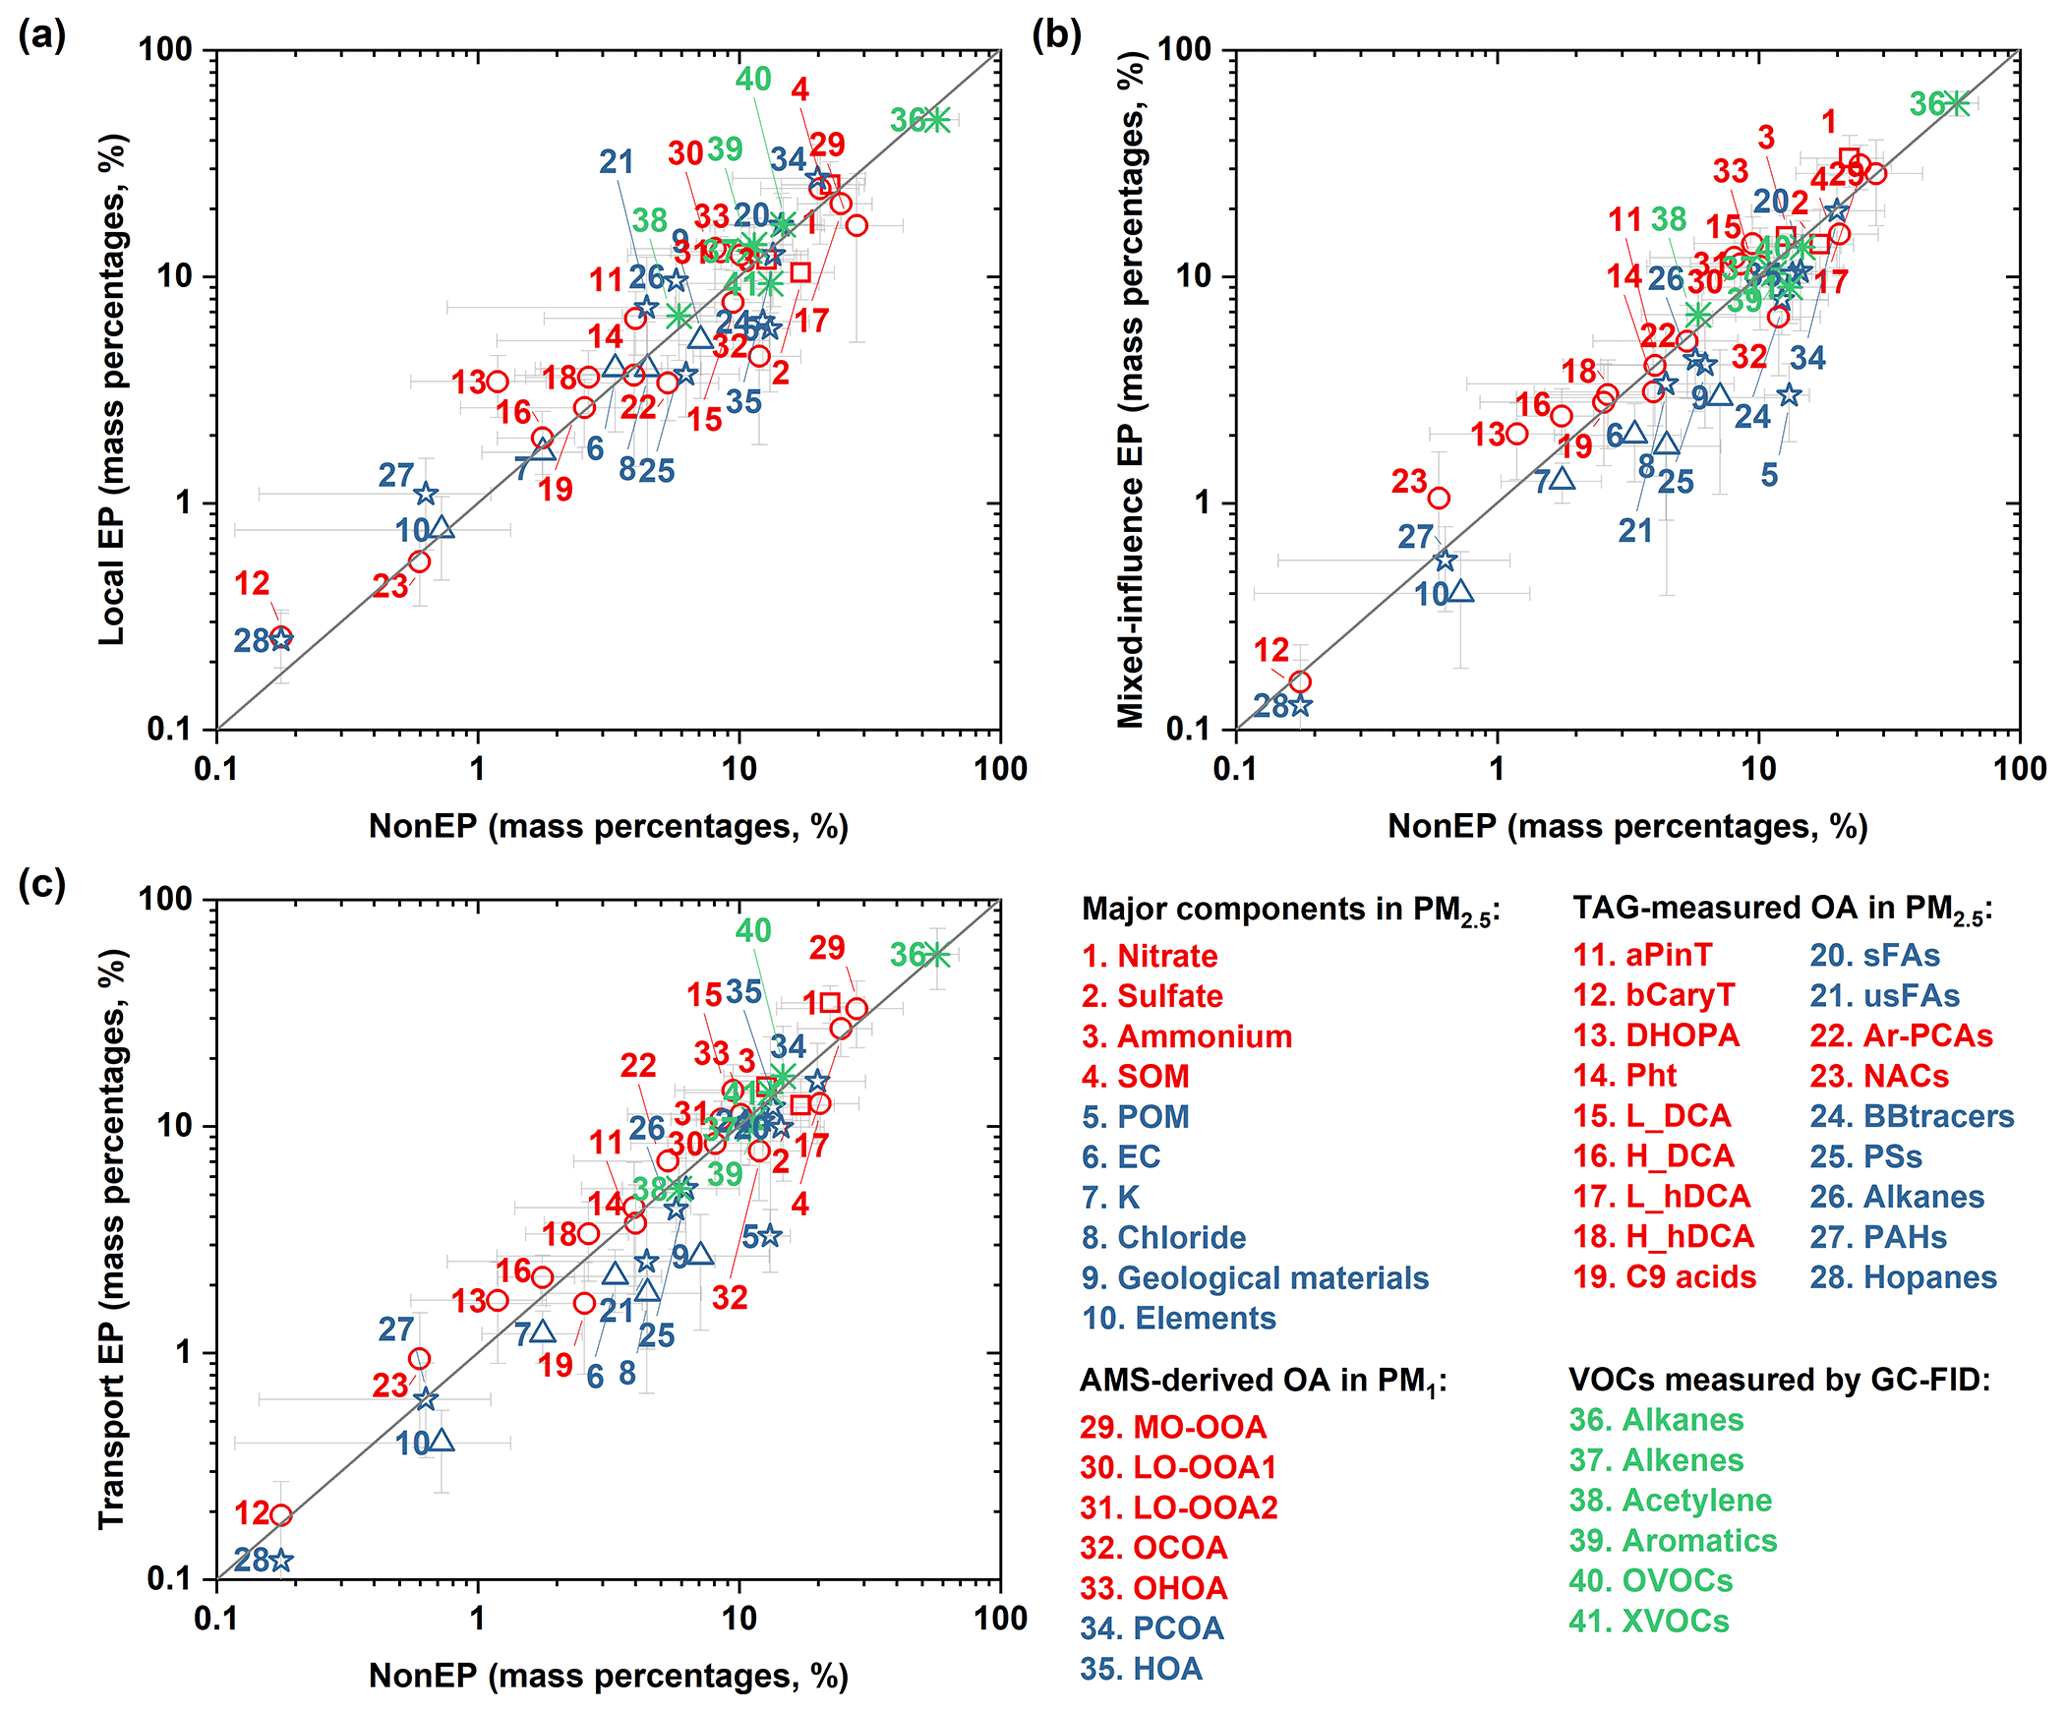
Figure 3Comparison of measured VOCs and PM components in mass percentages between (a) local episodes, (b) mixed-influence episodes, and (c) transport episodes against non-episode periods. The comparison plots cover four groups of mass percentages, namely individual organic molecules in the total TAG-measured OA, major components in PM2.5, sub-categories of bulk OA in PM1, and a single VOC in the sum of a select group of VOCs. Data are grouped by colors and symbols, with open red circles representing secondary origins, open blue triangles representing primary origins, and green asterisks representing donating VOCs (e.g., alkanes, alkenes, acetylene, and aromatics), OVOCs, and XVOCs in the total VOCs. The measured VOC species included in alkanes, alkenes, acetylene, aromatics, and OVOCs are given in Table S2. Detailed information related to the identification and quantification of AMS-derived OA subgroups in PM1 can be found in Huang et al. (2021). Data located above the 1:1 line indicate an increase in respective mass proportions during episodes when compared with non-episodic periods.
3.3 Variations in secondary organic molecular tracers during episodes
3.3.1 2,3-dihydroxy-4-oxopentanoic acid (DHOPA) and aromatic SOA estimates
As discussed in the previous sections, DHOPA in TAG-measured OA had a remarkable elevation in both the absolute mass concentration and mass proportion during local episodes. Correlation analyses of DHOPA versus other source tracers during different episodes were performed and are shown in Fig. S9. The moderate-to-strong correlations between DHOPA and the estimated SOM during all nine episodes reaffirmed the secondary nature of DHOPA. DHOPA played a larger role in SOA formation during local episodes in comparison with the mixed-influence episodes and transport episodes, as suggested by the generally higher R2 (0.55–0.75) and slopes (1.3–1.6) during local episodes.
It is also worthwhile to examine the correlations of DHOPA with primary tracers. DHOPA had strong correlations with hopanes during local episodes (R2: 0.62 to 0.82), but the correlations were much weaker during transport episodes (R2 0.34–0.56) and nearly negligible during mixed-influence episodes (R2: 0.00–0.28). In contrast, DHOPA had stronger correlations with PAHs (e.g., benzo[b]fluoranthene, benzo[k]fluoranthene, benzo[a]fluoranthene, benzo[e]pyrene, benzo[a]pyrene, indeno[1,2,3-cd]pyrene, and benzo[ghi]perylene; R2 0.53–0.72) during transport episodes, which was likely related to coal combustion. Such differences could be explained as a result of differing aromatic precursor sources for DHOPA during local episodes versus transport episodes, with the dominating precursor sources being the vehicular emissions during local episodes versus sources such as coal combustion and biomass burning under the influence of transported air.
Taking advantage of the DHOPA data, we used a modified tracer-based method proposed by Gao et al. (2019) and Zhang et al. (2021a) to estimate the aromatic SOA from ambient DHOPA measurements, with gas particle partitioning effects taken into consideration. The aromatic SOA could be seen to consist of (1) semi-volatile aromatic SOA (SemiASOA), which is formed via gas particle partitioning processes, and (2) more-oxidized aromatic SOA (MoASOA) that is associated with later-generation products (e.g., oligomers and dicarbonyl compounds). Although a number of monoaromatics can form DHOPA, only toluene and xylenes were included in the SemiASOA estimation, due to their predominant presence in urban area. The well-estimated hourly DHOPA values further confirmed this. The mass yield coefficients of toluene and xylenes under high NOx conditions were adopted from previous chamber experiments (Al-Naiema et al., 2020), and more details about this estimation method are provided in Text S3.
In general, a significant fraction (62 %) of DHOPA was oxidized from m- or p-xylenes through high NOx pathways during wintertime in Shanghai, regardless of the episodic or non-episodic periods. Toluene only accounted for in 38 % of the DHOPA mass concentration on average under high NOx conditions (Fig. S12). Several previous studies have also verified that it is incorrect to attribute all DHOPA-based aromatic SOA estimation to toluene, and xylenes can be a more predominant precursor in aromatic SOA formation (Al-Naiema et al., 2020; Ma et al., 2018; Zhang et al., 2021b).
Comparing the contributions to total SOA from DHOPA-based semi-volatile aromatic SOA (SemiASOA), more-oxidized aromatic SOA (MoASOA), and SOA produced from precursors other than monoaromatic hydrocarbons (NonASOA) between episodic events and non-episodic periods (as shown in Fig. 4), a drastic elevation in the contributions from aromatic SOA were observed during episodic events. During non-episodic periods, aromatic SOA constituted around 21 % of the total SOA in wintertime in Shanghai, while this value rose to 32 %–44 % during episodic events. The mass contributions from aromatic SOA also increased from 0.94 µg m−3 during non-episodic periods to 3.3–7.5 µg m−3 during episodic events. This enhancement of the SOA formation during episodes emphasizes the importance of controlling aromatic precursors for mitigating PM2.5 pollution in a megacity like Shanghai. Especially during local episodes, considerable benefits from an average reduction of 38 % in SOA can be expected to be obtained if monoaromatic VOCs are effectively controlled.
Among the nine episodes, notably higher contributions from SemiASOA were observed in local episodes, which constituted 17 % of the total SOA on average. Relatively lower contributions (7 %–14 %) from SemiASOA and higher fractions (24 %–32 %) of oligomers and dicarbonyl compounds (MoSOAs) in the total SOA were found during mixed-influence episodes and transport episodes. This suggests that the SOA formed from aromatic hydrocarbons during mixed-influence episodes and transport episodes generally contained more highly oxidized organic products compared with local episodes, which is consistent with the observation as stated in Sect. 3.2.
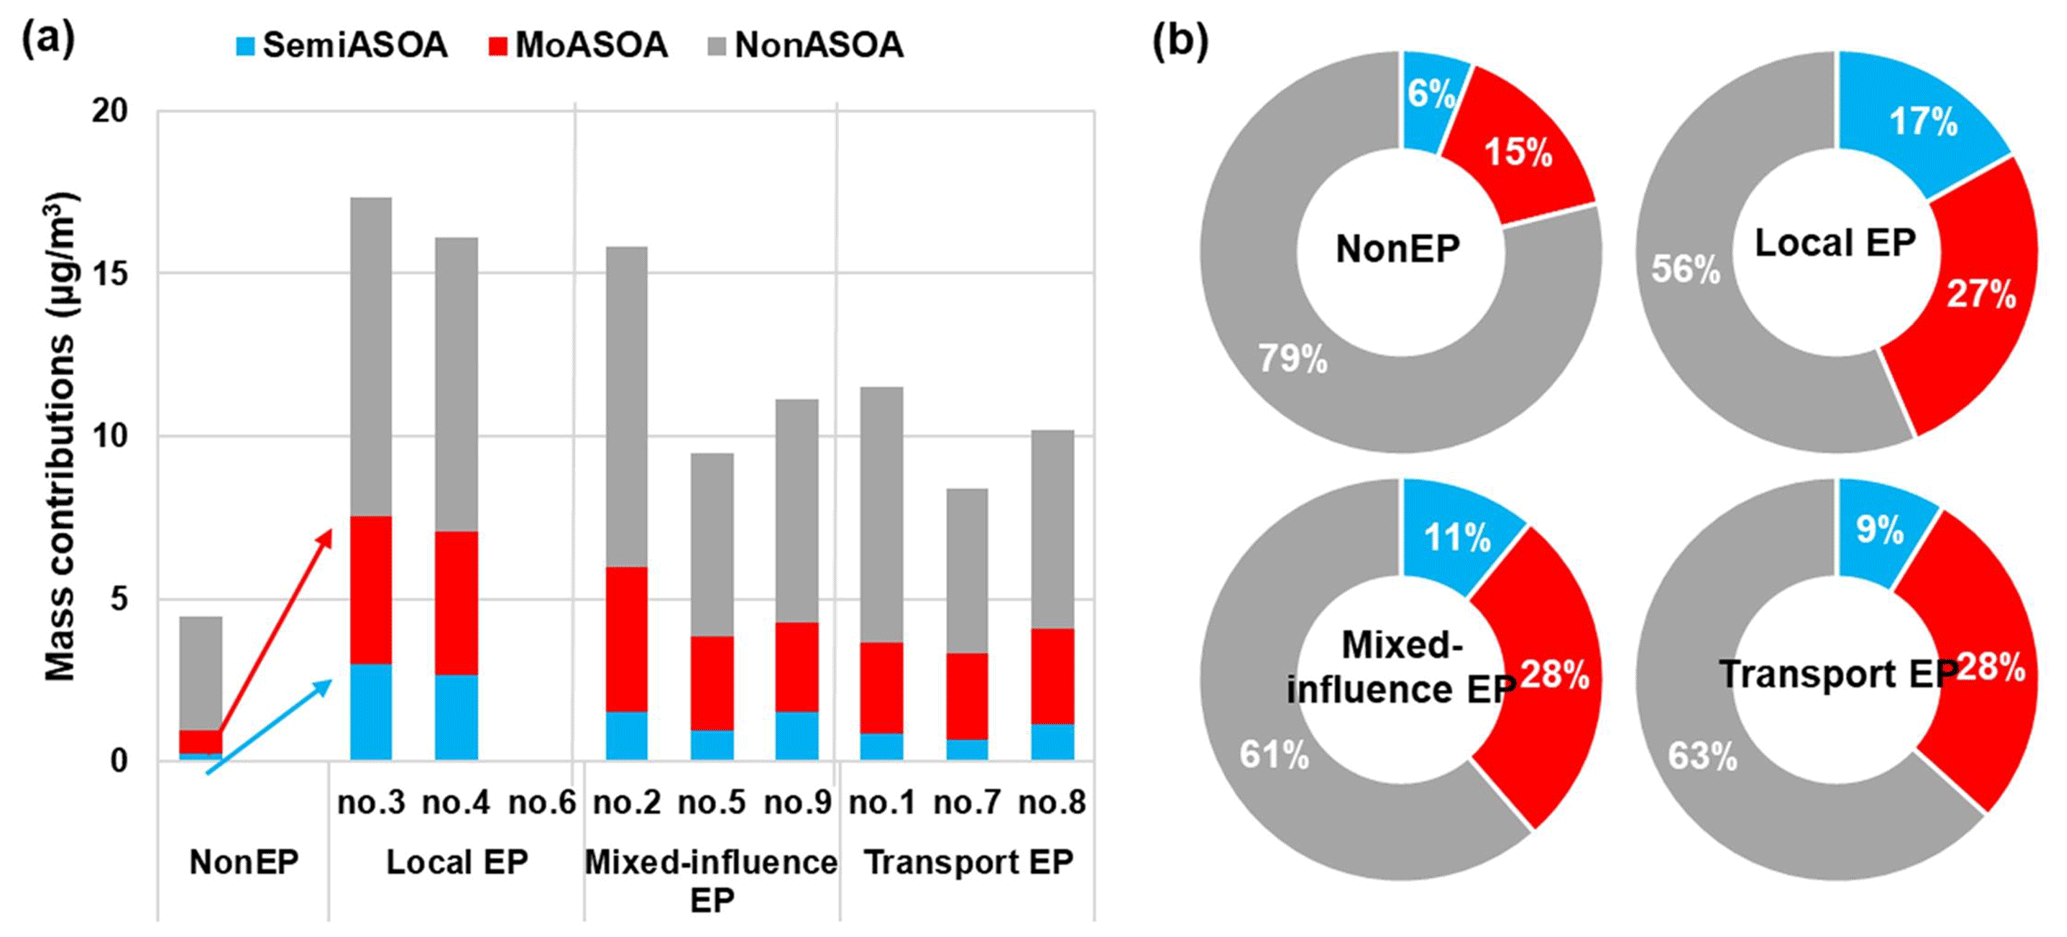
Figure 4Predicted (a) mass contributions and (b) percentage contributions to total SOA from semi-volatile aromatic SOA (SemiASOA), more-oxidized aromatic SOA (MoASOA), and SOA products oxidized from precursors other than aromatics (NonASOA) during episodic events and non-episodic periods. MoASOA was calculated here by subtracting SemiASOA from TotalASOA, and NonASOA was estimated by subtracting TotalASOA from SOM, which was calculated based on the OC EC ratio method.
3.3.2 Nitroaromatic compounds (NACs)
Both primary emissions from combustion sources and the nitration of aromatic hydrocarbons (e.g., benzene and toluene) are major sources of NACs in the atmosphere (Li et al., 2020; Wang et al., 2019; Yan et al., 2017). NACs measured in this study displayed moderate-to-strong correlations with SOM during all episodic events (Fig. S13), implying that they were likely secondarily formed from aromatic hydrocarbons. Figure 5 shows the evolution of NACs, with the increase in the concentrations of their VOC precursors during different episodes. During the whole campaign, benzene varied in the range of 0.0–1.9 ppb (parts per billion), while toluene varied in the range of 0.1–7.1 ppb. In general, NAC concentrations ascended with the increasing of toluene and benzene during all episodic events. During local episodes, NACs displayed a linear growth with the elevation of toluene concentrations, while they did not further increase with benzene concentrations when benzene concentrations were higher than 1.5 ppb (Fig. 5a, d). In comparison, NACs exhibited a linear increasing trend with benzene concentrations during the entire concentration range of 0.0–1.9 ppb, while the linear correlation of NACs with toluene ceased when toluene was higher than ∼ 3.5 ppb during mixed-influence episodes or ∼ 2.5 ppb during transport episodes (Fig. 5e, f). Toluene is a more reactive aromatic compound and more abundantly emitted from vehicular sources. As such, it is likely that toluene was a more predominant precursor in forming NACs during local episodes. Yet during mixed-influence episodes and transport episodes, benzene was a more dominant aromatic hydrocarbon precursor for NACs due to its relatively stable chemical structure and higher influences from coal combustion and biomass burning associated with air masses from northern China.
Figure S13 further confirms that NAC concentrations during transport episodes were largely impacted by biomass burning emissions. Hourly concentrations of NACs showed strong correlations with organic tracers, which is indicative of biomass burning (BBtracers) with R2 higher than 0.64 during transport episodes, while the correlation coefficients dropped to 0.30 during local episodes. Such results suggested that biomass burning was a major source of NACs in Shanghai during transport episodes and likely had a sizable influence during local episodes. The stronger correlations between NACs and SOM, with higher values of slopes during mixed-influence episodes and transport episodes, also suggested that NACs played a more important role in SOA formation during mixed-influence episodes and transport episodes.
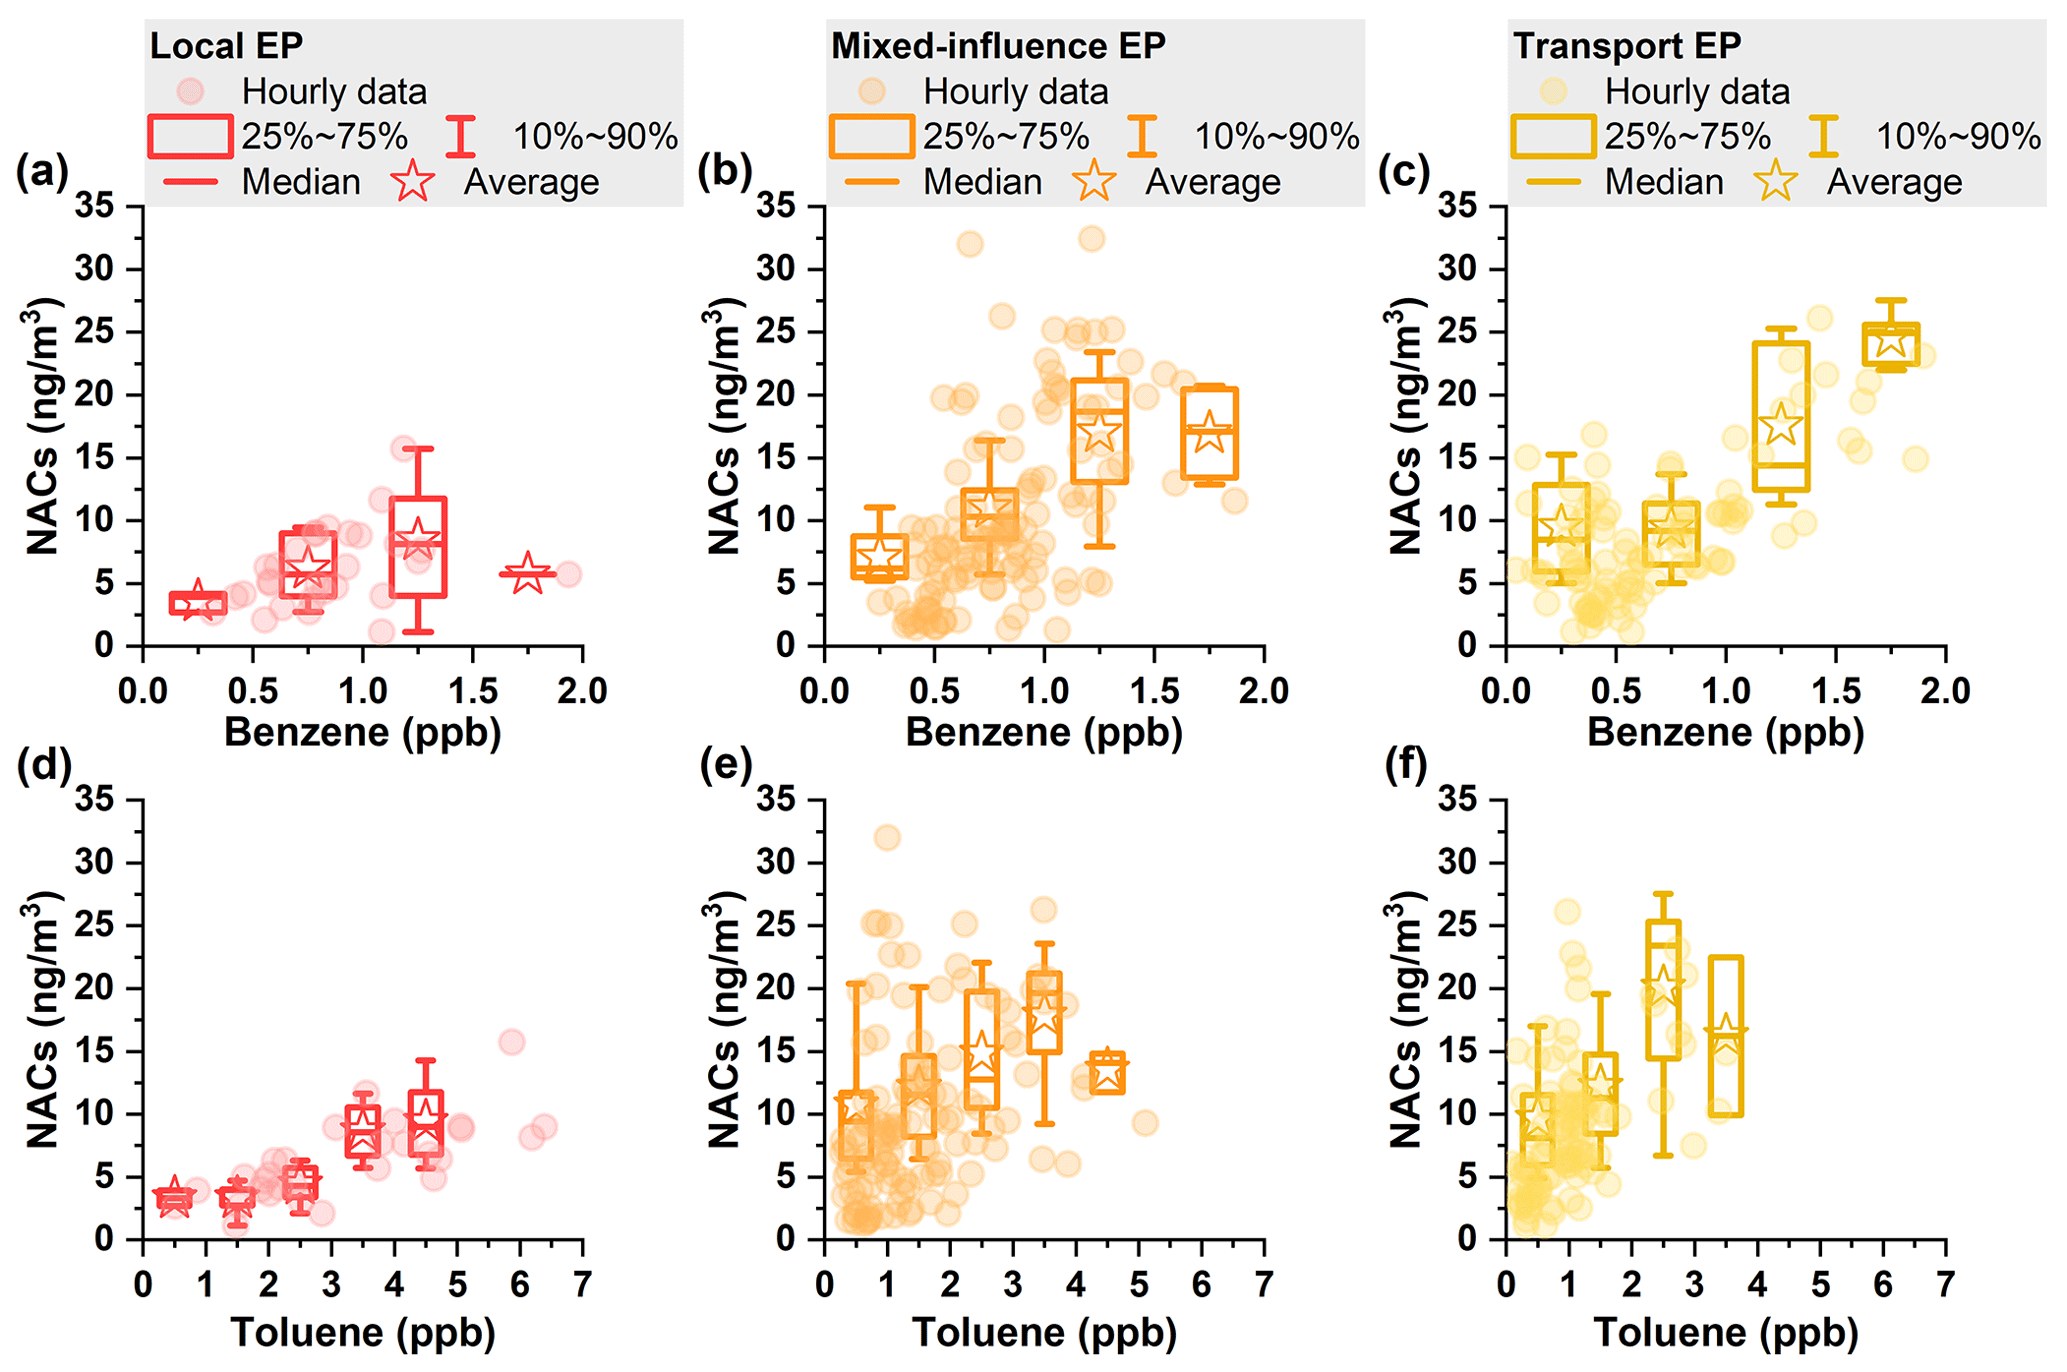
Figure 5Concentrations of NACs as a function of benzene and toluene concentration bins during the three types of episodic events. The markers represent the mean values, and whiskers represent the 25th and 75th percentiles.
Since NOx played an important role in controlling secondary products by influencing the fate of organic peroxy radicals (RO2; Kroll et al., 2006; Kroll and Seinfeld, 2008; Nihill et al., 2021; Peng et al., 2019), correlations of NO NAC ratios versus NO NO2 ratios were compared among different episodes (Fig. S13). During the three local episodes, the NO NAC ratio was negatively correlated with the NO NO2 ratios, with R2 ranging from 0.40 to 0.67. This suggested that the higher NO NO2 ratios under the influence of local air masses greatly hindered the local OH level, and RO2 branching chemistry was dominant under this high NO environment. In contrast, no correlation was observed between NO NAC and NO NO2 ratios during mixed-influence episodes and transport episodes, which may be attributable to the dominant role of OH reactions in both nitrate and NAC formations.
Both DHOPA and NACs are secondarily derived from monoaromatics, with DHOPA being a benzene ring-opening product, while NACs are ring-retaining products. We examined the variation pattern of the DHOPA NAC ratio under different RH and Ox level bins (Fig. S14a). An evident gradient was noted as a function of RH and Ox when the Ox concentration level was lower than 65 ppb. Under conditions of higher RH and lower Ox, a higher DHOPA NAC ratio was revealed, suggesting more conducive conditions for aqueous-phase processing in forming more-oxidized SOA. No clear trend was observed for DHOPA NAC ratios when the Ox level was higher than 65 ppb. It is likely that when the atmospheric oxidation capacity was enhanced, the competition between the benzene ring addition and open reactions were affected by multiple factors (e.g., abundance of VOC precursors and air masses).
Similar conclusion can be deduced from the variations in the NAC versus BBtracer ratios (Fig. S14b). The ratios presented the highest values in the top-left corner and experienced small changes as RH increased when Ox was less than 55 ppb, indicating that gas-phase photooxidation is a more dominant pathway for the formation of NACs in winter Shanghai. Previous studies also showed that high atmospheric oxidation capacity facilitated the transformation of monoaromatics into particle-phase NACs and increased the NAC concentrations substantially (Salvador et al., 2021; Yuan et al., 2016).
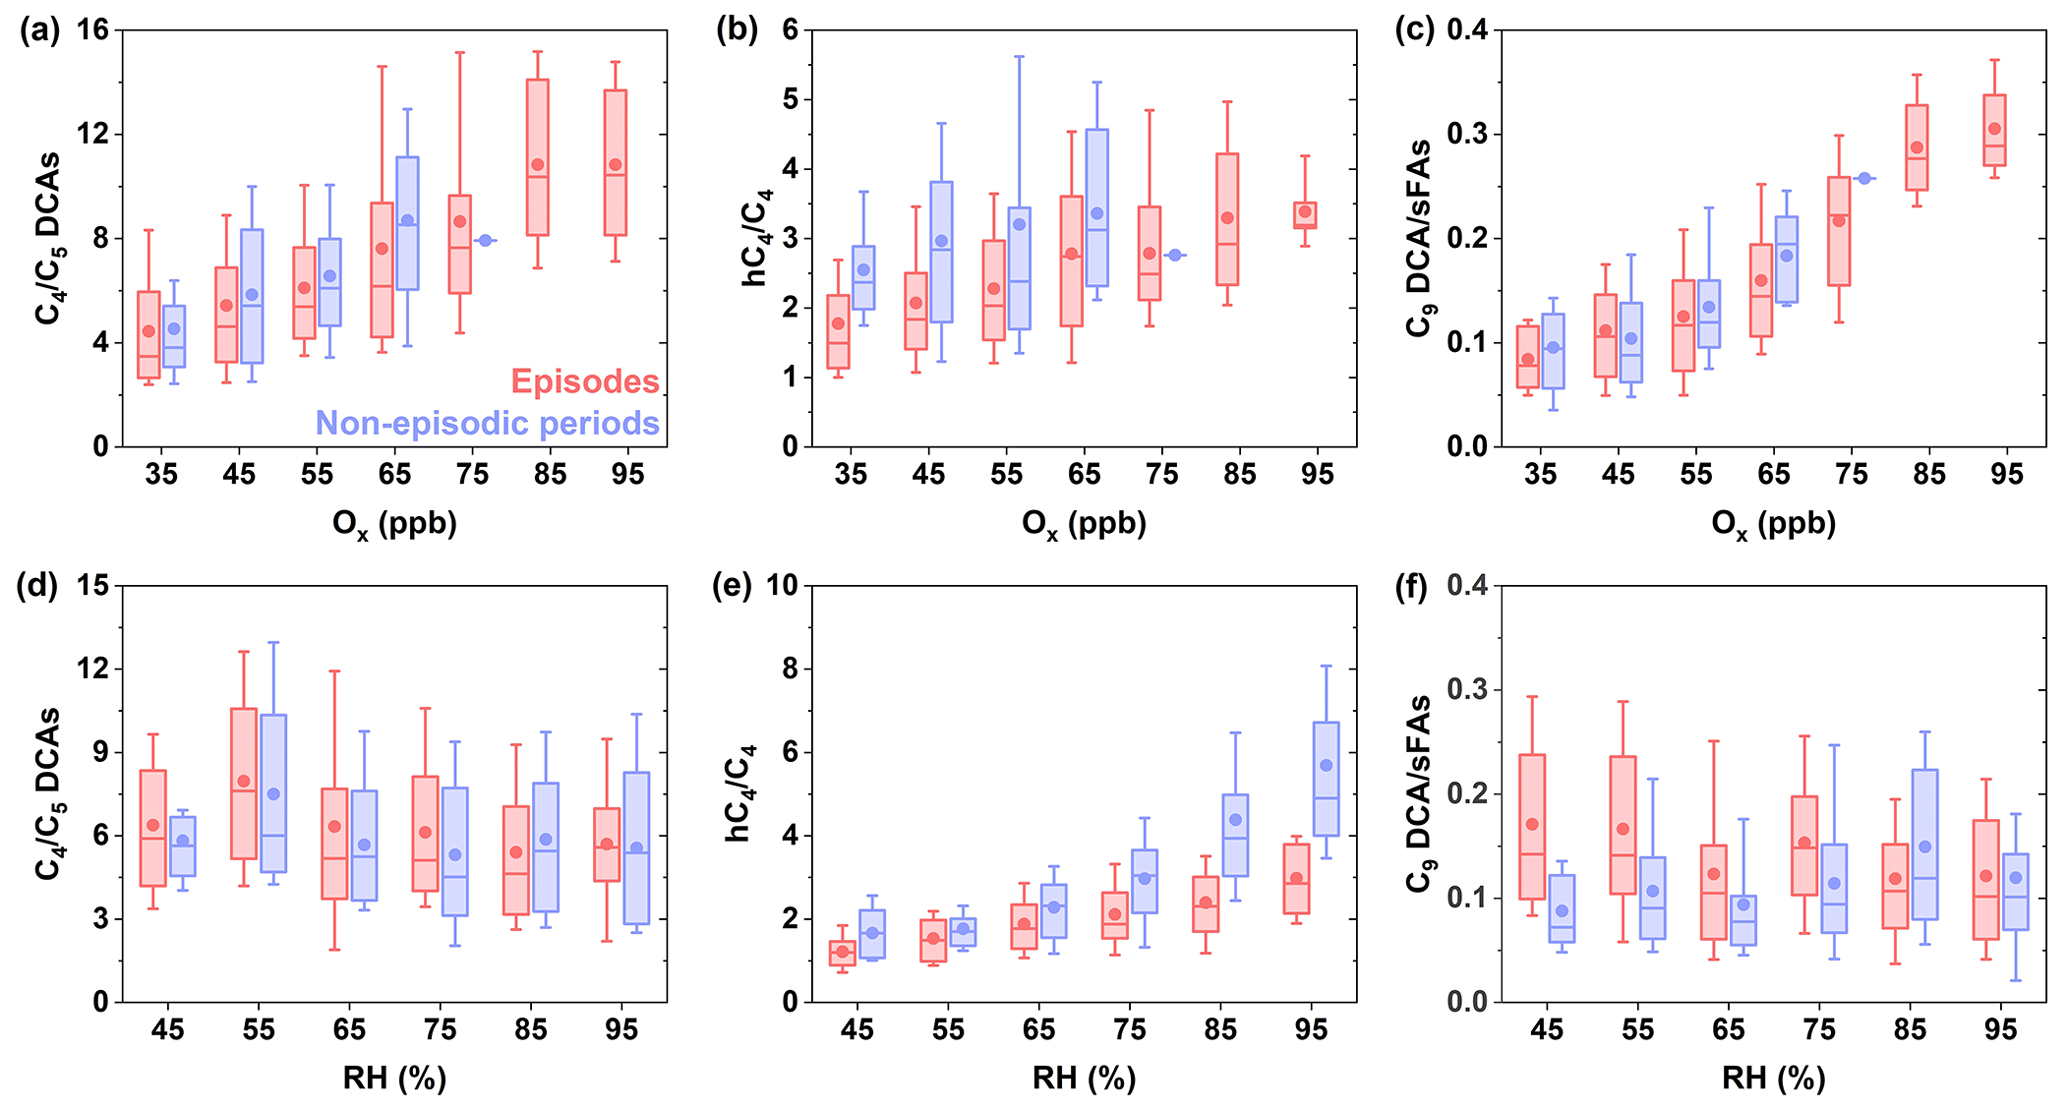
Figure 6Ratios of (a) C4 C5, (b) hC4 C4, and (c) C9 sFAs as a function of Ox concentration bins and (d) C4 C5, (e) hC4 C4, and (f) C9 sFAs as a function of RH-level bins during episodic and non-episodic events.
3.3.3 Dicarboxylic acids and hydroxyl dicarboxylic acids (DCAs and hDCAs)
For all three types of haze episodes, L_DCAs and L_hDCAs were observed to increase significantly. Their good correlations with nitrate, sulfate, and MO-OOA reflected that they were mainly formed via secondary processes. To further provide the implications for their precursor sources and aging processes, diagnostic ratios of DCAs and hDCAs during episodic and non-episodic periods are examined as a function of Ox and RH in Fig. 6. On the one hand, both succinic acid (C4) and glutaric acid (C5) could be formed from a wide range of precursors of longer carbon chains, while C4 could also be the product of C5 as a result of undergoing successive oxidation cleavage (Ervens et al., 2004; Kawamura and Bikkina, 2016; Yang et al., 2008). On the other hand, C4 can be further oxidized by OH radicals to form malic acid (hC4; Ervens et al., 2004; Yang et al., 2008). Therefore, the ratios of C4 C5 and hC4 C4 could be applied to indicate the oxidizing degree of the organic aerosols and the extent of photooxidation in the atmosphere (Yu et al., 2021). An examination of episode-specific events showed that the average values of C4 C5 ratios and hC4 C4 ratios generally increased with the Ox level during both episodic events and non-episodic periods (Fig. 6a and b). In addition, the hC4 C4 ratios also displayed significantly positive correlations with RH during both episodic and non-episodic periods (Fig. 6e). A previous field study also observed the elevated hC4 C4 ratios with the increase in the RH during wet season, which attributed to the aqueous-phase processing of dicarboxylic acids (Yu et al., 2021). The hC4 C4 ratios elevated more rapidly during non-episodic periods compared with episodic periods. This may suggest that aqueous-phase OH oxidation played a more important role in SOA formation during non-episodic periods, as higher levels of O3 were observed during non-episodic periods in reference to episodic events under the same RH-level bins. In addition, the higher influence from marine air masses during non-episodic periods may also facilitate the formation of hC4, as previous studies also observed a high mole fraction of hydroxyl groups in marine aerosols (Aluwihare et al., 1997; Lyu et al., 2020; Russell et al., 2011). On the contrary, the C4 C5 ratios did not show a clear trend with the increase in the RH (Fig. 6d), indicating that their dominant chemistry was insensitive to aqueous-phase processing, which is consistent with our understanding that the gas-phase photochemical oxidation played a more important role in the formation of DCAs.
In urban atmospheres, long-chain fatty acids, especially C16 and C18 fatty acids, are dominantly sources from primary cooking emissions. Azelaic acid (C9 DCA) is a major photooxidation product of unsaturated C18 fatty acids (He et al., 2004; Kawamura et al., 1996; Robinson et al., 2006; Rogge et al., 1991). Hence, the C9 DCA sFA ratio reflects the oxidation degree of cooking organic aerosols. As shown in Fig. 6f, C9 DCA/sFA ratios significantly increased with Ox, while RH had a minor influence on the oxidation of fatty acids. Such speculation was also supported by previous field observation and chamber experiments which found that O3 acted as a predominant oxidant on the degradation of fatty acids (Vesna et al., 2009; Wang and Yu, 2021; Zahardis and Petrucci, 2007; Ziemann, 2005).
The implementation of the Air Pollution Prevention and Control Action Plan since 2013 has profoundly altered the PM2.5 chemical composition in China, with one consequence being that organic aerosol has constituted an increasing fraction of PM2.5 in recent years. Yet, a comprehensive understanding of the physical and chemical processing of OA has been limited. This study presents bi-hourly measurements of 98 organic molecular markers and compares their mass contributions to PM2.5 during different types of episodes at an urban site in Shanghai, a megacity in China. The average mass concentrations of the total TAG-measured OA ranged from 934 to 1595 ng m−3 during the nine observed haze episodes, which were 2–3 times higher than that during non-episodic periods (476 ng m−3). Enhanced OA formation was a major culprit responsible for the deterioration of PM2.5 pollution levels in wintertime in Shanghai. Major contributors of OA were substantially different among local, mixed-influence, and transport episodes. Local episodes were characterized by higher contributions from primary OA markers, which are indicative of vehicular exhaust and cooking emissions, such as alkanes, hopanes, and fatty acids, and account for 43 % of the total TAG-measured OA mass on average. The SOA markers (e.g., DHOPA and C9 acids) derived from these source categories also exhibited higher concentrations during local episodes. Specifically, the estimated mass contributions of aromatic SOA elevated from 21 % during non-episodic periods to 44 % during local episodes, indicating the important impacts from vehicular emissions on local aerosol formation.
In comparison, BBtracers comprised a significant contributor of primary OA during mixed-influence episodes and transport episodes. The significant presence of BBtracers in urban PM2.5 in Shanghai implicated the continued practice of burning agricultural residuals, despite recent policies banning such activities. Consistently, Ar-PCAs and NACs, which are indicative of secondary biomass burning sources, constituted larger fractions of the total TAG-measured OA during mixed-influence episodes and transport episodes when compared with local episodes. The positive correlations between NAC versus BBtracer ratios and Ox during the campaign revealed that the transformation of aromatics (e.g., benzene and toluene) from biomass burning via photochemical processing was an important source of NACs in wintertime in Shanghai. Besides, highly oxidized secondary organic molecular groups, L_DCAs and L_hDCAs, were also more abundant during mixed-influence episodes and transport episodes under the aging of continental outflows, with contributions ranging from 39 % to 57 % in the total TAG-measured OA. During local episodes, L_DCAs and L_hDCAs were comparatively deficient, while SemiASOA values in the total aromatic SOA (TotalASOA) were relatively higher. Such results were likely attributable to a suppression of the atmospheric oxidative capacity under high NOx concentrations. The fact that L_DCAs and L_hDCAs tracked well with Ox also supported their photochemical origin.
Overall, the significant variations in the OA composition during different types of episodes indicate that the sources and formation processes of OA were diverse and subject to the influence of the prevailing air masses. The control of local urban sources such as vehicular and cooking emissions would lessen the severity of the local episodes, while regional control of the precursors for secondary inorganic aerosols and more effective restriction of biomass burning activities would reduce PM2.5 episodes under synoptic conditions conducive to regional transport.
The bi-hourly organic markers and other hourly chemical speciation data presented in this study are available from the data repository maintained by the Hong Kong University of Science and Technology (HKUST) at https://doi.org/10.14711/dataset/PXEV3I (Zhu and Yu, 2022).
The supplement related to this article is available online at: https://doi.org/10.5194/acp-23-7551-2023-supplement.
SZ, CH, and JZY conceived the study and led the overall research. SZ did the overall data analysis, with contributions from QW and SW. MZ and LQ collected and processed the chemical species data measured by MARGA, the OC/EC analyzer, and XRF. DDH collected and processed AMS measurement data. YG, SJ, QW, and HW collected and processed VOC measurement data. CC conducted background research and reviewed the writing. SZ and JZY wrote the paper, with contributions from all co-authors.
The contact author has declared that none of the authors has any competing interests.
Publisher's note: Copernicus Publications remains neutral with regard to jurisdictional claims in published maps and institutional affiliations.
This research has been supported by Shanghai 2021 “Science and Technology Innovation Action Plan” social development science and technology project (grant no. 21DZ1202300), the Research Grants Council of Hong Kong (grant no. R6011-18), the National Natural Science Foundation of China (grant no. 41875161), and the Fundamental Research Funds for the Central Universities, China University of Geosciences (Wuhan; grant no. G1323523063).
This paper was edited by Dara Salcedo and reviewed by three anonymous referees.
Al-Naiema, I., Offenberg, J. H., Madler, C. J., Lewandowski, M., Kettler, J., Fang, T., and Stone, E. A.: Secondary organic aerosols from aromatic hydrocarbons and their contribution to fine particulate matter in Atlanta, Georgia, Atmos. Environ., 223, 117227, https://doi.org/10.1016/j.atmosenv.2019.117227, 2020.
Aluwihare, L. I., Repeta, D. J., and Chen, R. F.: A major biopolymeric component to dissolved organic carbon in surface sea water, Nature (London), 387, 166–169, https://doi.org/10.1038/387166a0, 1997.
Cai, W., Li, K., Liao, H., Wang, H., and Wu, L.: Weather conditions conducive to Beijing severe haze more frequent under climate change, Nat. Clim. Change, 7, 257–262, https://doi.org/10.1038/nclimate3249, 2017.
Castro, L. M., Pio, C. A., Harrison, R. M., and Smith, D. J. T.: Carbonaceous aerosol in urban and rural European atmospheres: estimation of secondary organic carbon concentrations, Atmos. Environ., 33, 2771–2781, https://doi.org/10.1016/S1352-2310(98)00331-8, 1999.
Chen, H. and Wang, H.: Haze Days in North China and the associated atmospheric circulations based on daily visibility data from 1960 to 2012, Journal of geophysical research, Atmospheres, 120, 5895–5909, https://doi.org/10.1002/2015JD023225, 2015.
Chen, L., Shi, M., Gao, S., Li, S., Mao, J., Zhang, H., Sun, Y., Bai, Z., and Wang, Z.: Assessment of population exposure to PM2.5 for mortality in China and its public health benefit based on BenMAP, Environ. Pollut., 221, 311–317, https://doi.org/10.1016/j.envpol.2016.11.080, 2017.
Ding, A., Huang, X., Nie, W., Chi, X., Xu, Z., Zheng, L., Xu, Z., Xie, Y., Qi, X., Shen, Y., Sun, P., Wang, J., Wang, L., Sun, J., Yang, X.-Q., Qin, W., Zhang, X., Cheng, W., Liu, W., Pan, L., and Fu, C.: Significant reduction of PM2.5 in eastern China due to regional-scale emission control: evidence from SORPES in 2011–2018, Atmos. Chem. Phys., 19, 11791–11801, https://doi.org/10.5194/acp-19-11791-2019, 2019.
Ervens, B., Feingold, G., Frost, G. J., and Kreidenweis, S. M.: A modeling study of aqueous production of dicarboxylic acids: 1. Chemical pathways and speciated organic mass production, J. Geophys. Res.-Atmos., 109, D15205, https://doi.org/10.1029/2003JD004387, 2004.
Fan, S., Gao, C. Y., Wang, L., Yang, Y., Liu, Z., Hu, B., Wang, Y., Wang, J., and Gao, Z.: Elucidating roles of near-surface vertical layer structure in different stages of PM2.5 pollution episodes over urban Beijing during 2004–2016, Atmos. Environ., 246, 118157, https://doi.org/10.1016/j.atmosenv.2020.118157, 2021.
Gao, Y., Wang, H., Zhang, X., Jing, S., Peng, Y., Qiao, L., Zhou, M., Huang, D. D., Wang, Q., Li, X., Li, L., Feng, J., Ma, Y., and Li, Y.: Estimating Secondary Organic Aerosol Production from Toluene Photochemistry in a Megacity of China, Environ. Sci. Technol., 53, 8664–8671, https://doi.org/10.1021/acs.est.9b00651, 2019.
Guo, B., Wang, Y., Zhang, X., Che, H., Zhong, J., Chu, Y., and Cheng, L.: Temporal and spatial variations of haze and fog and the characteristics of PM2.5 during heavy pollution episodes in China from 2013 to 2018, Atmos. Pollut. Res., 11, 1847–1856, https://doi.org/10.1016/j.apr.2020.07.019, 2020.
He, L., Hu, M., Huang, X., Yu, B., Zhang, Y., and Liu, D.: Measurement of emissions of fine particulate organic matter from Chinese cooking, Atmos. Environ., 38, 6557–6564, https://doi.org/10.1016/j.atmosenv.2004.08.034, 2004.
He, X., Huang, X. H. H., Chow, K. S., Wang, Q., Zhang, T., Wu, D., and Yu, J. Z.: Abundance and Sources of Phthalic Acids, Benzene-Tricarboxylic Acids, and Phenolic Acids in PM2.5 at Urban and Suburban Sites in Southern China, ACS Earth Space Chem., 2, 147–158, https://doi.org/10.1021/acsearthspacechem.7b00131, 2018.
He, X., Wang, Q., Huang, X. H. H., Huang, D. D., Zhou, M., Qiao, L., Zhu, S., Ma, Y., Wang, H., Li, L., Huang, C., Xu, W., Worsnop, D. R., Goldstein, A. H., and Yu, J. Z.: Hourly measurements of organic molecular markers in urban Shanghai, China: Observation of enhanced formation of secondary organic aerosol during particulate matter episodic periods, Atmos. Environ., 240, 117807, https://doi.org/10.1016/j.atmosenv.2020.117807, 2020.
Hu, D. and Yu, J. Z.: Secondary organic aerosol tracers and malic acid in Hong Kong: Seasonal trends and origins, Environ. Chem., 10, 381–394, https://doi.org/10.1071/EN13104, 2013.
Hu, D., Bian, Q., Li, T. W. Y., Lau, A. K. H., and Yu, J. Z.: Contributions of isoprene, monoterpenes, β-caryophyllene, and toluene to secondary organic aerosols in Hong Kong during the summer of 2006, J. Geophys. Res.-Atmos., 113, D22206, https://doi.org/10.1029/2008JD010437, 2008.
Huang, D. D., Zhu, S., An, J., Wang, Q., Qiao, L., Zhou, M., He, X., Ma, Y., Sun, Y., Huang, C., Yu, J. Z., and Zhang, Q.: Comparative Assessment of Cooking Emission Contributions to Urban Organic Aerosol Using Online Molecular Tracers and Aerosol Mass Spectrometry Measurements, Environ. Sci. Technol., 55, 14526–14535, https://doi.org/10.1021/acs.est.1c03280, 2021.
Huang, R., Zhang, Y., Bozzetti, C., Ho, K., Cao, J., Han, Y., Daellenbach, K. R., Slowik, J. G., Platt, S. M., Canonaco, F., Zotter, P., Wolf, R., Pieber, S. M., Bruns, E. A., Crippa, M., Ciarelli, G., Piazzalunga, A., Schwikowski, M., Abbaszade, G., Schnelle-Kreis, J., Zimmermann, R., An, Z., Szidat, S., Baltensperger, U., El Haddad, I., and Prévôt, A. S. H.: High secondary aerosol contribution to particulate pollution during haze events in China, Nature, 514, 218–222, https://doi.org/10.1038/nature13774, 2014.
Kawamura, K. and Bikkina, S.: A review of dicarboxylic acids and related compounds in atmospheric aerosols: Molecular distributions, sources and transformation, Atmos. Res., 170, 140–160, https://doi.org/10.1016/j.atmosres.2015.11.018, 2016.
Kawamura, K., Kasukabe, H. and Barrie, L. A.: Source and reaction pathways of dicarboxylic acids, ketoacids and dicarbonyls in arctic aerosols: One year of observations, Atmos. Environ., 30, 1709–1722, https://doi.org/10.1016/1352-2310(95)00395-9, 1996.
Kreisberg, N. M., Hering, S. V., Williams, B. J., Worton, D. R., and Goldstein, A. H.: Quantification of Hourly Speciated Organic Compounds in Atmospheric Aerosols, Measured by an In-Situ Thermal Desorption Aerosol Gas Chromatograph (TAG), Aerosol Sci. Technol., 43, 38–52, https://doi.org/10.1080/02786820802459583, 2009.
Kristensen, K., Cui, T., Zhang, H., Gold, A., Glasius, M., and Surratt, J. D.: Dimers in α-pinene secondary organic aerosol: effect of hydroxyl radical, ozone, relative humidity and aerosol acidity, Atmos. Chem. Phys., 14, 4201–4218, https://doi.org/10.5194/acp-14-4201-2014, 2014.
Kroll, J. H. and Seinfeld, J. H.: Chemistry of secondary organic aerosol: Formation and evolution of low-volatility organics in the atmosphere, Atmos. Environ., 42, 3593–3624, https://doi.org/10.1016/j.atmosenv.2008.01.003, 2008.
Kroll, J. H., Ng, N. L., Murphy, S. M., Flagan, R. C., and Seinfeld, J. H.: Secondary Organic Aerosol Formation from Isoprene Photooxidation, Environ. Sci. Technol., 40, 1869–1877, https://doi.org/10.1021/es0524301, 2006.
Li, M., Wang, T., Xie, M., Li, S., Zhuang, B., Huang, X., Chen, P., Zhao, M., and Liu, J.: Formation and Evolution Mechanisms for Two Extreme Haze Episodes in the Yangtze River Delta Region of China During Winter 2016, Journal of geophysical research, Atmospheres, 124, 3607–3623, https://doi.org/10.1029/2019JD030535, 2019.
Li, Q., Zhang, R., and Wang, Y.: Interannual variation of the wintertime fog–haze days across central and eastern China and its relation with East Asian winter monsoon, Int. J. Climatol., 36, 346–354, https://doi.org/10.1002/joc.4350, 2016.
Li, X., Wang, Y., Hu, M., Tan, T., Li, M., Wu, Z., Chen, S., and Tang, X.: Characterizing chemical composition and light absorption of nitroaromatic compounds in the winter of Beijing, Atmos. Environ., 237, 117712, https://doi.org/10.1016/j.atmosenv.2020.117712, 2020.
Lim, H. and Turpin, B. J.: Origins of Primary and Secondary Organic Aerosol in Atlanta: Results of Time-Resolved Measurements during the Atlanta Supersite Experiment, Environ. Sci. Technol., 36, 4489–4496, https://doi.org/10.1021/es0206487, 2002.
Liu, J., Li, J., Zhang, Y., Liu, D., Ding, P., Shen, C., Shen, K., He, Q., Ding, X., Wang, X., Chen, D., Szidat, S., and Zhang, G.: Source Apportionment Using Radiocarbon and Organic Tracers for PM2.5 Carbonaceous Aerosols in Guangzhou, South China: Contrasting Local- and Regional-Scale Haze Events, Environ. Sci. Technol., 48, 12002–12011, https://doi.org/10.1021/es503102w, 2014.
Liu, M., Huang, Y., Ma, Z., Jin, Z., Liu, X., Wang, H., Liu, Y., Wang, J., Jantunen, M., Bi, J., and Kinney, P. L.: Spatial and temporal trends in the mortality burden of air pollution in China: 2004–2012, Environ. Int., 98, 75–81, https://doi.org/10.1016/j.envint.2016.10.003, 2017.
Liu, Y., Wang, H., Jing, S., Peng, Y., Gao, Y., Yan, R., Wang, Q., Lou, S., Cheng, T., and Huang, C.: Strong regional transport of volatile organic compounds (VOCs) during wintertime in Shanghai megacity of China, Atmos. Environ., 244, 117940, https://doi.org/10.1016/j.atmosenv.2020.117940, 2021.
Lyu, X., Guo, H., Yao, D., Lu, H., Huo, Y., Xu, W., Kreisberg, N., Goldstein, A. H., Jayne, J., Worsnop, D., Tan, Y., Lee, S., and Wang, T.: In Situ Measurements of Molecular Markers Facilitate Understanding of Dynamic Sources of Atmospheric Organic Aerosols, Environ. Sci. Technol., 54, 11058–11069, https://doi.org/10.1021/acs.est.0c02277, 2020.
Ma, Y., Russell, A. T., and Marston, G.: Mechanisms for the formation of secondary organic aerosol components from the gas-phase ozonolysis of α-pinene, Physical chemistry chemical physics, Phys. Chem. Chem. Phys., 10, 4294–4312, https://doi.org/10.1039/b803283a, 2008.
Ma, P., Zhang, P., Shu, J., Yang, B., and Zhang, H.: Characterization of secondary organic aerosol from photo-oxidation of gasoline exhaust and specific sources of major components, Environ. Pollut., 232, 65–72, https://doi.org/10.1016/j.envpol.2017.09.018, 2018.
Mao, L., Liu, R., Liao, W., Wang, X., Shao, M., Liu, S. C., and Zhang, Y.: An observation-based perspective of winter haze days in four major polluted regions of China, Nat. Sci. Rev., 6, 515–523, https://doi.org/10.1093/nsr/nwy118, 2019.
Nihill, K. J., Ye, Q., Majluf, F., Krechmer, J. E., Canagaratna, M. R., and Kroll, J. H.: Influence of the NO/NO2 Ratio on Oxidation Product Distributions under High-NO Conditions, Environ. Sci. Technol., 55, 6594–6601, https://doi.org/10.1021/acs.est.0c07621, 2021.
Peng, Z., Lee-Taylor, J., Orlando, J. J., Tyndall, G. S., and Jimenez, J. L.: Organic peroxy radical chemistry in oxidation flow reactors and environmental chambers and their atmospheric relevance, Atmos. Chem. Phys., 19, 813–834, https://doi.org/10.5194/acp-19-813-2019, 2019.
Petit, J., Favez, O., Albinet, A., and Canonaco, F.: A user-friendly tool for comprehensive evaluation of the geographical origins of atmospheric pollution: Wind and trajectory analyses, Environ. Modell. Softw., 88, 183–187, https://doi.org/10.1016/j.envsoft.2016.11.022, 2017.
Qiao, L., Cai, J., Wang, H., Wang, W., Zhou, M., Lou, S., Chen, R., Dai, H., Chen, C., and Kan, H.: PM2.5 Constituents and Hospital Emergency-Room Visits in Shanghai, China, Environ. Sci. Technol., 48, 10406–10414, https://doi.org/10.1021/es501305k, 2014.
RenHe, Z., Li, Q., and Zhang, R.: Meteorological conditions for the persistent severe fog and haze event over eastern China in January 2013, Sci. China Earth Sci., 57, 26–35, https://doi.org/10.1007/s11430-013-4774-3, 2014.
Ministry of Ecology and Environment, the People’s Republic of China: Report on the State of the Ecology and Environment in China, http://english.mee.gov.cn/Resources/Reports/soe/SOEE2019/202012/P020201215587453898053.pdf (last access: 5 July 2023), 2019.
Robinson, A. L., Subramanian, R., Donahue, N. M., Bernardo-Bricker, A., and Rogge, W. F.: Source Apportionment of Molecular Markers and Organic Aerosol. 3. Food Cooking Emissions, Environ. Sci. Technol., 40, 7820–7827, https://doi.org/10.1021/es060781p, 2006.
Rogge, W. F., Hildemann, L. M., Mazurek, M. A., Cass, G. R., and Simoneit, B. R. T.: Sources of fine organic aerosol. 1. Charbroilers and meat cooking operations, Environ. Sci. Technol., 25, 1112–1125, https://doi.org/10.1021/es00018a015, 1991.
Russell, L. M., Bahadur, R., and Ziemann, P. J.: Identifying organic aerosol sources by comparing functional group composition in chamber and atmospheric particles, P. Natl. Acad. Sci. USA, 108, 3516–3521, https://doi.org/10.1073/pnas.1006461108, 2011.
Salvador, C. M. G., Tang, R., Priestley, M., Li, L., Tsiligiannis, E., Le Breton, M., Zhu, W., Zeng, L., Wang, H., Yu, Y., Hu, M., Guo, S., and Hallquist, M.: Ambient nitro-aromatic compounds – biomass burning versus secondary formation in rural China, Atmos. Chem. Phys., 21, 1389–1406, https://doi.org/10.5194/acp-21-1389-2021, 2021.
Schauer, J. J., Kleeman, M. J., Cass, G. R., and Simoneit, B.: Measurement of emissions from air pollution sources. 5. C-1-C-32 organic compounds from gasoline-powered motor vehicles, Environ. Sci. Technol., 36, 1169–1180, https://doi.org/10.1021/es0108077, 2002.
Szmigielski, R., Surratt, J. D., Gómez-González, Y., Van der Veken, P., Kourtchev, I., Vermeylen, R., Blockhuys, F., Jaoui, M., Kleindienst, T. E., Lewandowski, M., Offenberg, J. H., Edney, E. O., Seinfeld, J. H., Maenhaut, W., and Claeys, M.: 3-methyl-1,2,3-butanetricarboxylic acid: An atmospheric tracer for terpene secondary organic aerosol, Geophys. Res. Lett., 34, L24811, https://doi.org/10.1029/2007GL031338, 2007.
Sun, J., Gong, J., Zhou, J., Liu, J., and Liang, J.: Analysis of PM2.5 pollution episodes in Beijing from 2014 to 2017: Classification, interannual variations and associations with meteorological features, Atmos. Environ., 213, 384–394, https://doi.org/10.1016/j.atmosenv.2019.06.015, 2019.
Tao, J., Zhang, L., Cao, J., and Zhang, R.: A review of current knowledge concerning PM2.5 chemical composition, aerosol optical properties and their relationships across China, Atmos. Chem. Phys., 17, 9485–9518, https://doi.org/10.5194/acp-17-9485-2017, 2017.
Turpin, B. J. and Huntzicker, J. J.: Identification of secondary organic aerosol episodes and quantitation of primary and secondary organic aerosol concentrations during SCAQS, Atmos. Environ., 29, 3527–3544, https://doi.org/10.1016/1352-2310(94)00276-Q, 1995.
Vesna, O., Sax, M., Kalberer, M., Gaschen, A., and Ammann, M.: Product study of oleic acid ozonolysis as function of humidity, Atmos. Environ., 43, 3662–3669, https://doi.org/10.1016/j.atmosenv.2009.04.047, 2009.
Wang, D., Zhou, B., Fu, Q., Zhao, Q., Zhang, Q., Chen, J., Yang, X., Duan, Y., and Li, J.: Intense secondary aerosol formation due to strong atmospheric photochemical reactions in summer: observations at a rural site in eastern Yangtze River Delta of China, Sci. Total Environ., 571, 1454–1466, https://doi.org/10.1016/j.scitotenv.2016.06.212, 2016.
Wang, H. L., Chen, C. H., Wang, Q., Huang, C., Su, L. Y., Huang, H. Y., Lou, S. R., Zhou, M., Li, L., Qiao, L. P., and Wang, Y. H.: Chemical loss of volatile organic compounds and its impact on the source analysis through a two-year continuous measurement, Atmos. Environ., 80, 488–498, https://doi.org/10.1016/j.atmosenv.2013.08.040, 2013.
Wang, Q. and Yu, J. Z.: Ambient Measurements of Heterogeneous Ozone Oxidation Rates of Oleic, Elaidic, and Linoleic Acid Using a Relative Rate Constant Approach in an Urban Environment, Geophys. Res. Lett., 48, e2021GL095130, https://doi.org/10.1029/2021GL095130, 2021.
Wang, Q., Zhuang, G., Huang, K., Liu, T., Deng, C., Xu, J., Lin, Y., Guo, Z., Chen, Y., Fu, Q., Fu, J. S., and Chen, J.: Probing the severe haze pollution in three typical regions of China: Characteristics, sources and regional impacts, Atmos. Environ., 120, 76–88, https://doi.org/10.1016/j.atmosenv.2015.08.076, 2015.
Wang, Q., He, X., Zhou, M., Huang, D. D., Qiao, L., Zhu, S., Ma, Y., Wang, H., Li, L., Huang, C., Huang, X. H. H., Xu, W., Worsnop, D., Goldstein, A. H., Guo, H., and Yu, J. Z.: Hourly Measurements of Organic Molecular Markers in Urban Shanghai, China: Primary Organic Aerosol Source Identification and Observation of Cooking Aerosol Aging, ACS Earth Space Chem., 4, 1670–1685, https://doi.org/10.1021/acsearthspacechem.0c00205, 2020.
Wang, Y., Li, L., Chen, C., Huang, C., Huang, H., Feng, J., Wang, S., Wang, H., Zhang, G., Zhou, M., Cheng, P., Wu, M., Sheng, G., Fu, J., Hu, Y., Russell, A. G., and Wumaer, A.: Source apportionment of fine particulate matter during autumn haze episodes in Shanghai, China, J. Geophys. Res.-Atmos., 119, 1903–1914, https://doi.org/10.1002/2013JD019630, 2014a.
Wang, Y., Yao, L., Wang, L., Liu, Z., Ji, D., Tang, G., Zhang, J., Sun, Y., Hu, B., and Xin, J.: Mechanism for the formation of the January 2013 heavy haze pollution episode over central and eastern China, Sci. China Earth Sci., 57, 14–25, https://doi.org/10.1007/s11430-013-4773-4, 2014b.
Wang, Y., Hu, M., Wang, Y., Zheng, J., Shang, D., Yang, Y., Liu, Y., Li, X., Tang, R., Zhu, W., Du, Z., Wu, Y., Guo, S., Wu, Z., Lou, S., Hallquist, M., and Yu, J. Z.: The formation of nitro-aromatic compounds under high NOx and anthropogenic VOC conditions in urban Beijing, China, Atmos. Chem. Phys., 19, 7649–7665, https://doi.org/10.5194/acp-19-7649-2019, 2019.
Wei, X., Liu, M., Yang, J., Du, W., Sun, X., Huang, Y., Zhang, X., Khalil, S. K., Luo, D., and Zhou, Y.: Characterization of PM2.5-bound PAHs and carbonaceous aerosols during three-month severe haze episode in Shanghai, China: Chemical composition, source apportionment and long-range transportation, Atmos. Environ., 203, 1–9, https://doi.org/10.1016/j.atmosenv.2019.01.046, 2019.
Williams, B. J., Goldstein, A. H., Kreisberg, N. M., and Hering, S. V.: An In-Situ Instrument for Speciated Organic Composition of Atmospheric Aerosols: Thermal Desorption Aerosol GC/MS-FID (TAG), Aerosol Sci. Technol., 40, 627–638, https://doi.org/10.1080/02786820600754631, 2006.
Yan, C., Zheng, M., Bosch, C., Andersson, A., Desyaterik, Y., Sullivan, A. P., Collett, J. L., Zhao, B., Wang, S., He, K., and Gustafsson, Ö: Important fossil source contribution to brown carbon in Beijing during winter, Sci. Rep., 7, 43182, https://doi.org/10.1038/srep43182, 2017.
Yang, L., Ray, M. B., and Yu, L. E.: Photooxidation of dicarboxylic acids – Part II: Kinetics, intermediates and field observations, Atmos. Environ., 42, 868–880, https://doi.org/10.1016/j.atmosenv.2007.10.030, 2008.
Yao, L., Huo, J., Wang, D., Fu, Q., Sun, W., Li, Q., and Chen, J.: Online measurement of carbonaceous aerosols in suburban Shanghai during winter over a three-year period: Temporal variations, meteorological effects, and sources, Atmos. Environ., 226, 117408, https://doi.org/10.1016/j.atmosenv.2020.117408, 2020.
Yu, Q., Chen, J., Cheng, S., Qin, W., Zhang, Y., Sun, Y., and Ahmad, M.: Seasonal variation of dicarboxylic acids in PM2.5 in Beijing: Implications for the formation and aging processes of secondary organic aerosols, Sci. Total Environ., 763, 142964, https://doi.org/10.1016/j.scitotenv.2020.142964, 2021.
Yuan, B., Liggio, J., Wentzell, J., Li, S.-M., Stark, H., Roberts, J. M., Gilman, J., Lerner, B., Warneke, C., Li, R., Leithead, A., Osthoff, H. D., Wild, R., Brown, S. S., and de Gouw, J. A.: Secondary formation of nitrated phenols: insights from observations during the Uintah Basin Winter Ozone Study (UBWOS) 2014, Atmos. Chem. Phys., 16, 2139–2153, https://doi.org/10.5194/acp-16-2139-2016, 2016.
Zahardis, J. and Petrucci, G. A.: The oleic acid-ozone heterogeneous reaction system: products, kinetics, secondary chemistry, and atmospheric implications of a model system – a review, Atmos. Chem. Phys., 7, 1237–1274, https://doi.org/10.5194/acp-7-1237-2007, 2007.
Zeng, L., Huang, D. D., Zhu, S., Li, F., Zhou, M., Qiao, L., Wang, Q., Wang, Q., Ma, Y., Lou, S., Shi, H., In Hoi, K., Mok, K. M., Ge, X., Wang, H., Yu, J. Z., Huang, C., and Li, Y. J.: The interplays among meteorology, source, and chemistry in high particulate matter pollution episodes in urban Shanghai, China, Sci. Total Environ., 853, 158347, https://doi.org/10.1016/j.scitotenv.2022.158347, 2022.
Zhang, J., He, X., Gao, Y., Zhu, S., Jing, S., Wang, H., Yu, J. Z., and Ying, Q.: Assessing Regional Model Predictions of Wintertime SOA from Aromatic Compounds and Monoterpenes with Precursor-specific Tracers, Aerosol Air Qual. Res., 21, 210233, https://doi.org/10.4209/aaqr.210233, 2021a.
Zhang, J., He, X., Gao, Y., Zhu, S., Jing, S., Wang, H., Yu, J. Z., and Ying, Q.: Estimation of Aromatic Secondary Organic Aerosol Using a Molecular Tracer – A Chemical Transport Model Assessment, Environ. Sci. Technol., 55, 12882–12892, https://doi.org/10.1021/acs.est.1c03670, 2021b.
Zhang, X. Y., Wang, Y. Q., Niu, T., Zhang, X. C., Gong, S. L., Zhang, Y. M., and Sun, J. Y.: Atmospheric aerosol compositions in China: spatial/temporal variability, chemical signature, regional haze distribution and comparisons with global aerosols, Atmos. Chem. Phys., 12, 779–799, https://doi.org/10.5194/acp-12-779-2012, 2012.
Zhao, M., Qiao, T., Huang, Z., Zhu, M., Xu, W., Xiu, G., Tao, J. and Lee, S.: Comparison of ionic and carbonaceous compositions of PM2.5 in 2009 and 2012 in Shanghai, China, Sci. Total Environ., 536, 695–703, https://doi.org/10.1016/j.scitotenv.2015.07.100, 2015.
Zhao, X. J., Zhao, P. S., Xu, J., Meng,, W., Pu, W. W., Dong, F., He, D., and Shi, Q. F.: Analysis of a winter regional haze event and its formation mechanism in the North China Plain, Atmos. Chem. Phys., 13, 5685–5696, https://doi.org/10.5194/acp-13-5685-2013, 2013.
Zhu, S. and Yu, J.: Online measurements data of organic molecular markers and other pollutants at SAES supersite during 2019–2020 wintertime episodes, DataSpace@HKUST V1 [data set], https://doi.org/10.14711/dataset/PXEV3I, 2022.
Zhu, S., Wang, Q., Qiao, L., Zhou, M., Wang, S., Lou, S., Huang, D., Wang, Q., Jing, S., Wang, H., Chen, C., Huang, C., and Yu, J. Z.: Tracer-based characterization of source variations of PM2.5 and organic carbon in Shanghai influenced by the COVID-19 lockdown, Faraday Discuss., 226, 112–137, https://doi.org/10.1039/D0FD00091D, 2021.
Zhu, W., Zhou, M., Cheng, Z., Yan, N., Huang, C., Qiao, L., Wang, H., Liu, Y., Lou, S., and Guo, S.: Seasonal variation of aerosol compositions in Shanghai, China: Insights from particle aerosol mass spectrometer observations, Sci. Total Environ., 771, 144948, https://doi.org/10.1016/j.scitotenv.2021.144948, 2021.
Ziemann, P. J.: Aerosol products, mechanisms, and kinetics of heterogeneous reactions of ozone with oleic acid in pure and mixed particles, Faraday Discuss., 130, 469, https://doi.org/10.1039/b417502f, 2005.