the Creative Commons Attribution 4.0 License.
the Creative Commons Attribution 4.0 License.
 | 06 Jul 2023
Characterization of size-segregated particles' turbulent flux and deposition velocity by eddy correlation method at an Arctic site
Gianluca Pappaccogli
Daniela Famulari
Mauro Mazzola
Federico Scoto
Stefano Decesari
Estimating aerosol depositions on snow and ice surfaces and assessing the aerosol lifecycle in the Arctic region is challenged by the scarce measurement data available for particle surface fluxes. This work aims at assessing the deposition velocity of atmospheric particles at an Arctic site (Ny-Ålesund, Svalbard islands) over snow, during the melting season, and over dry tundra. The measurements were performed using the eddy covariance method from March to August 2021. The measurement system was based on a condensation particle counter (CPC) for ultrafine particle (UFP; < 0.25 µm) fluxes and an optical particle counter (OPC) for evaluating particle size fluxes in the accumulation mode (ACC; 0.25 < dp < 0.7 µm) and quasi-coarse mode (CRS; 0.8 < dp < 3 µm). Turbulent fluxes in the ultrafine particle size range were prevalently downward, especially in summertime. In contrast, particle fluxes in the accumulation and quasi-coarse mode were more frequently positive, especially during the colder months, pointing to surface sources of particles from, for example, sea spray, snow sublimation, or local pollution. The overall median deposition velocity () values were 0.90, 0.62, and 4.42 mm s−1 for UFP, ACC, and CRS, respectively. Deposition velocities were smaller, on average, over the snowpack, with median values of 0.73, 0.42, and 3.50 mm s−1. The observed velocities differ by less than 50 % with respect to the previous literature in analogous environments (i.e. ice/snow) for particles in the size range 0.01–1 µm. At the same time, an agreement with the results of predictive models was found for only a few parameterizations, in particular with Slinn (1982), while large biases were found with other models, especially in the range 0.3–10 µm, of particle diameters. Our observations show a better fit with the models predicting a minimum deposition velocity for small-accumulation-mode particle sizes (0.1–0.3 µm) rather than for larger ones (about 1 µm), which could result from an efficient interception of particles over snow surfaces which are rougher and stickier than the idealized ones. Finally, a polynomial fit was investigated (for the ACC-CRS size range) to describe the deposition velocity observations which properly represents their size dependence and magnitude. Even if this numerical fit is driven purely by the data and not by the underlying chemical–physical processes, it could be very useful for future model parameterizations.
- Article
(9553 KB) - Full-text XML
-
Supplement
(719 KB) - BibTeX
- EndNote


The Arctic region is experiencing rapid climate change in response to the increase in greenhouse gases, aerosols, and other climate drivers, and it is warming 2 to 3 times faster than the global average (Stjern et al., 2019), as indicated both by observations and climate models (Cowtan and Way, 2014; Hartmann et al., 2013). Although this phenomenon, known as Arctic amplification (Schmale et al., 2021), is mainly driven by changes in anthropogenic greenhouse gases and climate feedbacks, short-lived climate forcers such as methane, tropospheric ozone, and aerosols contribute to the observed environmental change (Arnold et al., 2016; Law et al., 2014; Quinn et al., 2008; Sand et al., 2015; AMAP 2015a, b). The most important factors controlling aerosol climate forcing in the Arctic are the long-range transport of aerosols from mid-latitudes, local sources from both terrestrial and marine emissions, the surface energy budget at high latitudes, the annual cycle of the cryosphere, and atmospheric depositions (Quinn et al., 2008; Willis et al., 2018).
Aerosol depositions on uncontaminated snow and ice can be a key factor affecting melting processes (Skiles et al., 2018) because particles can decrease snow and/or ice albedo directly (as particles can contain light-absorbing materials) or indirectly by affecting ice metamorphism. This phenomenon causes a reinforcing feedback that melts the snow and ice, thereby exposing a darker underground and leading to further surface warming (Di Mauro, 2020; Abbatt et al., 2019). The aerosols' lifetime and hence the radiative forcing are strongly influenced by wet and dry deposition processes (e.g. Johnson et al., 2018). Dry deposition is a complex process that is influenced by the microphysical properties of aerosols and their sources, meteorological conditions, and surface morphological characteristics (Donateo and Contini, 2014; Urgnani et al., 2022). The particle exchange between the atmosphere and the surface is also controlled by frictional drag and terrain-induced flow modification (Giorgi, 1986; Stull, 1988). Knowing the factors controlling dry deposition allows us to estimate the residence time of particles in the atmosphere that governs their transport distance and potential climate effects (Nemitz et al., 2002; Pryor et al., 2008). The accurate quantification of particle deposition rates is a necessary prerequisite for the modelling of aerosol cycles, particle size distribution, long-range transport, and radiative forcing potential (Wang et al., 2011; Liu et al., 2011; Zhou et al., 2012; Browse et al., 2012; Menegoz et al., 2012; Lee et al., 2013; Eckhardt et al., 2015; Qi et al., 2017;). Despite its importance, however, the size dependence of the deposition rates is poorly understood, and therefore, the aerosols' atmospheric lifetime remains uncertain (Farmer et al., 2021; Emerson et al., 2020).
Many aerosols' properties have been investigated in the Arctic with regards to chemical composition (Quinn et al., 2009; Köllner et al., 2021), total number and mass concentrations (Croft et al., 2016), aerosol optical properties (Ferrero et al., 2019), ability to act as cloud condensation nuclei (Bulatovic et al., 2021), and number and size distribution (Lupi et al., 2016; Song et al., 2022). However, relatively few cases of aerosol deposition measurements on snow or iced surfaces exist, especially for those using the direct eddy covariance (EC) method (Farmer et al., 2021). These limitations are mainly due to the logistical challenges of collecting continuous data sets in remote areas (Abbatt et al., 2019) and micrometeorology-based measurement techniques, which require fast and sensitive detectors for EC (Burba, 2022). Dry deposition is typically described by the deposition velocity Vd = , where F is a flux, and C is the concentration of the species of interest. Vd provides a particularly useful metric for comparing the results across sites and for modelling particle removal because it is independent of the ambient concentration (Farmer et al., 2021). Furthermore, the current understanding of Arctic amplification is limited by a lack of robust model representations of the regional Arctic feedback processes, with major challenges in representing the aerosol sources and sinks processes (Schmale et al., 2021). In particular, to reduce model uncertainty, a deeper knowledge of the dry deposition velocity as a function of the particles' size is required. Moreover, an assessment of the current deposition models against an observational data set of aerosol fluxes over the cryosphere is clearly needed (Farmer et al., 2021). Global model skills in simulating the Arctic aerosol behaviour have improved in the last few years (Eckhardt et al., 2015; Arnold et al., 2016); however, significant discrepancies remain in our understanding of Arctic aerosol deposition and removal (Saylor et al., 2019; Emerson et al., 2020; IPCC, 2021). Global models generally make use of an aerosol deposition module with a particle-size-dependent resistance approach developed for specific deposition surfaces (Slinn, 1982; Wesely and Hicks, 2000). The model developed by Zhang et al. (2001) expanded on the Slinn (1982) approach by incorporating simple empirical parameterizations for dry deposition processes. Zhang et al. (2001) also expanded on the application of the resistance approach to also include ice and/or snow surfaces. The deposition rates described by Zhang et al. (2001) have been compared to some observations over vegetated surfaces; however, the parameters used to tune modern deposition models over the cryosphere have not been tested against observations (Khan and Perlinger, 2017).
The principal aim of this work is to measure the particle number fluxes and the related dry deposition velocities for size-segregated particles (from ultrafine to quasi-coarse range) at an Arctic site located in the Svalbard archipelago (Norway). In aiming to characterize the effect of surface properties on dry deposition, we performed continuous observations from the coldest months (on snow surface) to the snow melting period, and all through the early summer (snow-free surface). For these three conditions, a characterization of the deposition velocity as a function of particle diameters will be provided. Finally, a data fit parameterization of the deposition velocity on micrometeorological friction velocity has also been obtained.
2.1 Measurement site
Aerosol fluxes were measured at the Gruvebadet laboratory located southwest of the village of Ny-Ålesund (78∘55′ N, 11∘56′ E; Fig. 1) in the archipelago of Svalbard (Norway). The measurement campaign started on 15 March 2021 and lasted until 15 August, for a total of 5 months. The site is characterized by small hills and depressions (height differences below 10 m), whereas the land cover is characterized by dry tundra or bare soil (Magnani et al., 2022) during summer months when the snowpack disappears. Ancillary meteorological measurements of air temperature and relative humidity were collected at 5 (above ground level) at the Amundsen–Nobile Climate Change Tower (CCT), which is located about 1 km northwest of the Gruvebadet laboratory (Mazzola et al., 2016).
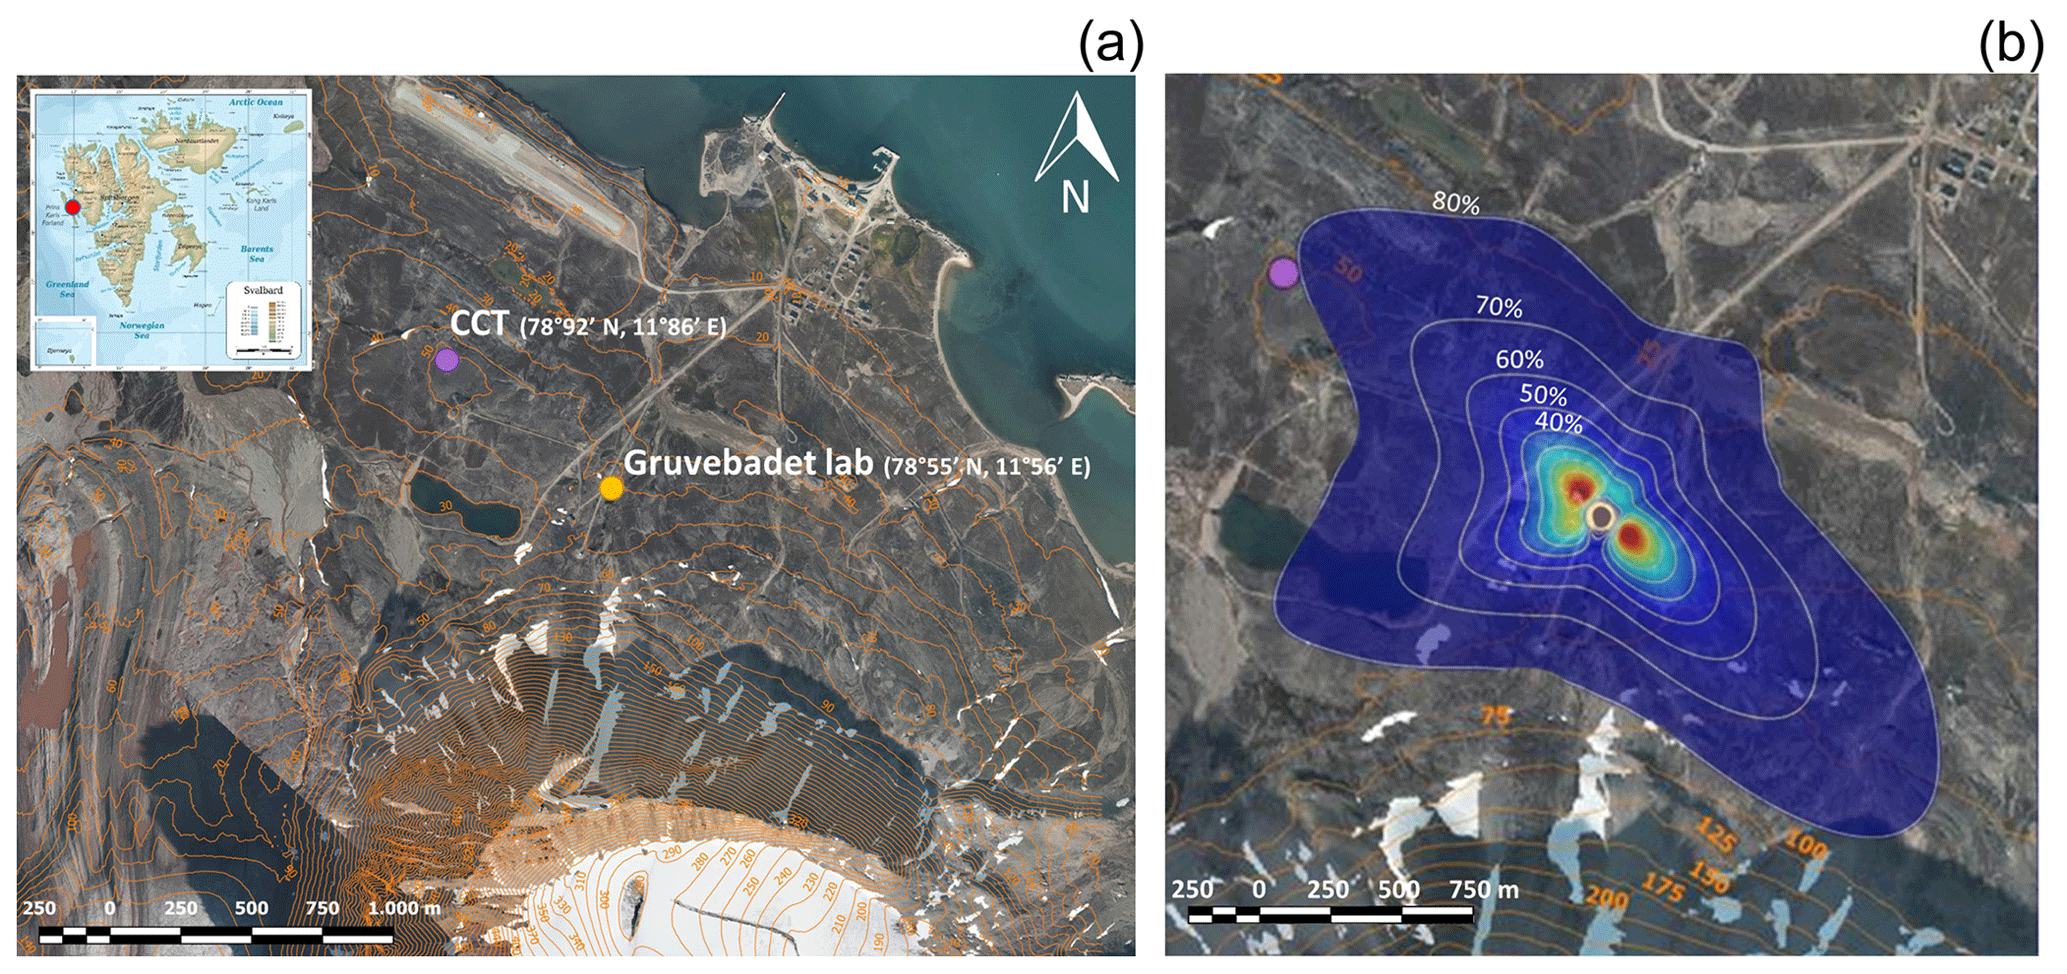
Figure 1(a) Location map of the study site at Ny-Ålesund (Svalbard, Norway). Purple and gold points indicate the Amundsen–Nobile Climate Change Tower and the Gruvebadet laboratory, respectively. Height contours (above sea level) are also presented. Figure credit: ©Norwegian Polar Institute (https://www.npolar.no, last access: 5 September 2022). In panel (b), the flux footprint of the EC system is represented (see Sect. 3.2) with the fractions of the total flux originating within the respective contours.
2.2 Instruments
The measurement system was located on the rooftop of the Gruvebadet laboratory at 9.6 on a pneumatic mast (Fig. S1a and b in the Supplement). Specifically, the EC station included an ultrasonic anemometer (R3-100; Gill Instruments Limited, UK) with a 100 Hz acquisition frequency, a condensation particle counter (CPC; TSI 3756; TSI Incorporated, USA) measuring the total particle number concentration, and an optical particle counter (OPC; 11-D; GRIMM AEROSOL TECHNIK, Germany) measuring in 16 size channels (from 0.25 to 3 µm). To measure the particle concentration and fluxes from both the CPC and OPC, a maximum acquisition rate of 1 Hz was used. Air was sampled by a unique inlet system for CPC and OPC (Fig. S2). It was placed at a small distance from the sampling volume of the anemometer (about 25 cm). The air sample was driven into the laboratory by a silicon conductive tube that is 6 m long (internal diameter 26 mm), ending with a (three-way) steel flow splitter that is 0.15 m long and 25 mm in diameter, to supply the air sample to both the CPC and the OPC. A nominal flow rate of 60 L min−1 was applied to the flow splitter for the sampling operation, giving a turbulent flow (Reynolds number equal to 4073) and minimizing the temporal distortion of concentration fluctuations. The CPC was connected to the flow splitter by a 0.82 m long silicon conductive tube (6 mm internal diameter) operating at a flow rate of 1.5 L min−1, whereas a portion of 1.2 L min−1 was aspirated by the OPC through a 0.80 m long (4 mm internal diameter) tube of the same type. The particle losses of the sampling system were calculated according to the formulation by Hinds (2012) for turbulent flow in the larger section of the tube (6 m) and according to Kulkarni et al. (2011) for the laminar flow inside the two narrow tubes of the inlet system (beyond the flow splitter). The total particle losses amount to 9 % (on average; mainly diffusional for smaller particles) for CPC and about 2.3 % (on average; mainly gravitational for greater particles) for OPC (Fig. S3a and b). Flux is affected by particle losses in the same way as the particle concentration; consequently, the deposition velocity should not be affected or marginally overestimated by the particle losses being calculated from the ratio of the flux on the concentration. According to TSI Incorporated, the D50 cut-off diameter (at 50 % efficiency) of the TSI 3756 CPC is 2 nm under normal laboratory conditions. The particle penetration curve through the whole sampling system, calculated as the product of the penetration factors in the two tubing sections for CPC (Mordas et al., 2008; Kupc et al., 2013), shows that D50 is about 5 nm (Fig. S3). Therefore, the data analysis for concentration, fluxes, and deposition velocity refers to particles with a diameter starting from 5 nm, which causes large particle losses for smaller diameters. Both particle instruments were running together through a specific software, developed by our research group, which is able to synchronize measured data with the anemometer output. Air temperature and relative humidity were measured at CCT (5 ) by a conventional thermo-hygrometer (Vaisala, Finland; model HMP45AC). The 10 min average physical size distributions above the canopy were measured using a Scanning Mobility Particle Sampler (SMPS; TSI Incorporated; 3034) sampling from the base of the roof (5.5 ), corrected for particle-size-specific tubing losses, and then used to compute the particle number size distributions for each half-hour in the size range from 10 to 470 nm. More details of the particle size distribution measurements which were conducted at Gruvebadet laboratory are given in Lupi et al. (2016). Precipitation data were measured during the campaign by a laser optical disdrometer, Parsivel2 (OTT HydroMet, Germany), installed on the roof of Gruvebadet. The Parsivel2 can measure the size and fall speed of the hydrometeors for a comprehensive measurement of all precipitation types (rain, snow, and hail). The Parsivel2 disdrometer can measure droplet sizes from 0.25 mm to about 25 mm, with 32 classes of varying diameter intervals. The velocity categories range from 0 to 22.4 m s−1, with 32 classes of varying intervals. Details of the instrument and the measurement technique used to determine the size and velocity of hydrometeors can be found in the literature (e.g. Löffler-Mang and Joss, 2000; Battaglia et al., 2010; Tapiador et al., 2010). An automatic snow meter station was located close to Gruvebadet laboratory at about 100 m southeast during the campaign period. It automatically provides continuous snow data, including near-infrared images of the snow cover area, snow depth, internal snow temperature, and liquid water content profiles at different depths, with a time resolution of 10 min.
2.3 Eddy covariance data analysis
The eddy covariance micrometeorological technique was applied in this work to quantify the atmosphere–surface particle exchange in a size-dependent mode. The flux is computed as the mean cross-product of the fluctuations in a scalar concentration (s′) and the vertical component of wind velocity (w′) as Fs = , where the overbar indicates the average values (Kaimal and Finnigan, 1994; Stull, 1988). Turbulent fluxes were calculated on a 30 min basis, using a homemade code developed in MATLAB® 2018b. In this work, the micrometeorological convention was used, according to which upward fluxes are positive, thus corresponding to emissions, while downward fluxes (towards the surface) are negative. EC measurements allow us to calculate the following main turbulence characteristics: the virtual sensible heat flux, which is ; hereafter sensible heat flux), where Ts represents the sonic temperature, cp = 1005 is the specific heat at constant pressure, and ρ is the air density; the turbulent kinetic energy, which is ), where σu,v,w is the standard deviation of the wind components; and the friction velocity, which is , where and are the horizontal momentum fluxes. Using CPC and OPC measurements together, a complete characterization of the particle number concentration can be obtained from ultrafine to coarse particle size ranges across 17 size bins. Particle fluxes from the particle number concentration were calculated according to for each particle size bin (index i). Size-resolved exchange velocities (Vex i) of aerosol particles were defined according to the following:
which shows the turbulent flux of each stage normalized by the respective particle number concentration. The minus sign is used to define the positive values of the deposition velocity () as a transport toward the surface (deposition) and negative values () as a transport into the atmosphere (emission), respectively. Positive and negative fluxes will be treated as two separate processes following the uneven distribution of positive and negative fluxes around zero. The separation of upward and downward flux periods or systematic removal periods of positive flux based on other parameters is a common practice in deposition studies (e.g. Nilsson and Rannik, 2001; Vong et al., 2004; Pryor et al., 2013; Lavi et al., 2013; Emerson et al., 2020). Atmospheric stability is a crucial quantity for the characterization of the turbulent pollutant dispersion in the environment, and it is considered in the parameterizations of turbulent characteristics and wind profiles (Nordbo et al., 2013). To classify the different atmospheric conditions over the entire measurement period, the atmospheric stability parameter is defined as ζ = , where z is the measurement height, and L represents the Obukhov length, which is computed as follows:
where Ts is the sonic temperature measured by the anemometer. Five stability classes are estimated, according to Nordbo et al. (2013), as follows: very unstable (ζ < −1) and unstable (ζ < −0.01), neutral (−0.01 0.01), stable (ζ > 0.01), and very stable (ζ > 1).
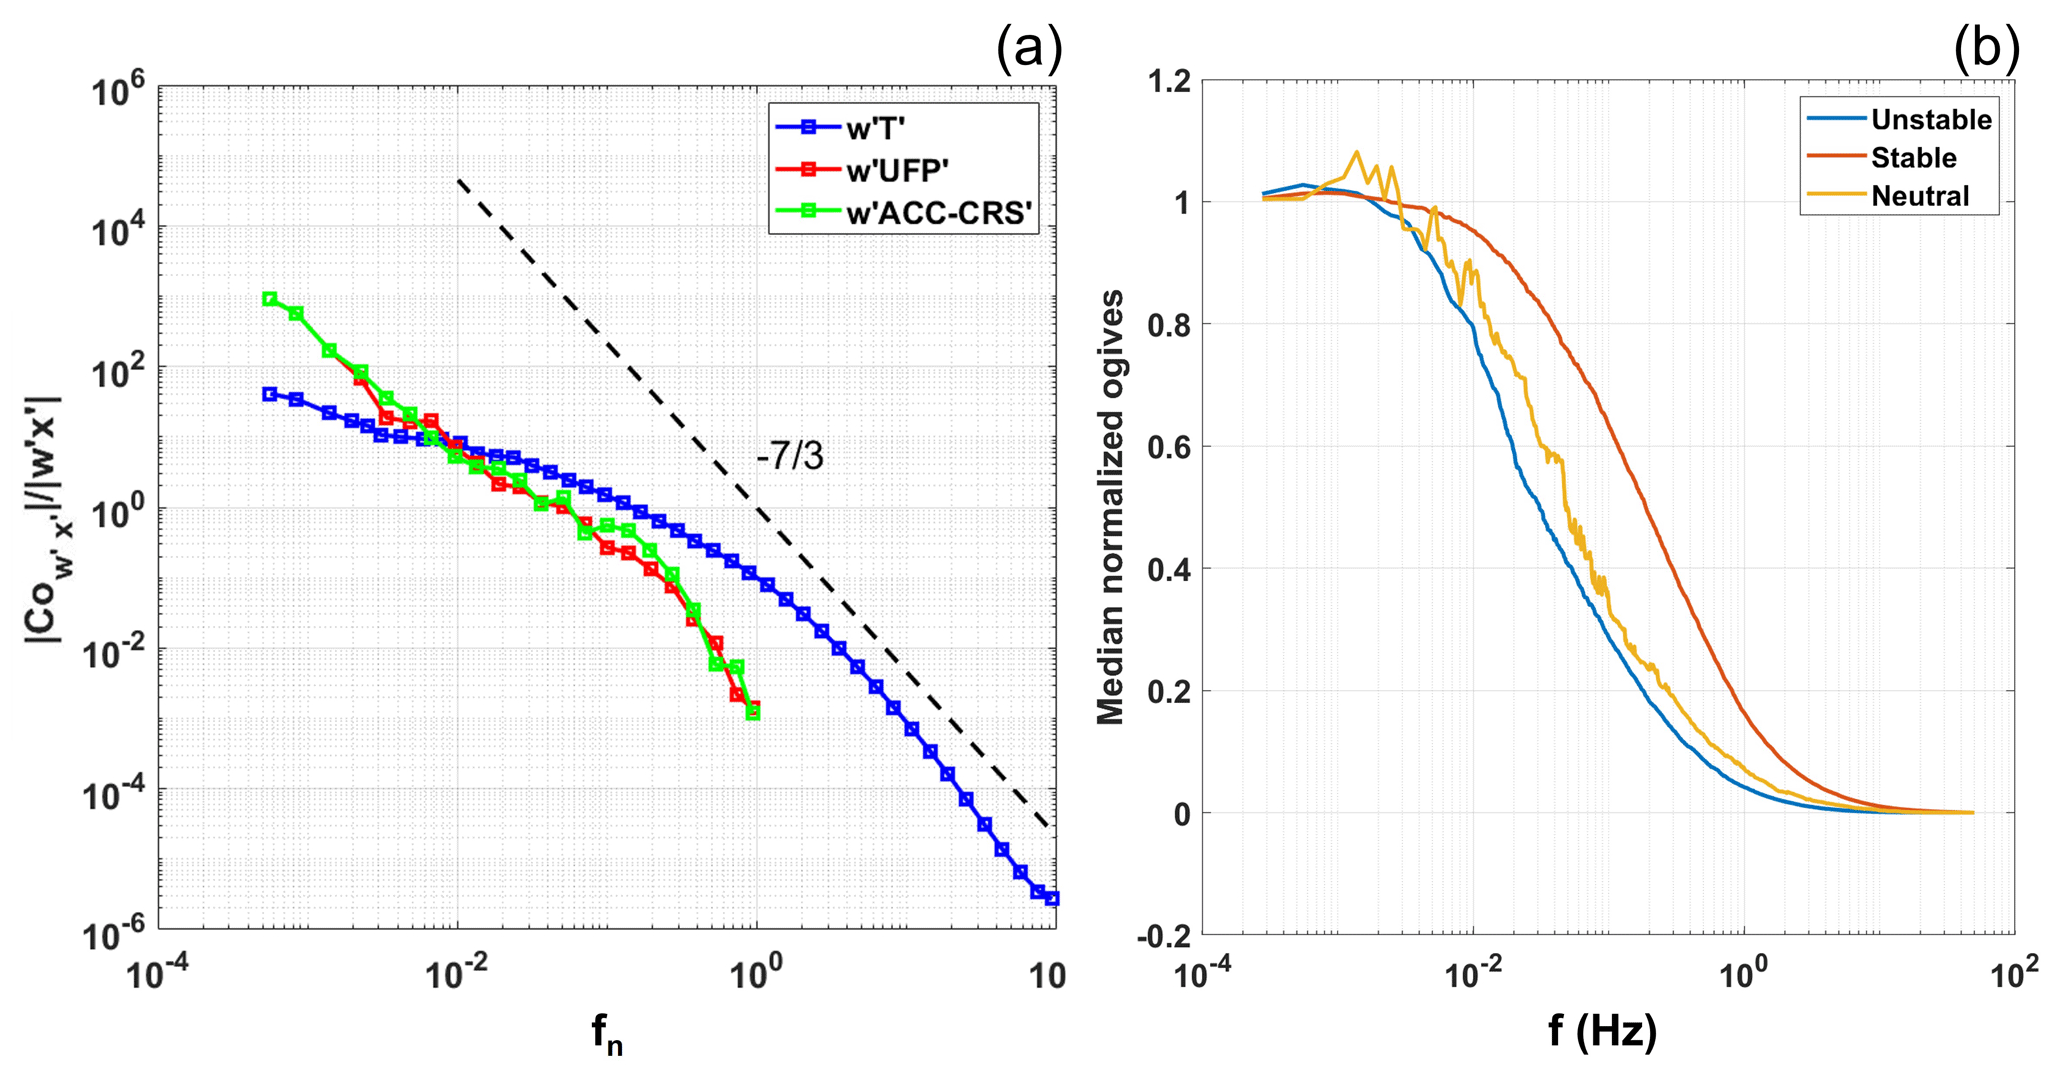
Figure 2(a) Normalized median cospectra of the kinematic heat flux (blue), ultrafine particle (UFP; red), and accumulation mode and quasi-coarse mode (ACC-CRS) particle flux (green) as a function of fn. The binned median cospectra (about 1500) were computed from a continuous period of 1 h. The dashed black line represents the slope theoretically predicted in the inertial subrange (Kolmogorov, 1941). (b) Median normalized ogives for kinematic heat flux as a function of natural frequency (Hz) for the three classes of atmospheric stability.
2.4 Data pre-processing
Half-hour periods were hard flagged for dropouts, discontinuities caused by power loss, or values outside the absolute limits and discarded from the data set. These events resulted in 25 % and 24 % of data being rejected for the CPC and OPC fluxes, respectively. The OPC measurements were discontinued on 29 July due to technical issues. The raw data were pre-processed by first applying a despiking procedure to eliminate spikes caused, for example, by electronics issues. Spikes in the 100 Hz (anemometer) and 1 Hz (CPC and OPC) time series were removed from the data set and replaced by linear interpolation, using a procedure described by Vickers and Mahrt (1997). A spike-detection algorithm was applied to the raw high-frequency data defining spikes as absolute deviations from the mean of a threshold value that is 6-fold σ (where σ is the variance of the 10 min sub-interval). Using a closed-path instrument (i.e. CPC or OPC) with a sampling tube, the air sampled by the sonic anemometer takes many seconds to reach the scalar sensor, leading to a time lag between the vertical wind component fluctuations w′ and concentration fluctuations c′. Without correcting for the time delay, the vertical wind component fluctuations do not correlate properly with concentration fluctuations, leading to incorrect flux estimation. Such a time lag was estimated by means of a cross-correlation analysis, by moving the time series forward, defining the maximum covariance between the vertical component of wind speed and particle number concentration, and considering a time window between 3 and 5 s. This time window was estimated using the flow rate, tube length, and response time (Deventer et al., 2015). A mean time lag of 4.14 s was calculated for CPC and 3.77 s for OPC (for all size channels), respectively. The wind data were rotated along the streamline reference system (McMillen, 1988) via three rotations. The first two rotations set a reference system that, for each averaging period, aligns the streamline velocity component with the mean wind velocity vector. The third rotation was performed, except when the absolute value of the angle of attack (McMillen, 1988) was greater than 15∘ (about 3 % of total cases). In neutral or stable atmospheric conditions with low wind speed and weak and intermittent turbulence (Sun et al., 2012; Schiavon et al., 2019), the submeso motions do not follow the surface layer similarity, but they can still contribute to observed statistics (Vickers and Mahrt, 2006; Liang et al., 2014; Mortarini et al., 2016). According to some authors (e.g. Vickers and Mahrt, 2003), similarity relationships should be evaluated only after filtering out the contribution from these motions. In this work, the energy contributions related to non-turbulent submeso motions, with timescales often longer than the investigated time window, were removed by a recursive digital filter both for heat and particles fluxes (Falocchi et al., 2018; Pappaccogli et al., 2022). The recursive digital filter worked on a different timescale, depending on the atmospheric stability conditions. Ogive analysis (Fig. 2b) was carried out in order to estimate a proper timescale (Metzger and Holmes, 2008). A detailed description of the methodology used for spectral and ogive analysis is reported in Pappaccogli et al. (2022). The timescale for unstable atmosphere is 522 s, whereas the value decreases to 350 and 340 s for neutral and stable conditions, respectively. This filter does not introduce any phase shift or signal amplitude attenuation in the filtered time series. The filtering procedure used two data buffers (1800 s long) before and after the considered 30 min period of investigation. A fundamental assumption of the EC method is that fluctuations are statistically stationary during the chosen averaging time to ensure the calculation of an ensemble average. Stationarity tests, as reported by Mahrt (1998), were carried out on sonic temperature and the particles' concentration fluctuations (Cava et al., 2014; Věcenaj and De Wekker, 2015). A lower detection limit for the fluxes in the sampling system was computed using the method proposed by Langford et al. (2015) and defined at 2.8 for the CPC and 0.3 for the OPC. To ensure the study of particle dry deposition only, all data corresponding to a precipitation intensity greater than 0.1 mm h−1 for a period greater than 5 min (on the averaging period of 30 min) were also rejected. Errors associated with the random and limited statistical counting (relative error; %) were estimated through the approach reported in Deventer et al. (2015) for the particle number concentration δ(N) and fluxes . The method reported in Fairall (1984) was used for the deposition velocity δ(Vd) for each size range (Table 1). Obviously, uncertainties due to discrete counting δ(N) are negligibly small for all stages, as they increase from ultrafine to coarse particles (greater than 100 %). Hence, the relative flux uncertainty , due to limited counting statistics, is also moderate (on average 9 %), and the average exceeds 25 % only for the 11th OPC channel. If the counting errors in the deposition velocity δ(Vd) are considered, then on the first size channel (CPC) it was very low (< 5 %). The same error for the first 11 channels of OPC (0.25–0.80 µm) was on average about 85 %, while for the remaining channels (1–3 µm) it was on average greater than 100 % (on average 109 %). To lower the associated statistical counting error, especially on deposition velocity, the first nine channels have been pooled together, as have the remaining seven channels (Whitehead et al., 2012; Conte et al., 2018; Donateo et al., 2019).
Table 1The relative error associated with the random and limited statistical counting for the particle concentration, fluxes, and deposition velocity is shown. Aerodynamic (D50) cut points and the respective geometric mean diameter (Dgm) are also reported. Note that UFP is for ultrafine particle, ACC is for accumulation mode, and CRS is for quasi-coarse mode.
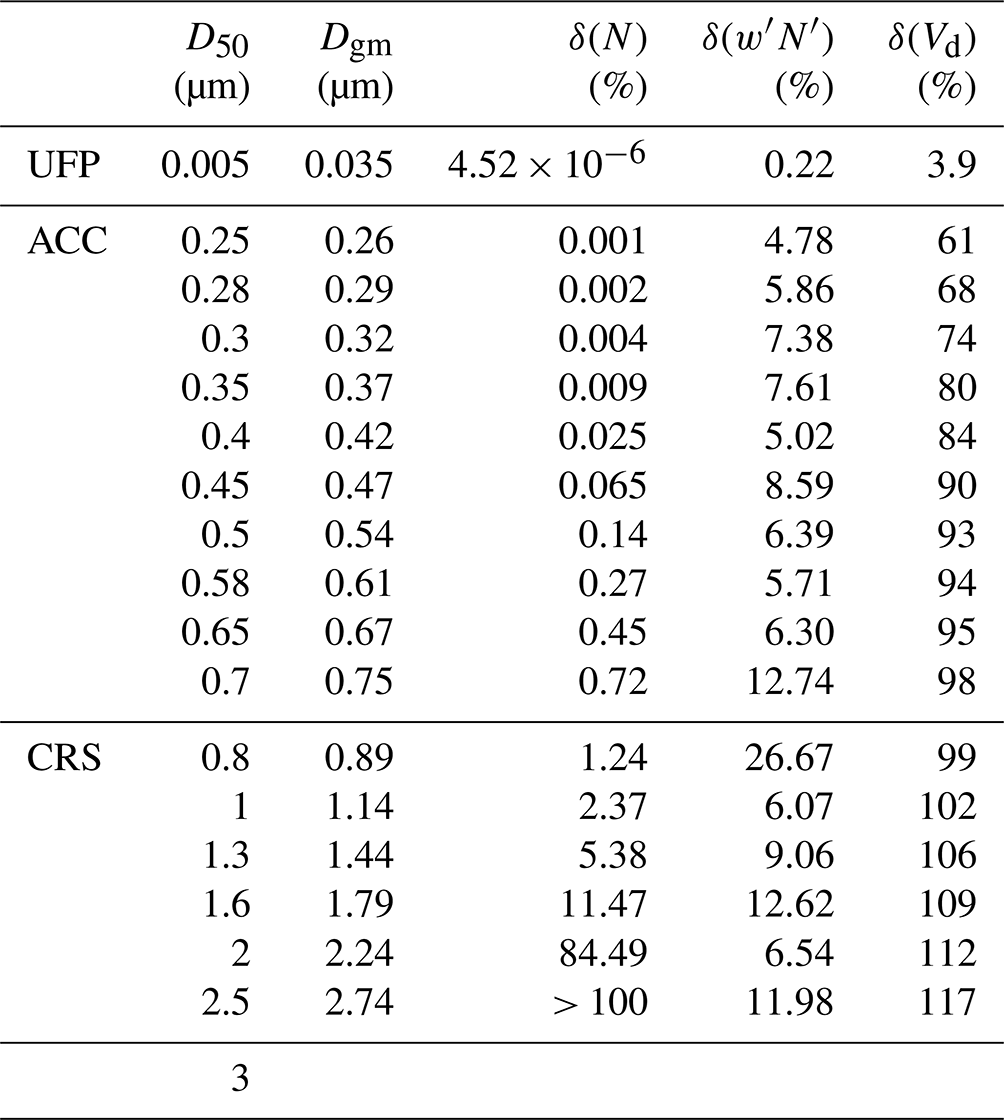
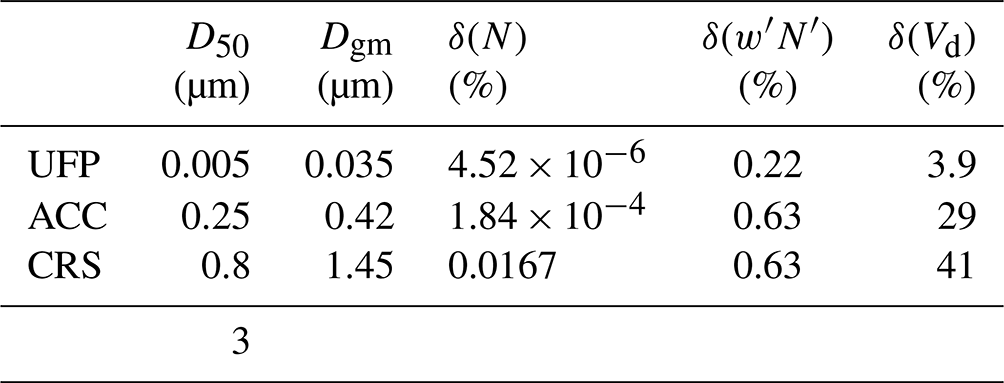
The previous considerations confirm that it is possible to aggregate the particles into the three size ranges mentioned below, namely ultrafine (UFP; 5 nm < dp < 0.25 µm), accumulation (ACC; 0.25 < dp < 0.7 µm), and quasi-coarse (CRS; 0.8 < dp < 3 µm) mode, with the last mode indicating a particle size range between large accumulation mode and small coarse particles. It is worth noting that UFP particle concentration has been obtained as the difference between the total number concentration (CPC measurement) and the OPC total concentration in the size range 0.25–1 µm. The relative counting errors in Vd for these two groups are approximately 29 % for ACC and 41 % for CRS (Table 2). This size aggregation is also supported by the correlation analysis of the concentration time series associated with the different size classes. The resulting correlation shows that all classes in the first and second group have a good temporal correlation (Pearson coefficient > 0.6) with each other. The UFP fraction was obtained from the difference between the sum of the first 12 OPC channels (up to 1 µm) and the total number concentration of the CPC. This subdivision will be useful for studying the characteristics and trends of the particles and their possible correlation with meteorological and micrometeorological parameters.
Table 2The relative error associated with the random and limited statistical counting for the particle concentration, fluxes, and deposition velocity is shown. Aerodynamic (D50) cut points and the respective geometric mean diameter (Dgm) are also reported.
2.5 Spectral analysis and corrections
The cospectra were computed on the vertical wind speed component and the analysed scalars (sonic temperature, ultrafine, accumulation, and coarse particle concentration) by means of the fast Fourier transform (FFT). Figure 2a shows normalized median cospectra (about 1500) of the kinematic heat flux, UFP, and ACC-CRS particle number flux as a function of a normalized frequency , where u is the mean wind velocity, z is the measurement height, and f is the sampling frequency. The cospectra were calculated over 1 h periods. ACC-CRS cospectra were calculated based on the sum of all OPC size channels. The cospectra between the vertical wind velocity and the scalar x are normalized with the correlation . Cospectra calculated for all variables display similar patterns, showing a decay for frequencies above 10−1, which is within the universal equilibrium range.
Specifically, the kinematic heat flux cospectrum shows a slight slope at the high frequencies, which tend to level off in the low-frequency range. Results indicate that the contribution to the correlation between w and particle concentration follow a kinematic heat flux trend up to normalized frequencies in the interval 0.5–0.8. Therefore, the system used was generally able to measure concentration fluctuations at frequencies that made a substantial contribution to the vertical turbulent fluxes of particles. Figure 2b shows the normalized median ogives of kinematic heat flux. A comparison of the ogives for the different atmospheric stability classes (defined below in Sect. 3.1) shows that the higher frequencies contribution is larger under stable conditions. Indeed, no relevant contribution to kinematic heat flux occurs above 1 Hz (1 s timescale) under unstable conditions, whereas a small turbulence contribution is still present up to about 2 Hz (0.5 s) and 5 Hz (0.2 s) under neutral and stable conditions, respectively. Ogives obtained for neutral conditions display some irregularities due to the low number of available cases. In Fig. S4, the ogives for the CPC and OPC data for the whole data set (with no distinction for stability conditions) were shown. Spectral corrections were applied to the UFP, ACC, and CRS particle number fluxes, using the theoretical approach described in Aubinet et al. (2012). The first-order time constant of the CPC and OPC measurement systems was determined by estimating the time response (at the first order) to a concentration step in a laboratory experiment. The results were τCPC = 0.77 ± 0.01 s and τOPC = 0.40 ± 0.03 s (identical for each size channel). High frequency under the sampling of the EC system, due to the relative low-frequency response of the CPC and OPC, leads to an error (underestimation) of the measurement of the particles' fluxes. It means that the full atmospheric cospectra between the vertical wind velocity and the particle concentration can be under sampled at high frequency (Fig. 2a). High-frequency losses were corrected following the parametric/in situ approach developed by Horst (1997), and these losses have been quantified on average to 30 % for CPC and 21 % for OPC. A spectral correction of the attenuation of the fluctuations during the transport of the aerosol sample in the inlet tube was obtained according to the method reported by Massman and Ibrom (2008). This spectral correction for our measurement system resulted in a very low associated error (lower than 0.01 %).
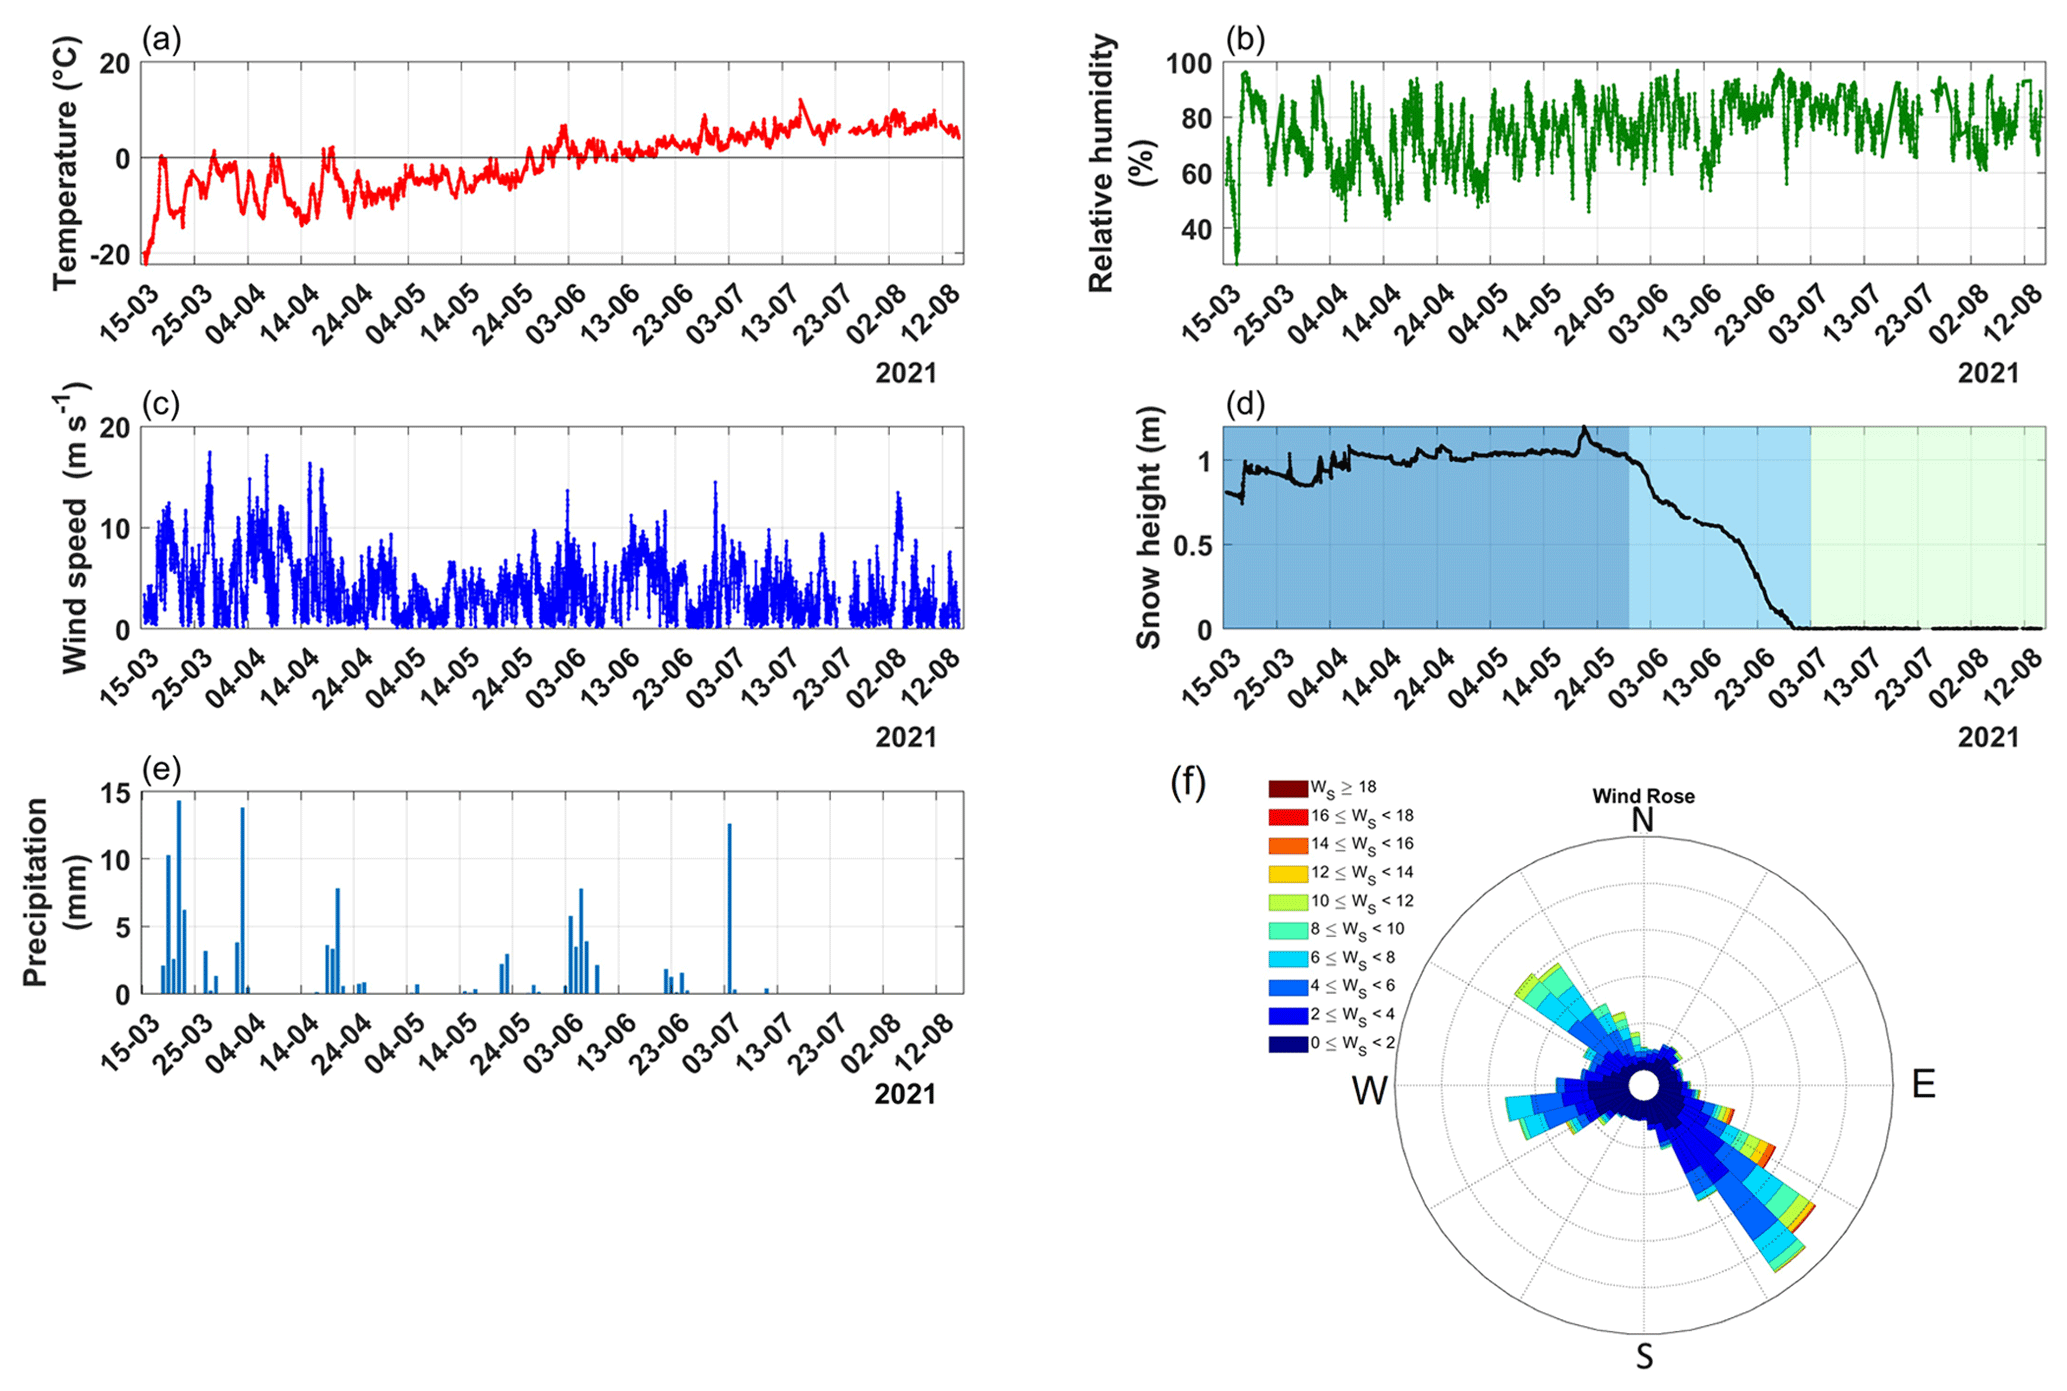
Figure 3Time series of the principal meteorological variables measured during the campaign in Ny-Ålesund. (a) Air temperature (∘C), (b) relative humidity (%), (c) wind velocity (m s−1), (d) snow depth (m), (e) daily cumulative precipitation (mm), and (f) wind direction (∘ N). In panel (d), three colour bands were used to separate the period characterized by snow cover (dark cyan) from the melting snow period (cyan) and, finally, the snow-free phase (light cyan).
3.1 Site meteorology and micrometeorology
During March and April, the air temperature was on average −7 ∘C, while during summertime (June–August) the temperature was above 5 ∘C (Fig. 3a).
Positive temperature values occur approximately at the end of May (29 May), leading to a gradual melting of the snowpack, which reached a maximum height of 1.20 m on 21 May (Fig. 3d). Specifically, the snowpack had an average height of 1 m until 30 May (hereafter named the snow cover period or SC). Snow depth decreased gradually for about 8 d due to its compacting processes. Snowpack was on average 0.54 m from 30 May for about a month until 3 July. In this period (hereafter named the snow melting period or SM), snowpack went through a complete melting phase until the summer period, with the presence of widespread ponds and snow patches in the footprint of the EC system. This period was characterized by positive daily average temperatures. The last period of the measurement campaign, from 3 July to 15 August, will be referred to as the snow-free period (SF), with the surface covered by dry tundra. Relative humidity in general increases from a minimum of 37 % during a severe storm in the month of March up to 82 % in July (Fig. 3b).
A direct correlation is observed between snow melting and increased relative humidity, even if the latter variable is also strongly influenced by the presence of the Kongsfjorden close to the site. Two prevailing wind directions can be distinguished, with one characterized by winds coming from the northwesterly sector for 27 % of the cases and one with winds coming from the southeast for 42 % of the cases (Fig. 3f). Indeed, the prevailing wind directions are essentially along the direction of the Kongsfjorden. On the other hand, from mid-to-end June onwards, the wind field shows two components from west–southwest and northeast (with low winds). The highest wind speeds are measured in the northwesterly direction, with an average of 4.9 m s−1, while in the southeasterly direction the average wind speed is about 4.0 m s−1 (Fig. 3c). In the measurement period, 22 rain days were observed starting from 1 June, with a cumulative precipitation above 2 mm for 9 d. In this period, the maximum amount of cumulative rain on daily basis was of 23 mm on 4 June. In the first part of the campaign, until 30 May, 16 d of precipitation were observed, with a peak of snow height (1.20 m) on 20 May.
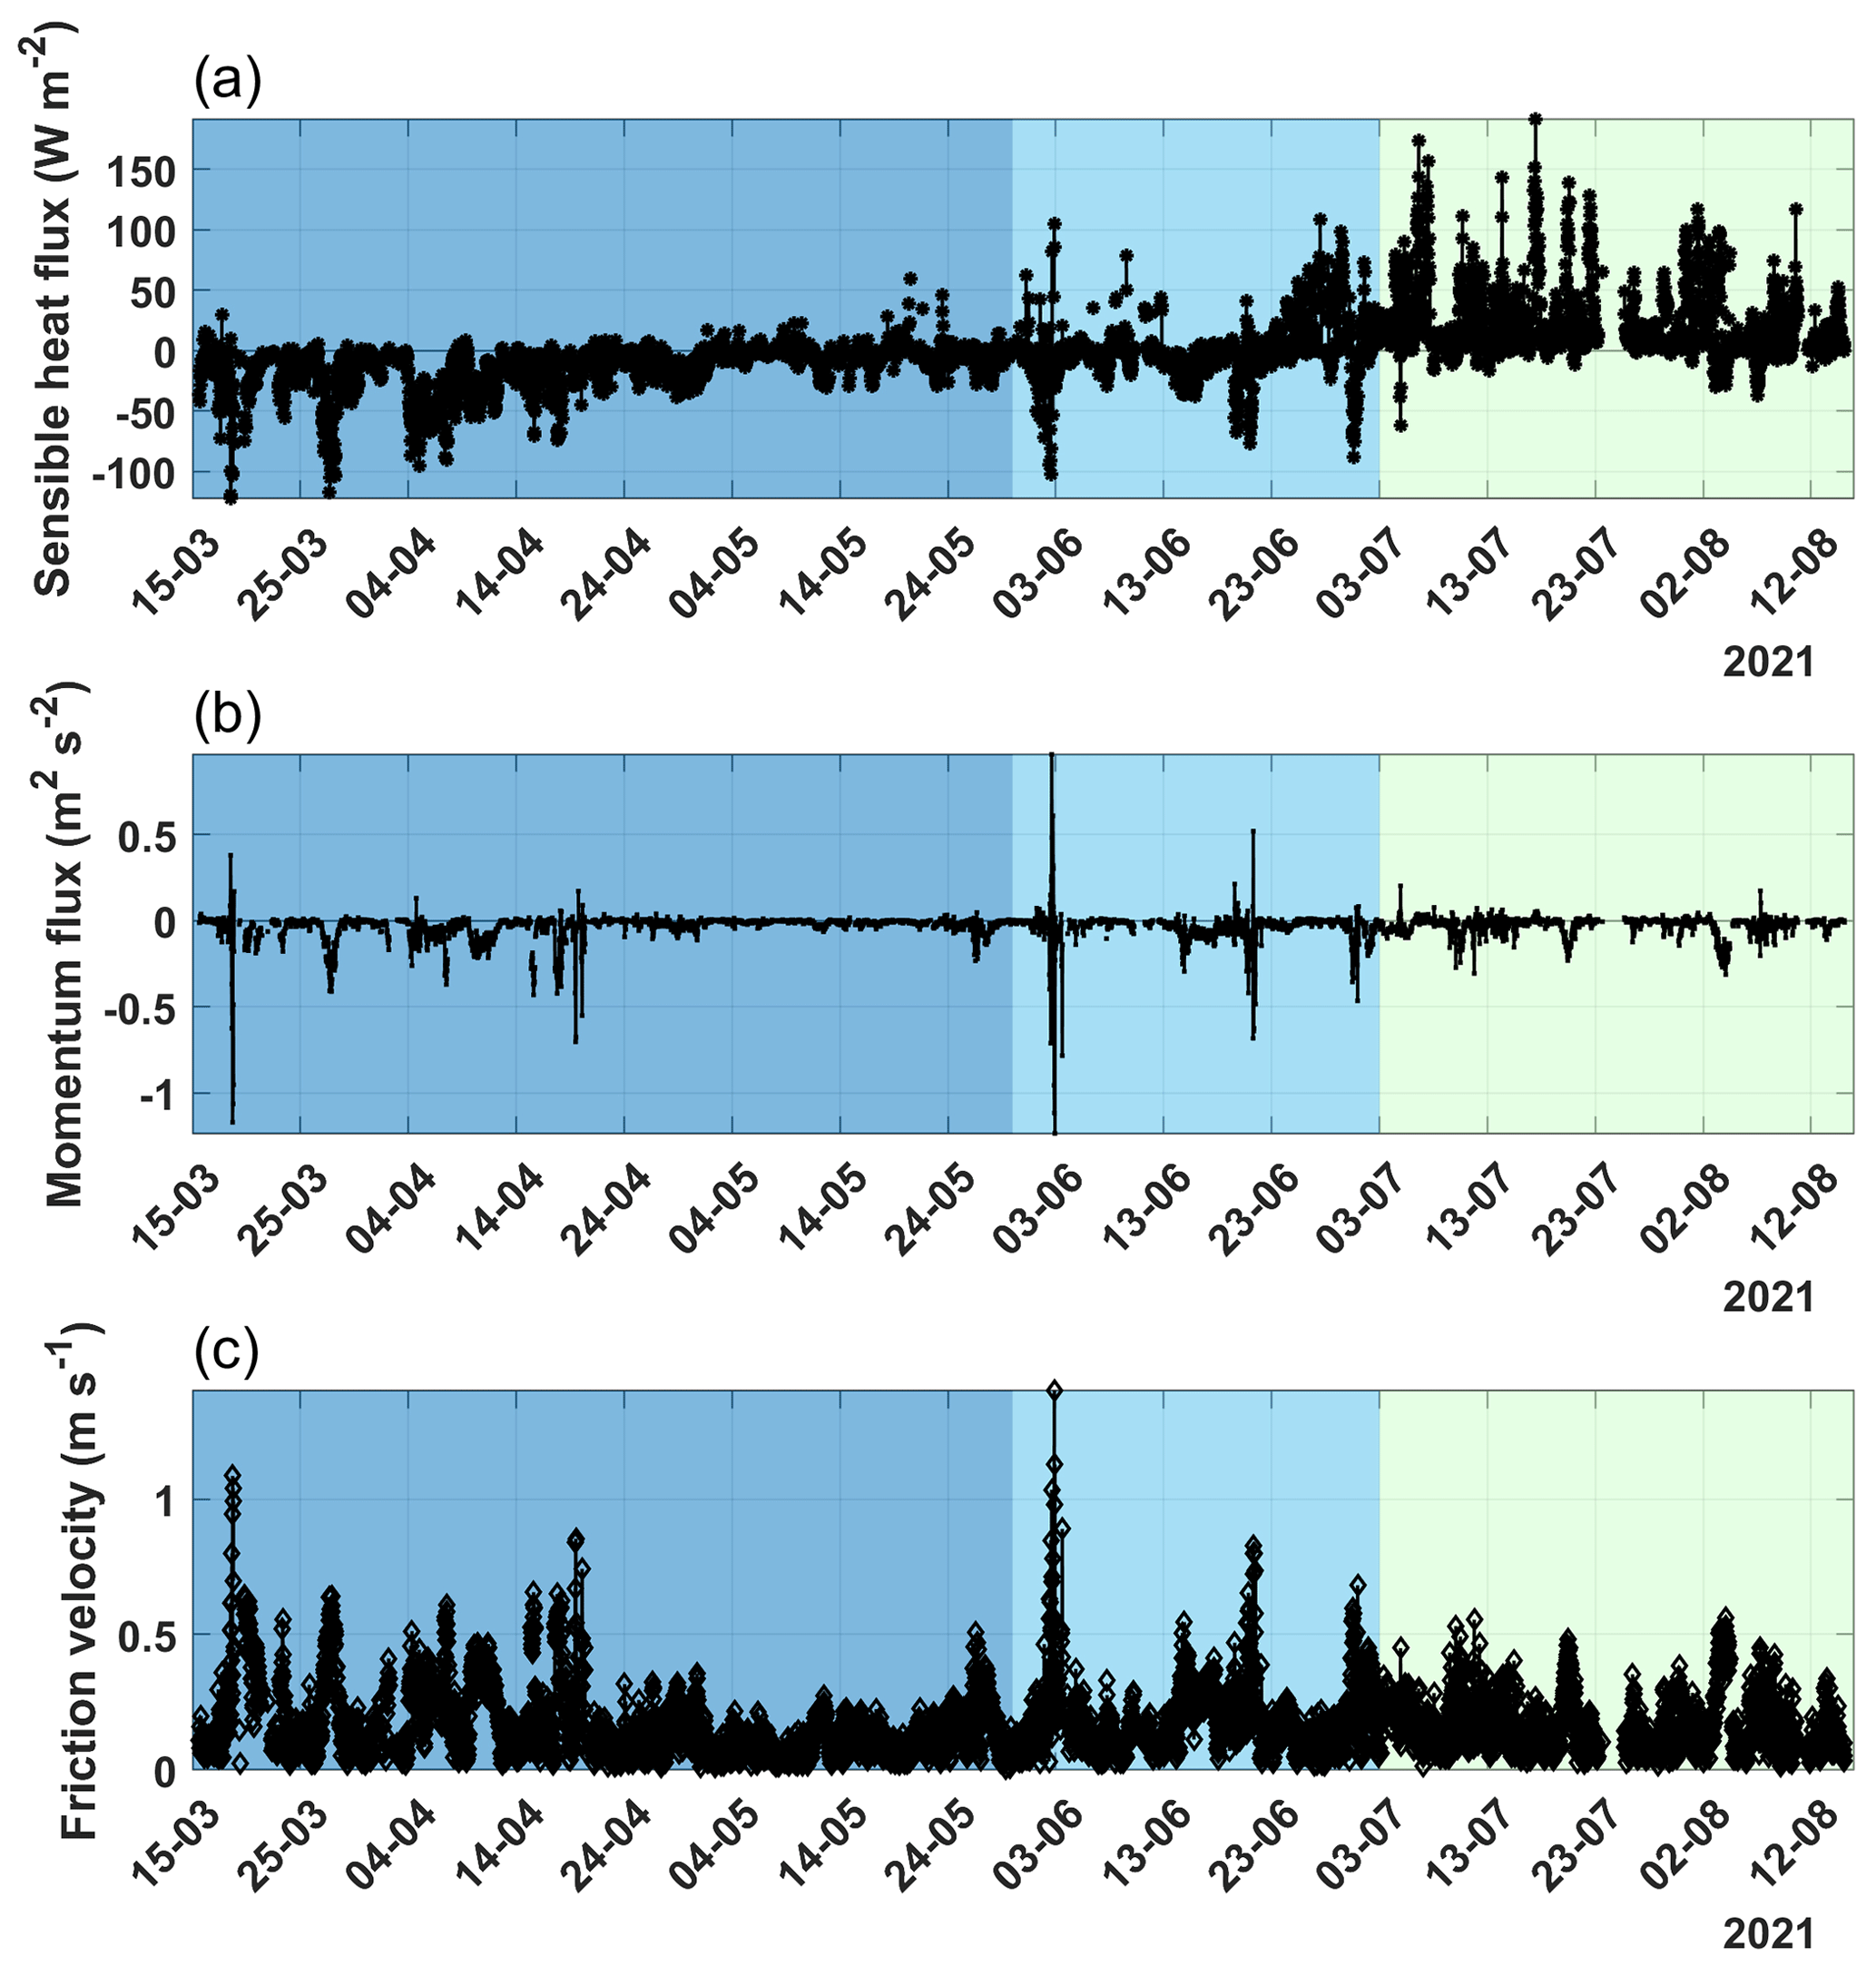
Figure 4A time series of the principal micrometeorological variables measured during the campaign carried in Ny-Ålesund. (a) Sensible heat flux, (b) momentum turbulent flux, and (c) friction velocity u∗. In each panel, three colour bands were used to separate the period characterized by snow cover (dark cyan) from the melting snow period (cyan) and, finally, the snow-free phase (light cyan).
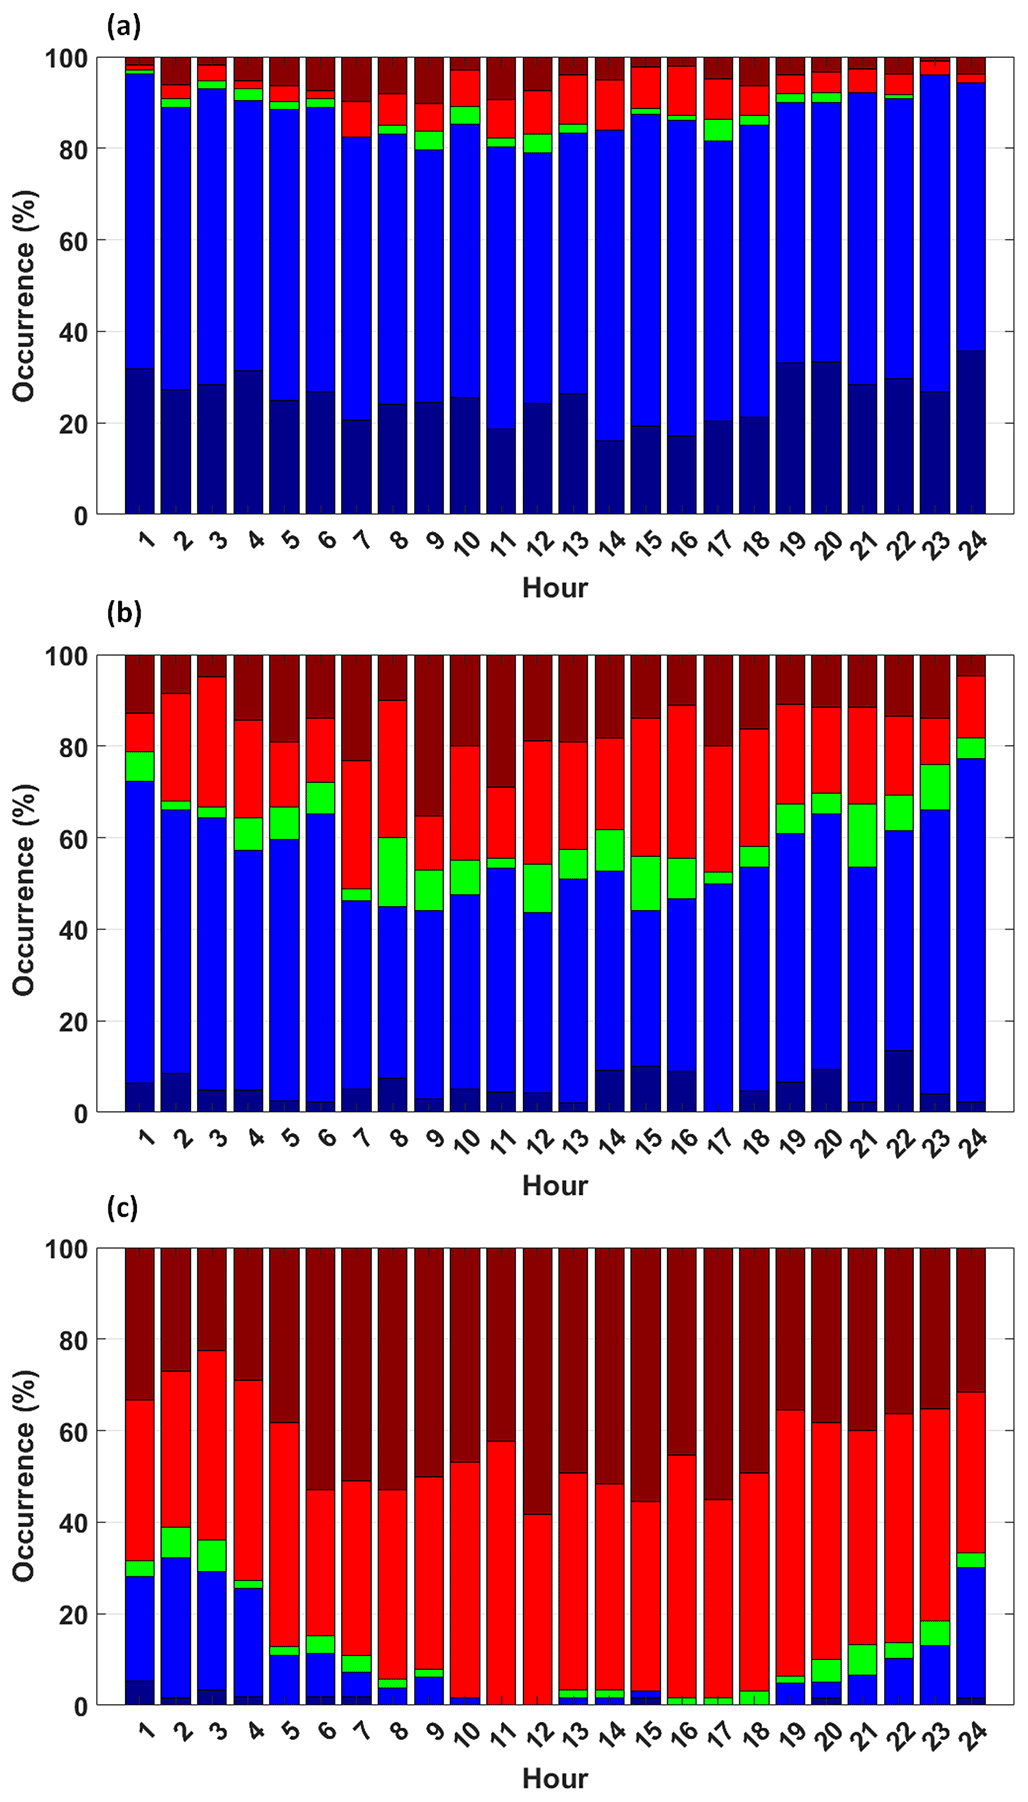
Figure 5Percentage of atmospheric stability over the daily cycle for the (a) snow cover, (b) melting, and (c) snow-free periods. Stability classes based on threshold values of the stability parameter ζ were defined as very unstable (dark red; ζ < −1) and unstable (red; ζ < −0.01), neutral (green; −0.01 0.01), stable (blue; ζ > 0.01), and very stable (dark blue; ζ > 1).
The results from this work are completely in line with those reported in (Mazzola et al., 2016) for the data collected at CCT from 2010 to 2016. In the measurement period, the sensible heat flux was on average negative (−0.8 W m−2; Fig. 4a). The results show the presence of a long period with negative energy fluxes (with an average value of −10.7 W m−2) and a minimum around −121 W m−2 both while snow cover is present and during the snow melting phase, when the atmosphere is warmer than the surface. As the snow melts, positive sensible heat fluxes begun to appear, with values of up to 191 W m−2 (on a half-hourly base) in the month of July. This behaviour has also been observed in other measurement campaigns in the Antarctica (Van den Broeke, 2005; Van As et al., 2005) and in the Arctic (Kral et al., 2014), where the snowpack acts as a sink of heat during the winter and spring months. The kinematic momentum flux was typically downward (Fig. 4b), with an average of −0.034 m2 s−2. However, for about 16 % of the data, the direction of the momentum flux showed positive values. A particular event can be observed (Fig. S5) on 2 June from 14:00 to 18:30 LT, with large positive values of momentum flux (on average 0.40 m2 s−2). This event was characterized by air masses coming from the glacier Brøggerbreen, which is located west (250–270∘) of our measurement site, with relatively high velocity (on average 8 m s−1). More frequent positive momentum flux events with lower intensity occurred, coinciding with air masses coming from east–southeast (from the Kongsfjorden), most likely due to the effect of a very shallow sea breeze swell (Grachev and Fairall, 2001). Figure 4c reports the time series of friction velocity, with a mean value of 0.17 m s−1 over the whole measurement period. No specific differences can be noted in the friction velocity behaviour due to the changing in snowpack characteristics. As it can be noted in Fig. 5, stable conditions prevailed during the snow cover period (Fig. 5a), with 62 % of cases (and 26 % very stable), while unstable stratification was more frequent in the summer months (Fig. 5c; 45 % and 43 % for unstable and very unstable, respectively). Neutral stratification occurred with a maximum frequency of 7 % during the melting period and with no diurnal variability. It is worth noting the difference in a typical daily pattern at the mid-latitudes, characterized by a much greater contrast between day and night planetary boundary layer (PBL) temperature profile structures, compared to more unstable conditions during the day and more frequent stable conditions at night.
3.2 Footprint analysis
The ratio between wind velocity and friction velocity in atmospheric neutral conditions was used to evaluate the average roughness length z0 for the measurement site, using a parameterization based on similarity theory (Toda and Sugita, 2003). The results gave z0 = 0.005 m if the whole measurement period is considered. After separating the period with snow coverage from that without snow, the calculated values were z0 = 0.002 m and z0 = 0.004 m, respectively. No significant statistical differences were found when exploring the roughness length for different wind sectors. Besides, an evaluation, using the method reported in Toda and Sugita (2003), gave a null displacement height when considering again all wind directions together. The source area for the scalar fluxes have been evaluated using a Lagrangian footprint model by Kljun et al. (2015). The results of the flux footprint analysis of the EC system are shown in Fig. 1b, with fractions of the total flux originating within the respective contours (until 80 %). The particle fluxes measured at the rooftop site represented a surface area of about 0.48 km2 (with respect to the 80 % contour line), with a maximum distance of 400 m both in the northwesterly and southeasterly directions (otherwise 300 m in northeasterly and southwesterly sector). The flux peak contribution was in the wind direction sectors at about 40 m (± 20 m; Fig. 1). However, the source areas were quite homogeneous for all wind direction sectors around the measurement site, with 100 % of snow coverage for the first period of the campaign; from then onwards, the land cover was largely dry tundra and bedrocks, with about 1 % water surfaces (an arctic lake) in the flux footprint (Fig. 1).
Table 3Statistical quantities of UFP, ACC, and CRS for the particle number concentration and their turbulent fluxes for the different phases considered in this work (snow cover, snow melting, and snow-free period). Note that SD is for the standard deviation, and SE is for the standard error.
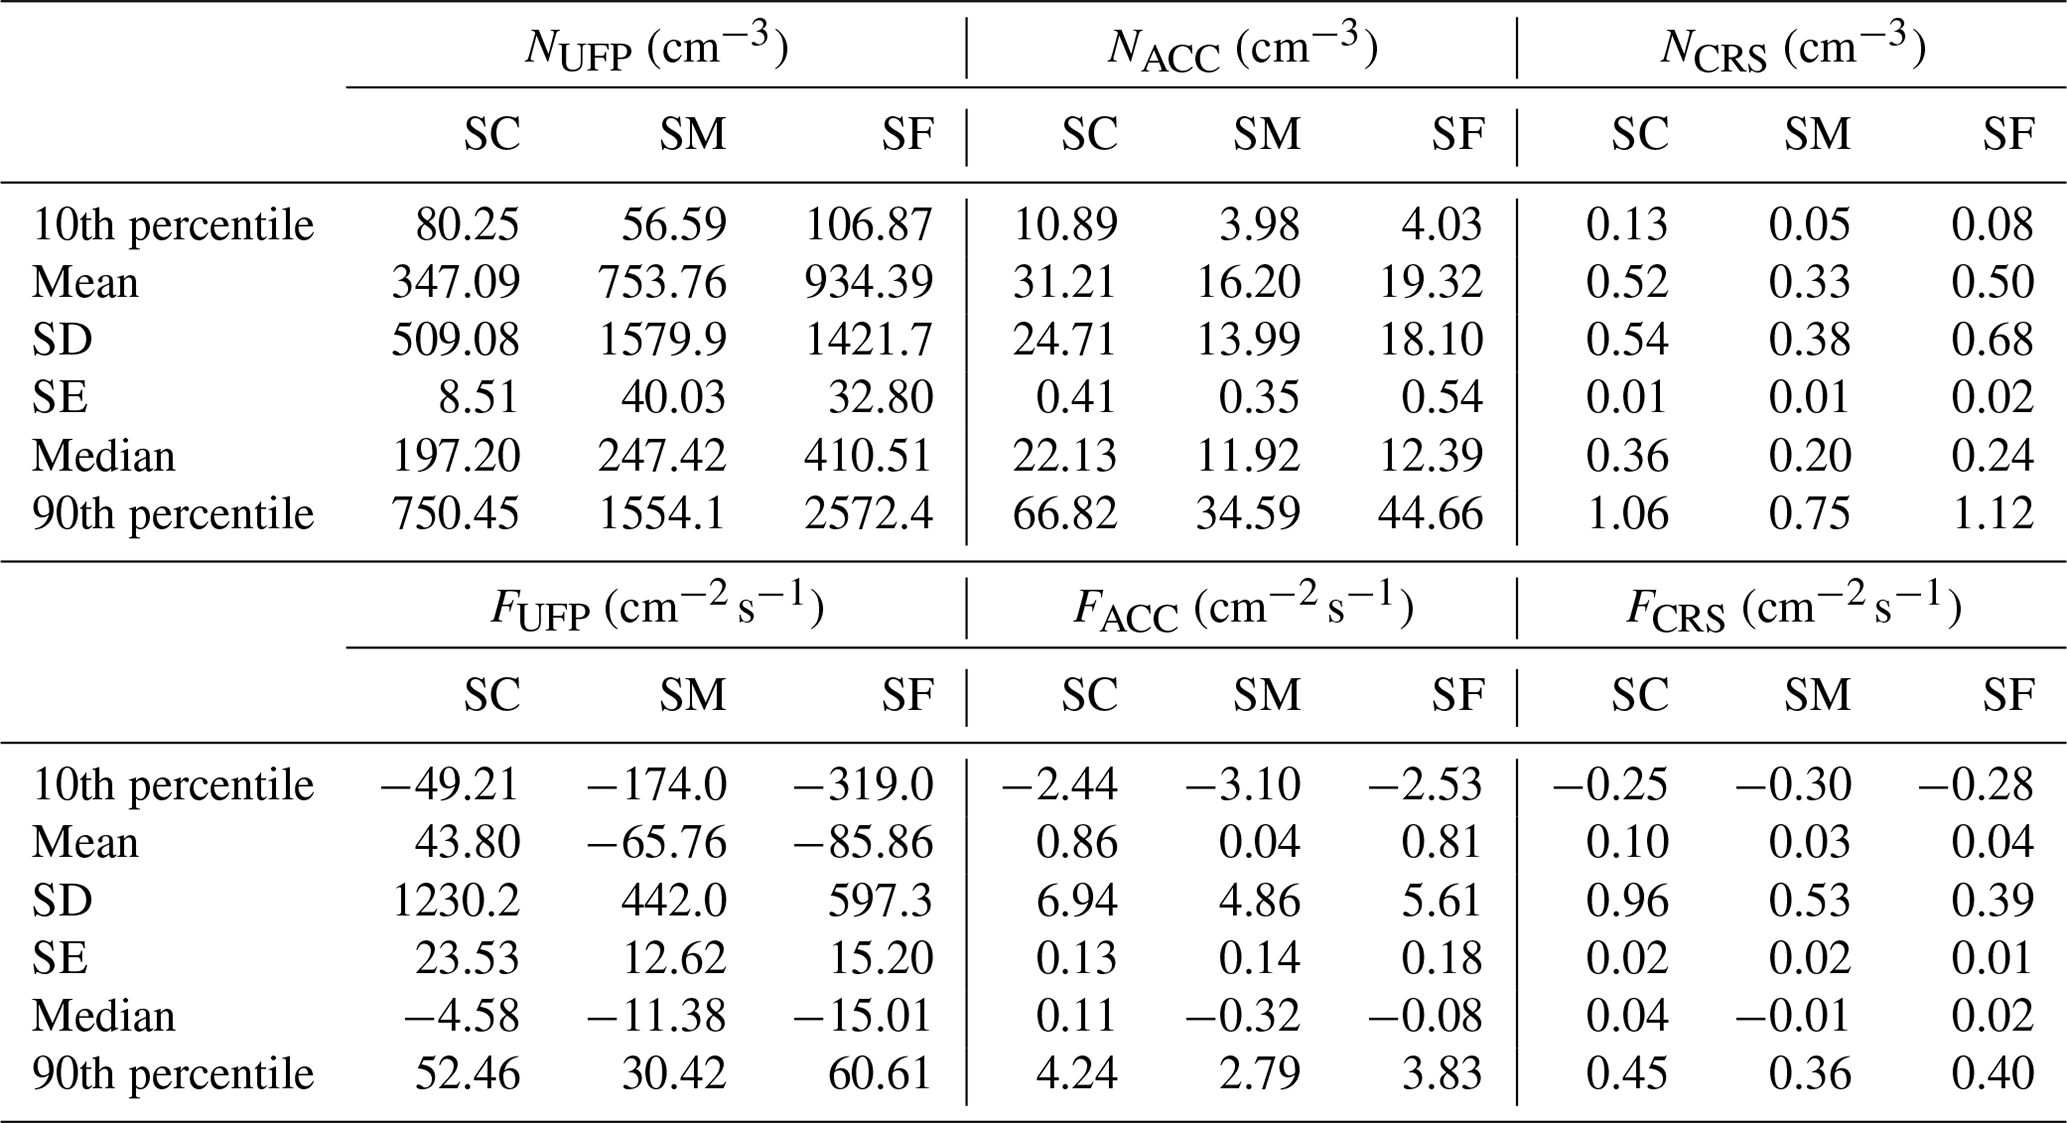
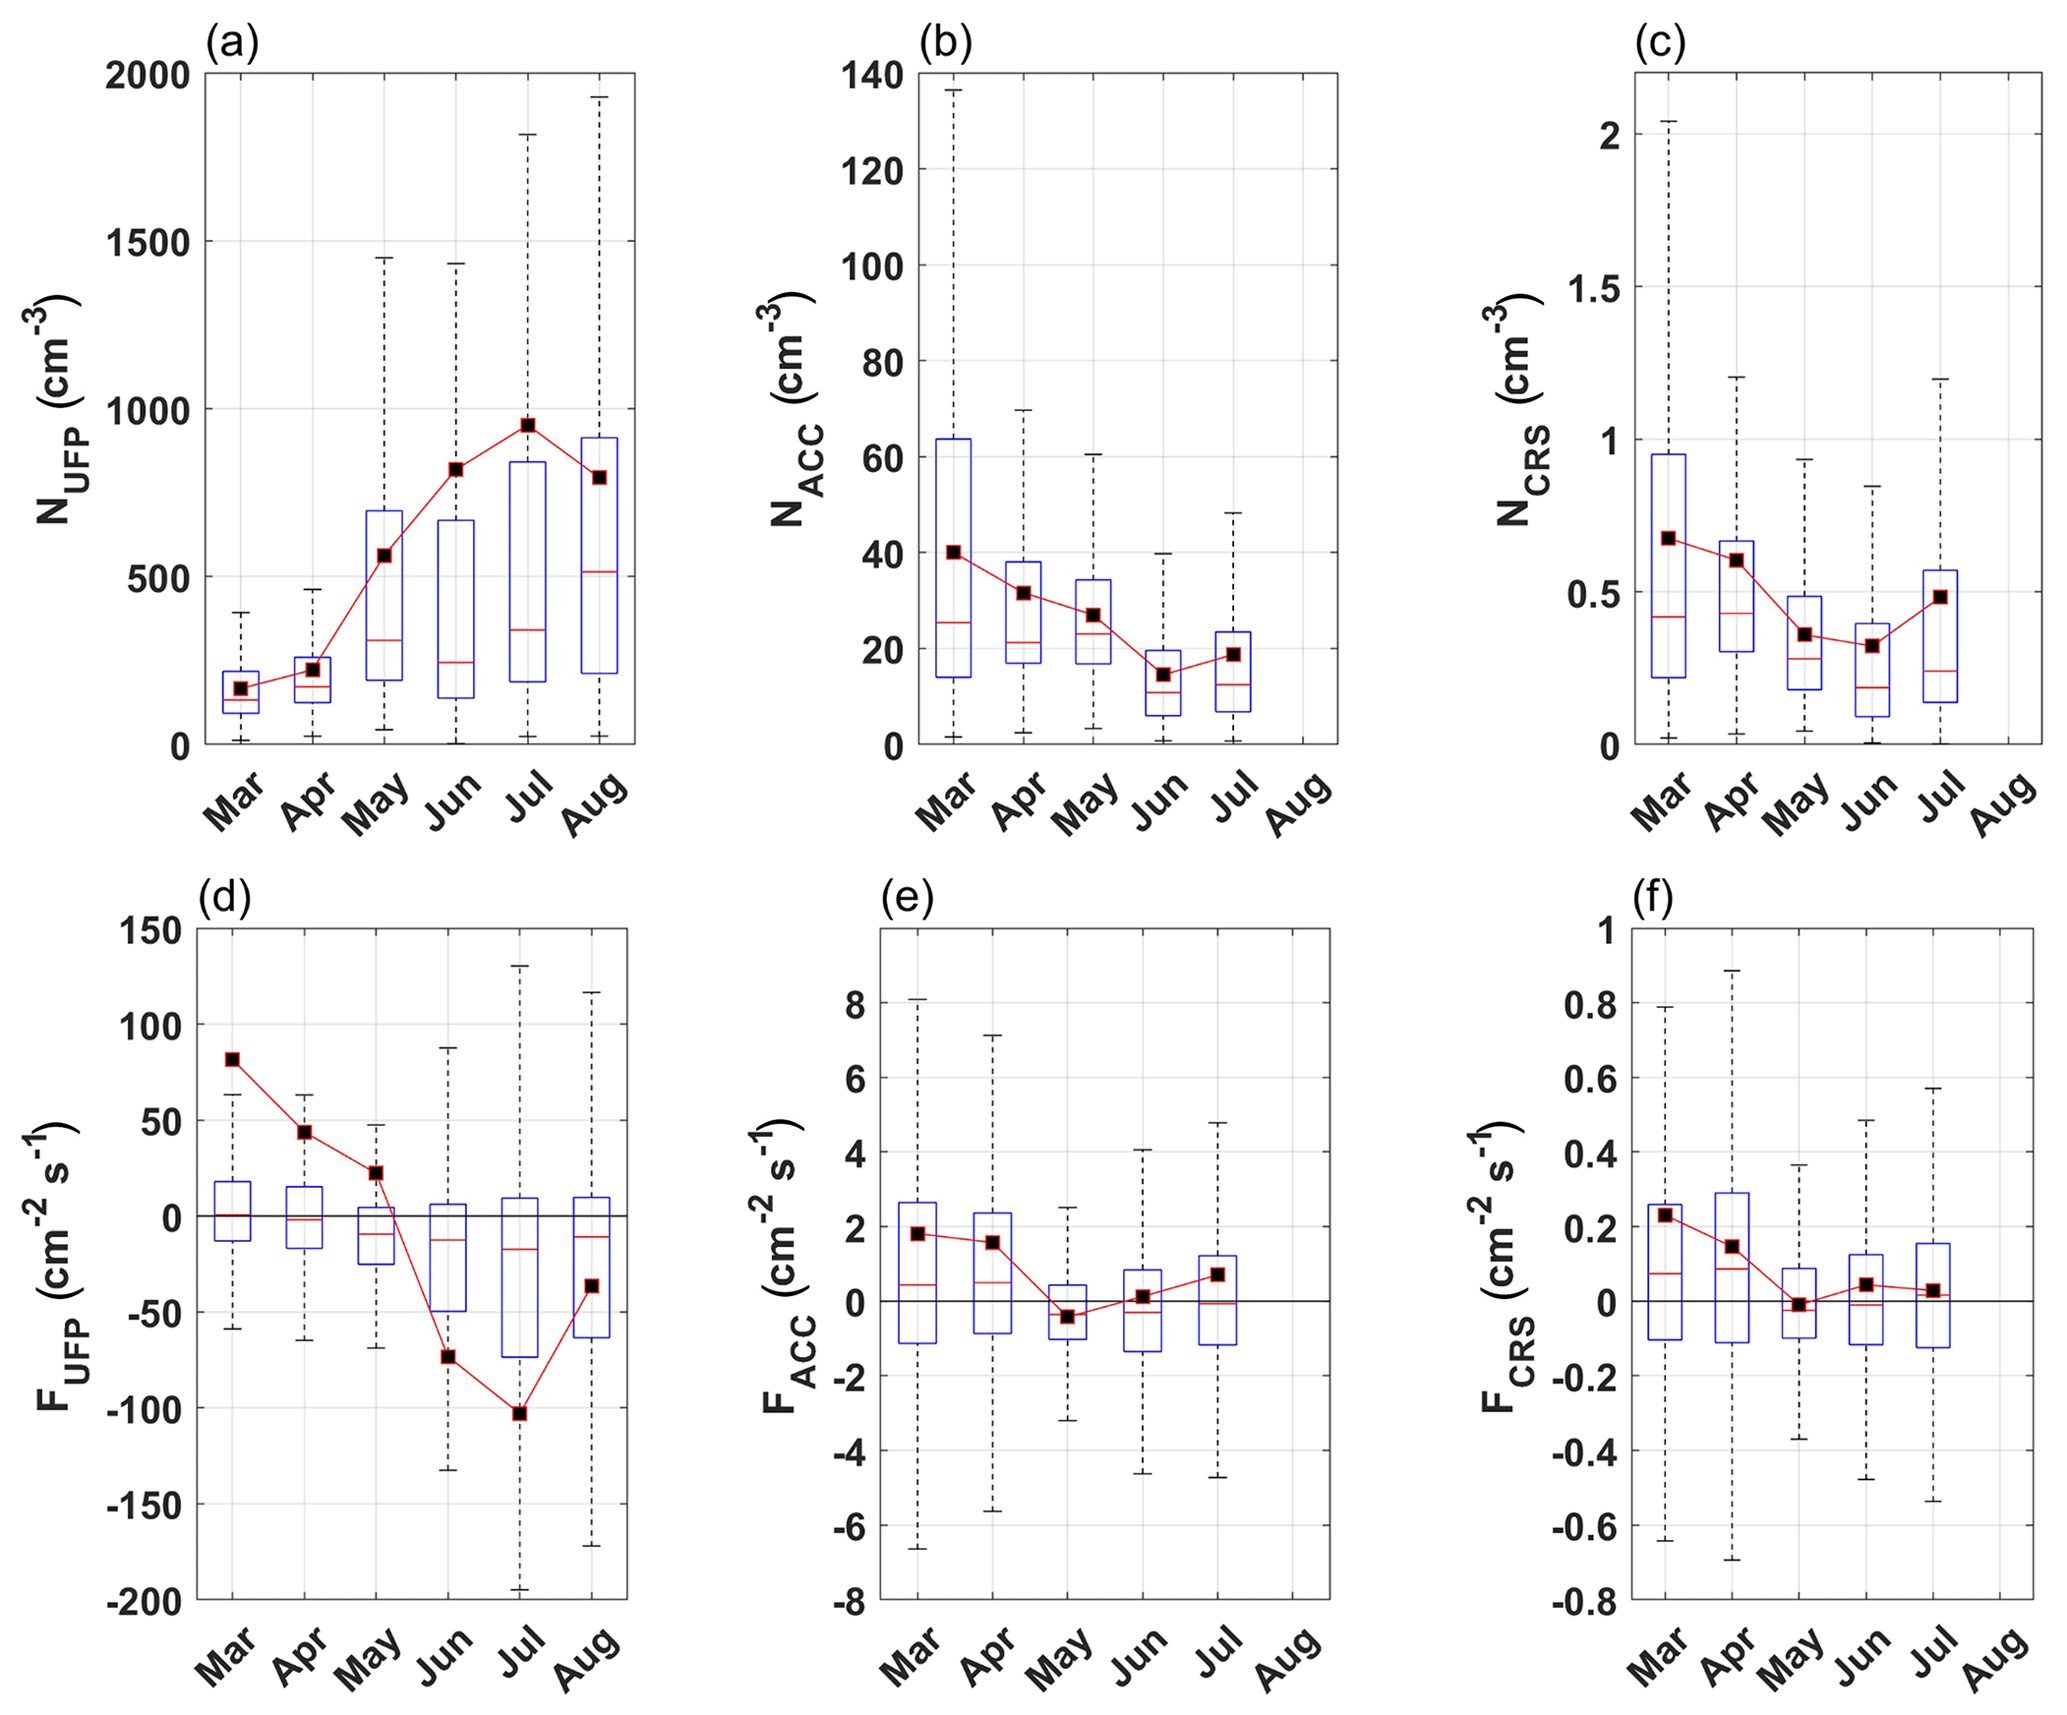
Figure 6Upper panels show the monthly box plots for (a) NUFP, (b) NACC, and (c) NCRS. Bottom panels show the monthly box plots for (d) FUFP, (e) FACC, and (f) FCRS. Continuous red lines represent median values. value. Boxes represent the 25th and 75th percentiles. Whiskers correspond to ± 2.7σ and 99.3 % data coverage. In black (square) are the average values for the measured variables.
3.3 Particle concentration and turbulent fluxes
Average particle number concentration, over the whole measurement period, for the UFP (hereafter NUFP) was 595 cm−3 (median 238 cm−3) and ACC mode (hereafter NACC) was 25 cm−3 (median 19 cm−3) and for the CRS mode (hereafter NCRS) was 0.47 cm−3 (median 0.30 cm−3; Table 3). NUFP increases from March (on average 166 cm−3) to August 2021, reaching its maximum in July (951 cm−3; Fig. 6a). On the other hand, NACC and NCRS show a different, anti-correlated behaviour with respect to the NUFP (Fig. 6b and c). NACC and NCRS reach the maximum concentration in March with, respectively, 40 and 0.67 cm−3, and then they decrease down to a minimum concentration in June (18 cm−3 for NACC and 0.47 cm−3 for NCRS). The same behaviour was observed by Croft et al. (2016) at the Zeppelin Observatory on the Zeppelin Mountain. The complete annual cycle is remarkably similar to that observed at Mount Zeppelin over an earlier 10-year period from 2000 to 2010 (Tunved et al., 2013). The particle size distribution was continuously monitored, combining the SMPS and OPC measurements, from the nanoparticle (4 nm) up to the micro-particle (2.5 µm) size range. The total size distribution plot (Fig. 7; black markers) refers to the whole measurement period. This plot shows a two-mode size distribution, with a high concentration of particles in the 0.02–0.04 µm range, with a peak at 0.03 µm (ultrafine mode), and 0.1–0.2 µm range, with a peak at 0.15 µm (accumulation mode). Considering the snow cover period, the particle size distribution (red markers) also presented two modes, in which one peaked at 0.03 µm and the other at 0.15 µm; with respect to the whole period of analysis, the dominant mode was the accumulation one.
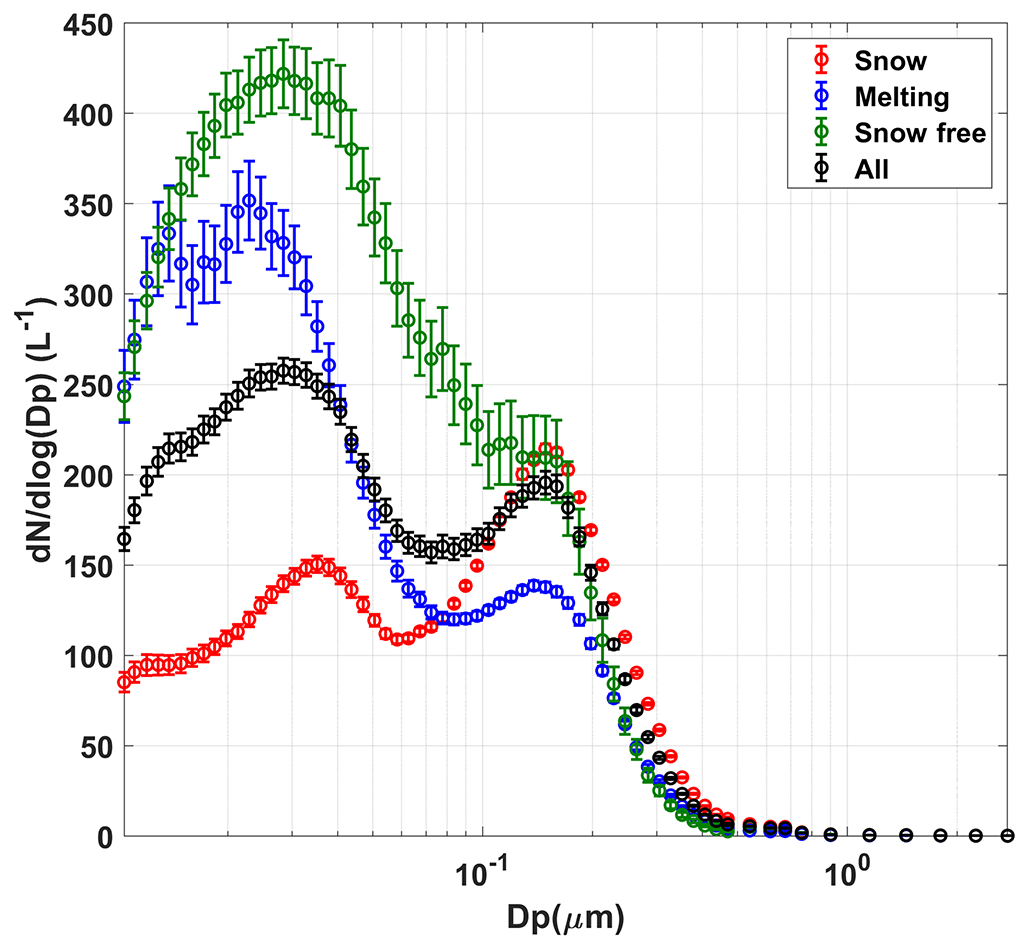
Proceeding towards the melting period and throughout the snow-free period, the two-mode size distribution tends to peak in the ultrafine range (0.02–0.03 µm), with an increasing concentration. In particular, during the snow melting, the particle concentration in the accumulation mode decreased, while the UFP mode significantly increases in this period. Previous studies at the mountain station of Zeppelin Observatory (south of Ny-Ålesund) showed that new particle formation events seem to be a rather common phenomenon during the summer season, and this is the result of both the photochemical production of nucleating or condensing species and a low condensation sink (Tunved et al., 2013; Ferrero et al., 2016). The particle size distribution pattern from the snow cover to the snow-free period can be explained as follows: during March–May, there is sunlight and also a large deposition aerosol surface due to the presence of long-range transported aerosol (Giardi et al., 2016). On the other hand, during June–August, atmospheric conditions are quite different, with high solar insolation and more daylight hours bringing new particle production and supporting their growth to a large size (accumulation mode). Furthermore, the seasonal effect of nucleation precursors is also related to sources because marine biota (the phytoplankton blooms) grow in late spring and early summer and emit methane sulfonic acid (MSA), which gives rise to nucleation (Beck et al., 2021).
The turbulent fluxes of ultrafine (FUFP), accumulation (FACC), and quasi-coarse (FCRS) particle statistics are listed in Table 3 and consider the snow cover, snow melting, and snow-free periods. The average FUFP was −16.99 (median −8.20 ) over the entire measurement period; specifically, the measurement site behaved, on average, like a deposition area (negative fluxes) for particles in that size range, both with and without snowpack (Table 3). The average value of FACC for the whole period was 0.64 (median −0.15 ), but from snow melting onwards, the fluxes became negative in median values, showing a sink behaviour for the measurement site for this size range of particles. Finally, the mean of FCRS was 0.07 (median 0.03 ) for the whole period. Overall, in median values, quasi-coarse mode fluxes are positive for all periods, even if, on average, these fluxes were very small. However, this net deposition is not a steady feature. In fact, total and size-resolved turbulent fluxes are highly variable both in magnitude and direction (emission and deposition). Turbulent fluxes in the ultrafine mode are negative for 63 % of the quality-assured cases (Fig. 6d), establishing a deposition behaviour in this size range for the measurement site. Similarly, FACC is negative in 52 % of validated cases, while FCRS is negative for 46 % of available good flux cases. The values of FUFP have a positive median (0.59 ) at the beginning of the measurement period when ultrafine particle concentration is small and then turn significantly negative (median −17.3 ) in the summer when concentrations sharply increase (Fig. 6a). If the high summertime concentrations of UFP are due to new-particle-formation processes, then these do not occur near the surface and propagate upward but rather take place in the full mixing layer, topping at ≤ 500 m above the ground (Ferrero et al., 2016), with UFP mixing down and being deposited onto the surface. FACC and FCRS generally have a very similar monthly behaviour (Fig. 6e and f), with a maximum value in the month of April (median 0.50 and 0.09 , respectively) and a minimum in the month of May (median −0.35 and −0.02 , respectively). Although remote Arctic environments are normally considered to be receptors for pollution transported from the mid-latitudes, and the seasonal cycle of atmospheric aerosol concentrations witnesses it, at the surface level, small deposition fluxes can overlap with – and being exceeded by – small emission fluxes of the particles. In Ny-Ålesund, the emission fluxes of natural aerosols can originate from soil erosion (in the summer) and snow resuspension and sublimation; besides, a contribution from the village itself and from shipping (Eckhardt et al., 2013) has been occasionally identified but not quantified from our measurements. Finally, it is unclear whether a residual sea spray emission can lead to detectable emission fluxes of sea salt particles at ∼ 1 km inland from the coast. Our measurements – relying on fast particle counting – do not provide direct insights to the chemical nature, properties, and actual origin of the aerosols associated with either emissions or depositions.
3.4 Particle deposition velocity Vd
Exchange velocity (Vex) calculated from normalization of the turbulent fluxes (Eq. 1) on the number concentration, in general, as seen in the Sect. 3.3, presents both positive and negative values, representing the emission () and deposition events (). Vex calculated for the measurement campaign resulted in median values of 0.34 mm s−1 (IQR10−90 −2.00 to 2.81 mm s−1) for the ultrafine size range, 0.10 mm s−1 (IQR10−90 −2.02 to 1.53 mm s−1) for the accumulation mode, and −1.36 mm s−1 (IQR10−90 −11.25 to 8.48 mm s−1) for the coarse range (Table 4). IQR10−90 represents the interquartile range from the 10th and 90th percentile. Thus, the measurement site acts, on average, as a deposition area for the ultrafine and accumulation particles, while it was a source area for a greater size range (quasi-coarse mode). To explore the behaviour of the deposition events on the measurement site, only the positive values of the deposition velocity will be taken in consideration by studying . The median value for the UFP range was 0.90 mm s−1 (IQR10−90 0.18 to 3.89 mm s−1); in the ACC mode, the median was 0.62 mm s−1 (IQR10−90 0.16 to 2.38 mm s−1), and in the CRS mode, was 4.42 mm s−1 (IQR10−90 1.57 to 13.09 mm s−1). Also, in this case, Vex and analyses were separated into three periods (with or without snow and melting). In particular, increases from the snow surface to the snow-free conditions in all size ranges. It increased from a median value of 0.73 mm s−1 (SC) to 1.14 mm s−1 (SF) for the UFP particles. In the same way, increased from the SC to the SF phase, with a maximum during SM period for the ACC and CRS size ranges (Table 5).
Table 4Statistical parameters for exchange (Vex), deposition (), emission velocity (), and deposition velocity normalized for the friction velocity () calculated on the whole measurement period, separating the UFP, ACC, and CRS particle size ranges.
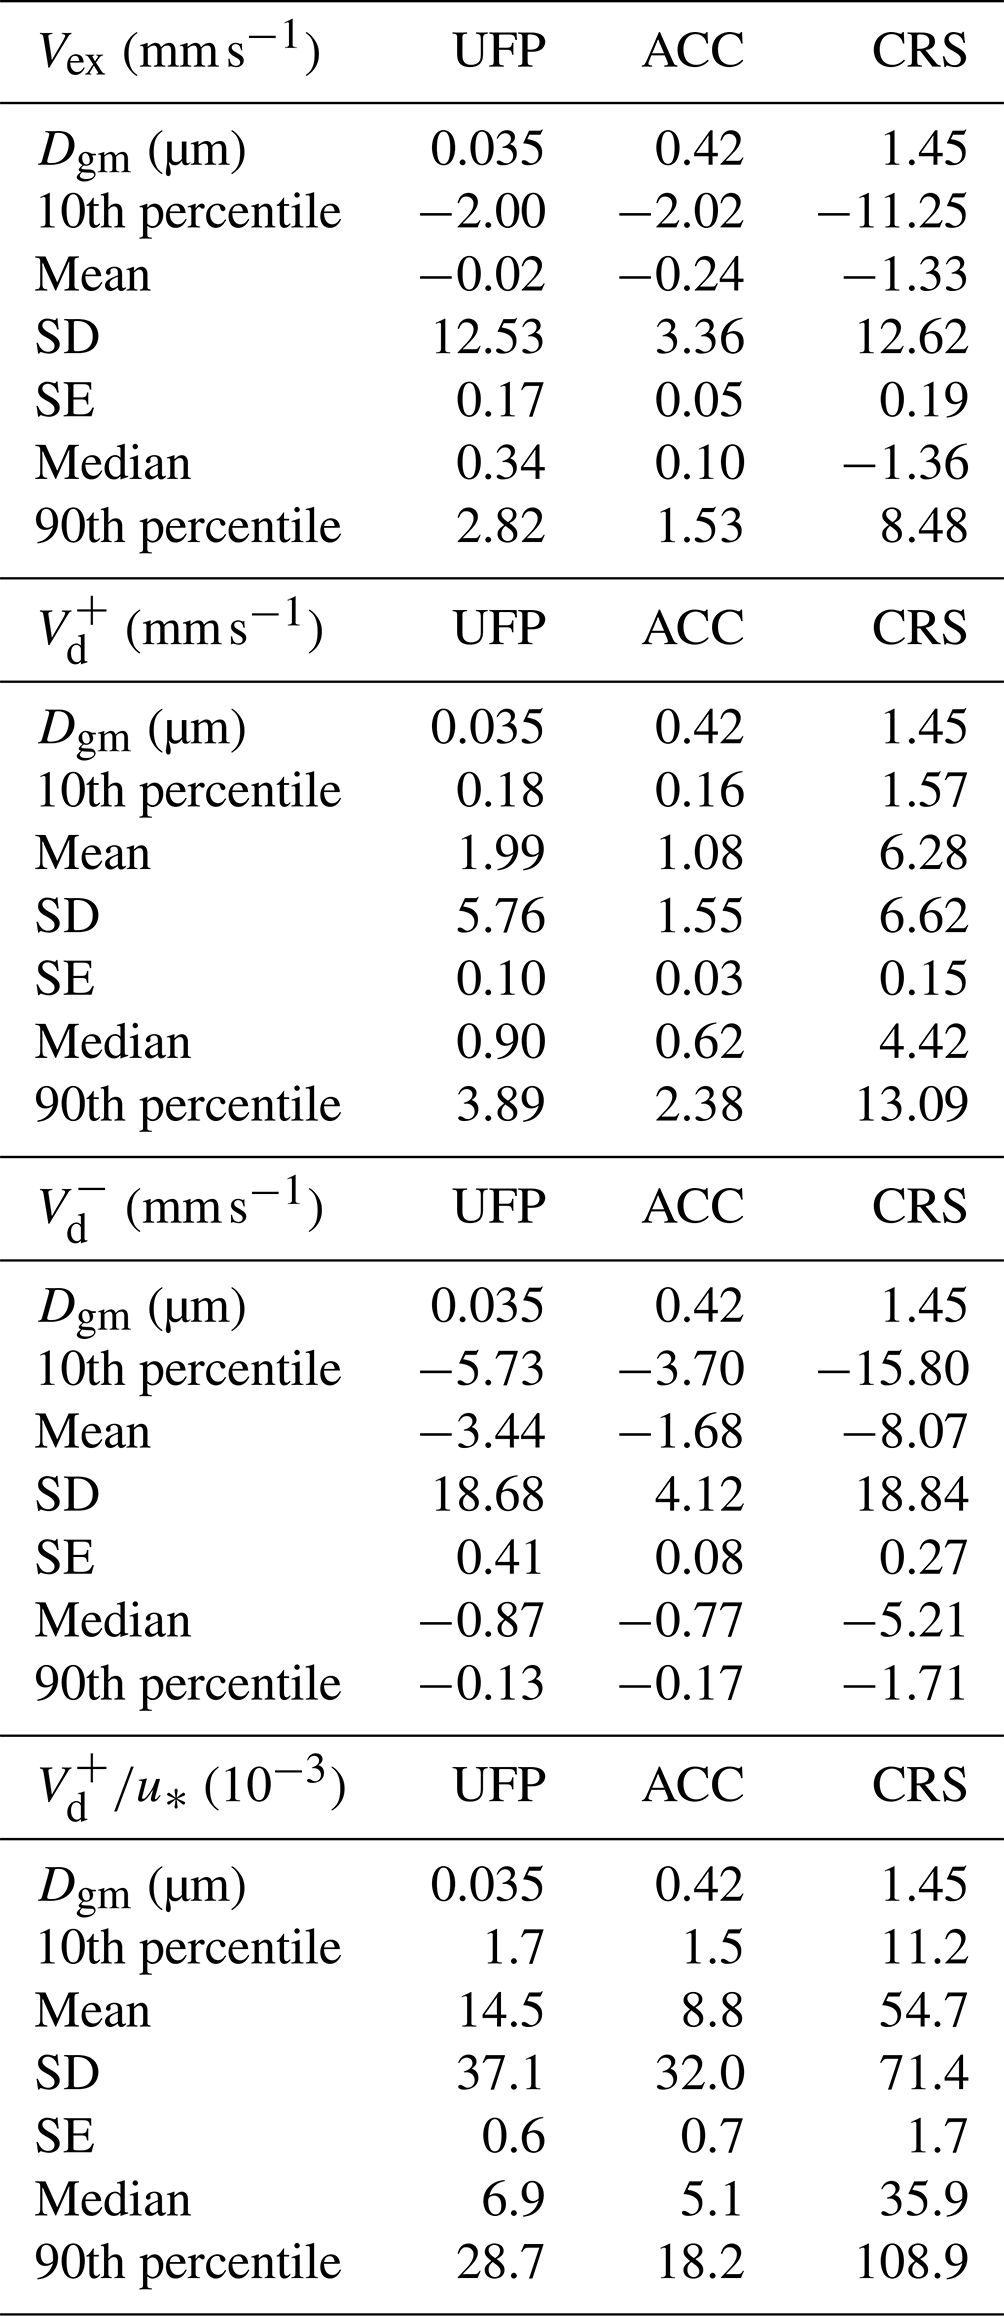
Table 5Statistical parameters for the exchange (Vex), deposition (), and emission velocity () and deposition velocity normalized for the friction velocity () calculated on snow (SC), snow melting (SM), and snow-free (SF) periods, separating the UFP, ACC, and CRS particle size ranges.
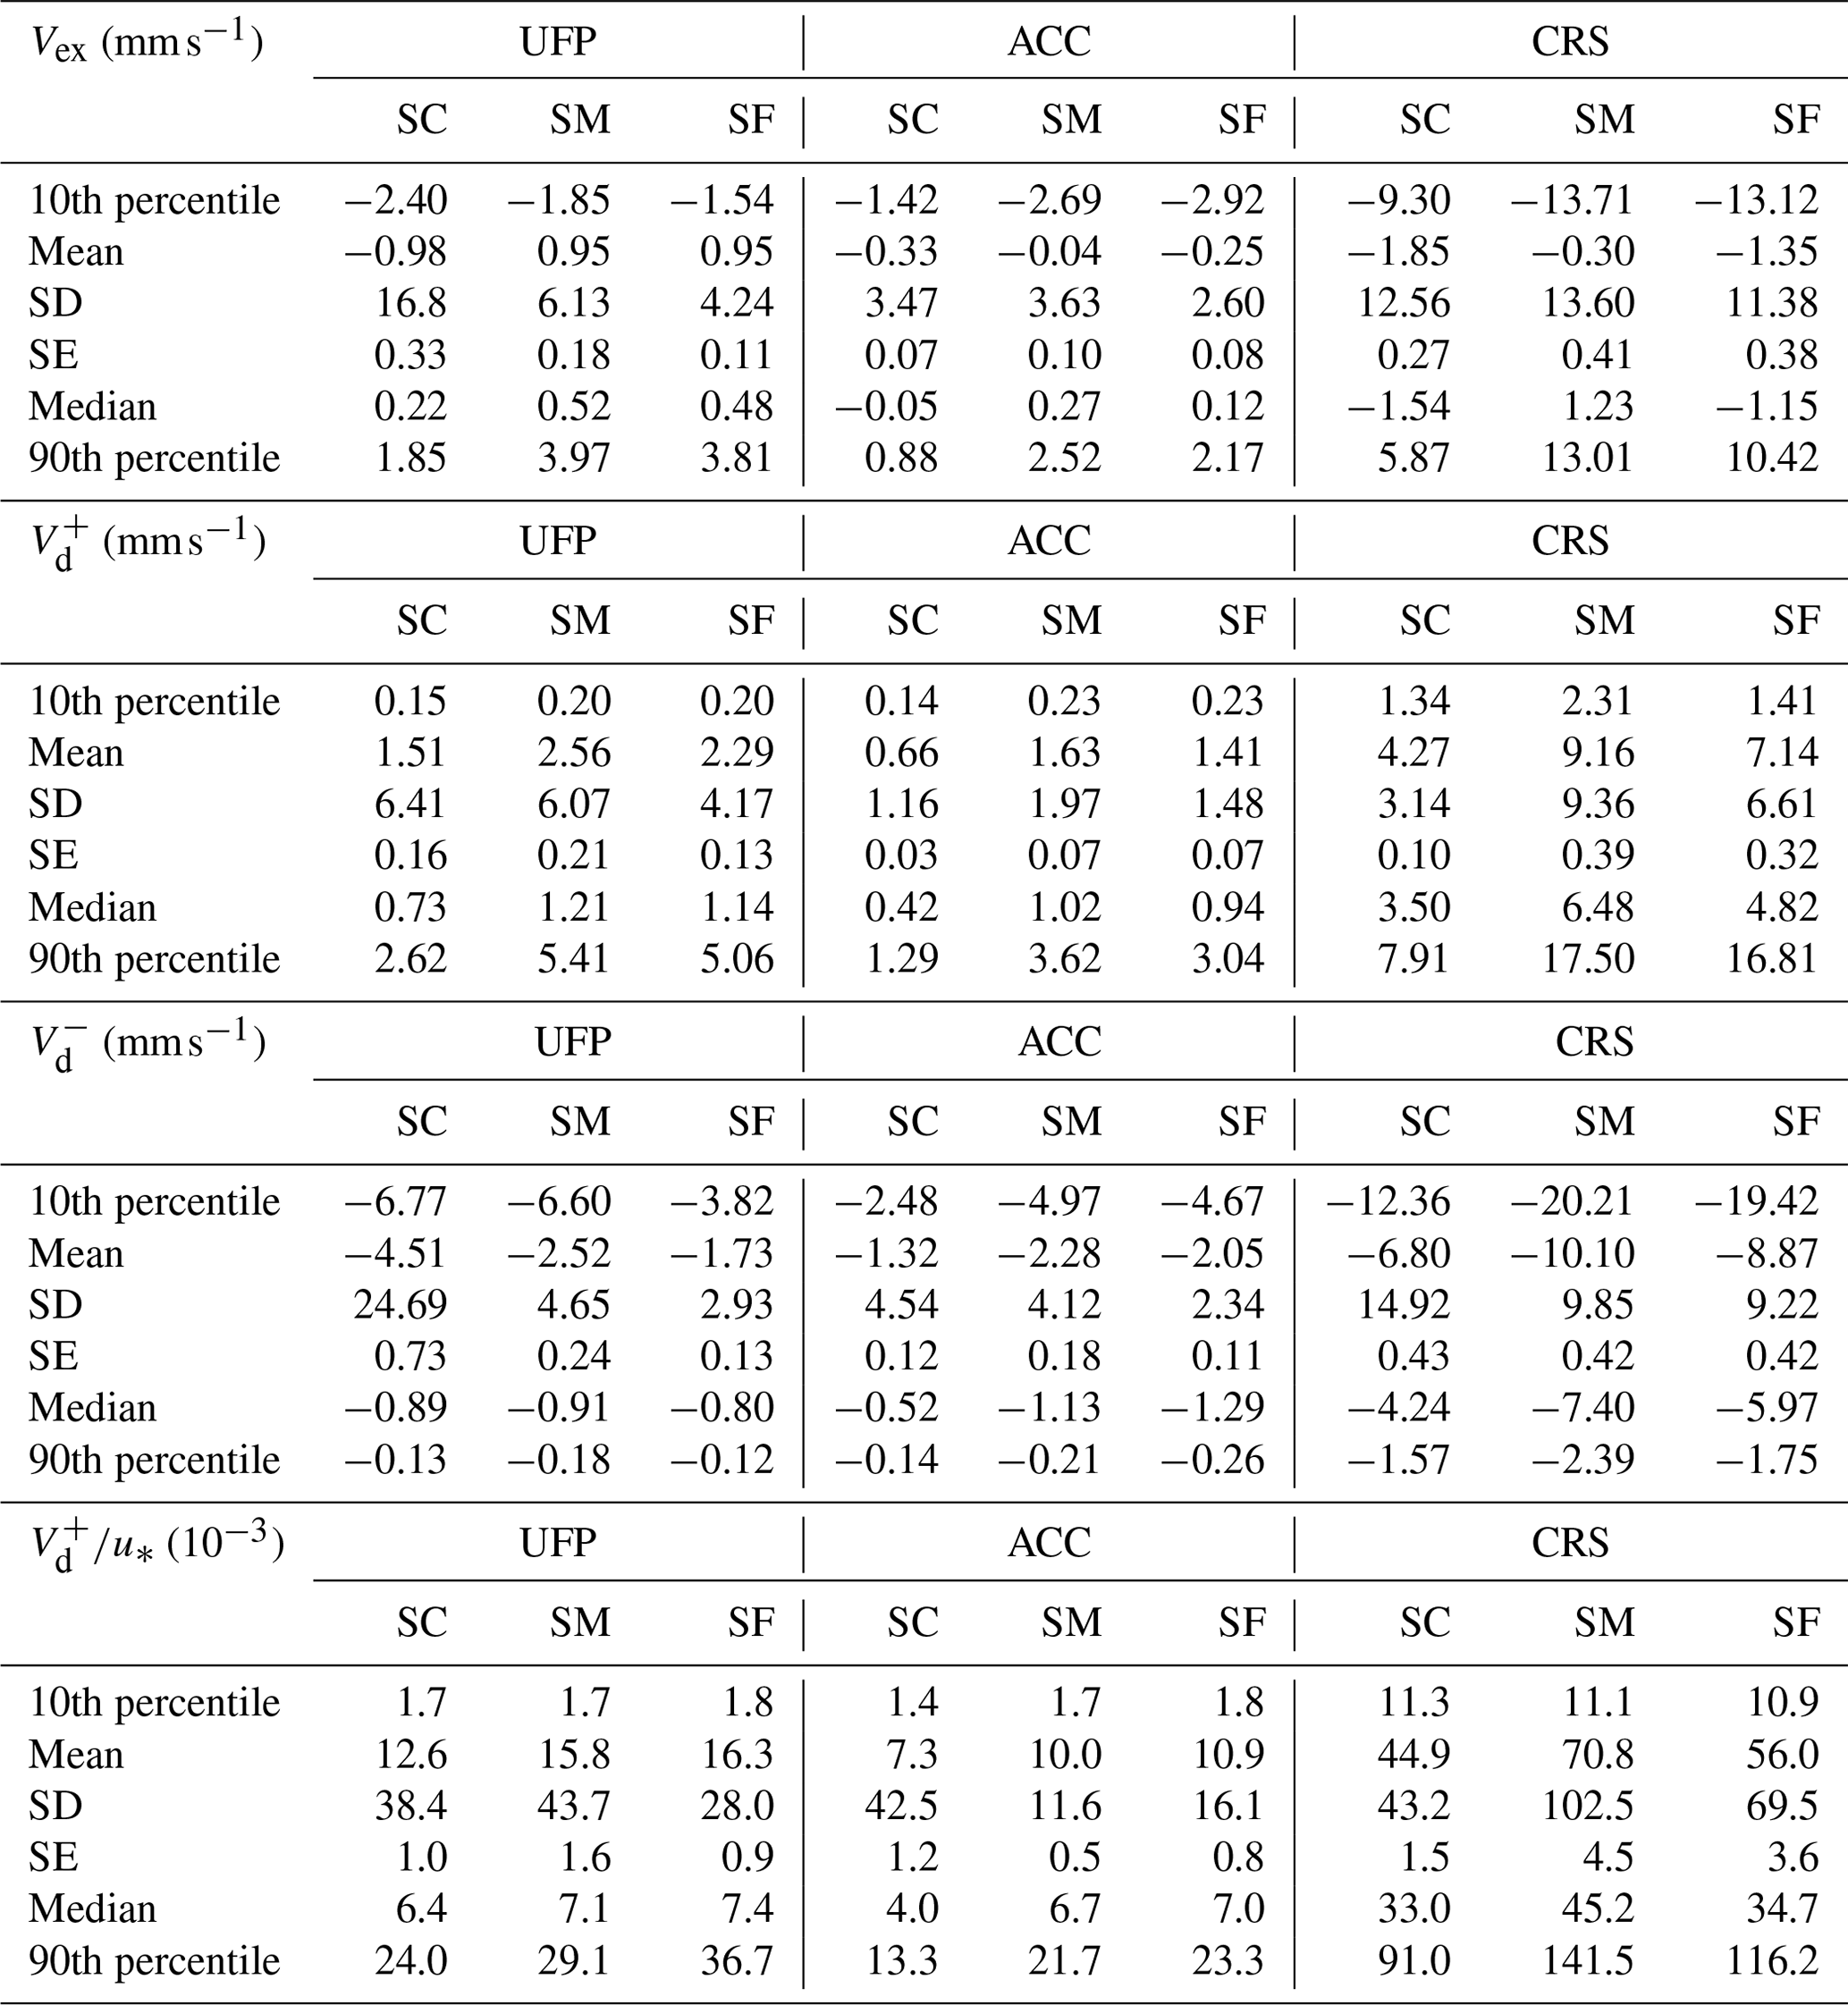
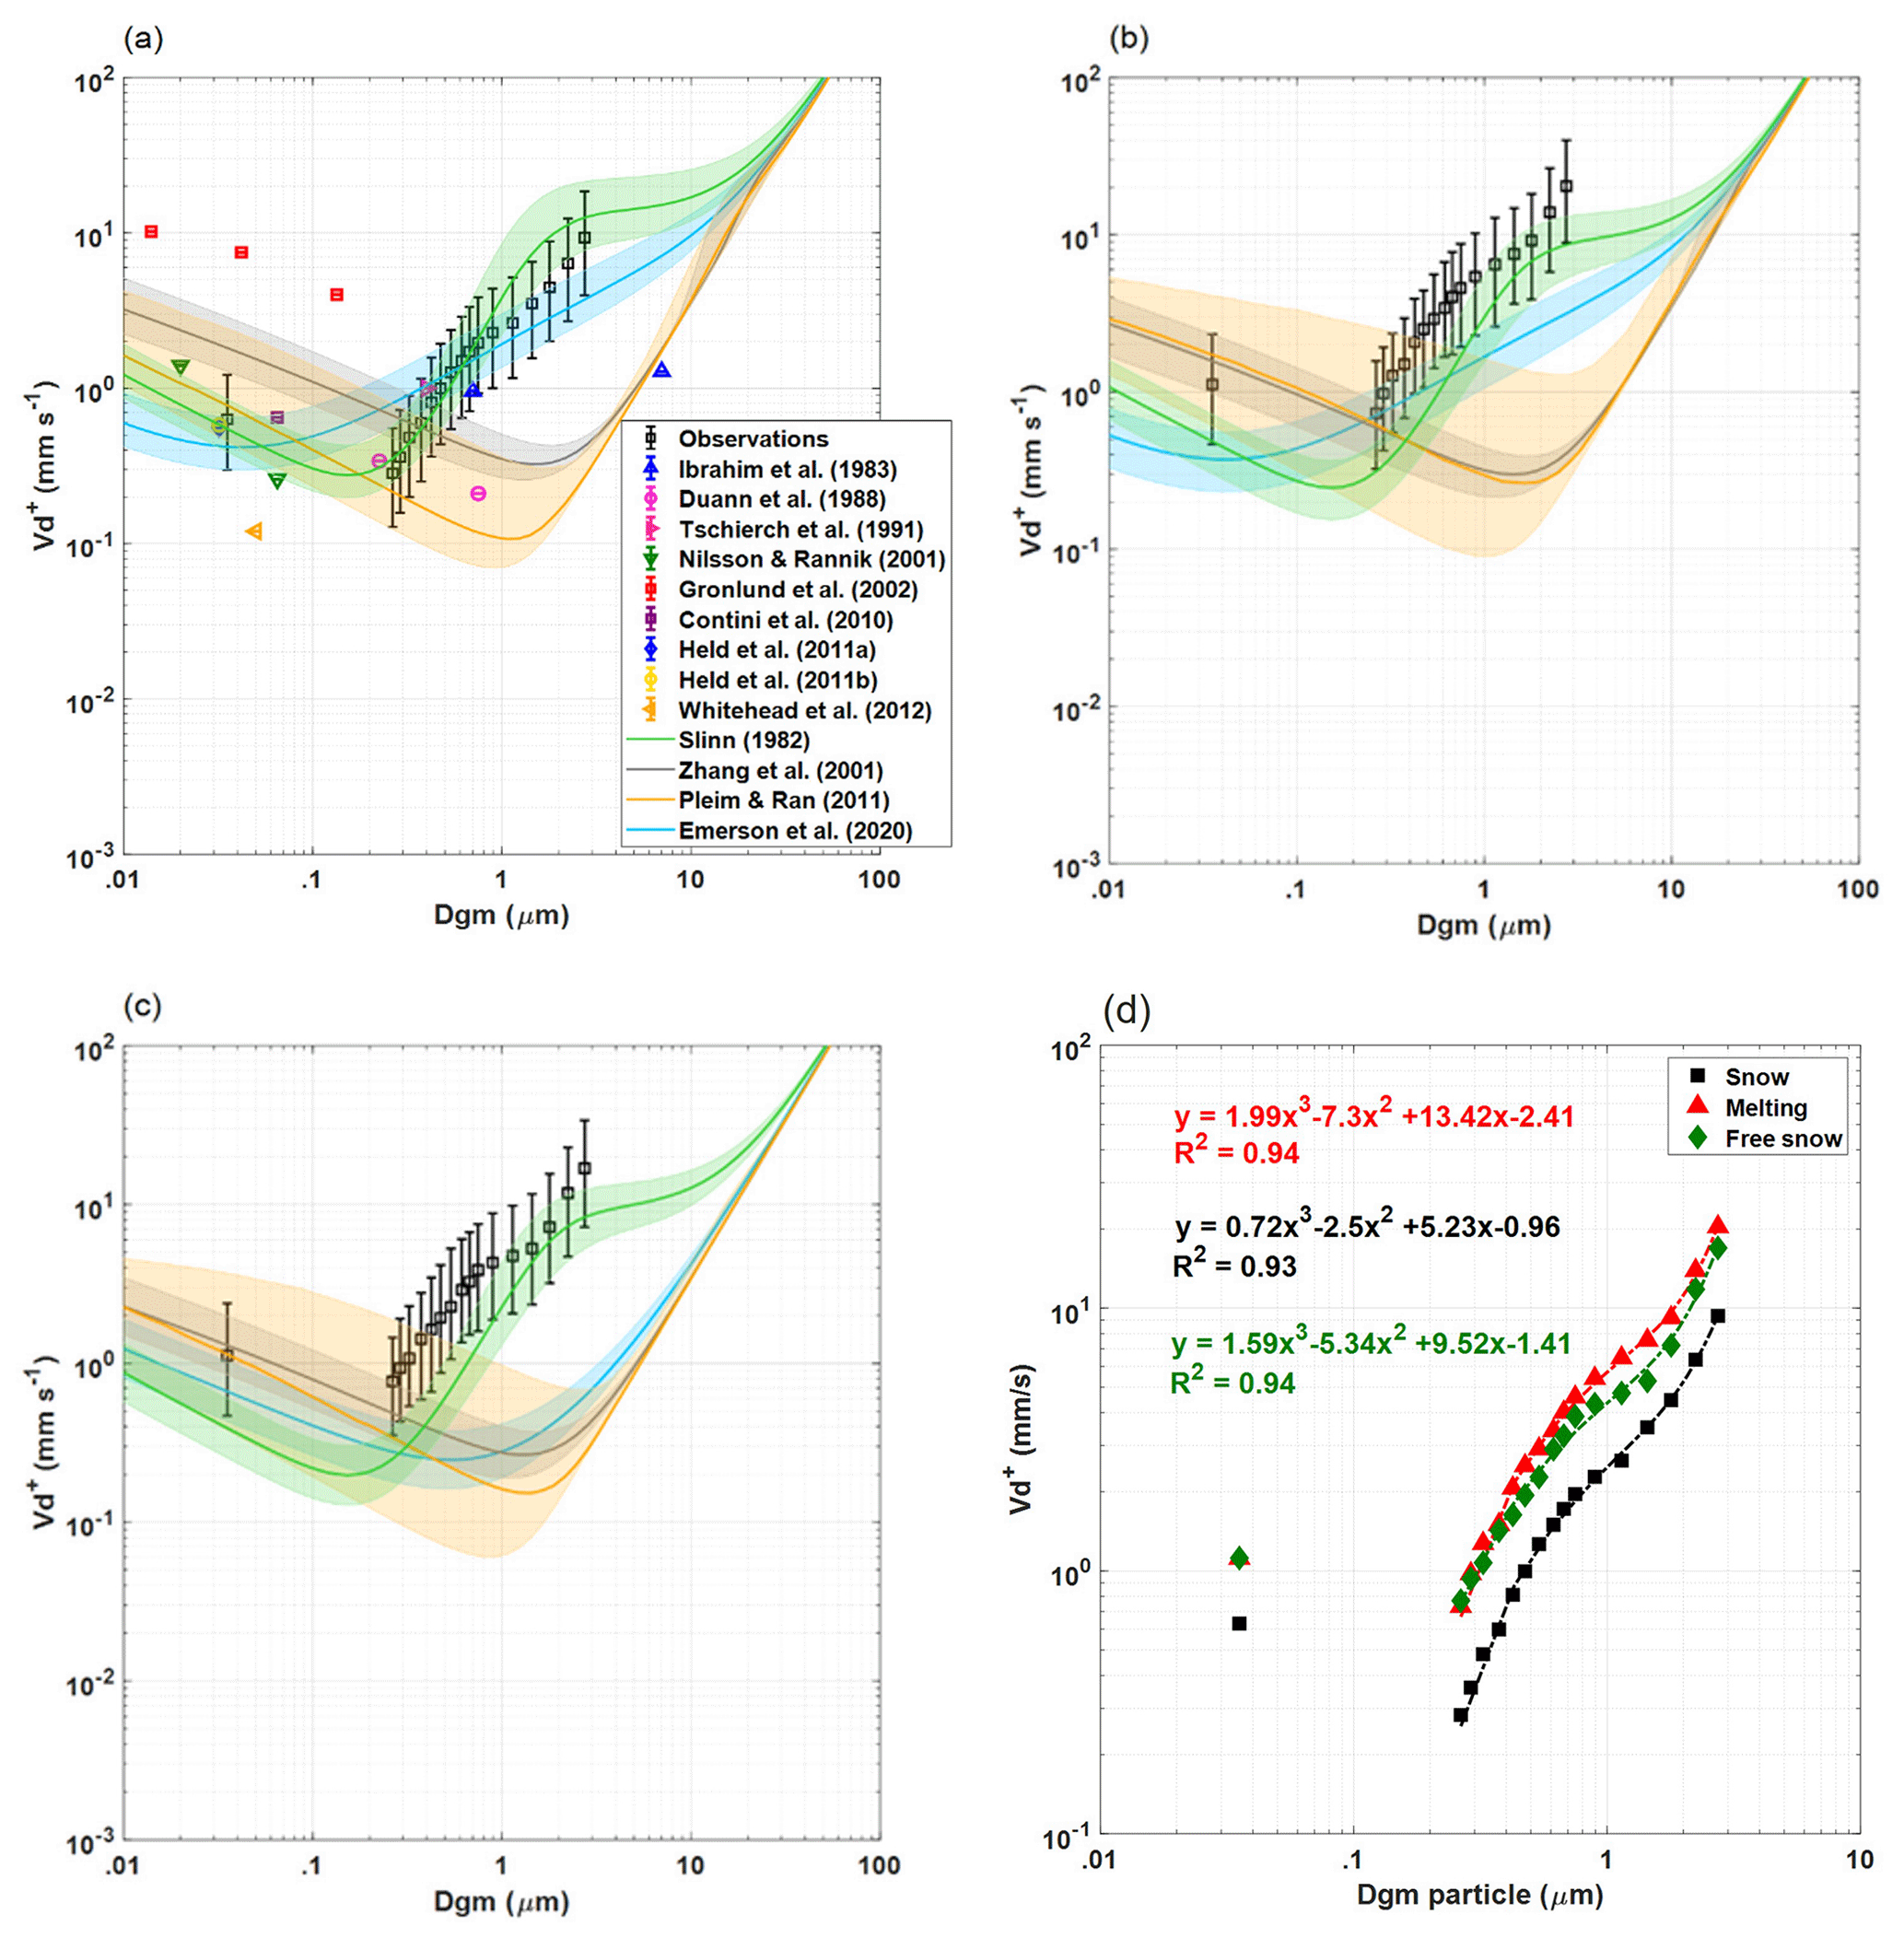
Figure 8Median as a function of the geometric mean diameter measured during (a) snow cover, (b) melting period, and (c) snow-free phases. A comparison with the model predictions is also reported in each panel. Observations are shown in symbols and models in lines. Error bars and shaded areas represent the interquartile range. In panel (a), the median values measured are compared to previous measurements of the deposition velocities over snow. (d) Functional fit for , depending on the geometric mean particle diameter for the different period analysed in this work.
The observed deposition or exchange velocity is in good agreement with previous measurements on snow and ice in the polar regions; however, a comparison with the measured deposition velocities in the literature is a challenge because work on ice and/or snow surfaces is very seldom reported, and often different instruments and methods (such as passive sampling, gradient method, and eddy covariance) are used. Measurements reported by Duann et al. (1988) on snow gave an average = 0.34 ± 0.14 mm s−1 for particles in the size range between 0.15 and 0.5 µm (Fig. 8a). In the High Arctic, Nilsson and Rannik (2001) report a mean deposition velocity = 1.4 mm s−1 over ice in the nucleation mode and = 0.51 mm s−1 in the Aitken mode (with a size distribution peaking at about 60–70 nm).
Gronlund et al. (2002) reported a median of about 3.3 mm s−1 (and an interval between 0.8 and 18.9 mm s−1) over snow for total particles larger than 10 nm. The values reported by this last work are significantly larger than the values observed in the present data set. Held et al. (2011a) observed median values ranging from 0.27 to 0.68 mm s−1 during deposition-dominated periods. In Held et al. (2011b), a deposition velocity on the snow surface in the Arctic pack ice ranged from 0.28 to 0.58 (± 0.4) mm s−1 by eddy covariance. There was a fair agreement with the observations from Contini et al. (2010) at the Nansen Ice Sheet (Antarctica) over ice and/or snow, where median Vex = 0.19 mm s−1 was observed for total particle larger than 10 nm. Furthermore, Contini et al. (2010) observed a median deposition velocity of = 0.65 mm s−1. In the Hudson Bay (Canada) area, Whitehead et al. (2012) measured a mean Vex of 0.12 ± 0.11 mm s−1 on sea ice for particles greater than 2.5 nm. Seasonal differences in the deposition have also been observed in the cryosphere, with greater values during warmer months (Macdonald et al., 2017) when collecting snow samples on average every 4 d at Alert, Nunavut (Arctic Canada). In Ibrahim et al. (1983), a deposition velocity between 0.39 and 0.96 mm s−1 over snow surface was observed for 0.7 µm diameter particles using artificial collectors for the liquid scintillation counting technique. Even if the particle sizes range were not exactly the same, the Vex (1 mm s−1) values reported by Tschiersch et al. (1991) are still comparable with values measured at the closest size range (Fig. 8a). For a more detailed and comprehensive review of the deposition velocities, see Pryor et al. (2008), Whitehead et al. (2012), Saylor et al. (2019), Emerson et al. (2020), and Farmer et al. (2021). From the graphs in Fig. 8, (median values) increases with particle diameter, and is greater in all size bins during the melting phase with respect to the other periods. This could probably be due to the increase in the roughness length z0 as the snow melts (and the consequent shallow pond formation), which leads to an increased capture of the particles (in all size ranges) by the interception and impaction mechanisms. has the lowest results for the snow surface coverage. To put our observations into context, deposition velocity observations from previous studies have been plotted in Fig. 8, alongside four models for dry deposition velocity developed by Slinn (1982; hereafter S82), Zhang et al. (2001; hereafter Z01), Pleim and Ran (2011; hereafter PR11), and Emerson et al. (2020; hereafter E20). Dry deposition models were based on a custom code (DepoBoxTool) translated in MATLAB (version 2018b) from the original form in Python (https://doi.org/10.5281/zenodo.4749548; Shu et al., 2021; Shu, 2021). Figure 8a shows the deposition velocity measured and predicted during the snow period, whereas Fig. 8b and c display the results during the melting and snow-free periods, respectively. Furthermore, it seems that the values observed in this work follow the shape of the S82 model output. As reported by Saylor et al. (2019) for smooth surfaces such as water or snow and/or ice, models provide a minimum deposition rate for particles in the accumulation mode. Data suggest a minimum in the 0.08–0.15 µm range, with a strong increase in above 0.25 µm, rather than the gradual decrease predicted by some of the algorithms (i.e. Z01 and PR11). Our results are in line with the observations of E20, as they revisit the importance of interception processes with respect to Brownian diffusion. Apparently, interception can be a significant term of particle loss, even over ice and/or snow surfaces, whose actual structures and fine irregularities contrast with the idealized smoothness traditionally assumed for this land type.
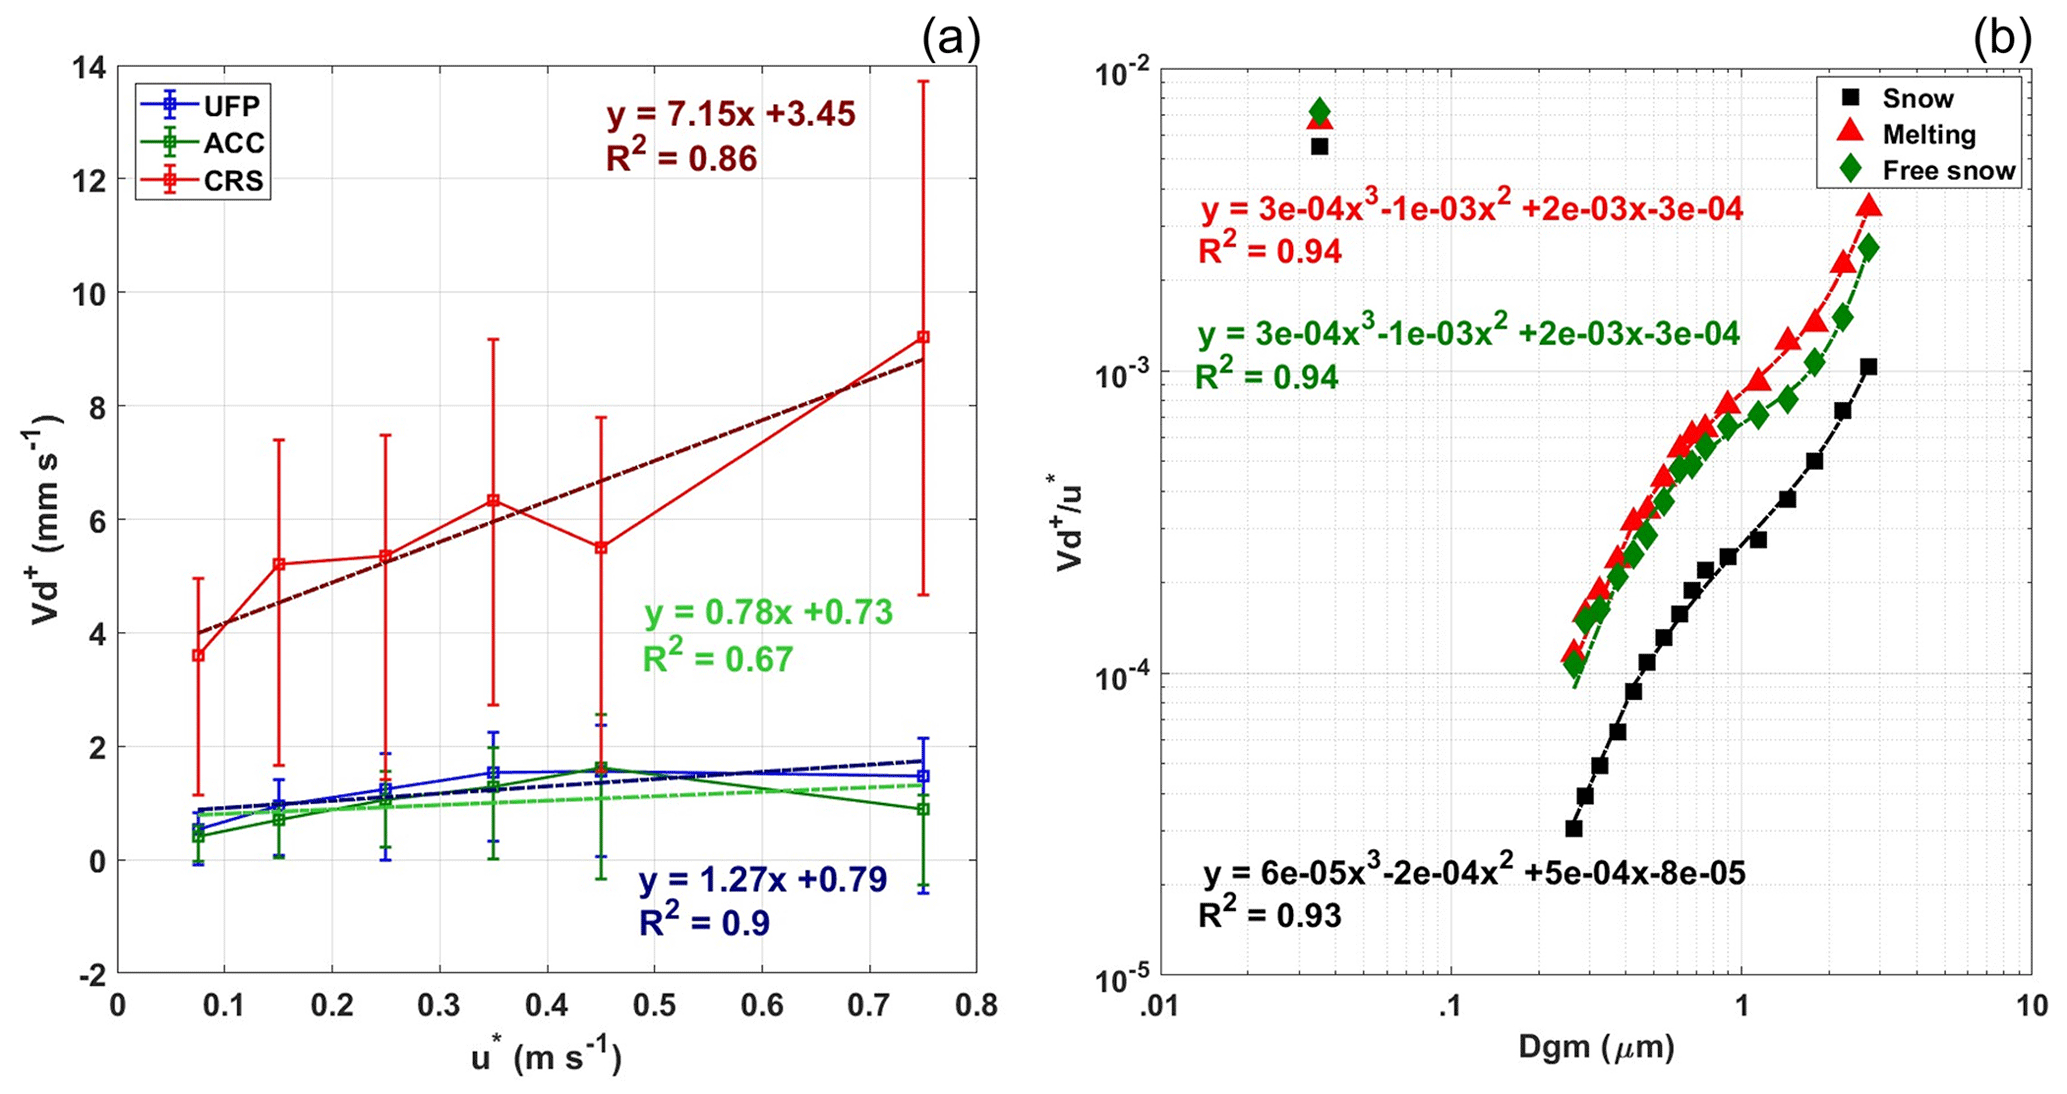
Figure 9(a) Relation between median and friction velocity for the different size ranges. Vertical bars represent the interquartile range of the deposition velocity within the specific interval of u∗. Friction velocity intervals were selected to optimize the number of data points within each interval and, hence, provide a statistically reliable median deposition velocity. (b) Functional fit for Vn as a function of the geometric mean particle diameter (excluding UFP) for the different periods analysed in this work.
The selected deposition velocity models take as input our meteorological and micrometeorological observations (temperature, pressure, relative humidity, L, and u∗), site-specific surface properties (roughness length, canopy height, displacement height, and land use category), and particle properties (density and diameter). Note that most model outputs are highly sensitive to canopy structure parameters and friction velocity. It is worth considering, for example, the high sensitivity of PR11 to the value of the convective velocity scale, which can vary significantly with the surface roughness defined for each land use type (Saylor et al., 2019). On the other hand, Z01 produces the widest differences in the predicted deposition velocities among land use types, showing weak deposition velocities compared to other models, especially in the accumulation and coarse mode. The comparison of predictive models with our observations shows a good agreement, especially with S82, which seems to better fit the data over a broader range of particle diameters and properly predict a minimum in the range 0.1–0.3 µm in addition to the deposition velocities for accumulation and coarse mode. On the contrary, the Z01 and PR11 models show the minimum as being around 1 µm, providing a broad underestimate of the deposition velocity for particles above 0.3 µm. Specifically, during the snow period (Fig. 8a), the considered models predict deposition rates for particles below 0.1 µm well, except for Z01, which overestimates in that range. In contrast, a slight and broad underestimation of above 0.3 µm was observed for the E20, Z01, and PR11 parameterizations. During the melting period (Fig. 8b), a good agreement was observed in the 0.03–0.3 µm size range, although slight underprediction was observed for S82 and E20. For particle diameters above 0.3 µm, a broad underestimation occurs for all parameterizations, except S82, which shows a good agreement, especially in the particle range above 1 µm. Finally, during the snow-free period, an overestimation of the deposition velocity for ultrafine particles was observed in Z01 and PR11, which remained in agreement with measurements up to 0.3 µm particles. Although the S82 and E20 models show an underestimation of for ultrafine particles, a good agreement was observed for accumulation and coarse modes, especially for S82. In view of these results, most analysed parameterizations show an underestimation of the deposition velocity that is greater than an order of magnitude and in the range of 0.2–0.3 µm, except for S82. In general, due to the sensitivity of the models to input parameters, the differences between model outputs and our data should be considered with caution. However, our data clearly show that the minimum deposition velocity is reached at around 0.1 µm particle diameter so that values monotonously increase over the particle size interval from 0.1 to 10 µm, and our data support the parameterizations in the high range of for this particle size interval.
3.5 Particle deposition velocity parameterization
Regarding the trend of the deposition velocity as a function of particle diameter, can be described by a third-order polynomial function of the mean geometric diameter in a typical saddle-shaped graph, with an increase in magnitude toward the lowest and highest side of the size spectrum and a minimum in the Aitken mode. A robust (bi-square) polynomial fit to our observations (excluding UFP) was computed for the three considered periods, with a resulting goodness of fit R2 and a root mean square error (RMSE) as reported in Table 6.
where the p values in Eq. (3) denote the polynomial fitting coefficients.
Table 6Polynomial fit parameters and goodness of fit for each observed curve.
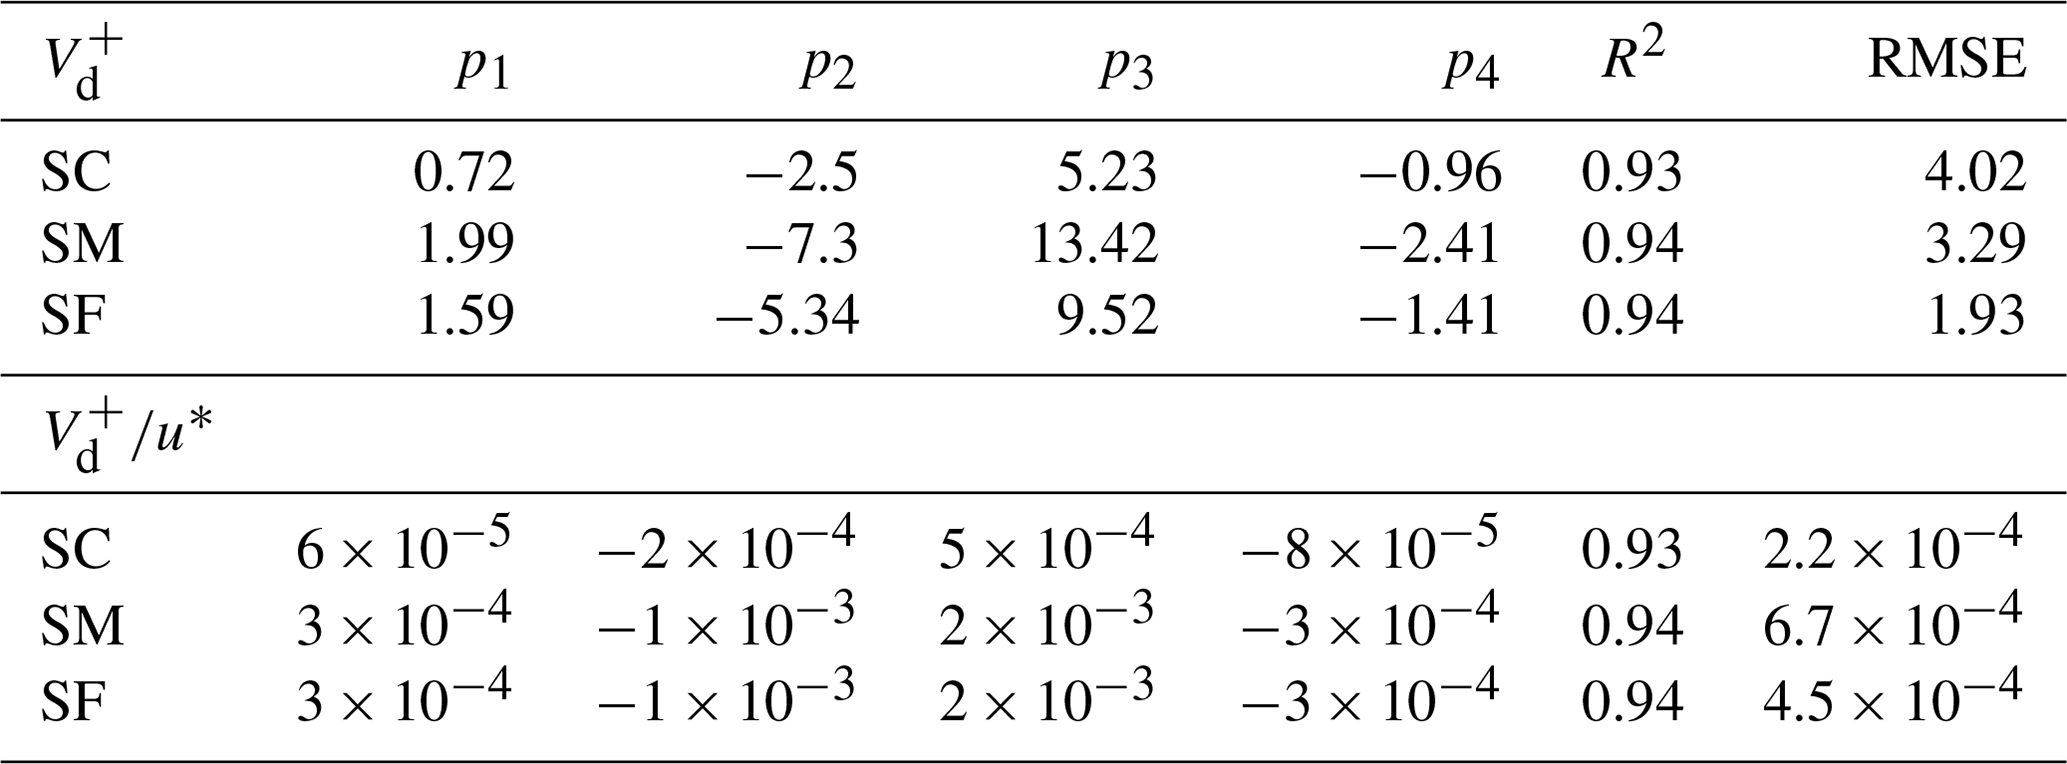
Deposition velocity increased with friction velocity in all size ranges, and several studies (Nilsson and Rannik, 2001; Pryor et al., 2008; Contini et al., 2010) found a positive correlation between and the friction velocity. In particular, for u∗ > 0.1 m s−1, the relation can be described linearly. Our data confirm a linear correlation (see Fig. 9a), but the correlation coefficient varies considerably with particle size, with an angular coefficient m = 1.27 (R2 = 0.9) for UFP, m = 0.78 (R2 = 0.67) for ACC, and, finally, m = 7.15 (R2 = 0.86) for CRS. In this context, a reasonable normalization of the deposition velocity is the ratio to obtain better comparability between different studies (Table 5). An analogous fit for the normalized Vn resulted in a similar goodness of fit and the respective fitting coefficients reported in Table 6, which have been segregated for the presence (or not) of the snowpack.
Aerosol fluxes were measured in the Arctic site of Ny-Ålesund (western Spitzbergen, Svalbard). The measurement campaign was carried out between March and August 2021. Number concentrations for the ultrafine particles increased from March to August, with new-particle-formation processes probably contributing to summertime concentrations, boosted by the enhanced biological emissions in warm months. In contrast, the number concentration for larger-sized particles shows the maximum concentration in March, during the Arctic haze season, and then it decreases to a minimum concentration in June. Turbulent fluxes in the ultrafine particle size range were prevalently downward, especially in summertime when the concentrations are highest. Particle fluxes in the accumulation and quasi-coarse mode were positive (upward) during the colder months, indicating that the site behaves, on average, as a source for particles, even if these fluxes were very small. In the warmer months, particle fluxes were slightly negative, showing that the area under examination acts as a weak sink for particulates in those size ranges. The overall median deposition velocity () values were 0.90, 0.62, and 4.42 mm s−1, for UFP, ACC, and CRS, respectively. A more pronounced deposition was observed, on average, during the melting and snow-free periods over the whole dimensional range, while the median deposition velocity () with the snowpack was of 0.73, 0.42, and 3.50 mm s−1. Our results indicate a low sensitivity of the saddle-shape of the deposition velocity (as a function of the geometric mean diameter) to the surface characteristics, showing a fixed minimum in the range of 0.1–0.2 µm and an increase in deposition velocity for particles > 0.3 µm. The deposition velocity growth is probably due to the increase in the roughness length z0, due to the emerging of obstacles, such as rocks or irregularities and the bare soil, after melting that perturb the flow. The observed deposition velocity depends on the friction velocity; therefore, it is valuable to normalize the deposition velocity with the u∗ to obtain a better comparison between different measurement sites. The median normalized velocity for the whole period (Vn) was 6.9 × 10⁻³, 5.1 × 10⁻³, and 35.9 × 10⁻³ for UFP, ACC, and CRS, respectively. In general, our observations of deposition velocities are aligned to the previous literature in similar environments (i.e. ice and/or snow), especially for particles in the size range 0.01–1 µm, with a percentage difference lower than 50 % in magnitude. The behaviour of Vd as a function of the particle diameter result was well predicted by the Slinn (1982) parameterization. The S82-derived models considered in this work provide different predictions with similar land covers (snow, tundra, and water ponds) and same environmental conditions, as also reported by Saylor et al. (2019). However, large discrepancies between modelled and observed deposition velocities for the accumulation mode were observed for most of the models used (i.e. Z01, PR11, and E20). The predictions of the available parameterizations generally do not agree with the observations, especially on snow and/or ice surfaces, and the discrepancy in the deposition velocity values can be as high as 2 orders of magnitude. The polynomial parameterization proposed in this study fits our observations and the analysed models, which properly represents the size dependence and magnitude of the deposition velocity. Even if this numerical fit is driven purely by the data, and not by the underlying chemical-physical processes, it could be very useful for implementing new parameterizations for existing chemical transport models considering the role of turbulence on dry deposition, which is a process typically neglected in regional and global models. Overall, our findings indicate that the most common parameterizations for dry depositions in polar areas could contribute significantly to the overall uncertainty in global models simulating short-lived climate forcer (SLCF) climate effects (Whaley et al., 2022). The scarce measurements in the cryosphere and the consequent large gap in deposition velocity modelling demonstrate the need to improve the understanding of deposition processes in polar areas.
Data are available upon request to the corresponding author.
The supplement related to this article is available online at: https://doi.org/10.5194/acp-23-7425-2023-supplement.
AD and GP planned the experimental design and guided the research. AD, GP, MM, and FS collaborated with respect to the data collection and post-processing. AD, GP, and DF carried out the analysis presented in this paper and wrote the draft, with contributions from all co-authors. AD, GP, and DF developed the code used to analyse the data. AD and SD managed and provided the funding for the project. All authors reviewed and edited the paper, collaborated with the interpretation of the results, and wrote, read, commented on, and approved the final paper.
The contact author has declared that none of the authors has any competing interests.
Publisher's note: Copernicus Publications remains neutral with regard to jurisdictional claims in published maps and institutional affiliations.
The authors acknowledge Fabio Massimo Grasso (ISAC-CNR) for his help in setting up the instrumental acquisition system before the measurement campaign. The authors acknowledge the Institute of Polar Science (ISP-CNR) and its staff for the logistics at the Dirigibile Italia Arctic Station in Ny-Ålesund. We would like also to acknowledge Nuncio Murukesh, of the Indian Arctic Programme, for the precipitation data and Rita Traversi, of the University of Florence, for the SMPS data used in this work.
This work has been funded and conducted in the framework of the Joint Research Center ENI-CNR–Aldo Pontremoli, within the ENI-CNR Joint Research Agreement, WP1 Impatto delle emissioni in atmosfera sulla criosfera e sul cambiamento climatico nell'Artico. Furthermore, this work has been partially financed by the Svalbard Science Forum for the Arctic Field Grant Aerosol Flux in Arctic (ALFA) project (RiS ID 11390; NFR contract no. 310658).
This paper was edited by Leiming Zhang and reviewed by Delphine Farmer and two anonymous referees.
Abbatt, J. P. D., Leaitch, W. R., Aliabadi, A. A., Bertram, A. K., Blanchet, J.-P., Boivin-Rioux, A., Bozem, H., Burkart, J., Chang, R. Y. W., Charette, J., Chaubey, J. P., Christensen, R. J., Cirisan, A., Collins, D. B., Croft, B., Dionne, J., Evans, G. J., Fletcher, C. G., Galí, M., Ghahreman, R., Girard, E., Gong, W., Gosselin, M., Gourdal, M., Hanna, S. J., Hayashida, H., Herber, A. B., Hesaraki, S., Hoor, P., Huang, L., Hussherr, R., Irish, V. E., Keita, S. A., Kodros, J. K., Köllner, F., Kolonjari, F., Kunkel, D., Ladino, L. A., Law, K., Levasseur, M., Libois, Q., Liggio, J., Lizotte, M., Macdonald, K. M., Mahmood, R., Martin, R. V., Mason, R. H., Miller, L. A., Moravek, A., Mortenson, E., Mungall, E. L., Murphy, J. G., Namazi, M., Norman, A.-L., O'Neill, N. T., Pierce, J. R., Russell, L. M., Schneider, J., Schulz, H., Sharma, S., Si, M., Staebler, R. M., Steiner, N. S., Thomas, J. L., von Salzen, K., Wentzell, J. J. B., Willis, M. D., Wentworth, G. R., Xu, J.-W., and Yakobi-Hancock, J. D.: Overview paper: New insights into aerosol and climate in the Arctic, Atmos. Chem. Phys., 19, 2527–2560, https://doi.org/10.5194/acp-19-2527-2019, 2019.
AMAP: Arctic Monitoring and Assessment Programme, Assessment 2015: Black carbon and ozone as Arctic climate forcers, Technical Report, AMAP, Oslo, Norway, 116 pp., http://www.amap.no (last access: 29 June 2023), 2015a.
AMAP: Arctic Monitoring and Assessment Programme, Assessment 2015: Methane as an Arctic climate forcer, Technical Report, AMAP, Oslo, Norway, 139 pp., http://www.amap.no (last access: 29 June 2023), 2015b.
Arnold, S. R., Law, K. S., Brock, C. A., Thomas, J. L., Starkweather, S. M., von Salzen, K., Stohl, A., Sharma, S., Lund, M. T., Flanner, M. G., Petäjä, T., Tanimoto, H., Gamble, J., Dibb, J. E., Melamed, M., Johnson, N., Fidel, M., Tynkkynen, V. -P., Baklanov, A., Eckhardt, S., Monks, S. A., Browse, J., and Bozem, H.: Arctic air pollution: Challenges and opportunities for the next decade, Elementa: Science of the Anthropocene, 4, 000104, https://doi.org/10.12952/journal.elementa.000104, 2016.
Aubinet, M., Vesala, T., Papale, D.: Eddy Covariance. A Practical Guide to Measurement and Data Analysis, Springer Atmospheric Sciences, https://doi.org/10.1007/978-94-007-2351-1, 2012.
Battaglia, A., Rustemeier, E., Tokay, A., Blahak, U., and Simmer, C.: PARSIVEL snow observations: A critical assessment, J. Atmos. Ocean. Tech., 27, 333–344, https://doi.org/10.1175/2009jtecha1332.1, 2010.
Beck, L. J., Sarnela, N., Junninen, H., Hoppe, C. J. M., Garmash, O., Bianchi, F., Riva, M., Rose, C., Peräkylä, O., Wimmer, D., Kausiala, O., Jokinen, T., Ahonen, L., Mikkilä, J., Hakala, J., He, X., Kontkanen, J., Wolf, K. K. E., Cappelletti, D., Mazzola, M., Traversi, R., Petroselli, C., Viola, A. P., Vitale, V., Lange, R., Massling, A., Nøjgaard, J. K., Krejci, R., Karlsson, L., Zieger, P., Jang, S., Lee, K., Vakkari, V., Lampilahti, J., Thakur, R. C., Leino, K., Kangasluoma, J., Duplissy, E., Siivola, E., Marbouti, M., Tham, Y. J., Saiz-Lopez, A., Petäjä, T., Ehn, M., Worsnop, D. R., Skov, H., Kulmala, M., Kerminen, V. M., and Sipilä, M.: Differing mechanisms of new particle formation at two Arctic sites, Geophys. Res. Lett., 48, e2020GL091334, https://doi.org/10.1029/2020GL091334, 2021.
Browse, J., Carslaw, K. S., Arnold, S. R., Pringle, K., and Boucher, O.: The scavenging processes controlling the seasonal cycle in Arctic sulphate and black carbon aerosol, Atmos. Chem. Phys., 12, 6775–6798, https://doi.org/10.5194/acp-12-6775-2012, 2012.
Bulatovic, I., Igel, A. L., Leck, C., Heintzenberg, J., Riipinen, I., and Ekman, A. M. L.: The importance of Aitken mode aerosol particles for cloud sustenance in the summertime high Arctic – a simulation study supported by observational data, Atmos. Chem. Phys., 21, 3871–3897, https://doi.org/10.5194/acp-21-3871-2021, 2021.
Burba, G.: Eddy Covariance Method for Scientific, Regulatory, and Commercial Applications, LI-COR Biosciences, Lincoln, USA, 702 pp., ISBN 978-0-578-97714-0, 2022.
Cava, D., Donateo, A., and Contini, D.: Combined stationarity index for the estimation of turbulent fluxes of scalars and particles in the atmospheric surface layer, Agr. Forest Meteorol., 194, 88–103, https://doi.org/10.1016/j.agrformet.2014.03.021, 2014.
Conte, M., Donateo, A., and Contini, D.: Characterisation of particle size distributions and corresponding size-segregated turbulent fluxes simultaneously with CO2 exchange in an urban area, Sci. Total Environ., 1067–1078, 622–623, https://doi.org/10.1016/j.scitotenv.2017.12.040, 2018.
Contini, D., Donateo, A., Belosi, F., Grasso, F. M., Santachiara, G., and Prodi F.: Deposition velocity of ultrafine particles measured with the Eddy-Correlation Method over the Nansen Ice Sheet (Antarctica), J. Geophys. Res., 115, D16202, https://doi.org/10.1029/2009JD013600, 2010.
Cowtan, K. and Way, R. G.: Coverage bias in the HadCRUT4 temperature series and its impact on recent temperature trends, Q. J. Roy. Meteor. Soc., 140, 1935–1944, https://doi.org/10.1002/qj.2297, 2014.
Croft, B., Martin, R. V., Leaitch, W. R., Tunved, P., Breider, T. J., D'Andrea, S. D., and Pierce, J. R.: Processes controlling the annual cycle of Arctic aerosol number and size distributions, Atmos. Chem. Phys., 16, 3665–3682, https://doi.org/10.5194/acp-16-3665-2016, 2016.
Deventer, M. J., Held, A., El-Madany, T. S., and Klemm, O.: Size-resolved eddy covariance fluxes of nucleation to accumulation mode aerosol particles over a coniferous forest, Agr. Forest Meteorol., 214–215, 328–340, https://doi.org/10.1016/j.agrformet.2015.08.261, 2015.
Di Mauro, B.: A darker cryosphere in a warming world, Nat. Clim. Change, 10, 978–982, 2020.
Donateo, A. and Contini, D.: Correlation of dry deposition velocity and friction velocity over different surfaces for PM2.5 and particle number concentrations, Adv. Meteorol., 2014, 760393, https://doi.org/10.1155/2014/760393, 2014.
Donateo, A., Conte, M., Grasso, F. M., and Contini, D.: Seasonal and diurnal behaviour of size segregated particles fluxes in a suburban area, Atmos. Environ., 219, 117, https://doi.org/10.1016/j.atmosenv.2019.117052,052, 2019.
Duann, B., Fairall, W., and Thomson, D. W.: Eddy correlation measurements of the dry deposition of particles in wintertime, J. Appl. Meteorol., 27, 642–652, 1988.
Eckhardt, S., Hermansen, O., Grythe, H., Fiebig, M., Stebel, K., Cassiani, M., Baecklund, A., and Stohl, A.: The influence of cruise ship emissions on air pollution in Svalbard – a harbinger of a more polluted Arctic?, Atmos. Chem. Phys., 13, 8401–8409, https://doi.org/10.5194/acp-13-8401-2013, 2013.
Eckhardt, S., Quennehen, B., Olivié, D. J. L., Berntsen, T. K., Cherian, R., Christensen, J. H., Collins, W., Crepinsek, S., Daskalakis, N., Flanner, M., Herber, A., Heyes, C., Hodnebrog, Ø., Huang, L., Kanakidou, M., Klimont, Z., Langner, J., Law, K. S., Lund, M. T., Mahmood, R., Massling, A., Myriokefalitakis, S., Nielsen, I. E., Nøjgaard, J. K., Quaas, J., Quinn, P. K., Raut, J.-C., Rumbold, S. T., Schulz, M., Sharma, S., Skeie, R. B., Skov, H., Uttal, T., von Salzen, K., and Stohl, A.: Current model capabilities for simulating black carbon and sulfate concentrations in the Arctic atmosphere: a multi-model evaluation using a comprehensive measurement data set, Atmos. Chem. Phys., 15, 9413–9433, https://doi.org/10.5194/acp-15-9413-2015, 2015.
Emerson, E. W., Hodshire, A. L., De Bolt, H. M., Bilsback, K. R., Pierce, J. R., McMeeking, G. R., and Farmer, D. K.: Revisiting particle dry deposition and its role in radiative effect estimates, P. Natl. Acad. Sci. USA, 117, 26076–26082, 2020.
Fairall, C.: Interpretation of eddy-correlation measurements of particulate deposition and aerosol flux, Atmos. Environ., 18, 1329–1337, https://doi.org/10.1016/0004-6981(84)90041-6, 1984.
Falocchi, M., Giovannini, L., de Franceschi, M., and Zardi, D.: A refinement of the McMillen (1988) recursive digital filter for the analysis of atmospheric turbulence, Bound.-Lay. Meteorol., 168, 523, https://doi.org/10.1007/s10546-018-0355-5, 2018.
Farmer, D. K., Boedicker, E. K., and DeBolt, H. M.: Dry Deposition of Atmospheric Aerosols: Approaches, Observations, and Mechanisms, Annu. Rev. Phys. Chem., 72, 16.1–16.23, 2021.
Ferrero, L., Cappelletti, D., Busetto, M., Mazzola, M., Lupi, A., Lanconelli, C., Becagli, S., Traversi, R., Caiazzo, L., Giardi, F., Moroni, B., Crocchianti, S., Fierz, M., Močnik, G., Sangiorgi, G., Perrone, M. G., Maturilli, M., Vitale, V., Udisti, R., and Bolzacchini, E.: Vertical profiles of aerosol and black carbon in the Arctic: a seasonal phenomenology along 2 years (2011–2012) of field campaigns, Atmos. Chem. Phys., 16, 12601–12629, https://doi.org/10.5194/acp-16-12601-2016, 2016.
Ferrero, L., Ritter, C., Cappelletti, D., Moroni, B., Močnik, G., Mazzola, M., Lupi, A., Becagli, S., Traversi, R., Cataldi, M., Neuber, R., Vitale, V., and Bolzacchini, E.: Aerosol optical properties in the Arctic: The role of aerosol chemistry and dust composition in a closure experiment between Lidar and tethered balloon vertical profiles, Sci. Total Environ., 686, 452–467, 2019.
Giardi, F., Becagli, S., Traversi, R., Frosini, D., Severi, M., Caiazzo, L., Ancillotti, C., Cappelletti, D., Moroni, B., Grotti, M., Bazzano, A., Lupi, A., Mazzola, M., Vitale, V., Abollino, O., Ferrero, L., Bolzacchini, E., Viola, A., and Udisti, R.: Size distribution and ion composition of aerosol collected at Ny-Ålesund in the spring–summer field campaign 2013, Rend. Fis. Acc. Lincei, 27, 47–58, https://doi.org/10.1007/s12210-016-0529-3, 2016.
Giorgi, F.: A particle dry-deposition parameterization scheme for use in tracer transport models, J. Geophys. Res., 91, 9794–9806, 1986.
Grachev, A. A. and Fairall, C. W.: Upward momentum transfer in the marine boundary layer, J. Phys. Oceanogr., 31, 1698–1711, 2001.
Gronlund, A., Nilsson, D., Koponen, I. K., Virkkula, A., and Hansson, M. E.: Aerosol dry deposition measured with eddy-covariance technique at Wasa and Aboa, Dronning Maud Land, Antarctica, Ann. Glaciol., 35, 355–361, 2002.
Hartmann, D. L., Tank, A. M. K., Rusticucci, M., Alexander, L. V., Brönnimann, S., Charabi, Y. A. R., Dentener, F. J., Dlugokencky, E. J., Easterling, D. R., Kaplan, A., Soden, B. J., Thorne, P. W., Wild, M., and Zhai, P.: Observations: Atmosphere and surface, in: Climate change 2013: The physical science basis. Contribution of Working Group I to the Fifth Assessment Report of the Intergovernmental Panel on Climate Change, edited by: Stocker, T. F., Qin, D., Plattner, G.- K., Tignor, M., Allen, S. K., Boschung, J., Nauels, A., Xia, Y., Bex, V., and Midgley, P. M., Cambridge University Press, 159–254, ISBN 978-1-107-05799-1, 2013.
Held, A., Brooks, I. M., Leck, C., and Tjernström, M.: On the potential contribution of open lead particle emissions to the central Arctic aerosol concentration, Atmos. Chem. Phys., 11, 3093–3105, https://doi.org/10.5194/acp-11-3093-2011, 2011a.
Held, A., Orsini, D. A., Vaattovaara, P., Tjernström, M., and Leck, C.: Near-surface profiles of aerosol number concentration and temperature over the Arctic Ocean, Atmos. Meas. Tech., 4, 1603–1616, https://doi.org/10.5194/amt-4-1603-2011, 2011b.
Hinds, W. C.: Aerosol Technology, Properties, Behaviour, and Measurement of Airborne Particles, in: 2nd Edn., John Wiley and Sons, New York, ISBN 1118591569, 2012.
Horst, T. W.: A simple formula for attenuation of eddy fluxes measured with first order-response scalar sensor, Bound.-Lay. Meteorol., 82, 219–233, https://doi.org/10.1023/A:1000229130034, 1997.
Ibrahim, M., Barrie, L. A., and Fanaki, F. H.: An experimental and theoretical investigation of the dry deposition of particles to snow, pine trees and artificial collectors, Atmos. Environ., 17, 781–788, 1983.
IPCC: Climate Change 2021: The Physical Science Basis. Contribution of Working Group I to the Sixth Assessment Report of the Intergovernmental Panel on Climate Change, edited by: Masson-Delmotte, V., Zhai, P., Pirani, A., Connors, S. L., Péan, C., Berger, S., Caud, N., Chen, Y., Goldfarb, L., Gomis, M. I., Huang, M., Leitzell, K., Lonnoy, E., Matthews, J. B. R., Maycock, T. K., Waterfield, T., Yelekçi, O., Yu, R., and Zhou, B., Cambridge University Press, ISBN 978-1-107-05799-1, 2021.
Johnson, J. S., Regayre, L. A., Yoshioka, M., Pringle, K. J., Lee, L. A., Sexton, D. M. H., Rostron, J. W., Booth, B. B. B., and Carslaw, K. S.: The importance of comprehensive parameter sampling and multiple observations for robust constraint of aerosol radiative forcing, Atmos. Chem. Phys., 18, 13031–13053, https://doi.org/10.5194/acp-18-13031-2018, 2018.
Kaimal, J. C. and Finnigan, J. J.: Atmospheric Boundary Layer flows, in: 2nd Edn., Oxford University Press, New York, Oxford, ISBN 0-19-506239-6, 1994.
Khan, T. R. and Perlinger, J. A.: Evaluation of five dry particle deposition parameterizations for incorporation into atmospheric transport models, Geosci. Model Dev., 10, 3861–3888, https://doi.org/10.5194/gmd-10-3861-2017, 2017.
Kljun, N., Calanca, P., Rotach, M. W., and Schmid, H. P.: A simple two-dimensional parameterisation for Flux Footprint Prediction (FFP), Geosci. Model Dev., 8, 3695–3713, https://doi.org/10.5194/gmd-8-3695-2015, 2015.
Köllner, F., Schneider, J., Willis, M. D., Schulz, H., Kunkel, D., Bozem, H., Hoor, P., Klimach, T., Helleis, F., Burkart, J., Leaitch, W. R., Aliabadi, A. A., Abbatt, J. P. D., Herber, A. B., and Borrmann, S.: Chemical composition and source attribution of sub-micrometre aerosol particles in the summertime Arctic lower troposphere, Atmos. Chem. Phys., 21, 6509–6539, https://doi.org/10.5194/acp-21-6509-2021, 2021.
Kolmogorov, A. N.: The local structure of turbulence in incompressible viscous fluid for very large Reynolds number, Dokl. Akad. Nauk.+, 30, 9–13, 1941.
Kral, S. T., Sjöblom, A., and Nygård, T.: Observations of summer turbulent surface fluxes in a High Arctic fjord, Q. J. Roy. Meteor. Soc., 140, 666–675, https://doi.org/10.1002/qj.2167, 2014.
Kulkarni, P., Baron, P. A., and Willeke, K.: Aerosol Measurement: Principles, Techniques, and Applications, 3rd ed., John Wiley and Sons, New York, https://doi.org/10.1002/9781118001684, 2011.
Kupc, A., Bischof, O., Tritscher, T., Beeston, M., Krinke, T., and Wagner, P. E.: Laboratory characterization of a new nano-water-based CPC 3788 and performance comparison to an ultrafine butanol-based CPC 3776, Aerosol Sci. Technol., 47, 183–191, https://doi.org/10.1080/02786826.2012.738317, 2013.
Langford, B., Acton, W., Ammann, C., Valach, A., and Nemitz, E.: Eddy-covariance data with low signal-to-noise ratio: time-lag determination, uncertainties and limit of detection, Atmos. Meas. Tech., 8, 4197–4213, https://doi.org/10.5194/amt-8-4197-2015, 2015.
Lavi, A., Farmer, D. K., Segre, E., Moise, T., Rotenberg, E., Jimenez, J. L., and Rudich, Y.: Fluxes of fine particles over a semi-arid pine forest: possible effects of a complex terrain, Aerosol Sci. Technol., 47, 906–915, https://doi.org/10.1080/02786826.2013.800940, 2013.
Law, K. S., Stohl, A., Quinn, P. K., Brock, C. A., Burkhart, J. F., Paris, J.-D., Ancellet, G., Singh, H. B., Roiger, A., Schlager, H., Dibb, J., Jacob, D. J., Arnold, S. R., Pelon, J., and Thomas, J. L.: Arctic air pollution: New insights from POLARCAT-IPY, B. Am. Meteorol. Soc., 95, 1873–1895, https://doi.org/10.1175/bams-d-13-00017.1, 2014.
Lee, L. A., Pringle, K. J., Reddington, C. L., Mann, G. W., Stier, P., Spracklen, D. V., Pierce, J. R., and Carslaw, K. S.: The magnitude and causes of uncertainty in global model simulations of cloud condensation nuclei, Atmos. Chem. Phys., 13, 8879–8914, https://doi.org/10.5194/acp-13-8879-2013, 2013.
Liang, J., Zhang, L., Wang, Y., Cao, X., Zhang, Q., Wang, H., and Zhang, B.: Turbulence regimes and the validity of similarity theory in the stable boundary layer over complex terrain of the Loess Plateau, China, J. Geophys, Res., 119, 6009–6021, 2014.
Liu, J. F., Fan, S. M., Horowitz, L. W., and Levy, H.: Evaluation of factors controlling long-range transport of black carbon to the Arctic, J. Geoph. Res., 116, D04307, https://doi.org/10.1029/2010JD015145, 2011.
Löffler-Mang, M. and Joss, J.: An optical disdrometer for measuring size and velocity of hydrometeors, J. Atmos. Ocean. Tech., 17, 130–139, https://doi.org/10.1175/1520-0426(2000)017<0130:aodfms>2.0.co;2, 2000.
Lupi, A., Busetto, M., Becagli, S., Giardi, F., Lanconelli, C., Mazzola, M., Udisti, R., Hansson, H. C., Henning, T., Petkov, B., Ström, J., Krejci, R., Tunved, P., Viola, A. P., and Vitale, V.: Multi-seasonal ultrafine aerosol particle number concentration measurements at the Gruvebadet observatory, Ny-Ålesund, Rend. Fis. Acc. Lincei, 27, 59–71, https://doi.org/10.1007/s12210-016-0532-8, 2016.
Macdonald, K. M., Sharma, S., Toom, D., Chivulescu, A., Hanna, S., Bertram, A. K., Platt, A., Elsasser, M., Huang, L., Tarasick, D., Chellman, N., McConnell, J. R., Bozem, H., Kunkel, D., Lei, Y. D., Evans, G. J., and Abbatt, J. P. D.: Observations of atmospheric chemical deposition to high Arctic snow, Atmos. Chem. Phys., 17, 5775–5788, https://doi.org/10.5194/acp-17-5775-2017, 2017.
Magnani, M., Baneschi, I., Giamberini, M., Raco, B., and Provenzale, A.: Microscale drivers of summer CO2 fluxes in the Svalbard High Arctic tundra, Sci. Rep., 12, 763, https://doi.org/10.1038/s41598-021-04728-0, 2022.
Mahrt, L.: Flux sampling errors for aircraft and towers, J. Atmos. Ocean. Tech., 15, 416–429, https://doi.org/10.1175/1520-0426(1998)015<0416:FSEFAA>2.0.CO;2, 1998.
Massman, W. J. and Ibrom, A.: Attenuation of concentration fluctuations of water vapor and other trace gases in turbulent tube flow, Atmos. Chem. Phys., 8, 6245–6259, https://doi.org/10.5194/acp-8-6245-2008, 2008.
Mazzola, M., Tampieri, F., Viola, A. P., Lanconelli, C., and Choi, T.: Stable boundary layer vertical scales in the Arctic: observations and analyses at Ny-Ålesund, Svalbard, Q. J. Roy. Meteor. Soc., 142, 1250–1258, https://doi.org/10.1002/qj.2727, 2016.
McMillen, R. T.: An eddy correlation technique with extended applicability to no simple terrain, Bound.-Lay. Meteorol., 43, 231–245, 1988.
Menegoz, M., Voldoire, A., Teyssedre, H., Melia, D. S. Y., Peuch, V. H., and Gouttevin, I.: How does the atmospheric variability drive the aerosol residence time in the Arctic region?, Tellus B, 64, 11596, https://doi.org/10.3402/tellusb.v64i0.11596, 2012.
Metzger, M. and Holmes, H.: Time scales in the unstable atmospheric surface layer, Bound.-Lay. Meteorol., 126, 29–50, https://doi.org/10.1007/s10546-007-9219-0, 2008.
Mordas, G., Manninen, H. E., Petäjä, T., Aalto, P. P., Hämeri, K., and Kulmala, M.: On operation of the ultra-fine water-based CPC TSI 3786 and comparison with other TSI models (TSI 3776, TSI 3772, TSI 3025, TSI 3010, TSI 3007), Aerosol Sci. Technol., 42, 152–158, https://doi.org/10.1080/02786820701846252, 2008.
Mortarini, L., Stefanello, M., Degrazia, G., Roberti, D., Trini Castelli, S., and Anfossi, D.: Characterization of wind meandering in low-wind-speed conditions, Bound.-Lay. Meteorol., 161, 165–182, 2016.
Nemitz, E., Gallagher, M. W., Duyzer, J. H., and Fowler, D.: Micrometeorological measurements of particle deposition velocities to moorland vegetation, Q. J. Roy. Meteor. Soc., 128, 2281–2300, 2002.
Nilsson, E. D. and Rannik, U.: Turbulent aerosol fluxes over the Arctic ocean 1. Dry deposition over sea and pack ice, J. Geophys. Res., 106, 32125–32137, https://doi.org/10.1029/2000JD900605, 2001.
Nordbo, A., Jäarvi, L., Haapanala, S., Moilanen, J., and Vesala, T.: Intra-city variation in urban morphology and turbulence structure in Helsinki, Finland, Bound.-Lay. Meteorol., 146, 469–496, https://doi.org/10.1007/s10546-012-9773-y, 2013.
Pappaccogli, G., Famulari, D., and Donateo, A.: Impact of filtering methods on ultrafine particles turbulent fluxes by eddy covariance, Atmos. Environ., 285, 119237, https://doi.org/10.1016/j.atmosenv.2022.119237, 2022.
Pleim, J. and Ran, L.: Surface flux modeling for air quality applications, Atmosphere, 2, 271–302, https://doi.org/10.3390/atmos2030271, 2011.
Pryor, S., Gallagher, M., Sievering, H., Larsen, S. E., Barthelmie, R. J., Birsan, F., Nemitz, E., Rinne, J., Kulmala, M., and Grönholm, T.: A review of measurement and modelling results of particle atmosphere–surface exchange, Tellus B, 60, 42–75, 2008.
Pryor, S. C., Barthelmie, R. J., and Hornsby, K. E.: Size-Resolved particle fluxes and vertical gradients over and in a sparse pine forest, Aerosol Sci. Technol., 47, 1248–1257, https://doi.org/10.1080/02786826.2013.831974, 2013.
Qi, L., Li, Q., Li, Y., and He, C.: Factors controlling black carbon distribution in the Arctic, Atmos. Chem. Phys., 17, 1037–1059, https://doi.org/10.5194/acp-17-1037-2017, 2017.
Quinn, P. K., Bates, T. S., Baum, E., Doubleday, N., Fiore, A. M., Flanner, M., Fridlind, A., Garrett, T. J., Koch, D., Menon, S., Shindell, D., Stohl, A., and Warren, S. G.: Short-lived pollutants in the Arctic: their climate impact and possible mitigation strategies, Atmos. Chem. Phys., 8, 1723–1735, https://doi.org/10.5194/acp-8-1723-2008, 2008.
Quinn, P. K., Bates, T. S., Schulz, K., and Shaw, G. E.: Decadal trends in aerosol chemical composition at Barrow, Alaska: 1976–2008, Atmos. Chem. Phys., 9, 8883–8888, https://doi.org/10.5194/acp-9-8883-2009, 2009.
Sand, M., Berntsen, T. K., von Salzen, K., Flanner, M. G., Langner, J., and Victor, D. G.: Response of Arctic temperature to changes in emissions of short-lived climate forcers, Nat. Clim. Change, 6, 286–289, https://doi.org/10.1038/nclimate2880, 2015.
Saylor, R. D., Baker, B. D., Lee, P., Tong, D., Pan, L., and Hicks, B. B.: The particle dry deposition component of total deposition from air quality models: right, wrong or uncertain?, Tellus B, 71, 1550324, https://doi.org/10.1080/16000889.2018.1550324, 2019.
Schiavon, M., Tampieri, F., Bosveld, F. C., Mazzola, M., Trini Castelli, S., Viola, A. P., and Yagüe, C.: The Share of the Mean Turbulent Kinetic Energy in the Near-Neutral Surface Layer for High and Low Wind Speeds, Bound.-Lay. Meteorol., 172, 81–106, https://doi.org/10.1007/s10546-019-00435-6, 2019.
Schmale, J., Zieger, P., and Ekman, A. M. L.: Aerosols in current and future Arctic climate, Nat. Clim. Change, 11, 95–105, 2021.
Shu, Q.: Particle dry deposition algorithms in CMAQ version 5.3: characterization of critical parameters and land use dependence using DepoBoxTool version 1.0, Zenodo [code], https://doi.org/10.5281/zenodo.4749548, 2021.
Shu, Q., Murphy, B., Pleim, J. E., Schwede, D., Henderson, B. H., Pye, H. O. T., Appel, K. W., Khan, T. R., and Perlinger, J. A.: Particle dry deposition algorithms in CMAQ version 5.3: characterization of critical parameters and land use dependence using DepoBoxTool version 1.0, Geosci. Model Dev. Discuss. [preprint], https://doi.org/10.5194/gmd-2021-129, 2021.
Skiles, S. M., Flanner, M., Cook, J. M., Dumont, M., and Painter, T. H.: Radiative forcing by light-absorbing particles in snow, Nat. Clim. Change, 8, 964–971, 2018.
Slinn, W.: Predictions for particle deposition to vegetative canopies, Atmos. Environ., 16, 1785–1794, 1982.
Song, C., Becagli, S., Beddows, D. C. S., Brean, J., Browse, J., Dai, Q., Dall'Osto, M., Ferracci, V., Harrison, R. M., Harris, N., Li, W., Jones, A. E., Kirchgäßner, A., Kramawijaya, A. G., Kurganskiy, A., Lupi, A., Mazzola, M., Severi, M., Traversi, R., and Shi, Z.: Understanding Sources and Drivers of Size-Resolved Aerosol in the High Arctic Islands of Svalbard Using a Receptor Model Coupled with Machine Learning, Environ. Sci. Technol., 56, 11189–11198, 2022.
Stjern, C. W., Lund, M. T., Samset, B. H., Myhre, G., Forster, P. M., Andrews, T., Boucher, O., Faluvegi, G., Fläschner, D., Iversen, T., Kasoar, M., Kharin, V., Kirkevåg, A., Lamarque, J.-F., Olivié, D., Richardson, T., Sand, M., Shawki, D., Shindell, D., Smith, C. J., Takemura, T., Voulgarakis, A.: Arctic amplification response to individual climate drivers, J. Geophys. Res.-Atmos., 124, 6698–6717, https://doi.org/10.1029/2018JD029726, 2019.
Stull, R. B.: An introduction to boundary layer meteorology, Kluwer Academic Publishers, Dordrecht, ISBN 978-90-277-2768-8, 1988.
Sun, J., Mahrt, L., Banta, R. M., and Pichugina, Y. L.: Turbulence regimes and turbulence intermittency in the stable boundary layer during cases-99, J. Atmos. Sci., 69, 338–351, https://doi.org/10.1175/JAS-D-11-082.1, 2012.
Tapiador, F. J., Checa, R., and de Castro, M.: An experiment to measure the spatial variability of rain drop size distribution using sixteen laser disdrometers, Geophys. Res. Lett., 37, L16803, https://doi.org/10.1029/2010gl044120, 2010.
Toda, M. and Sugita, M.: Single level turbulence measurements to determine roughness parameters of complex terrain, J. Geophys. Res., 108, D12, https://doi.org/10.1029/2002JD002573, 4363, 2003.
Tschiersch J., Frank, G., Hietel, B., Schramel, P., Schulz, F., and Trautner, F.: Aerosol deposition to a snow surface, J. Aerosol Sci., 22, Suppl. I, 565–568, 1991.
Tunved, P., Ström, J., and Krejci, R.: Arctic aerosol life cycle: linking aerosol size distributions observed between 2000 and 2010 with air mass transport and precipitation at Zeppelin station, Ny-Ålesund, Svalbard, Atmos. Chem. Phys., 13, 3643–3660, https://doi.org/10.5194/acp-13-3643-2013, 2013.
Urgnani, R., Finco, A., Chiesa, M., Marzuoli, R., Bignotti, L., Riccio, A., Chianese, E., Tirimberio, G., Giovannini, L., Zardi D., and Gerosa G.: Size-segregated aerosol fluxes, deposition velocities, and chemical composition in an Alpine valley, Atmos. Res., 268, 105995, https://doi.org/10.1016/j.atmosres.2021.105995, 2022.
Van As, D., Van den Broeke, M., and Van de Wal, R.: Daily cycle of the surface layer and energy balance on the high Antarctic Plateau, Antarct. Sci., 17, 121–133, 2005.
Van den Broeke, M.: Strong surface melting preceded collapse of Antarctic Peninsula ice shelf, Geophys. Res. Lett., 32, L12815, https://doi.org/10.1029/2005GL023247, 2005.
Věcenaj, Z. and De Wekker, S. F. J.: Determination of non-stationarity in the surface layer during the T-REX experiment, Q. J. Roy. Meteor. Soc., 141, 1560–1571, https://doi.org/10.1002/qj.2458, 2015.
Vickers, D. and Mahrt, L.: Quality Control and Flux Sampling Problems for Tower and Aircraft Data, J. Atmos. Ocean. Tech., 14, 512–526, https://doi.org/10.1175/1520-0426(1997)014<0512:QCAFSP>2.0.CO;2, 1997.
Vickers, D. and Mahrt, L.: The cospectral gap and turbulent flux calculations, J. Atmos. Ocean. Tech., 20, 660–672, 2003.
Vickers, D. and Mahrt, L.: A solution for flux contamination by mesoscale motions with very weak turbulence, Bound.-Lay. Meteorol., 118, 431–447, 2006.
Vong, R. J., Vickers, D., and Covert, D. S.: Eddy correlation measurements of aerosol deposition to grass, Tellus B, 56, 105–117, 2004.
Wang, Q., Jacob, D. J., Fisher, J. A., Mao, J., Leibensperger, E. M., Carouge, C. C., Le Sager, P., Kondo, Y., Jimenez, J. L., Cubison, M. J., and Doherty, S. J.: Sources of carbonaceous aerosols and deposited black carbon in the Arctic in winter-spring: implications for radiative forcing, Atmos. Chem. Phys., 11, 12453–12473, https://doi.org/10.5194/acp-11-12453-2011, 2011.
Wesely, M. L. and Hicks, B. B.: A review of the current status of knowledge on dry deposition, Atmos. Environ., 34, 12–14, 2000.
Whaley, C. H., Mahmood, R., von Salzen, K., Winter, B., Eckhardt, S., Arnold, S., Beagley, S., Becagli, S., Chien, R.-Y., Christensen, J., Damani, S. M., Dong, X., Eleftheriadis, K., Evangeliou, N., Faluvegi, G., Flanner, M., Fu, J. S., Gauss, M., Giardi, F., Gong, W., Hjorth, J. L., Huang, L., Im, U., Kanaya, Y., Krishnan, S., Klimont, Z., Kühn, T., Langner, J., Law, K. S., Marelle, L., Massling, A., Olivié, D., Onishi, T., Oshima, N., Peng, Y., Plummer, D. A., Popovicheva, O., Pozzoli, L., Raut, J.-C., Sand, M., Saunders, L. N., Schmale, J., Sharma, S., Skeie, R. B., Skov, H., Taketani, F., Thomas, M. A., Traversi, R., Tsigaridis, K., Tsyro, S., Turnock, S., Vitale, V., Walker, K. A., Wang, M., Watson-Parris, D., and Weiss-Gibbons, T.: Model evaluation of short-lived climate forcers for the Arctic Monitoring and Assessment Programme: a multi-species, multi-model study, Atmos. Chem. Phys., 22, 5775–5828, https://doi.org/10.5194/acp-22-5775-2022, 2022.
Whitehead, J. D., Dorsey, J. R., Gallagher, M. W., Flynn, M. J., Mc Figgans, G., and Carpenter, L. J.: Particle fluxes and condensational uptake over sea ice during COBRA, J. Geophys. Res., 117, D15202, https://doi.org/10.1029/2012JD017798, 2012.
Willis, M. D., Leaitch, W. R., and Abbatt, J. P.: Processes controlling the composition and abundance of Arctic aerosol, Rev. Geophys., 56, 621–671, https://doi.org/10.1029/2018RG000602, 2018.
Zhang, L. M., Gong, S. L., Padro, J., and Barrie, L.: A size-segregated particle dry deposition scheme for an atmospheric aerosol module, Atmos. Environ., 35, 549–60, 2001.
Zhou, C., Penner, J. E., Flanner, M. G., Bisiaux, M. M., Edwards, R., and McConnell, J. R.: Transport of black carbon to polar regions: Sensitivity and forcing by black carbon, Geophys. Res. Lett., 39, L22804, https://doi.org/10.1029/2012GL053388, 2012.