the Creative Commons Attribution 4.0 License.
the Creative Commons Attribution 4.0 License.
 | 04 Jul 2023
Impact of Landes forest fires on air quality in France during the 2022 summer
Laurent Menut
Arineh Cholakian
Guillaume Siour
Rémy Lapere
Romain Pennel
Sylvain Mailler
Bertrand Bessagnet
The atypical huge forest fires observed in France during the summer of 2022 are modeled using the CHIMERE model. The impact of these emissions is quantified on ozone, aerosols and aerosol optical depth (AOD). The fires also influence the surface by destroying the vegetation and creating new erodible surfaces. This increases the mineral dust emissions but also reduces the leaf area index (LAI), and then it decreases the biogenic emissions and the dry deposition of gases such as ozone. Results show that the fires induce numerous increases in surface ozone and particulate matter (PM) concentrations close to the sources but also in downwind remote sites such as the Paris area. During the period of the most intense fires in July, the impact of concentrations is mainly due to emissions themselves, and later, in August, ozone and PM concentrations continue to increase but this time due to changes in the burned surfaces.
- Article
(15289 KB) - Full-text XML
- BibTeX
- EndNote


Forest fires are frequent in summer in Europe, mainly in the south. They are usually observed in Greece, Spain and Portugal and can last several weeks (San-Miguel-Ayanz et al., 2022). In addition to the destruction of burning vegetation, these fires emit numerous air pollutants that can degrade the air quality in the areas downwind of the smoke plumes. In France, these fires are more rare. But during the summer of 2022, numerous huge and atypical forest fires were observed. The Landes de Gascogne forest in southwestern France covers an area of about 1 500 000 ha, mostly belonging to the departments of Gironde (to the north) and Landes (to the south). Mostly planted during the 19th century, this forest is primarily composed of maritime pine (Mora et al., 2014). Major episodes of wildfires occurred in this large forest in the past, the most dramatic being the megafire of 1949, which burned 50 000 ha in the Gironde department and caused 82 deaths. Recent significant events occurred in August 2015 in the vicinity of Bordeaux (500 ha burned) and April 2017 (1100 ha burned). With increased urbanization and demographic growth in this area, the risk associated to wildfires increases. Protection and management measures against wildfires have been taken in this forest after the 1949 disaster. These measures rely on a strong implication of the local economic actors who grow and harvest the forest. However, this implication has been weakened in the recent years due to many factors including economic hardship for the forest sector following the destructions caused by storms (Martin, 1999; Klaus, 2009). Therefore, the management of the forest by economic actors is not as intense as it used to be, easing the propagation of wildfires, while climate change favors an increased risk of wildfires (Huang et al., 2015).
The 2022 fire season was the worst in this region since 1949. Three main episodes have occurred during this summer season, the first from 12 to 22 July, with two major fire events close to Landiras (13 800 ha burned as of 20 July) and La-Teste-de-Buch (7000 ha burned as of 20 July). However, the Landiras fire, apparently finished at the surface but still propagating underground due to the presence of peat, began activity again on 9 August, burning another 7400 ha of forest between 9 and 14 August and a last one in September burning 3400 ha in Saumos. These events destroyed more than 30 000 ha of forest in Gironde during the 2022 fire season. One explanation is the unusual heat wave observed in France during this summer: the forest and its soil were dryer than usual, and high wind speeds were observed. In addition, the region experienced very low precipitation compared to seasonal norms (Toreti et al., 2022).
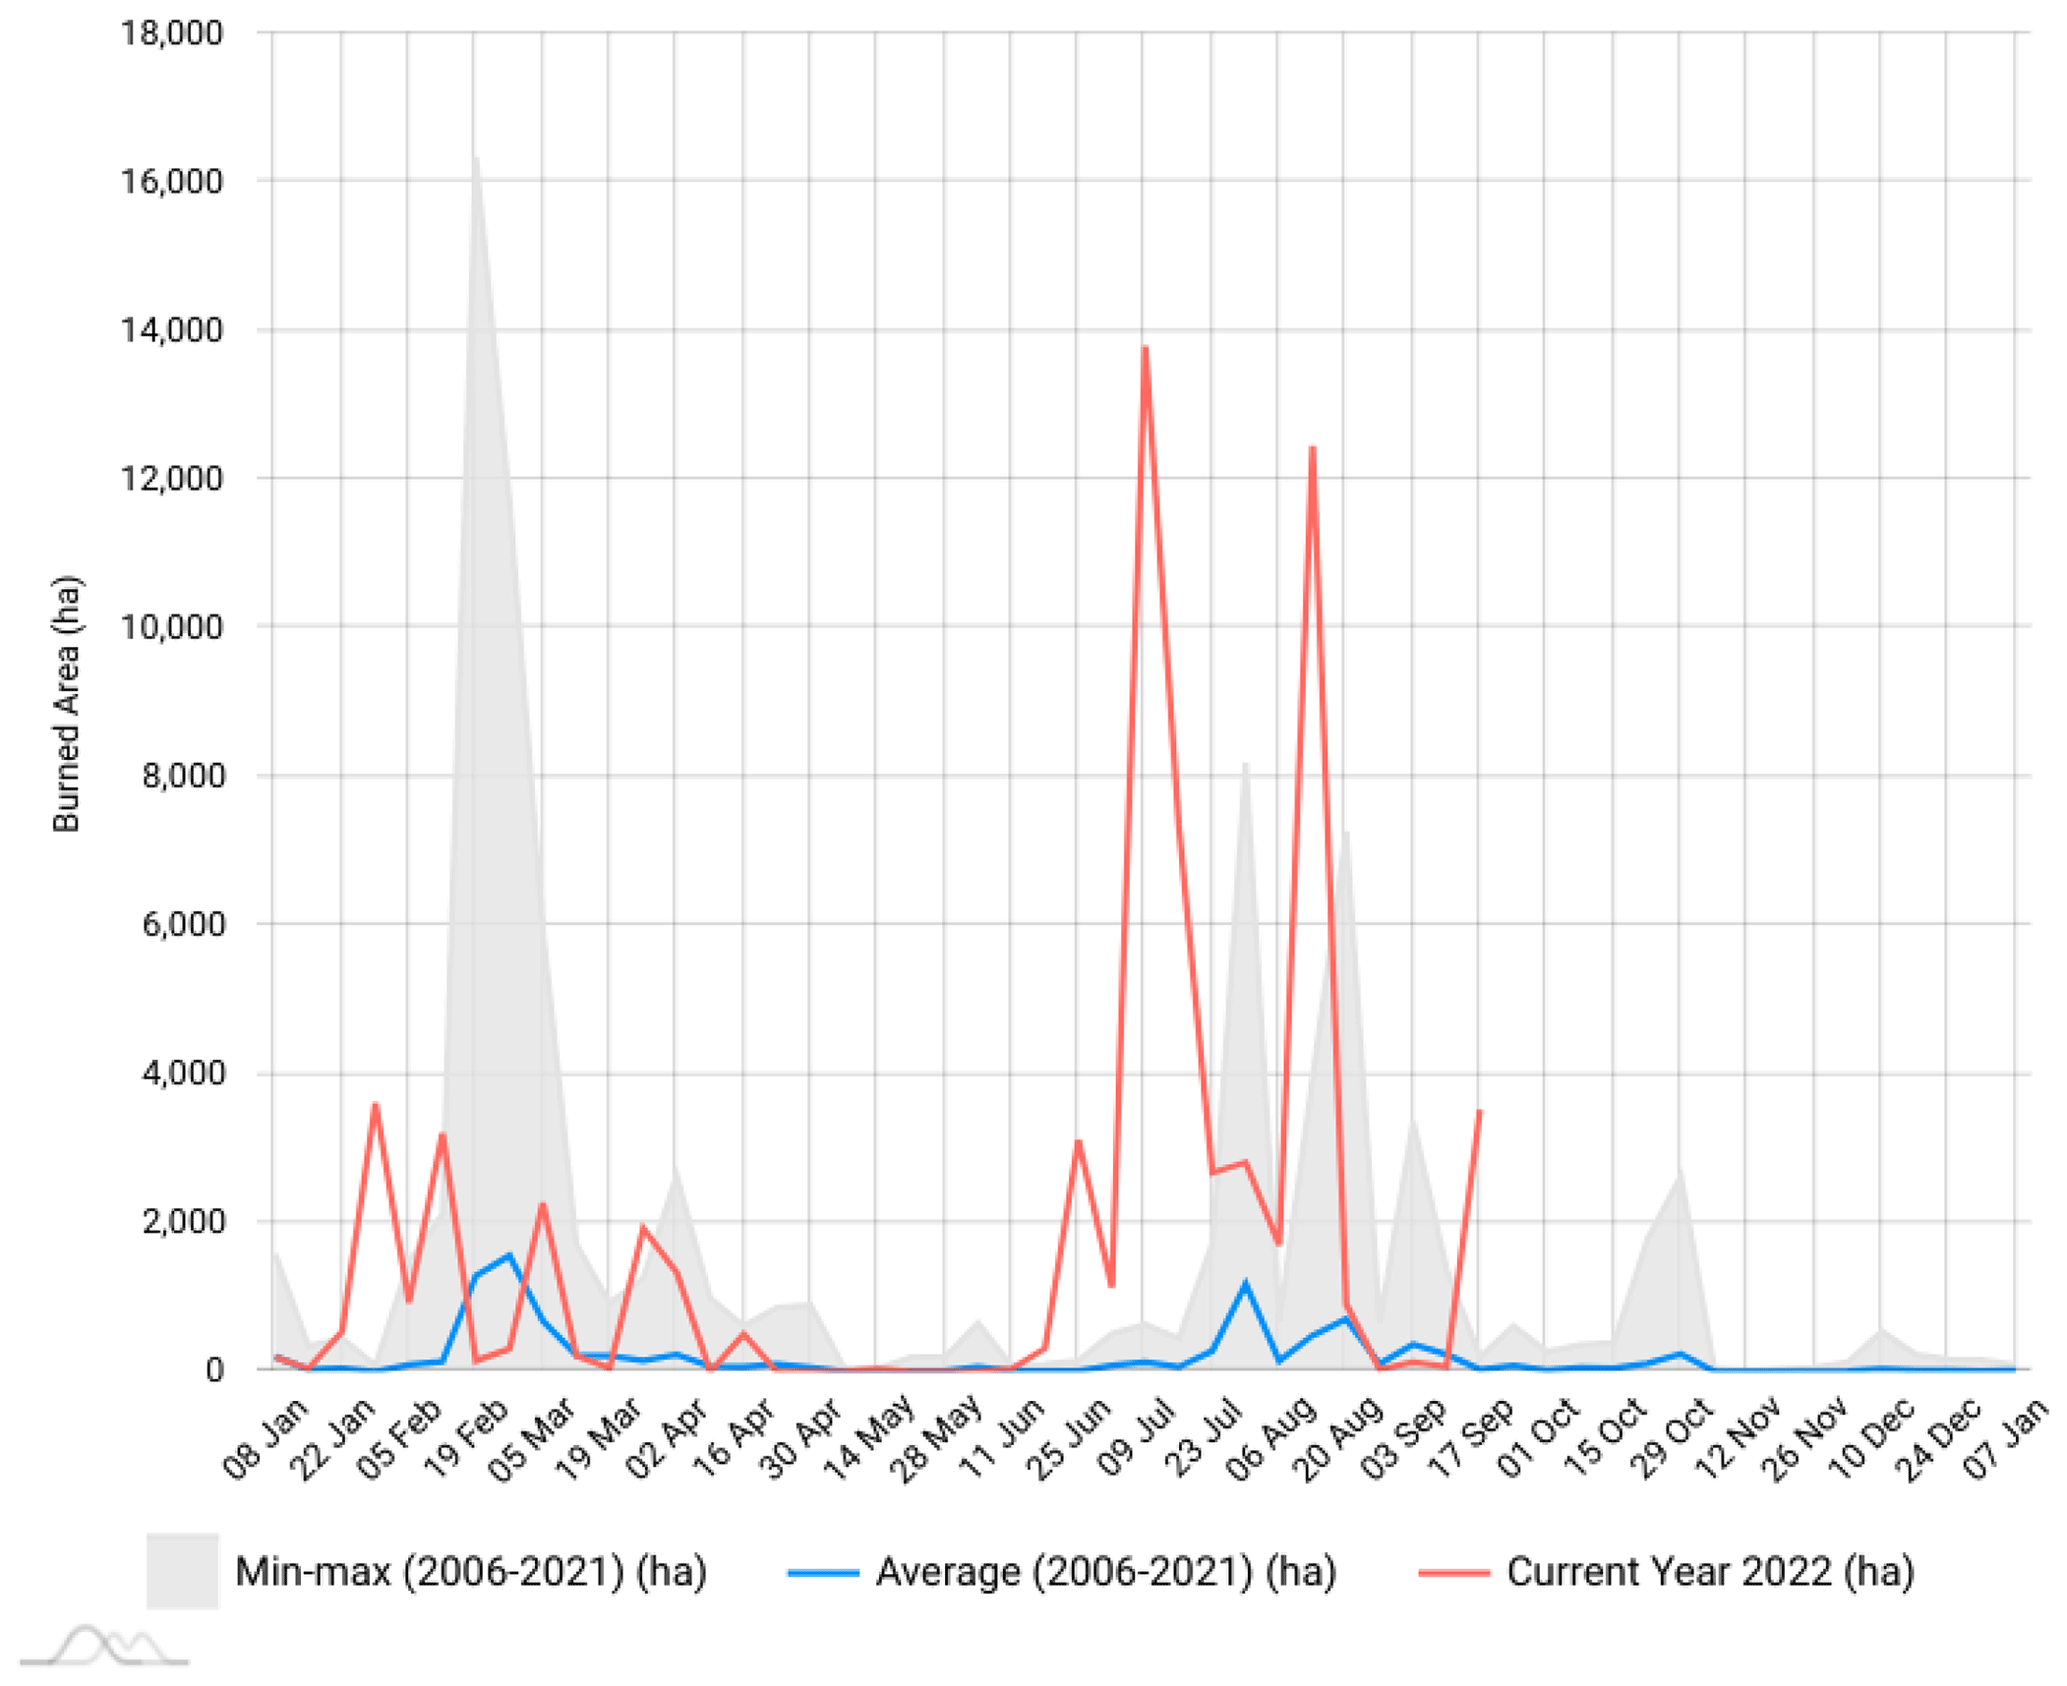
Figure 1Seasonal trend of weekly burned areas (ha) in France as an average over the period 2006–2021 and for the year 2022 (until 13 September). The figure is extracted from the EFFIS database (https://effis.jrc.ec.europa.eu/apps/effis.statistics/estimates, last access: 29 June 2023).
The seasonal trend of vegetation fires is presented in Fig. 1. Figure 1 is extracted from the European Forest Fire Information System (EFFIS). The blue curve shows the weekly average burned area (ha) in France for the period ranging from 2006 to 2021. The maximum burned area is in February, July and August and does not exceed 2000 ha. The gray shade shows the maximum values recorded during this period, and values may reach 18 000 ha in February. The red curve presents the burned area for the year 2022 only. Summer 2022 is characterized by two extreme peaks in weekly burned areas, with 14 000 ha burned in 1 week in July and 13 000 ha in 1 week of August, more than any other sole summer week in the 2006–2021 period.
By emitting gas and particles in the atmosphere, vegetation fires change directly the atmospheric composition downwind the fire plume (Jaffe and Wigder, 2012; Rea et al., 2015). It has a direct impact on surface concentrations of ozone, nitrogen oxides and particulate matter and then on possible pollution peaks monitored by air quality networks. Some other impacts of fires exist: aerosols have a direct effect of aerosol on meteorology by attenuating the solar radiation (Reid et al., 2005) and changing microphysics (Grell et al., 2011). They also have an impact on other natural emissions such as mineral dust (Wagner et al., 2018; Menut et al., 2022b). A possible impact exists also on biogenic emissions, with the fires destroying the vegetation that potentially emits chemical species (Vieira et al., 2023).
The main questions addressed in this study are as follows: (i) is the model able to simulate the fires plumes; (ii) does the biomass burning have a significant impact on mineral dust emissions, dry deposition or biogenic emissions by changing the surface; and (iii) are the fire plumes responsible for additional pollution peaks in urbanized areas? To answer these questions, several simulations are performed with regional modeling and comparisons to observations. In Sect. 2, the CHIMERE model used is presented as well as its specific configurations and the model developments made for this study. In Sects. 3, 4 and 5, the results of the simulations are presented.
The modeling system is presented in this section with the models used, the databases employed as forcings and the main changes made in the last model versions.
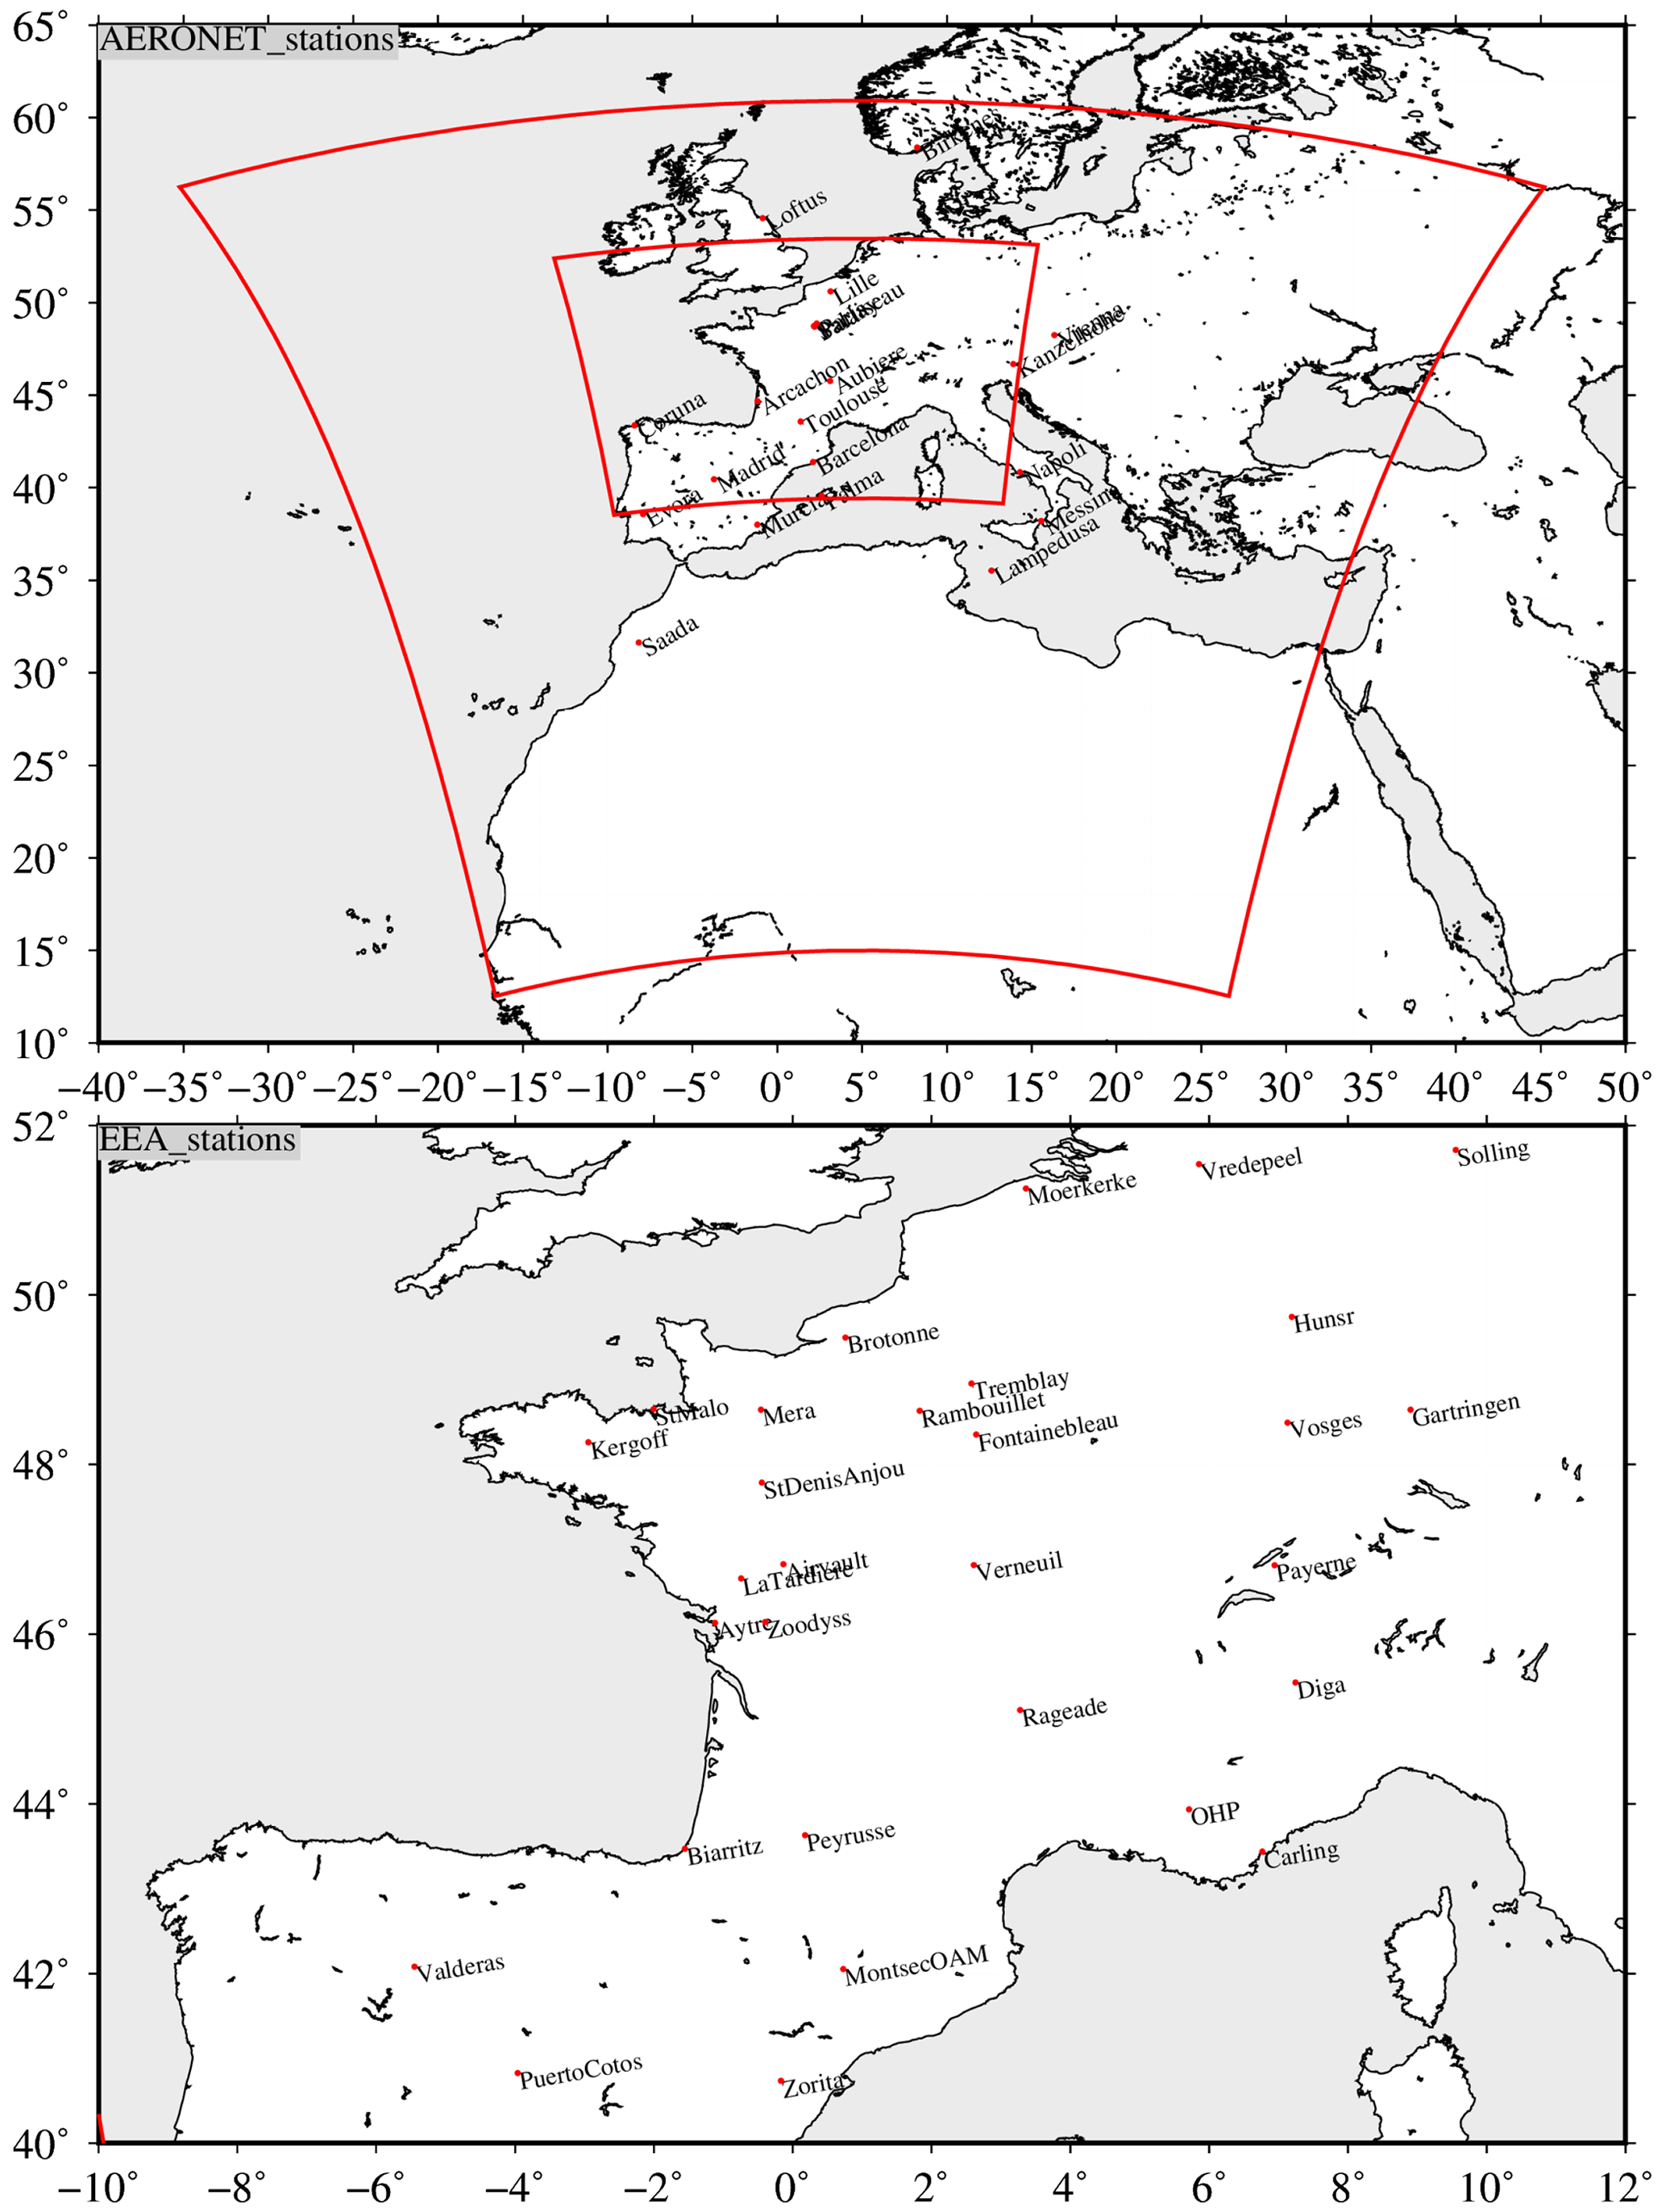
Figure 2Maps of measurements stations of EEA and AERONET. The two nested model domains are represented as red frames. The largest one has a horizontal resolution of 50 km, and the second one has a horizontal resolution of 15 km.
2.1 The model setups
In this study, we use the CHIMERE model v2020r3 (Menut et al., 2021) forced by IFS ECMWF meteorological fields (Haiden et al., 2022). Two model domains are defined, one with a horizontal resolution of 50 km, and the second one is nested inside the largest one, with a horizontal resolution of 15 km (Fig. 2). The larger domain is designed to have the boundary conditions far from France where fires are studied and also to have an explicit representation of the numerous natural emissions around and in France (mineral dust in Africa, sea salt, biogenic emissions). Figure B1 presents the domain border in red as well as the leaf area index (LAI), in m2 m−2, for the month of August. The second domain is centered over France and is dedicated to have a good resolution to capture the thin plumes generated by forest fires. The two domains are presented in Fig. 2. Note that all results will be presented using the simulation made with the inner domain, with a resolution of 15 km. CHIMERE has 15 vertical levels from the surface to 300 hPa.
Several tens of chemical species, gas and aerosol, are modeled. For gases, the MELCHIOR 2 scheme is used as described in Menut et al. (2013) and Mailler et al. (2017). For aerosols, 10 bins are used from 0.01 to 40 µm. Emissions include several contributions such as anthropogenic, biogenic, sea salt, dimethylsulfide, biomass burning, lightning NOx and mineral dust. The anthropogenic emissions are those of CAMS (Granier et al., 2019). Having no available data for the summer 2022, we used the 2018 year for these emissions. Indeed, we avoided the years 2019, 2020 and 2021 to avoid lockdown effects or other perturbations due to this very particular COVID-19 period (Menut et al., 2020). The dry deposition is modeled following the Zhang et al. (2001) scheme and the wet deposition following Wang et al. (2014).
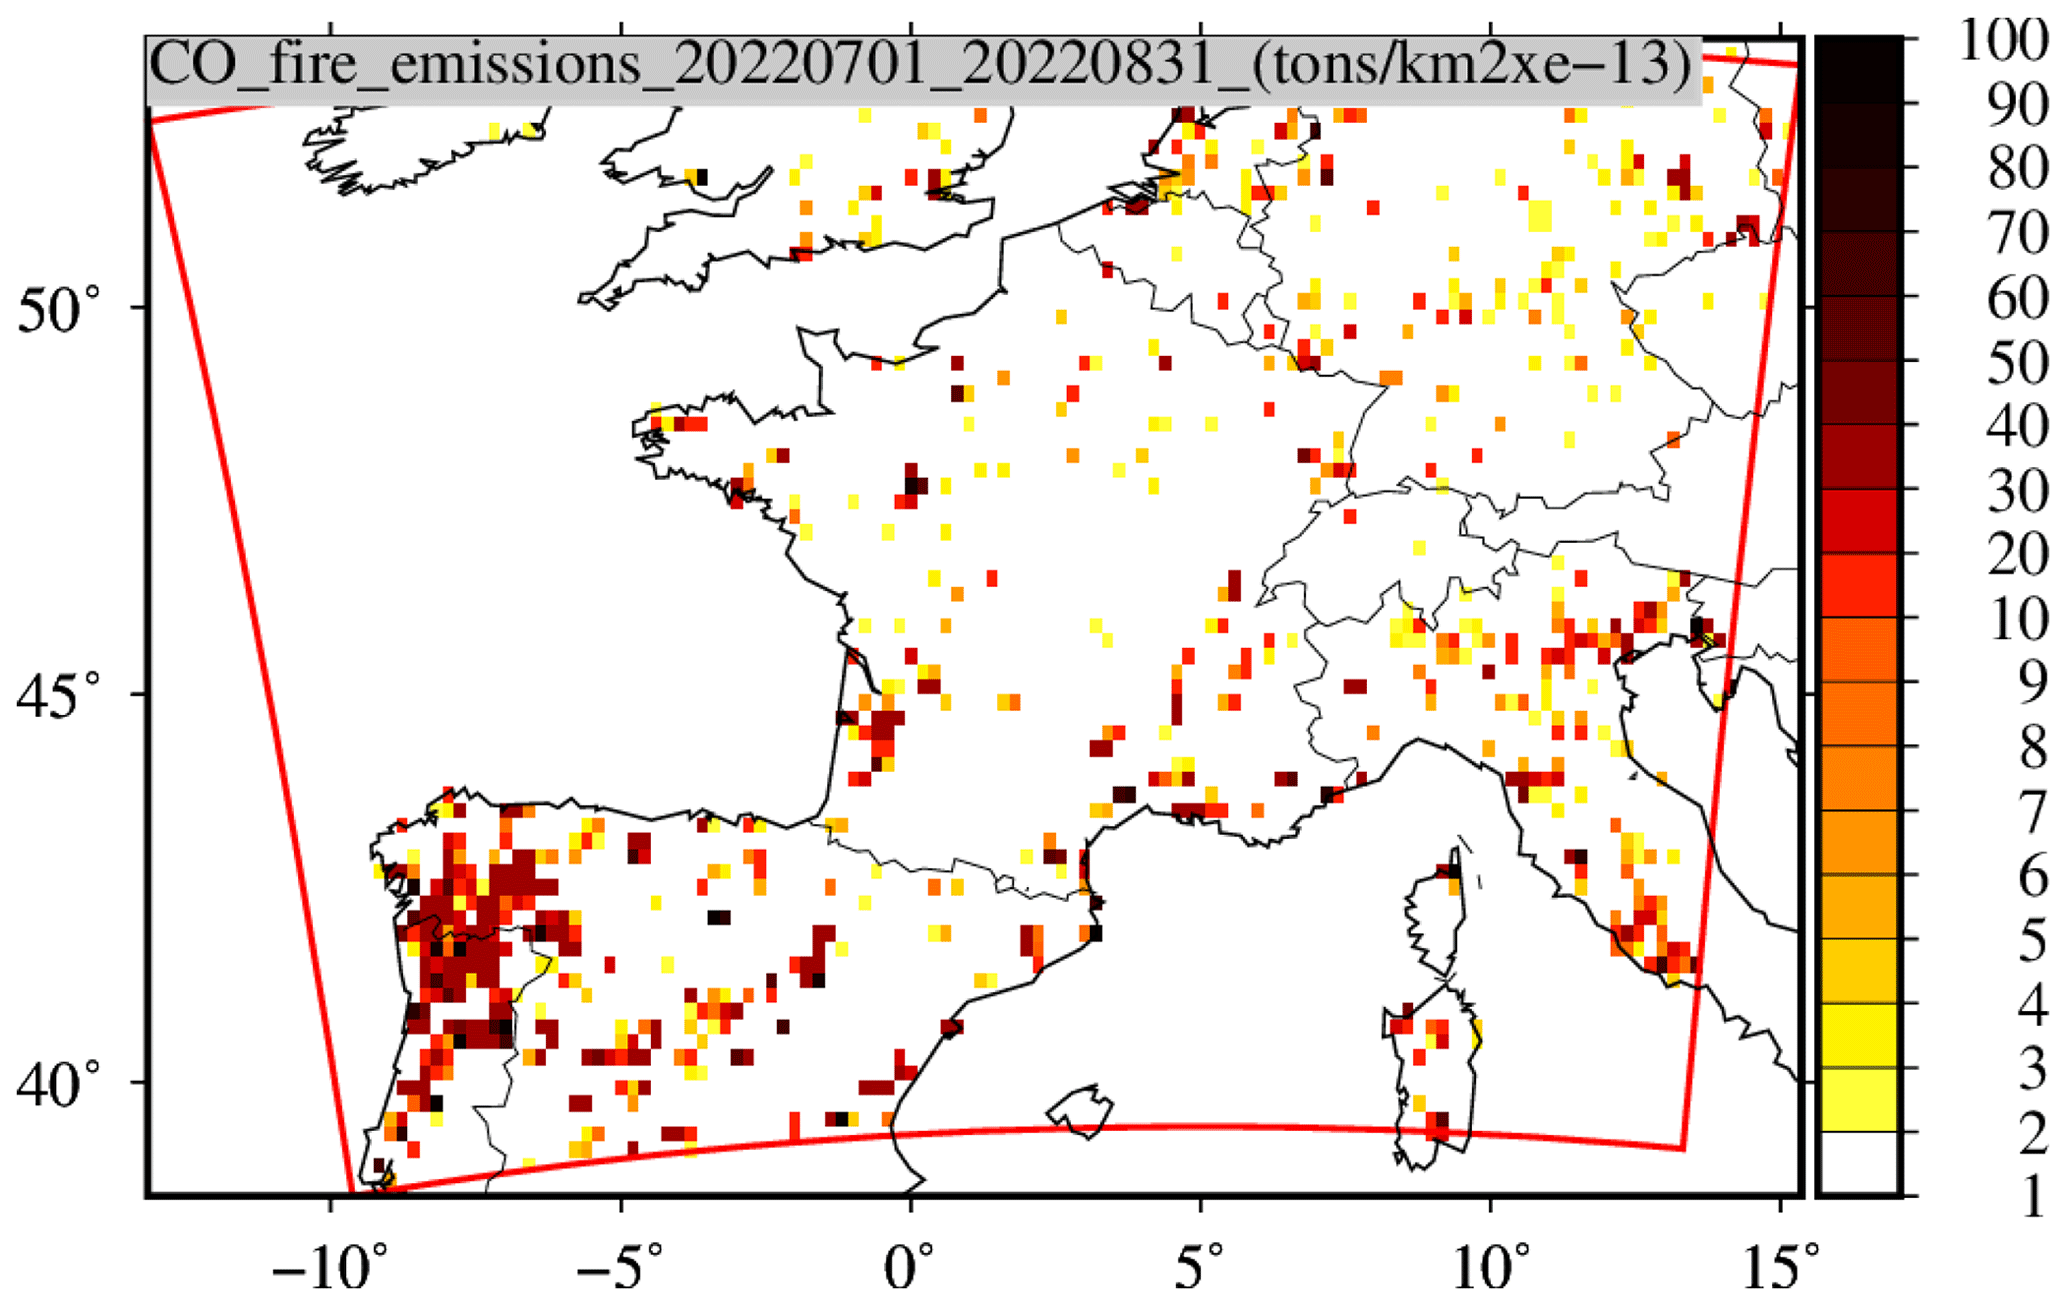
Figure 3Time-averaged surface flux of CO emitted by fires during the months of July and August 2022 and calculated using the CAMS fires product. The studied Landes fires are those located around the longitude 0∘ E and the latitude 45∘ N.
The biomass burning emissions are those of CAMS as described in Kaiser et al. (2012) and presented in Fig. 3 for the modeled domain with 15 km resolution. Biomass burning fluxes are calculated at the global scale and with a system assimilating MODIS satellite observations of fire radiative power (FRP). Burned areas are also provided but here used only for the scheme presented in this study and not for the fluxes calculation. At 0.5 × 0.5 horizontal resolution, these fluxes are projected on the CHIMERE grid. The surface fluxes are vertically redistributed as described in Menut et al. (2018). The injection height is parameterized following the Sofiev et al. (2012) scheme, and the shape of the vertical injection is parameterized using the Veira et al. (2015) scheme. Mineral dust emissions are calculated using the Alfaro and Gomes (2001) scheme with the numerical optimization presented in Menut et al. (2005). Sea-salt emission is calculated using the Monahan (1986) scheme. NOx by lightning is calculated following Menut et al. (2020) using the Price and Rind (1993) parameterization. Primary particulate matter (PPM) can also be emitted by a resuspension process as described in Vautard et al. (2005). The biogenic emissions are modeled using the MEGAN model (Guenther et al., 2012), with the leaf area index with 30 s resolution and 8 d frequency (Sindelarova et al., 2014).
2.2 Impact of fires on other natural emissions
Fires destroy the environment and thus have an impact on potential natural emissions and processes. In this study, three different impacts of vegetation fires are studied. First, there is a non-negligible impact on the local wind speed and the erodibility. The local wind speed is enhanced by the massive pyroconvection creating a surface pressure gradient. The burned surface becomes more erodible. Depending on the vegetation type, the increase in erodibility can last several months (Menut et al., 2022b). The conjunction of a higher wind speed and a higher erodibility leads to higher mineral dust emissions. Another impact is due to the fires destroying the vegetation then decreasing the leaf area index (LAI). The LAI is involved in the calculation of two processes in the model. First, the LAI proportionally affects the biogenic emission when less LAI induces less biogenic emissions. Second, less LAI is also responsible for less dry deposition of gaseous species, as there is less available leaf surface. To take into account this effect, the LAI is reduced proportionally to the burned area (the same percentage of surface) during and after each fire. Taking these three impacts into account has the effect of increasing dust emissions and reducing biogenic emissions but also reducing dry deposition.
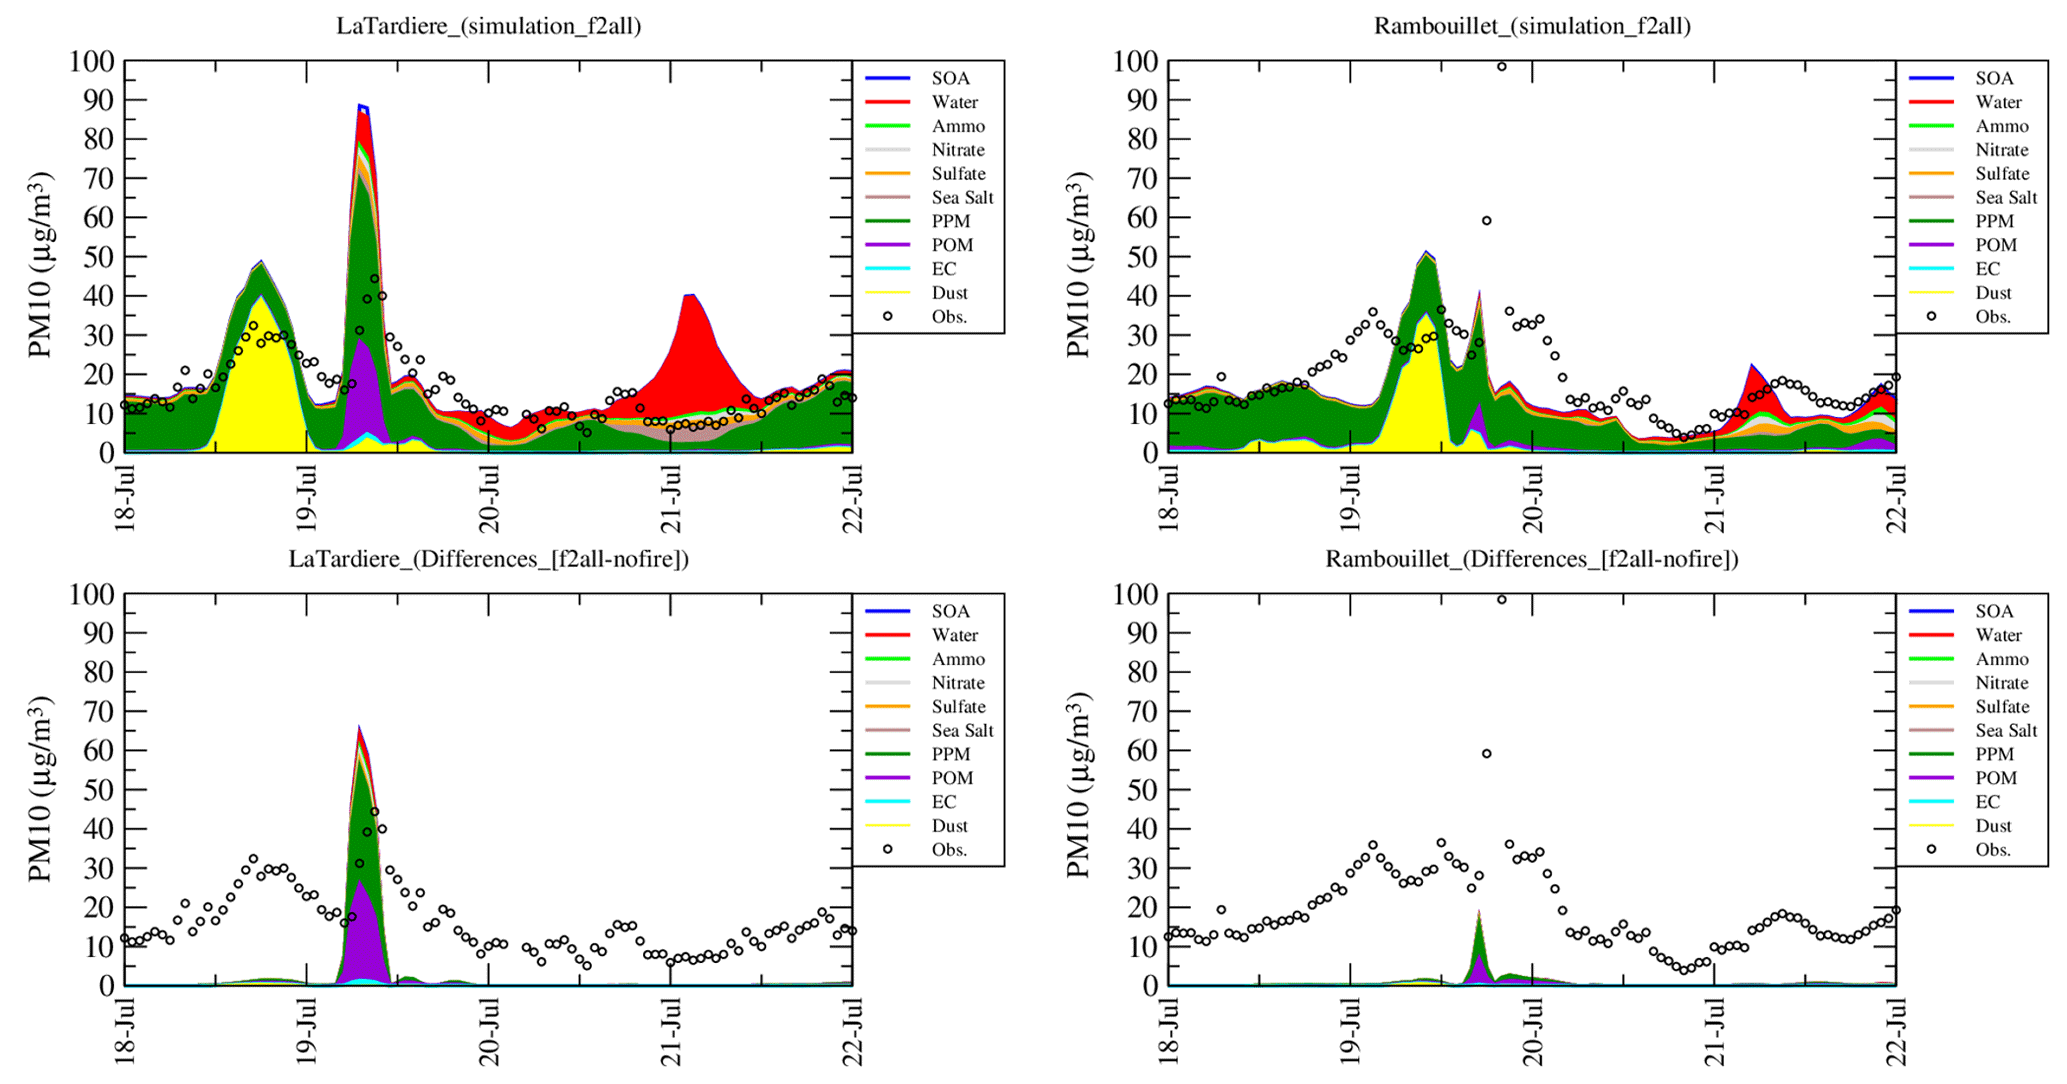
Figure 4Time series of absolute values and differences of PM10 (µg m−3) surface concentrations in La Tardiere and Rambouillet, for the period 18 to 22 July 2022. For the model values, the chemical composition of the PM10 is presented.
2.3 The simulations
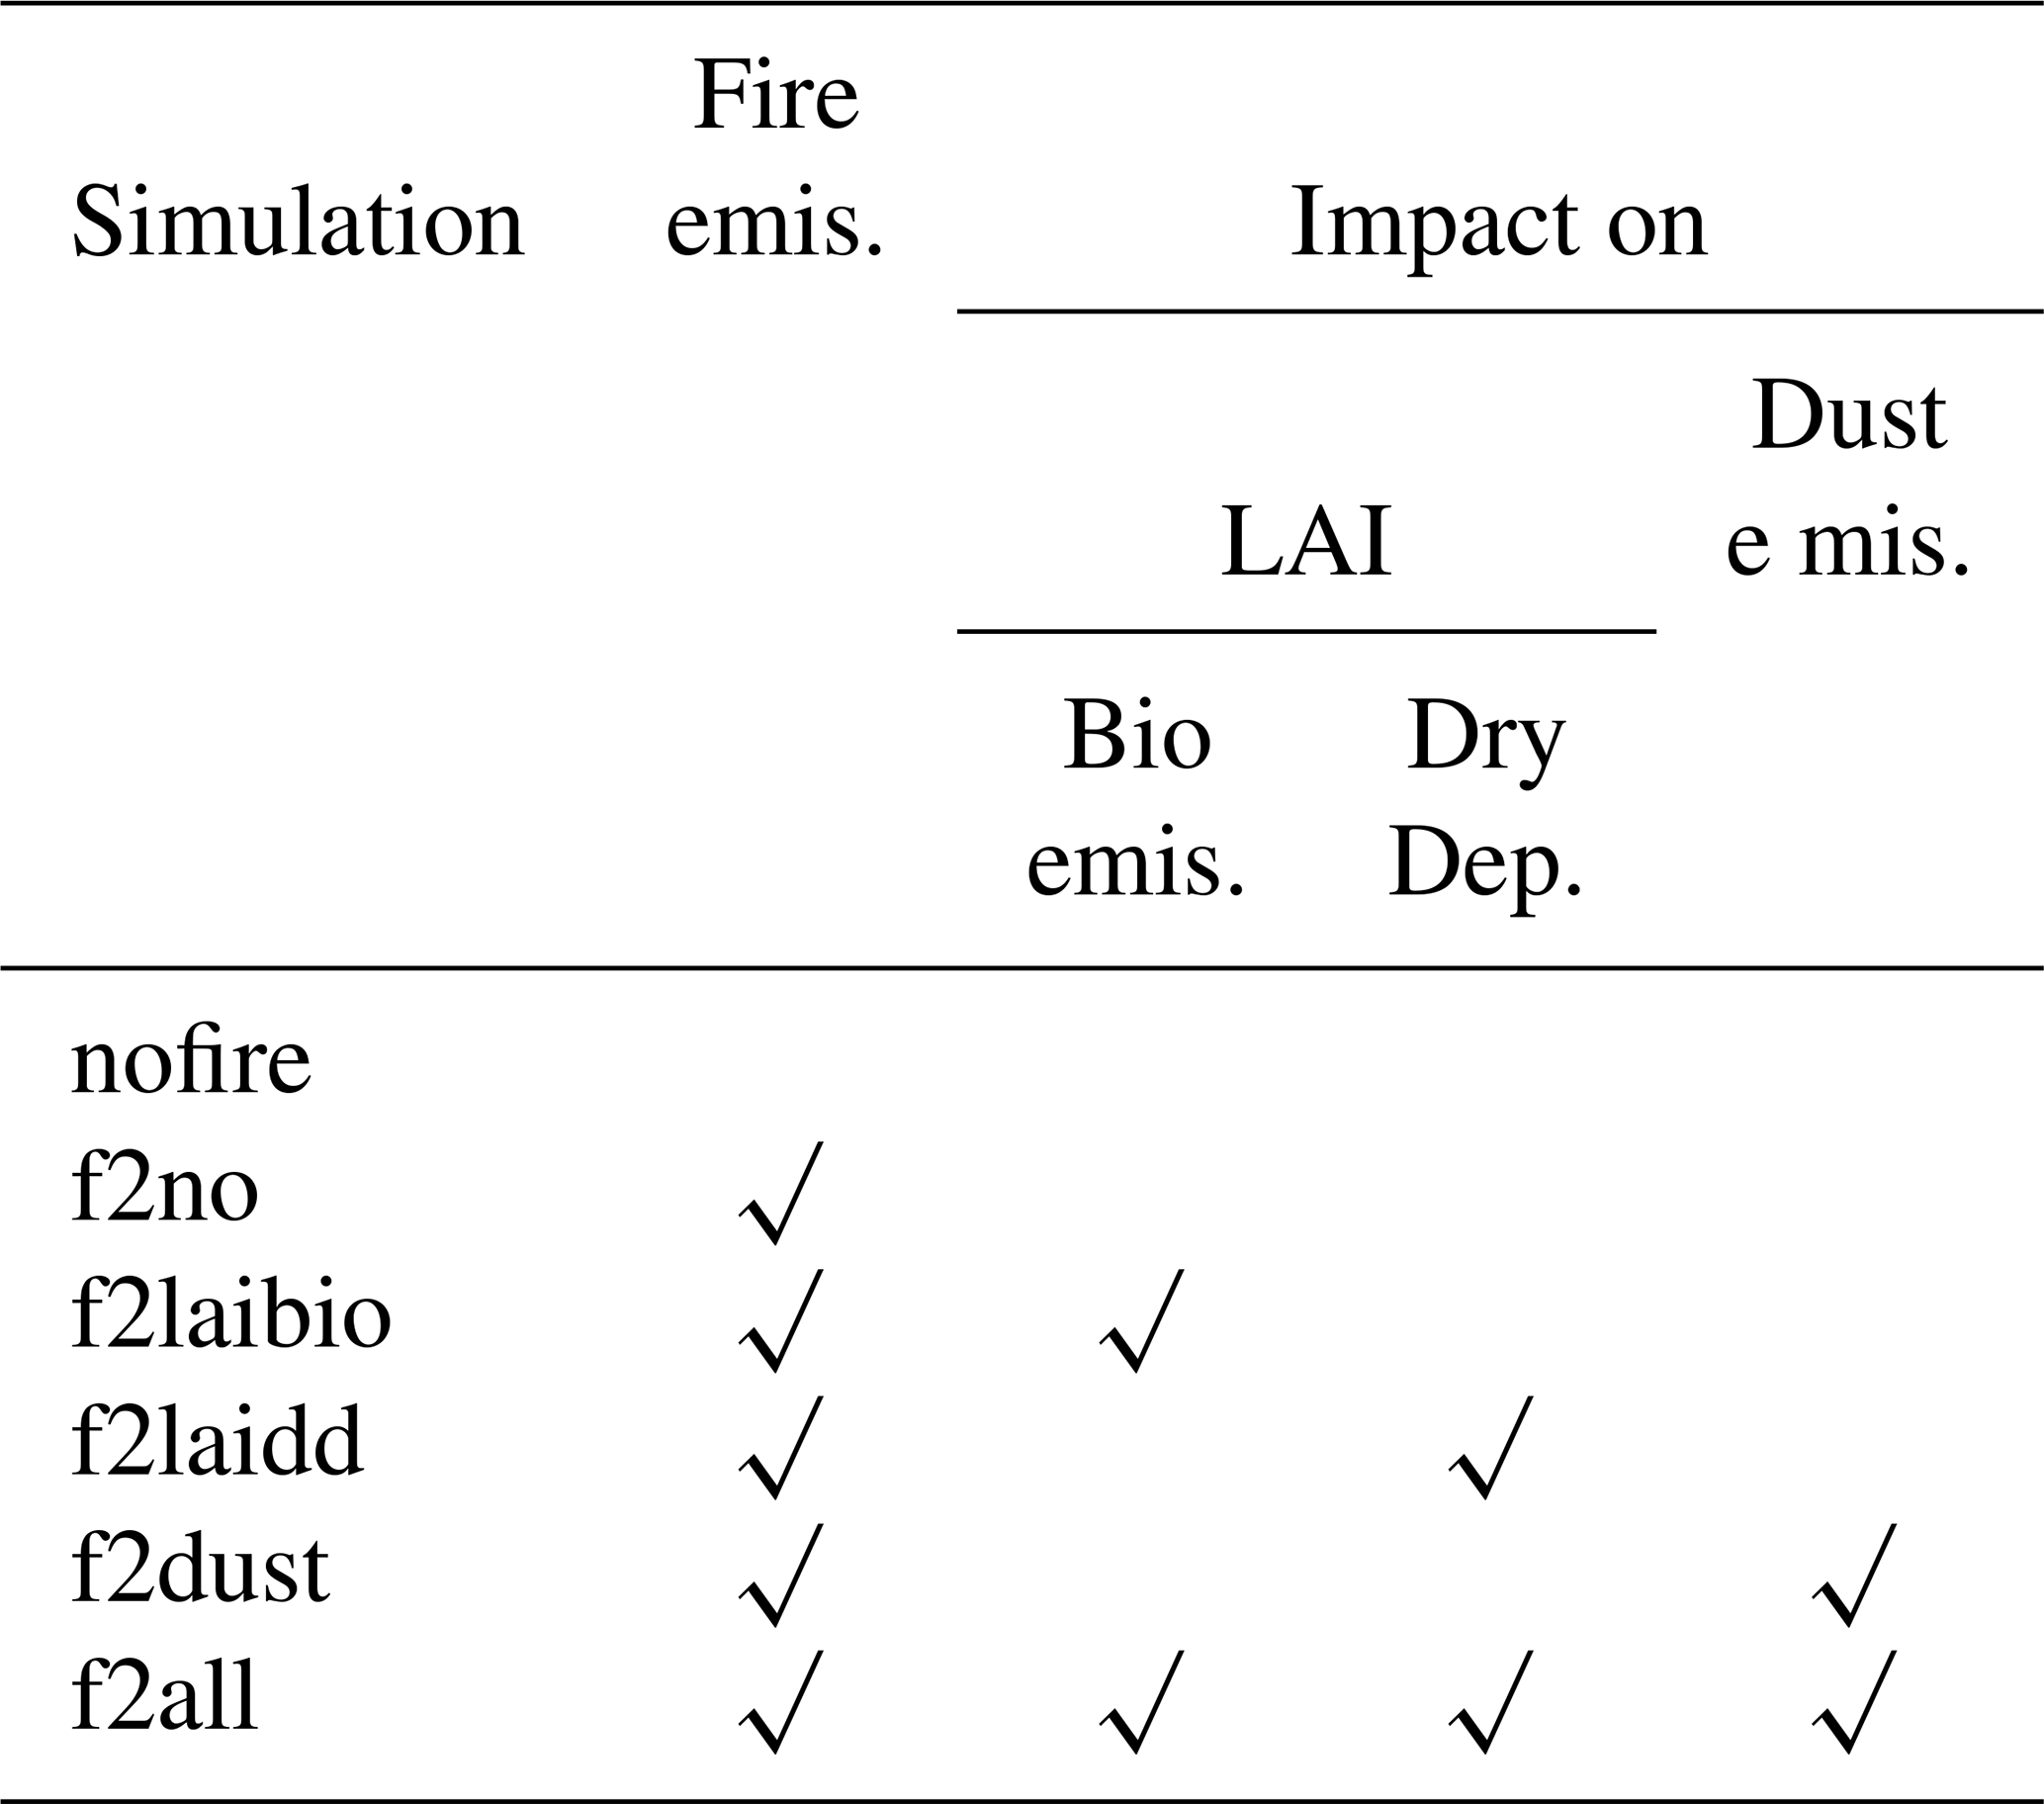
Simulations designed for this study are summarized in Table 1. They all have a common period of 15 June to 31 August 2022. The first one is called nofire and corresponds to the modeling with all emissions except the forest fires. The model is used in its offline version, meaning there are no retroactions from aerosols to meteorology. All other simulations are with the biomass burning emissions and have a name with “f” for fires. The first simulation with fires is called f2no and corresponds to the emissions of fires but without impact on other processes. It corresponds to the classical use of fire emissions in chemistry transport models: only a flux of chemical species is prescribed when a fire is detected. The simulation f2laibio is as f2no but with, in addition, the impact of the fires on the LAI used for the calculation of the biogenic emissions. The simulation f2laidd is as f2no but with, in addition, the impact of the fires on the LAI used for the dry deposition of gaseous species. The simulation f2dust is as f2no but with, in addition, the impact of the fires on the mineral dust emissions as described in Menut et al. (2022a). Finally, the simulation f2all is the more realistic, taking into account both emissions of the fires and interactions between fire emissions and surface properties (on LAI for biogenic emissions and dry deposition) and mineral dust emissions.
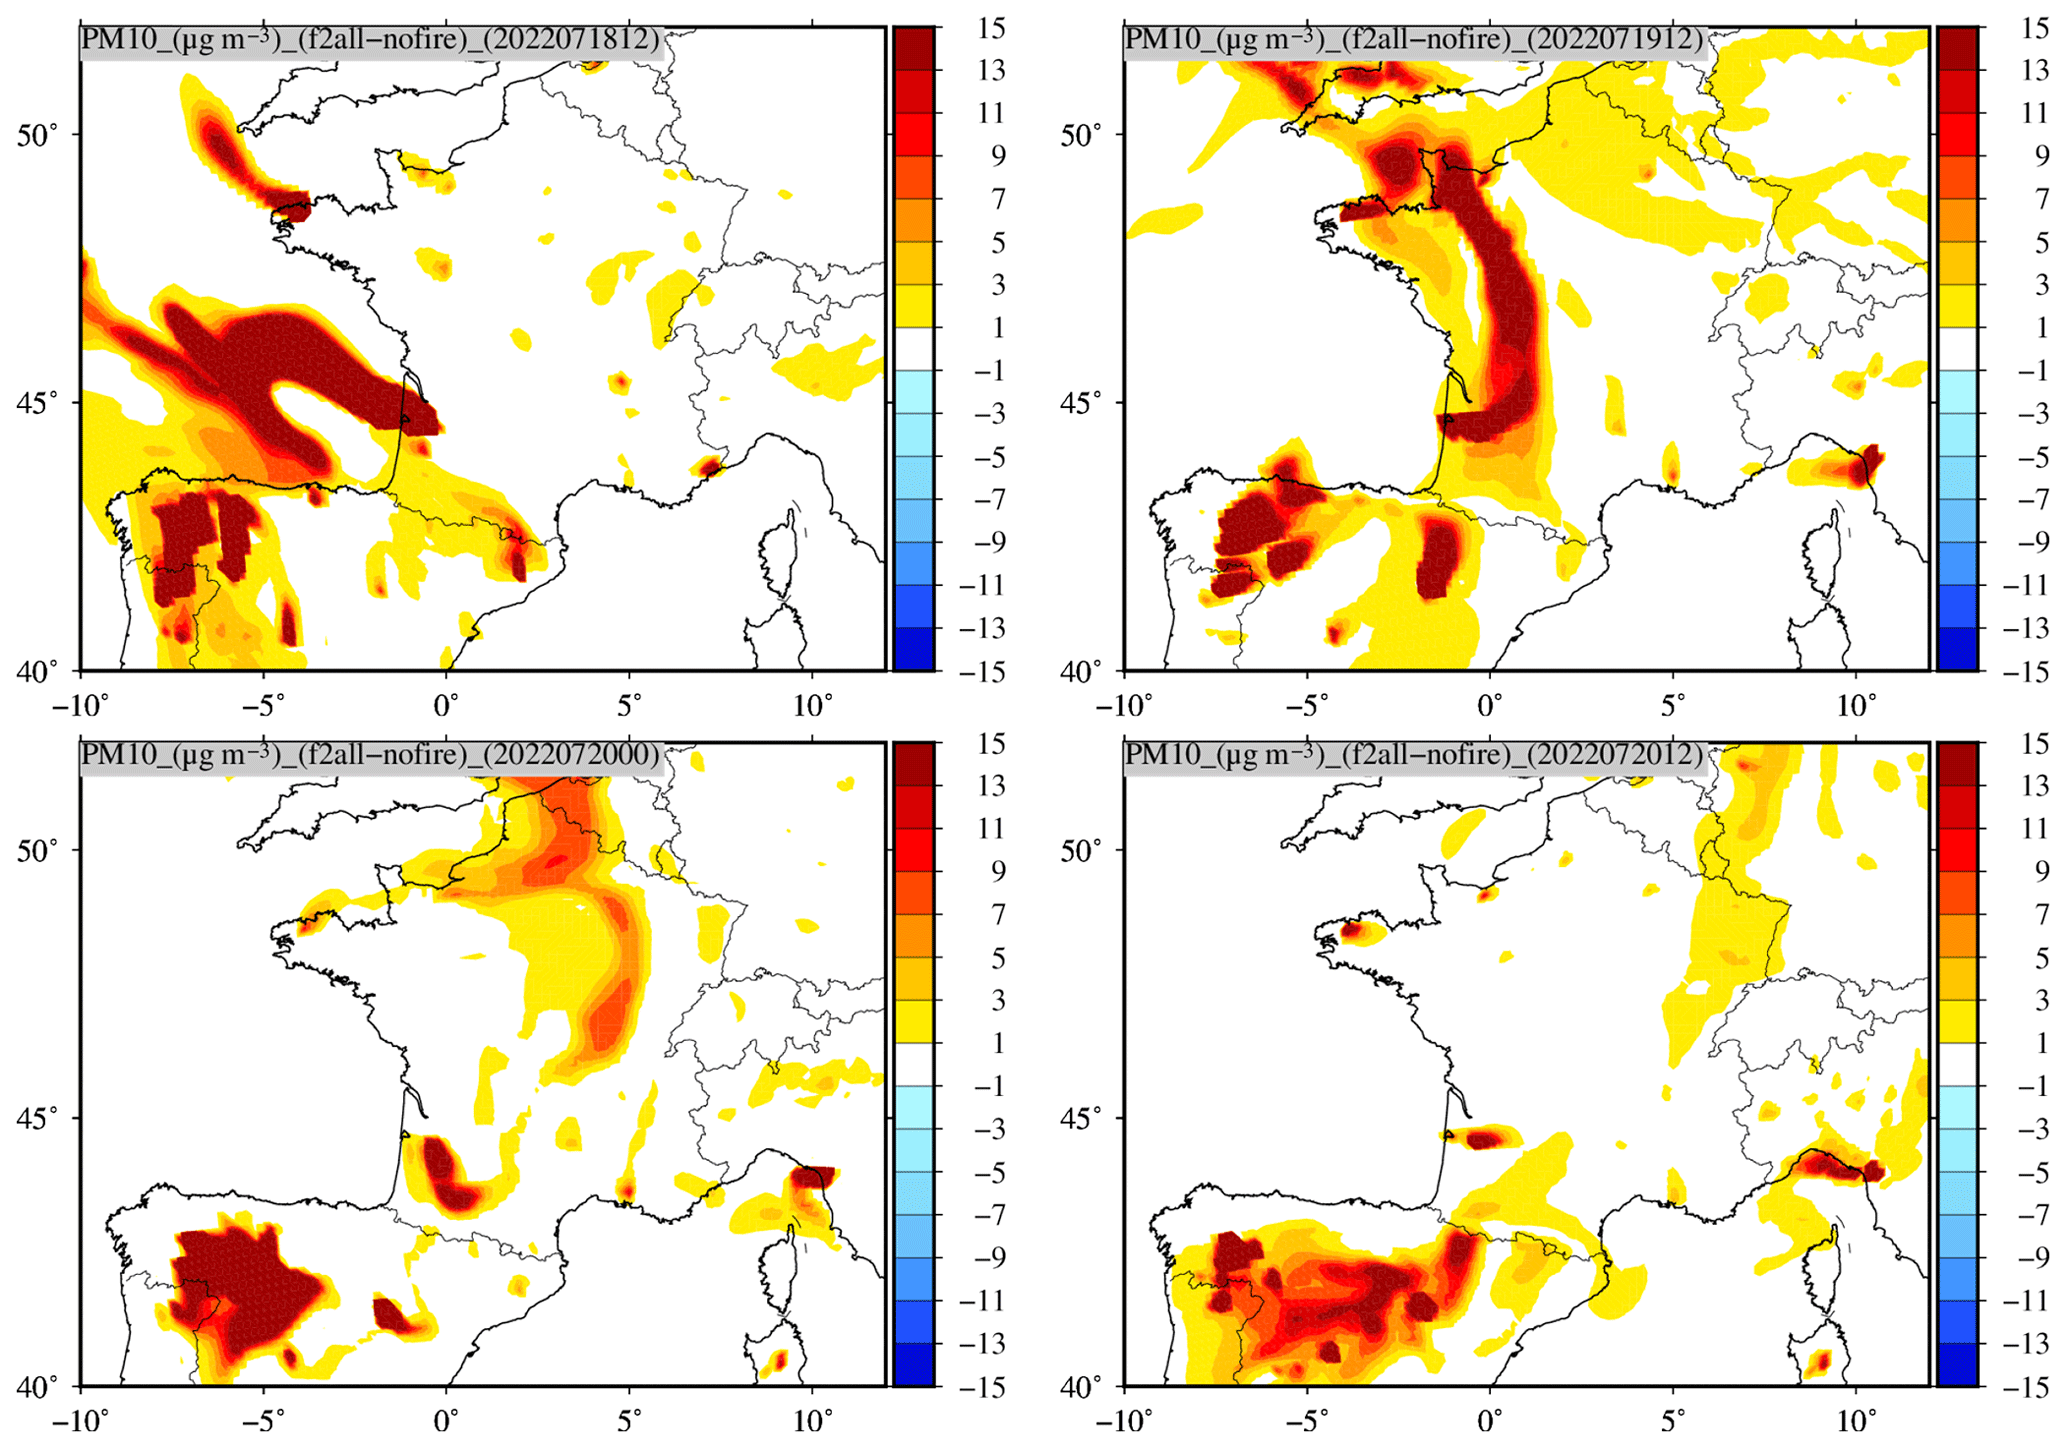
Figure 5Maps of surface concentrations of PM10 (µg m−3) for the 18 July 2022 at 12:00 UTC, 19 July 2022 at 12:00 UTC and 20 July 2022 at 00:00 and 12:00 UTC.
The first goal of this study is to have a reference case able to quantify what would have been the atmospheric composition if the observed fires had not existed. For this question, we will use the f2all–nofire differences. The second question is to know the impact of the retroactions of fires on dust emissions and the LAI parameter. We will then use in this case the differences between the simulations with impacts against the f2no simulation. The analysis of the simulation is performed from 1 July to 31 August 2022. The simulated period from 15 to 30 June considered as a spin-up period is not analyzed.
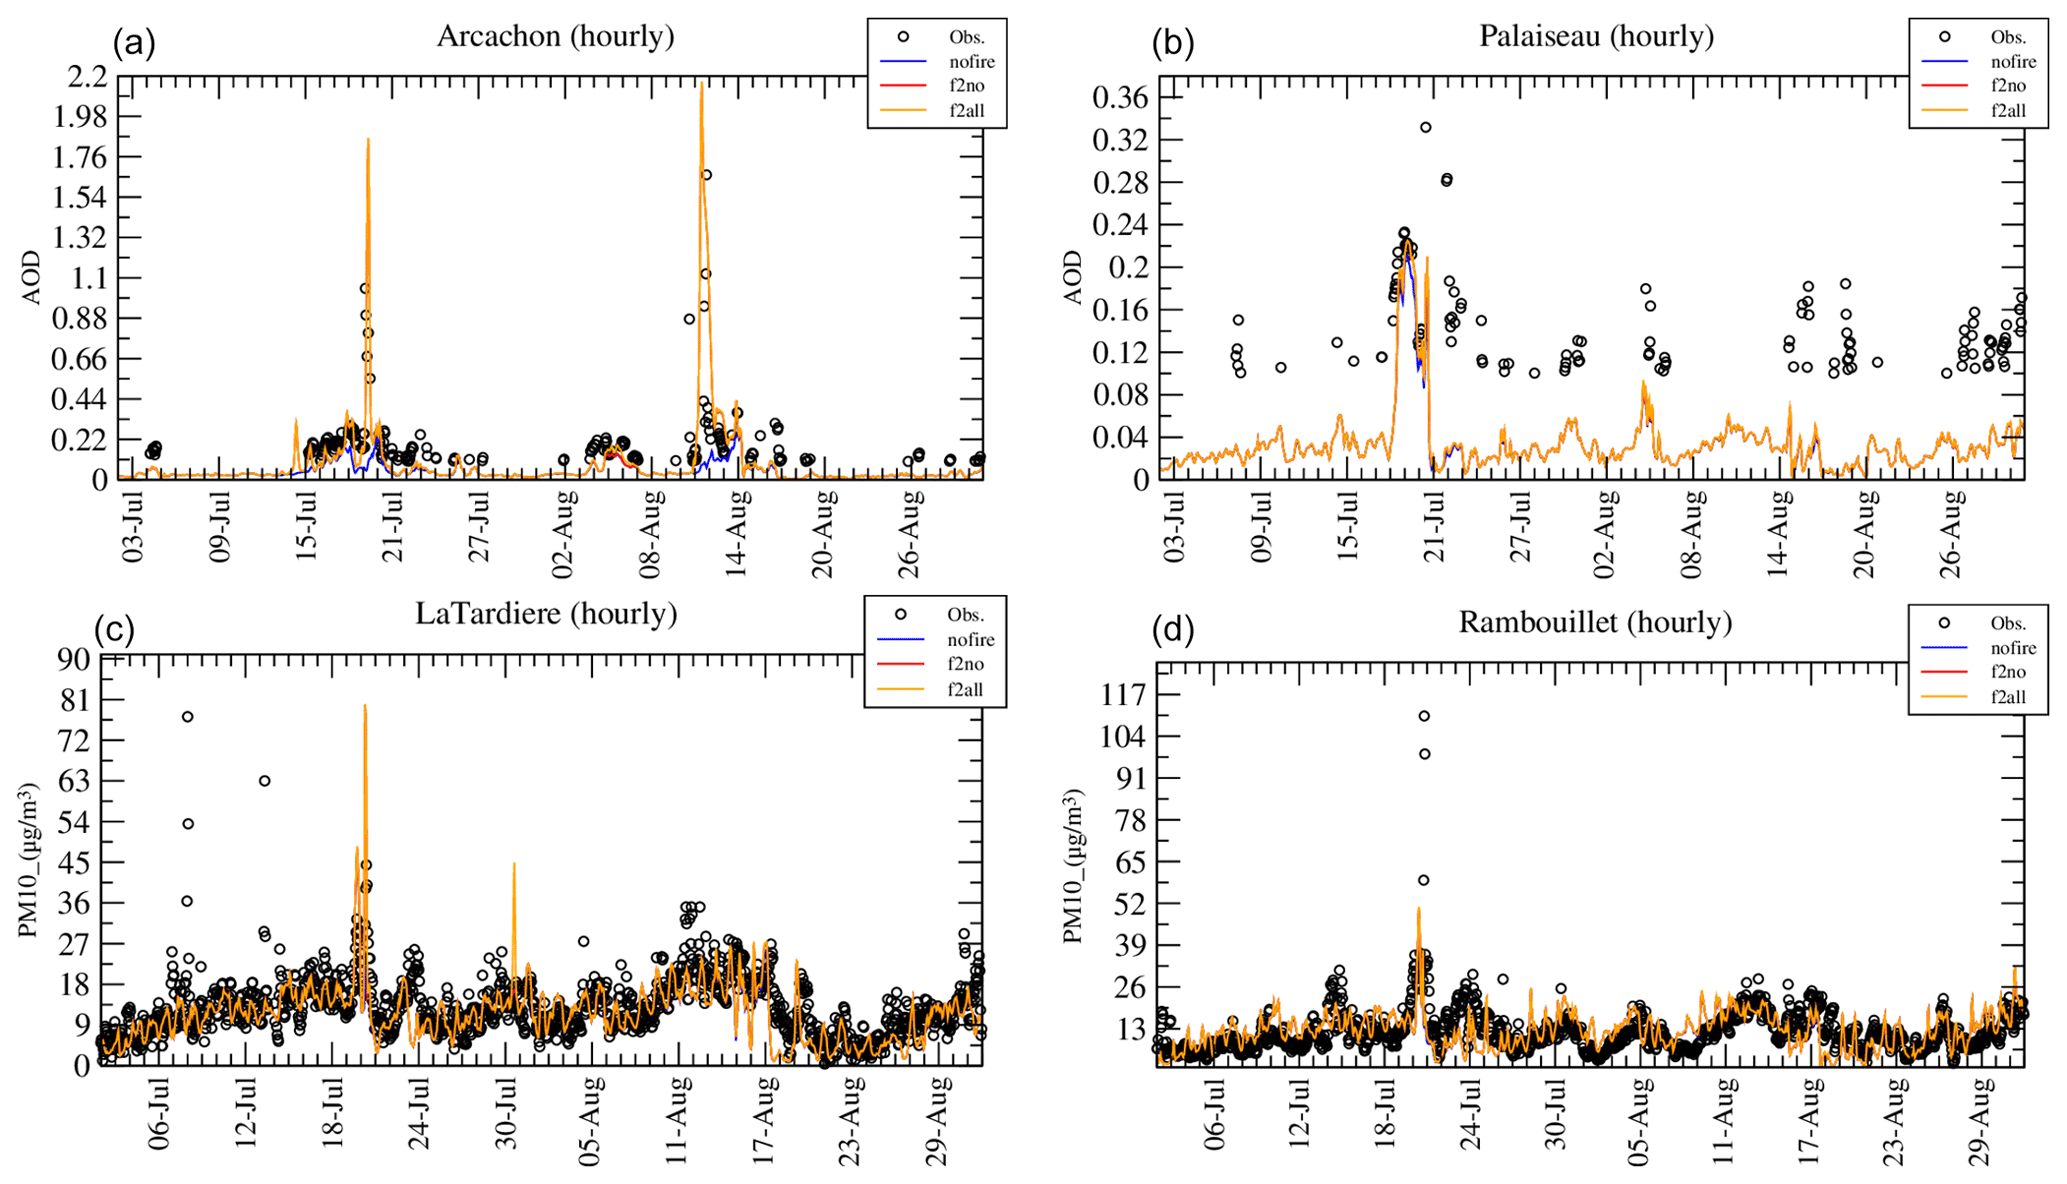
Figure 6Time series of (a, b) hourly aerosol optical depth in Arcachon and Palaiseau and (c, d) PM10 surface concentrations in La Tardiere and Rambouillet. The three model simulations nofire, f2no and f2all are compared to the measurements of AERONET (AOD) and EEA (PM10).
2.4 The observations
Several types of observations are used to quantify the model ability to reproduce these events. First, measurements from surface stations are used. The European Environment Agency (EEA; https://www.eea.europa.eu, last access: 29 June 2023) provides a full set of hourly data for several pollutants such as particulate matter PM2.5 and PM10, ozone (O3) and nitrogen dioxide (NO2) for a large number of stations in western Europe. Only urban, rural and suburban background stations are used, considering that the industrial and traffic ones have an inadequate spatial representativity for model outputs with a spatial resolution of Δx = 15 km. The AErosol RObotic NETwork (AERONET; https://aeronet.gsfc.nasa.gov/, last access: 29 June 2023) level 1.5 measurements are used (Holben et al., 2001). The AOD at a wavelength of λ=675 nm is daily averaged and compared to daily averaged modeled values. Maps of the stations for which the measurements were used are presented in Fig. 2. The detailed names and location of these stations are provided in Tables A1 and A2. The map of the AERONET stations shows the entire modeled domain. The second map is a zoom on the region that we will study in more detail. Note that the stations closer to the studied fires are Airvault (FR09304), La Tardiere (FR23124), Aytre (FR09008) and Zoodyss (FR09302).
Second, and in order to have information on the vertical, Cloud-Aerosol Lidar Pathfinder Satellite Observation (CALIPSO) lidar data are used. The Cloud-Aerosol Lidar with Orthogonal Polarization (CALIOP) lidar measurements, on-board the CALIPSO satellite (Winker et al., 2010), are analyzed to obtain an aerosol sub-type classification (CALIOP v4.10 product), as proposed in Omar et al. (2010) and Burton et al. (2015). Limitations associated with this aerosol classification are described in Tesche et al. (2013). For the model, a specific development was performed as described in Menut et al. (2018), using aerosol concentrations to reproduce the categories chosen by the CALIPSO team.
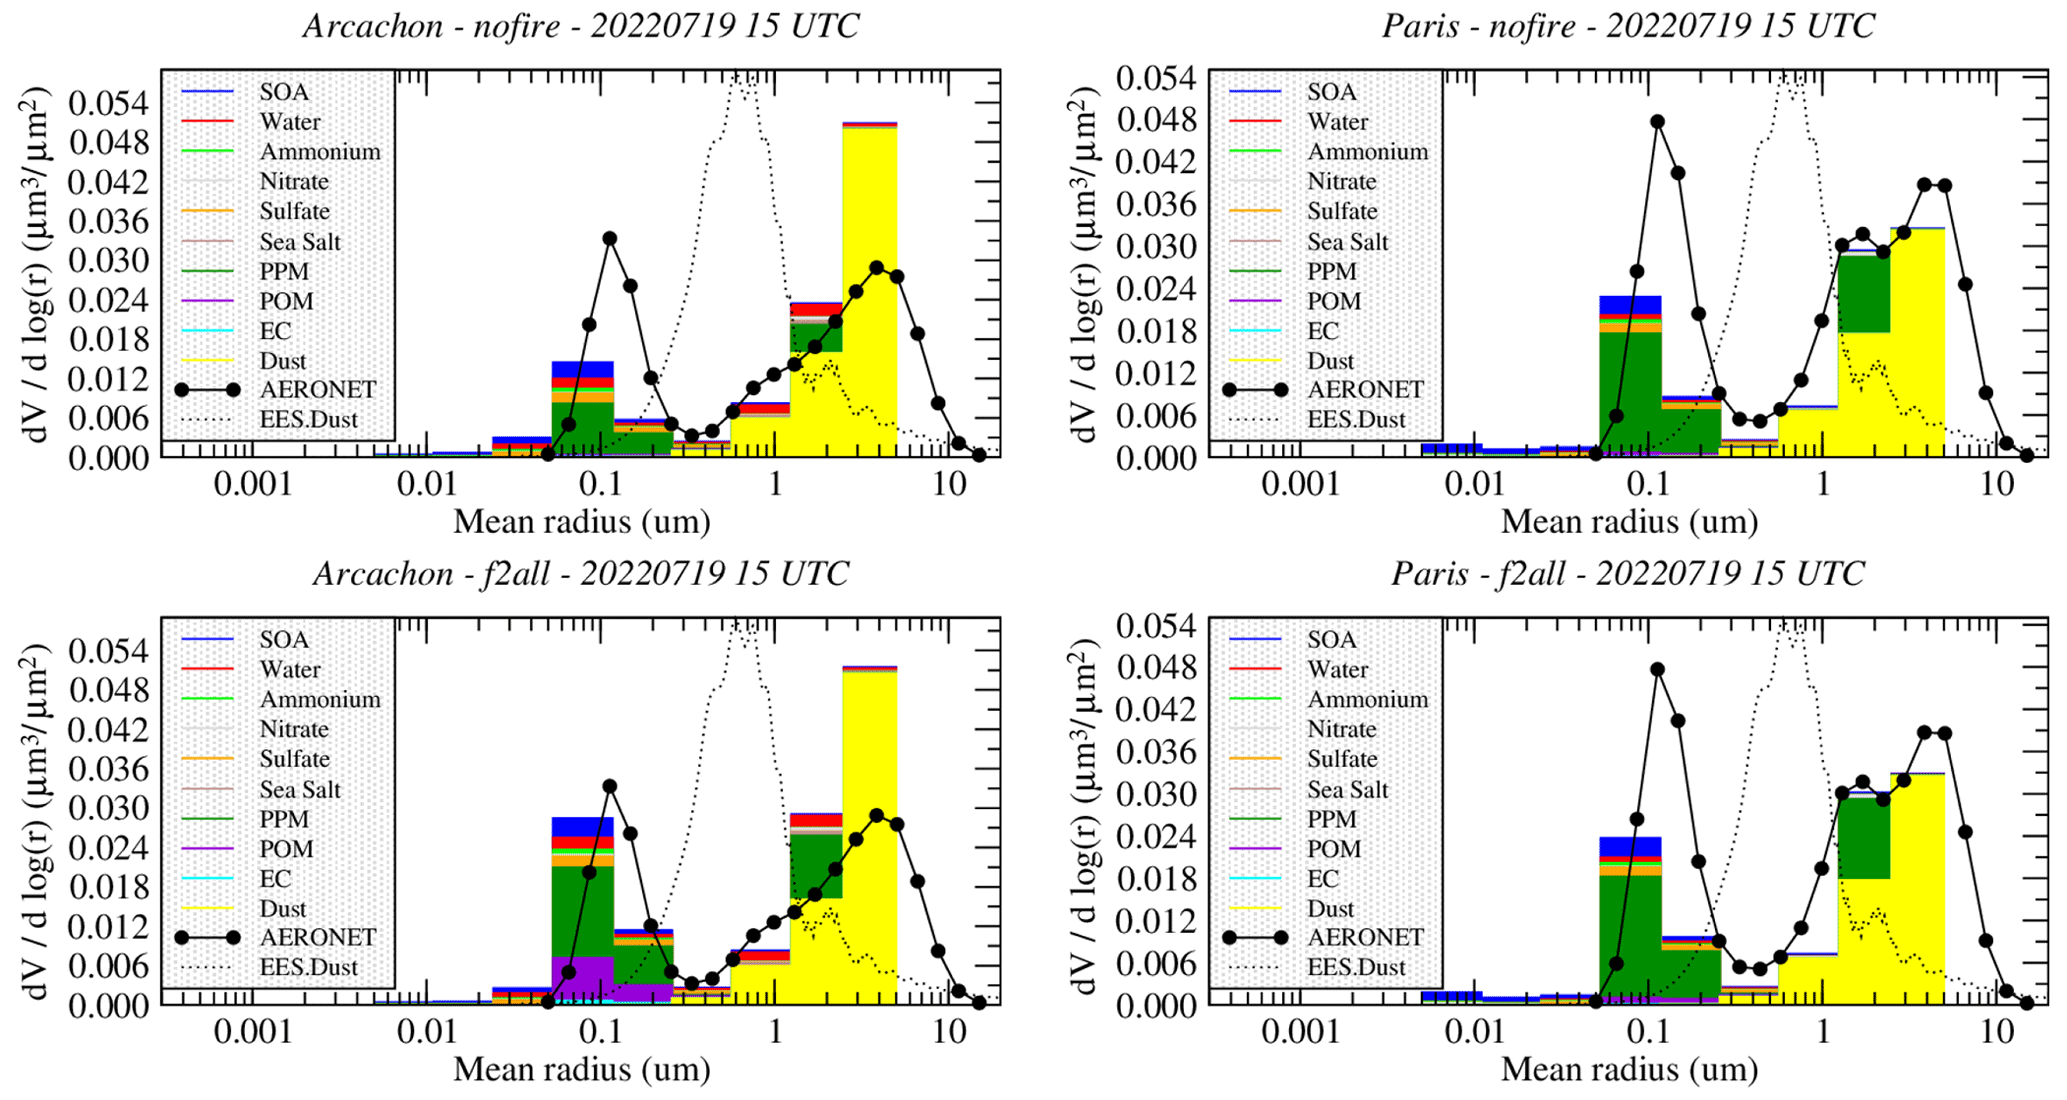
Figure 7Aerosol size distribution and composition for the 19 July 2022 at 15:00 UTC and for the stations of Arcachon and Paris. Model outputs are compared to the AERONET product. The dashed line represents the efficient extinction section (EES) calculated for mineral dust and normalized to the maximum value of the model for the plot.
In this section, the impact of fires on aerosol is analyzed, first on the aerosol surface concentrations and second on the aerosol optical depth (AOD).
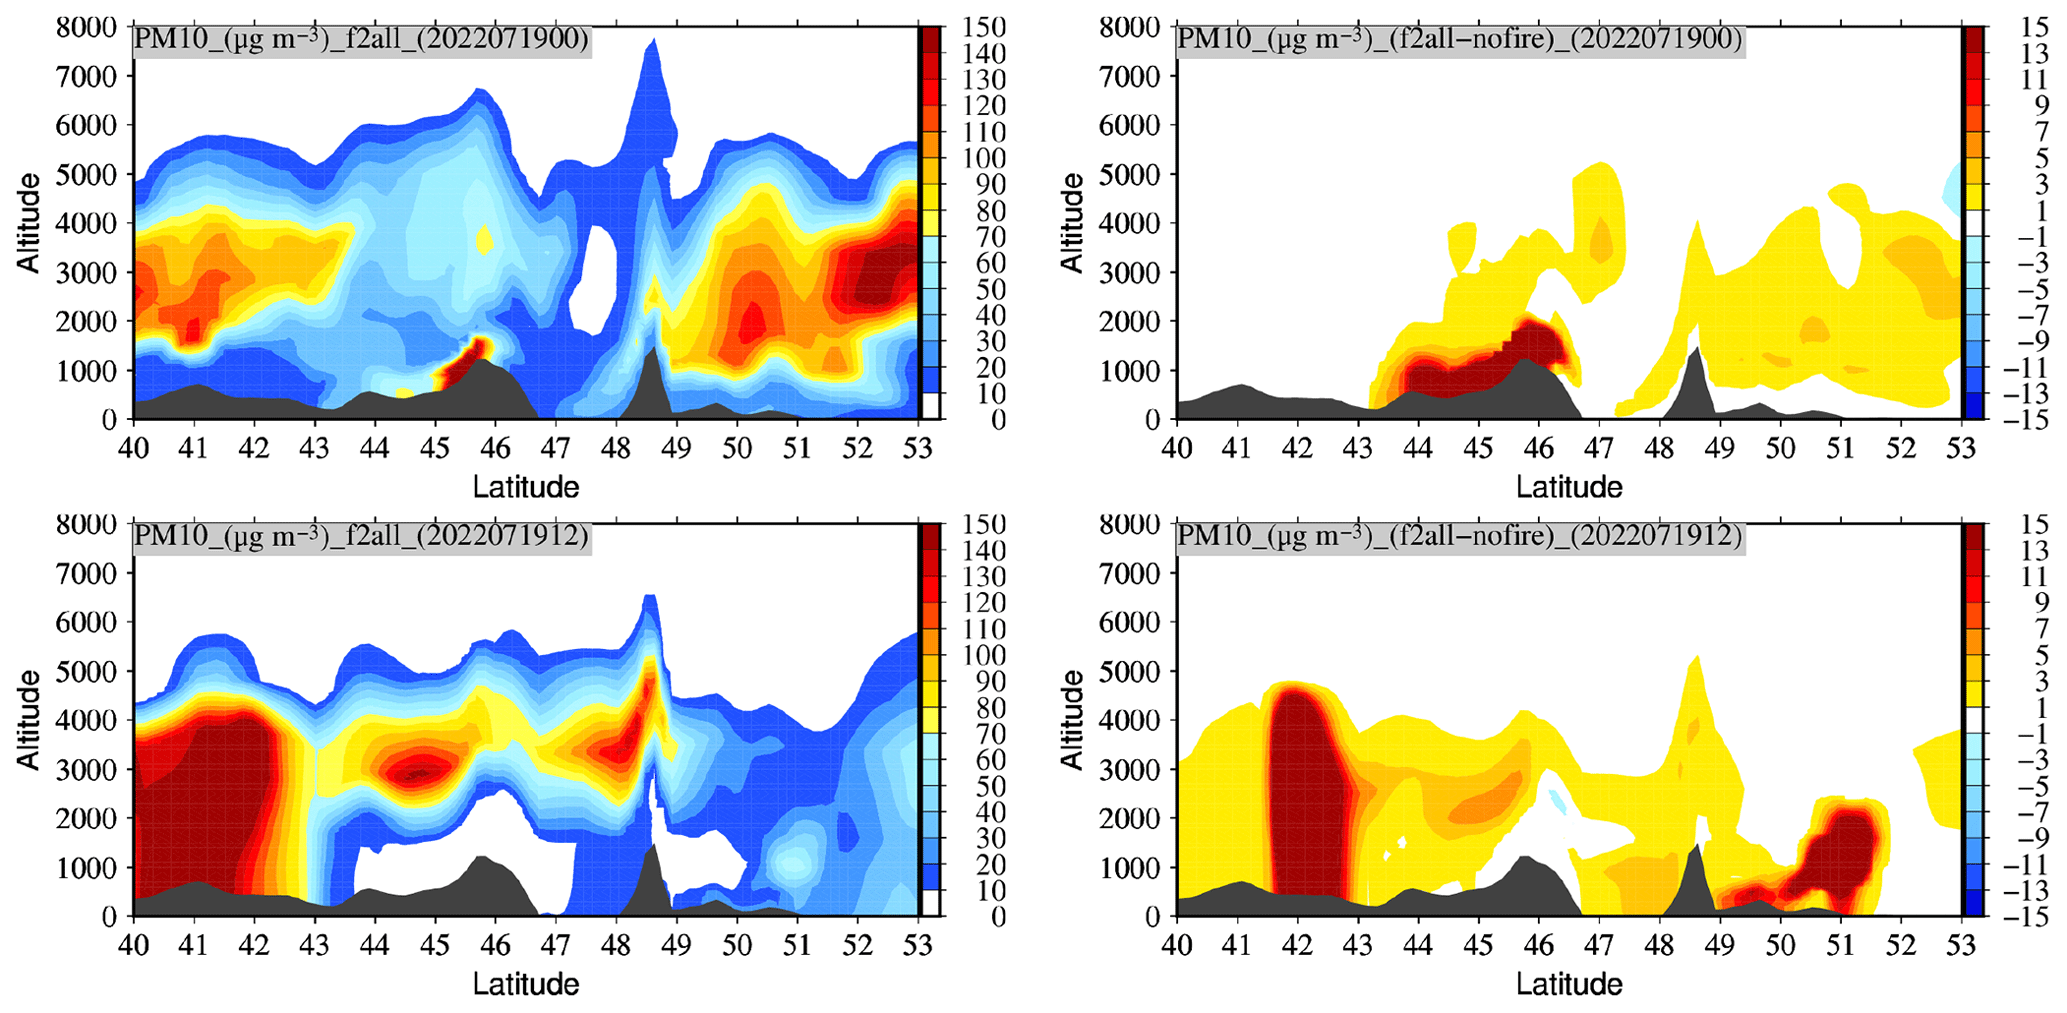
Figure 8Differences between f2all and nofire simulations for the PM10 concentrations at longitude −1∘ E and for the 19 July at 00:00 and 12:00 UTC.
3.1 Impact of fires on PM10 surface concentrations
The first question is to know if Landes fires have changed the surface concentrations of pollutants close to the source or downwind. Figure 4 presents time series of PM10 hourly surface concentrations (in µg m−3). The presented time period is reduced to 18 to 22 July 2022 in order to have a more precise view of the fire event of 19 July. Time series are presented for the two sites of La Tardiere (close to the fires) and Rambouillet (in the Paris area) and for the simulation f2all. In addition, the time series presents the modeled chemical composition of the PM10. This information is not available with the measurements which only provide the total mass. For the La Tardiere stations, two peaks of PM10 are observed and correctly modeled. The first one occurs on the 18 July and corresponds to mineral dust. There is also primary particle matter (PPM) concentrations, but they are as a background during the whole period and correspond to resuspension in this agricultural and forest region. The second peak corresponds to the forest fires. The model overestimates the measurements and is composed of primary organic matter (POM). The predominance of this species in the aerosol composition is a signature of the biomass burning. On 21 July at midnight, concentration shows larger values of water in the aerosol composition due to a change in the meteorology and advection of maritime air. For the same site, the time series of differences between f2all and nofire are presented. It shows that the only difference between the two simulations occurs the 19 July and is half composed of POM and half composed of PPM. Far from the fires, in Rambouillet, the time series of the f2all simulation shows that a similar peak of dust is modeled and corresponds to an observed peak. It occurs on 19 July (in place of 18 July in La Tardiere) and corresponds to the transport of the mineral dust plume over France. The second peak, corresponding to the transport of the fires plumes, is underestimated by the model but present and visible in the time series of differences. When the additional PM10 surface concentration due to fires is ≈ 70 µg m−3 in La Tardiere, it is only ≈ 10 µg m−3 in Rambouillet.
In order to have another point of view on PM10 surface concentrations, maps are presented in Fig. 5. These maps display the differences between the two simulations f2all and nofire to spatialize the transport of the biomass burning plumes and to quantify their impact far from the fire areas. The first map represents the 18 July at 12:00 UTC. In France, two main fires are observed: in Landes and in Brittany. The wind has the same direction and the plume is transported westward over the Atlantic sea. For this day, there is a priori no impact on land in France. The only impact may be in the south, under the plumes of Portuguese fires. The second map presents the concentrations for the 19 July at 12:00 UTC. The wind has turned and is now from south to north. The fire plume goes towards Brittany, Normandy and Belgium and passes to the west of the Parisian region. The third map is for the 20 July at 00:00 UTC. The plume over France is diluted and is split in two parts: one in the south and one in the north of the Paris area. This explains the underestimation of the model for the stations in the Paris area. The fourth and last map presents the concentrations for the 20 July at 12:00 UTC. Differences of surface concentrations are now low, except just over the active fires in Landes and Brittany. High differences are modeled over Spain and Portugal but impact moderately the surface concentrations in the south of France. Finally, the impact of fires induces positive differences only, indicating that the negative feedbacks from fire emissions do not outweigh the effects of direct emissions and positive feedbacks at any location. The timing of the sources and the transport is realistic.
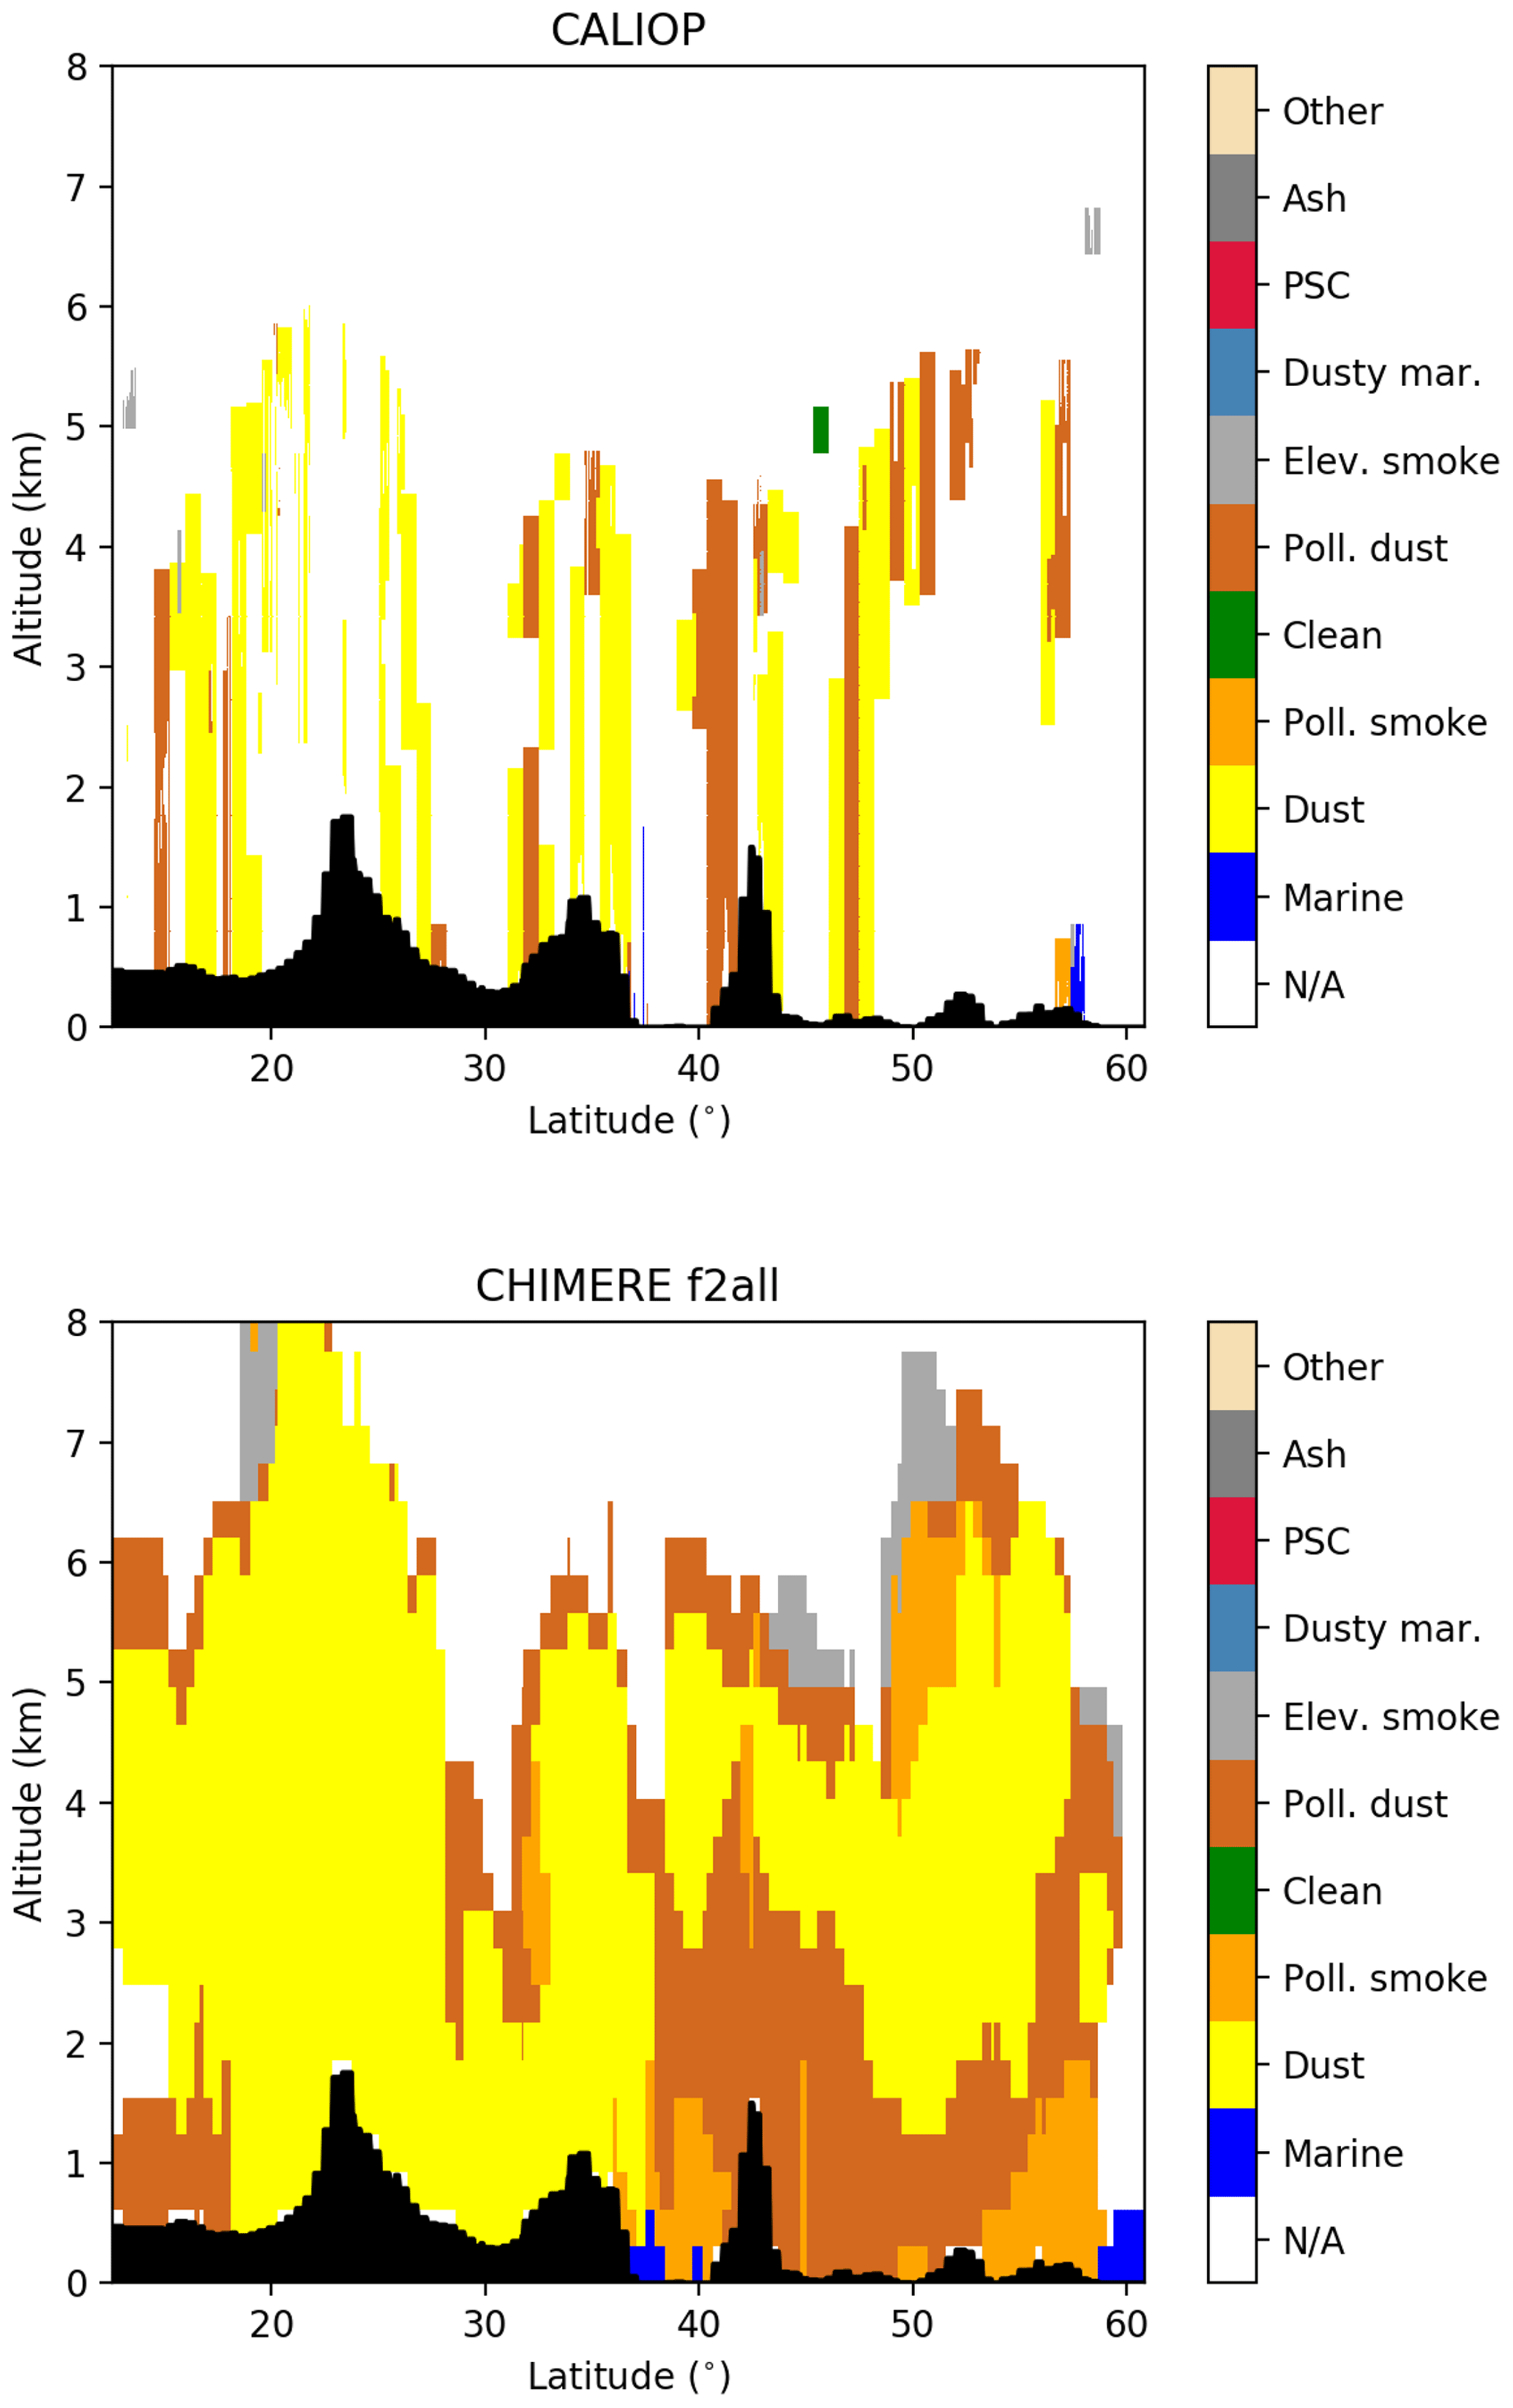
Figure 9CALIOP and CHIMERE vertical aerosol classification for the 18 July 2022 at 13:51 UTC.
3.2 Comparisons to AERONET measurements
Comparison of model concentrations against measurements are also performed for the aerosol optical depth (AOD) using AERONET measurements. Results are presented in Fig. 6 for the stations of Arcachon (close to the fires) and Palaiseau (close to Paris). In Arcachon, two important peaks are measured and modeled on 19 July and 10 August. The model is able to retrieve these peaks at the right time. The differences between the curves show this is only the impact of fires. For Arcachon, we can note that only the first peak is present on the PM10 time series in La Tardiere (close to Arcachon and the fires). It means that the fires on 19 July are in the boundary layer and impact the surface concentrations but are probably at higher altitude on 10 August: they are visible on the AOD time series but not on surface concentrations. It is true both for the measurements and the model results. In Palaiseau, only the peak of 19 July is visible on the AOD time series. It is the same for the PM10 surface concentrations in Rambouillet (close to Palaiseau). But in this latter case, model values are underestimated: when the model simulates a peak at ≈ 50 µg m−3, the measurements show high values at ≈ 110 µg m−3. It means that the plume coming from Landes reaches the Paris area but is simulated too low compared to the measurements.
In order to refine the analysis on PM10 surface concentrations, the modeled aerosol composition is presented in Fig. 7 as size distribution. Depending on the data availability, results are presented here for Arcachon and Paris and for the 19 July at 15:00 UTC. Two simulation results are compared to measurements: nofire and f2all. For the four plots of Fig. 7, the same kind of distribution is calculated: two modes are modeled – a fine mode with a mean mass median diameter Dp ≈ 0.1–0.2 µm and a coarser mode with Dp ≈ 1–6 µm. The fine mode is composed of all kinds of modeled aerosols, with a dominant part of PPM, which is here due to resuspension. For the coarse mode, the most important contribution of the composition is mineral dust.
In Fig. 7, note that the efficient extinction section (EES and noted (z,λ)) coefficient is superimposed (in dashed line). This coefficient is used for the AOD calculation, τext (λ,z), for one atmospheric layer depth Δz and one specific wavelength λ (Stromatas et al., 2012), as follows:
with the extinction coefficient (by particles), (z,λ) (m−1), as
where Qext is the extinction efficiency, depending on the refractive index (η), the particle radius (R) and the wavelength (λ), and Np is the particle concentration in number (m−3). For Fig. 7, the EES is normalized to have the same order of magnitude as the maximum of concentration. It appears that its maximum corresponds to a minimum of concentration in the size distribution: the AOD calculation is very sensitive to the size distribution and the number of bins of the model (even if here it is concentrations at the surface only).
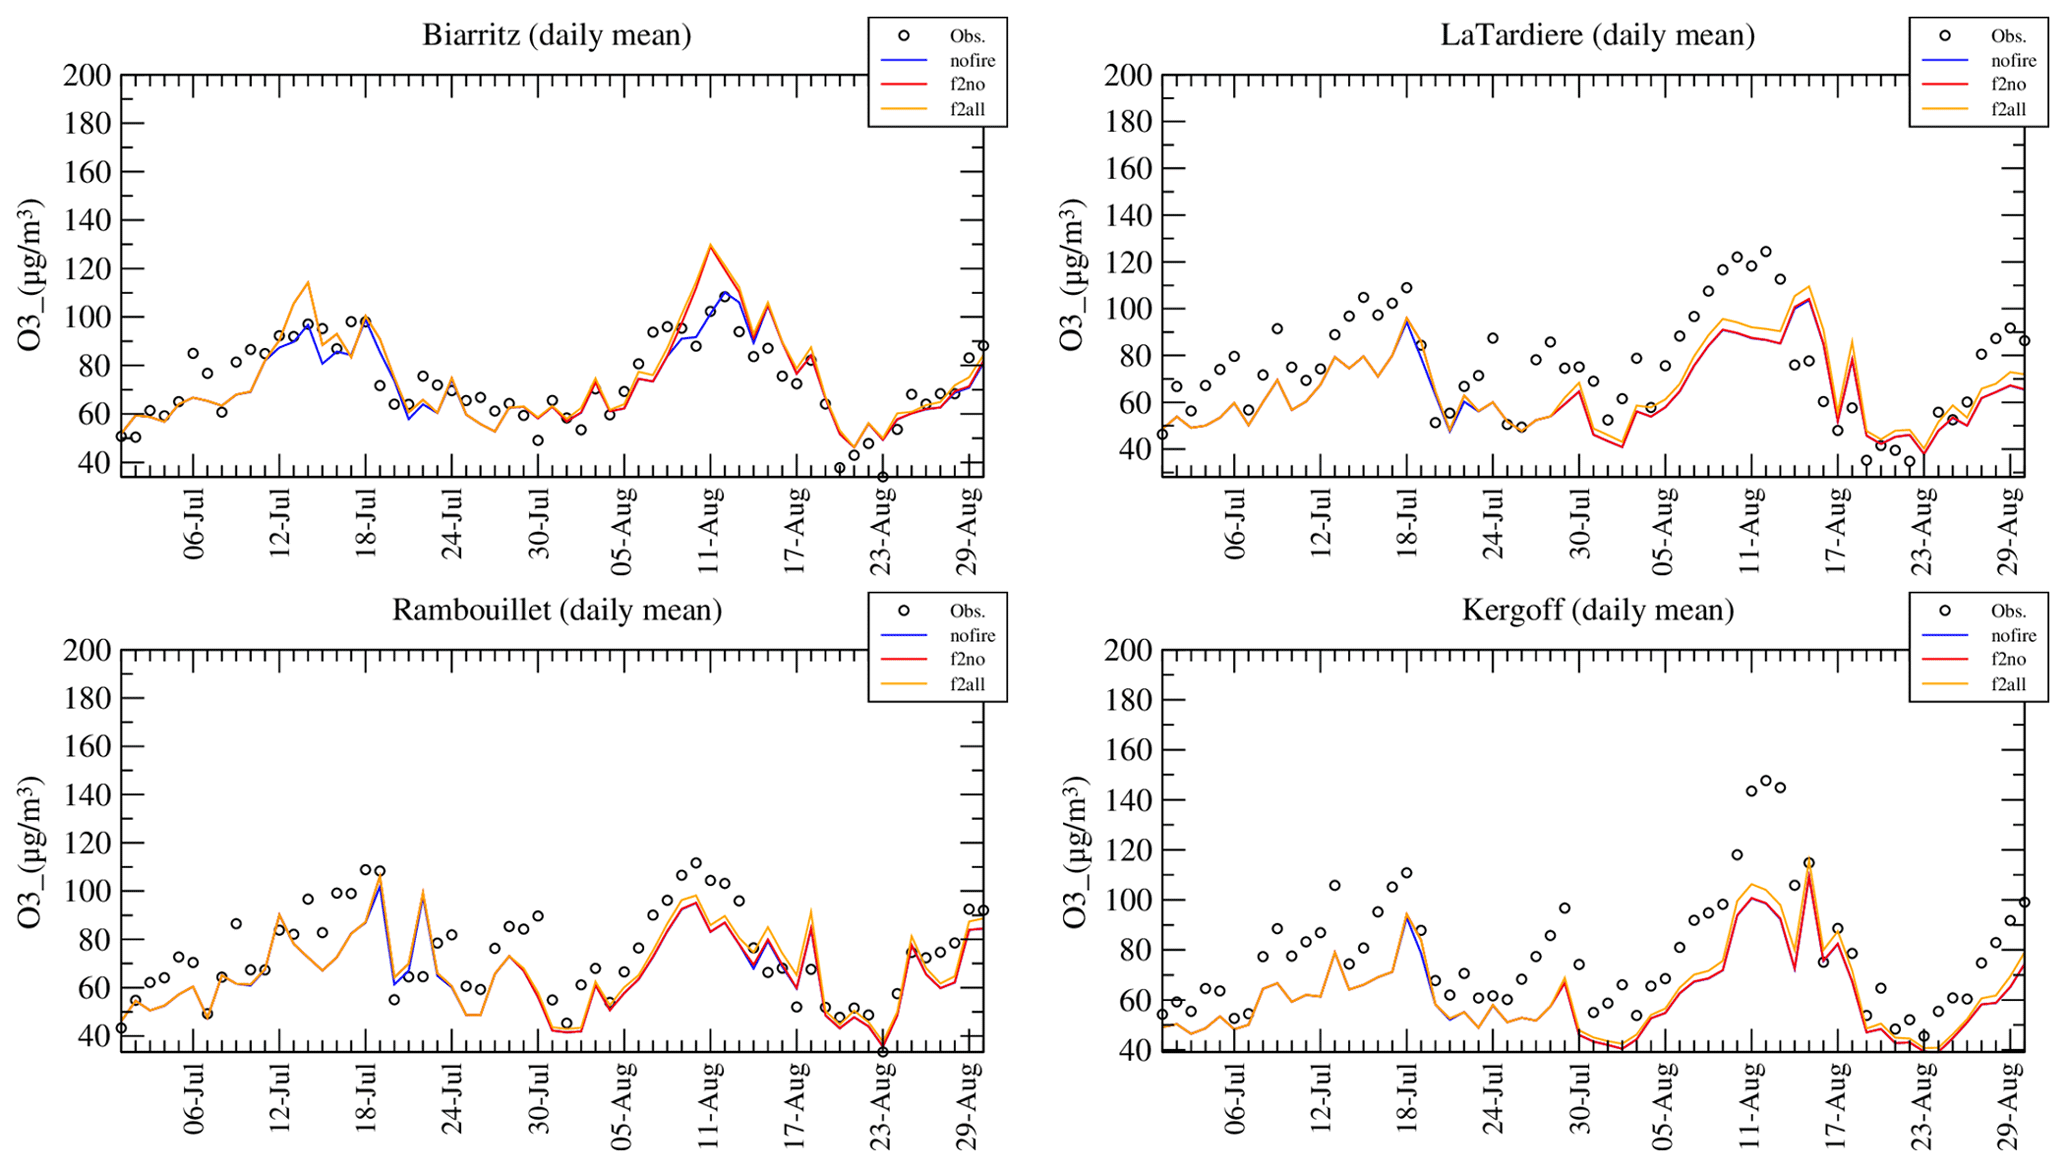
Figure 10Time series of daily averaged surface ozone concentrations in Biarritz, La Tardiere, Rambouillet and Kergoff.
The main difference between nofire and f2all is for the Arcachon site and the fine mode where a non-negligible contribution of PPM and POM is calculated in case of fires. It is the direct impact of biomass burning in the aerosol composition. However, there is no clear differences between the two simulations at the Paris site.
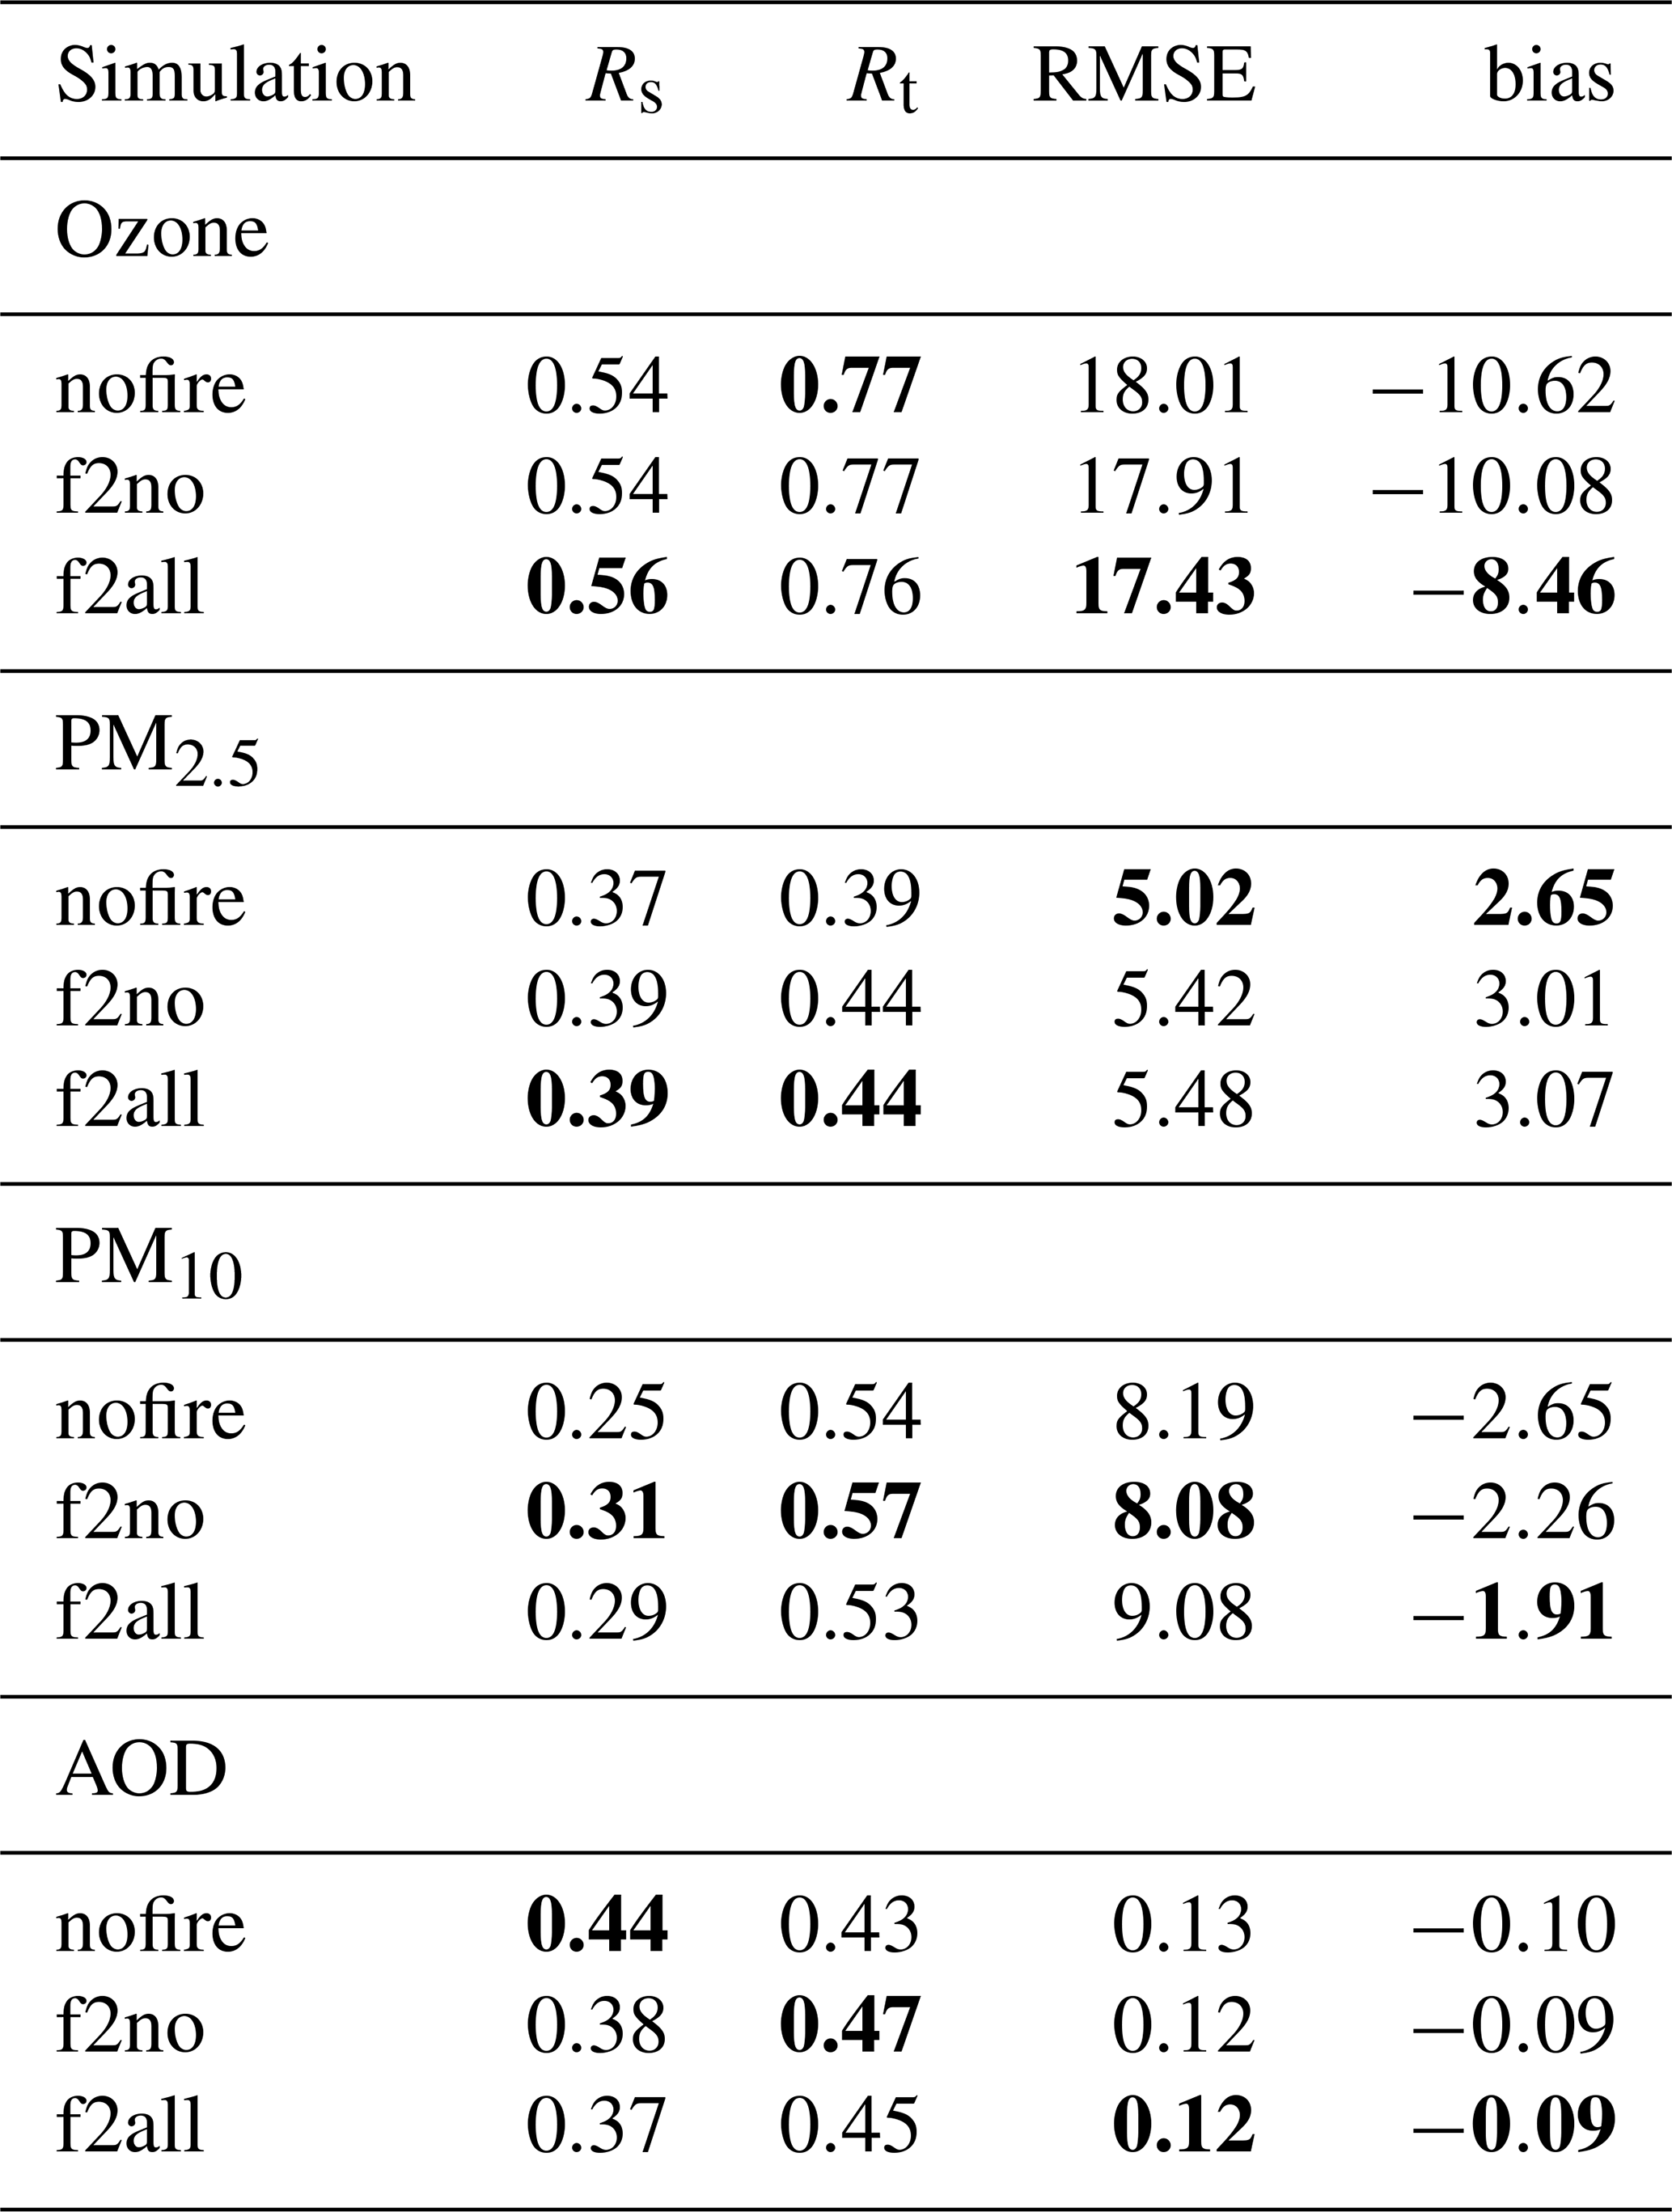
Table 2Statistical scores for the surface ozone, PM2.5, PM10 (µg m−3) concentrations and AOD (dimensionless) by comparison with EEA and AERONET measurements and the three simulations nofire, f2no and f2all. Scores are aggregated for all stations, and the spatial correlation is added to the temporal correlation. Calculations are done over the entire modeled period (July and August 2022). Bolded values are for the best scores for each pollutants and each model configuration.
3.3 Vertical transport of the fire plume
The differences between the time series of AOD and surface concentrations of PM10 show that the fire plume might have been transported aloft without high concentrations being present at the surface. To verify this hypothesis with the simulations, vertical sections are presented in Fig. 8. These cross-sections are presented for the simulation f2all and for the difference between the two simulations f2all–nofire. The figure presents an iso-longitude cross-section (for longitude −1∘, corresponding roughly to the longitude of the Landes fires). The latitude ranges from 40 to 53∘ N. Two periods are presented: 19 July at 00:00 and at 12:00 UTC. At 00:00 UTC, the is of PM10 are mainly in altitude between 2000 m and 4000 m a.s.l. Concentrations close to the surface are low and do not exceed 20 µg m−3.
Some maximums are modeled in altitude and for latitude between 40 and 43∘ N and between 49 and 53∘ N. For the latitude of the Paris area, there is low concentrations of PM10 over the whole atmospheric column at 00:00 UTC and close to the surface at 12:00 UTC. The differences between f2all and nofire show that the most important contribution of fires remains below 5000 m a.g.l. The maximum of differences is at latitude 44–46 N at 00:00 UTC and 42 and 50 N at 12:00 UTC. There is no important impact modeled for the latitude of the Paris area at ≈ 48∘ N.
In order to follow the wildfire plumes transported to the northeast, we compare model vertical cross-sections of aerosol concentrations to CALIOP lidar data. The CALIOP lidar is on-board the Cloud-Aerosol Lidar Pathfinder Satellite Observation (CALIPSO) satellite (Winker et al., 2010). Vertical lidar profiles are analyzed to obtain an aerosol sub-type classification (CALIOP v4.10 product), developed by Omar et al. (2010) and Burton et al. (2015). This classification is built on thresholds of lidar-derived optical characteristics. Of course, this estimation is uncertain and limitations are quantified in Tesche et al. (2013). For the CHIMERE model results, a specific development was done in Menut et al. (2018) to retrieve the same classification but based on all modeled aerosols. The comparison is presented in Fig. 9 for the dataset named CAL_LID_L2_VFM-ValStage1-V3-41.2022-07-18T13-51-17ZD. It corresponds to a trajectory quasi-iso-longitude, and the data are presented for the latitude from 10 to 60∘ N. The CALIOP data are scarce (white areas are for no data) but show that the aerosol plume is mainly between the surface and 5000 m a.g.l. It also shows that the aerosol composition is mostly dust and polluted dust. The same type of composition is modeled and analyzed with the model. The locations of the several types of dust are well retrieved by the model, showing that the modeled transport is realistic.
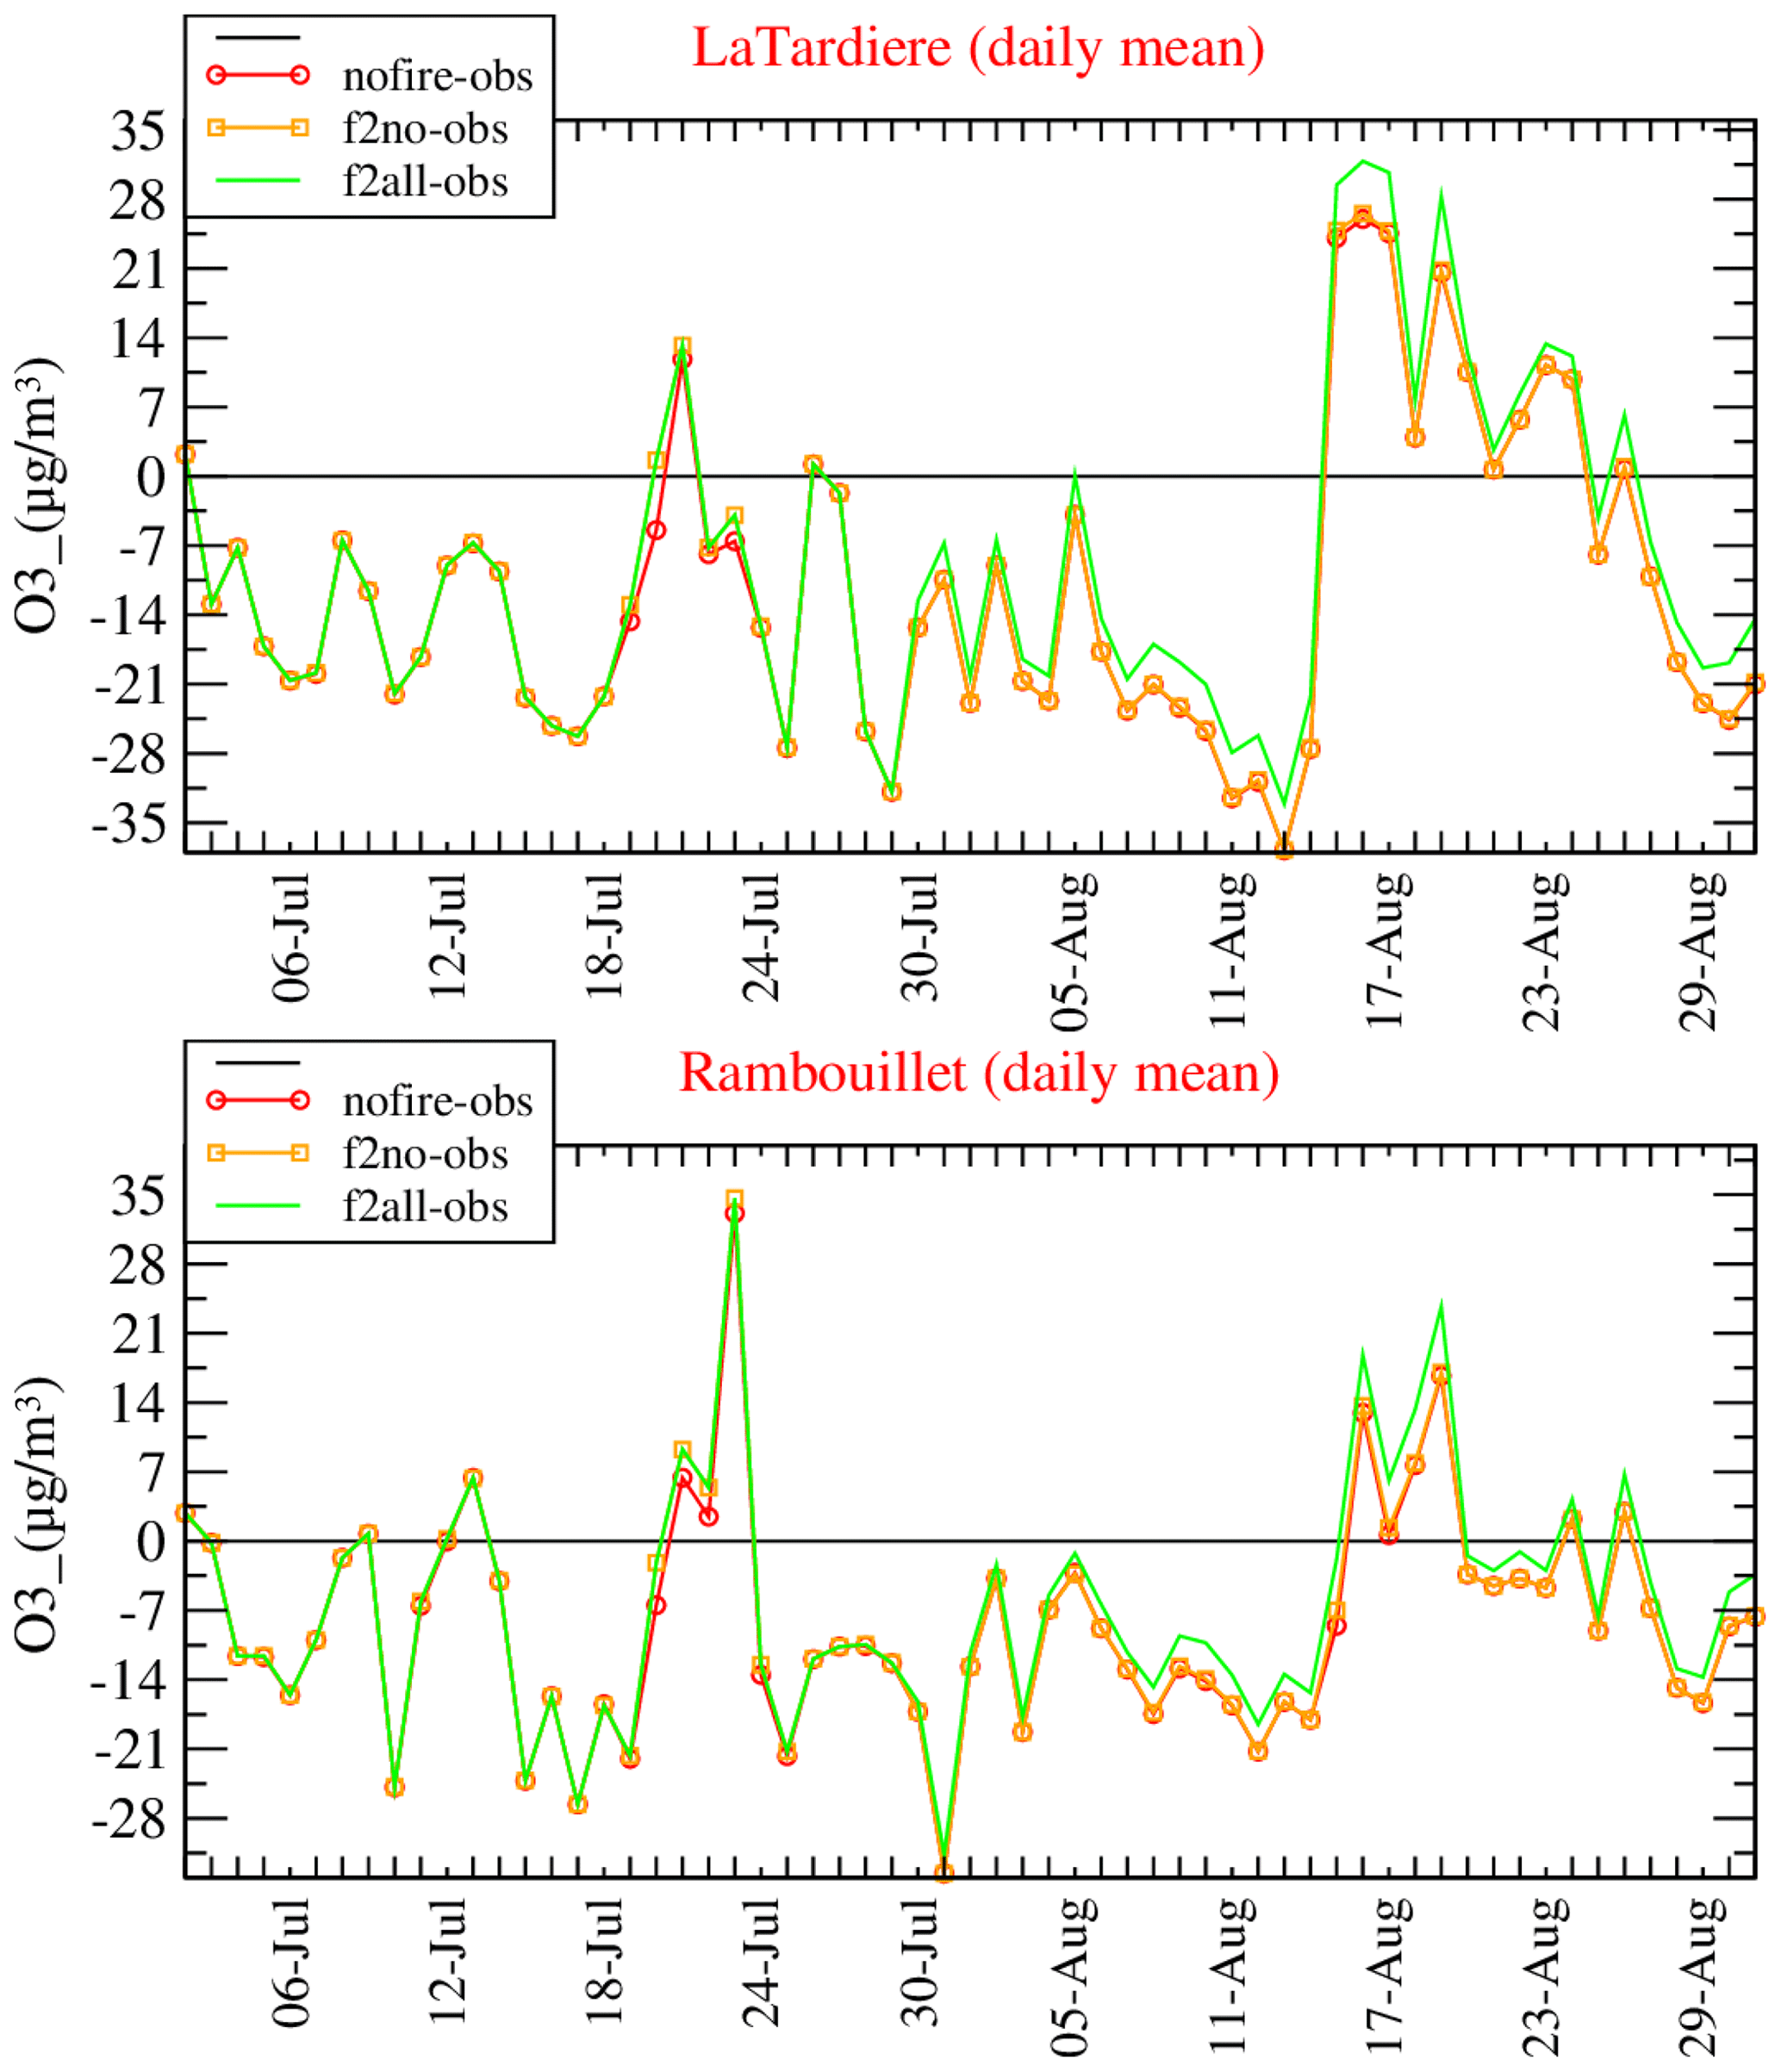
Figure 11Time series of differences of surface ozone concentrations (µg m−3) in Airvault and Rambouillet.
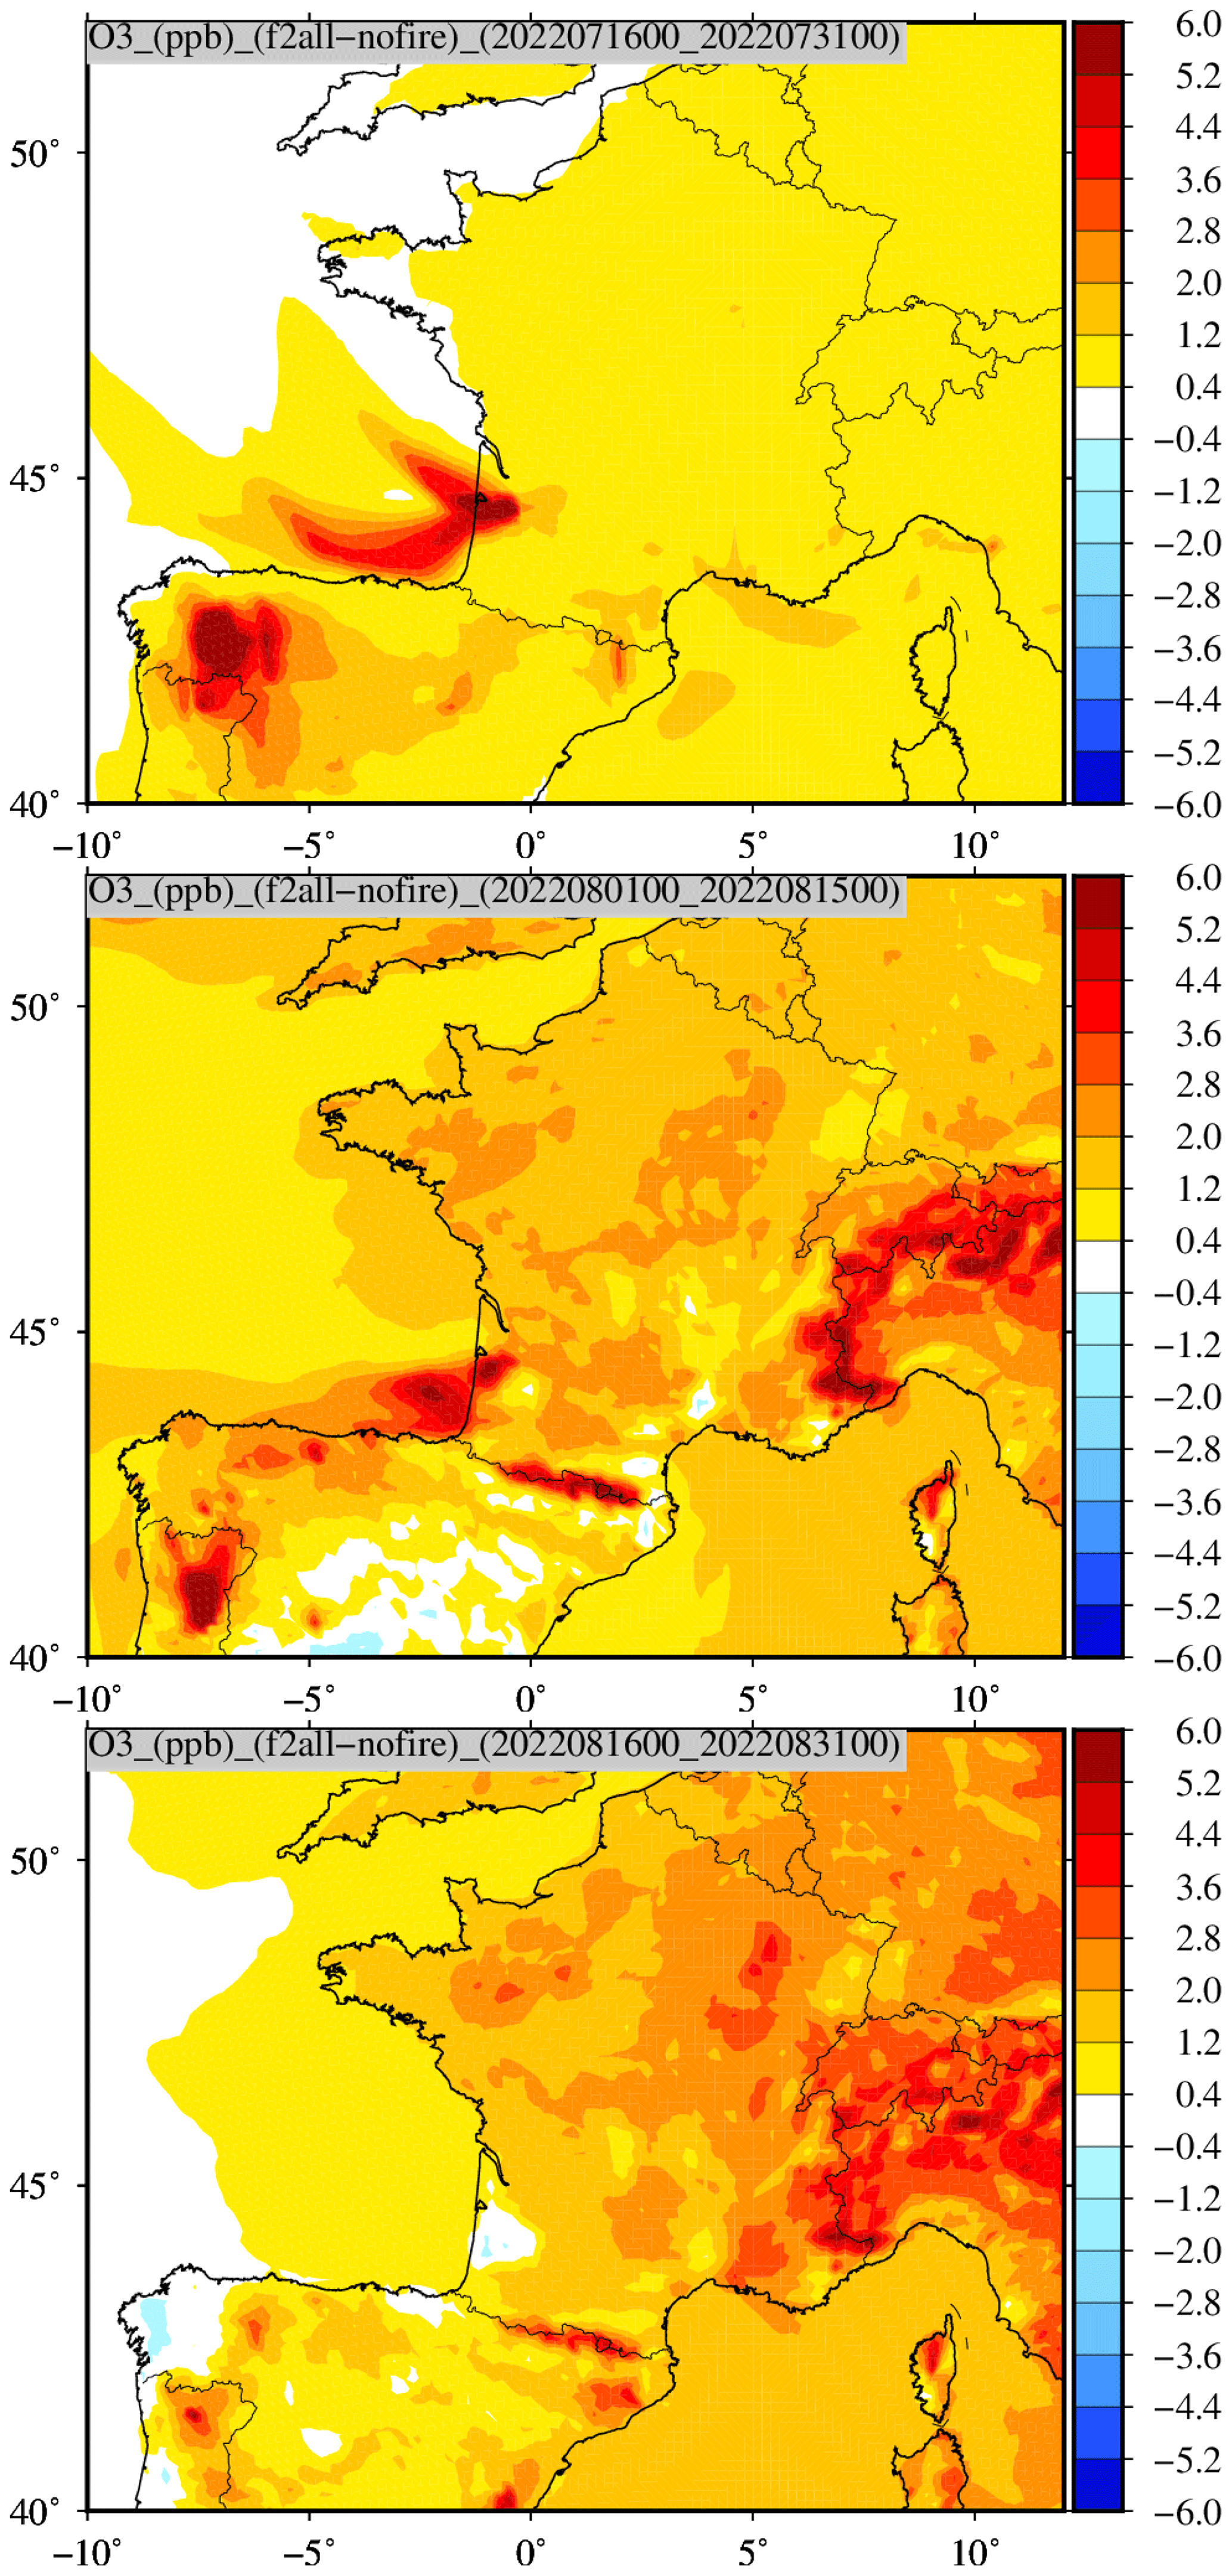
Figure 12Maps of differences of the maximal values of surface ozone concentrations (ppb), modeled in each model grid cell and for three consecutive 2-week periods.
In this section, the impact of fires on surface ozone concentrations is quantified. Details about the sensitivity simulations are also presented, including all simulations. Results are presented for ozone only because the impact of fires on LAI, biogenic emissions and dry deposition impacts gaseous species but has a negligible impact on aerosols.
4.1 Comparisons between observed and modeled surface concentrations
Time series are presented in Fig. 10 for comparison between measured and modeled surface ozone concentrations during the period from 15 July to 15 August 2022. Data are averaged daily in order to highlight the most important differences. The model results are presented for the three simulations nofire (no biomass burning emissions), f2no (fires but no retroactions on dust and LAI) and f2all (fires and retroactions).
Table 3Number of exceedances of daily maximum surface ozone concentrations recorded between 1 July and 31 August 2022 for the EEA stations and for the thresholds 120 and 180 µg m−3.
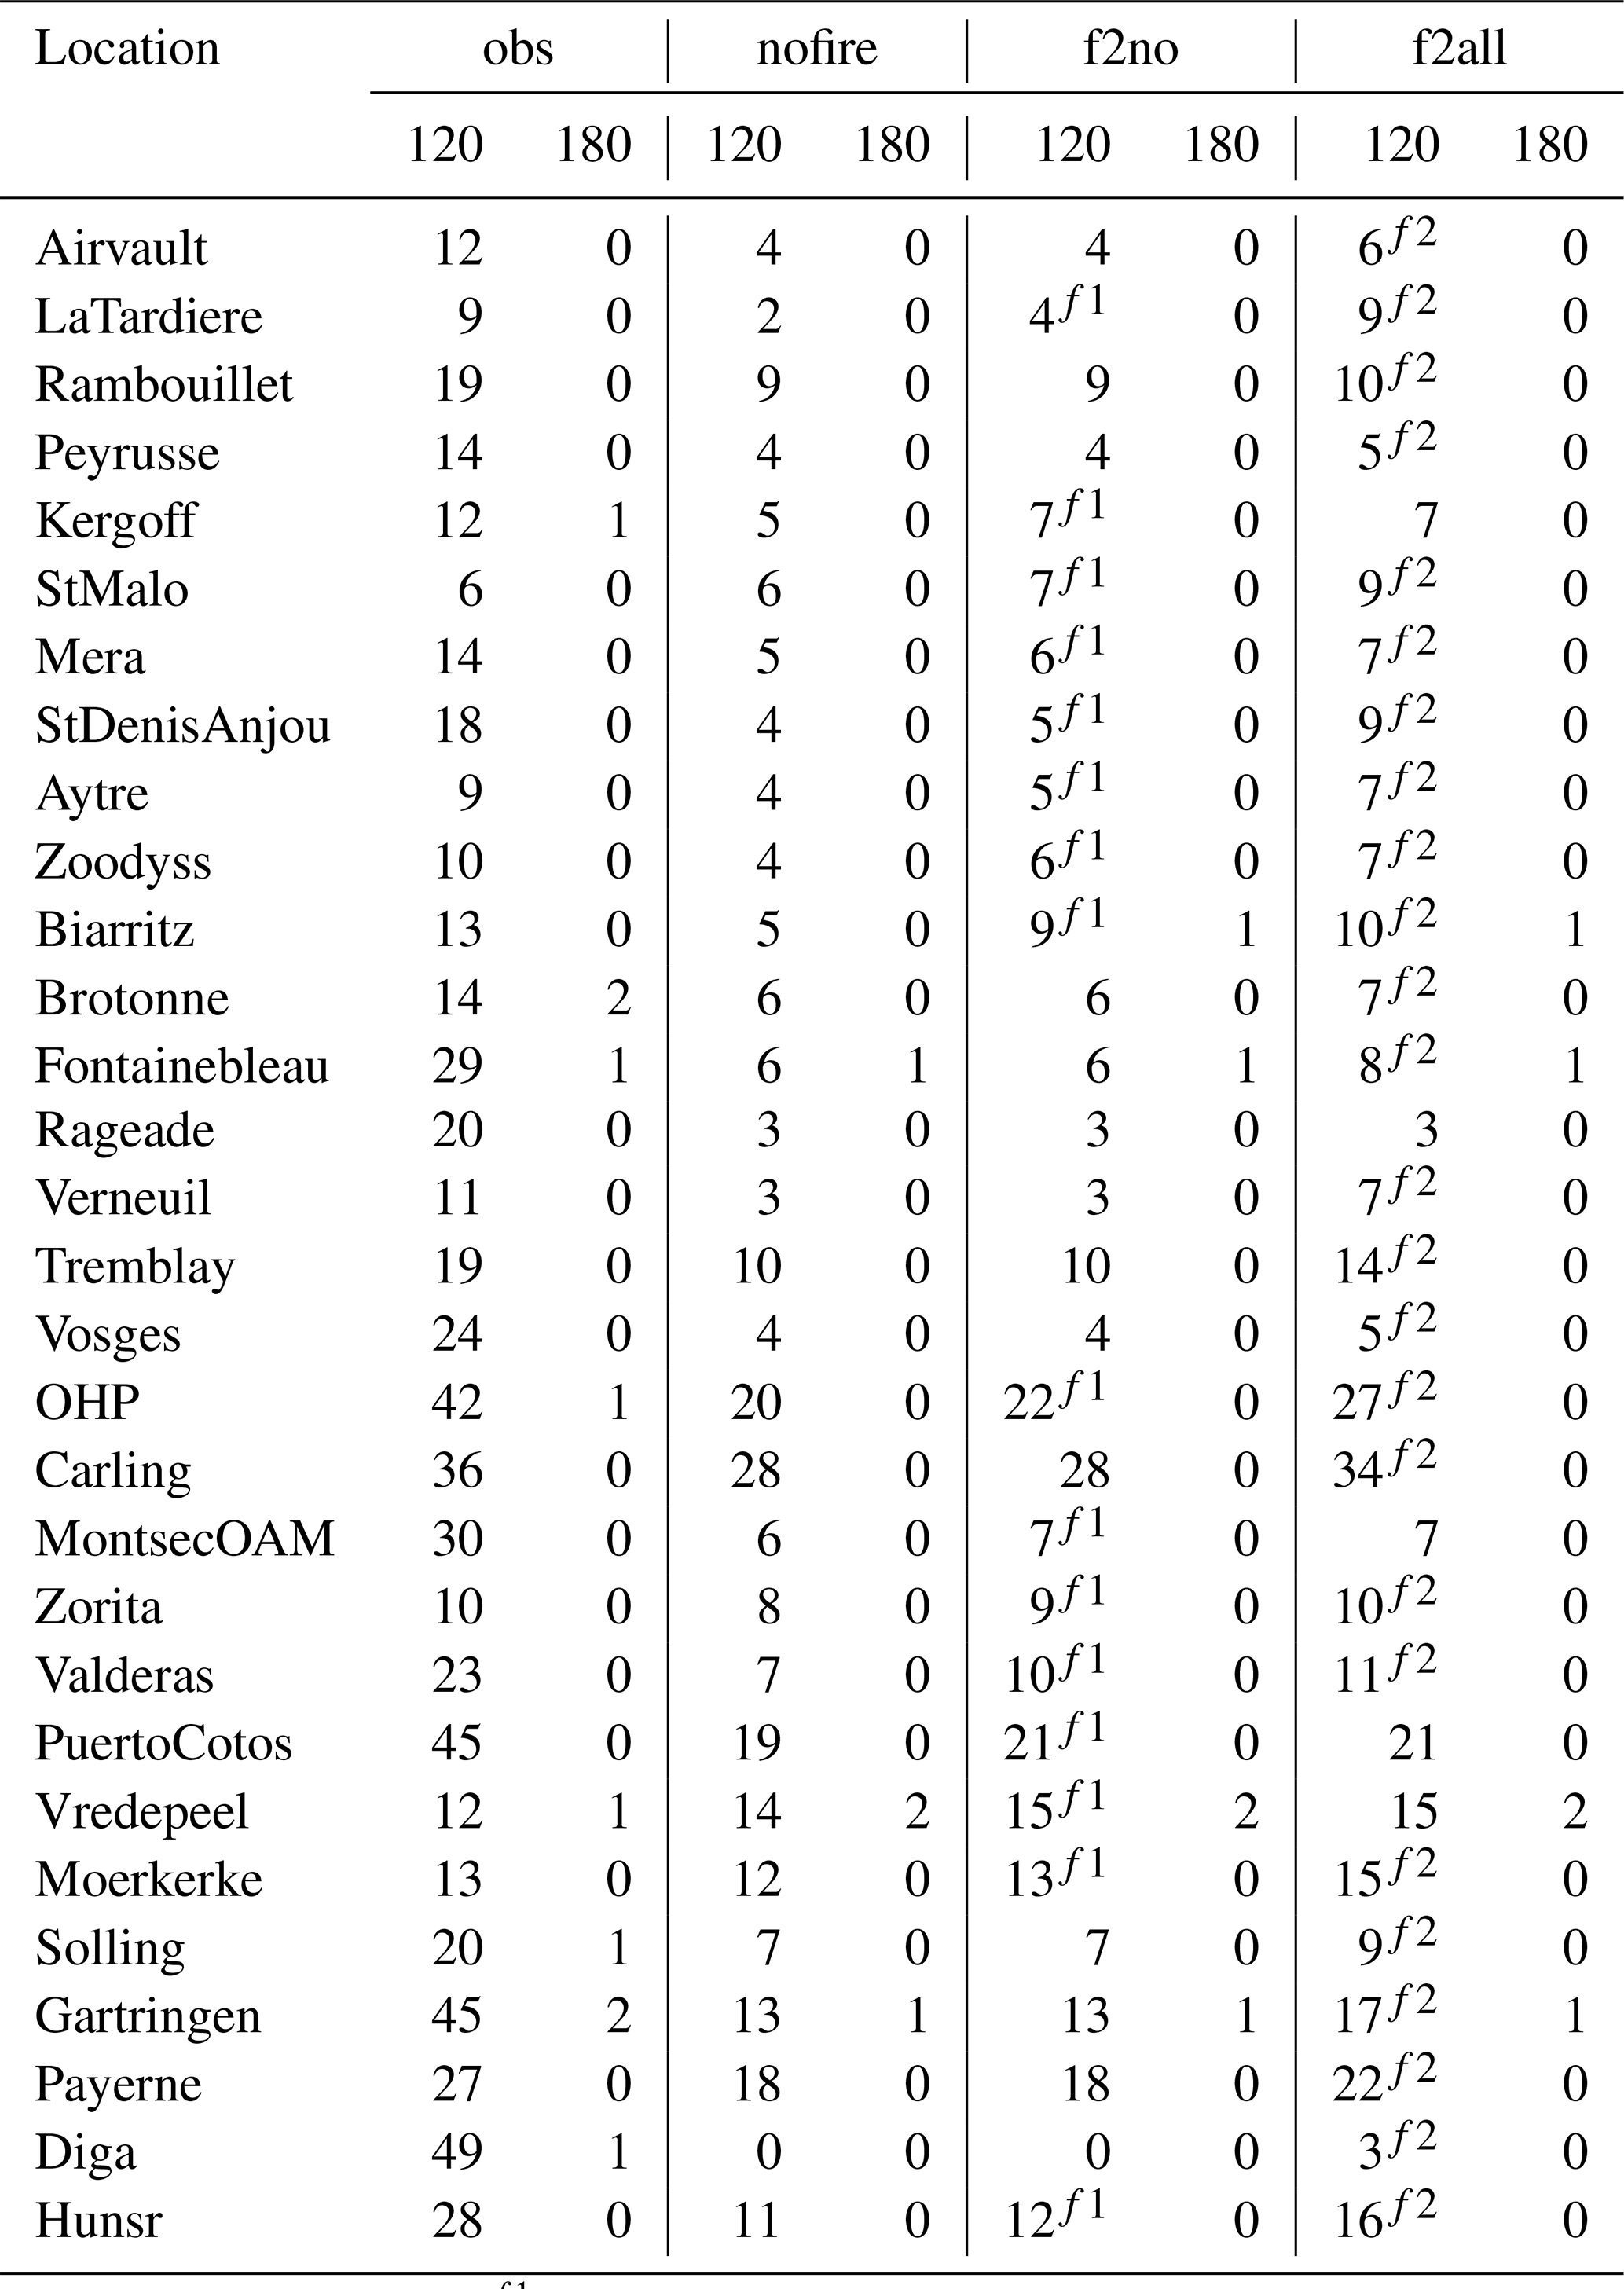
Values are with the exponent f1 when the number of exceedances is different between nofire and f2no. Values are with f2 when the number of exceedances is different between f2no and f2all.
For the four stations presented in Fig. 10, Biarritz, La Tardiere, Rambouillet and Kergoff, located at various ranges from the fires (La Tardiere being the closest one), there is no important impact of the fire emissions on daily mean surface ozone concentrations. The concentrations vary a lot from one week to another, but the simulated concentrations are very close to each other. Two periods of higher concentrations are noted both with the model and the measurements: between 12 and 18 July and between 5 and 17 August 2022. These two episodes are observed for the four stations, showing this is a spatially extended episode over the whole of France. Values are not as high as the daily mean, ranging from 60 to 140 µg m−3. Results are also presented as statistical scores in Table 2. These scores are defined in Menut et al. (2019). The best spatial correlation is for the simulation the more realistic f2all. But the best temporal correlation is obtained with the nofire simulation (R=0.77) even if the two others simulations have very close results (0.77 for f2no and 0.76 for f2all). The RMSE and the bias are better for f2all: with a value of −8.46 µg m−3, the bias is significantly reduced compared to the two other simulations with values of −10.62 µg m−3 for nofire and −10.08 µg m−3 for f2no.
For the two periods, the type of the differences between the simulations is not the same. During the first period, 12 to 18 July, the simulations with fires (f2no and f2all) provides ozone concentrations with a peak of 10 µg m−3 higher than the simulation nofire. This is the direct impact of the additional emission due to fires. There is no difference between f2no and f2all, showing that the secondary effect of fires on mineral dust emissions and LAI have a negligible impact during this period. During the second period with high ozone concentrations, from 5 to 17 August 2022, the three time series are separated: if nofire provides again the lowest ozone concentrations, the f2all simulation is now higher than the f2no simulation. It means that during this second period, the impact of the fires tends to increase the surface ozone production. And this trend increases with time, with the surface being modified for the whole on-going simulation.
In order to quantify the differences between the simulations and the observations, Fig. 11 presents time series for the stations of La Tardiere and Rambouillet. The three time series represent the differences between the observations and the simulations nofire, f2no and f2all for the daily mean values of surface ozone concentrations (µg m−3). In La Tardiere, the differences are mostly negative: the model has a negative bias compared to observations, underestimating the daily mean values of surface ozone concentrations (as seen in Fig. 10). For the two sites, the same behavior is observed: during July, the differences are between nofire and f2all: the f2no case is overlaid to the f2all case, meaning that the change is due to the addition of the biomass burning fluxes and not to the impact of these fires on the surface. But during August, the differences change: the simulations nofire and f2no are very close, and the differences between f2all and obs are larger. It means that the impact on ozone is not due to active fires but to the impact of previous fires on the surface. During the month of August, the differences between f2all and f2no increase in time.
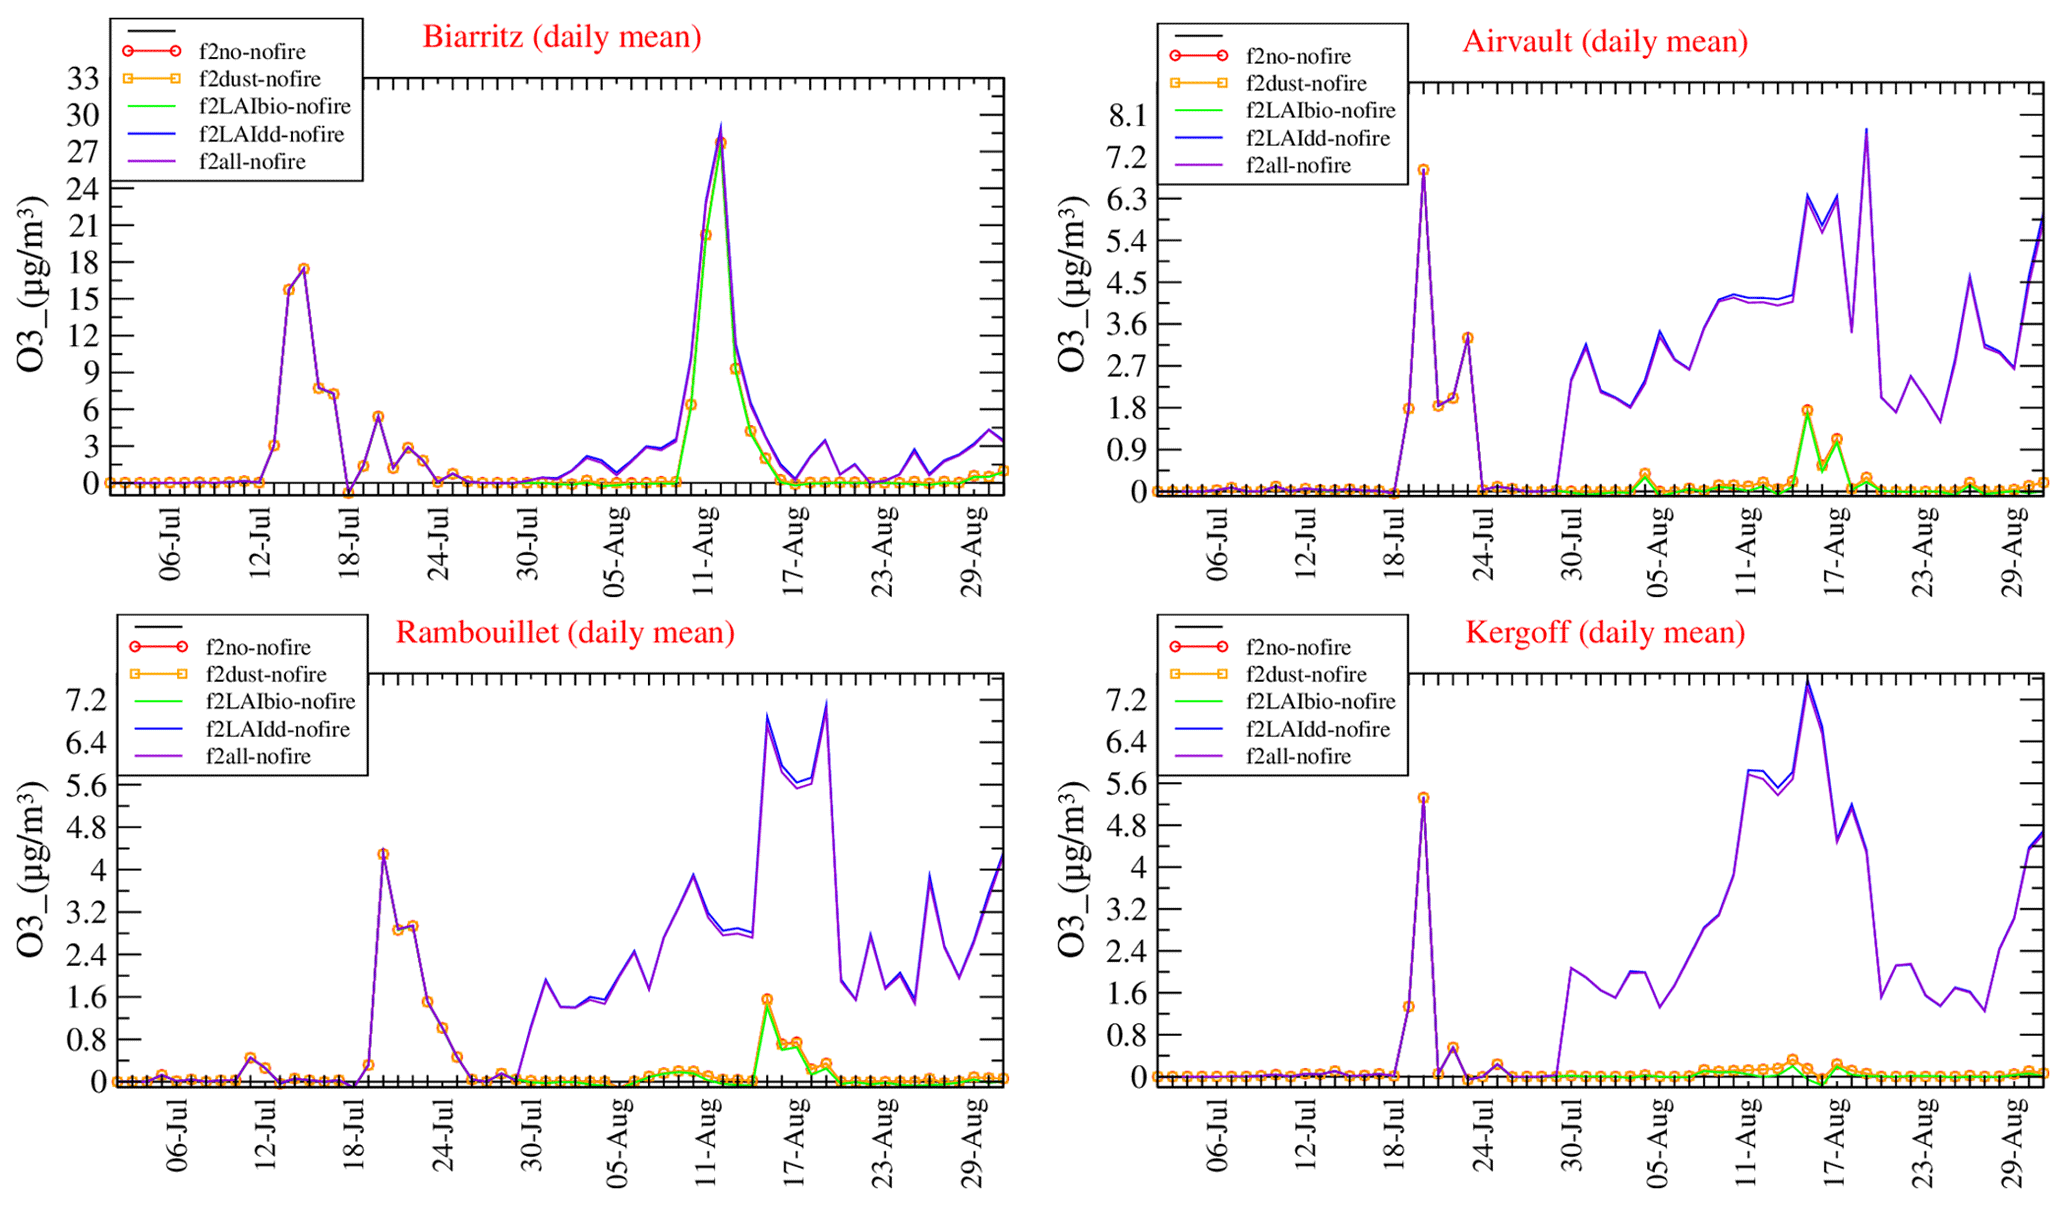
Figure 13Time series of differences on ozone (µg m−3) surface concentrations in Biarritz, Airvault, Rambouillet and Kergoff. The differences are all model versus model and are for all simulations with fire emissions against the simulation with no fires.
For each location, ozone surface concentrations display large differences between the simulation with no fires, nofire, and with the fires and the retroactions, f2all, as shown in Fig. 12. Several periods are defined to see the time change of these maxima values. Each period lasts 2 weeks: from 16 to 31 July, from 1 to 15 August and from 16 to 31 August 2022. For the three periods, the addition of fires induces an increase of surface ozone concentrations. In average over 2 weeks, this increase is ≈ 6 µg m−3 at the maximum. For the first period, the increase is mainly over continents, except for the large plume coming for the Landes fires and going to the west, over the Atlantic sea. The second area of large additional concentrations is at the border of Portugal and Spain, due to Portuguese wildfires. During the second period, and due to several synoptic events, the additional ozone concentrations are modeled all over the domain. Positive differences have peaks again over Landes and Portugal but also over the Pyrenean and Alps. In the north of France, additional ozone may reach 5 µg m−3, when it was only ≈ 1 µg m−3 during the July period. For the second period of 2 weeks in August, the ozone differences remain positive and are more located in the eastern part of the modeled domain, in Germany, Switzerland and Italy.
4.2 Observed and modeled exceedances
In order to quantify the impact of the fires as well as their impact on the surface, on the modeled ozone concentrations, Table 3 presents the number of exceedances of the daily maximum surface concentrations compared to thresholds. These exceedances are calculated station by station and two thresholds are selected: 120 and 180 µg m−3. These exceedances are independently counted for the observations and the three simulations: nofire, f2no and f2all. The first result is that there are many more exceedances with the observations than with the simulations. With the observations, all stations have at least one station over the daily maximum value of 120 µg m−3 during the 2 months (i.e., 60 d). The stations with the most important number of observed exceedances are Diga (49), Gartringen and PuertoCotos (45) and OHP (42). For the threshold of 180 µg m−3 and for the observations, only a few stations are above this value: Kergoff (1), Brotonne (2), Fontainebleau (1), OHP (1), Vredepeel (1), Gartringen (2) and Diga (1).
With the model, the number of exceedances is always lower than with the observations. With the nofire simulation, there is a non-negligible number of exceedances, showing that, obviously, the fires are not always responsible for ozone peaks in western Europe. For the threshold of 180 µg m−3, the model is able to catch only three exceedances, in Fontainebleau, Vredepeel and Gartringen, when the observations showed exceedances for eight stations. For the simulation f2no, the stations where the additional fires cause a new exceedance are in green. There are 16 stations in this case and only for the threshold 120 µg m−3. But the increase in number of exceedance days is not very important: it is, for the most important part, 1 or 2 d more. For the simulation 2all, the values are in red when there are more days of exceedances compared to f2no. Almost all the stations are in this case: 25 stations (of 30) have more exceedance days than f2no, showing that the impact of the fires on the surface may have a non-negligible impact on surface ozone peaks. The additional number of exceedances are important: as an example, and for the threshold 120 µg m−3, the increase is from 4 to 9 in La Tardiere and StDenisAnjou, 10 to 14 in Tremblay, and 22 to 27 in OHP. But, there is no change for the threshold 180 µg m−3: the number of exceedances remains the same and is lower than the observations. With these scores, it is noticeable that the addition of biomass burning emission fluxes has an impact on the daily maxima of surface ozone concentrations. This impact is only for the threshold 120 µg m−3 but not the one at 180 µg m−3. A second, more important impact is when the retroaction of the fires on the surface is taken into account. Again, this is true for the threshold 120 µg m−3 but not for 180 µg m−3. In all cases, the modeled daily maxima remain lower than the observations.
Finally, this section presents an analysis of the processes involved in the impact of fires on the mineral dust and LAI. As presented in Sect. 2.2, the fire emissions will have an impact at the surface by increasing the wind speed and the erodibility and decreasing the LAI. The decrease of LAI has an impact on biogenic emissions (less emissions) and dry deposition (less deposition). In Figs. 10 and 11, it has been shown that the differences between the simulation without (nofire) and with fires (f2all) may be divided into two distinct periods. First, during the month of July and when the fires were very active, there is a direct impact of the fires on the ozone concentrations. Taking into account that the retroaction has no impact, the differences between the simulations f2all and f2no are negligible. For the second part of the modeled period, in August, this time the impact of fires is clearly highlighted with modeled differences observed between f2all and f2no. It means that the impact of fires on ozone exists and is not due to a direct emission of pollutants but to secondary effects of the fire on the surface and then on ozone production.
The question is which process had the greatest effect on ozone production. Three additional simulations were performed and may be classified between f2no and f2all, as described in Table 1. Time series of differences between the simulations and nofire are presented in Fig. 13 for surface ozone concentrations (µg m−3). Four locations are selected: Biarritz (south of France and the fires), Airvault (close to the Landes fires), Rambouillet (close to the Paris area) and Kergoff (Brittany). For the four sites, two peaks of differences are modeled. The first one in July is directly the impact of fires on ozone concentrations, and the second one in August is the indirect impact of the land use change on the ozone production. For the first peak, the behavior is the same for all simulations: the difference between simulations with the fire and the simulation without the fires is the same for all configurations, meaning that the land use changes have no impact during the fires or immediately after. The behavior is different for the second peak occurring in August. In Biarritz, the additional part of ozone added with the fires is important and reaches 30 µg m−3. At the peak time, this impact is mostly due to the fire emissions directly. A small contribution of a few µg m−3 is diagnosed with the f2dust and f2laibio simulations. The behavior is different for the three other sites. The increase due to fires may reach 6 to 8 µg m−3, but this increase is mainly due to only one simulation, f2laidd. The other differences with f2dust and f2laibio have the same order of magnitude as those modeled with f2no. The direct impact of the fires is only ± 1 µg m−3 for the sites. It means that after fires, 1 month later, the impact on vegetation leads to less dry deposition, and then much more concentration of ozone at the surface. The impact of fires on mineral dust and biogenic emissions is not a first-order impact for this pollution episode.
In this study, we simulated the summer 2022 with the CHIMERE model, forced by the ECMWF IFS meteorological fields and over western Europe in order to model the huge fires events observed in the Landes forest. The model was able to simulate both ozone and PM10 surface concentrations as well as the aerosol optical depth during the 2 months of July and August 2022. Several simulations were performed, with and without fires, but also with and without impact of fires on the land use, then the mineral dust emissions, the biogenic emissions and the dry deposition of gases.
Compared to observations, the implementation of the Landes fires in the emissions improves the spatial and temporal correlation, the bias and the RMSE for almost all studied pollutants. With time series in several locations in France, it has been shown that the model is able to capture the timing and the magnitude of the pollution peaks due to the fires. The simulations also showed that the Landes fires were not the only fire events during this summer, and the results showed huge fires also in Spain and Portugal, transported to the north in the south of France. At the same time, mineral dust emissions from North Africa are also transported to southern France.
Calculations of ozone daily maxima and their comparison to threshold values (120 and 180 µg m−3) showed that the fires are responsible for a large increase in ozone peaks during this period. But overall, the summer was not a very polluted summer, with only a few stations showing surface concentrations above 180 µg m−3 as a daily maximum. The model underestimates the ozone peaks, and no day above this threshold is modeled at any station. Taking into account the impact of fires on the land use also changes the scores and increases the threshold exceedances, and it thus reduces the negative bias of the model on ozone peaks. It is therefore a process that should be considered in particular for the forecast of pollution in summer. More precisely, the most sensitive process for ozone is the fact that fires destroy vegetation and therefore reduce the LAI which reduces the dry deposition of ozone and therefore increases its concentration in plumes downwind of the fires. This process has an impact for a much longer period than fires, as the vegetation takes months or years to recover. The influence of the day-to-day surface state clearly shows the need for higher spatial and temporal frequency couplings between vegetation, surface and chemistry transport models.
Tables A1 and A2 present the coordinates and altitude above ground level of the stations for which the measurements are used for the comparison with the model results.
Table A1List of the EEA sites used for the comparisons between measured and modeled surface concentrations.
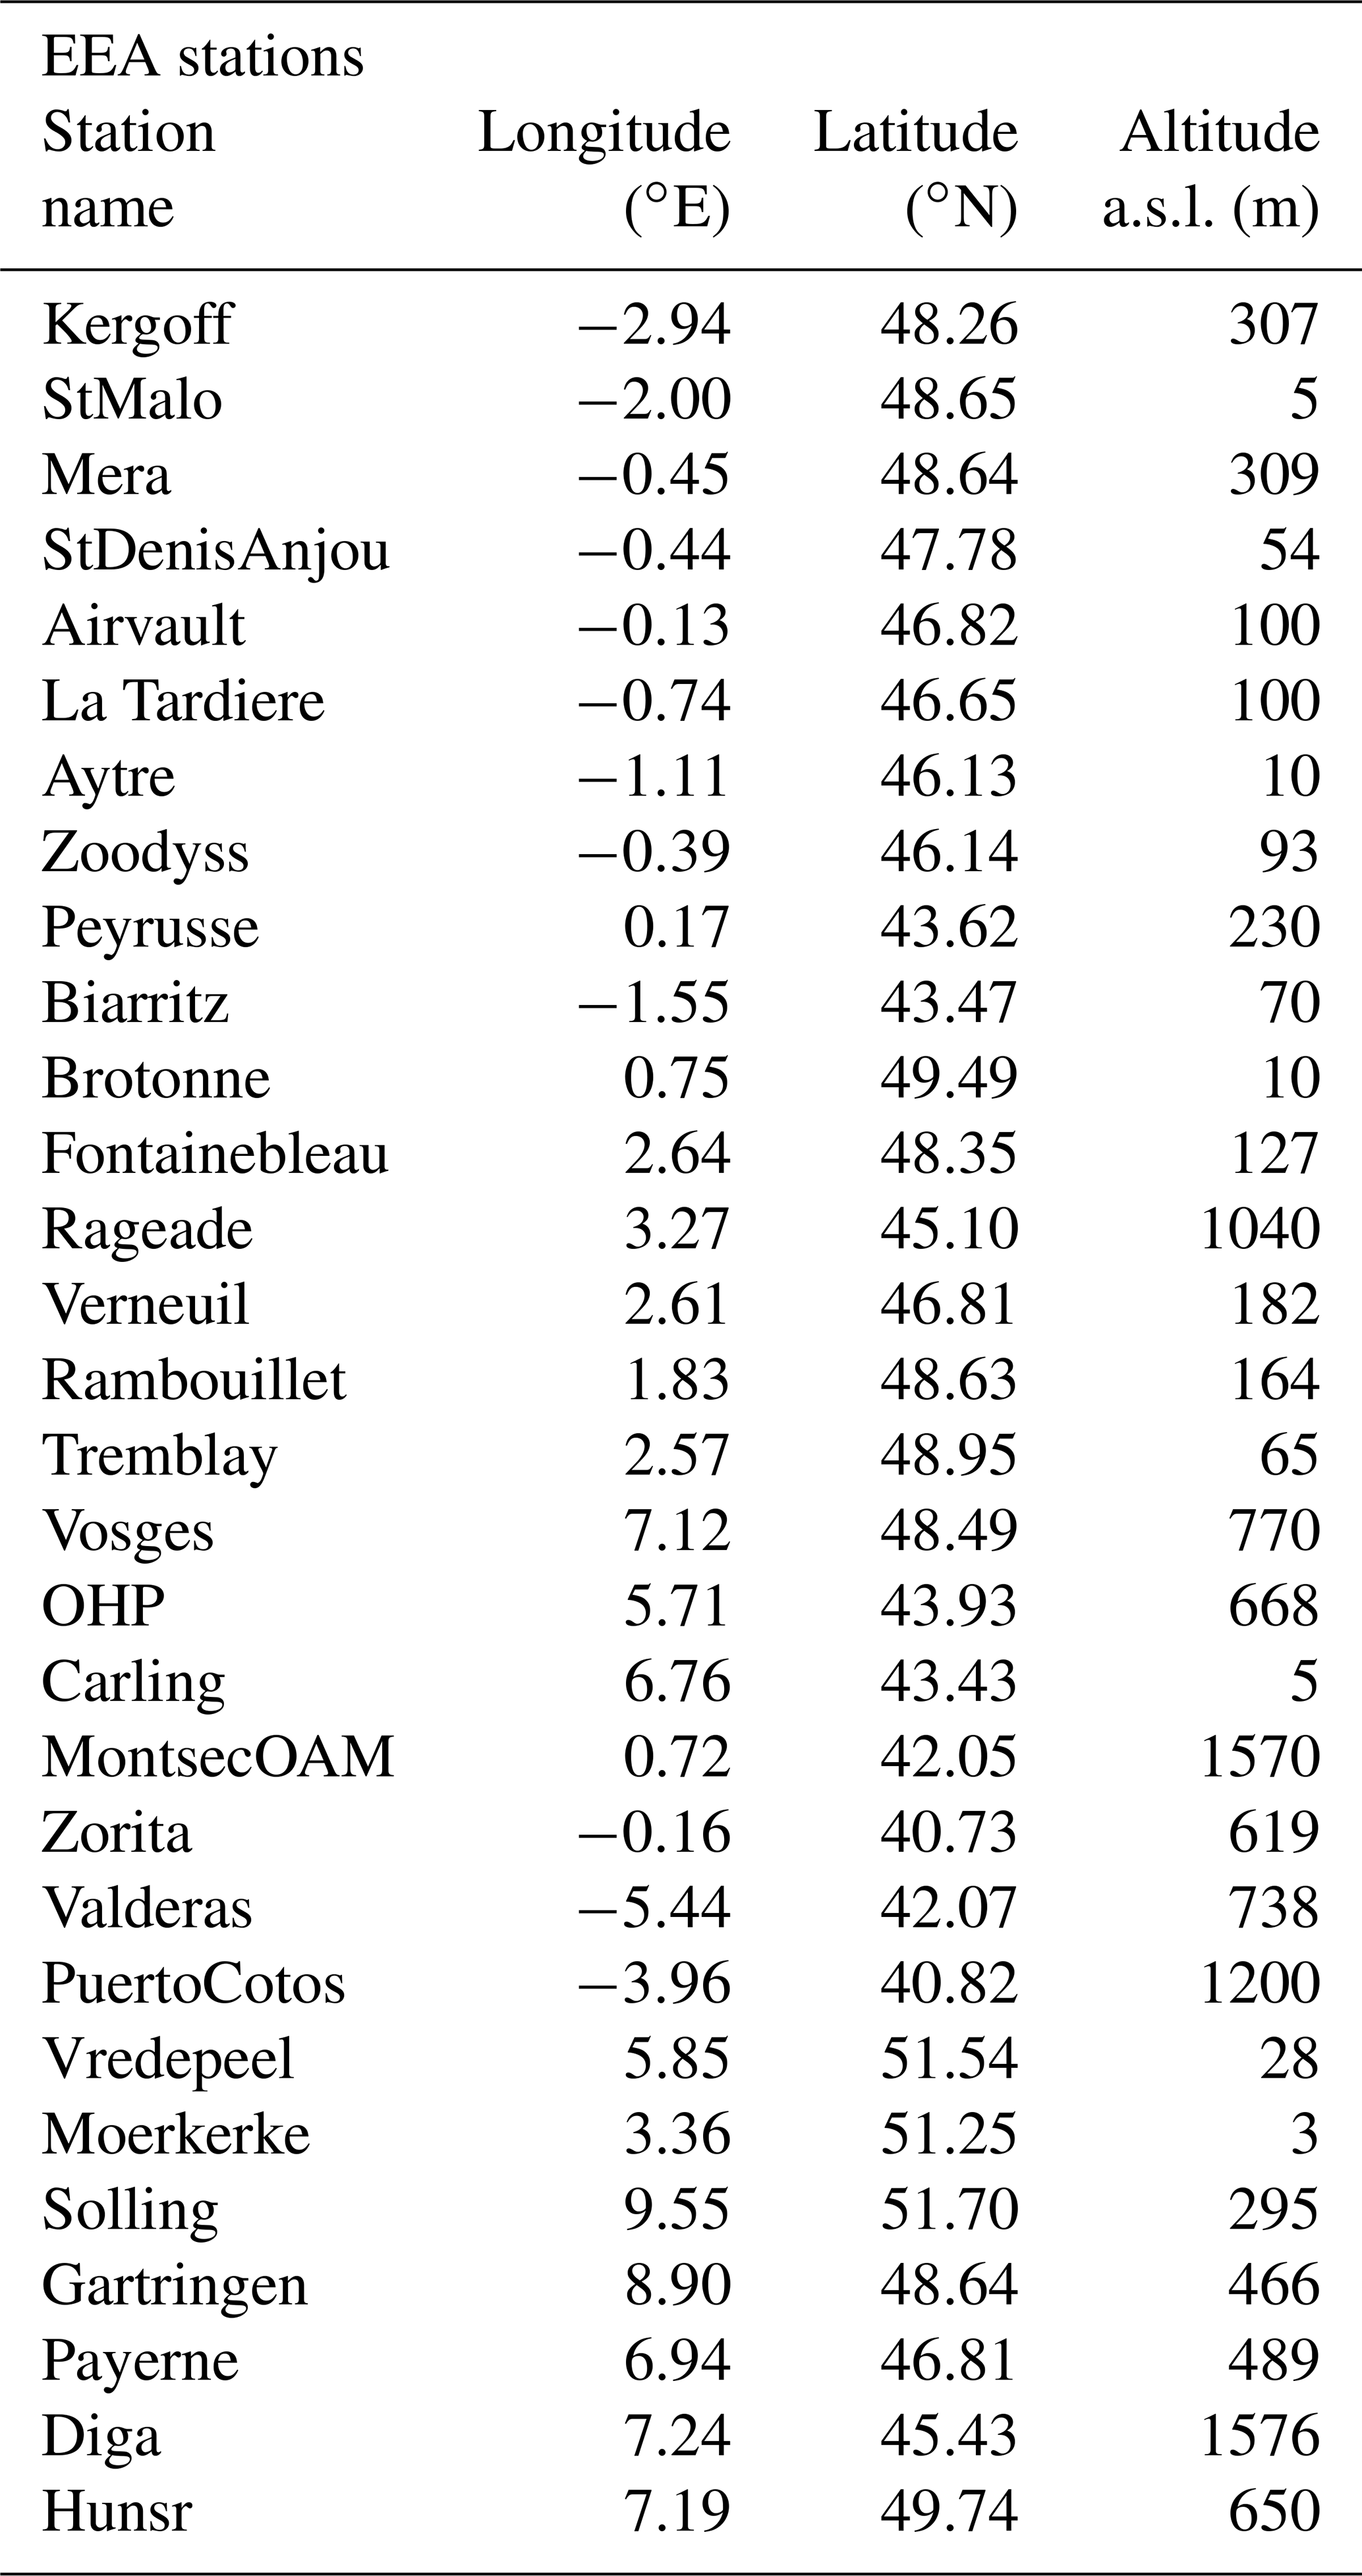
Table A2List of the AERONET sites used for the comparisons between measured and modeled surface concentrations.
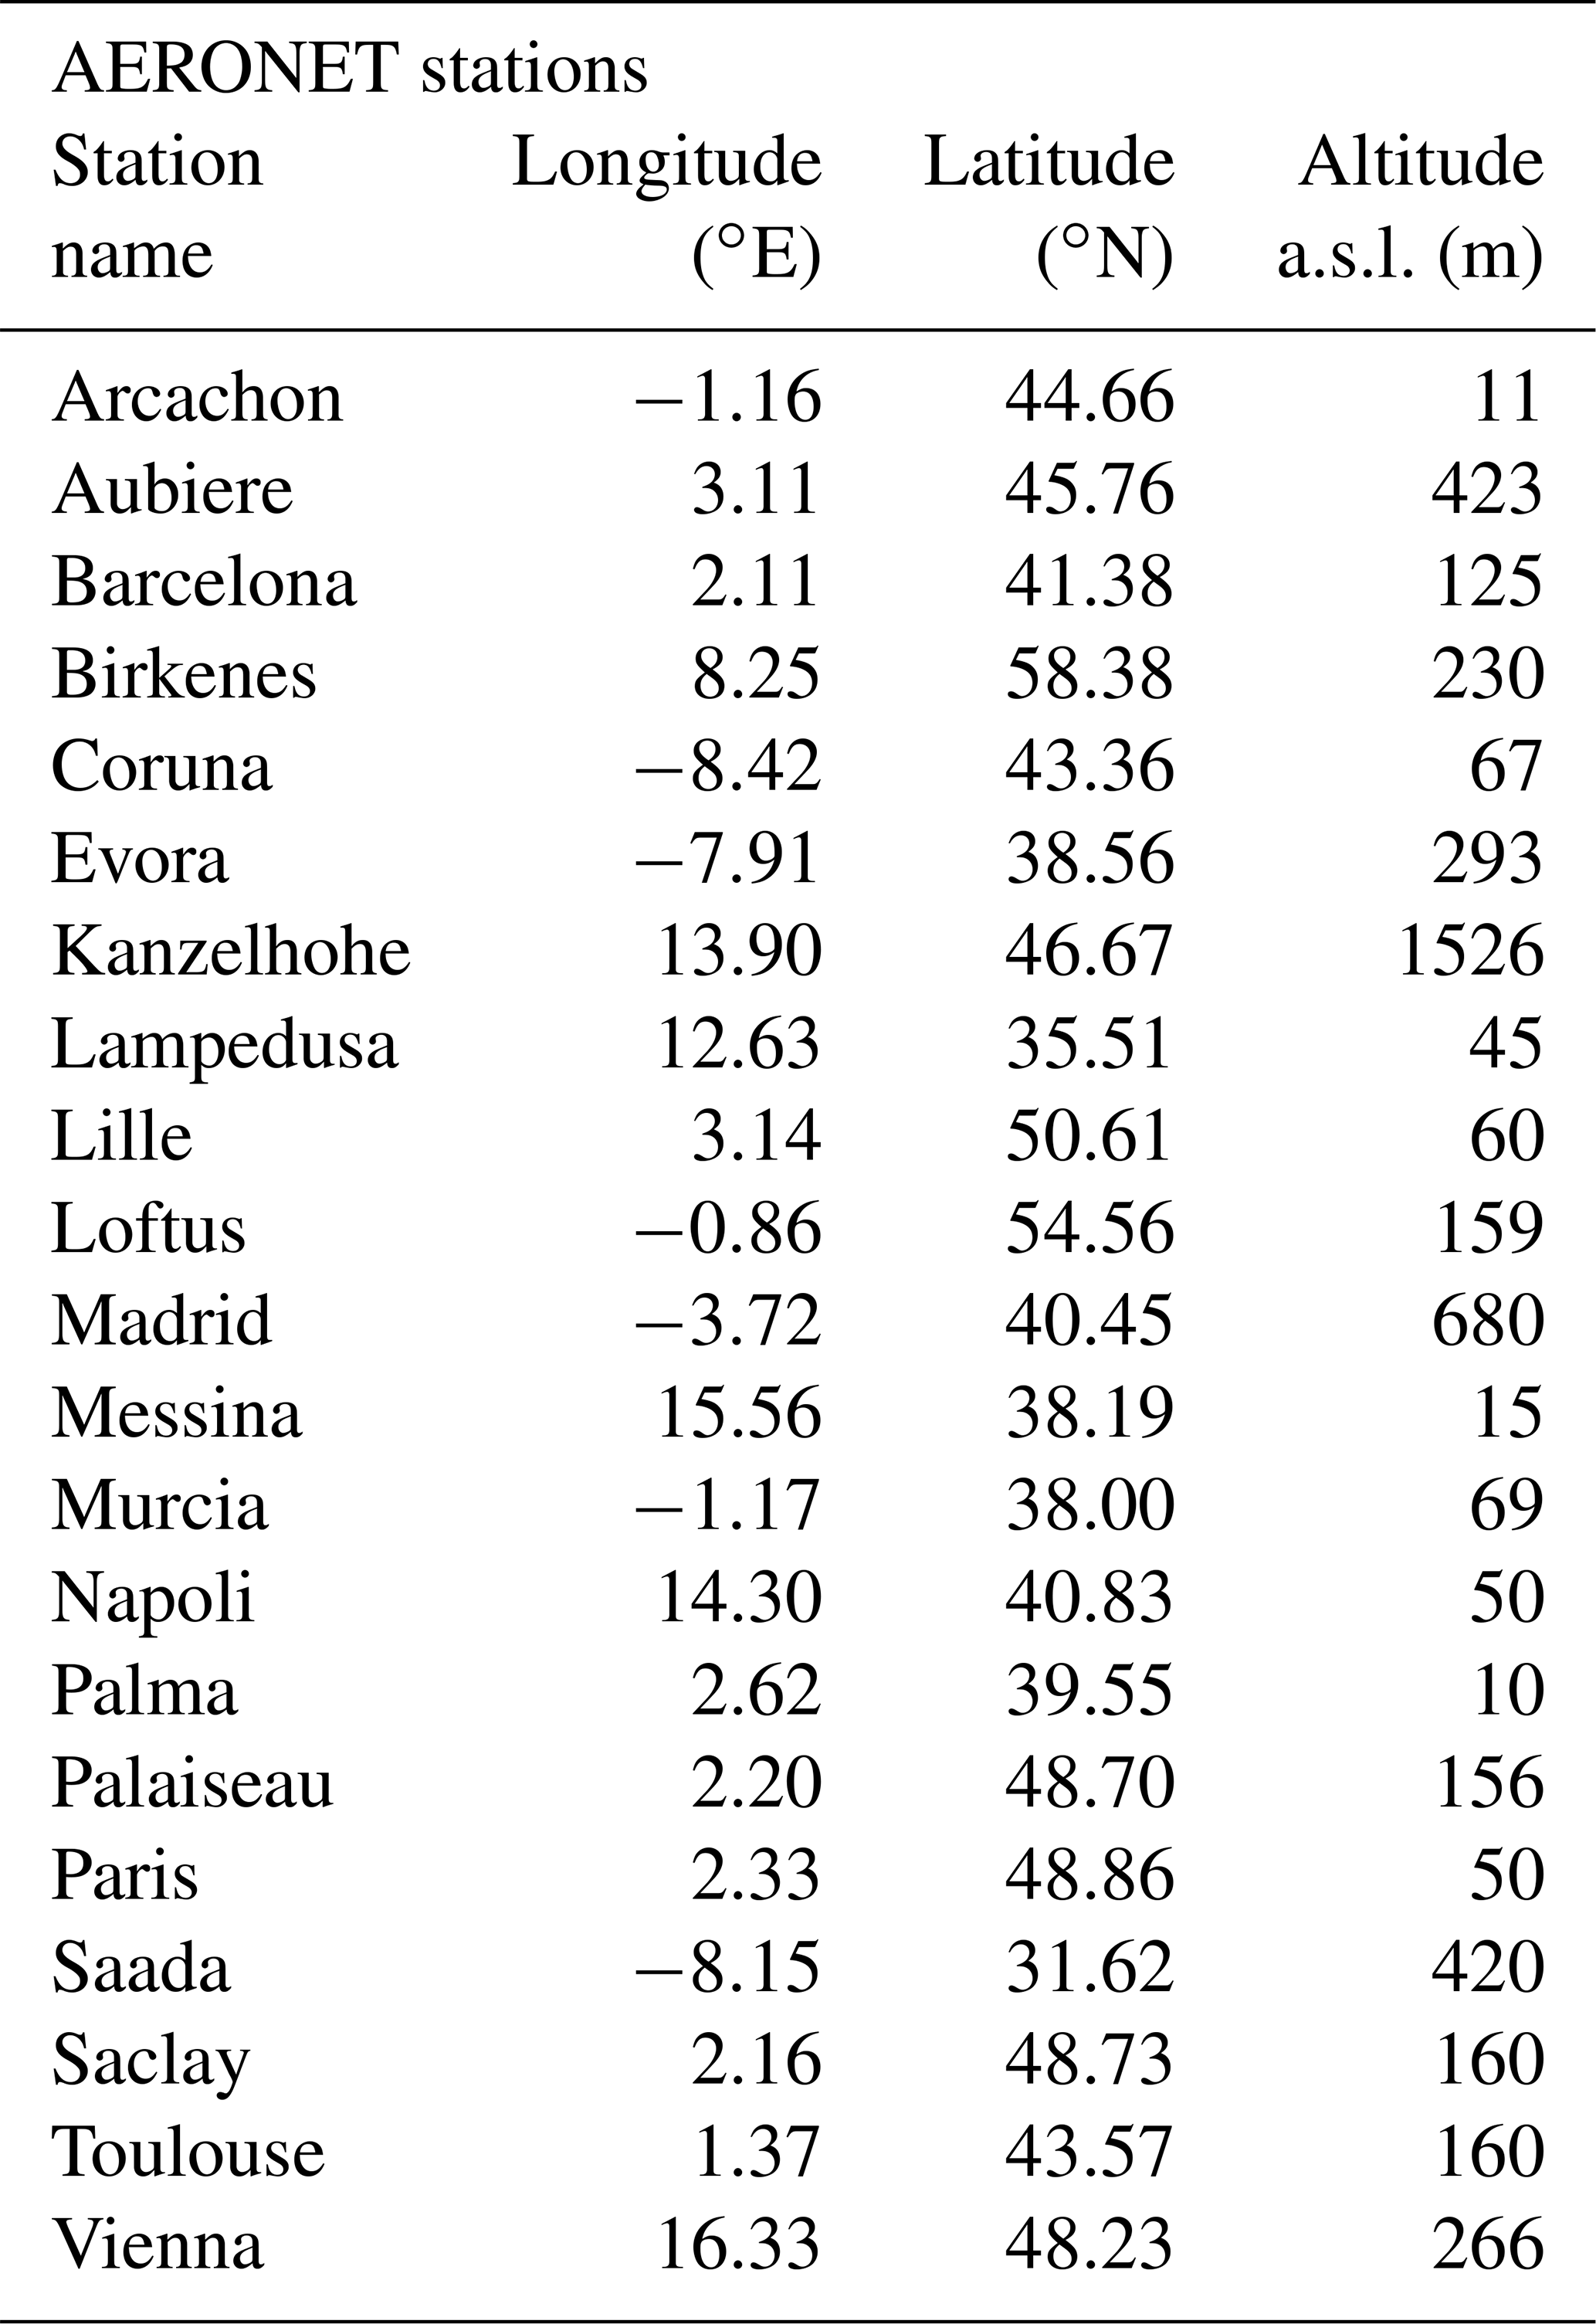
Figure B1 presents the domain with 50 km resolution and the LAI database used before change by the fires and for the MEGAN biogenic emissions calculation.
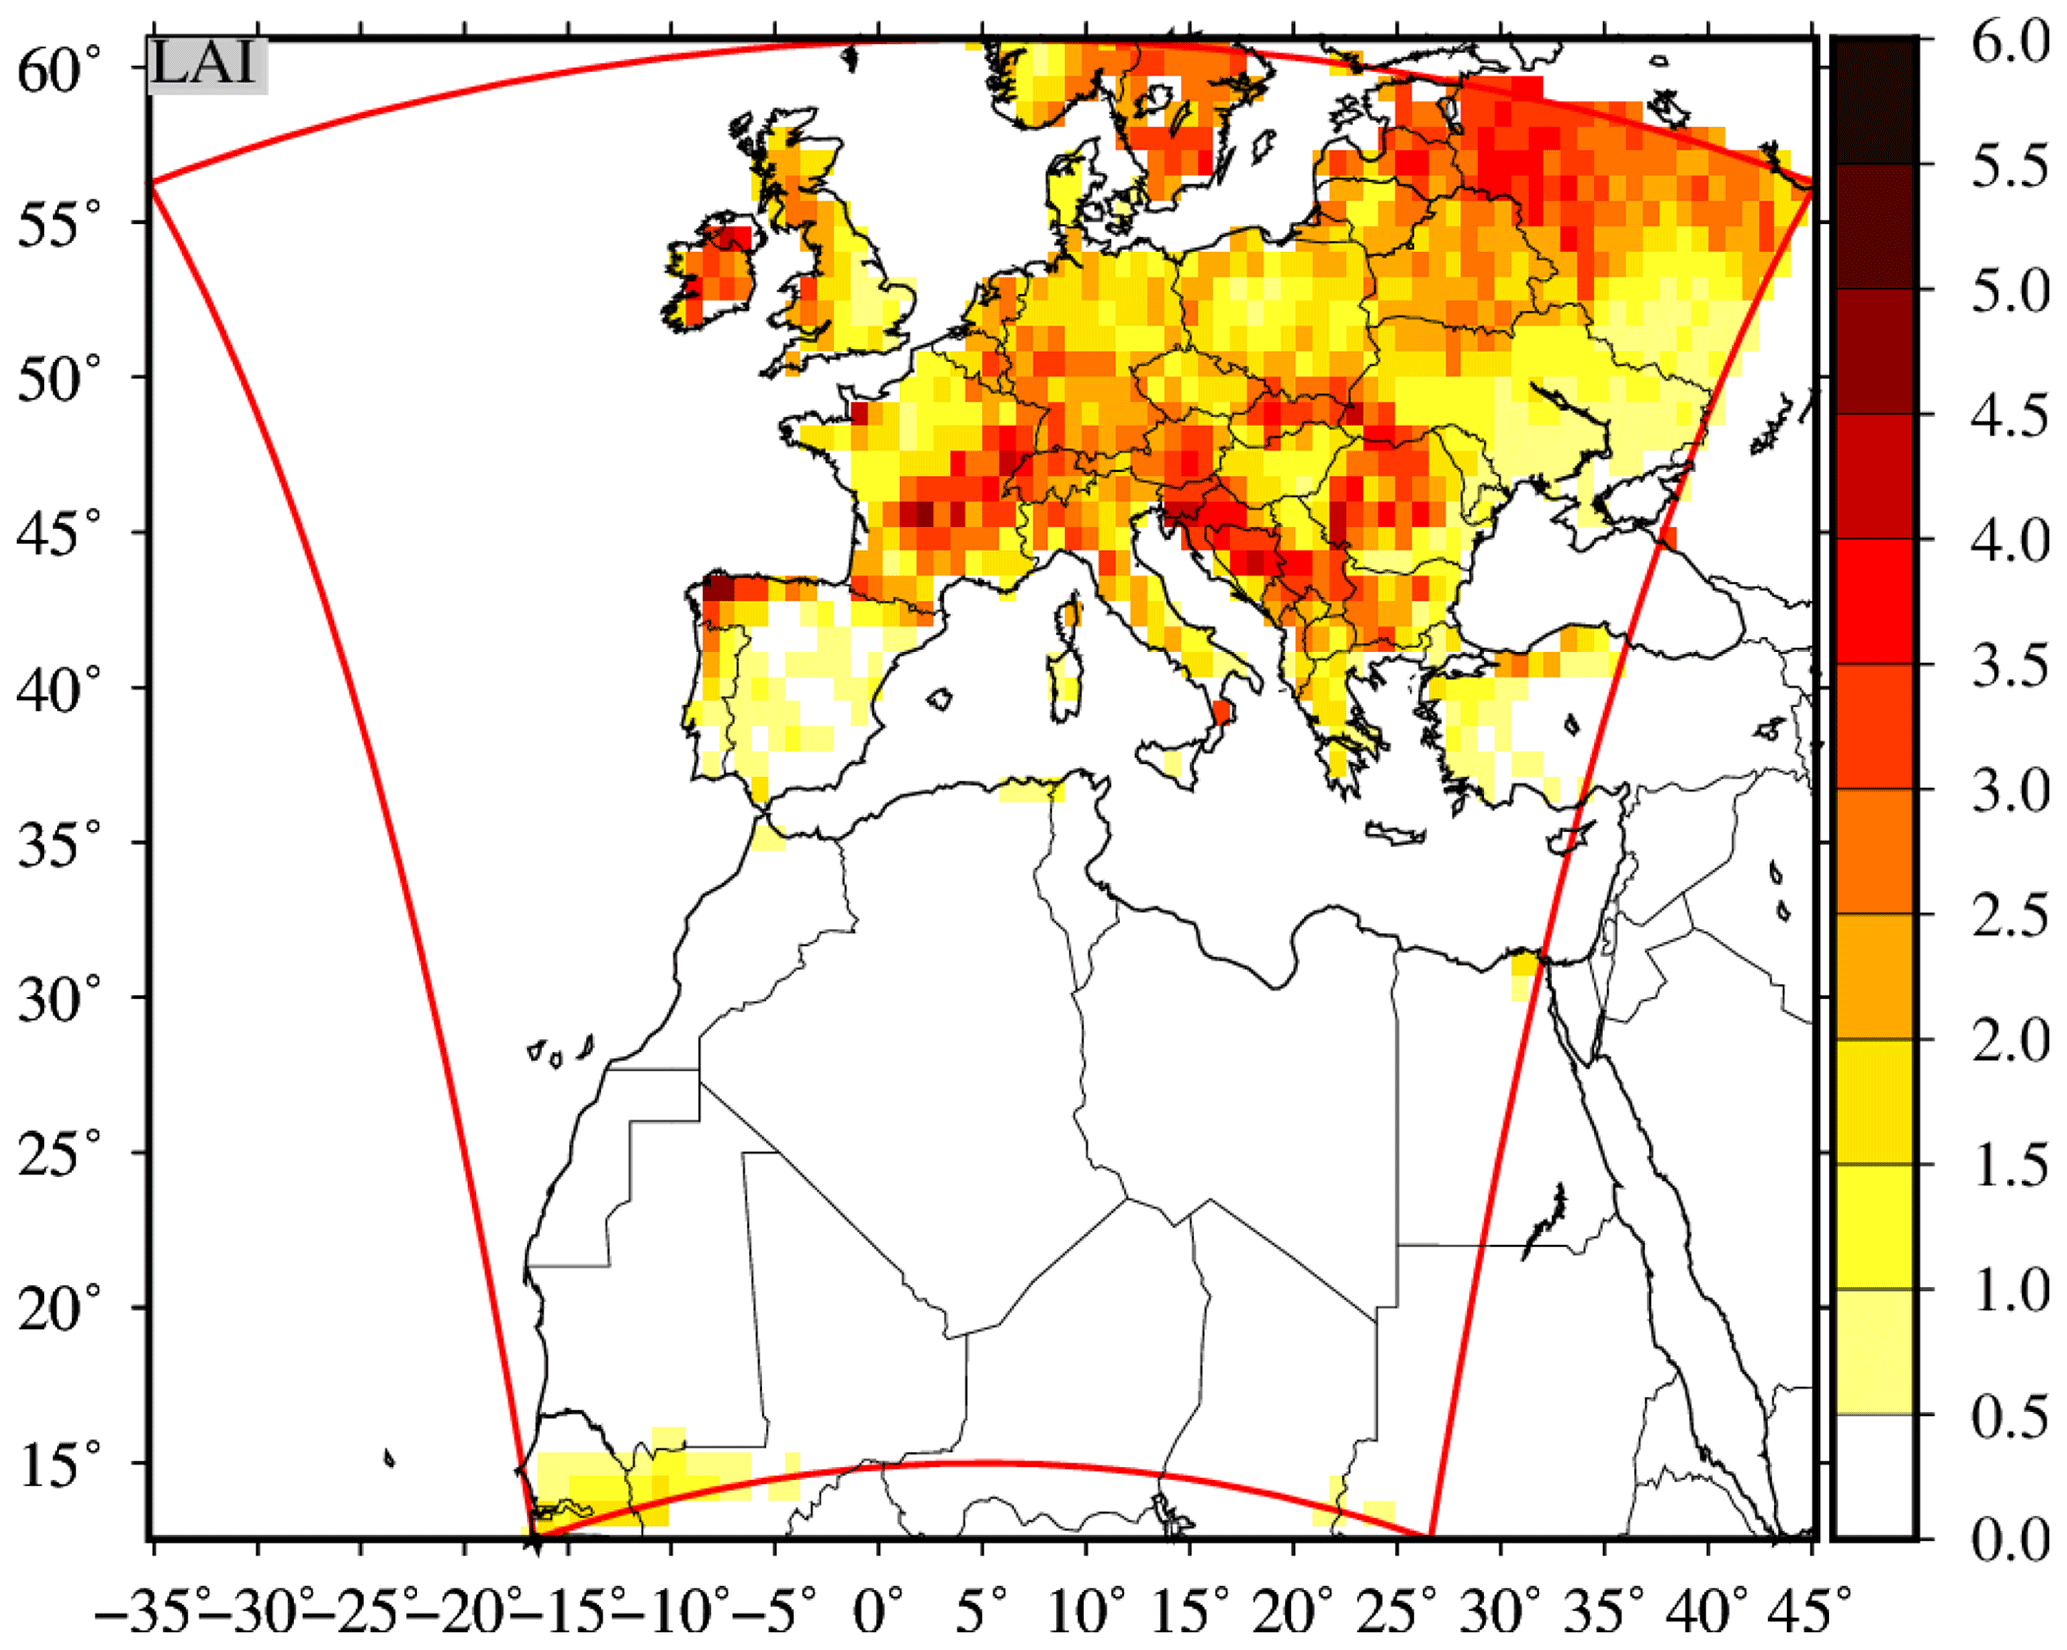
Figure B1Model domain (Δx=50 km) with the leaf area index (LAI in m2 m−2) used by the CHIMERE model and for the month of August.
The CHIMERE v2020 model is available on its dedicated website at https://www.lmd.polytechnique.fr (IPSL, 2020) and for download at https://doi.org/10.14768/8afd9058-909c-4827-94b8-69f05f7bb46d (LMD/IPSL, 2020).
All data used in this study, as well as the data required to run the simulations, are available on the CHIMERE website download page at https://doi.org/10.14768/8afd9058-909c-4827-94b8-69f05f7bb46d (LMD/IPSL, 2020).
All authors contributed to the model development.
The contact author has declared that none of the authors has any competing interests.
Publisher’s note: Copernicus Publications remains neutral with regard to jurisdictional claims in published maps and institutional affiliations.
We thank the investigators and staff who maintain and provide the AERONET data (https://aeronet.gsfc.nasa.gov/, last access: 29 June 2023; Holben et al., 2001). The European Environmental Agency (EEA) is acknowledged for their air quality station data that are provided and freely downloadable (https://www.eea.europa.eu/data-and-maps/data/aqereporting-8, last access: 29 June 2023).
This paper was edited by Lea Hildebrandt Ruiz and reviewed by two anonymous referees.
Alfaro, S. C. and Gomes, L.: Modeling mineral aerosol production by wind erosion: Emission intensities and aerosol size distribution in source areas, J. Geophys. Res., 106, 18075–18084, 2001. a
Burton, S. P., Hair, J. W., Kahnert, M., Ferrare, R. A., Hostetler, C. A., Cook, A. L., Harper, D. B., Berkoff, T. A., Seaman, S. T., Collins, J. E., Fenn, M. A., and Rogers, R. R.: Observations of the spectral dependence of linear particle depolarization ratio of aerosols using NASA Langley airborne High Spectral Resolution Lidar, Atmos. Chem. Phys., 15, 13453–13473, https://doi.org/10.5194/acp-15-13453-2015, 2015. a, b
Granier, C., Darras, S., van der Gon, H. D., Doubalova, J., Elguindi, N., Galle, B., Gauss, M., Guevara, M., Jalkanen, J.-P., Kuenen, J., Liousse, C., Quack, B., Simpson, D., and Sindelarova, K.: The Copernicus Atmosphere Monitoring Service global and regional emissions (April 2019 version), Tech. rep., ECMWF, https://doi.org/10.24380/d0bn-kx16, copernicus Atmosphere Monitoring Service, 2019. a
Grell, G., Freitas, S. R., Stuefer, M., and Fast, J.: Inclusion of biomass burning in WRF-Chem: impact of wildfires on weather forecasts, Atmos. Chem. Phys., 11, 5289–5303, https://doi.org/10.5194/acp-11-5289-2011, 2011. a
Guenther, A. B., Jiang, X., Heald, C. L., Sakulyanontvittaya, T., Duhl, T., Emmons, L. K., and Wang, X.: The Model of Emissions of Gases and Aerosols from Nature version 2.1 (MEGAN2.1): an extended and updated framework for modeling biogenic emissions, Geosci. Model Dev., 5, 1471–1492, https://doi.org/10.5194/gmd-5-1471-2012, 2012. a
Haiden, T., Janousek, M., Vitart, F., Ben-Bouallegue, Z., Ferranti, L., Prates, F., and Richardson, D.: Evaluation of ECMWF forecasts, including the 2021 upgrade, ECMWF, 902, https://doi.org/10.21957/xqnu5o3p, 2022. a
Holben, B., Tanre, D., Smirnov, A., Eck, T. F., Slutsker, I., Abuhassan, N., Newcomb, W. W., Schafer, J., Chatenet, B., Lavenu, F., Kaufman, Y. J., Vande Castle, J., Setzer, A., Markham, B., Clark, D., Frouin, R., Halthore, R., Karnieli, A., O'Neill, N. T., Pietras, C., Pinker, R. T., Voss, K., and Zibordi, G.: An emerging ground-based aerosol climatology: Aerosol Optical Depth from AERONET, J. Geophys. Res., 106, 12067–12097, 2001. a, b
Huang, Y., Wu, S., and Kaplan, J. O.: Sensitivity of global wildfire occurrences to various factors in the context of global change, Atmos. Environ., 121, 86–92, https://doi.org/10.1016/j.atmosenv.2015.06.002, interdisciplinary Research Aspects of Open Biomass Burning and its Impact on the Atmosphere, 2015. a
IPSL: The chimere chemistry-transport model, IPSL [data set], https://www.lmd.polytechnique.fr (last access: 29 June 2023), 2020. a
Jaffe, D. A. and Wigder, N. L.: Ozone production from wildfires: a critical review, Atmos. Environ., 51, 1–10, https://doi.org/10.1016/j.atmosenv.2011.11.063, 2012. a
Kaiser, J. W., Heil, A., Andreae, M. O., Benedetti, A., Chubarova, N., Jones, L., Morcrette, J.-J., Razinger, M., Schultz, M. G., Suttie, M., and van der Werf, G. R.: Biomass burning emissions estimated with a global fire assimilation system based on observed fire radiative power, Biogeosciences, 9, 527–554, https://doi.org/10.5194/bg-9-527-2012, 2012. a
LMD/IPSL: The CHIMERE chemistry-transport model v2020, IPSL [data set, code], https://doi.org/10.14768/8afd9058-909c-4827-94b8-69f05f7bb46d, 2020. a, b
Mailler, S., Menut, L., Khvorostyanov, D., Valari, M., Couvidat, F., Siour, G., Turquety, S., Briant, R., Tuccella, P., Bessagnet, B., Colette, A., Létinois, L., Markakis, K., and Meleux, F.: CHIMERE-2017: from urban to hemispheric chemistry-transport modeling, Geosci. Model Dev., 10, 2397–2423, https://doi.org/10.5194/gmd-10-2397-2017, 2017. a
Menut, L., C.Schmechtig, and B.Marticorena: Sensitivity of the sandblasting fluxes calculations to the soil size distribution accuracy, J. Atmos. Ocean. Technol., 22, 1875–1884, 2005. a
Menut, L., Bessagnet, B., Khvorostyanov, D., Beekmann, M., Blond, N., Colette, A., Coll, I., Curci, G., Foret, G., Hodzic, A., Mailler, S., Meleux, F., Monge, J.-L., Pison, I., Siour, G., Turquety, S., Valari, M., Vautard, R., and Vivanco, M. G.: CHIMERE 2013: a model for regional atmospheric composition modelling, Geosci. Model Dev., 6, 981–1028, https://doi.org/10.5194/gmd-6-981-2013, 2013. a
Menut, L., Flamant, C., Turquety, S., Deroubaix, A., Chazette, P., and Meynadier, R.: Impact of biomass burning on pollutant surface concentrations in megacities of the Gulf of Guinea, Atmos. Chem. Phys., 18, 2687–2707, https://doi.org/10.5194/acp-18-2687-2018, 2018. a, b, c
Menut, L., Tuccella, P., Flamant, C., Deroubaix, A., and Gaetani, M.: The role of aerosol–radiation–cloud interactions in linking anthropogenic pollution over southern west Africa and dust emission over the Sahara, Atmos. Chem. Phys., 19, 14657–14676, https://doi.org/10.5194/acp-19-14657-2019, 2019. a
Menut, L., Bessagnet, B., Siour, G., Mailler, S., Pennel, R., and Cholakian, A.: Impact of lockdown measures to combat Covid-19 on air quality over western Europe, Sci. Total Environ., 741, 140426, https://doi.org/10.1016/j.scitotenv.2020.140426, 2020. a, b
Menut, L., Bessagnet, B., Briant, R., Cholakian, A., Couvidat, F., Mailler, S., Pennel, R., Siour, G., Tuccella, P., Turquety, S., and Valari, M.: The CHIMERE v2020r1 online chemistry-transport model, Geosci. Model Dev., 14, 6781–6811, https://doi.org/10.5194/gmd-14-6781-2021, 2021. a
Menut, L., Siour, G., Bessagnet, B., Cholakian, A., Pennel, R., and Mailler, S.: Impact of Wildfires on Mineral Dust Emissions in Europe, J. Geophys. Res.-Atmos., 127, e2022JD037395, https://doi.org/10.1029/2022JD037395, 2022a. a
Menut, L., Siour, G., Bessagnet, B., Cholakian, A., Pennel, R., and Mailler, S.: Impact of wildfires on mineral dust emissions in Europe, J. Geophys. Res.-Atmos., 127, e2022JD037395, https://doi.org/10.1029/2022JD037395, 2022b. a, b
Monahan, E. C.: In The Role of Air-Sea Exchange in Geochemical Cycling, chap. The ocean as a source of atmospheric particles, 129–163, Kluwer Academic Publishers, Dordrecht, Holland, https://doi.org/10.1007/978-94-009-4738-2, 1986. a
Mora, O., Banos, V., Regolini, M., and Carnus, J.-M.: Using scenarios for forest adaptation to climate change: a foresight study of the Landes de Gascogne Forest 2050, Ann. Forest Sci., 71, 313–324, https://doi.org/10.1007/s13595-013-0336-2, 2014. a
Omar, A., Winker, D. M., Vaughan, M. A., Hu, Y., Trepte, C. R., Ferrare, R. A., Lee, K.-P., Hostetler, C. A., Kittaka, C., Rogers, R. R., Kuehn, R. E., and Liu, Z.: The CALIPSO Automated Aerosol Classification and Lidar Ratio Selection Algorithm, J. Atmos. Ocean. Technol., 26, 1994–2014, 2010. a, b
Price, C. and Rind, D.: What determines the cloud-to-ground lightning fraction in thunderstorms?, Geophys. Res. Lett., 20, 463–466, https://doi.org/10.1029/93GL00226, 1993. a
Rea, G., Turquety, S., Menut, L., Briant, R., Mailler, S., and Siour, G.: Source contributions to 2012 summertime aerosols in the Euro-Mediterranean region, Atmos. Chem. Phys., 15, 8013–8036, https://doi.org/10.5194/acp-15-8013-2015, 2015. a
Reid, J. S., Koppmann, R., Eck, T. F., and Eleuterio, D. P.: A review of biomass burning emissions part II: intensive physical properties of biomass burning particles, Atmos. Chem. Phys., 5, 799–825, https://doi.org/10.5194/acp-5-799-2005, 2005. a
San-Miguel-Ayanz, J., Durrant, T., Boca, R., Maianti, P., Liberta, G., Artés-Vivancos, T., Oom, D., Branco, A., de Rigo, D., Ferrari, D., Pfeiffer, H., Grecchi, R., and Nuijten, D.: Advance Report on Forest Fires in Europe, Middle East and North Africa 2021, Publications Office of the European Union, Luxembourg, 2022, ISBN 978-92-76-49633-5, JRC128678, 1–39, https://doi.org/10.2760/039729, 2022. a
Sindelarova, K., Granier, C., Bouarar, I., Guenther, A., Tilmes, S., Stavrakou, T., Müller, J.-F., Kuhn, U., Stefani, P., and Knorr, W.: Global data set of biogenic VOC emissions calculated by the MEGAN model over the last 30 years, Atmos. Chem. Phys., 14, 9317–9341, https://doi.org/10.5194/acp-14-9317-2014, 2014. a
Sofiev, M., Ermakova, T., and Vankevich, R.: Evaluation of the smoke-injection height from wild-land fires using remote-sensing data, Atmos. Chem. Phys., 12, 1995–2006, https://doi.org/10.5194/acp-12-1995-2012, 2012. a
Stromatas, S., Turquety, S., Menut, L., Chepfer, H., Péré, J. C., Cesana, G., and Bessagnet, B.: Lidar signal simulation for the evaluation of aerosols in chemistry transport models, Geosci. Model Dev., 5, 1543–1564, https://doi.org/10.5194/gmd-5-1543-2012, 2012. a
Tesche, M., Wandinger, U., Ansmann, A., Althausen, D., Muller, D., and Omar, A. H.: Ground-based validation of CALIPSO observations of dust and smoke in the Cape Verde region, J. Geophys. Res.-Atmos., 118, 2889–2902, https://doi.org/10.1002/jgrd.50248, 2013. a, b
Toreti, A., Bavera, D., Acosta Navarro, J., Cammalleri, C., de Jager, A., Di Ciollo, C., Hrast Essenfelder, A., Maetens, W., Magni, D., Masante, D., Mazzeschi, M., Niemeyer, S., and Spinoni, J.: Drought in Europe August 2022, Tech. Rep. JRC130493, Joint Research Center, https://doi.org/10.2760/264241, publications Office of the European Union, Luxembourg, 2022. a
Vautard, R., B.Bessagnet, M.Chin, and Menut, L.: On the contribution of natural Aeolian sources to particulate matter concentrations in Europe: testing hypotheses with a modelling approach, Atmos. Environ., 39, 3291–3303, 2005. a
Veira, A., Kloster, S., Wilkenskjeld, S., and Remy, S.: Fire emission heights in the climate system – Part 1: Global plume height patterns simulated by ECHAM6-HAM2, Atmos. Chem. Phys., 15, 7155–7171, https://doi.org/10.5194/acp-15-7155-2015, 2015. a
Vieira, D., Borrelli, P., Jahanianfard, D., Benali, A., Scarpa, S., and Panagos, P.: Wildfires in Europe: Burned soils require attention, Environm. Res., 217, 114936, https://doi.org/10.1016/j.envres.2022.114936, 2023. a
Wagner, R., Jähn, M., and Schepanski, K.: Wildfires as a source of airborne mineral dust – revisiting a conceptual model using large-eddy simulation (LES), Atmos. Chem. Phys., 18, 11863–11884, https://doi.org/10.5194/acp-18-11863-2018, 2018. a
Wang, X., Zhang, L., and Moran, M. D.: Development of a new semi-empirical parameterization for below-cloud scavenging of size-resolved aerosol particles by both rain and snow, Geosci. Model Dev., 7, 799–819, https://doi.org/10.5194/gmd-7-799-2014, 2014. a
Winker, D., Pelon, J., Coakley Jr., J. A., Ackerman, S. A., Charlson, R. J., Colarco, P. R., Flamant, P., Fu, Q., Hoff, R. M., Kittaka, C., Kubar, T. L., Le Treut, H., McCormick, M. P., Megie, G., Poole, L., Powell, K., Trepte, C., Vaughan, M. A., and Wielicki, B. A.: The CALIPSO Mission: A Global 3D View of Aerosols and Clouds, B. Am. Meteorol. Soc., 91, 1211–1229, 2010. a, b
Zhang, L., Gong, S., Padro, J., and Barrie, L.: A size-segregated particle dry deposition scheme for an atmospheric aerosol module, Atmos. Environ., 35, 549–560, 2001. a
- Abstract
- Introduction
- The modeling system
- Impact of fires on aerosol
- Impact of fires on surface ozone concentrations
- Relative contributions of processes impacted by fires
- Conclusions
- Appendix A: Coordinates of measurement stations
- Appendix B: Maps of surface properties
- Code availability
- Data availability
- Author contributions
- Competing interests
- Disclaimer
- Acknowledgements
- Review statement
- References