the Creative Commons Attribution 4.0 License.
the Creative Commons Attribution 4.0 License.
 | 03 Jul 2023
Microphysical and thermodynamic phase analyses of Arctic low-level clouds measured above the sea ice and the open ocean in spring and summer
Christiane Voigt
Tina Jurkat-Witschas
Valerian Hahn
Guillaume Mioche
Olivier Jourdan
Régis Dupuy
Christophe Gourbeyre
Alfons Schwarzenboeck
Johannes Lucke
Yvonne Boose
Mario Mech
Stephan Borrmann
André Ehrlich
Andreas Herber
Christof Lüpkes
Manfred Wendisch
Airborne in situ cloud measurements were carried out over the northern Fram Strait between Greenland and Svalbard in spring 2019 and summer 2020. In total, 811 min of low-level cloud observations were performed during 20 research flights above the sea ice and the open Arctic ocean with the Polar 5 research aircraft of the Alfred Wegener Institute. Here, we combine the comprehensive in situ cloud data to investigate the distributions of particle number concentration N, effective diameter Deff, and cloud water content CWC (liquid and ice) of Arctic clouds below 500 m altitude, measured at latitudes between 76 and 83∘ N. We developed a method to quantitatively derive the occurrence probability of their thermodynamic phase from the combination of microphysical cloud probe and Polar Nephelometer data. Finally, we assess changes in cloud microphysics and cloud phase related to ambient meteorological conditions in spring and summer and address effects of the sea ice and open-ocean surface conditions. We find median N from 0.2 to 51.7 cm−3 and about 2 orders of magnitude higher N for mainly liquid clouds in summer compared to ice and mixed-phase clouds measured in spring. A southerly flow from the sea ice in cold air outbreaks dominates cloud formation processes at temperatures mostly below −10 ∘C in spring, while northerly warm air intrusions favor the formation of liquid clouds at warmer temperatures in summer. Our results show slightly higher N in clouds over the sea ice compared to the open ocean, indicating enhanced cloud formation processes over the sea ice. The median CWC is higher in summer (0.16 g m−3) than in spring (0.06 g m−3), as this is dominated by the available atmospheric water content and the temperatures at cloud formation level. We find large differences in the particle sizes in spring and summer and an impact of the surface conditions, which modifies the heat and moisture fluxes in the boundary layer. By combining microphysical cloud data with thermodynamic phase information from the Polar Nephelometer, we find mixed-phase clouds to be the dominant thermodynamic cloud phase in spring, with a frequency of occurrence of 61 % over the sea ice and 66 % over the ocean. Pure ice clouds exist almost exclusively over the open ocean in spring, and in summer the cloud particles are most likely in the liquid water state.
The comprehensive low-level cloud data set will help us to better understand the role of clouds and their thermodynamic phase in the Arctic radiation budget and to assess the performance of global climate models in a region of the world with the strongest anthropogenic climate change.
- Article
(7182 KB) - Full-text XML
- BibTeX
- EndNote


The impact of global warming is particularly strong in the Arctic, where temperatures rise at an accelerated rate relative to the rest of the globe, a phenomenon known as Arctic amplification (Serreze and Francis, 2006). Clouds may play a key role for processes underlying the intense mean temperature rise in high latitudes (Wendisch et al., 2022). In contrast to cloud-free conditions, where the radiation energy budget is dominated by the low albedo of the dark open ocean, the presence of clouds significantly increases the reflection of solar radiation towards space and the emission of thermal-infrared radiation towards the surface. These changes of the atmospheric radiative energy budget are highly sensitive to the microphysical properties of Arctic clouds (Curry et al., 1996). In particular, the size, shape, and thermodynamic phase of the hydrometeors influence the atmospheric energy fluxes and are often poorly represented in observations and models (Naud et al., 2014; Bodas-Salcedo et al., 2016; McCoy et al., 2016; Tan and Storelvmo, 2019; Wendisch et al., 2019; Kretzschmar et al., 2020). Observations show that the surface temperature is higher when clouds containing liquid water droplets are present (Shupe et al., 2022). Hence, clouds have a direct impact on the sea ice thickness, snow depth, surface albedo, solar radiative energy input, and other parameters. In turn, the surface conditions feed back on the cloud properties (Stapf et al., 2020). Clouds frequently occur in the Arctic throughout the whole year (Mioche et al., 2015), for example, an occurrence of around 80 % was measured at the research station Ny-Ålesund, predominantly at altitudes below 2 km (Nomokonova et al., 2019). These low-level clouds are often found in a mixed-phase state (Shupe et al., 2006), representing a three-phase colloidal system consisting of water vapor, ice particles, and coexisting supercooled liquid water droplets. In spite of many years of mixed-phase cloud research (Korolev et al., 2017), our knowledge about mixed-phase cloud physical processes remains incomplete. Hence, their representation in numerical weather prediction and climate models remains challenging (Morrison et al., 2011; Bock et al., 2020). In the Arctic the micro- and macrophysical properties of clouds are strongly affected by seasonal changes in meteorological weather situations such as atmospheric rivers, warm air intrusions, cold air outbreaks, or Arctic cyclones, as well as small-scale temperature and humidity fluctuations (McFarquhar et al., 2007; Mioche et al., 2017; Ruiz-Donoso et al., 2020; Wendisch et al., 2022). Turbulent fluxes and moisture transport are affected by the presence of sea ice (Lüpkes et al., 2011; Vihma et al., 2014; Wendisch et al., 2019; Elvidge et al., 2021; Schmale et al., 2021; Michaelis and Lüpkes, 2022). The total Arctic sea ice reaches its maximum extent in early March and a minimum in September, which leads to a change in the overall surface properties, e.g., the surface albedo. During springtime, a strong surface temperature gradient develops between sea ice and open ocean, while in summer the gradient is strongly reduced (Wendisch et al., 2022), which affects the structure of the lower atmosphere and, in particular, the atmospheric boundary layer (ABL) and clouds within. In addition, different types of aerosol particles are formed and transported in the Arctic ABL and influence the cloud formation (Moschos et al., 2022).
Several studies have addressed the microphysical properties of low-level Arctic clouds measured by airborne in situ observations before. Such studies often investigated the clouds in case studies at distinct meteorological situations or surface properties. McFarquhar et al. (2007) used airborne in situ data to study the thermodynamic phase of Arctic clouds during fall. Results revealed that during a 4 d measurement period, clouds were mostly in a mixed-phase state, with a liquid layer at the top. Case studies by Lawson and Zuidema (2009) and Klingebiel et al. (2015) analyzed cloud particles using in situ measurements. Lawson and Zuidema (2009) detected large dendrites, rimed ice, and aggregates in summertime clouds formed in Arctic frontal and convective systems, while Klingebiel et al. (2015) examined liquid droplets in Arctic stratocumulus clouds in spring and found bimodal droplet size distribution at the cloud top. In situ measured vertical Arctic cloud profiles during an airborne campaign in spring were analyzed by Mioche et al. (2017) regarding microphysical cloud properties. They found that the prevalent meteorological conditions had an impact on the cloud microphysical properties. Dodson et al. (2021) evaluated the microphysical properties of in situ measured Arctic low-level clouds in September and compared these measurements with models. The study suggests that the observed discrepancy may be due to the models' poor representation of thermodynamic parameters. In a case study, Young et al. (2016) investigated the microphysical properties of clouds during a cold air outbreak in March near the sea ice edge. The study revealed the strong near-surface temperature increase as the primary driver of microphysical evolution during the transition from the sea ice to the open ocean.
It is essential to study microphysical cloud processes, in particular the properties of hydrometeors and the dominant thermodynamic cloud phase, to improve our knowledge on Arctic amplification and the Arctic radiative energy budget. During the two campaigns “Aircraft campaign observing FLUXes of energy and momentum in the cloudy boundary layer over polar sea ice and ocean” (AFLUX) and “Multidisciplinary Drifting Observatory for the Study of Arctic Climate – Airborne observations in the Central Arctic” (MOSAiC-ACA) conducted within the framework of the “ArctiC Amplification: Climate Relevant Atmospheric and SurfaCe Processes, and Feedback Mechanisms (AC)3” project (Wendisch et al., 2017), a comprehensive data set with microphysical measurements in low-level clouds was collected in the vicinity of Svalbard over the ice-covered and the open ocean in spring and in summer. In this work, we present an overview of low-level Arctic microphysical cloud properties and compare cloud particle number concentration, size, and phase in spring and summer and for sea-ice-covered and open-ocean conditions. We distinguish between liquid water, mixed-phase, ice clouds, and swollen aerosol particles and present the frequency of occurrence of a certain thermodynamic phase depending on meteorological and surface conditions.
The article is structured as follows. In Sect. 2, the aircraft field campaigns are described including the meteorological situation using trajectory analysis, as well as the airborne in situ instrumentation and the methodology of data evaluation. In Sect. 3.1 we distinguish the in situ cloud particle measurements by the ambient atmosphere and surface conditions (spring over sea ice, spring over the open ocean, summer over sea ice, and summer over ocean) and derive mean and altitude-resolved microphysical cloud properties. By introducing a hydrometeor classification depending on particle number concentration, size, and angular scattering properties, we study the microphysical properties and thermodynamic phase of low-level Arctic clouds in Sect. 3.2 and discuss their frequency of occurrence. In Sect. 4 we summarize the findings of this study and discuss the implications.
2.1 The airborne field campaigns AFLUX and MOSAiC-ACA
In situ cloud data presented in this study were collected during the following two airborne field campaigns in the Arctic region around Svalbard. The Aircraft campaign AFLUX was based in Longyearbyen (78∘ N, 015∘ E) and took place in the region of the Fram Strait in March and April 2019. The aircraft campaign MOSAiC-ACA, as part of the Multidisciplinary drifting Observatory for the Study of Arctic Climate (MOSAiC) expedition was conducted in September 2020, complementing the local atmospheric measurements on board of the German icebreaking research vessel (RV) Polarstern (Knust, 2017; Herber et al., 2021; Shupe et al., 2022).
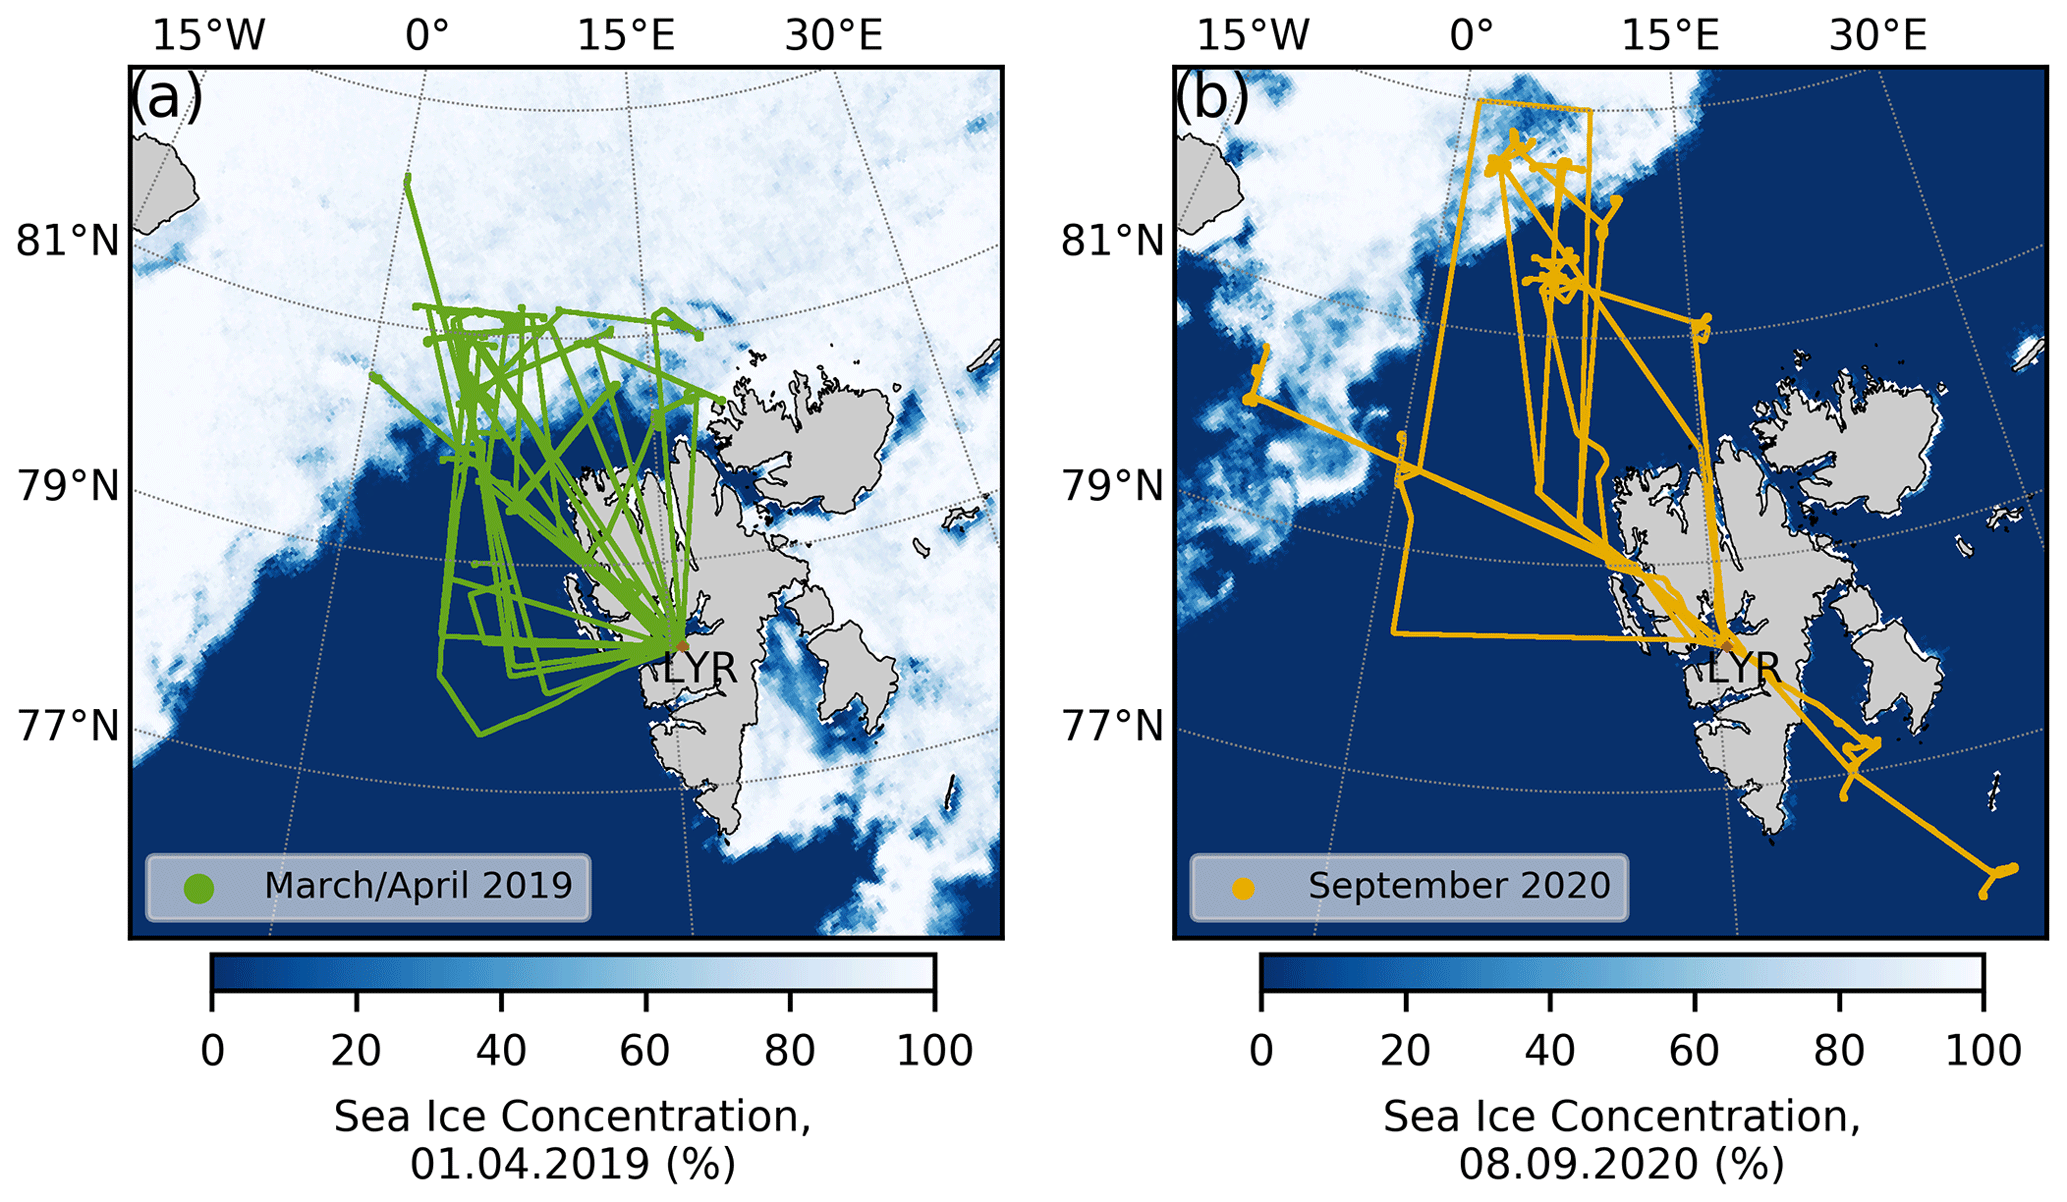
Figure 1Maps of the flights during AFLUX (a) and MOSAiC-ACA (b) in the vicinity of Svalbard, Longyearbyen (LYR). Background shows the sea ice concentration at the halftime of each campaign recorded by the Advanced Microwave Scanning Radiometer 2 (AMSR2) onboard the GCOM-W1 satellite.
Table 1Flight table for AFLUX summarizing the air mass origin (discussed in Sect. 2.2), the temperature range of cloud measurements, and the total time of cloud measurements. The fraction of measurements over the sea ice and open ocean are added. Note that minutes in clouds over the sea ice and over the ocean do not add up to total, as for total all surface conditions are considered, for condition sea ice SIC > 80 % and condition ocean SIC < 20 % only.
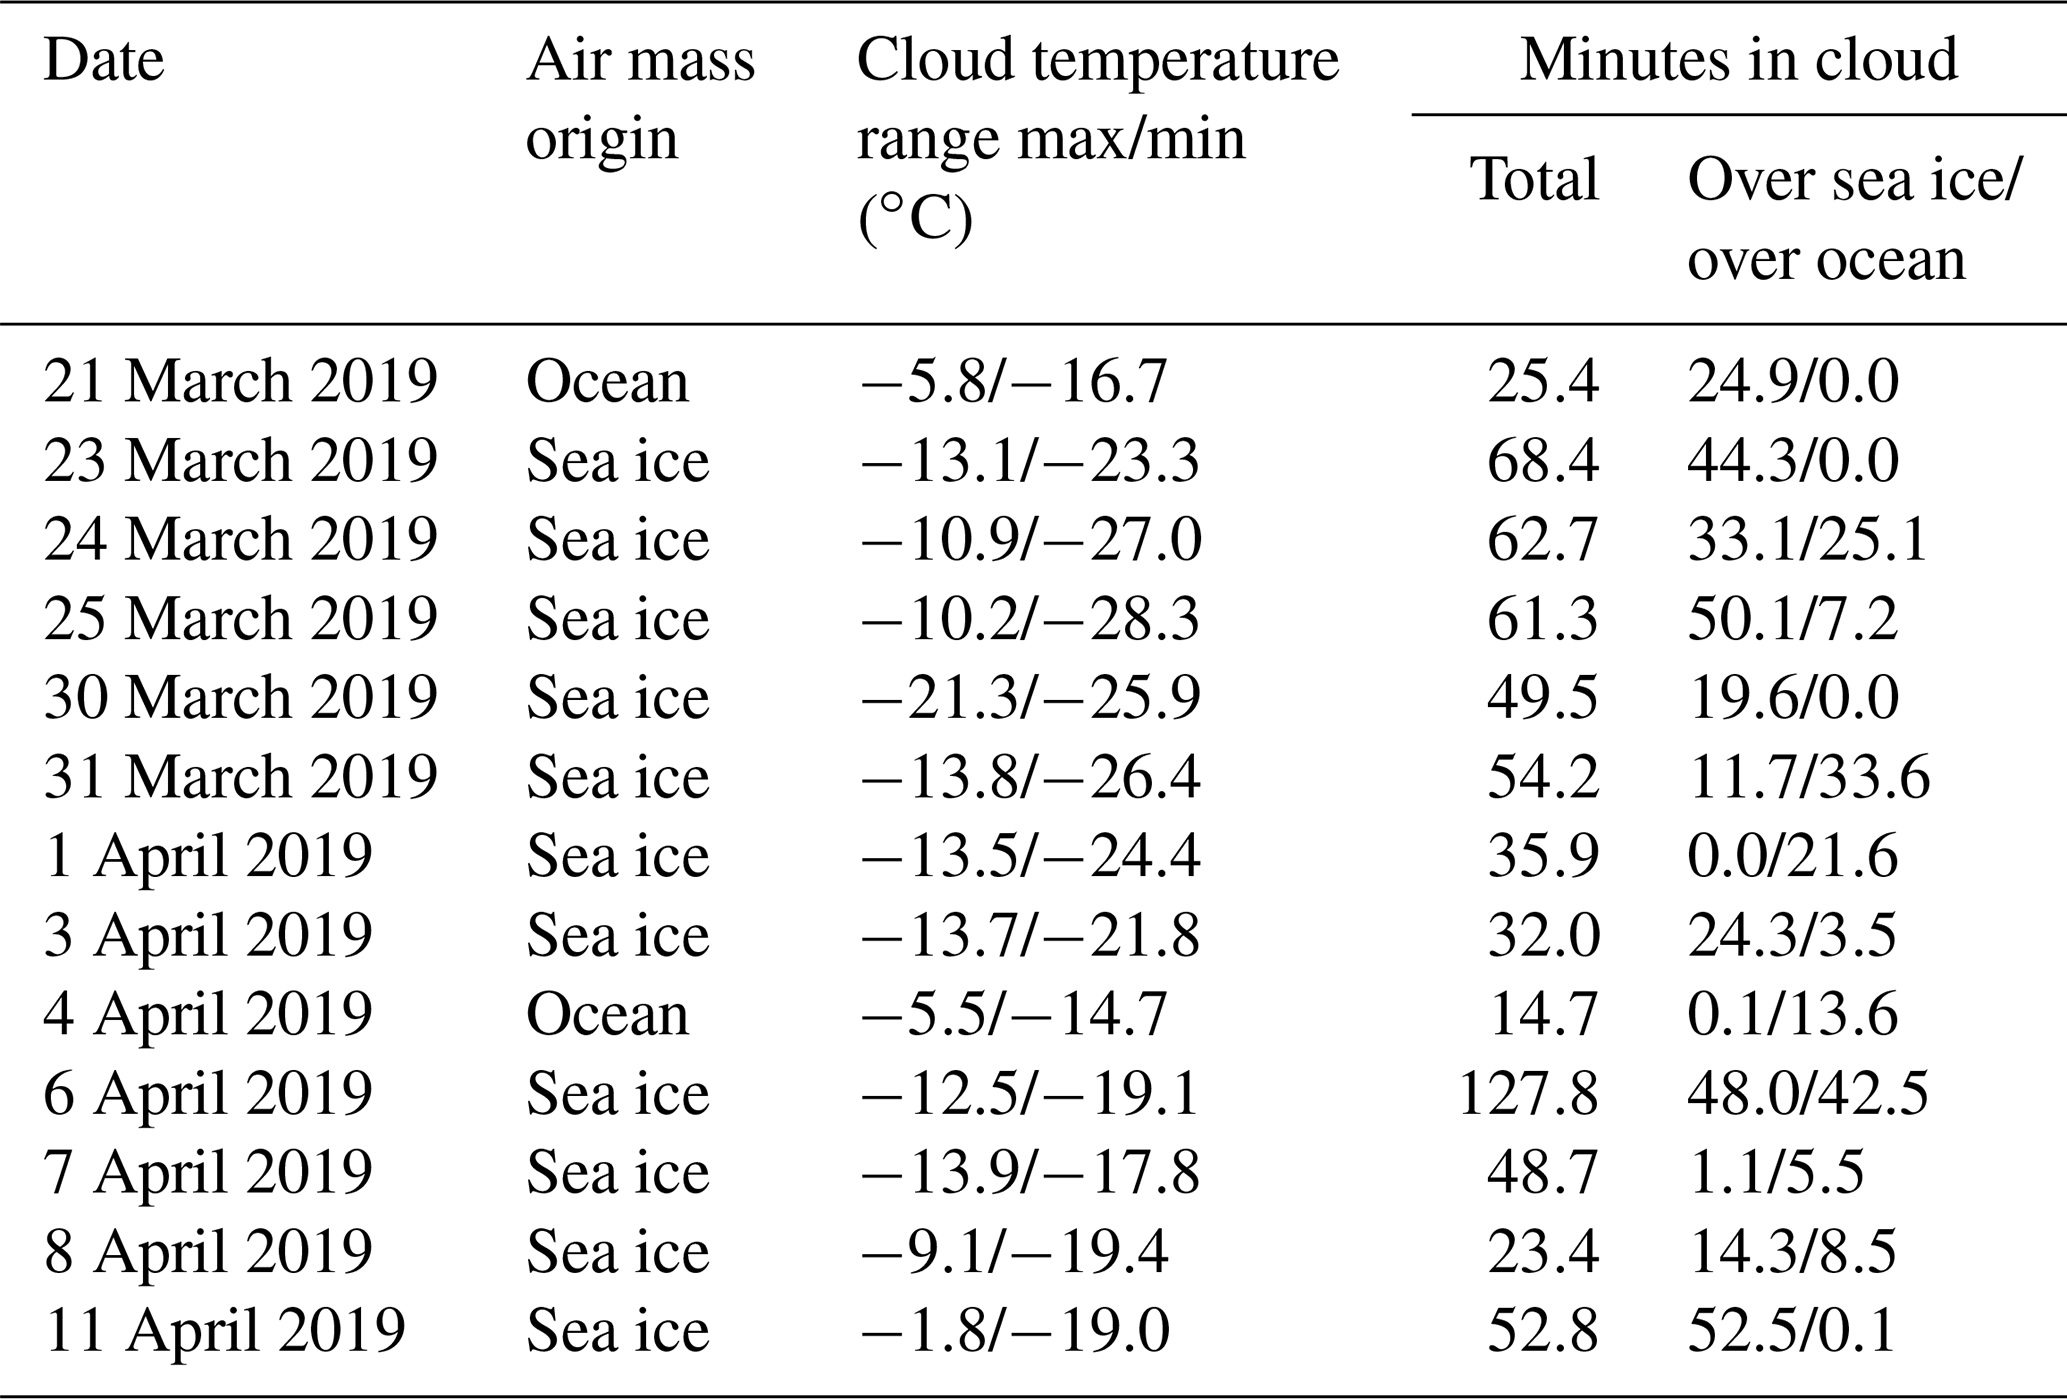
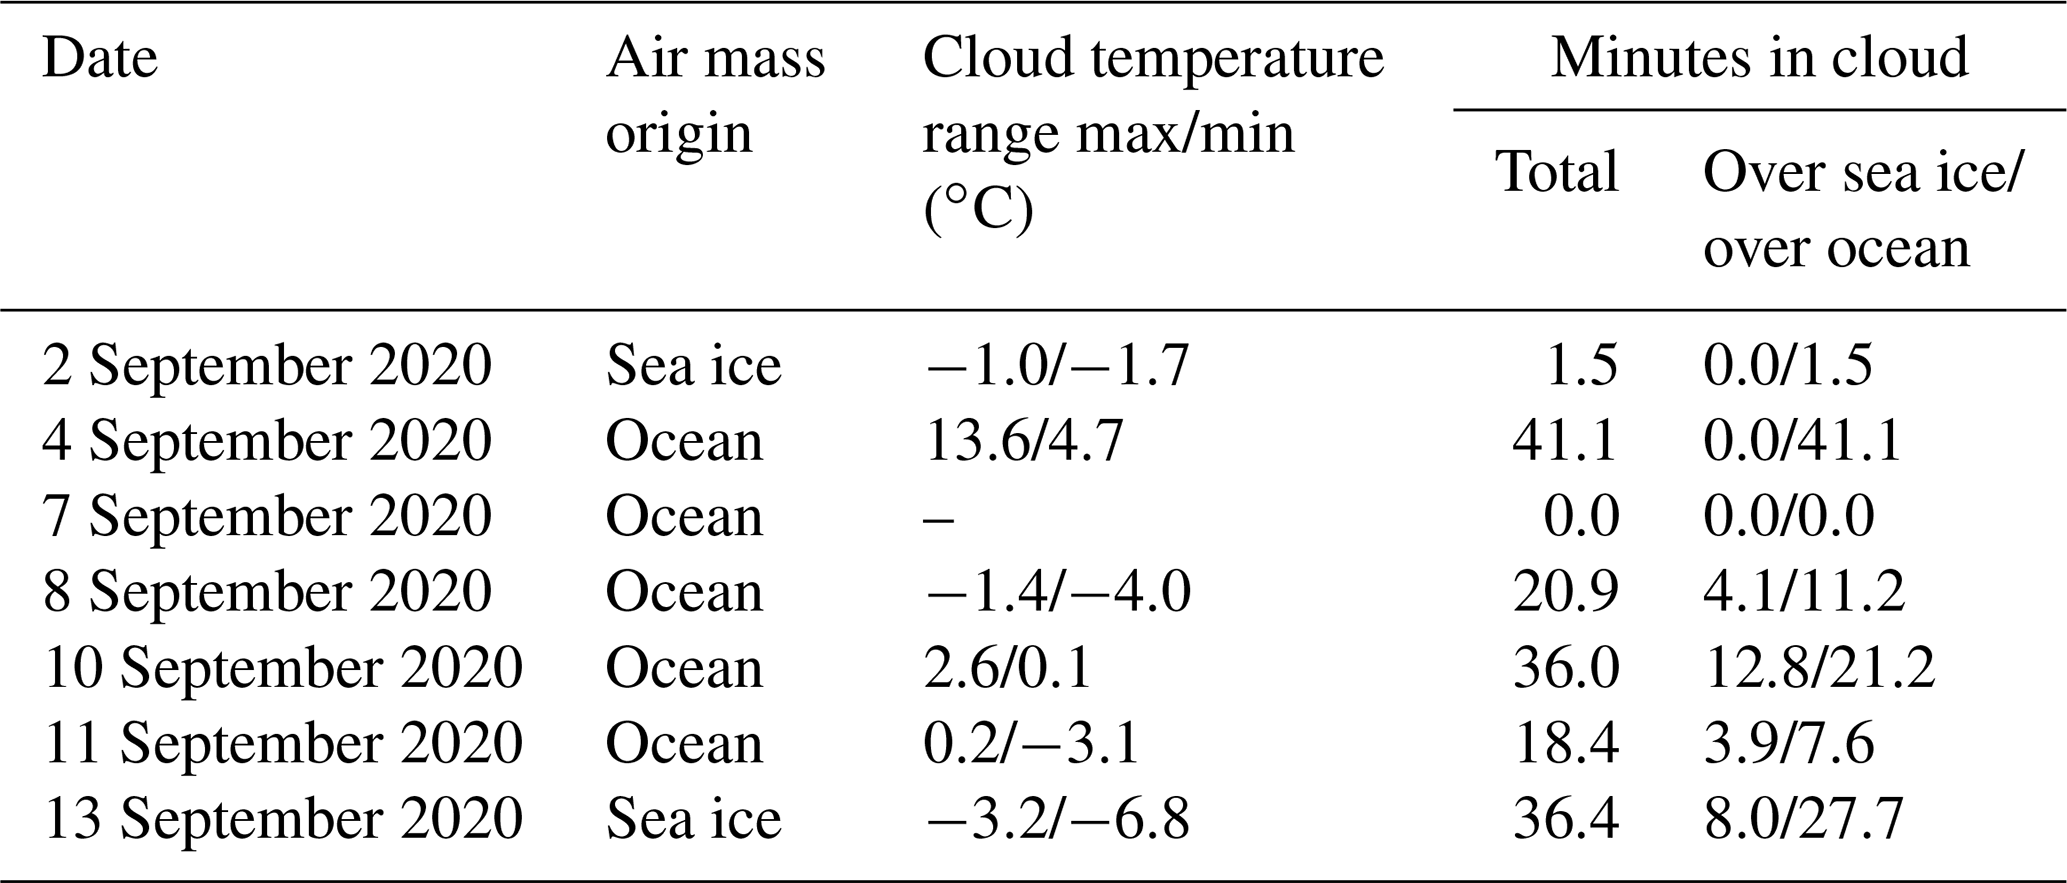
Table 2Flight table for MOSAiC-ACA. Same columns as in Table 1.
During both campaigns, the research aircraft Polar 5, a former Douglas DC-3 specifically modified by Basler Turbo Conversions for flying under extreme polar conditions (BT-67; Wesche et al., 2016), operated by the Alfred Wegener Institute (AWI), was used as a platform to conduct remote sensing and in situ measurements of clouds. A detailed description of the data collected during both campaigns is given by Mech et al. (2022a). The flight strategy for the campaigns was to provide both in situ and remote sensing measurements over the sea ice and the open ocean. The respective flight paths are displayed in Fig. 1. The figure also shows the fraction of sea ice concentration (SIC) from GCOM-W1 satellite observations by the Advanced Microwave Scanning Radiometer 2 (AMSR2) instrument (Spreen et al., 2008), at a representative time for each campaign. The campaign periods were chosen to be in the season of largest and lowest sea ice extent in the Arctic. The data set of this study consists of 1992 horizontal low-level in situ cloud sequences (1685 during AFLUX and 307 during MOSAiC-ACA). One cloud sequence is defined as a continuous cloud measurement at the same altitude level. The cloud data cover more than 48 668 measurement points at 1 Hz resolution (in total 811 min of cloud measurements, 657 min during AFLUX and 154 min during MOSAiC-ACA) performed during 20 flights in the Arctic, mainly within the ABL over sea ice and the open ocean (see Tables 1 and 2). In the following Sect. 2.2, the meteorological conditions during both campaigns are explained using backward trajectory calculations.
2.2 Meteorological situation
The weather situations during both campaigns differed significantly. Colder temperatures in spring compared to summer and differences in Arctic sea ice extent have a major influence on the atmospheric temperature structure. Large-scale weather systems favor southerly air mass transport in the Fram Strait in spring, e.g., cold air outbreaks, and northerly transport during summer, e.g., warm air intrusions and atmospheric rivers. Clouds form within a couple of hours inside the ABL. Also, studies have shown that aerosol particle number concentration and chemical composition inside the Arctic ABL strongly depend on regional processes (Hartmann et al., 2020; Köllner et al., 2021). In order to determine the origin of the probed air masses during both field campaigns, backward trajectories were calculated for each day with flights inside the ABL. Trajectories end at 100, 300, and 500 m altitude at a position representative of the low-level in situ cloud measurements (80.27∘ N, 007.20∘ E). The air mass pathways were retrieved from the Hybrid Single-Particle Lagrangian Integrated Trajectory model (HYSPLIT) (Stein et al., 2015; Rolph et al., 2017) using the Global Data Assimilation System (GDAS) with 0.5∘ horizontal resolution as meteorological input for the AFLUX time period and the Global Forecast System (GFS), with 0.25∘ horizontal for the MOSAiC-ACA time period. In combination with the AMSR2 sea ice coverage, data for each flight day were classified with an air mass origin from the ocean or from the sea ice depending on the dominant surface condition below the air mass pathways over the last 24 h (see Fig. 2 and Tables 1 and 2). Out of all considered cloud measurements inside the ABL, 77.6 % are attributed to air masses originating from the sea ice and 22.4 % to air masses originating from the open ocean. During AFLUX the general wind direction was dominated by off-ice direction while on-ice flow prevailed during summer (see Fig. 3a). Air masses classified as originating from the sea ice can be attributed to cold air outbreaks in most cases. Here typically strong winds transport air masses over longer distances from the central Arctic to the Fram Strait within 24 h. In contrast, air masses originating from the ocean are mostly of regional origin, with the lowest observed latitude over the last 24 h being 77.0∘ N. Also, cloud temperature is strongly linked to the air mass origin, with colder temperatures during off-ice flow compared to on-ice flow. The temperature range for the low-level cloud measurements is shown in Fig. 3b and c, divided according to air mass origin and season.
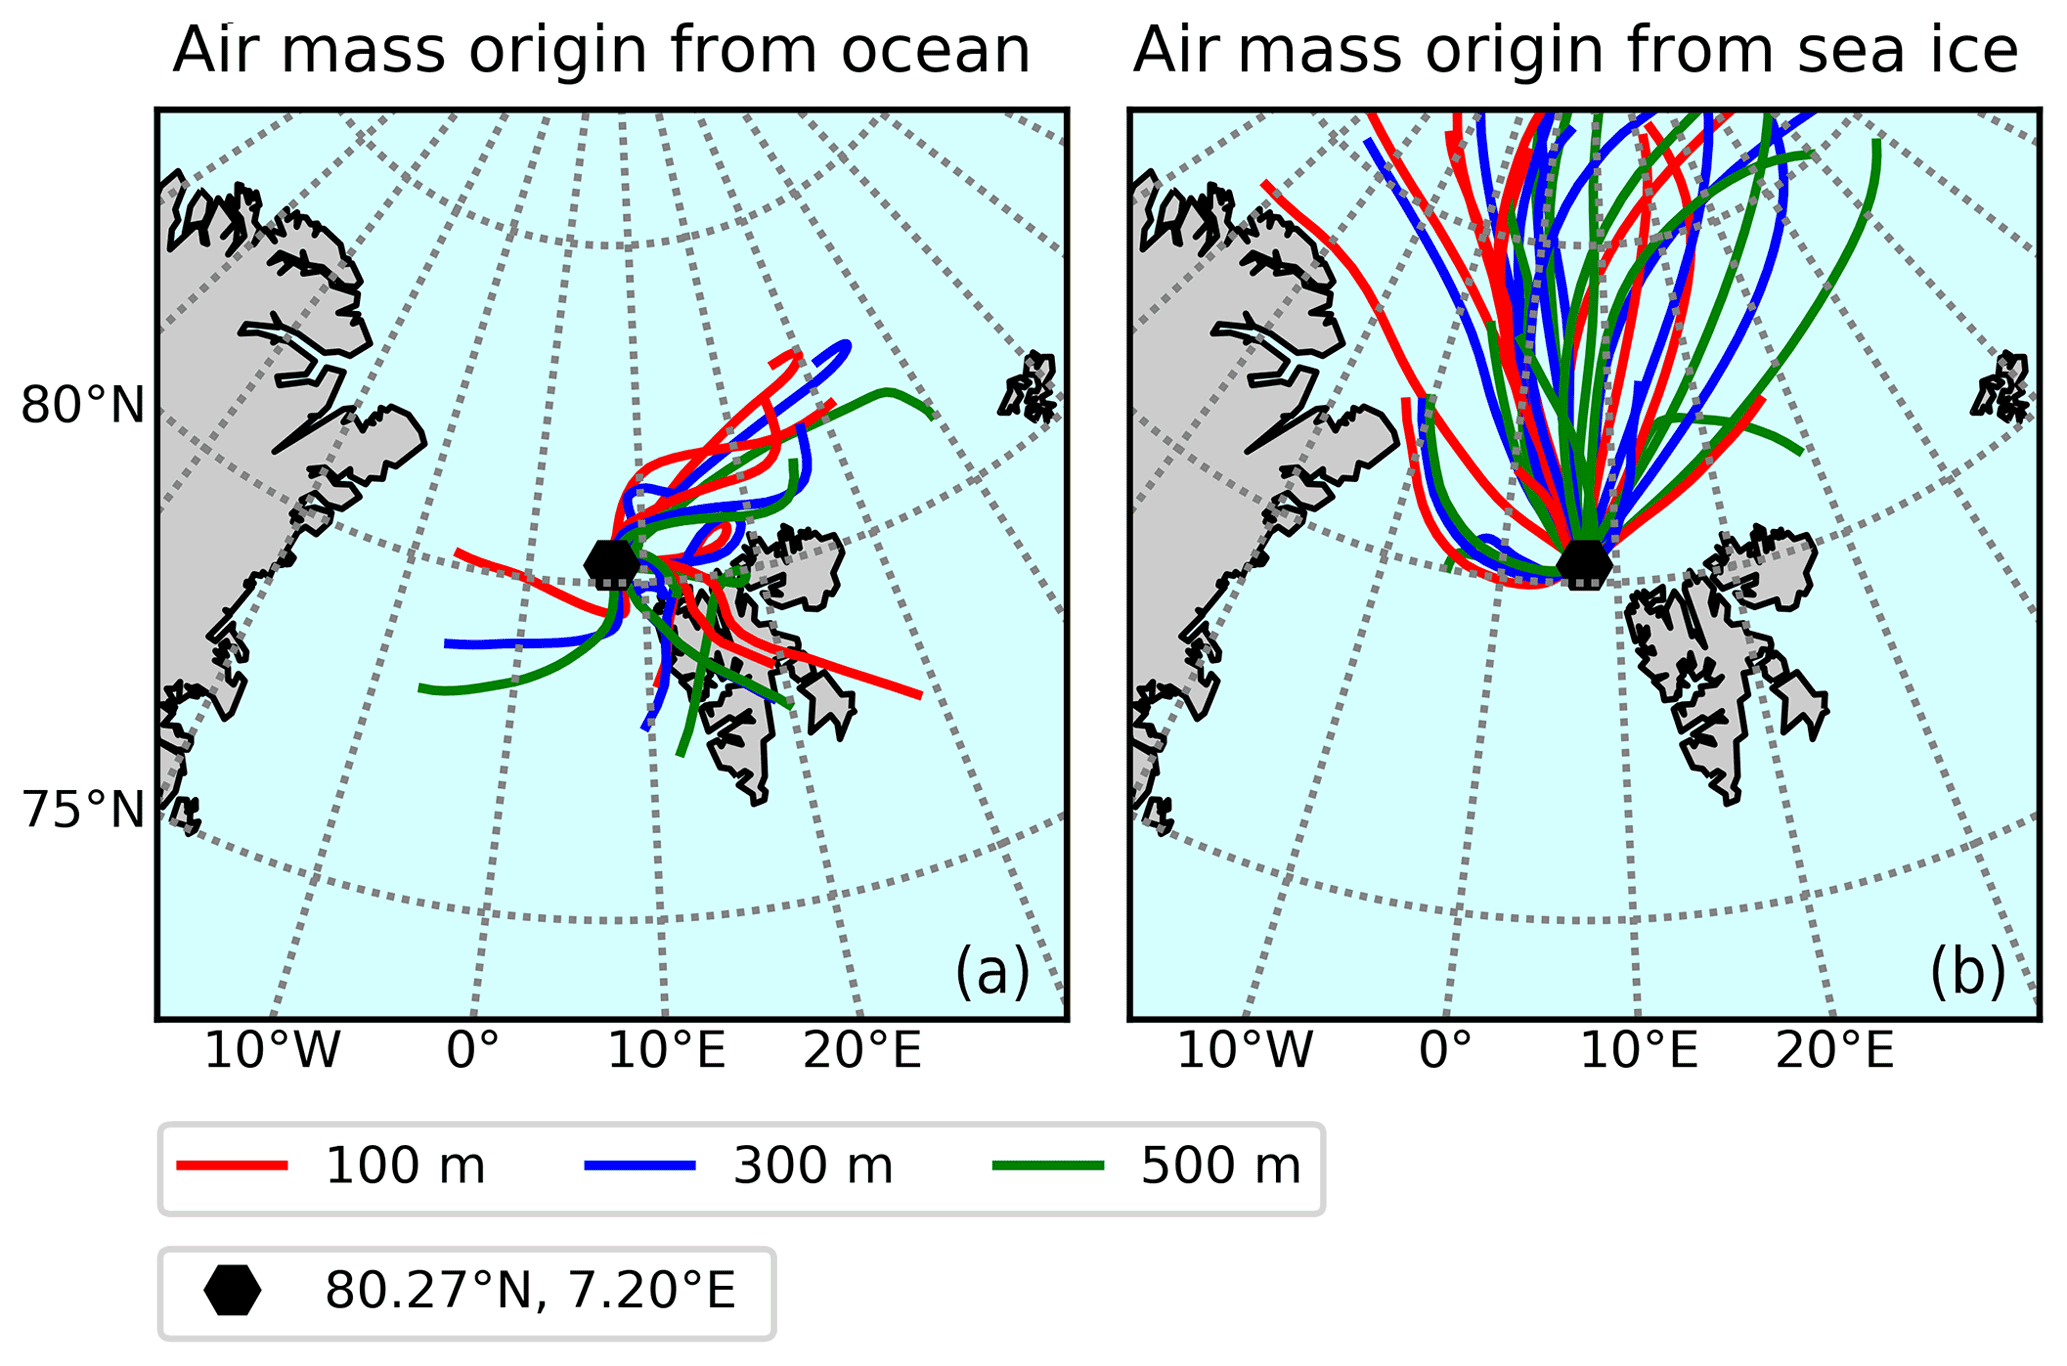
Figure 2Air mass trajectories calculated based on 24 h HYSPLIT backward analysis classified by dominant surface condition: ocean (a) and sea ice (b).
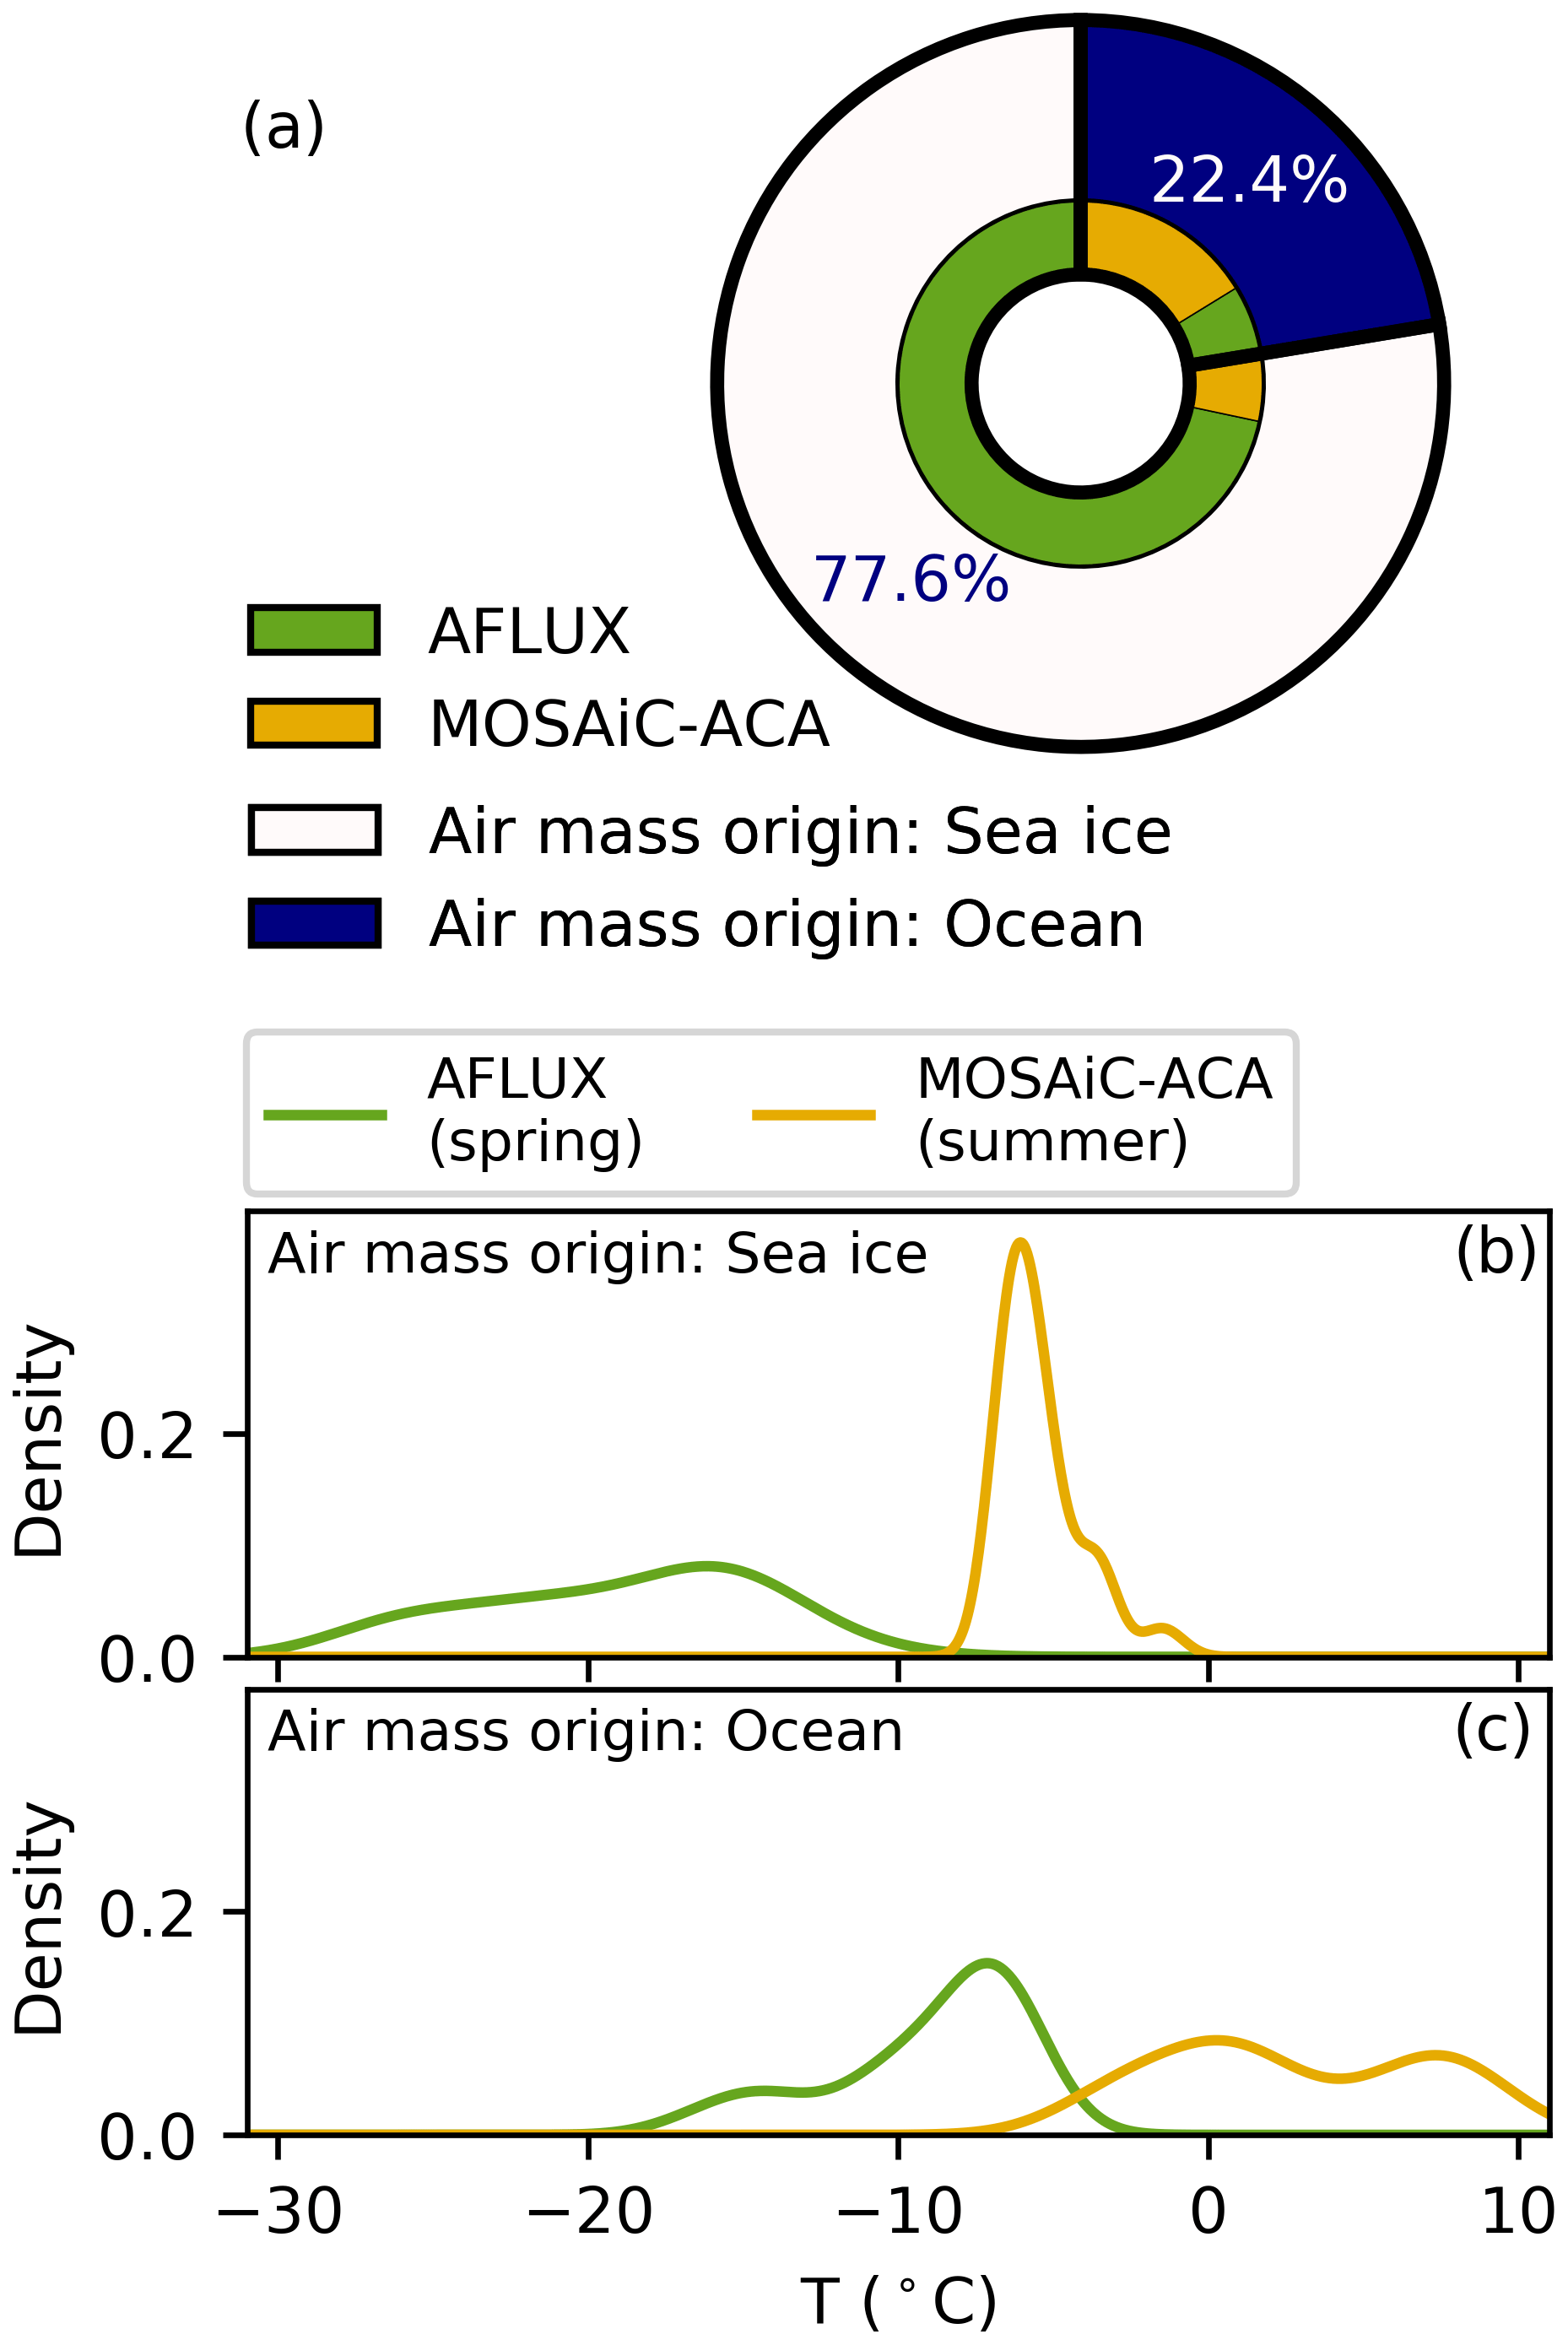
Figure 3(a) Percentage of time with measurements inside clouds partitioned by air mass, classified as originating from the ocean or sea ice, and partitioned by the season: spring (AFLUX) and summer (MOSAiC-ACA). Normalized frequency distribution of cloud temperatures in air masses originating from (b) the sea ice and (c) the open ocean during AFLUX and MOSAiC-ACA.
Although all flights were planned to avoid any influence of Svalbard, some trajectories indicate air masses overflowing the landmasses of the Svalbard archipelago. For these individual days the backwards trajectories in Fig. 2 might not be representative. The microphysical cloud properties presented in this section were measured along the Polar 5 flight track and depend on the meteorological situation on these days. Climatological studies in the Fram Strait on air mass flow direction by Dahlke et al. (2022) are in line with our meteorological analyses for the seasons spring 2019 and summer 2020, supporting the hypothesis that the measured clouds can represent spring and summer conditions in the Arctic near Svalbard. Also, the flight strategy remained the same for both campaigns and, with the large amount of cloud measurements over varying surface conditions and different flight days during both seasons, reveals different microphysical properties for each season over the sea ice and over the ocean.
2.3 In situ instrumentation
During both campaigns, Polar 5 was equipped with an enhanced payload for in situ cloud measurements, characterizing hydrometeors in a size range from 2.8 to 6400 µm. The instruments use two types of measurement techniques: scattering probes (Cloud Aerosol Spectrometer (CAS) for AFLUX, Cloud Droplet Probe (CDP) for MOSAiC-ACA, and Polar Nephelometer (PN)) and optical array probes (Cloud Imaging Probe (CIP), the Precipitation Imaging Probe (PIP), and the 2D Stereo Imaging Probe (2D-S)).
Data retrieved by the CAS and the CDP were used to derive the droplet size distribution from 2.8 to 50 µm, (e.g., Wendisch et al., 1996; Baumgardner et al., 2001, 2011; Wendisch and Brenguier, 2013; Kleine et al., 2018; Voigt et al., 2021). Both instruments count the number of cloud particles in the sampling volume and determine their individual size from the intensity of forward-scattered laser light (658 nm). Standard methods for calibration using monodisperse glass beads were applied (Lance et al., 2010). The binning for the particle sizing was adopted using Mie theory with a refraction index of water (n=1.33), including a distinct choice of bin limits to avoid ambiguities due to Mie resonances in the size range below 10 µm.
Particles in the size range of 30 µm to 6.4 mm are measured with optical array probes. The basic measurement principle of optical array probes consists of shadowgraphs of droplets and ice particles. Two-dimensional shadow images of hydrometeors are reconstructed from individual image slices, where a slice monitors the state (shadowed or non shadowed) of a linear multi-element photo diode array at a given moment in time. The data recorded by the CIP and the PIP (Baumgardner et al., 2001) differ in pixel resolution (CIP: 64 diode array with 15 µm resolution, PIP: 64 diode array with 103 µm resolution; Voigt et al., 2017). Data in the overlap size region are used to check the consistency between the cloud probes. The data processing includes identification and removal of shattered particle artifacts, stuck bit correction, and particle sizing, which is done with the processing software SODA (Software for OAP Data Analysis; Bansemer, 2023). The standard sizing method “circle fit” is used for the particle diameter calculation, which is defined as the diameter of the minimum enclosing circle of the projected 2D image. In addition to the CIP and PIP, a 2D-S (Lawson et al., 2006) equipped with 128 diode array of 10 µm resolution was installed on the wing of Polar 5. The 2D-S data were used for a backup and validation of the CIP data.
The PN provides a direct measurement of the non-normalized scattering phase function (i.e., angular scattering coefficients, ASCs) of a volume of cloud particles crossing a collimated laser beam with a wavelength of 0.8 µm near the focal point of a parabolic mirror. The light scattered by water droplets, ice crystals, or a mixture of both is recorded by a circular array of photodiodes (channels) (Gayet et al., 1997). Hence, the angular scattering pattern of cloud particle with diameter from a few micrometers to 1 mm can be obtained for scattering angles ranging from ±15 to ±162∘ and with an angular resolution of 3.5∘. Measurement errors lie between 3 % to 5 % for scattering angles ranging from 15 to 155∘ with a maximum of 20 % at 162∘ (Shcherbakov et al., 2006). Averaged values of the calibrated ASCs were computed at a 1 Hz frequency and synchronized with the data recorded on the aircraft system. Electronic offsets of each channel were estimated and subtracted from the signal based on the signal measured during clear air sequences. Extinction coefficient and asymmetry parameter g can be derived from the ASC measurements (Gerber et al., 2000; Gayet et al., 2002, 2012) with uncertainties of ∼ 25 % and ±0.04, respectively. Jourdan et al. (2003, 2010) showed that the combination of these parameters can be used to discriminate spherical from non-spherical cloud particles, as well as the dominant cloud thermodynamic phase.
All cloud probes were heated in order to avoid icing during the flights. Data are processed at 1 Hz frequency, which corresponds to a spatial resolution between 50 and 90 m depending on the aircraft speed. The data recorded by the in situ instrumentation during both campaigns are published in PANGAEA with open access (Moser and Voigt, 2022; Dupuy et al., 2022a; Moser et al., 2022; Dupuy et al., 2022b). Cloud data processing for both campaigns is explained in more detail by Mech et al. (2022a). The next section indicates how they are used to analyze the low-level clouds in both campaigns.
2.4 Processing of Arctic cloud data
Data presented in this study stem from a combination of three instruments. Particles below 30 µm diameter are exclusively detected by CAS or CDP. Between diameters of 30 to 40 µm, averaged data from the scattering probe and the CIP are calculated, from 40 to 250 µm diameter, CIP data only, in the overlap region of 250 to 350 µm mean data of CIP and PIP and above 350 µm data recorded by the PIP are used. The microphysical cloud properties including the total particle number concentration (N), effective diameter (Deff), and cloud water content (CWC) are calculated from the combined particle size distribution. In order to derive N, the number concentration for each particle size bin is added up. Deff is the ratio of the third to the second moment of the cloud particle size spectrum (Schumann et al., 2011). The CWC is defined here as the sum of the measured liquid and ice water content. Hydrometeors with diameters smaller than 50 µm are assumed to be droplets and those with diameters larger than 50 µm as ice, which is appropriate for the majority of low-level Arctic mixed-phase clouds, where ice dominates the large-particle regime (McFarquhar et al., 2007; Korolev et al., 2017). The ice water content is calculated using the mass-dimension relationship
with D the particle diameter from the circle fit method and the parameters (a = 0.00528 g cm−b and b = 2.1) proposed by Heymsfield et al. (2010, 2023). Another effective method to separate the liquid and ice fraction in clouds is recommended by D'Alessandro et al. (2019). The method classifies the thermodynamic phase of the cloud into ice, liquid, or a mixed-phase based on a combination of microphysical properties recorded by similar in situ cloud particle sizing instruments (Yang et al., 2021). In this work, however, the thermodynamic phase discrimination in Sect. 3.2 is achieved with the PN. Attributed to a recording failure of the CIP on 11 April 2019, the data were replaced by the 2D-S for that day. Uncertainties in cloud particle probe data depend on the microphysical cloud properties, as certain particle size ranges are detected by different measurement techniques. In liquid and mixed-phase clouds, N has a measurement uncertainty range of 10 %–30 % derived from the scattering probes (Baumgardner et al., 2017). The larger ice crystals in ice clouds are counted by the optical array probes, with an estimated uncertainty of approximately 50 % in N (Baumgardner et al., 2017; McFarquhar et al., 2017). In liquid clouds, the droplets are sized by the scattering probes, which have a range of 10 %–50 % uncertainty (Baumgardner et al., 2017). Sizing in ice and mixed-phase clouds is dominated by data from the optical array probes, which have an uncertainty of 20 % (Baumgardner et al., 2017; Gurganus and Lawson, 2018). CWC data have an uncertainty of 20 % for liquid clouds (Faber et al., 2018). In ice clouds, we assume an uncertainty of 50 % in CWC (Heymsfield et al., 2010; Hogan et al., 2012). In mixed-phase clouds, we estimate the uncertainty of CWC to be in between the liquid and ice cloud measurement, hence 20 %–50 %.
Basic meteorological parameters including wind, temperature, humidity, and pressure along the flight track were provided by the meteorological instrumentation mounted at the nose boom of Polar 5. For position tracking GPS data are used. In this study, we restricted our measurements to horizontal in situ flight legs to obtain microphysical cloud data with high statistical accuracy. The Arctic ABL over the sea ice is commonly quite thin and usually less than 500 m thick. Over the open ocean the ABL can extend to higher altitudes. However, during both campaigns the majority of low-level in situ cloud measurements were conducted below 500 m to enable sufficient statistics for comparison. The cloud distribution versus altitude in Fig. 4, discussed in Sect. 3.1, supports our altitude threshold value.
In this study we distinguish the cloud data sets in four meteorological and surface conditions: cloud data sets measured during AFLUX over the sea ice (spring–ice), during AFLUX over the ocean (spring–ocean), during MOSAiC-ACA over the sea ice (summer–ice), and during MOSAiC-ACA over the ocean (summer–ocean). For the surface characterization, we use AMSR2 satellite data with flight legs above sea ice (SIC > 80 %) and open ocean (SIC < 20 %). In order to avoid aerosol particles in Sect. 3.1, we define a cloud as a segment where the CWC exceeds g m−3, while in Sect. 3.2 we do not set a threshold to account for all particles in the thermodynamic phase analyses.
3.1 Microphysical properties of Arctic low-level clouds at different ambient meteorological and surface conditions
In this section, we analyze the measured microphysical cloud properties collected over sea ice and the open ocean during spring and summer and distinguish them in terms of seasons and surface conditions. A summary plot in Fig. 4 shows the variability of the CWC measured during both campaigns, AFLUX representing clouds in spring (panel c), and MOSAiC-ACA representing clouds in summer (panel d), as a function of altitude. Additionally, the median temperature for the two seasons is shown in panel (e). Each circle in panels (c) and (d) represents a mean of a cloud measurement along one horizontal flight leg in clouds where successive 1 Hz data points fulfill CWC > 2 g m−3. This threshold removes more than 98 % of all measurements disturbed by aerosol particles, leaving, for example, the data of thick clouds, the data of thin ice clouds, and the measurement of light precipitation untouched. The diameter of the data points indicates the mean N, and the color transparency shows the duration of each continuous cloud measurement. Red data points correspond with clouds where surface conditions are classified as sea ice, and blue corresponds with data points over open ocean. Boxplots in panels (a) and (b) show the CWC data from panels (c) and (d), respectively, weighted by the measurement time within the cloud. The boxes represent the median, the upper quartile, and the lower quartile, and the whiskers give the 97.5th and 2.5th percentile. Large differences between summer and spring clouds and clouds over sea ice and ocean are revealed.
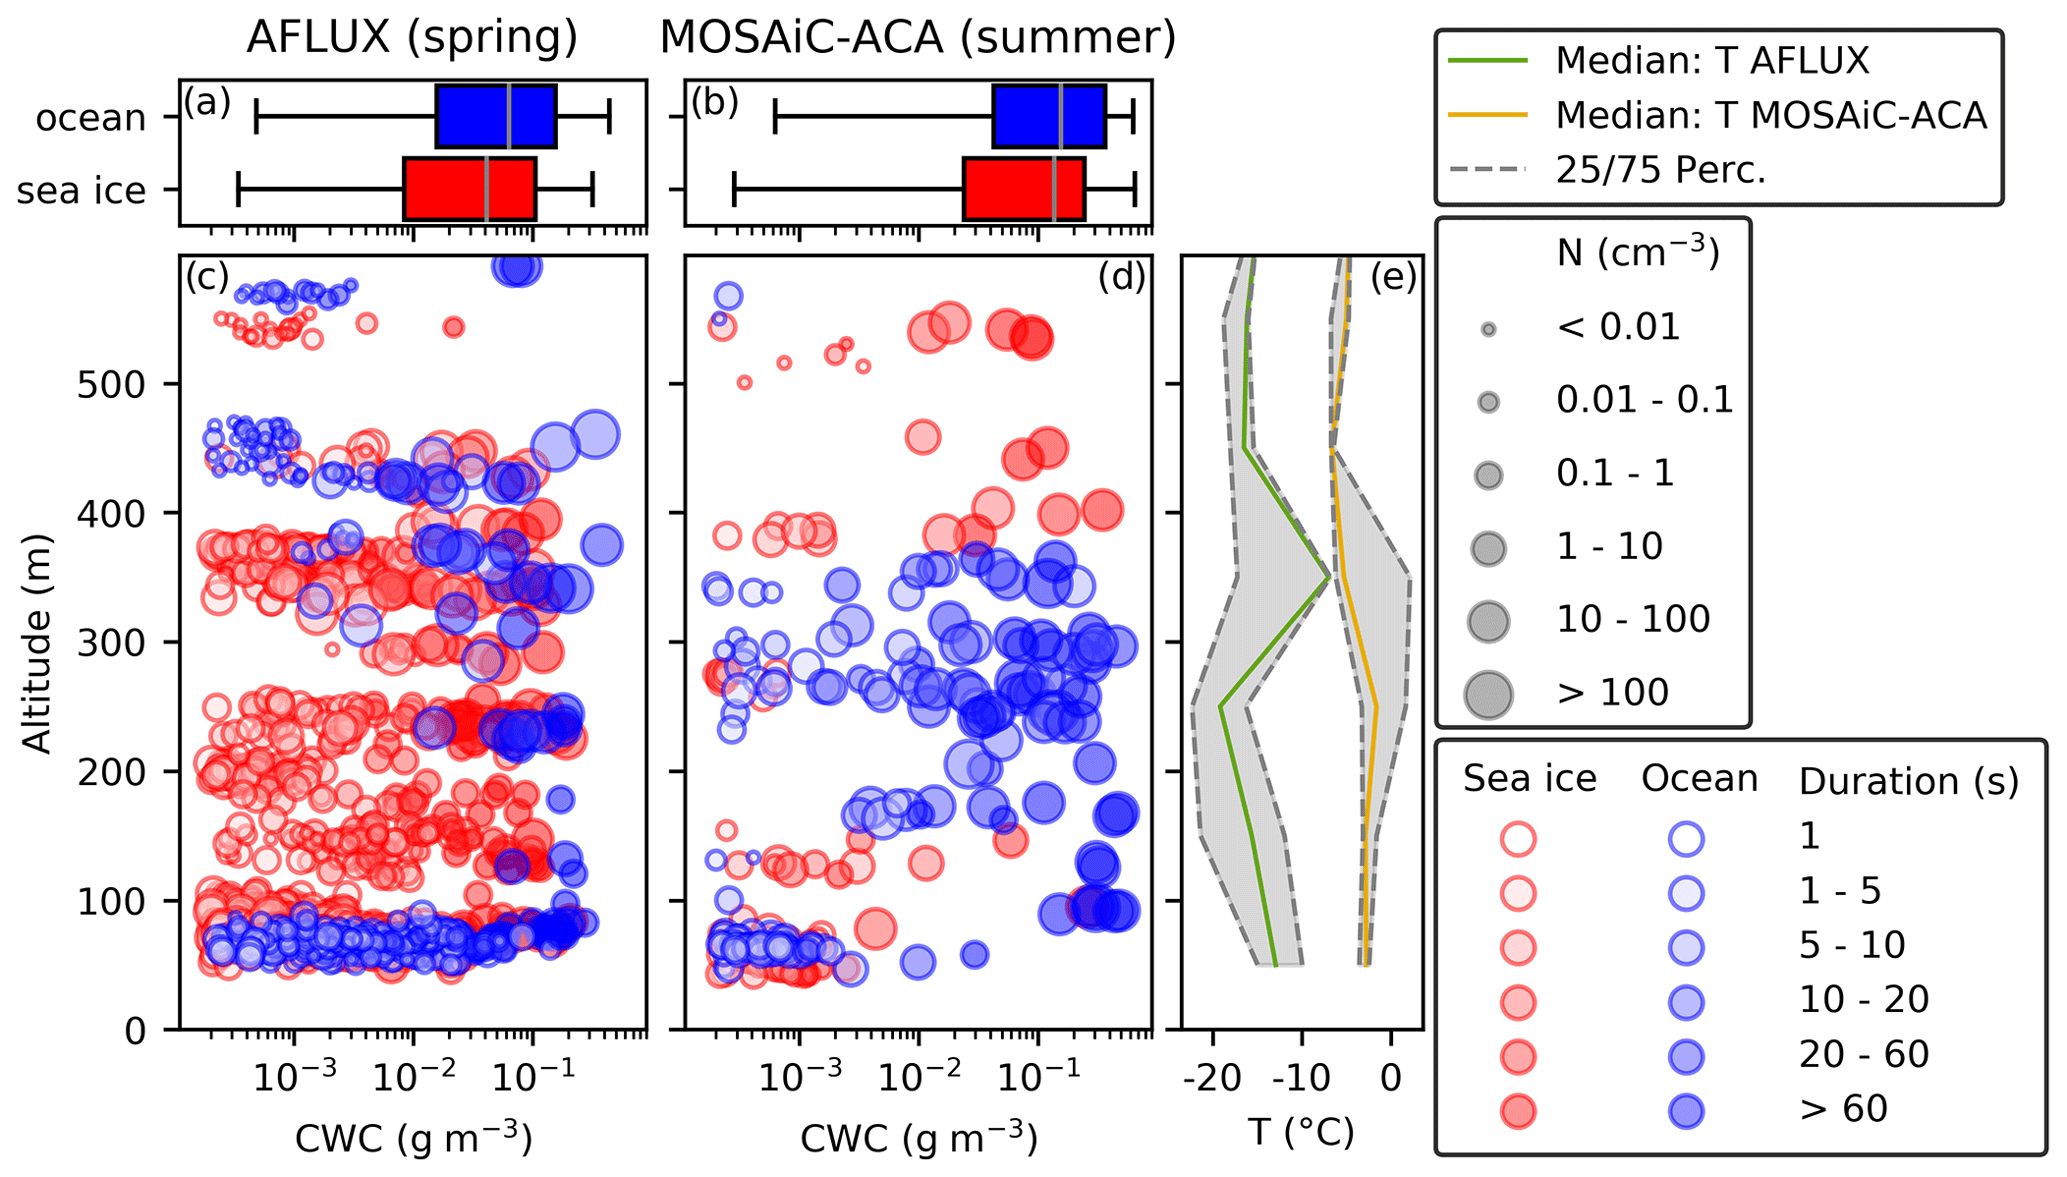
Figure 4Overview of the in situ measured low-level clouds during spring represented by the AFLUX data set (a, c) and summer represented by the MOSAiC-ACA data set (b, d), depending on surface condition. Panels (a) and (b) show all CWC measurements below 500 m in boxplots. Panels (c) and (d) present the respective CWC values in altitude including information about N and duration of each cloud measurement. The median temperature for both seasons is shown in (e).
Table 3Properties of Arctic low-level clouds (< 500 m) during AFLUX and MOSAiC-ACA for surface condition sea ice or ocean: median number concentration , median effective diameter , median cloud water content , and mean horizontal cloud extent (calculated using the duration in cloud and mean aircraft speed, V = 60 m s−1). The values in the square brackets give the 25th and 75th percentile, respectively. The microphysical properties are calculated from all detected cloud particles, as well as for particles smaller than 50 µm (assumed to be liquid) and for particles larger than 50 µm (assumed to be ice). An asterisk indicates that a combination of two values within this column is not significantly different. These combinations are as follows. : im–om, : ia–oa, ia–im, i–o, : im–om, : ia–im, : i–o.
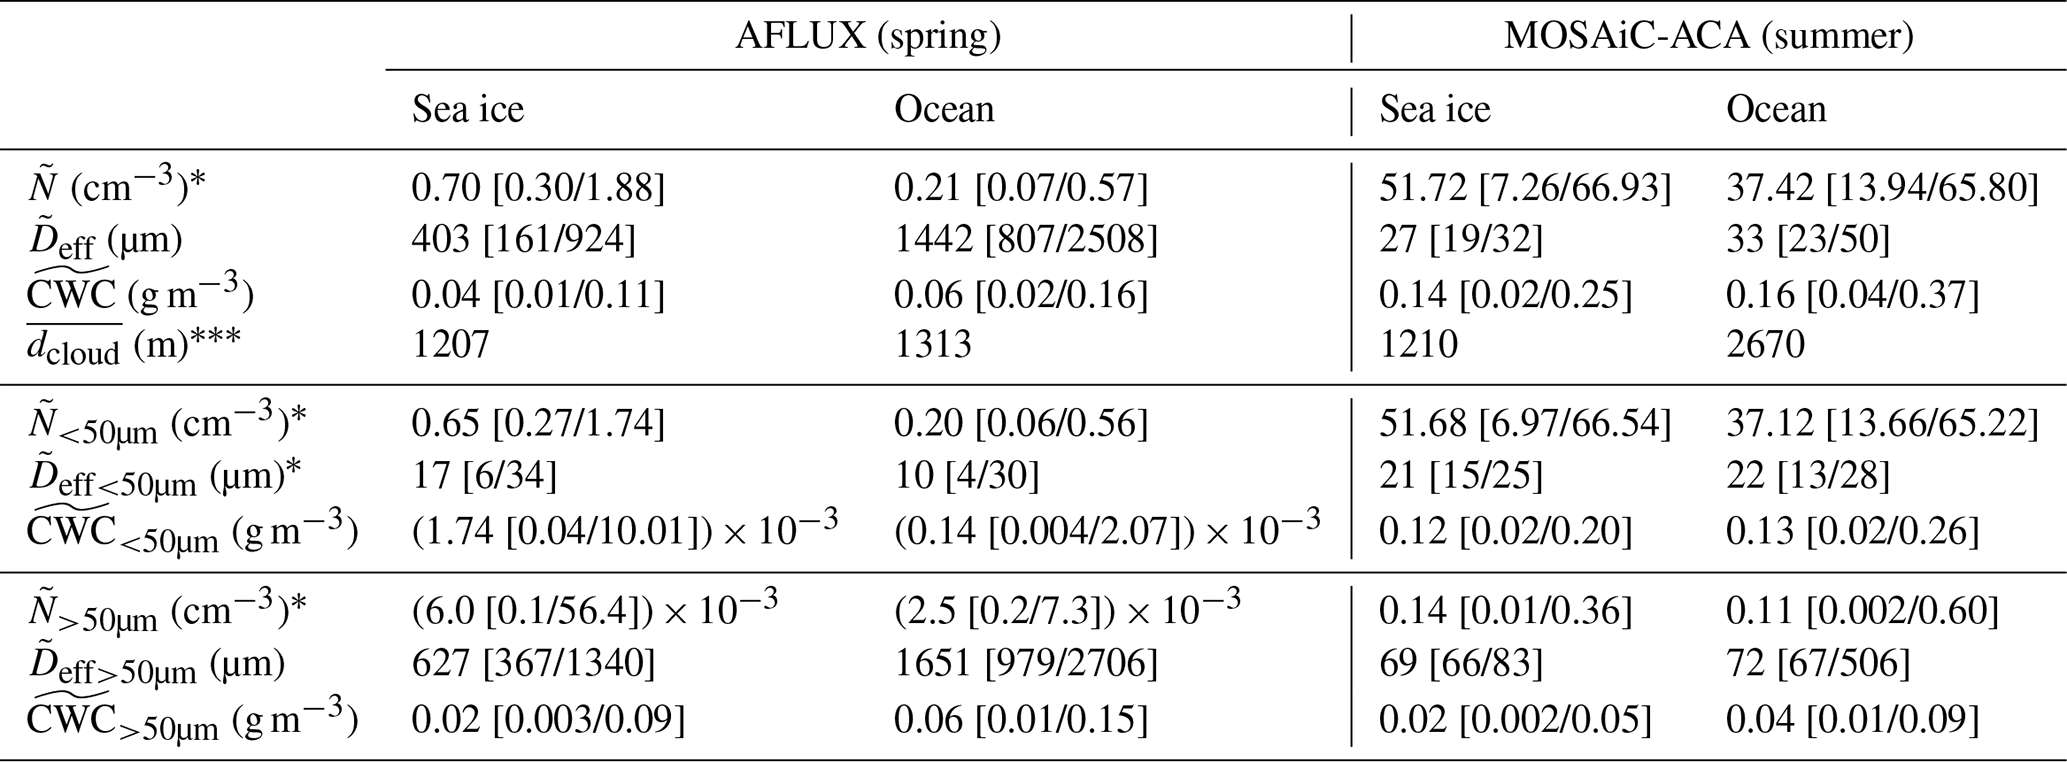
The median and percentiles of the measured low-level microphysical cloud properties in Fig. 4 over the sea ice and the ocean during the AFLUX and MOSAiC-ACA field campaigns are given in Table 3. In addition to the microphysical cloud properties based on particles in the size range from 2.8 µm to 6.4 mm, the microphysical cloud properties for liquid particles (based on particles <50 µm) and ice particles (based on particles >50 µm) only are presented. In order to determine whether two values within a single column in Table 3 are statistically different, we conducted t tests for the mean values and Wilcoxon tests for the medians. The significance level was set at 5 % to decide whether the prevalent environmental conditions influence the properties of the clouds. We examined the following combinations for each property value within a row: between the surface condition sea ice (i) and ocean (o) in spring (a) and in summer (m) (ia–oa, im–om), between spring and summer for the two surface conditions (ia–im, oa–om), and between the cloud data for each season (a–m) and surface condition (i–o). In case there is a combination for which the difference is not statistically significant, it is marked with an asterisk in Table 3, and the corresponding combination is indicated in the caption. For example, the asterisk in the first row indicates that there is no significant difference in the data between the we observe for clouds over sea ice compared to cloud over the ocean during the summer campaign.
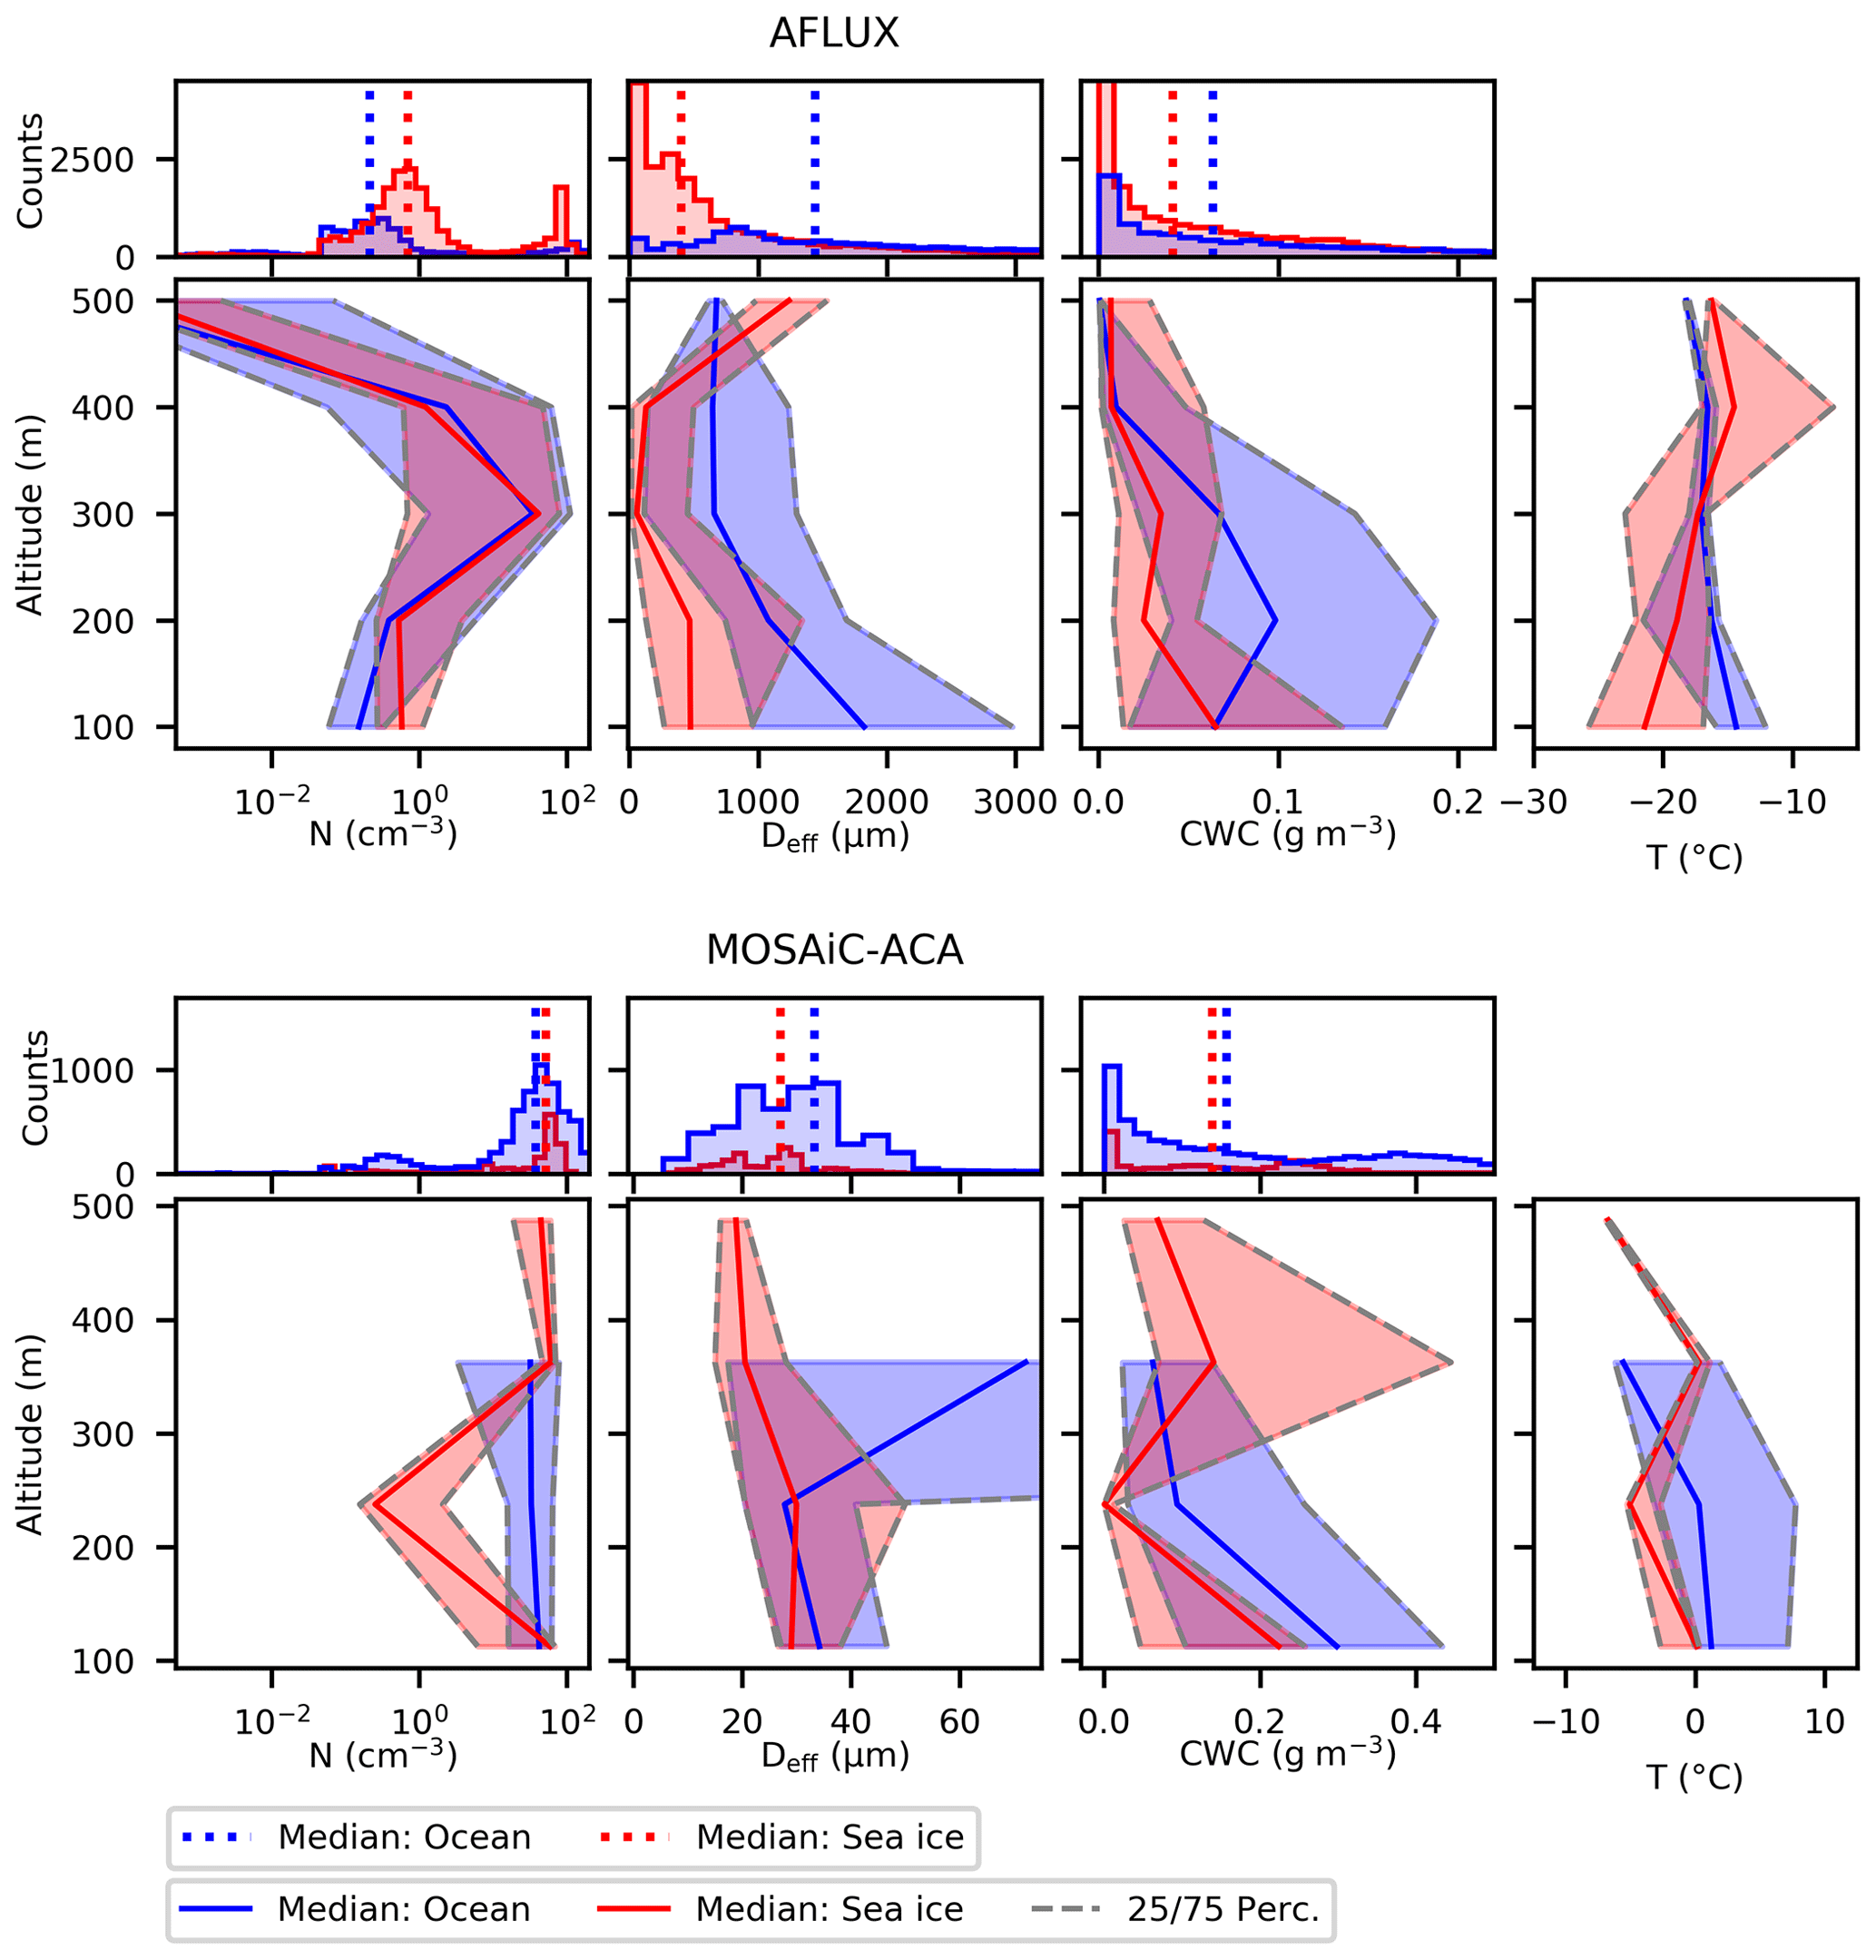
Figure 5Height resolved microphysical cloud properties including N, Deff, and CWC for the conditions spring (AFLUX), summer (MOSAiC-ACA), over sea ice, and over the ocean.
The largest differences of cloud properties are associated with the different seasons. Especially, the medians of the Deff during summer are significantly reduced compared to spring, with values of 27 µm over the sea ice and 33 µm over the ocean in summer, compared to values of 403 µm over sea ice and 1442 µm over the ocean in spring. The main reason for this reduction is the ambient cloud temperatures in the respective seasons. As discussed in Sect. 2.2, cloud temperatures during the summer campaign period are warmer compared to spring, with temperatures between −6.8 and +13.6 ∘C during MOSAiC-ACA and between −28.3 and −1.8 ∘C during AFLUX. In microphysical cloud analysis, it is important to consider the impact of seasonal temperature variations. During the spring months, temperatures favor the growth of ice crystals, while temperatures above the freezing point during summer only allow for the existence of liquid cloud particles. As a result, the Deff values during spring correspond to ice crystals, while in summer these values result from smaller liquid cloud particles. During summer at warmer temperatures, the median CWC is increased, with a value of 0.16 g m−3 over the ocean and 0.14 g m−3 over the sea ice, compared to colder conditions in spring, where the median CWC over the ocean is 0.06 g m−3 and over the sea ice 0.04 g m−3. Also, higher median N values are found in summer, with 51.7 cm−3 over the sea ice and 37.4 cm−3 over the ocean. In spring these values are reduced, with 0.7 cm−3 measured over the sea ice and 0.2 cm−3 over the ocean. Similar to Deff, these changes in CWC and N can be traced back to the different temperature ranges and meteorological situations during both seasons. Greater CWC during MOSAiC-ACA is related to higher humidity and higher temperatures compared to cloud measurements during AFLUX. In spring, cold air outbreaks with strong winds from the central Arctic bring dry air with a low aerosol load. In contrast, in summer, the weather situations favor the transport of moist air masses from the open ocean towards the sea ice. These different synoptic situations impact cloud condensation nuclei and ice nuclei concentration and thus influence N by cloud particle formation processes (Kirschler et al., 2022; Mech et al., 2020). The findings are supported by the microphysical cloud properties calculated for particles <50 and >50 µm in Table 3. Ice crystals dominate the Deff in spring, and droplets dominate the Deff in summer. While droplets are the main contributor to the total CWC in summer, ice particles contribute most to the CWC in spring. The horizontal cloud extension is represented by the duration of a cloud measurement (mean aircraft speed at low-level cloud measurements at 60 m s−1) in Fig. 4. Mean low-level cloud length in summer over the ocean is 2670 m (44.6 s) and over the sea ice less than half, 1210 m (20.0 s). In spring, horizontal cloud lengths are similar, 1313 m (21.8 s) over the ocean and 1207 m (20.3 s) over the sea ice. As a result of the ambient atmospheric conditions in spring, clouds are more patchy compared to summer. This may be due to strong winds, common in the Arctic spring, which may favor the formation of cumulus clouds in cold air outbreak weather situations. Warm air intrusions and frontal systems lead to larger cloud lengths in summer. The influence of different surface conditions on the horizontal cloud extension does not appear to be significant in our data. In Fig. 4 we observe a more homogeneous cloud distribution with altitude during the time of the spring campaign compared to summer. In spring, clouds are more equally distributed up to 450 m, with slightly smaller median CWC over sea ice compared to ocean. In summer, the CWC distribution with respect to altitude is more patchy, and the measured cloud heights depend on the surface conditions. Over the ocean, most of the clouds were measured at altitudes between 220–380 m, with CWC reaching 0.5 g m−3. The cloud layer in summer above the sea ice reaches higher altitudes compared to the clouds above the ocean. However, hardly any clouds are observed between 150–350 m. The more homogeneous vertical cloud distribution in spring and the more clustered and multilayered cloud structure in summer are in line with the visual observations made onboard the research aircraft. During AFLUX, one homogeneous cloud layer in the low-level altitude regime was regularly observed, while most of the time during summer a complex and patchy cloud structure with multiple individual layers was present. This can be associated with a stronger coupling of the ABL in springtime, which leads to a well-mixed boundary layer. In summer, warm and moist air advection from the south leads to a stronger temperature inversion and favors multilayer clouds (Eirund et al., 2020). Besides the seasons, the prevalent surface conditions below the clouds show an impact on the microphysical cloud properties. A slightly greater CWC over the ocean is related to higher humidity and higher temperatures compared to cloud measurements over the sea ice. Over the warmer ocean compared to the sea ice, increased heat fluxes are induced and lead to a warmer and more turbulent ABL. Hence, an increased adiabatic liquid water content and the enhanced moisture transport into the ABL cause an increase of the cloud water content, allow hydrometeors to grow faster, and lead to a deepening of the cloud layer. This also has an impact on particle growth rate. Due to the warmer and more turbulent ABL over the ocean, larger Deff values are a result of a higher efficient collision–coalescence and subsequent growth via sustained supersaturation, as explained by Young et al. (2016). This process could also explain the reduction of N over the ocean, which is significantly observed in spring. However, in Sect. 3.2 we will show that the differences of N measured over the sea ice and the open ocean might result from different aerosol sources.
Consistent with Fig. 4 and Table 3, we find similar trends in altitude-resolved cloud properties in Fig. 5. The altitude-resolved profiles show lower N, larger Deff, and lower CWC in spring compared to summer clouds. In Arctic spring clouds, N increases with altitude to a maximum near 300 m and decreases near the top of the boundary layer. The large amount of particles but relatively small Deff at 300 m can be related to supercooled water droplets. Below, N decreases and Deff increases, which is due to ice crystals growing at the expense of supercooled water droplets and then precipitating. Lower CWC values at the upper cloud part can be explained by turbulent mixing and entrainment of dry air. Also during summer, when clouds are most likely in a liquid state, a decrease of Deff with altitude is observed. The larger median values of Deff at 300 m in summer can be addressed to the presence of ice crystals. Multilayer cloud structure and lower statistics in summer hammers the interpretation of altitude-resolved summer clouds, especially for N and CWC. Nevertheless, altitude-resolved microphysical cloud parameters derived in spring are in line with the study of Lawson and Zuidema (2009) and Mioche et al. (2017), where the in situ data were collected in vertical profiles.
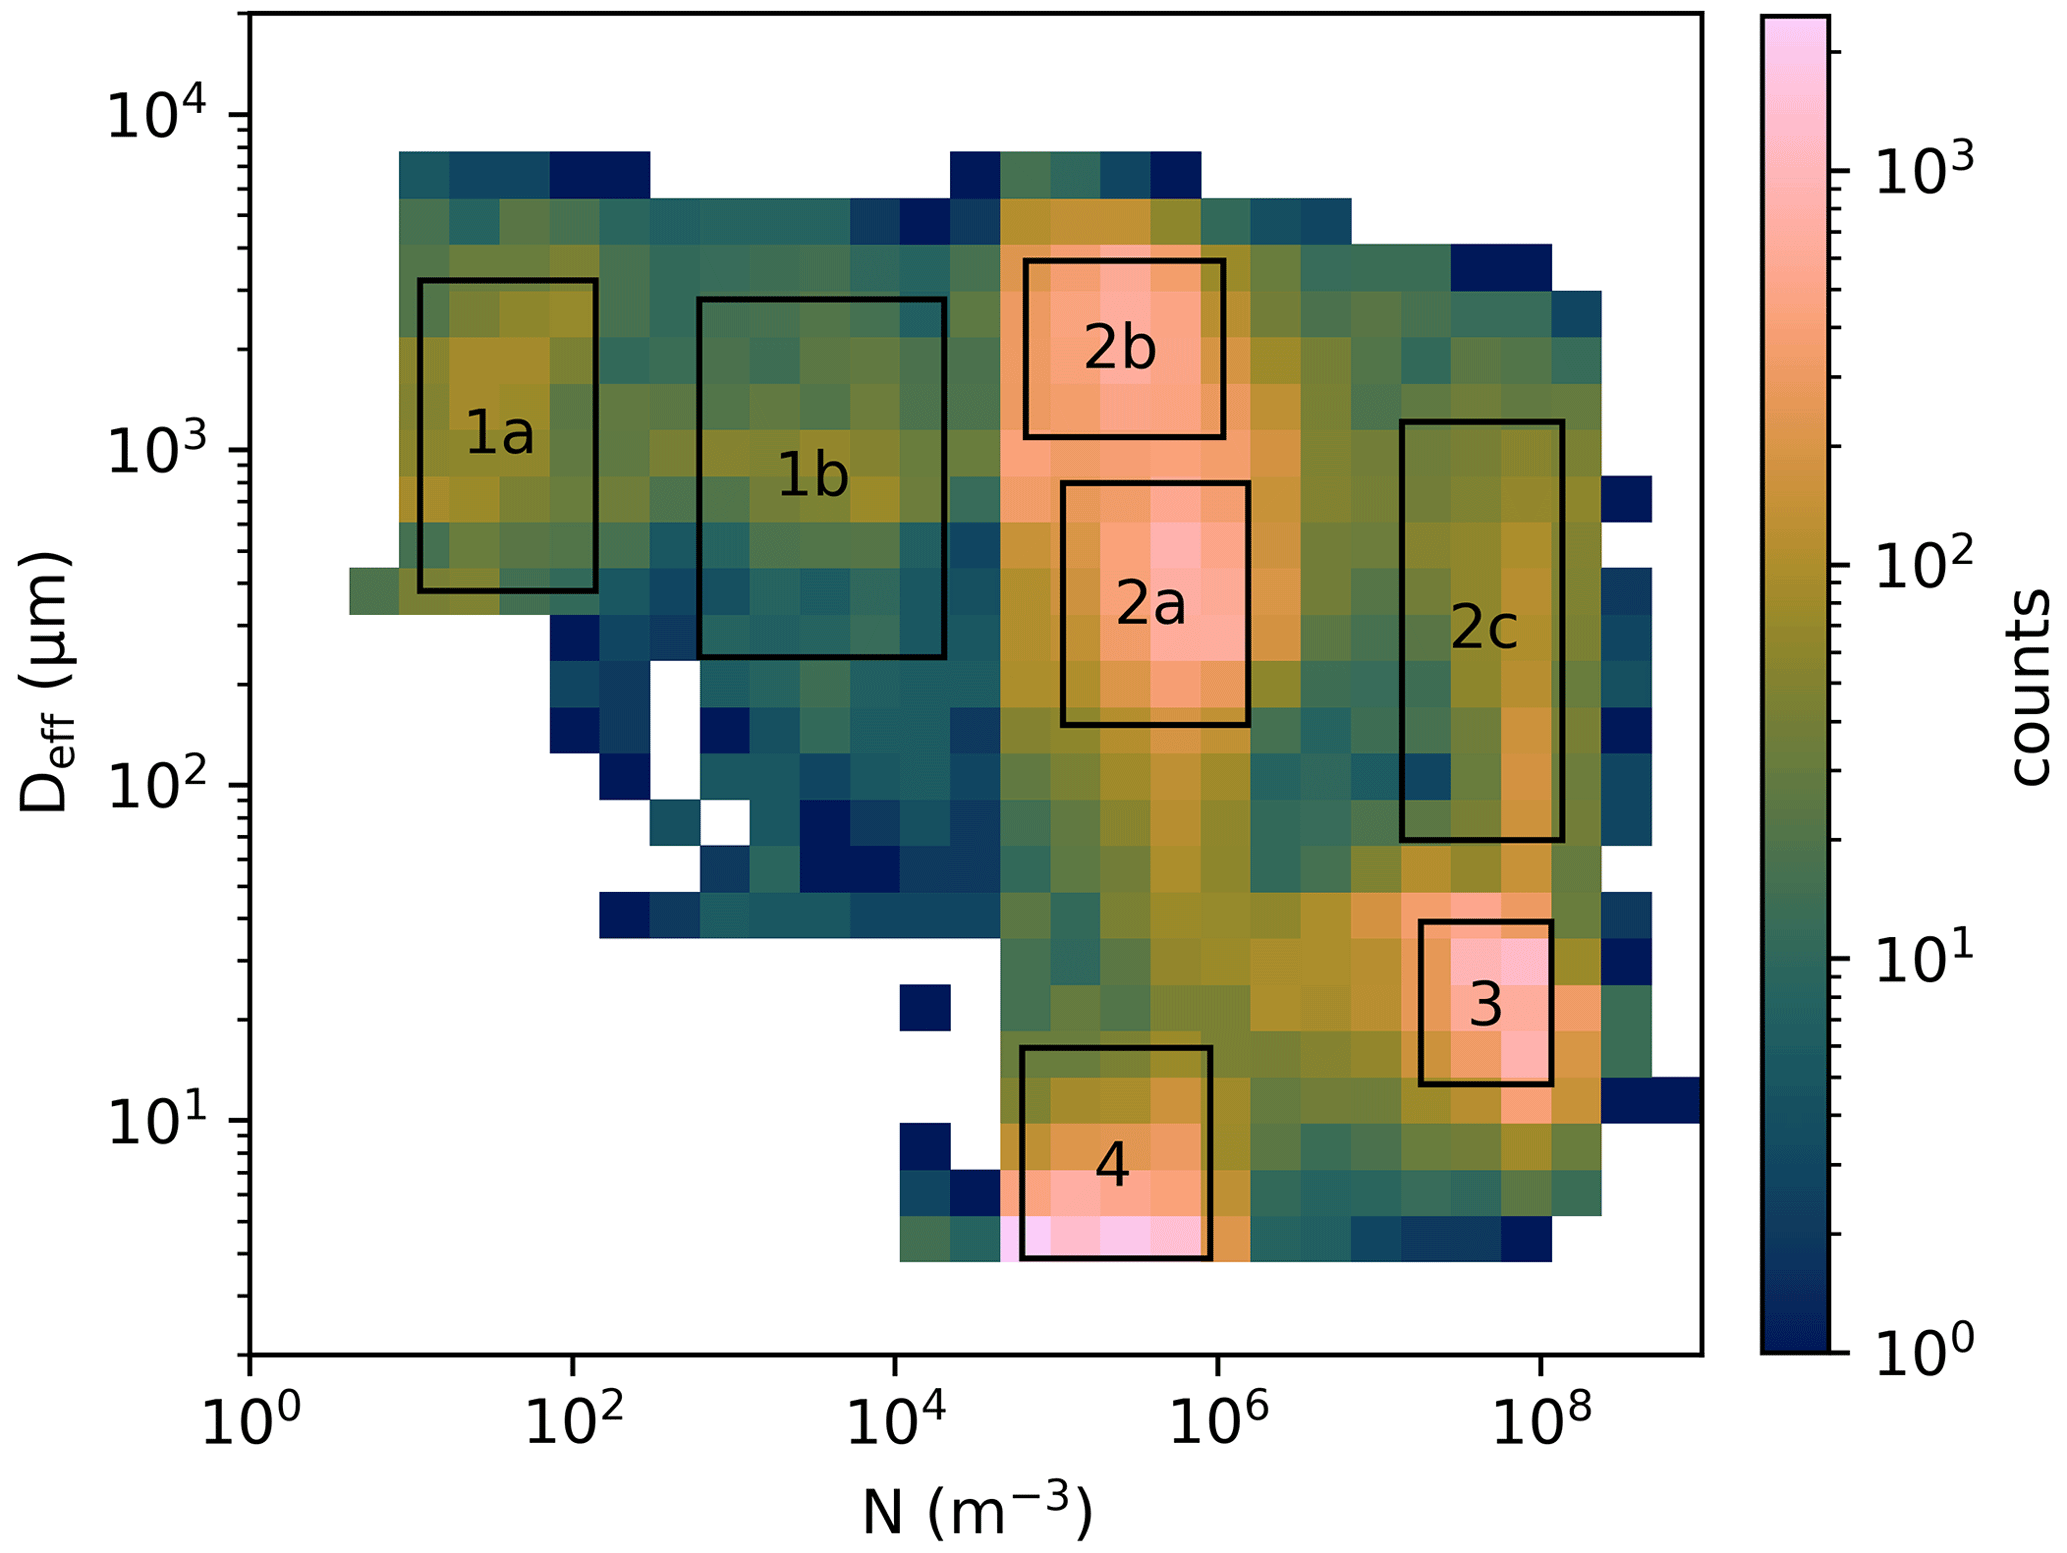
Figure 6N versus Deff for 1 Hz low-level particle data over sea ice and the open ocean (<500 m) from the AFLUX and MOSAiC-ACA campaign combined, color coded by their occurrence. Regimes with increased occurrence frequency are marked with a rectangle. Associated cloud particles: 1 – ice, 2 – mixed-phase, 3 – liquid, and 4 – aerosol particles.
3.2 Thermodynamic phase analyses of Arctic low-level clouds with respect to different ambient meteorological and surface conditions
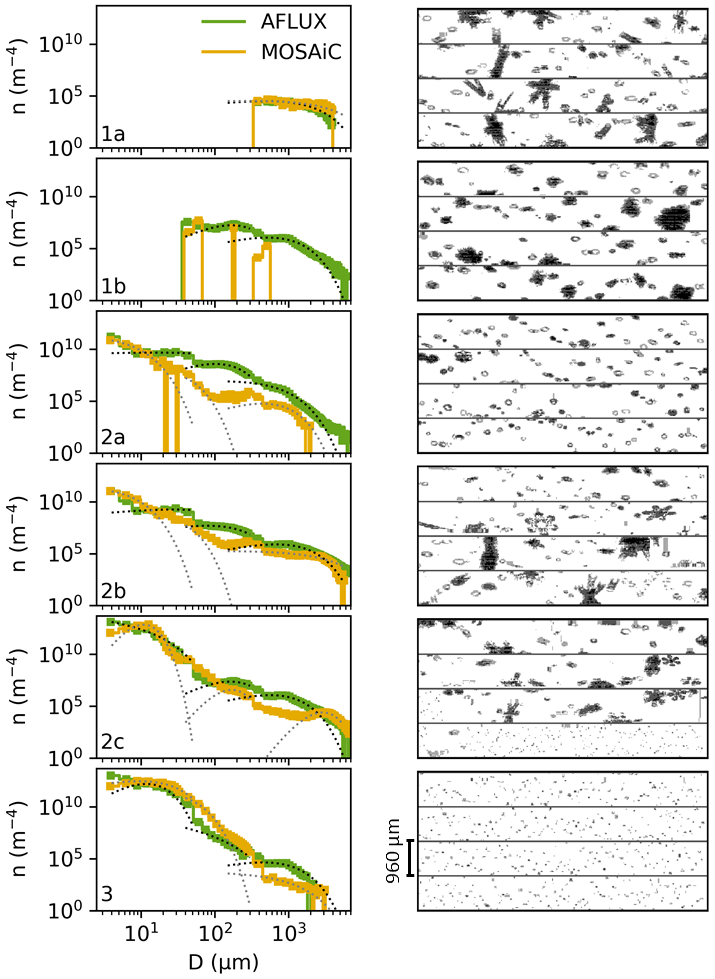
In the following we discuss microphysical changes, including cloud particle size, concentration, and thermodynamic phase, depending on surface structure and seasonal meteorological variations. All 1 Hz particle bulk measurements over the sea ice and the open ocean below 500 m for both campaigns are displayed in Fig. 6 in Deff versus N space. The color displays the number of 1 Hz particle measurements at the indicated Deff and N values. Peaks, which are areas with a higher probability of occurrence, are enclosed by rectangles, and in total seven regimes are identified. The boundary values for each regime are bounded to include 80 % of all data in one peak (Deff and N values between 10th to 90th percentile). Each peak of higher occurrence is separated by the minimum value to the neighboring peak. According to the prevailing thermodynamic phase, particle measurements in these regimes are classified as ice (1: 1a, 1b), mixed-phase (2: 2a, 2b, 2c), liquid (3), and aerosol particles (4). This classification is supported by particle size distributions from the combined particle measurement systems and by particle images by the CIP (Fig. 7), as well as by the asymmetry parameter and extinction coefficient measured with the PN (Fig. 8). In addition to the particle size distributions in Fig. 7, gamma functions are fitted over the sensitive size range of the respective instrument. Cloud particle size distribution usually follow gamma type functions of the form
The fitted values for the dispersion μ, the slope λ, and the intercept N0 are given in Table B1 in Appendix B. Ice particles in the regimes 1a and 1b have low N and larger sizes. Regime 1a shows N between 11–140 m−3 with Deff between 0.4–3.2 mm, and regime 1b shows higher N between 620–2×10⁴ m−3 with diameters between 0.24–2.8 mm. Images from the CIP indicate that pristine ice crystals dominate for 1a, whereas graupel particles prevail in 1b (see Fig. 7). Region 1 measurements are precipitating ice particles from cloud layers above, while a high fraction of 1b particles could have been in contact with a cloud layer where supercooled droplets were present facilitating the formation of graupel. Phase determination with the PN data remains challenging due to the very low N and large diameters of these ice crystals; often the PN does not detect any particles (extinction coefficient <0.05 km−1). Nevertheless, the remaining data show a clear trend towards ice phase, with g<0.8 and extinction coefficient values between 0.1–1 km−1.
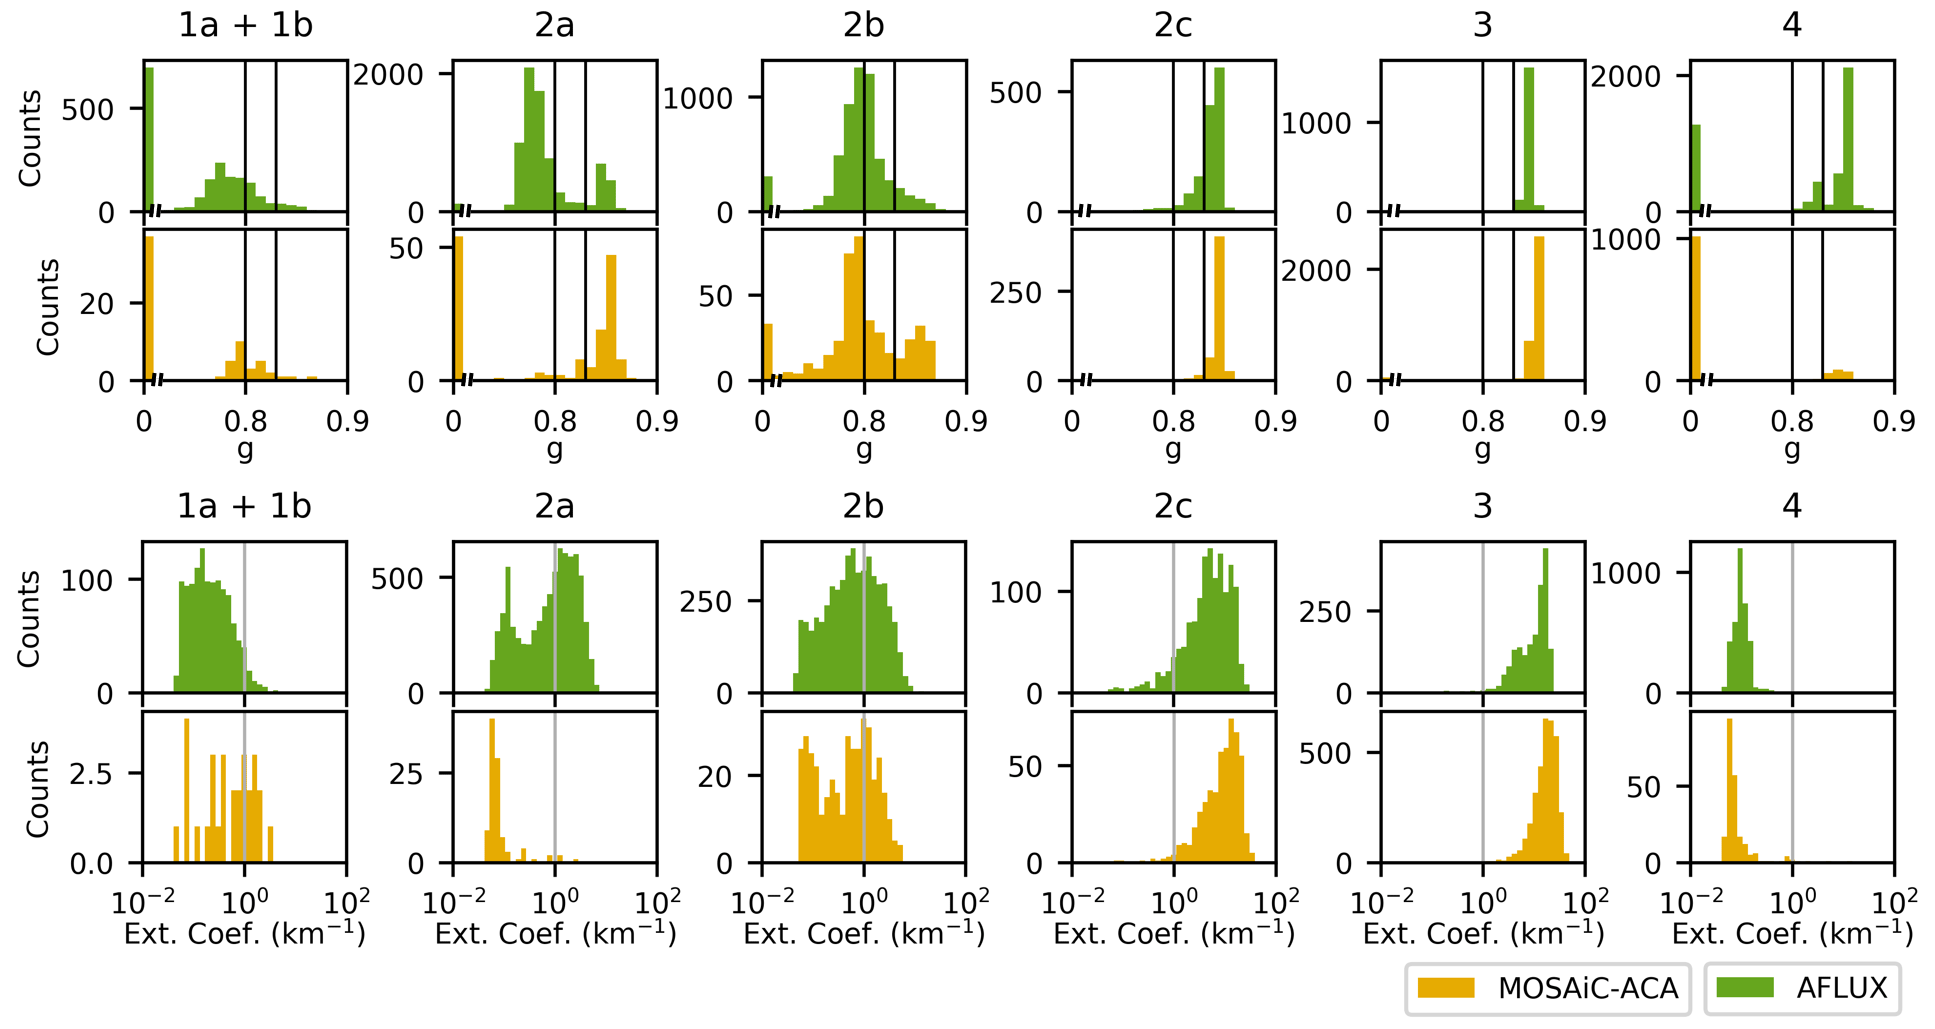
Figure 8Frequency distribution of the asymmetry parameter and the extinction coefficient measured by the PN in each particle regime. Data are separated into measurements during AFLUX and MOSAiC-ACA.
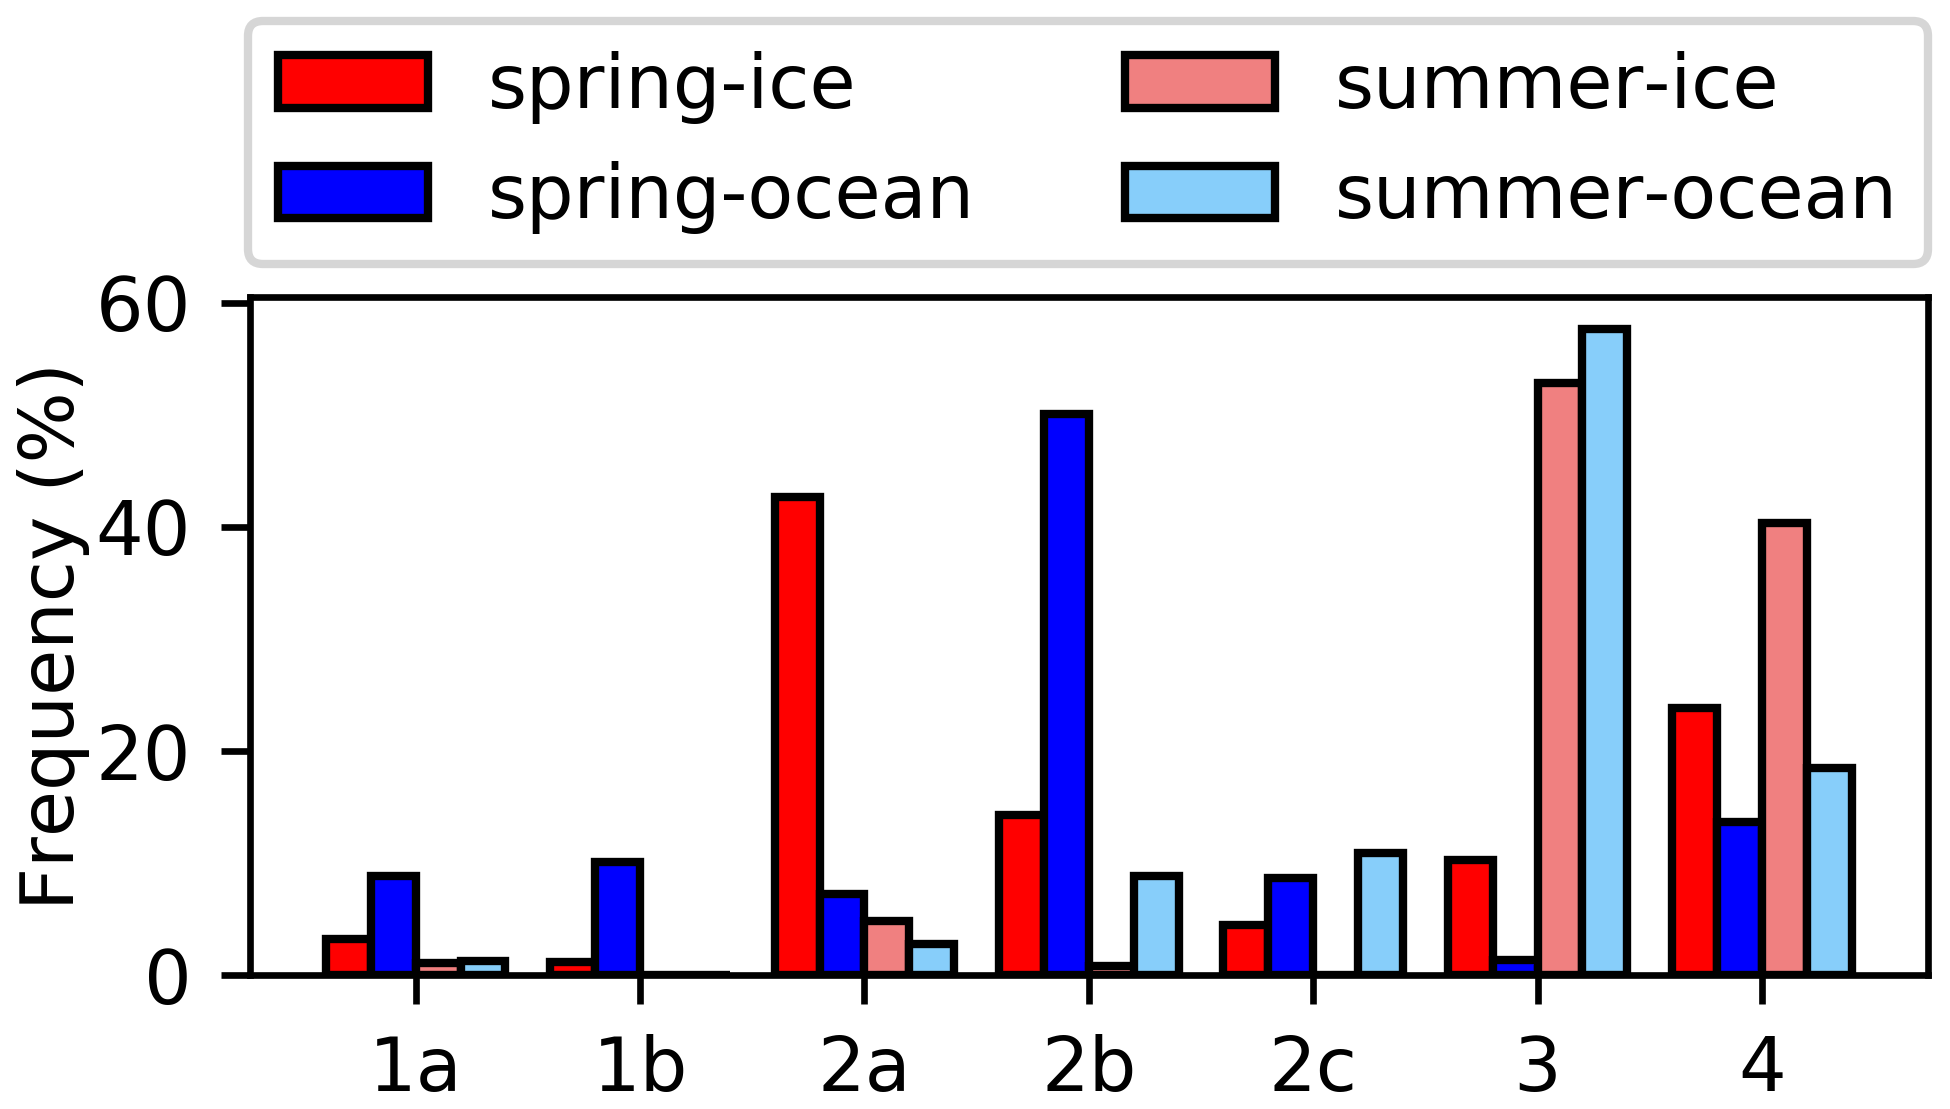
Figure 9Frequency of occurrence for each particle regime (1a, 1b: ice particles; 2a, 2b, 2c: mixed-phase particles; 3: liquid particles; 4: aerosol particles), separated by season and surface conditions. The values are normalized by the respective environmental conditions.
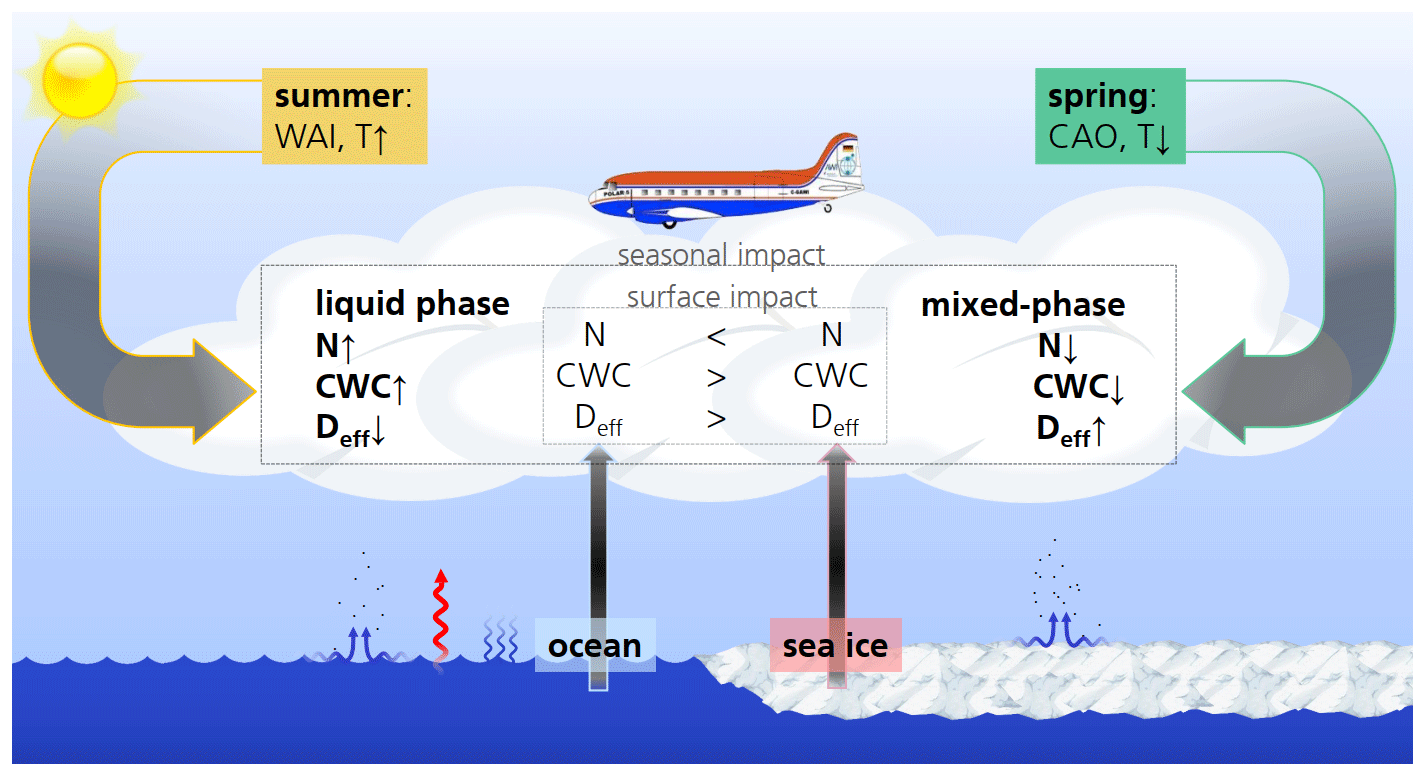
Figure 10Schematic representation of the results: black arrows symbolize the influence on the microphysical properties of Arctic low-level clouds, which is most pronounced during different seasons. In both seasons, the prevailing surface conditions modify the microphysical cloud properties due to regional atmospheric–surface processes. Abbreviations: WAI – “warm air intrusion”, CAO – “cold air outbreak”.
Regime 2 indicated the presence of mixed-phase clouds. In total, three sub-divisions are addressed to regime 2: 2a (1.1×10⁵ m−3 < m−3 and 0.15 mm < Deff<0.80 mm), 2b (6.5×10⁴ m−3 < m−3 and 1.1 mm < Deff<3.6 mm), and 2c (1.4×10⁷ m−3 < m−3 and 0.07 mm < Deff<1.2 mm). The N values in these regimes are dominated by particles smaller than 40 µm and the Deff by the larger ice crystals. Data from the PN measurements reveal a mixed-phase state, as g values cannot be clearly assigned to either liquid (g>0.83) or ice phase (g<0.8). The extinction coefficient ranges between 0.05 and 33 km−1; intermediate values are typically observed for ice and liquid water. The individual regimes 2a and 2b differ slightly by the size of the ice crystals and the N of liquid droplets. Later we show that 2a mixed-phase particles are frequently measured during AFLUX over the sea ice and 2b during AFLUX over the ocean. Thus, Arctic mixed-phase clouds over the ocean tend to have a slightly smaller N of liquid droplets and larger sizes of ice crystals compared to clouds over the sea ice in the same season. The air temperature, vertical wind velocities, humidity, and aerosol particle concentrations impact the microphysical processes in the Arctic low-level mixed-phase clouds. The mixed-phase clouds were measured at a mean temperature at −17.9 ∘C, which is close to −15 ∘C, where the maximum difference between water vapor partial pressure over ice and water is located. Such temperatures favor an enhanced ice crystal growth rate in mixed-phase clouds. The larger temperature gradient between open ocean and the atmosphere enhances vertical velocities and humidity transport, which might induce a faster ice crystal growth rate. Similar to the slight increase of the total N in clouds (see Sect. 3.1) over the sea ice compared to the open ocean, the higher number of liquid droplets in mixed-phase clouds over the sea ice could be explained by an increased cloud condensation nuclei concentration. Smaller ice crystals with higher N can be related to enhanced ice nucleating particle concentrations, which have been observed in other studies in the central Arctic before (Hartmann et al., 2020; Porter et al., 2022). Regime 2c, mixed-phase cloud measurements, is dominated by supercooled liquid cloud droplets with coexisting ice crystals, which have a higher N than 2a and 2b, as well as larger diameters compared to 2b. In all number 2 regimes, the Wegener–Bergeron–Findeisen process (WBF; Wegener, 1912; Bergeron, 1935; Findeisen, 1938) is very likely, with different ice crystal and water droplet growth and evaporation rates.
Cloud data with 1.8×10⁷ m−3 < m−3 and 13 µm < Deff<40 µm are addressed to regime 3, cloud particles in liquid state. Two-dimensional images from the CIP show spherical particles, while the extinction coefficient and asymmetry parameter from the PN support the assumption of the liquid phase (mean values: g=0.84 and extinction coefficient = 16 km−1). Very rarely, larger ice crystals may be present at the same time as liquid droplets. These particles are visible in the particle size distribution (PSD); however, they are negligible in the total particle concentration, with >5 orders of magnitude lower concentration than the liquid droplets.
Particle measurements with very small Deff (<16 µm) and 6.2×10⁴ m−3 < N < 9.0×10⁵ m−3 are attributed to regime 4. These particles are too small to be resolved by the CIP and are exclusively recorded by the CAS and CDP. The PN data recorded here in this regime cannot be addressed to any distinct cloud phase. Videos from onboard cameras show no visible clouds during regime 4 particle observations. We address these particles to large aerosol particles (lower detection limit of the particle measurement system: 2.8 µm) originated by the ocean and the sea ice.
The frequency of occurrence of each particle regime with respect to the four conditions (spring–ice, spring–ocean, summer–ice and summer–ocean) is given in Fig. 9. In spring, Arctic low-level clouds are most likely in a mixed-phase state (regimes 2a, 2b, or 2c). The microphysics of mixed-phase clouds is slightly different depending on surface conditions, as 2a mixed-phase clouds are measured with a higher frequency over the sea ice, and 2b mixed-phase clouds dominate over the open ocean. Mixed-phase clouds with microphysics corresponding to 2c are observed with very low probability and are not found in summertime over the sea ice. In general the mixed-phase state in clouds is suppressed in summertime, as temperatures are too warm to favor ice formation and the WBF process. Pure liquid phase (regime 3) is the prevailing cloud type in summertime, regardless of the surface. Temperatures close to 0 ∘C during the MOSAiC-ACA campaign (see Table 2) are warmer compared to spring and do suppress ice crystal formation or lead to melting of precipitating particles from above. So pristine ice clouds (1a and 1b) are mainly detected in spring, here with a higher probability over the ocean. Aerosols without liquid or ice phase particles (regime 4) are frequently measured during both seasons with a higher frequency over the sea ice for both cases. An elevated N of small particles over the sea ice was already observed in previous studies, e.g., in a case study by Young et al. (2016). Here, the enhanced N is explained by swollen aerosol particles associated with a haze layer over the sea ice. As we observe this increase systematically in summer and spring where air mass origin differs strongly, we assume a local source. Such sources could be driven by biological processes in the sea ice (Dall'Osto et al., 2017; Hartmann et al., 2020); however, the presence of cracks, open leads, and polynyas in the sea ice have to be assumed. A more likely assumption are aerosols consisting of sea salt, as the aerosol particles exceed diameters larger than 2.8 µm (Kirpes et al., 2018) (minimum size to be detected by the CDP). Over the ocean, sea spray aerosols are emitted into the atmosphere via wave breaking mechanism (Blanchard, 1989). Over snow- and ice-covered areas sea salt aerosols might be brought into the atmosphere by mechanisms related to blowing snow or frost flowers (Seguin et al., 2014; Xu et al., 2016; Yang et al., 2008; Huang and Jaeglé, 2017). But the mechanism of these processes is still under discussion (Willis et al., 2018). In this respect, the data of AFLUX and MOSAiC-ACA propose that sea salt emitting processes over the sea ice are more efficient than over the open ocean. Sea salt aerosols can act as cloud condensation nuclei. Therefore, the higher number of sea salt aerosol particles over the sea ice could explain the enhanced N observed in Sect. 3.1 and the distribution of occurrence of 2a and 2b over the sea ice and the open ocean. Please note, the difference of between the surface ocean and sea ice in Table 3 does not pass a statistical significance test for the MOSAiC-ACA campaign. However, calculating for the dominant phase in summer reveals a higher number of liquid particles over the sea ice during summer (see Table A3).
During the two aircraft field campaigns, AFLUX and MOSAiC-ACA, we collected a comprehensive data set of microphysical cloud properties above the sea ice and the open ocean, representing low-level clouds in spring and summer in the Arctic. We show that the microphysical cloud properties change significantly with seasonal meteorological and surface conditions. Primary results are listed below and schematically summarized in Fig. 10.
-
In total we identify seven cloud regimes with different microphysical properties, which we assign to four classes: ice clouds, liquid clouds, a mixture of ice and liquid particles, and aerosol particles.
-
Low-level ice clouds are exclusively observed over the ocean during spring. Due to warmer temperatures in summer, clouds are most frequently in a liquid state.
-
Mixed-phase clouds are the most prevalent state for clouds in spring.
-
Median N is enhanced by 2 orders of magnitude during summer compared to spring, caused by the different meteorological situations which favor liquid phase clouds in summer.
-
The median CWC is increased by more than a factor of 2 during summer compared to spring and appears enhanced in both seasons over the open ocean compared to measurements above the sea ice due to a warmer and more humid atmosphere.
-
We observe larger ice crystals in spring and smaller liquid droplets in summer conditions.
-
Slightly enhanced Deff and CWC over the ocean compared to cloud measurements above the sea ice result from a more turbulent ABL and increased heat fluxes.
-
The increased N observed in mixed-phase clouds, in aerosol particles, in liquid clouds, and in the total cloud particle measurements above the sea ice may be explained by surface processes emitting sea salt.
-
The horizontal cloud length quantified by the horizontal extension of the low-level cloud encounters grows with rising temperature and humidity within the ABL and is largest in summer.
This work provides a direct comparison of microphysical cloud properties and cloud phases related to surface conditions during the seasons of maximum and minimum sea ice extent over the Arctic Ocean. The comprehensive observations can help to evaluate satellite retrievals of Arctic low-level clouds. Our cloud data can be used to develop and evaluate parameterizations of Arctic clouds in process models and to better understand the influence of different meteorological and surface conditions on clouds. Improving the representation of microphysical cloud properties and their radiative impact in global climate models may elucidate the role of clouds for Arctic amplification and for future climate change.
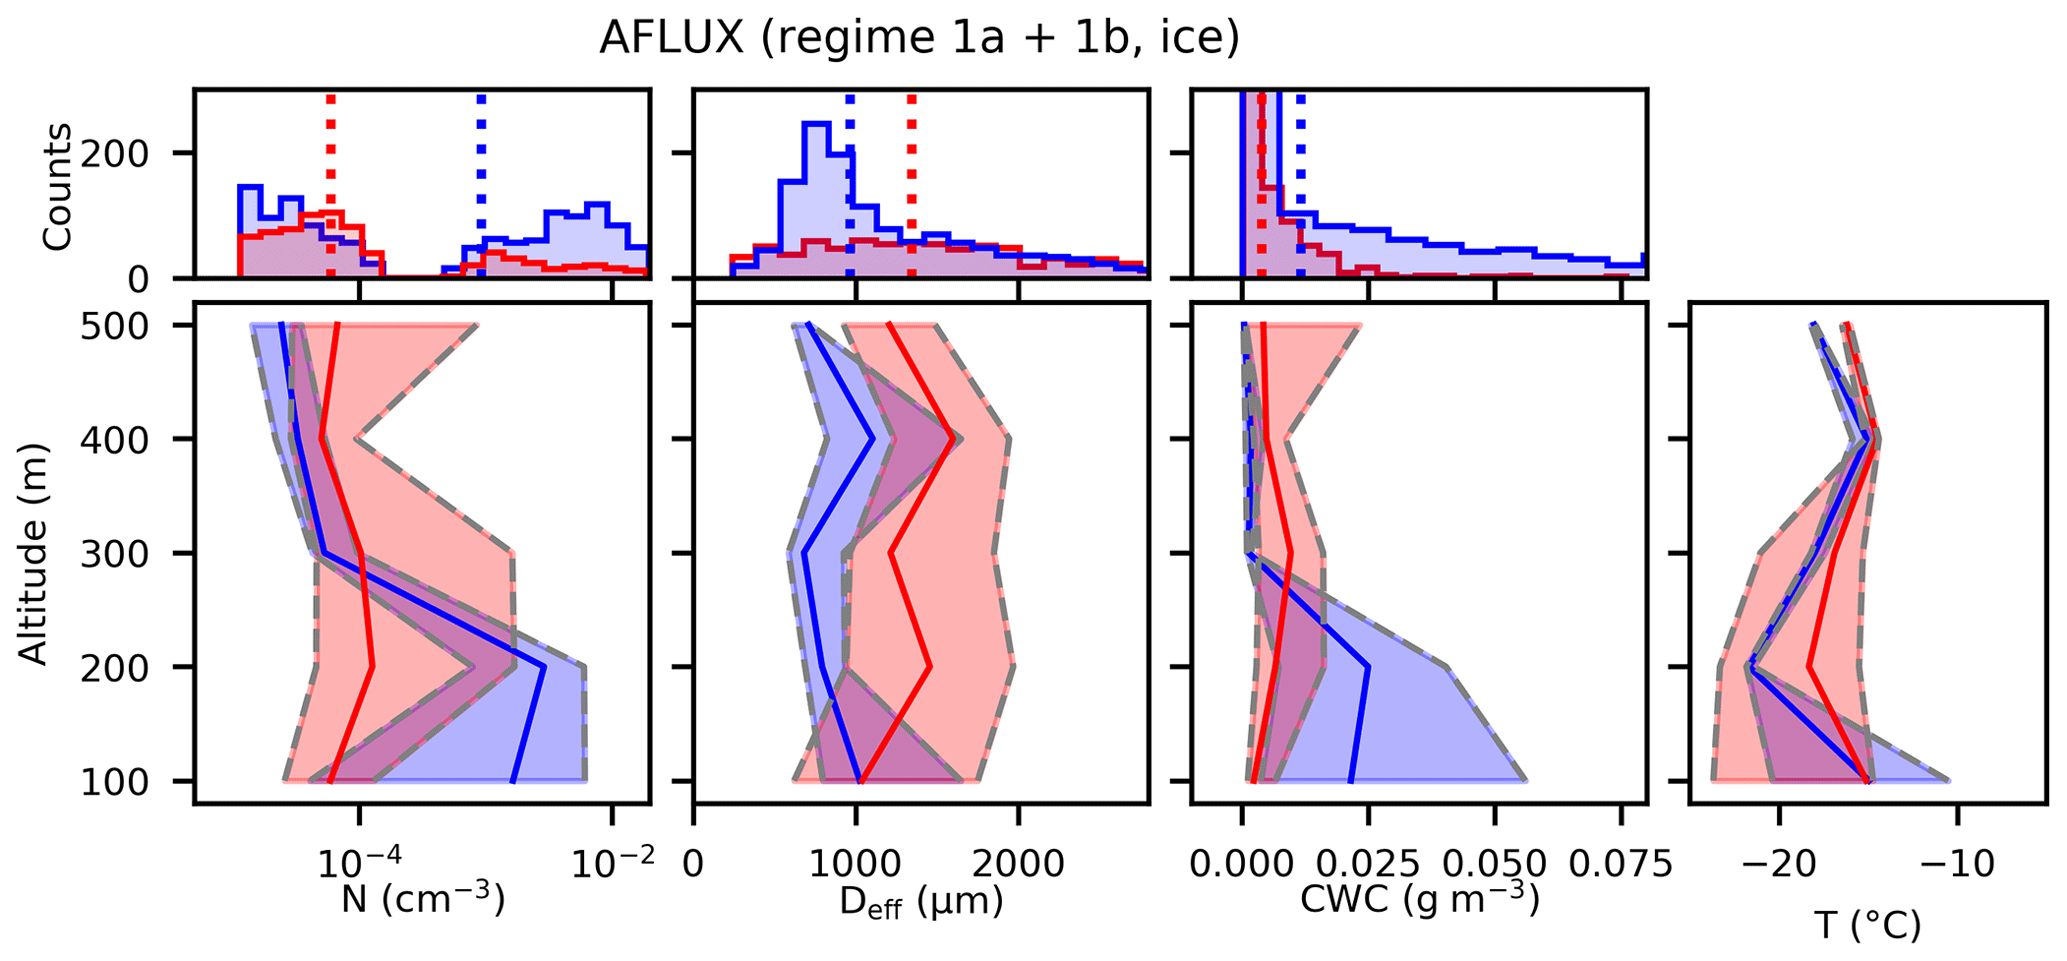
Table A1Similar to Table 3 but with cloud data from regimes 1a and 1b, classified as ice phase.
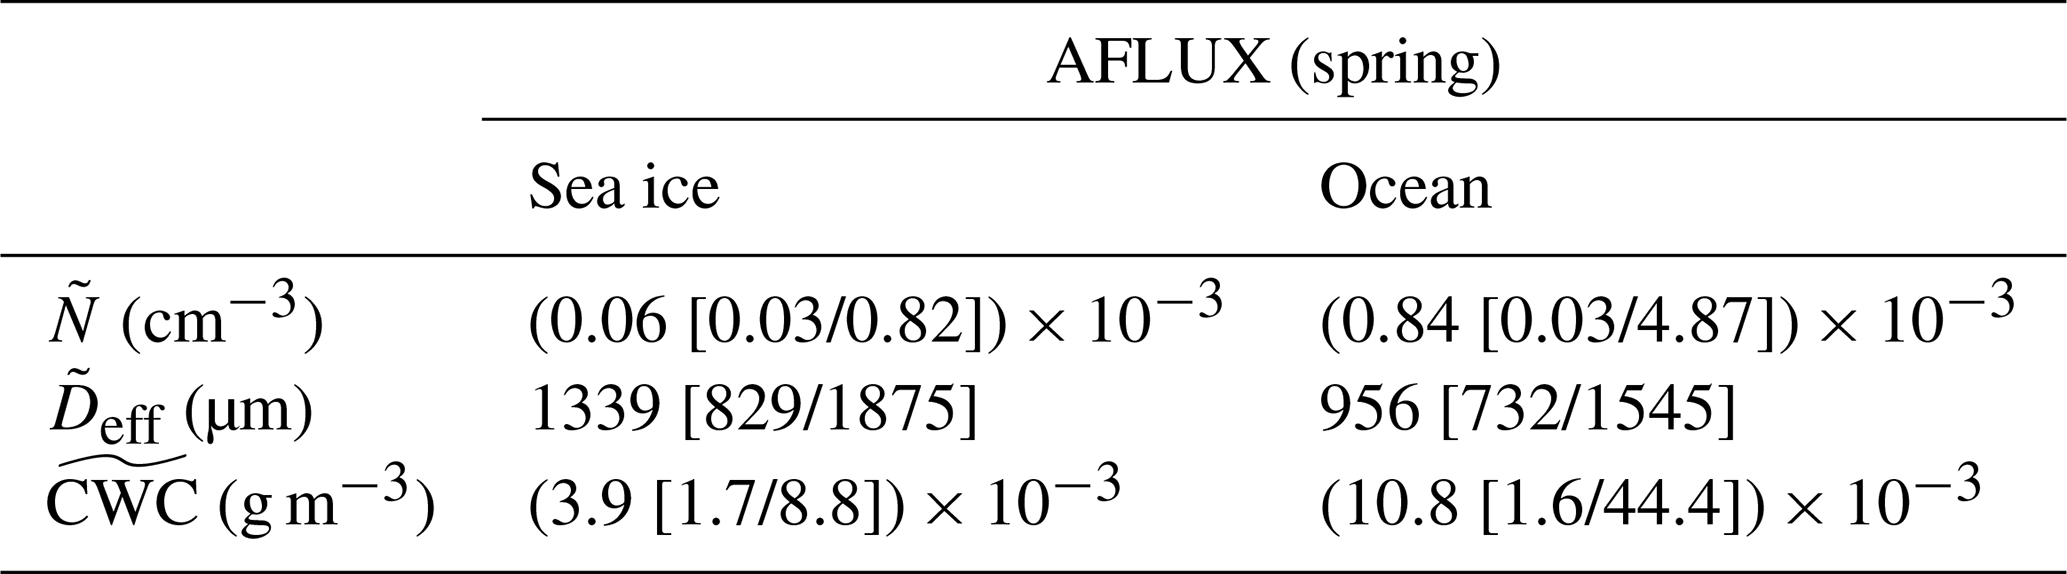
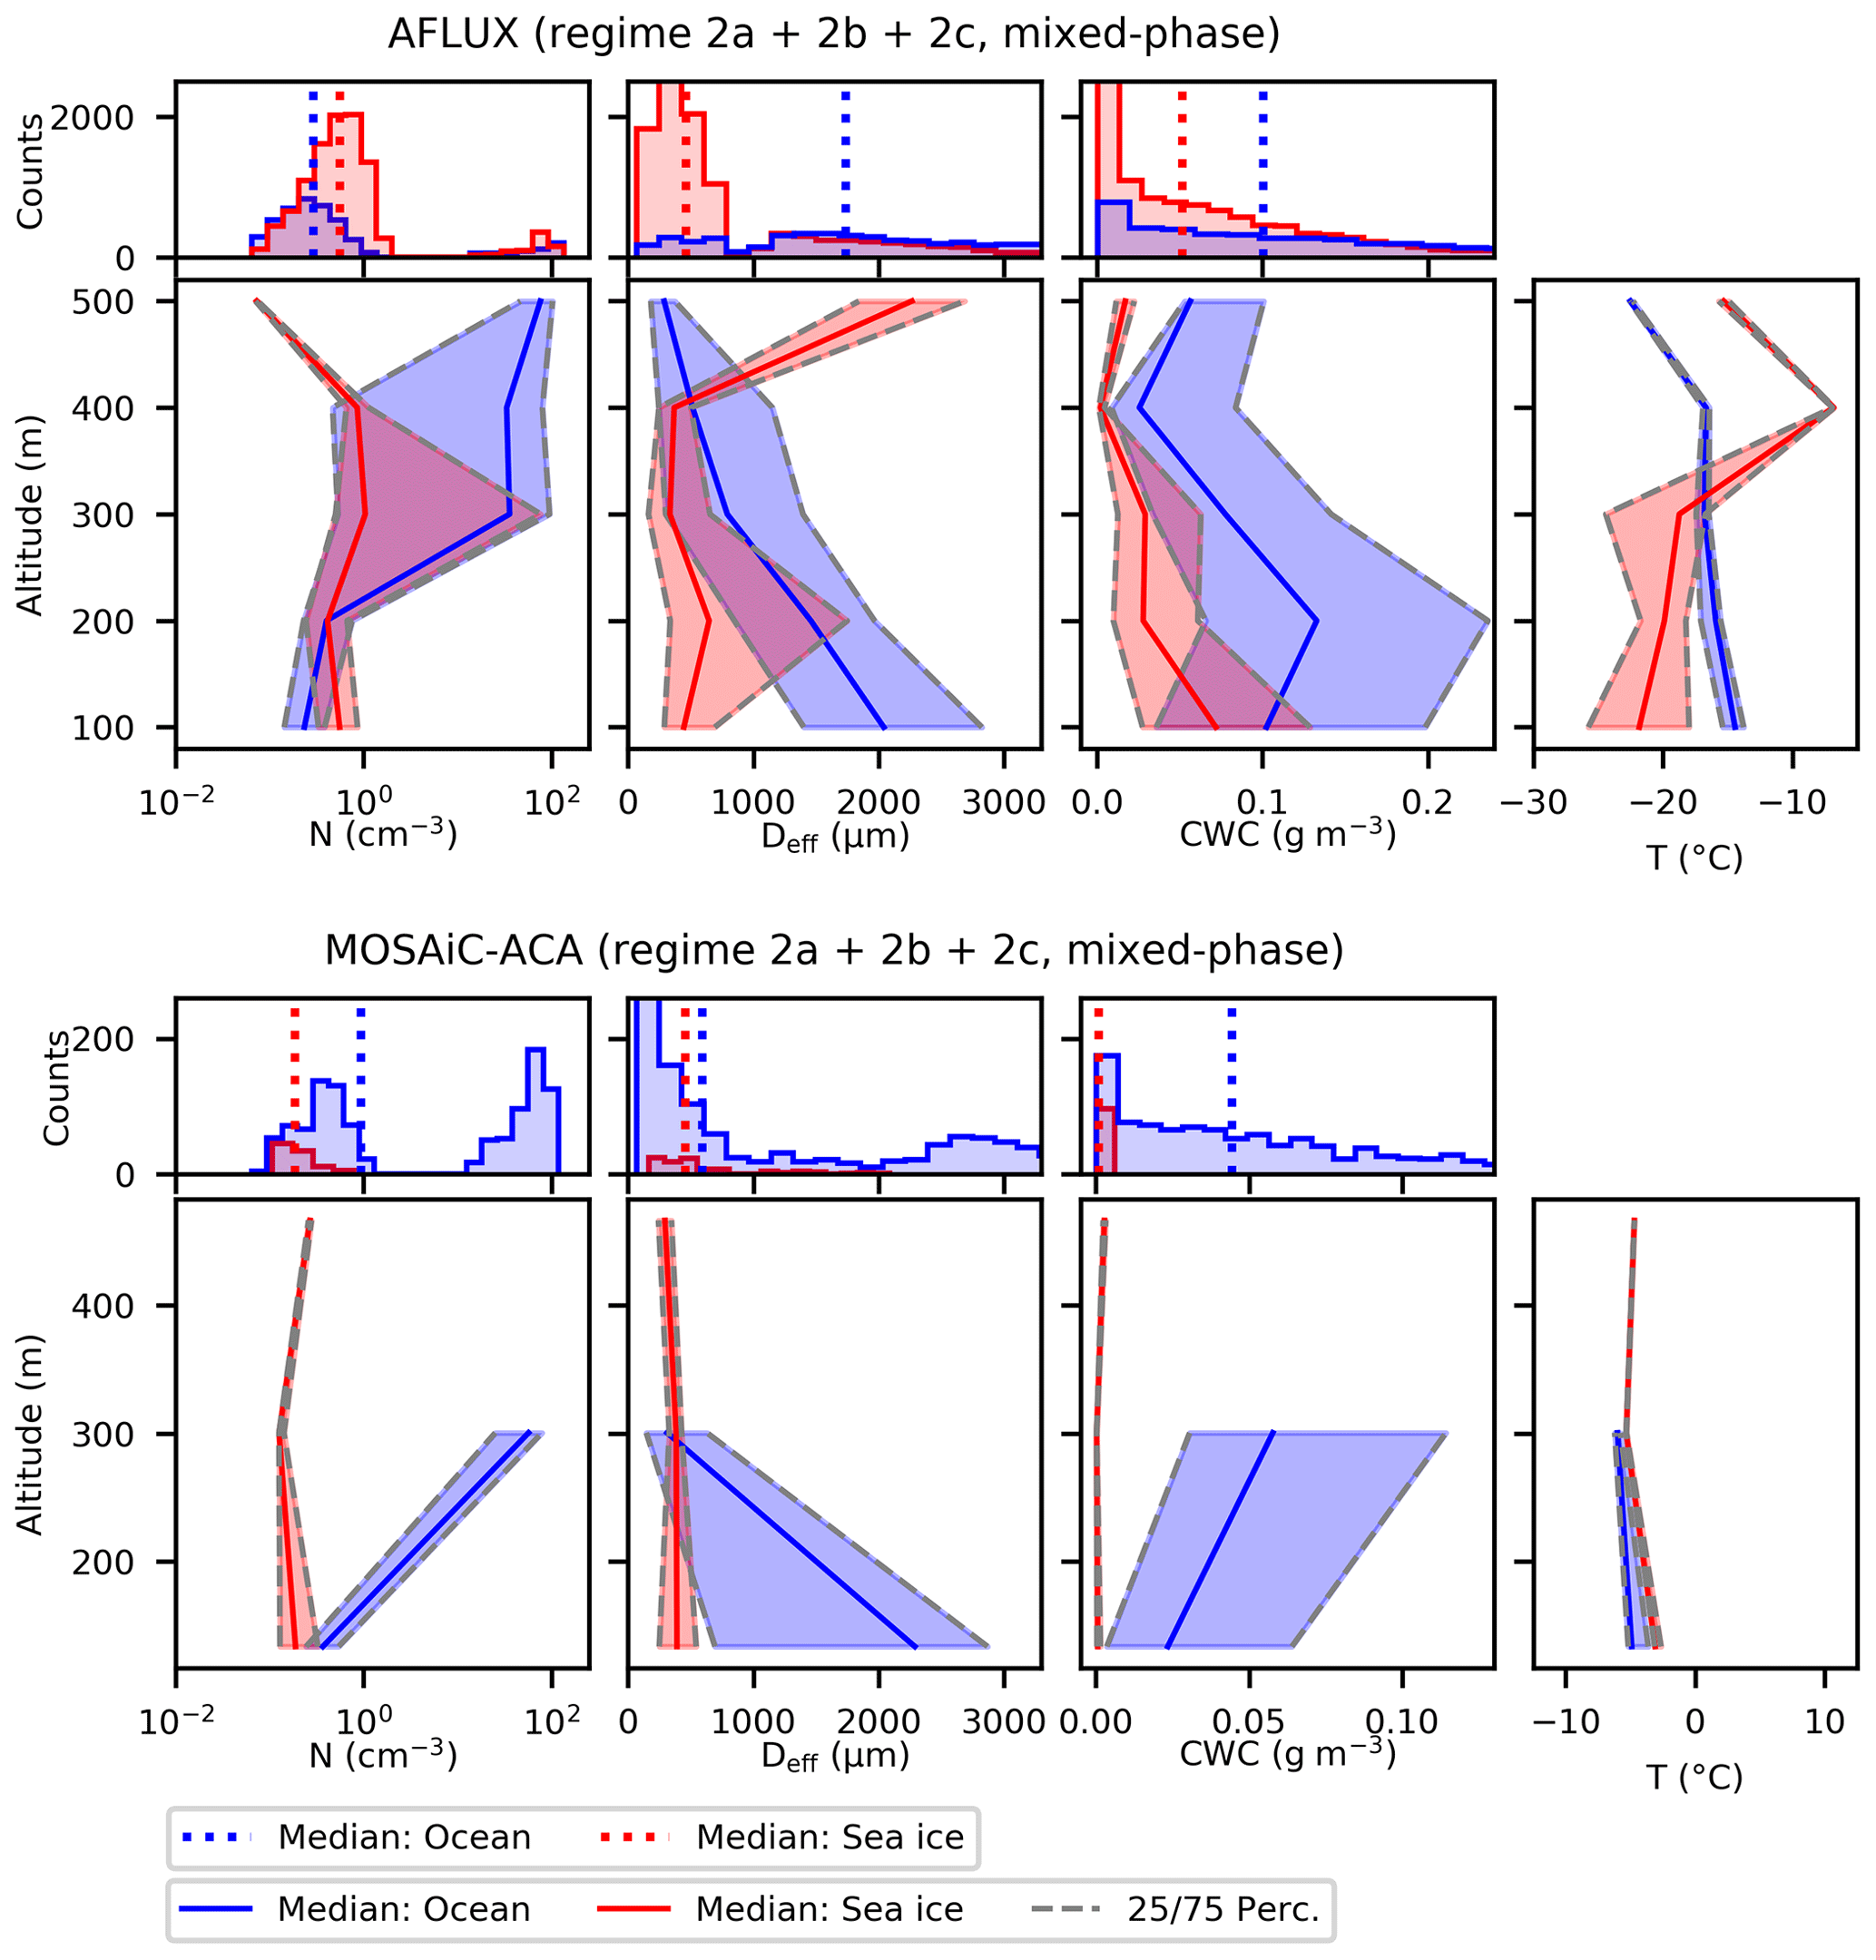
Table A2Similar to Table 3 but with cloud data from regimes 2a, 2b, and 2c, classified as mixed-phase. Differences within one column were tested for significance with method used in Sect. 3.1.
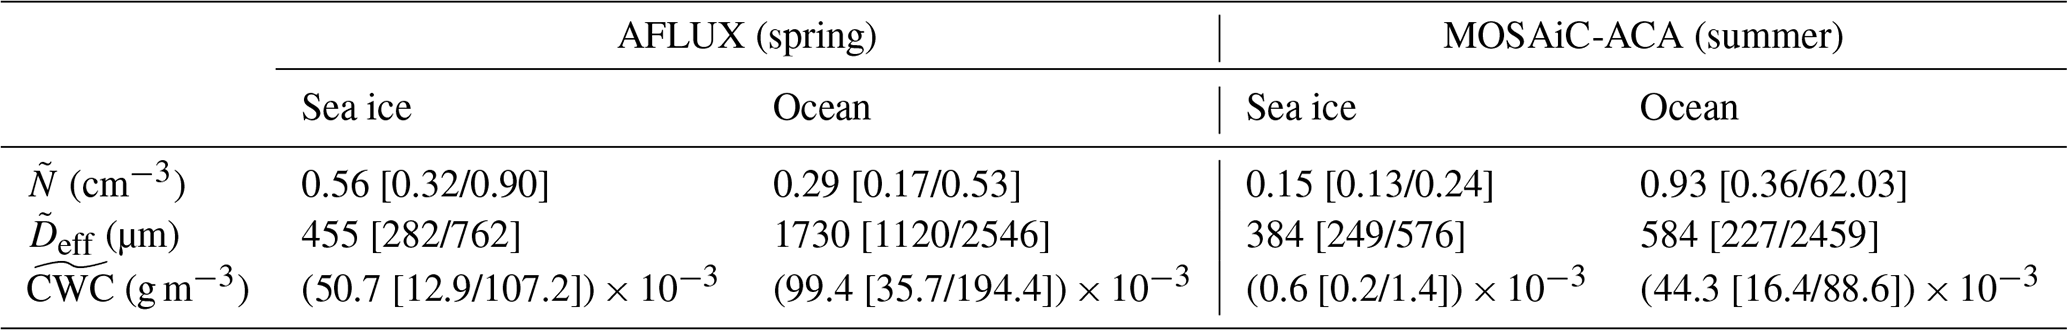
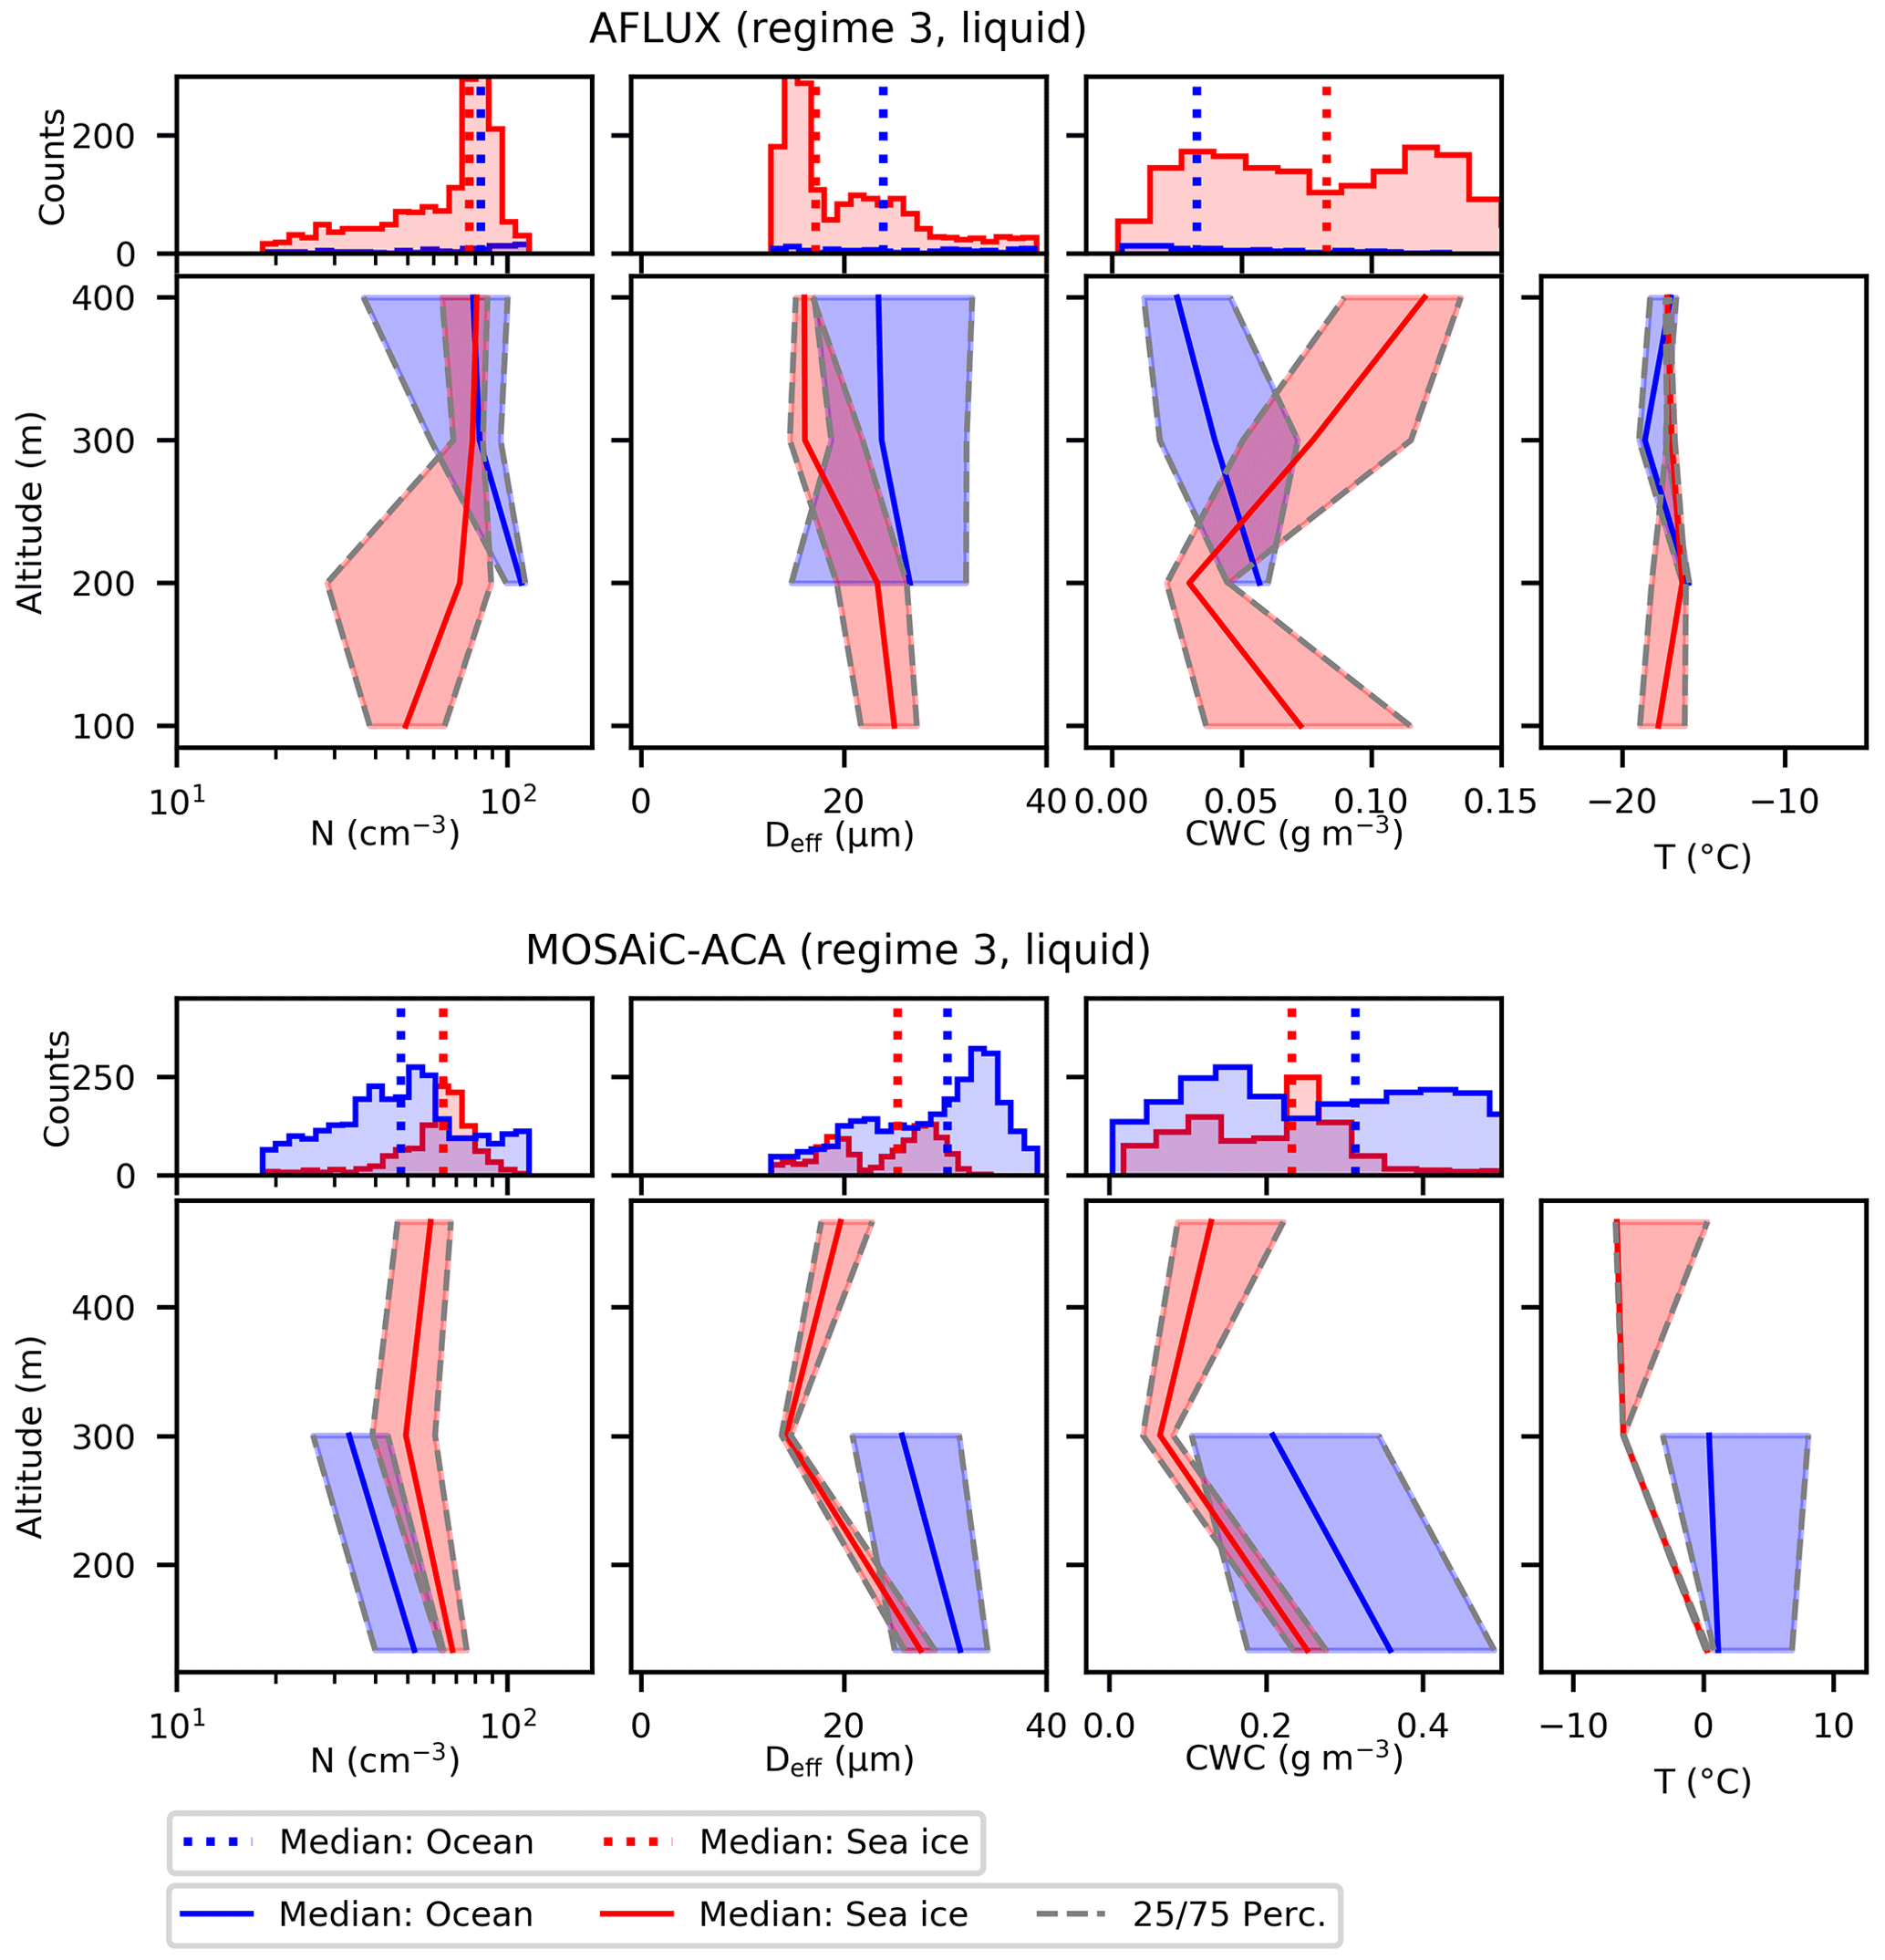
Table A3Similar to Table 3 but with cloud data from regime 3, classified as liquid phase. Differences within one column were tested for significance with method used in Sect. 3.1.

Table A4Similar to Table 3 but with data from regime 4, classified as aerosol particles (>2.8 µm). The asterisk indicates that one combination of two values within the column is not significantly different: im–om.
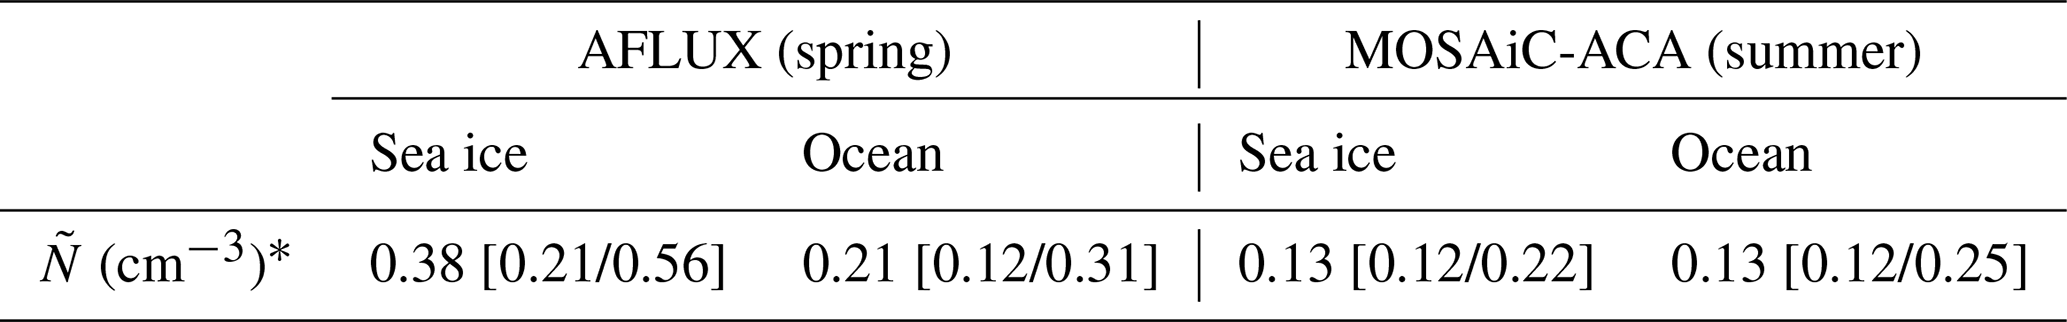
Table B1Fitted parameters for the gamma functions in Fig. 7 for the size range of the CDP/CAS, CIP, and PIP. The index CAS represents both instruments, CAS and CDP.
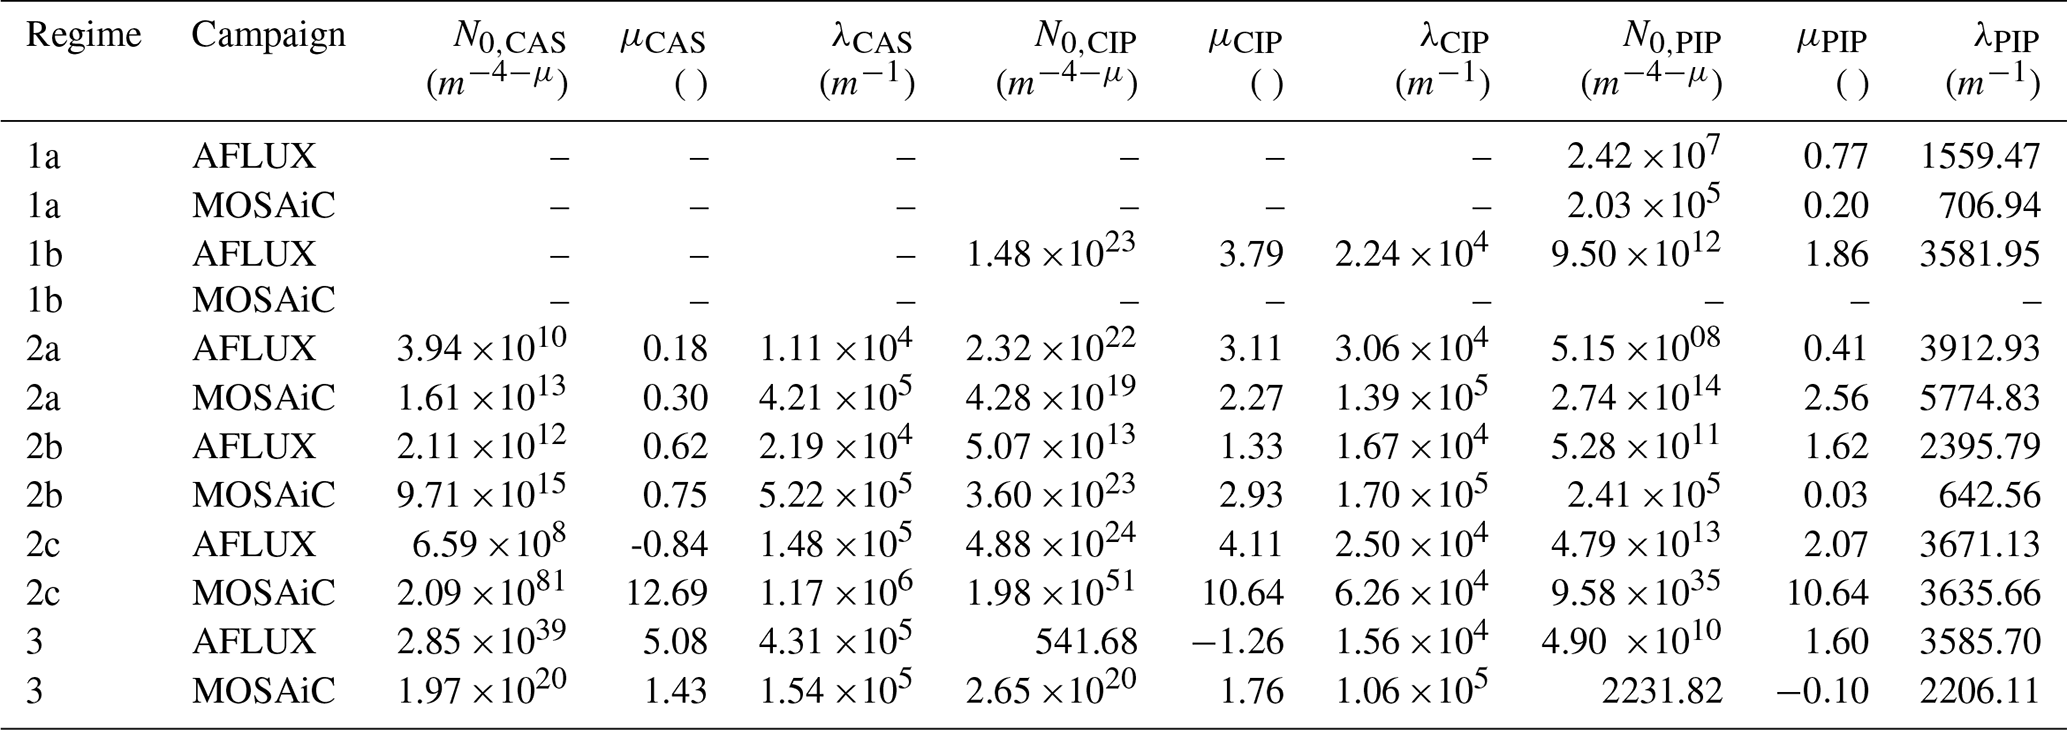
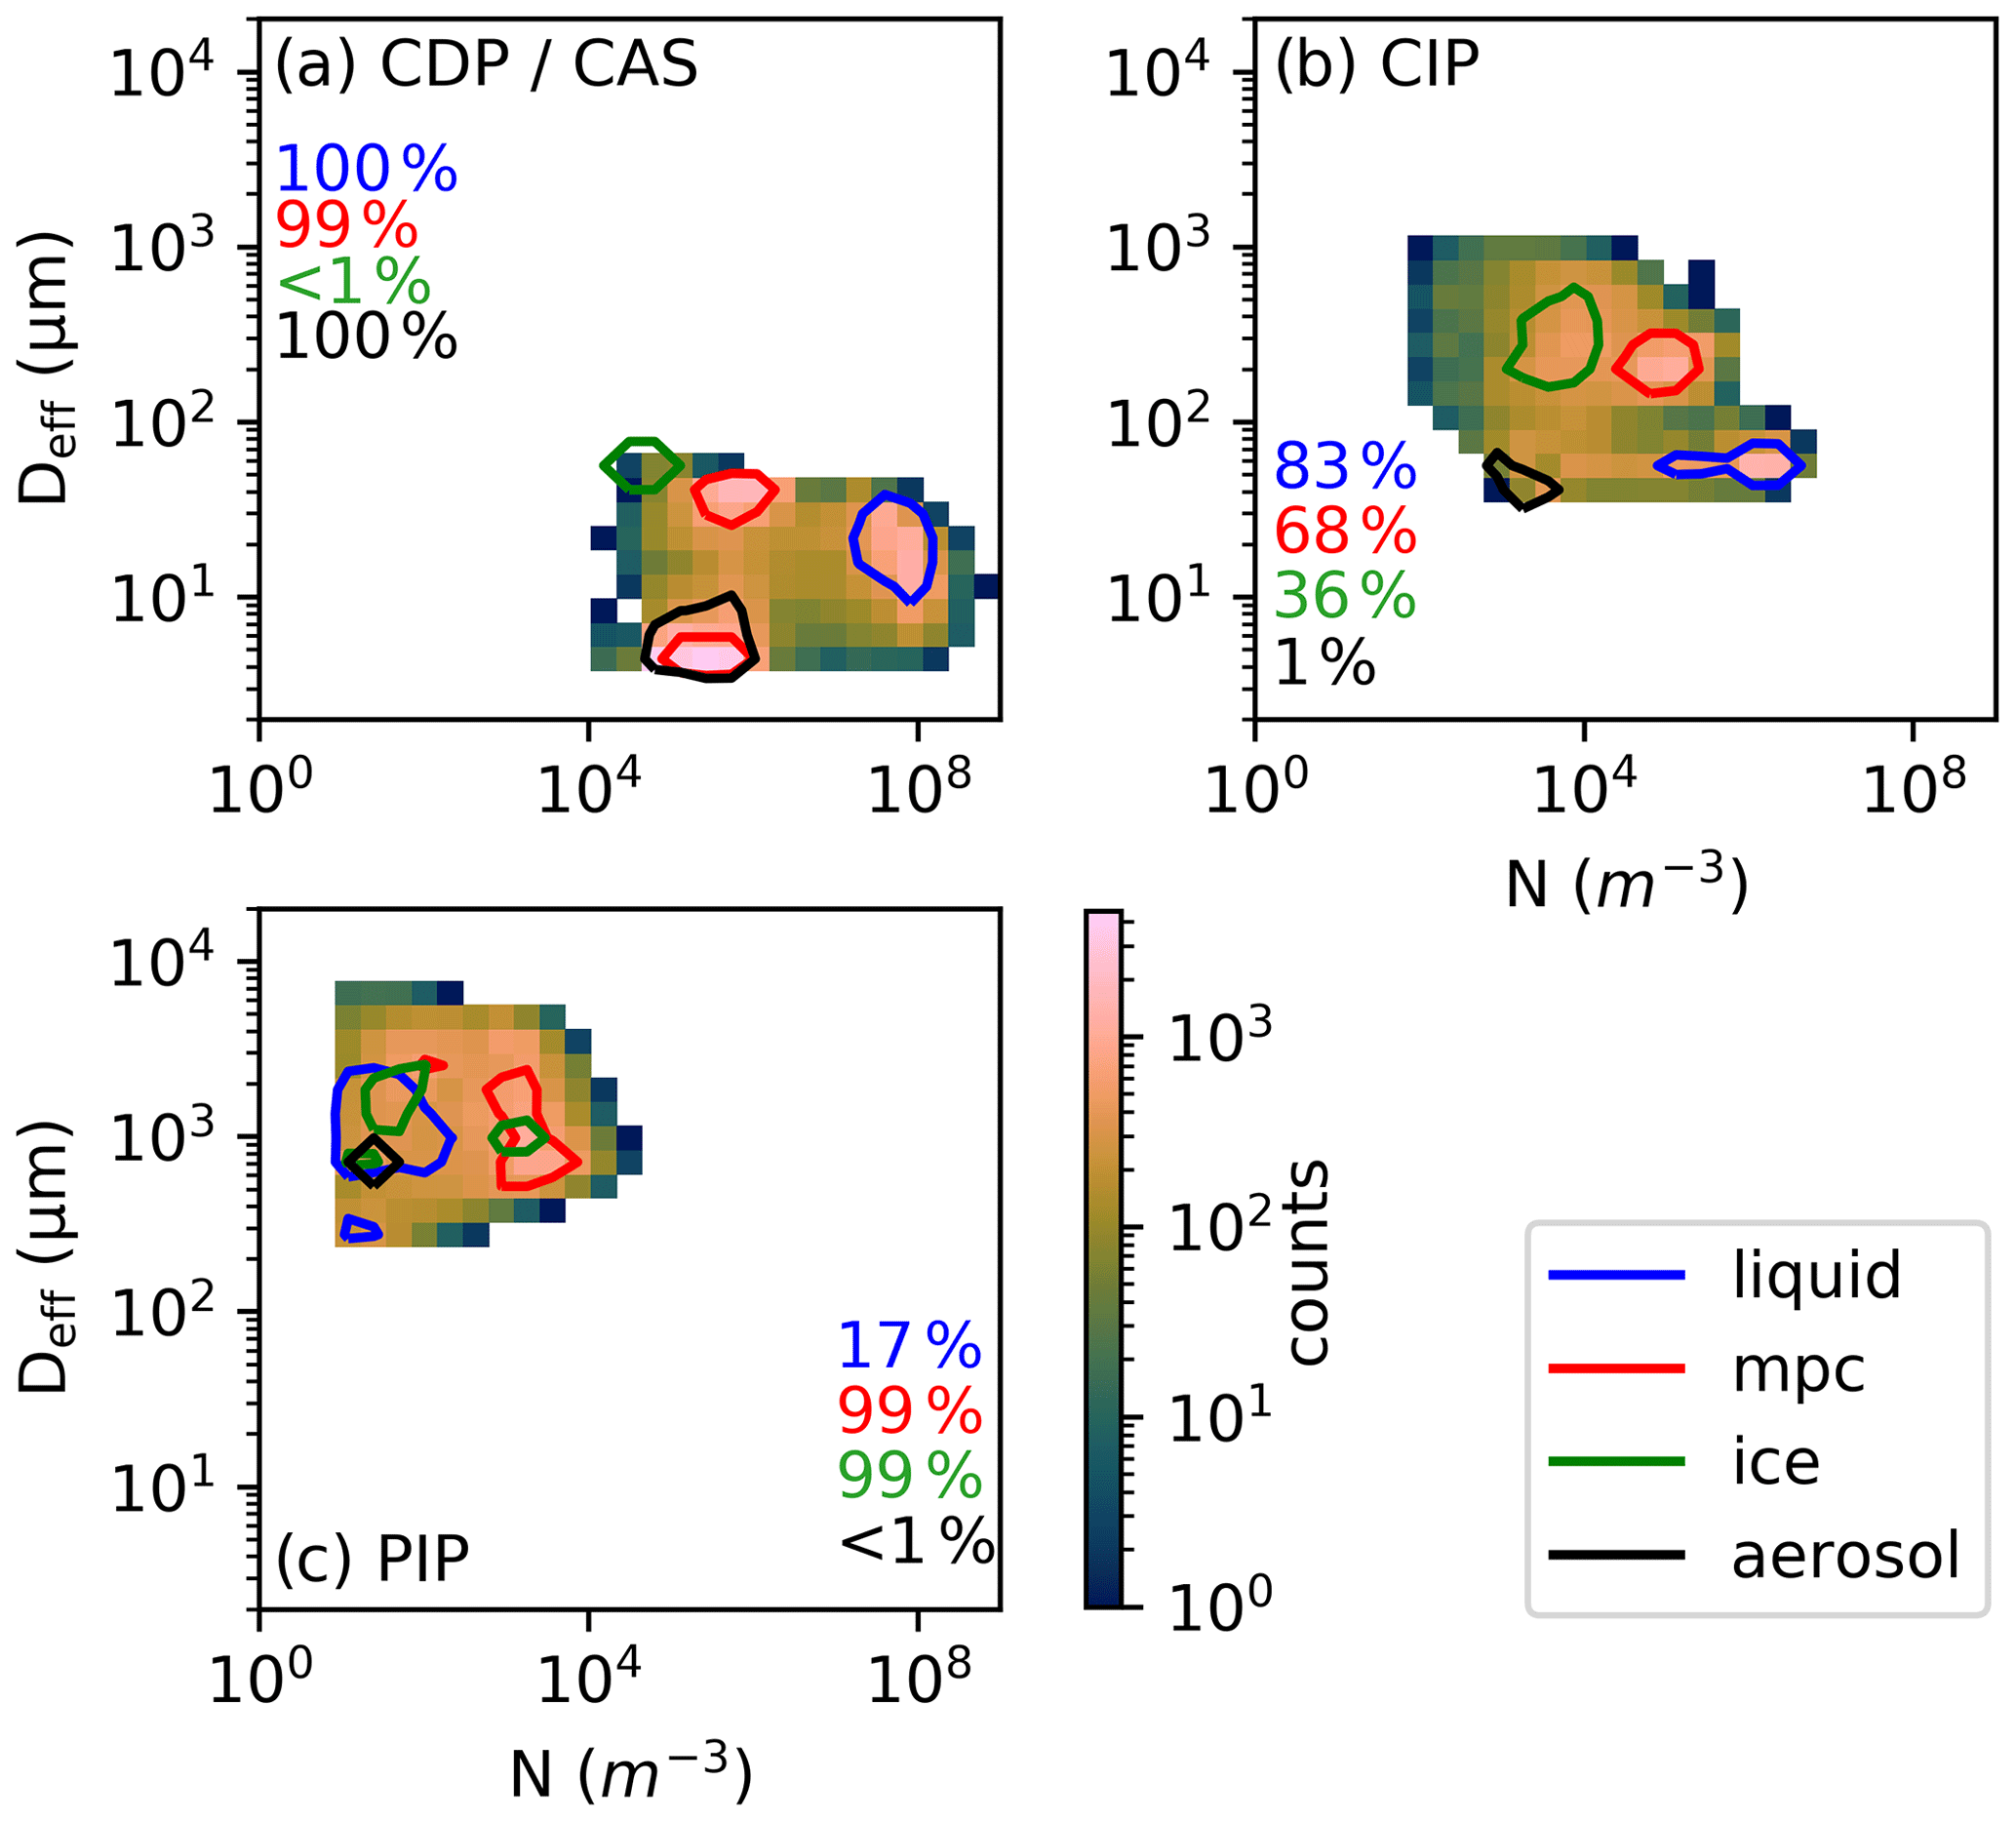
Figure B1N versus Deff as presented in Fig. 6 measured by the individual particle probes. The contour line encloses 95 % of the detected measurements classified as liquid, mixed-phase cloud (mpc), ice, and aerosol by the regimes in Fig. 6. The percentage values indicate the proportion of measurements detected by the respective instruments.
Processed in situ data from the AFLUX and MOSAiC-ACA campaigns are freely available via the world data center PANGAEA (https://doi.org/10.1594/PANGAEA.940564, Moser and Voigt, 2022; https://doi.org/10.1594/PANGAEA.940557, Moser et al., 2022; https://doi.org/10.1594/PANGAEA.941498, Dupuy et al., 2022a; https://doi.org/10.1594/PANGAEA.941538, Dupuy et al., 2022b). Data can be easily reproduced and analyzed by the Python package ac3airborne (https://doi.org/10.5281/Zenodo.7305585, Mech et al., 2022b) including a package for flight segmentation (https://doi.org/10.5281/Zenodo.7305558, Risse et al., 2022), where each research flight is split up into logical parts like ascends, descends, specific patterns for in situ probing, etc. The data ac3airborne package provides access to sea ice coverage along the flight path as well, extracted from data available at the University of Bremen (https://data.seaice.uni-bremen.de/amsr2/asi_daygrid_swath/n3125/, last access: 29 June 2023). Raw in situ cloud data recorded by the CAS, CAS, CIP, and PIP are archived at the German Aerospace Center and are available on request. Raw data by the PN and 2D-S are available from Régis Dupuy (regis.dupuy@uca.fr) on request. The HYSPLIT model is a freely accessible online tool available at https://www.ready.noaa.gov/HYSPLIT.php, last access: 29 June 2023. Figures have been designed with the Python software Pylustrator (Gerum, 2020).
MMo conducted the analysis and wrote the paper. CV and TJW supervised the study and provided intensive feedback on the paper. MMo, VH, GM, OJ, RD, CG, AS, JL, YB, and SB were responsible for the in situ probes and performed the measurements during both campaigns. MMe, AE, AH, CL, and MW conceived the flight experiments. MMo processed the data of the CAS, CDP, CIP, and PIP. RD processed the data recorded by the PN and the 2D-S probe. OJ and GM analyzed the PN data in Sect. 3.2. All authors reviewed the paper and added valuable suggestions to the final draft.
The contact author has declared that none of the authors has any competing interests.
Publisher’s note: Copernicus Publications remains neutral with regard to jurisdictional claims in published maps and institutional affiliations.
We thank the AWI flight crew for their excellent flight support during AFLUX and MOSAiC-ACA. We thank the two reviewers who provided valuable comments that improved the manuscript.
This research has been supported by the German Research Foundation (DFG, Deutsche
Forschungsgemeinschaft) under the Priority Program SPP PROM VO 1504/5-1, the Transregional
Collaborative Research Center SFB/TRR 172 (project ID 268020496), the TRR 301 – project ID
428312742, and the SPP 1294 HALO under contract VO 1504/7-1 and VO 1504/9-1.
The article processing charges for this open-access
publication were covered by the German Aerospace Center (DLR).
This paper was edited by Hailong Wang and reviewed by Andrew Heymsfield and Minghui Diao.
Bansemer, A.: System for OAP Data Analysis, Zenodo [code], https://doi.org/10.5281/zenodo.7803116, 2023. a
Baumgardner, D., Jonsson, H., Dawson, W., O'Connor, D., and Newton, R.: The Cloud, Aerosol and Precipitation Spectrometer: A New Instrument for Cloud Investigations, Atmos. Res., 59–60, 251–264, https://doi.org/10.1016/S0169-8095(01)00119-3, 2001. a, b
Baumgardner, D., Brenguier, J., Bucholtz, A., Coe, H., DeMott, P., Garrett, T., Gayet, J., Hermann, M., Heymsfield, A., Korolev, A., Krämer, M., Petzold, A., Strapp, W., Pilewskie, P., Taylor, J., Twohy, C., and Wendisch, M.: Airborne Instruments to Measure Atmospheric Aerosol Particles, Clouds and Radiation: A Cook's Tour of Mature and Emerging Technology, Atmos. Res., 102, 10–29, https://doi.org/10.1016/j.atmosres.2011.06.021, 2011. a
Baumgardner, D., Abel, S. J., Axisa, D., Cotton, R., Crosier, J., Field, P., Gurganus, C., Heymsfield, A., Korolev, A., Krämer, M., Lawson, P., McFarquhar, G., Ulanowski, Z., and Um, J.: Cloud Ice Properties: In Situ Measurement Challenges, Meteorol. Monogr., 58, 9.1–9.23, https://doi.org/10.1175/amsmonographs-d-16-0011.1, 2017. a, b, c, d
Bergeron, T.: On the physics of clouds and precipitation, Proces Verbaux de l’Association de Météorologie, International Union of Geodesy and Geophysics, Imprimerie Paul Dupont, Paris, France, 156–178, 1935. a
Blanchard, D. C.: The Ejection of Drops from the Sea and Their Enrichment with Bacteria and Other Materials: A Review, Estuaries, 12, 127–137, https://doi.org/10.2307/1351816, 1989. a
Bock, L., Lauer, A., Schlund, M., Barreiro, M., Bellouin, N., Jones, C., Meehl, G. A., Predoi, V., Roberts, M. J., and Eyring, V.: Quantifying Progress Across Different CMIP Phases With the ESMValTool, J. Geophys. Res.-Atmos., 125, e2019JD032321, https://doi.org/10.1029/2019jd032321, 2020. a
Bodas-Salcedo, A., Hill, P. G., Furtado, K., Williams, K. D., Field, P. R., Manners, J. C., Hyder, P., and Kato, S.: Large Contribution of Supercooled Liquid Clouds to the Solar Radiation Budget of the Southern Ocean, J. Climate, 29, 4213–4228, https://doi.org/10.1175/jcli-d-15-0564.1, 2016. a
Curry, J. A., Schramm, J. L., Rossow, W. B., and Randall, D.: Overview of Arctic Cloud and Radiation Characteristics, J. Climate, 9, 1731–1764, https://doi.org/10.1175/1520-0442(1996)009<1731:OOACAR>2.0.CO;2, 1996. a
Dahlke, S., Solbès, A., and Maturilli, M.: Cold Air Outbreaks in Fram Strait: Climatology, Trends, and Observations During an Extreme Season in 2020, J. Geophys. Res.-Atmos., 127, e2021JD035741, https://doi.org/10.1029/2021jd035741, 2022. a
D'Alessandro, J. J., Diao, M., Wu, C., Liu, X., Jensen, J. B., and Stephens, B. B.: Cloud Phase and Relative Humidity Distributions over the Southern Ocean in Austral Summer Based on In Situ Observations and CAM5 Simulations, J. Climate, 32, 2781–2805, https://doi.org/10.1175/jcli-d-18-0232.1, 2019. a
Dall'Osto, M., Beddows, D. C. S., Tunved, P., Krejci, R., Ström, J., Hansson, H.-C., Yoon, Y. J., Park, K.-T., Becagli, S., Udisti, R., Onasch, T., O'Dowd, C. D., Simó, R., and Harrison, R. M.: Arctic sea ice melt leads to atmospheric new particle formation, Sci. Rep., 7, 3318, https://doi.org/10.1038/s41598-017-03328-1, 2017. a
Dodson, J. B., Taylor, P. C., Moore, R. H., Bromwich, D. H., Hines, K. M., Thornhill, K. L., Corr, C. A., Anderson, B. E., Winstead, E. L., and Bennett, J. R.: Evaluation of simulated cloud liquid water in low clouds over the Beaufort Sea in the Arctic System Reanalysis using ARISE airborne in situ observations, Atmos. Chem. Phys., 21, 11563–11580, https://doi.org/10.5194/acp-21-11563-2021, 2021. a
Dupuy, R., Gourbeyre, C., Mioche, G., and Jourdan, O.: French Airborne Measurement Platform (PMA) cloud particle size distribution and volumic cloud particle diffusion properties dataset near Svalbard for AFLUX measurement campaign with POLAR 5 in 2019, PANGAEA [data set], https://doi.org/10.1594/PANGAEA.941498, 2022a. a, b
Dupuy, R., Gourbeyre, C., Mioche, G., Moser, M., and Jourdan, O.: French Airborne Measurement Platform (PMA) cloud particle size distribution and volumic cloud particle diffusion properties dataset near Svalbard for MOSAIC-ACA measurement campaign in 2020, PANGAEA [data set], https://doi.org/10.1594/PANGAEA.941538, 2022b. a, b
Eirund, G. K., Possner, A., and Lohmann, U.: The Impact of Warm and Moist Airmass Perturbations on Arctic Mixed-Phase Stratocumulus, J. Climate, 33, 9615–9628, https://doi.org/10.1175/jcli-d-20-0163.1, 2020. a
Elvidge, A. D., Renfrew, I. A., Brooks, I. M., Srivastava, P., Yelland, M. J., and Prytherch, J.: Surface Heat and Moisture Exchange in the Marginal Ice Zone: Observations and a New Parameterization Scheme for Weather and Climate Models, J. Geophys. Res.-Atmos., 126, e2021JD034827, https://doi.org/10.1029/2021jd034827, 2021. a
Faber, S., French, J. R., and Jackson, R.: Laboratory and in-flight evaluation of measurement uncertainties from a commercial Cloud Droplet Probe (CDP), Atmos. Meas. Tech., 11, 3645–3659, https://doi.org/10.5194/amt-11-3645-2018, 2018. a
Findeisen, F.: Kolloid-meteorologische Vorgänge bei Niederschlagsbildung, Meteorol. Z., 55, 121–133, 1938. a
Gayet, J. F., Crépel, O., Fournol, J. F., and Oshchepkov, S.: A new airborne polar Nephelometer for the measurements of optical and microphysical cloud properties. Part I: Theoretical design, Ann. Geophys., 15, 451–459, https://doi.org/10.1007/s00585-997-0451-1, 1997. a
Gayet, J.-F., Auriol, F., Minikin, A., Ström, J., Seifert, M., Krejci, R., Petzold, A., Febvre, G., and Schumann, U.: Quantitative Measurement of the Microphysical and Optical Properties of Cirrus Clouds with Four Different in Situ Probes: Evidence of Small Ice Crystals, Geophys. Res. Lett., 29, 2230, https://doi.org/10.1029/2001GL014342, 2002. a
Gayet, J.-F., Shcherbakov, V., Voigt, C., Schumann, U., Schäuble, D., Jessberger, P., Petzold, A., Minikin, A., Schlager, H., Dubovik, O., and Lapyonok, T.: The evolution of microphysical and optical properties of an A380 contrail in the vortex phase, Atmos. Chem. Phys., 12, 6629–6643, https://doi.org/10.5194/acp-12-6629-2012, 2012. a
Gerber, H., Takano, Y., Garrett, T. J., and Hobbs, P. V.: Nephelometer Measurements of the Asymmetry Parameter, Volume Extinction Coefficient, and Backscatter Ratio in Arctic Clouds, J. Atmos. Sci., 57, 3021–3034, https://doi.org/10.1175/1520-0469(2000)057<3021:NMOTAP>2.0.CO;2, 2000. a
Gerum, R.: pylustrator: code generation for reproducible figures for publication, Journal of Open Source Software, 5, 1989, https://doi.org/10.21105/joss.01989, 2020. a
Gurganus, C. and Lawson, P.: Laboratory and Flight Tests of 2D Imaging Probes: Toward a Better Understanding of Instrument Performance and the Impact on Archived Data, J. Atmos. Ocean. Tech., 35, 1533–1553, https://doi.org/10.1175/jtech-d-17-0202.1, 2018. a
Hartmann, M., Adachi, K., Eppers, O., Haas, C., Herber, A., Holzinger, R., Hünerbein, A., Jäkel, E., Jentzsch, C., Pinxteren, M., Wex, H., Willmes, S., and Stratmann, F.: Wintertime Airborne Measurements of Ice Nucleating Particles in the High Arctic: A Hint to a Marine, Biogenic Source for Ice Nucleating Particles, Geophys. Res. Lett., 47, e2020GL087770, https://doi.org/10.1029/2020gl087770, 2020. a, b, c
Herber, A., Becker, S., Belter, H. J., Brauchle, J., Ehrlich, A., Klingebiel, M., Krumpen, T., Lüpkes, C., Mech, M., Moser, M., and Wendisch, M.: MOSAiC Expedition: Airborne Surveys with Research Aircraft POLAR 5 and POLAR 6 in 2020 , Berichte zur Polar- und Meeresforschung = Reports on Polar and Marine Research, https://doi.org/10.48433/BzPM_0754_2021, 2021. a
Heymsfield, A., Bansemer, A., Heymsfield, G., Noone, D., Grecu, M., and Toohey, D.: Relationship of Multiwavelength Radar Measurements to Ice Microphysics from the IMPACTS Field Program, J. Appl. Meteorol. Clim., 62, 289–315, https://doi.org/10.1175/jamc-d-22-0057.1, 2023. a
Heymsfield, A. J., Schmitt, C., Bansemer, A., and Twohy, C. H.: Improved Representation of Ice Particle Masses Based on Observations in Natural Clouds, J. Atmos. Sci., 67, 3303–3318, https://doi.org/10.1175/2010jas3507.1, 2010. a, b
Hogan, R. J., Tian, L., Brown, P. R. A., Westbrook, C. D., Heymsfield, A. J., and Eastment, J. D.: Radar Scattering from Ice Aggregates Using the Horizontally Aligned Oblate Spheroid Approximation, J. Appl. Meteorol. Clim., 51, 655–671, https://doi.org/10.1175/jamc-d-11-074.1, 2012. a
Huang, J. and Jaeglé, L.: Wintertime enhancements of sea salt aerosol in polar regions consistent with a sea ice source from blowing snow, Atmos. Chem. Phys., 17, 3699–3712, https://doi.org/10.5194/acp-17-3699-2017, 2017. a
Jourdan, O., Oshchepkov, S., Shcherbakov, V., Gayet, J.-F., and Isaka, H.: Assessment of Cloud Optical Parameters in the Solar Region: Retrievals from Airborne Measurements of Scattering Phase Functions, J. Geophys. Res.-Atmos., 108, 4572, https://doi.org/10.1029/2003JD003493, 2003. a
Jourdan, O., Mioche, G., Garrett, T. J., Schwarzenböck, A., Vidot, J., Xie, Y., Shcherbakov, V., Yang, P., and Gayet, J.-F.: Coupling of the Microphysical and Optical Properties of an Arctic Nimbostratus Cloud during the ASTAR 2004 Experiment: Implications for Light-Scattering Modeling, J. Geophys. Res., 115, D23206, https://doi.org/10.1029/2010JD014016, 2010. a
Kirpes, R. M., Bondy, A. L., Bonanno, D., Moffet, R. C., Wang, B., Laskin, A., Ault, A. P., and Pratt, K. A.: Secondary sulfate is internally mixed with sea spray aerosol and organic aerosol in the winter Arctic, Atmos. Chem. Phys., 18, 3937–3949, https://doi.org/10.5194/acp-18-3937-2018, 2018. a
Kirschler, S., Voigt, C., Anderson, B., Campos Braga, R., Chen, G., Corral, A. F., Crosbie, E., Dadashazar, H., Ferrare, R. A., Hahn, V., Hendricks, J., Kaufmann, S., Moore, R., Pöhlker, M. L., Robinson, C., Scarino, A. J., Schollmayer, D., Shook, M. A., Thornhill, K. L., Winstead, E., Ziemba, L. D., and Sorooshian, A.: Seasonal updraft speeds change cloud droplet number concentrations in low-level clouds over the western North Atlantic, Atmos. Chem. Phys., 22, 8299–8319, https://doi.org/10.5194/acp-22-8299-2022, 2022. a
Kleine, J., Voigt, C., Sauer, D., Schlager, H., Scheibe, M., Jurkat-Witschas, T., Kaufmann, S., Kärcher, B., and Anderson, B. E.: In Situ Observations of Ice Particle Losses in a Young Persistent Contrail, Geophys. Res. Lett., 45, 13553–13561, https://doi.org/10.1029/2018gl079390, 2018. a
Klingebiel, M., de Lozar, A., Molleker, S., Weigel, R., Roth, A., Schmidt, L., Meyer, J., Ehrlich, A., Neuber, R., Wendisch, M., and Borrmann, S.: Arctic low-level boundary layer clouds: in situ measurements and simulations of mono- and bimodal supercooled droplet size distributions at the top layer of liquid phase clouds, Atmos. Chem. Phys., 15, 617–631, https://doi.org/10.5194/acp-15-617-2015, 2015. a, b
Knust, R.: Polar Research and Supply Vessel POLARSTERN operated by the Alfred-Wegener-Institute, Journal of large-scale research facilities, 3, A119, https://doi.org/10.17815/jlsrf-3-163, 2017. a
Köllner, F., Schneider, J., Willis, M. D., Schulz, H., Kunkel, D., Bozem, H., Hoor, P., Klimach, T., Helleis, F., Burkart, J., Leaitch, W. R., Aliabadi, A. A., Abbatt, J. P. D., Herber, A. B., and Borrmann, S.: Chemical composition and source attribution of sub-micrometre aerosol particles in the summertime Arctic lower troposphere, Atmos. Chem. Phys., 21, 6509–6539, https://doi.org/10.5194/acp-21-6509-2021, 2021. a
Korolev, A., McFarquhar, G., Field, P. R., Franklin, C., Lawson, P., Wang, Z., Williams, E., Abel, S. J., Axisa, D., Borrmann, S., Crosier, J., Fugal, J., Krämer, M., Lohmann, U., Schlenczek, O., Schnaiter, M., and Wendisch, M.: Mixed-Phase Clouds: Progress and Challenges, Meteorol. Monogr., 58, 5.1–5.50, https://doi.org/10.1175/amsmonographs-d-17-0001.1, 2017. a, b
Kretzschmar, J., Stapf, J., Klocke, D., Wendisch, M., and Quaas, J.: Employing airborne radiation and cloud microphysics observations to improve cloud representation in ICON at kilometer-scale resolution in the Arctic, Atmos. Chem. Phys., 20, 13145–13165, https://doi.org/10.5194/acp-20-13145-2020, 2020. a
Lance, S., Brock, C. A., Rogers, D., and Gordon, J. A.: Water droplet calibration of the Cloud Droplet Probe (CDP) and in-flight performance in liquid, ice and mixed-phase clouds during ARCPAC, Atmos. Meas. Tech., 3, 1683–1706, https://doi.org/10.5194/amt-3-1683-2010, 2010. a
Lawson, R. P. and Zuidema, P.: Aircraft Microphysical and Surface-Based Radar Observations of Summertime Arctic Clouds, J. Atmos. Sci., 66, 3505–3529, https://doi.org/10.1175/2009jas3177.1, 2009. a, b, c
Lawson, R. P., O’Connor, D., Zmarzly, P., Weaver, K., Baker, B., Mo, Q., and Jonsson, H.: The 2D-S (Stereo) Probe: Design and Preliminary Tests of a New Airborne, High-Speed, High-Resolution Particle Imaging Probe, J. Atmos. Ocean. Tech., 23, 1462–1477, https://doi.org/10.1175/JTECH1927.1, 2006. a
Lüpkes, C., Vihma, T., Birnbaum, G., Dierer, S., Garbrecht, T., Gryanik, V. M., Gryschka, M., Hartmann, J., Heinemann, G., Kaleschke, L., Raasch, S., Savijärvi, H., Schlünzen, K. H., and Wacker, U.: Mesoscale Modelling of the Arctic Atmospheric Boundary Layer and Its Interaction with Sea Ice, in: Arctic Climate Change, 279–324, Springer Netherlands, https://doi.org/10.1007/978-94-007-2027-5_7, 2011. a
McCoy, D. T., Tan, I., Hartmann, D. L., Zelinka, M. D., and Storelvmo, T.: On the relationships among cloud cover, mixed-phase partitioning, and planetary albedo in GCMs, J. Adv. Model. Earth Sy., 8, 650–668, https://doi.org/10.1002/2015ms000589, 2016. a
McFarquhar, G. M., Zhang, G., Poellot, M. R., Kok, G. L., McCoy, R., Tooman, T., Fridlind, A., and Heymsfield, A. J.: Ice properties of single-layer stratocumulus during the Mixed-Phase Arctic Cloud Experiment: 1. Observations, J. Geophys. Res., 112, D24201, https://doi.org/10.1029/2007jd008633, 2007. a, b, c
McFarquhar, G. M., Baumgardner, D., Bansemer, A., Abel, S. J., Crosier, J., French, J., Rosenberg, P., Korolev, A., Schwarzoenboeck, A., Leroy, D., Um, J., Wu, W., Heymsfield, A. J., Twohy, C., Detwiler, A., Field, P., Neumann, A., Cotton, R., Axisa, D., and Dong, J.: Processing of Ice Cloud In Situ Data Collected by Bulk Water, Scattering, and Imaging Probes: Fundamentals, Uncertainties, and Efforts toward Consistency, Meteorol. Monogr., 58, 11.1–11.33, https://doi.org/10.1175/amsmonographs-d-16-0007.1, 2017. a
Mech, M., Maahn, M., Kneifel, S., Ori, D., Orlandi, E., Kollias, P., Schemann, V., and Crewell, S.: PAMTRA 1.0: the Passive and Active Microwave radiative TRAnsfer tool for simulating radiometer and radar measurements of the cloudy atmosphere, Geosci. Model Dev., 13, 4229–4251, https://doi.org/10.5194/gmd-13-4229-2020, 2020. a
Mech, M., Ehrlich, A., Herber, A., Lüpkes, C., Wendisch, M., Becker, S., Boose, Y., Chechin, D., Crewell, S., Dupuy, R., Gourbeyre, C., Hartmann, J., Jäkel, E., Jourdan, O., Kliesch, L.-L., Klingebiel, M., Kulla, B. S., Mioche, G., Moser, M., Risse, N., Ruiz-Donoso, E., Schäfer, M., Stapf, J., and Voigt, C.: MOSAiC-ACA and AFLUX – Arctic airborne campaigns characterizing the exit area of MOSAiC, Sci. Data, 9, 790, https://doi.org/10.1038/s41597-022-01900-7, 2022a. a, b
Mech, M., Risse, N., Marrollo, G., and Paul, D.: Ac3airborne, Zenodo [code], https://doi.org/10.5281/zenodo.7305585, 2022b. a
Michaelis, J. and Lüpkes, C.: The Impact of Lead Patterns on Mean Profiles of Wind, Temperature, and Turbulent Fluxes in the Atmospheric Boundary Layer over Sea Ice, Atmosphere, 13, 148, https://doi.org/10.3390/atmos13010148, 2022. a
Mioche, G., Jourdan, O., Ceccaldi, M., and Delanoë, J.: Variability of mixed-phase clouds in the Arctic with a focus on the Svalbard region: a study based on spaceborne active remote sensing, Atmos. Chem. Phys., 15, 2445–2461, https://doi.org/10.5194/acp-15-2445-2015, 2015. a
Mioche, G., Jourdan, O., Delanoë, J., Gourbeyre, C., Febvre, G., Dupuy, R., Monier, M., Szczap, F., Schwarzenboeck, A., and Gayet, J.-F.: Vertical distribution of microphysical properties of Arctic springtime low-level mixed-phase clouds over the Greenland and Norwegian seas, Atmos. Chem. Phys., 17, 12845–12869, https://doi.org/10.5194/acp-17-12845-2017, 2017. a, b, c
Morrison, H., de Boer, G., Feingold, G., Harrington, J., Shupe, M. D., and Sulia, K.: Resilience of persistent Arctic mixed-phase clouds, Nat. Geosci., 5, 11–17, https://doi.org/10.1038/ngeo1332, 2011. a
Moschos, V., Dzepina, K., Bhattu, D., Lamkaddam, H., Casotto, R., Daellenbach, K. R., Canonaco, F., Rai, P., Aas, W., Becagli, S., Calzolai, G., Eleftheriadis, K., Moffett, C. E., Schnelle-Kreis, J., Severi, M., Sharma, S., Skov, H., Vestenius, M., Zhang, W., Hakola, H., Hellén, H., Huang, L., Jaffrezo, J.-L., Massling, A., Nøjgaard, J. K., Petäjä, T., Popovicheva, O., Sheesley, R. J., Traversi, R., Yttri, K. E., Schmale, J., Prévôt, A. S. H., Baltensperger, U., and Haddad, I. E.: Equal abundance of summertime natural and wintertime anthropogenic Arctic organic aerosols, Nat. Geosci., 15, 196–202, https://doi.org/10.1038/s41561-021-00891-1, 2022. a
Moser, M. and Voigt, C.: DLR in-situ cloud measurements during AFLUX Arctic airborne campaign, PANGAEA [data set], https://doi.org/10.1594/PANGAEA.940564, 2022. a, b
Moser, M., Voigt, C., and Hahn, V.: DLR in-situ cloud measurements during MOSAiC-ACA Arctic airborne campaign, PANGAEA [data set], https://doi.org/10.1594/PANGAEA.940557, 2022. a, b
Naud, C. M., Booth, J. F., and Genio, A. D. D.: Evaluation of ERA-Interim and MERRA Cloudiness in the Southern Ocean, J. Climate, 27, 2109–2124, https://doi.org/10.1175/jcli-d-13-00432.1, 2014. a
Nomokonova, T., Ebell, K., Löhnert, U., Maturilli, M., Ritter, C., and O'Connor, E.: Statistics on clouds and their relation to thermodynamic conditions at Ny-Ålesund using ground-based sensor synergy, Atmos. Chem. Phys., 19, 4105–4126, https://doi.org/10.5194/acp-19-4105-2019, 2019. a
Porter, G. C. E., Adams, M. P., Brooks, I. M., Ickes, L., Karlsson, L., Leck, C., Salter, M. E., Schmale, J., Siegel, K., Sikora, S. N. F., Tarn, M. D., Vüllers, J., Wernli, H., Zieger, P., Zinke, J., and Murray, B. J.: Highly Active Ice-Nucleating Particles at the Summer North Pole, J. Geophys. Res.-Atmos., 127, e2021JD036059, https://doi.org/10.1029/2021jd036059, 2022. a
Risse, N., Marrollo, G., Paul, D., and Mech, M.: Ac3airborne – Flight-Phase-Separation, Zenodo [code], https://doi.org/10.5281/zenodo.7305558, 2022. a
Rolph, G., Stein, A., and Stunder, B.: Real-time environmental applications and display sYstem: READY, Environ. Model. Softw., 95, 210–228, 2017. a
Ruiz-Donoso, E., Ehrlich, A., Schäfer, M., Jäkel, E., Schemann, V., Crewell, S., Mech, M., Kulla, B. S., Kliesch, L.-L., Neuber, R., and Wendisch, M.: Small-scale structure of thermodynamic phase in Arctic mixed-phase clouds observed by airborne remote sensing during a cold air outbreak and a warm air advection event, Atmos. Chem. Phys., 20, 5487–5511, https://doi.org/10.5194/acp-20-5487-2020, 2020. a
Schmale, J., Zieger, P., and Ekman, A. M. L.: Aerosols in current and future Arctic climate, Nat. Clim. Change, 11, 95–105, https://doi.org/10.1038/s41558-020-00969-5, 2021. a
Schumann, U., Mayer, B., Gierens, K., Unterstrasser, S., Jessberger, P., Petzold, A., Voigt, C., and Gayet, J.-F.: Effective Radius of Ice Particles in Cirrus and Contrails, J. Atmos. Sci., 68, 300–321, https://doi.org/10.1175/2010jas3562.1, 2011. a
Seguin, A. M., Norman, A.-L., and Barrie, L.: Evidence of sea ice source in aerosol sulfate loading and size distribution in the Canadian High Arctic from isotopic analysis, J. Geophys. Res.-Atmos., 119, 1087–1096, https://doi.org/10.1002/2013jd020461, 2014. a
Serreze, M. C. and Francis, J. A.: The Arctic Amplification Debate, Climatic Change, 76, 241–264, https://doi.org/10.1007/s10584-005-9017-y, 2006. a
Shcherbakov, V., Gayet, J.-F., Baker, B., and Lawson, P.: Light Scattering by Single Natural Ice Crystals, J. Atmos. Sci., 63, 1513–1525, https://doi.org/10.1175/JAS3690.1, 2006. a
Shupe, M. D., Matrosov, S. Y., and Uttal, T.: Arctic Mixed-Phase Cloud Properties Derived from Surface-Based Sensors at SHEBA, J. Atmos. Sci., 63, 697–711, https://doi.org/10.1175/JAS3659.1, 2006. a
Shupe, M. D., Rex, M., Blomquist, B., Persson, P. O. G., Schmale, J., Uttal, T., Althausen, D., Angot, H., Archer, S., Bariteau, L., Beck, I., Bilberry, J., Bucci, S., Buck, C., Boyer, M., Brasseur, Z., Brooks, I. M., Calmer, R., Cassano, J., Castro, V., Chu, D., Costa, D., Cox, C. J., Creamean, J., Crewell, S., Dahlke, S., Damm, E., de Boer, G., Deckelmann, H., Dethloff, K., Dütsch, M., Ebell, K., Ehrlich, A., Ellis, J., Engelmann, R., Fong, A. A., Frey, M. M., Gallagher, M. R., Ganzeveld, L., Gradinger, R., Graeser, J., Greenamyer, V., Griesche, H., Griffiths, S., Hamilton, J., Heinemann, G., Helmig, D., Herber, A., Heuzé, C., Hofer, J., Houchens, T., Howard, D., Inoue, J., Jacobi, H.-W., Jaiser, R., Jokinen, T., Jourdan, O., Jozef, G., King, W., Kirchgaessner, A., Klingebiel, M., Krassovski, M., Krumpen, T., Lampert, A., Landing, W., Laurila, T., Lawrence, D., Lonardi, M., Loose, B., Lüpkes, C., Maahn, M., Macke, A., Maslowski, W., Marsay, C., Maturilli, M., Mech, M., Morris, S., Moser, M., Nicolaus, M., Ortega, P., Osborn, J., Pätzold, F., Perovich, D. K., Petäjä, T., Pilz, C., Pirazzini, R., Posman, K., Powers, H., Pratt, K. A., Preußer, A., Quéléver, L., Radenz, M., Rabe, B., Rinke, A., Sachs, T., Schulz, A., Siebert, H., Silva, T., Solomon, A., Sommerfeld, A., Spreen, G., Stephens, M., Stohl, A., Svensson, G., Uin, J., Viegas, J., Voigt, C., von der Gathen, P., Wehner, B., Welker, J. M., Wendisch, M., Werner, M., Xie, Z., and Yue, F.: Overview of the MOSAiC expedition–Atmosphere, Elementa, 10, 00060, https://doi.org/10.1525/elementa.2021.00060, 2022. a, b
Spreen, G., Kaleschke, L., and Heygster, G.: Sea ice remote sensing using AMSR-E 89-GHz channels, J. Geophys. Res., 113, C02S03, https://doi.org/10.1029/2005jc003384, 2008. a
Stapf, J., Ehrlich, A., Jäkel, E., Lüpkes, C., and Wendisch, M.: Reassessment of shortwave surface cloud radiative forcing in the Arctic: consideration of surface-albedo–cloud interactions, Atmos. Chem. Phys., 20, 9895–9914, https://doi.org/10.5194/acp-20-9895-2020, 2020. a
Stein, A. F., Draxler, R. R., Rolph, G. D., Stunder, B. J. B., Cohen, M. D., and Ngan, F.: NOAA's HYSPLIT atmospheric transport and dispersion modeling system, B. Am. Meteorol. Soc., 96, 2059–2077, 2015. a
Tan, I. and Storelvmo, T.: Evidence of Strong Contributions From Mixed-Phase Clouds to Arctic Climate Change, Geophys. Res. Lett., 46, 2894–2902, https://doi.org/10.1029/2018gl081871, 2019. a
Vihma, T., Pirazzini, R., Fer, I., Renfrew, I. A., Sedlar, J., Tjernström, M., Lüpkes, C., Nygård, T., Notz, D., Weiss, J., Marsan, D., Cheng, B., Birnbaum, G., Gerland, S., Chechin, D., and Gascard, J. C.: Advances in understanding and parameterization of small-scale physical processes in the marine Arctic climate system: a review, Atmos. Chem. Phys., 14, 9403–9450, https://doi.org/10.5194/acp-14-9403-2014, 2014. a
Voigt, C., Schumann, U., Minikin, A., Abdelmonem, A., Afchine, A., Borrmann, S., Boettcher, M., Buchholz, B., Bugliaro, L., Costa, A., Curtius, J., Dollner, M., Dörnbrack, A., Dreiling, V., Ebert, V., Ehrlich, A., Fix, A., Forster, L., Frank, F., Fütterer, D., Giez, A., Graf, K., Grooß, J.-U., Groß, S., Heimerl, K., Heinold, B., Hüneke, T., Järvinen, E., Jurkat, T., Kaufmann, S., Kenntner, M., Klingebiel, M., Klimach, T., Kohl, R., Krämer, M., Krisna, T. C., Luebke, A., Mayer, B., Mertes, S., Molleker, S., Petzold, A., Pfeilsticker, K., Port, M., Rapp, M., Reutter, P., Rolf, C., Rose, D., Sauer, D., Schäfler, A., Schlage, R., Schnaiter, M., Schneider, J., Spelten, N., Spichtinger, P., Stock, P., Walser, A., Weigel, R., Weinzierl, B., Wendisch, M., Werner, F., Wernli, H., Wirth, M., Zahn, A., Ziereis, H., and Zöger, M.: ML-CIRRUS: The Airborne Experiment on Natural Cirrus and Contrail Cirrus with the High-Altitude Long-Range Research Aircraft HALO, B. Am. Meteorol. Soc., 98, 271–288, https://doi.org/10.1175/bams-d-15-00213.1, 2017. a
Voigt, C., Kleine, J., Sauer, D., Moore, R. H., Bräuer, T., Clercq, P. L., Kaufmann, S., Scheibe, M., Jurkat-Witschas, T., Aigner, M., Bauder, U., Boose, Y., Borrmann, S., Crosbie, E., Diskin, G. S., DiGangi, J., Hahn, V., Heckl, C., Huber, F., Nowak, J. B., Rapp, M., Rauch, B., Robinson, C., Schripp, T., Shook, M., Winstead, E., Ziemba, L., Schlager, H., and Anderson, B. E.: Cleaner burning aviation fuels can reduce contrail cloudiness, Communications Earth & Environment, 2, 114, https://doi.org/10.1038/s43247-021-00174-y, 2021. a
Wegener, A.: Thermodynamik der Atmosphäre, Nature, 90, 31–31, https://doi.org/10.1038/090031a0, 1912. a
Wendisch, M. and Brenguier, J.: Airborne Measurements for Environmental Research – Methods and Instruments, Wiley–VCH Verlag GmbH & Co. KGaA, Weinheim, Germany, Weinheim, Germany, https://doi.org/10.1002/9783527653218, 2013. a
Wendisch, M., Keil, A., and Korolev, A. V.: FSSP Characterization with Monodisperse Water Droplets, J. Atmos. Ocean. Tech., 13, 1152–1165, https://doi.org/10.1175/1520-0426(1996)013<1152:fcwmwd>2.0.co;2, 1996. a
Wendisch, M., Brückner, M., Burrows, J., Crewell, S., Dethloff, K., Ebell, K., Lüpkes, C., Macke, A., Notholt, J., Quaas, J., Rinke, A., and Tegen, I.: Understanding Causes and Effects of Rapid Warming in the Arctic, EOS, 98, 22-26, https://doi.org/10.1029/2017eo064803, 2017. a
Wendisch, M., Macke, A., Ehrlich, A., Lüpkes, C., Mech, M., Chechin, D., Dethloff, K., Velasco, C. B., Bozem, H., Brückner, M., Clemen, H.-C., Crewell, S., Donth, T., Dupuy, R., Ebell, K., Egerer, U., Engelmann, R., Engler, C., Eppers, O., Gehrmann, M., Gong, X., Gottschalk, M., Gourbeyre, C., Griesche, H., Hartmann, J., Hartmann, M., Heinold, B., Herber, A., Herrmann, H., Heygster, G., Hoor, P., Jafariserajehlou, S., Jäkel, E., Järvinen, E., Jourdan, O., Kästner, U., Kecorius, S., Knudsen, E. M., Köllner, F., Kretzschmar, J., Lelli, L., Leroy, D., Maturilli, M., Mei, L., Mertes, S., Mioche, G., Neuber, R., Nicolaus, M., Nomokonova, T., Notholt, J., Palm, M., van Pinxteren, M., Quaas, J., Richter, P., Ruiz-Donoso, E., Schäfer, M., Schmieder, K., Schnaiter, M., Schneider, J., Schwarzenböck, A., Seifert, P., Shupe, M. D., Siebert, H., Spreen, G., Stapf, J., Stratmann, F., Vogl, T., Welti, A., Wex, H., Wiedensohler, A., Zanatta, M., and Zeppenfeld, S.: The Arctic Cloud Puzzle: Using ACLOUD/PASCAL Multiplatform Observations to Unravel the Role of Clouds and Aerosol Particles in Arctic Amplification, B. Am. Meteorol. Soc., 100, 841–871, https://doi.org/10.1175/bams-d-18-0072.1, 2019. a, b
Wendisch, M., Brückner, M., Crewell, S., Ehrlich, A., Notholt, J., Lüpkes, C., Macke, A., Burrows, J. P., Rinke, A., Quaas, J., Maturilli, M., Schemann, V., Shupe, M. D., Akansu, E. F., Barrientos-Velasco, C., Bärfuss, K., Blechschmidt, A.-M., Block, K., Bougoudis, I., Bozem, H., Böckmann, C., Bracher, A., Bresson, H., Bretschneider, L., Buschmann, M., Chechin, D. G., Chylik, J., Dahlke, S., Deneke, H., Dethloff, K., Donth, T., Dorn, W., Dupuy, R., Ebell, K., Egerer, U., Engelmann, R., Eppers, O., Gerdes, R., Gierens, R., Gorodetskaya, I. V., Gottschalk, M., Griesche, H., Gryanik, V. M., Handorf, D., Harm-Altstädter, B., Hartmann, J., Hartmann, M., Heinold, B., Herber, A., Herrmann, H., Heygster, G., Höschel, I., Hofmann, Z., Hölemann, J., Hünerbein, A., Jafariserajehlou, S., Jäkel, E., Jacobi, C., Janout, M., Jansen, F., Jourdan, O., Jurányi, Z., Kalesse-Los, H., Kanzow, T., Käthner, R., Kliesch, L. L., Klingebiel, M., Knudsen, E. M., Kovács, T., Körtke, W., Krampe, D., Kretzschmar, J., Kreyling, D., Kulla, B., Kunkel, D., Lampert, A., Lauer, M., Lelli, L., von Lerber, A., Linke, O., Löhnert, U., Lonardi, M., Losa, S. N., Losch, M., Maahn, M., Mech, M., Mei, L., Mertes, S., Metzner, E., Mewes, D., Michaelis, J., Mioche, G., Moser, M., Nakoudi, K., Neggers, R., Neuber, R., Nomokonova, T., Oelker, J., Papakonstantinou-Presvelou, I., Pätzold, F., Pefanis, V., Pohl, C., van Pinxteren, M., Radovan, A., Rhein, M., Rex, M., Richter, A., Risse, N., Ritter, C., Rostosky, P., Rozanov, V. V., Donoso, E. R., Saavedra-Garfias, P., Salzmann, M., Schacht, J., Schäfer, M., Schneider, J., Schnierstein, N., Seifert, P., Seo, S., Siebert, H., Soppa, M. A., Spreen, G., Stachlewska, I. S., Stapf, J., Stratmann, F., Tegen, I., Viceto, C., Voigt, C., Vountas, M., Walbröl, A., Walter, M., Wehner, B., Wex, H., Willmes, S., Zanatta, M., and Zeppenfeld, S.: Atmospheric and Surface Processes, and Feedback Mechanisms Determining Arctic Amplification: A Review of First Results and Prospects of the (AC)3 Project, B. Am. Meteorol. Soc., 104, E208–E242, https://doi.org/10.1175/bams-d-21-0218.1, 2022. a, b, c
Wesche, C., Steinhage, D., and Nixdorf, U.: Polar aircraft Polar5 and Polar6 operated by the Alfred Wegener Institute, Journal of large-scale research facilities, 2, A87, https://doi.org/10.17815/jlsrf-2-153, 2016. a
Willis, M. D., Leaitch, W. R., and Abbatt, J. P.: Processes Controlling the Composition and Abundance of Arctic Aerosol, Rev. Geophys., 56, 621–671, https://doi.org/10.1029/2018rg000602, 2018. a
Xu, L., Russell, L. M., and Burrows, S. M.: Potential sea salt aerosol sources from frost flowers in the pan-Arctic region, J. Geophys. Res., 121, 10840–10856, 2016. a
Yang, C. A., Diao, M., Gettelman, A., Zhang, K., Sun, J., McFarquhar, G., and Wu, W.: Ice and Supercooled Liquid Water Distributions Over the Southern Ocean Based on In Situ Observations and Climate Model Simulations, J. Geophys. Res.-Atmos., 126, e2021JD036045, https://doi.org/10.1029/2021jd036045, 2021. a
Yang, X., Pyle, J. A., and Cox, R. A.: Sea salt aerosol production and bromine release: Role of snow on sea ice, Geophys. Res. Lett., 35, L16815, https://doi.org/10.1029/2008gl034536, 2008. a
Young, G., Jones, H. M., Choularton, T. W., Crosier, J., Bower, K. N., Gallagher, M. W., Davies, R. S., Renfrew, I. A., Elvidge, A. D., Darbyshire, E., Marenco, F., Brown, P. R. A., Ricketts, H. M. A., Connolly, P. J., Lloyd, G., Williams, P. I., Allan, J. D., Taylor, J. W., Liu, D., and Flynn, M. J.: Observed microphysical changes in Arctic mixed-phase clouds when transitioning from sea ice to open ocean, Atmos. Chem. Phys., 16, 13945–13967, https://doi.org/10.5194/acp-16-13945-2016, 2016. a, b, c
- Abstract
- Introduction
- Methods
- Results and discussion
- Summary and conclusion
- Appendix A: Microphysical properties separated by the thermodynamic phase
- Appendix B: Additional information to Sect. 3.2
- Code and data availability
- Author contributions
- Competing interests
- Disclaimer
- Acknowledgements
- Financial support
- Review statement
- References