the Creative Commons Attribution 4.0 License.
the Creative Commons Attribution 4.0 License.
 | 30 Jun 2023
Vertical distribution of black carbon and its mixing state in the urban boundary layer in summer
Shandong Lei
Yuting Zhang
Aodong Du
Weijie Yao
Guiqian Tang
Tao Wang
Jinyuan Xin
Jie Li
Junji Cao
Zifa Wang
The vertical distribution of black carbon (BC), as well as its mixing state, is of great concern due to BC's strong regional climatic and environmental effects. In this study, vertical measurements were conducted through a moveable container based on a meteorological tower in the Beijing urban area during June and July. A total of 112 vertical profiles (0–240 m), including the concentrations of BC, O3, NOx and the optical properties of aerosols, were obtained. Based on BC concentration, the vertical profiles could be classified into four categories: uniform, gradual decrease, sharp decrease and sudden increase. The uniform type indicates strong vertical mixing with similar pollutant concentrations along the vertical direction. The gradual and sharp decrease types indicate stable vertical conditions with higher pollutant concentrations on the ground and lower concentrations at higher altitudes. Due to the strong radiation in summer, the vertical profiles exhibited a clear diurnal variation in which ∼ 80 % of profiles were uniform during the daytime and ∼ 40 %–90 % of profiles were of the gradual and sharp decrease types at night. O3 is an exception, and its concentration generally increases with height, even under strong vertical mixing conditions. The size distribution of the BC core varied slightly along the vertical direction, and the coating thickness, denoted by the diameter ratio between the BC-containing particle and BC core (), of BC increased with height under stable conditions. Although the coating thickness could increase the absorption ability with an average absorption enhancement of 1.25 at 23:00 LT (local time: UTC+8), the vertical difference of (2 %) was much lower than that of BC concentration (∼ 35 %). The vertical variation in absorption ability was mainly caused by the variation in BC concentration. In addition, O3 and occasionally increased during 06:00–08:00 but remained stable during 08:00–10:00. Vertical mixing and transportation from upper heights, such as the residual layer, could significantly influence the pollutant properties on the surface during early mornings. This study exhibits a continuous vertical picture of BC and its mixing state in urban areas, which would be helpful for understanding BC's regional environmental effect.
- Article
(8478 KB) - Full-text XML
-
Supplement
(4557 KB) - BibTeX
- EndNote


Environmental effects associated with black carbon (BC) has attracted much attention (Ramanathan and Carmichael, 2008; Bond et al., 2013; Li et al., 2022). In addition to being one of the most toxic components of atmospheric pollutants (Dominguez-Rodriguez et al., 2015; Lin et al., 2011; Xue et al., 2021), BC could influence the boundary layer height (BLH), which can aggregate air pollution (Ding et al., 2016). Such depressing of the boundary layer is called the “dome effect” in which the BC in the upper boundary layer could heat the surrounding atmosphere, increasing the stability of the boundary layer. Through uncrewed aerial vehicle (UAV) measurements, Wilcox et al. (2016) found turbulent kinetic energy reduction with increasing BC concentration, leading to a shallower boundary layer. Further studies demonstrated that the dome effect is relevant to the vertical distribution of BC (Z. L. Wang et al., 2018). BC could even be attributed to the increase in the boundary layer if the BC concentration in the surface layer was too high. Thus, the precise measurement of BC vertical distribution is essential to evaluate its environmental effect.
Contemporary studies have mainly focused on the vertical distribution of BC mass concentrations (Q. Wang et al., 2018; Samad et al., 2020; C. Wu et al., 2021; Guan et al., 2022). For instance, Lu et al. (2019) found that the vertical profile of BC mass concentration could be classified into four types, and the variation in the vertical profile was related to the boundary layer variation and local emissions. Based on the measured BC vertical concentration, the precise evaluation of BC's radiative property distribution requires additional BC-related information, such as size distribution and mass absorption cross-section, which is a property that has been commonly assumed in previous studies (C. Wu et al., 2021). In fact, the optical properties could be significantly influenced by BC's microphysical properties. For example, the coating material could increase the absorption ability through the lensing effect. Through laboratory study, Shiraiwa et al. (2010) found that BC's absorption ability after coating could reach values 2 times greater than BC without coating. Such absorption enhancement of BC due to coatings was also observed in the ambient with typical factors of 1.0–1.5 (Liu et al., 2017). In addition, the size distribution and morphology of BC have proven to be important factors related to BC's optical and radiative properties (He et al., 2015; Matsui et al., 2018; Luo et al., 2022; H. Liu et al., 2020a). Such microphysical properties of BC vary greatly from the reported ground-based measurements (Shiraiwa et al., 2008; Pan et al., 2017; H. Liu et al., 2020b; Zhao et al., 2022), generally depending on the varied emission sources and complex aging processes. However, vertical measurements of such microphysical properties are still rare.
The present vertical measurement approaches include tower, balloon, aircraft and uncrewed aerial vehicle (UAV) approaches. UAVs have the advantages of high flexibility, but large precise instruments cannot be loaded by UAVs due to their low carrying capacity. UAV measurements generally focus on mass concentrations by using light instruments or sensors (B. Liu et al., 2020; Lu et al., 2020; Pikridas et al., 2019; Kwak et al., 2020). The aircraft approach is another vertical measurement method that combines flexibility and preciseness. Limited vertical measurements of BC and its mixing state using the aircraft approach have been conducted (Katich et al., 2018; Schulz et al., 2019; Schwarz et al., 2013, 2017). Generally, the BC concentration decreases with altitude, but the vertical distribution of size distribution and coating thickness could vary a lot due to the regional transportation (Hu et al., 2020), pollution levels (Ding et al., 2019; Zhao et al., 2020), biomass burning plumes (Ditas et al., 2018) and other factors. However, as summarized in Table S2, aircraft measurement mainly focuses on the vertical difference between boundary layer, upper troposphere and lower stratosphere. The data points in the boundary layer were limited due to flight height restrictions. In addition, continuous aircraft vertical measurements are difficult to conduct due to cost issues. The balloon measurements (Liu et al., 2012; Wang et al., 2022) have requirements for the location, which is typically conducted in rural or remote areas. Among the measurement methods, tower measurements are the most suitable way to study the vertical distribution of BC microphysical characteristics and its relationship with the boundary layer in urban areas considering the cost, accuracy and observation continuity.
BC emissions are substantial in urban areas (Li et al., 2017), exerting a significant impact on the urban environment and climate. The microphysical properties of BC may be highly variable under the influence of fresh emissions, aging and regional transportation. Due to the advantages of high data continuity, low cost and high observation frequency, a tower-based observation campaign was conducted in Beijing during summer. The vertical distributions of BC concentration, size distribution and mixing state were measured. In addition, aerosol absorption, extinction and pollutant gases (CO, NO2 and O3) were measured simultaneously. Such continuous vertical measurements of BC microphysical characteristics in the urban boundary layer are rare. This research provides insight into the vertical distribution of BC and its properties in the boundary layer and is helpful to reduce the uncertainties in BC environmental and climatic evaluations.
2.1 Measurements
The observation was conducted on the tower campus of the Institute of Atmospheric Physics, Chinese Academy of Sciences (latitude: 39.97∘ N; longitude: 116.37∘ E) from 17 June to 16 July 2022 (in the absence of specific indications, the year 2022 shall be applicable for all dates mentioned subsequently). The site is located in the urban area of Beijing and is approximately 50 m (380 m) away from the closest road (highway). More detailed descriptions of the observation site can be found in the previous literature (Sun et al., 2016; Pan et al., 2017; Xie et al., 2019). All instruments were placed in a moveable container, and an air conditioner and a UPS were used to supply stable temperature and power for the instruments inside. The container is able to move along the cable supporting the meteorological tower. During a normal run of a vertical observation, the container started at the ground level and rose at a nearly constant speed (8 m s−1) to the 240 m height of the tower, stayed at 240 m for 45 min and descended to the ground at a speed of 8 m s−1. The routine vertical observation was conducted 4 times a day (07:00, 11:00, 18:00 and 22:00), representing the morning, noon, afternoon and night conditions of the atmosphere (all times mentioned within this paper are in local time, corresponding to UTC+8). The vertical observation was canceled during the times with heavy rain or high wind, and the moveable container stayed at the ground when the vertical observation was not conducted. During the whole campaign, 112 vertical profiles were obtained, and 105 vertical profiles were analyzed through data quality control.
The concentration of pollutant gases (NO2, O3, CO), the concentration and mixing state of BC, and optical properties (light extinction and absorption) of aerosol were measured through the instruments inside the container. In addition to the container, meteorological parameters, including temperature (T), relative humidity (RH), wind speed (WS) and wind direction (WD), at 15 different heights were obtained through the instruments equipped on the tower. All instrument models and manufacturers are listed in Table S3.
The height of the boundary layer height (BLH) was determined (Tang et al., 2015, 2016) using the vertical profile of the attenuated backscatter coefficient measured by a single-lens ceilometer (CL51, Vaisala, Finland) at the same observation site. The cloud amount data were extracted from the ECMWF Reanalysis V5 data product (ERA5, https://cds.climate.copernicus.eu/cdsapp#!/home, last access: 20 March 2023) with a spatial resolution of 0.25∘ × 0.25∘ and a temporal resolution of 1 h.
2.2 Data analysis
2.2.1 Coating thickness and size distribution of BC
The BC microphysical properties were obtained through a single-particle soot photometer (SP2, Droplet Measurement Technology, Inc., Boulder, CO, USA). The SP2 obtained the mass-equivalent diameter (Dc) of the BC core in every single BC-containing particle, and the optical diameter (Dp) of BC-containing particles was derived through the leading-edge-only (LEO) fitting method (Gao et al., 2007) and a look-up table (table of precalculated scattering cross-sections of BC-containing particles with variables Dc and Dp through the Mie scattering theory) method (Taylor et al., 2015). The refractive indices of the BC core and coatings in the derivation of Dp were 2.26–1.26i (Moteki et al., 2010) and 1.48–0i (Taylor et al., 2015), respectively, at a wavelength of 1064 nm. The optical properties of BC are less sensitive to its morphology at a wavelength of 1064 nm, and Liu et al. (2015) estimate that the bias of due to the core–shell assumption in the look-up table method would be less than 6 %.
Aquadag (Acheson Inc., USA) and polystyrene latex (PSL) sphere (Nanosphere Size Standards, Duke Scientific Corp., USA) aerosols were used to calibrate the incandescence and scattering signals of the SP2. Because of the higher incandescence sensitivity of ambient BC than Aquadag (Moteki and Kondo, 2010), the calibration was scaled following the recommendation from Laborde et al. (2012). The data acquisition mode of the SP2 was set to record 1 particle every 2 particles to guarantee the high resolution of the vertical profile. More specific details regarding calibration and data processing can be found in our previous literature (H. Liu et al., 2020a). In general, the size distribution of the BC core (Dc) and coating thickness () could be determined through the SP2. The mass median diameter (MMD) was used to quantify the size distribution of the BC core and was calculated from the Dc distribution below and above which the BC mass was equal (D. Liu et al., 2019). The of bulk BC aerosols was calculated using the of every single BC particle in a certain time window:
The hygroscopicity of BC-containing particles was calculated based on the volume-weighted Zdanovskii–Stokes–Robinson (ZSR) rule (Stokes and Robinson, 1966) by assuming that the hygroscopicity parameters of BC and coatings were 0 and 0.3, respectively (Pringle et al., 2010). A detailed calculation of the hygroscopicity can be found in Hu et al. (2021).
2.2.2 Optical properties
The absorption efficiency (babs) at a wavelength of 880 nm was directly measured by an Aethalometer (AE33, Magee Scientific Corp.) The scattering efficiency (bsca) at a wavelength of 870 nm was measured by a photoacoustic extinctiometer (PAX, Droplet Measurement Technologies). A PM2.5 cyclone with a supporting pump was placed before AE33 and PAX; thus, the measured babs and bsca are characteristics of PM2.5. The single-scattering albedo (SSA) at a wavelength of 870 nm was calculated as follows:
The babs at a wavelength of 880 nm was transferred to babs at a wavelength of 870 nm through Eq. (3):
The absorption Ångström exponent (AAE) is assumed to be 1 in the calculation since brown carbon has little effect at long wavelengths.
The absorption enhancement (Eabs) of BC aerosols at a wavelength of 550 nm is calculated based on the information of Dc and Dp from the SP2's measurement by using the Mie core–shell approach. The refractive indices used in the calculation are 1.95+0.79i for the BC core (Bond and Bergstrom, 2006) and 1.50+0i for the coatings (Liu et al., 2015). The Eabs may be overestimated in this study due to the core–shell assumption in the calculation (Liu et al., 2017; Wu et al., 2018; H. Liu et al., 2019) because of the complex morphology of BC (Wang et al., 2017; Hu et al., 2021). H. Liu et al. (2020b) estimated that such overestimates could be ∼ 17 % in summer in Beijing.
3.1 Overview of the observation
The time series of the major observation parameters during the campaign are illustrated in Fig. 1. The height of the moveable container was also shown in Fig. 1a. Thus, the time series in Fig. 1 also include information on the vertical distribution of pollutant concentrations. The BLH ranged between 50–2000 m (Fig. 1f) during the observation. The variation of the BLH followed a clear diurnal pattern (Fig. S1) with an average value of 400–500 m at night and 1000–1200 m at noon. The observation height (0–240 m) was generally in the mixing layer. However, the BLH could occasionally be below 240 m at night and in the morning, and the moveable container could detect the BC properties in the residual layer in such cases.
The average concentration of BC was 0.34 µg m−3, and the average mixing ratio of O3 was 33 ppb. The relative humidity and temperature were high during the summer, with average values of 67 % and 27 ∘C, respectively. In general, the air condition is relatively clean during the observation period due to the frequent rainy event, except for a heavy O3 pollution event that occurred on 25 June with a maximum hourly mixing ratio of 124 ppb.
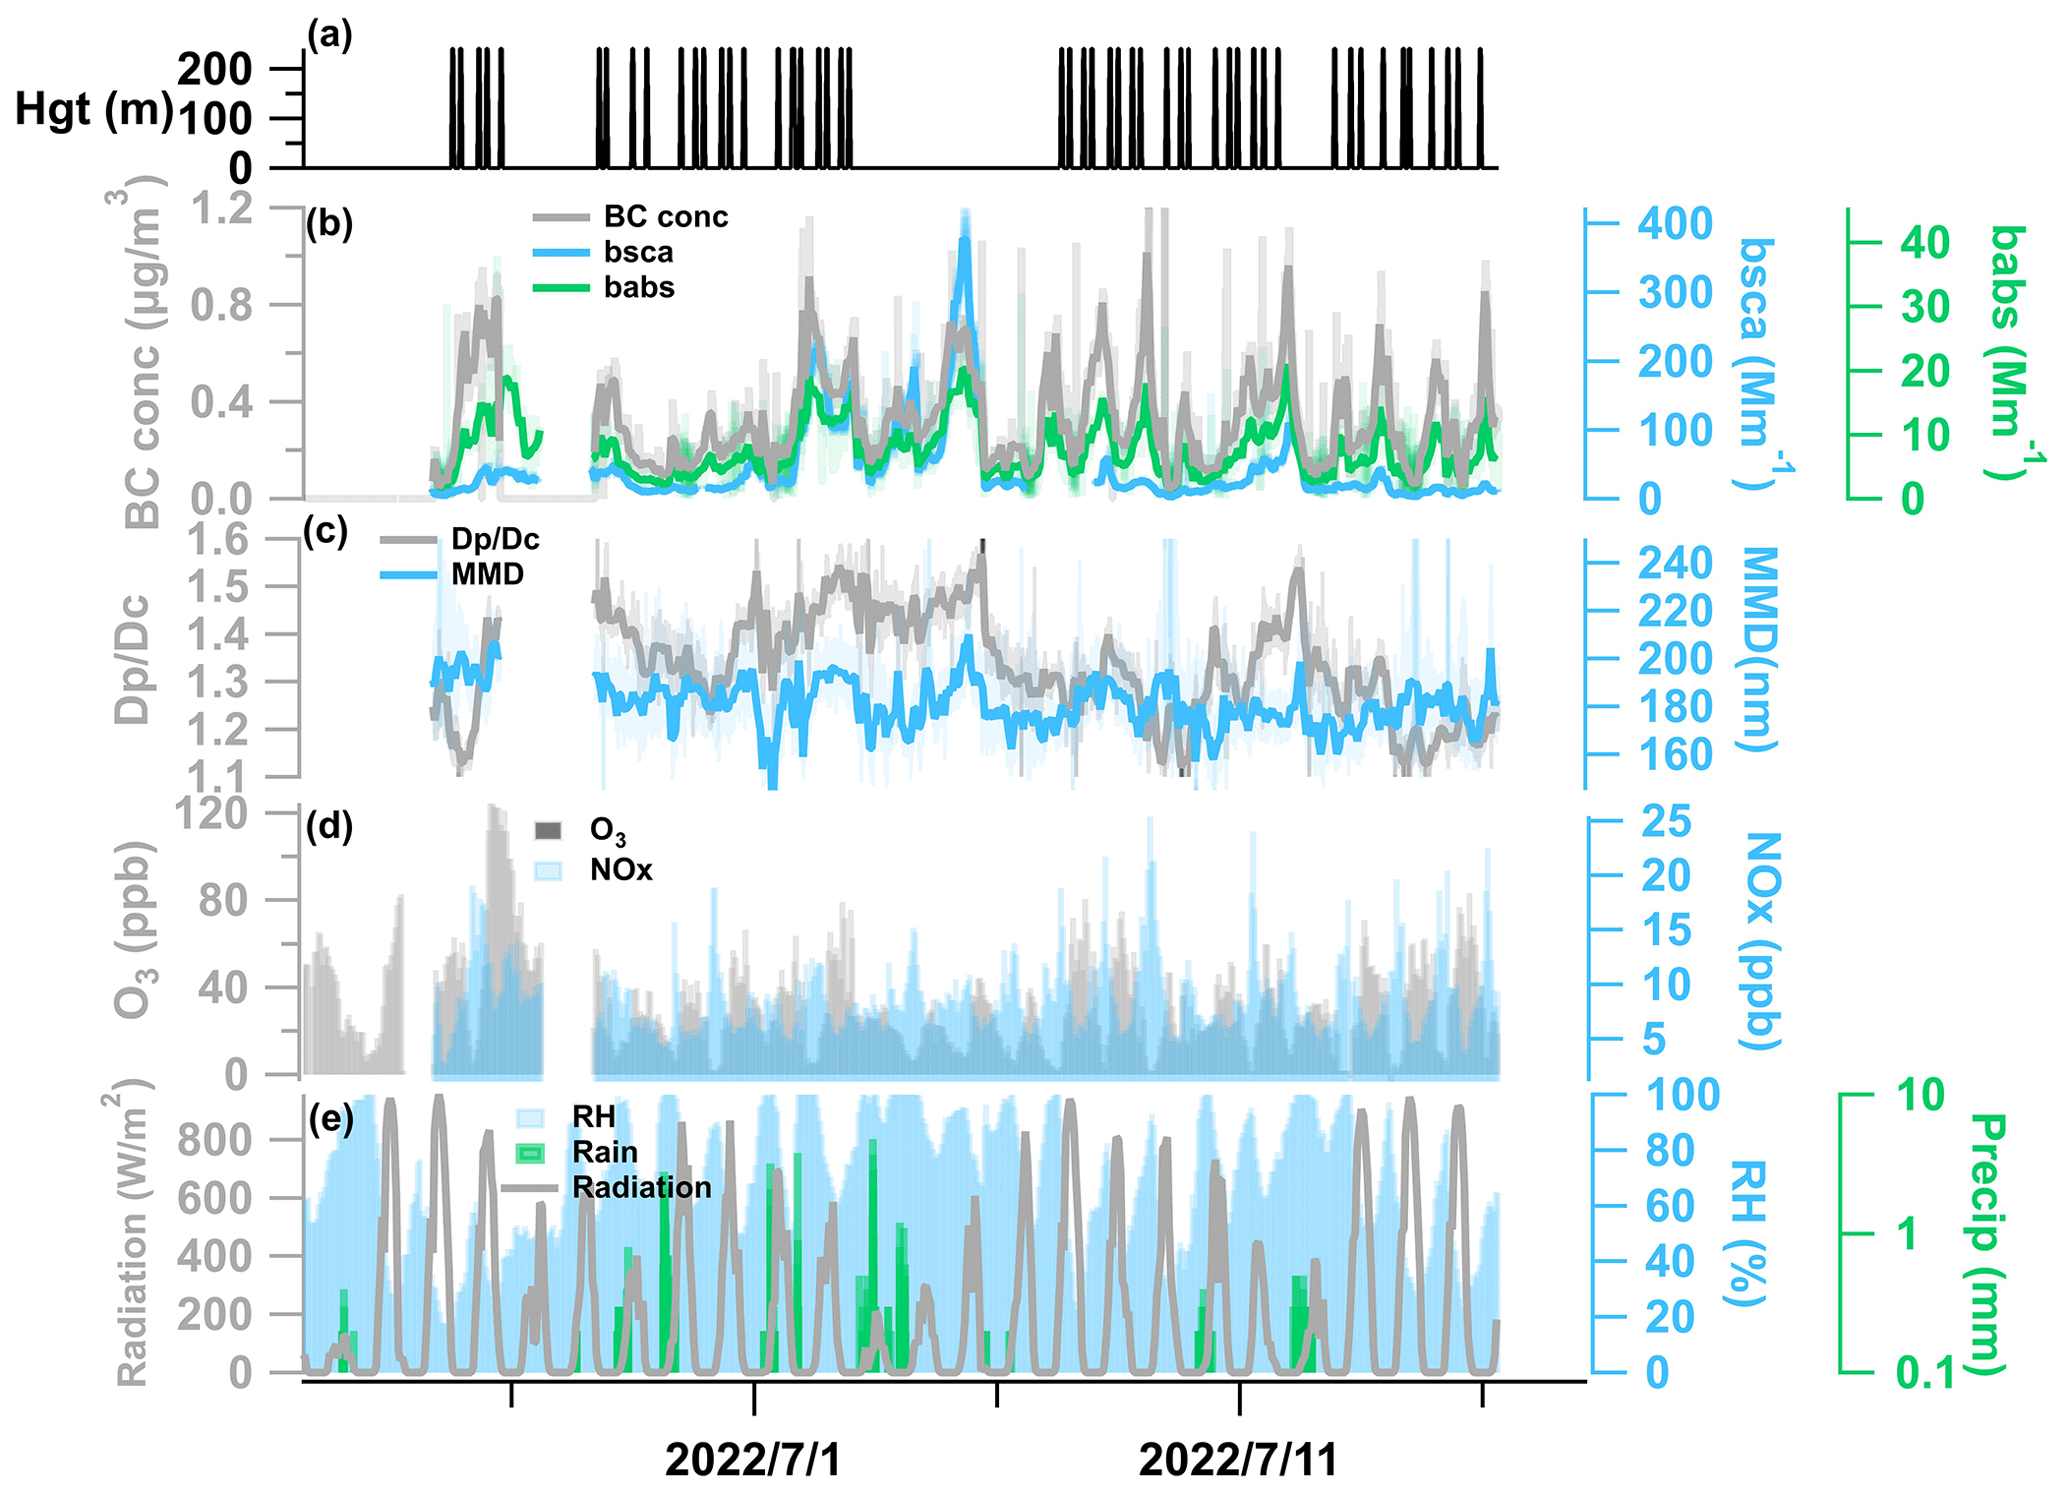
Figure 1Time series of the major parameters during the observation. (a) The height of the moveable container. (b) Mass concentration of black carbon, absorption (babs) and scattering coefficient (bsca). The opaque and non-opaque lines denote the data with a 1 h and 1 min average, respectively. (c) The coating thickness () and mass median diameter (MMD) of BC. The opaque and non-opaque lines denote the data with a 1 h and 1 min average, respectively. (d) The 1 min averaged mixing ratio of O3 and NOx. (e)–(f) The meteorological conditions during the observation period.
The mass size distribution of the BC core followed a lognormal distribution with a mass median diameter (MMD) of 173 nm and a geometric standard deviation (GSD) of 1.57, as shown in Fig. S2, which is consistent with the MMD value (171 nm) observed in Beijing in the summer of 2018 (H. Liu et al., 2020a). The MMD value remained stable between 160–190 nm. The coating thickness () of the BC bulk varied largely from 1.1 to 1.6, with an average value of 1.33. The coating thickness of BC could be as high as 1.4–1.5, even in the relatively clean conditions during 1–5 July. Figure S3 exhibits the vertical meteorological conditions. The wind direction from 1 to 5 July was dominated by the south wind. The wind was mainly from the north during other periods. The transportation of aged BC from the south may lead to an increase in coating thickness, even under clean conditions. Such an increase in was also found from 10 to 12 July, during which the wind also came from the south. Thus, the coating thickness may be highly dependent on the air mass. Zhang et al. (2018) reported that the transportation of aged BC from regional sources outside Beijing in winter and BC from transportation could account for 63 % of total BC aerosols. Such transportation may also be efficient in summer. It is also noted that the value could increase quickly from 1.1 to 1.4 during the ozone pollution day (25 June). Previous studies have suggested that BC aging could occur more rapidly in the presence of increased O3 concentrations (Zhang et al., 2022). Furthermore, H. Liu et al. (2020b) found that the could increase at a faster rate during the daytime under high Ox conditions. These findings suggest that severe photochemical processes and high atmospheric oxidation rates could contribute to the aging of BC and the subsequent increase in its coating thickness.
3.2 Classification of the vertical profile
Figures S4–S22 exhibit all measured vertical profiles of different parameters during the observation. Based on the vertical profiles of BC concentration, the profiles were classified into four categories, and Fig. 2 shows the typical profiles of the four categories.
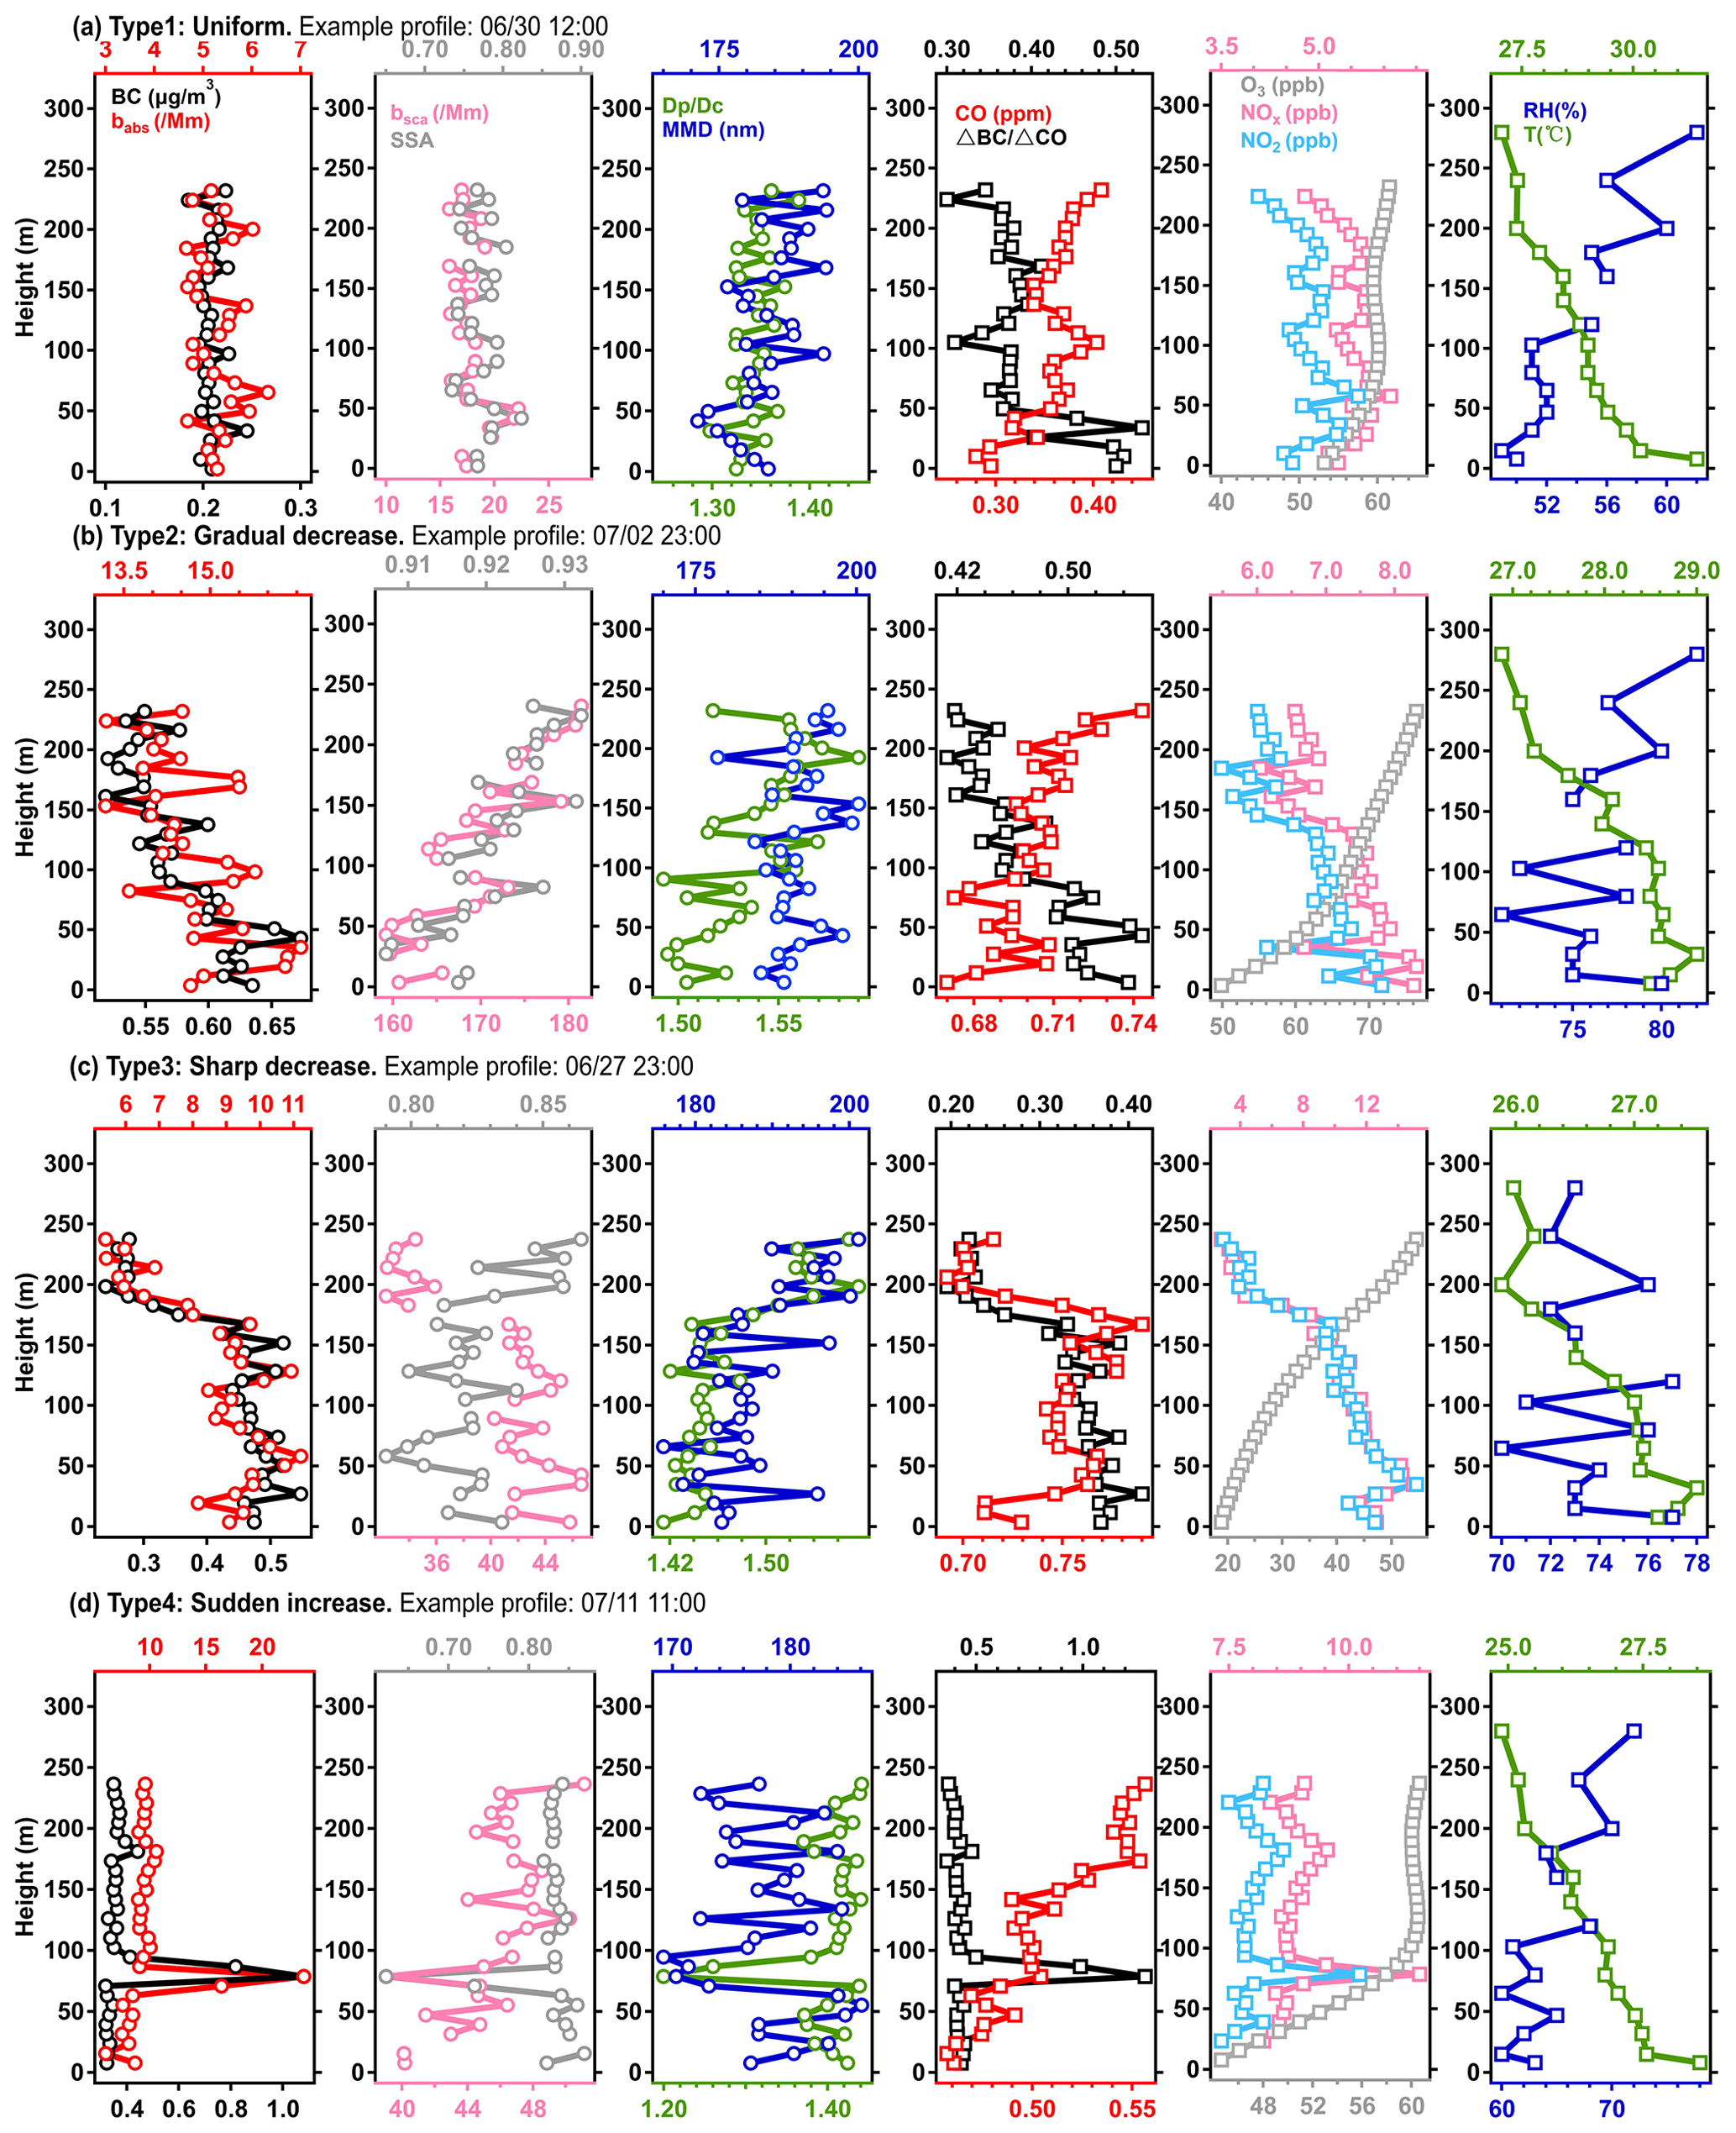
Figure 2Typical profiles of the pollutants and parameters of the four types: (a) uniform type, (b) gradual decrease type, (c) sharp decrease type, (d) sudden increase type. The four types were classified based on the vertical profiles of BC mass concentration. The exhibited parameters from left to right are BC mass concentration, aerosol absorption coefficient (babs), aerosol scattering coefficient (bsca), single-scattering albedo (SSA), BC coating thickness (), mass median diameter (MMD) of the BC core, CO mixing ratio, , mixing ratio of O3 and NOx, as well as relative humidity (RH) and temperature (T).
3.2.1 Uniform type
The vertical profile at 12:00 on 30 June was selected to represent the uniform type. As shown in Fig. 2a, the concentration of BC varied little from the surface to 240 m in height in this type. In addition to BC concentration, the microphysical properties (such as MMD and ) and optical properties (such as babs, bsca and SSA) also varied little. The uniform aerosol vertical distribution indicates sufficient mixing in the lower boundary layer. In this case, the temperature of the surface was ∼ 4 ∘C higher than that at the 240 m height. Such a large temperature difference would promote the vertical motion of the air mass and contribute to vertical mixing. Although vertical mixing is efficient in this case, the ozone concentration was found to be lower in the near-surface area, and the vertical profile exhibits a uniform distribution above the height of ∼ 50 m. The presence of substantial NO emissions from traffic sectors would decrease the concentration of ozone through the titration reaction between ozone and NO, leading to the decreasing trend of ozone concentration with height.
3.2.2 Gradual decrease type
The vertical profile at 18:00 on 2 July was selected to represent the gradual decrease type. In this type, the BC concentration gradually decreases with height. Such a vertical profile is mainly attributed to the stable boundary layer as well as weak convection and turbulence. The continuous emission of BC from the surface leads to a higher concentration near the surface. Fresh BC emissions would also lead to a decrease in near the surface, resulting in an increasing trend of with height. The aging process is efficient in increasing the coating thickness but not the size of the BC core. The MMD value remained stable at all heights in this case. Studies have shown that the size of the BC core varies depending on the emission source. For instance, BC emitted from traffic sources typically has a lower MMD of about 150–180 nm, while that from solid fuel burning sources has a higher MMD of about 170–230 nm (Schwarz et al., 2008; Pan et al., 2017; Holder et al., 2014). In Beijing and London, Liu et al. (2014) and D. Liu et al. (2019) found that the MMD of BC was much larger in winter than in summer, likely due to increased solid fuel burning for heating purposes. The nearly stable MMD value in this case may suggest similar sources of BC in the lower boundary layer, but the BC in the upper heights had a longer aging time (larger ). The concentration of O3 increased with increasing height at a sharper slope than that in the uniform case.
3.2.3 Sharp decrease type
The vertical profile at 23:00 on 27 June was selected to represent the sharp decrease type. This type is also referred to as the “stratified type” in other studies (Guimaraes et al., 2019; Lei et al., 2021). The concentration of pollutants decreased sharply at a certain height but remained uniform or slightly decreased with height above a certain height. Profiles of this type mainly appeared in the early morning and midnight. The was larger and was smaller at the upper height, indicating more aged BC at the upper height.
The vertical profiles at 22:00 on 27 June and 23:00 on 27 June are simultaneously shown in Fig. S8. As shown, the vertical profile at 22:00 exhibited a gradual decreasing trend. However, the profile changed into a sharp decrease type 1 h later. Comparing the vertical profiles at these 2 h, the BC concentration was similar above 200 m, but the concentration significantly increased below 200 m at 23:00. The was also similar above 200 m and significantly decreased below 200 m at 23:00. The BC concentration and characteristics in these two profiles suggest that freshly emitted BC was trapped at lower heights (below 200 m) at 23:00. Such a stratified vertical distribution is also found in previous studies (Q. Wang et al., 2018; Guimaraes et al., 2019; Lei et al., 2021). Lei et al. (2021) found that in the stratified type, the BLH measured by ceilometer was relatively low (∼ 110–250 m), which is consistent with the findings of this study. The BLH measured by ceilometer in the stratified type ranged between 100–300 m, which is lower than the average value of ∼ 400–500 m. On the night of 27 June, the BLH measured by ceilometer even reached 80 m. It is known that the absolute value of BLH determined from different methods can vary significantly. Q. Wang et al. (2018) found that in the stratified type, the BLH determined from ceilometer would always be higher than the sudden concentration transition point and suggested that it is more precise to determine the BLH by using the sudden concentration transition point in such cases. In this study, the top of the BLH was regarded as the sudden concentration transition point in the sharp decrease type, and the profiles were used to investigate the differences in pollutants between the nocturnal boundary layer and residual layer in the following section.
3.2.4 Sudden increase type
The vertical profile at 11:00 on 11 July was selected to represent the sudden increase type. As shown in Fig. 2d, The BC mass concentration rapidly increased from 0.4 to 1.2 µg m−3 at 80 m above the ground and quickly decreased to the background level above 90 m. The concentration of NOx and the mixing state of BC also exhibited a sudden change. The MMD and experienced sudden decreases, while the NOx concentration increased sharply. The characteristics of MMD, and NOx indicate that the sudden increase in this case may come from fresh emissions from traffic sources, since BC from traffic sources generally has a small BC core and thin coatings (Liu et al., 2017; Holder et al., 2014), and the NOx emissions from traffic sources are also substantial.
Among the seven sudden increase cases, four sudden increases occurred at ground level, and three sudden increases were found in midair. In addition to the emissions from traffic sources (characterized by the low MMD, and simultaneous increase in NOx), the emissions from other sources could also lead to a sudden increase. The sudden increase that occurred at 11:00 on 9 July, as shown in Fig. S16, was accompanied by an increase in the MMD, a decrease in and no significant variation in NOx concentration. The sudden increase in this case may be influenced by the emission from solid fuel burning, since the MMD is generally higher for BC from solid fuel burning than that of fossil fuel burning (Schwarz et al., 2008; Pan et al., 2017; H. Liu et al., 2019).
3.2.5 Other profiles in special cases
Figure S7 shows the profiles on the ozone pollution day (maximum hourly ozone mixing ratio reached 124 ppb), the vertical profiles of BC, including its concentration, mixing state and ozone presented in a uniform type. Since the formation of ozone is always accompanied by high temperature and radiation leading to highly sufficient mixing in the boundary layer, the uniform vertical distribution of pollutants may be the common situation on ozone pollution days.
Another special profile is the profile (at 19:00 on 1 July, shown in Fig. S12) after a heavy rainy event. The moveable container started rising at 18:00 and reached a height of 240 m at 18:30. When the container stayed at the tower, heavy rain occurred. The rainy event lasted for nearly 80 min, and the container started moving to the ground as soon as the rain ended. Thus, the vertical profile between 18:00 and 19:00 on 1 July could be compared to analyze the effect of wet scavenging. As shown, these two vertical profiles both belong to the uniform type, indicating that the wet scavenging efficiency may be vertically similar in the lower boundary layer or that there may be quick vertical mixing during the daytime in summer. It is noted that the MMD decreased largely from 190 to 170 nm within 1 h. The bulk value remained invariant, but the for Dc=180 nm decreased from 1.32 to 1.25. The variation in MMD and suggests that wet scavenging may prefer to remove large BC cores with thicker coatings. The preference of wet scavenging for BC with large sizes has also been reported in previous research (H. Liu et al., 2020a; Wang et al., 2015; Taylor et al., 2014). As also exhibited in Fig. 1c, the MMD tended to decrease during other rainy events when the container was at ground level, but the showed less variation.
3.3 Diurnal variation in the vertical profile
Figure 3 shows the number fractions of vertical profile types at different times during the day. The uniform type is the dominant type, accounting for ∼ 80 % during the daytime (08:00–18:00). The number fraction of the uniform type started dropping at 19:00 and only accounted for 14 % at 23:00 and rose back after sunrise. In contrast, the number fraction of the gradual decrease type started rising at night and dropped back ∼ 10 % during the daytime. The diurnal variation in the boundary layer (Fig. S1) leads to such vertical profile type changes. Due to the much higher heat capacity of the surface than that of air, the temperature of the surface responds to radiation at a much faster rate, leading to the boundary layer's thermal structure and stability change, especially in summer with strong radiation. Thus, the vertical motion and mixing during the daytime is more severe than that at night, and a uniform profile is the most common case during the daytime. In fact, several gradual decrease cases observed during the daytime, such as 11:00–12:00 on 2 July (Fig. S13) and 19:00 on 27 June (Fig. S8), generally occurred on cloudy days when the radiation was relatively weak. As shown in Fig. 1, the total amount of clouds was nearly 100 % for the two cases and the radiation was relatively low compared with that of the entire observation, except several rainy days. The sudden increase type always occurred during the daytime, partially caused by the more frequent human activity at that time, resulting in occasional plume transportation to the measurement site. The sharp decrease type, indicating the low nocturnal boundary layer height, occurred five times during the whole observation and was found only at midnight (23:00) or the early morning (06:00–07:00).
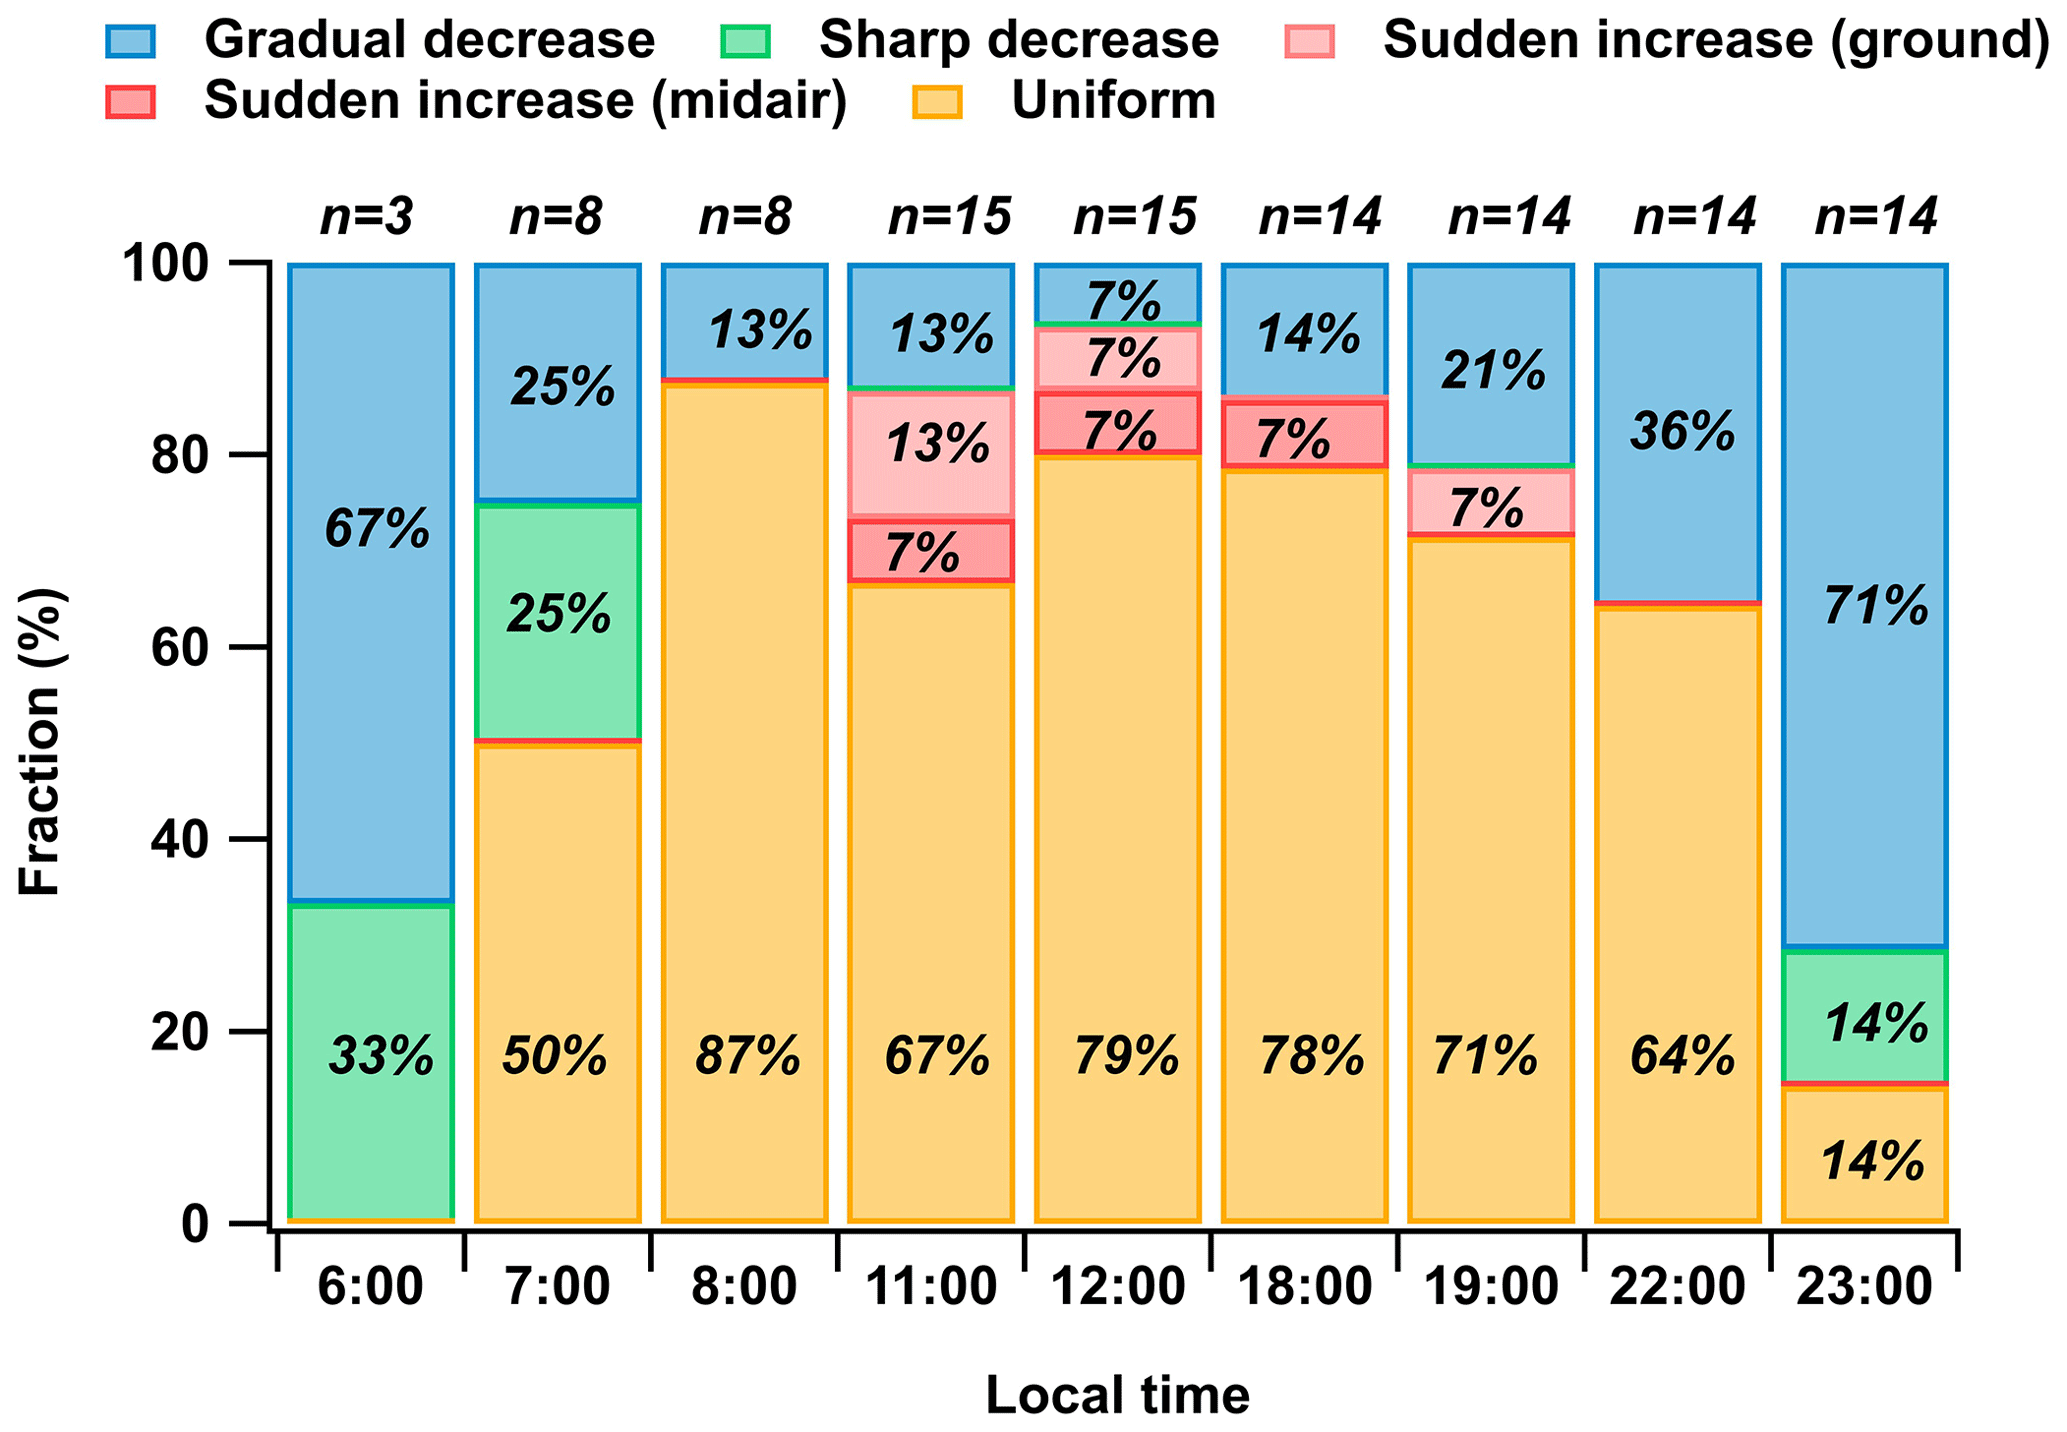
Figure 3Number fraction of the different vertical profile types at various times. The sudden decrease type was further classified into two types based on the sudden increase location. The n above each bar denotes the total measured profile numbers at the time.
In addition to the BC concentration, the average vertical profiles of other parameters at 07:00, 12:00, 18:00 and 23:00 are counted to further study the diurnal variation, as illustrated in Fig. 4 (the averaged profiles with error bars could be found in Fig. S27). The average value and the shape of vertical profiles both have clear diurnal changes.
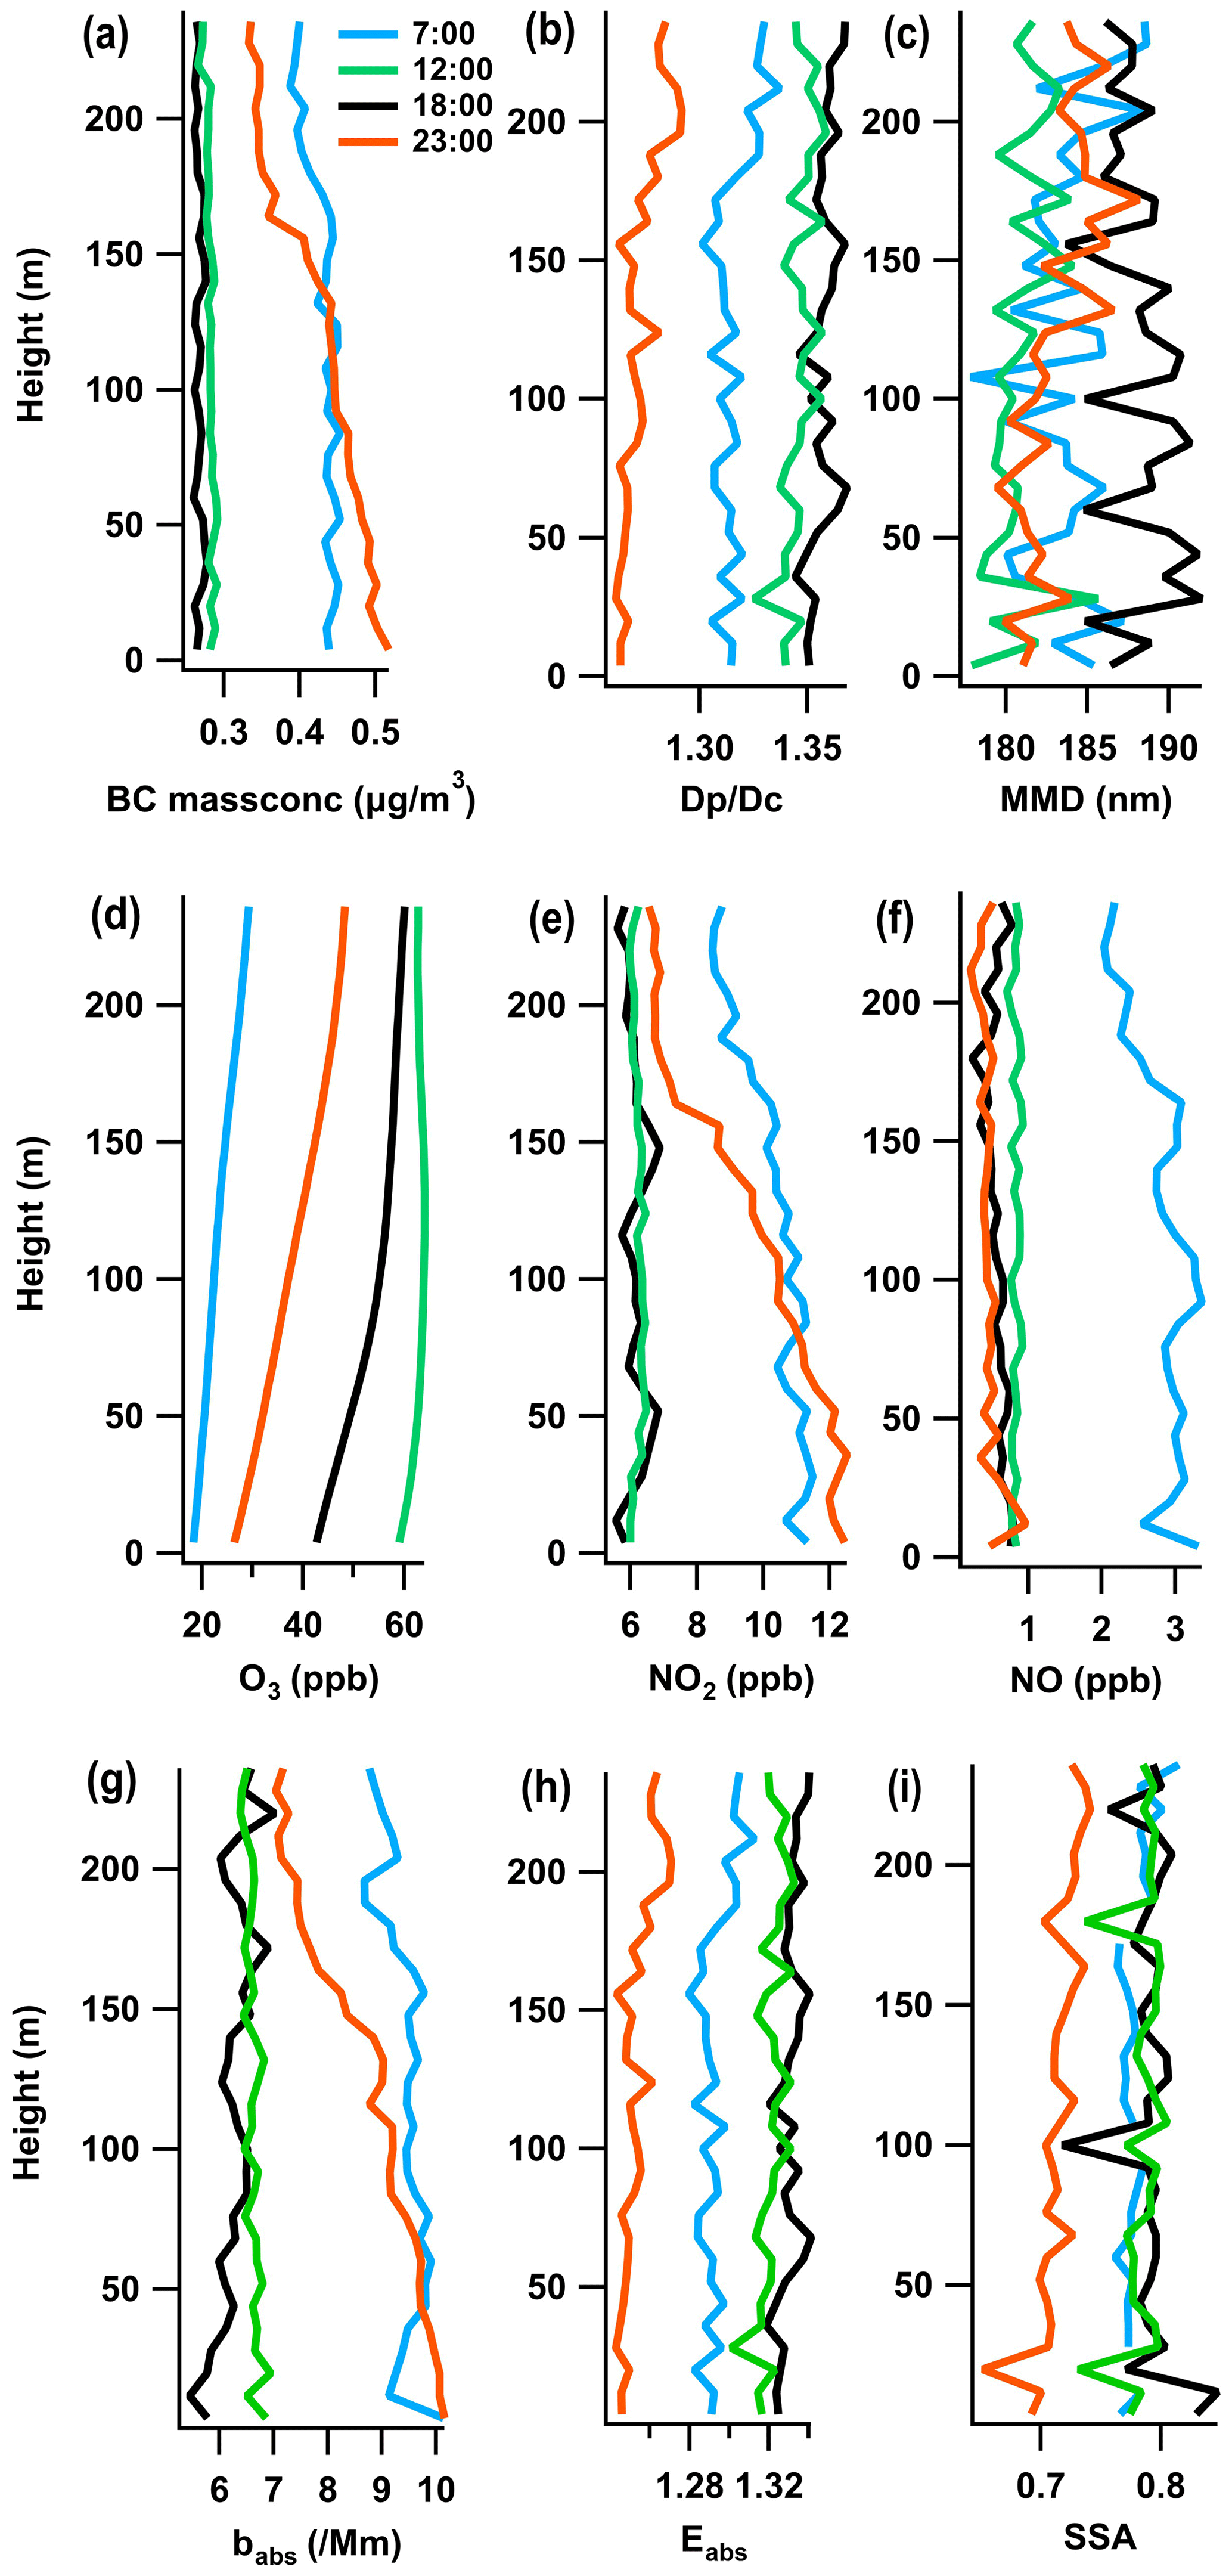
Figure 4The diurnal variation of the average profiles of BC properties including (a) BC, (b) and (c) MMD. The average profiles of (d) O3 and its precursors (e) NO2 and (f) NO. The averaged profiles of aerosol optical properties including (g) absorption coefficient (babs), (h) absorption enhancement (Eabs) of BC due to coatings and (i) single-scattering albedo (SSA).
For the average value, the mass concentration of BC is higher and is lower at night and in the morning than during the daytime. The changes are mainly attributed to the fresh BC emissions and low nighttime boundary layer height. Fresh BC tends to accumulate in the nocturnal boundary layer. The development of the boundary layer and photochemical aging with the condensation process during the daytime would result in a decrease in the concentration and an increase in . Since O3 is the product of photochemical reactions, the concentration of O3 is higher at noon and significantly decreases at night. The concentration of NOx exhibits the opposite variation trend to O3.
For the shape of the vertical profile, the average profiles of all parameters during the daytime (12:00 and 18:00) generally follow a uniform distribution, except O3. The O3 concentration exhibits a slight decrease at the surface level at 12:00, and the degree of decrease extends at 18:00.
Compared with the uniform average profiles during the daytime, the vertical gradients of the average profiles at night and in the morning (07:00 and 23:00) are larger. For BC aerosols, the average concentration decreases with height at a rate of −0.075 µg m−3 per 100 m at 23:00. The is nearly uniform below 160 m and slightly increases with height above 160 m. The transition at 160 m is mainly affected by the two sharp decrease profiles at 23:00, which both occurred at a height of ∼ 160 m. Excluding the two sharp decrease types, the average shows little variation with height. The MMD also remained nearly invariable at 0–240 m. The variation tendency of the BC concentration, and MMD at 07:00 was similar to that at 23:00, but the vertical gradient at 07:00 was lower. The vertical profile of NO2 shows a very similar variation trend with that of BC concentration, partially caused by the similar emission sources of these two pollutants in the urban area. The concentration of NO was near zero at 12:00, 18:00 and 23:00, and it significantly increased at 07:00 due to the low O3 concentration at the time as well as the large emissions from the morning commute. The vertical profile of NO at 07:00 shows a decreasing trend with increasing height. The average vertical profile of O3 increased with increasing height at 07:00 and 23:00.
3.4 Pollutant properties in the residual layer
The BC properties, O3 and NOx at the 240 m height and ground are counted for the five sharp decrease profiles to study the pollutant difference between the ground and residual layer. For BC aerosols, the concentration is much higher on the ground than that in the residual layer. The BC concentration on the ground was 84.6 % higher than that in the residual layer at 23:00 on 8 July. BC in the residual layer generally had thicker coatings, indicating a higher aging degree. The maximum difference in was found at 23:00 on 27 June, and the in the residual layer was 8.4 % higher than that on the ground. The difference in BC concentration and in the two layers could be explained by the accumulation of fresh BC in the nocturnal boundary layer. In addition, as exhibited in Fig. S23, the number frequency of another BC type with an apparently higher , denoted by the red circle, increased at the 240 m height. The transportation of aged BC from other areas in the residual layer may also lead to an increase in . The MMD values were relatively stable (∼ 170–190 nm) on the ground, while the MMD in the residual layer was more variable, ranging between 210 and 165 nm. Since the BC core is inertial in the atmosphere, the size distribution of the BC core is mainly affected by the emission sources and has been used as an index for source apportionment (Wu et al., 2017). The stable MMD may indicate stable emission sources in the boundary layer, and the MMD value on the ground is close to the reported MMD value observed at the urban site, which is mainly influenced by traffic emissions (H. Liu et al., 2020b; Y. F. Wu et al., 2021). The variable MMD value in the residual layer may indicate more complicated sources. Other physical properties, such as absorption ability and hygroscopicity, are calculated and exhibited in Fig. 5e–f. Due to the thicker coating, BC in the residual layer generally has a higher absorption ability and hygroscopicity. At 23:00 on 27 June, the absorption enhancement (Eabs) in the residual layer is 8.6 % higher than that on the ground, and the critical supersaturation point in the residual layer is 25.0 % lower than that on the ground.
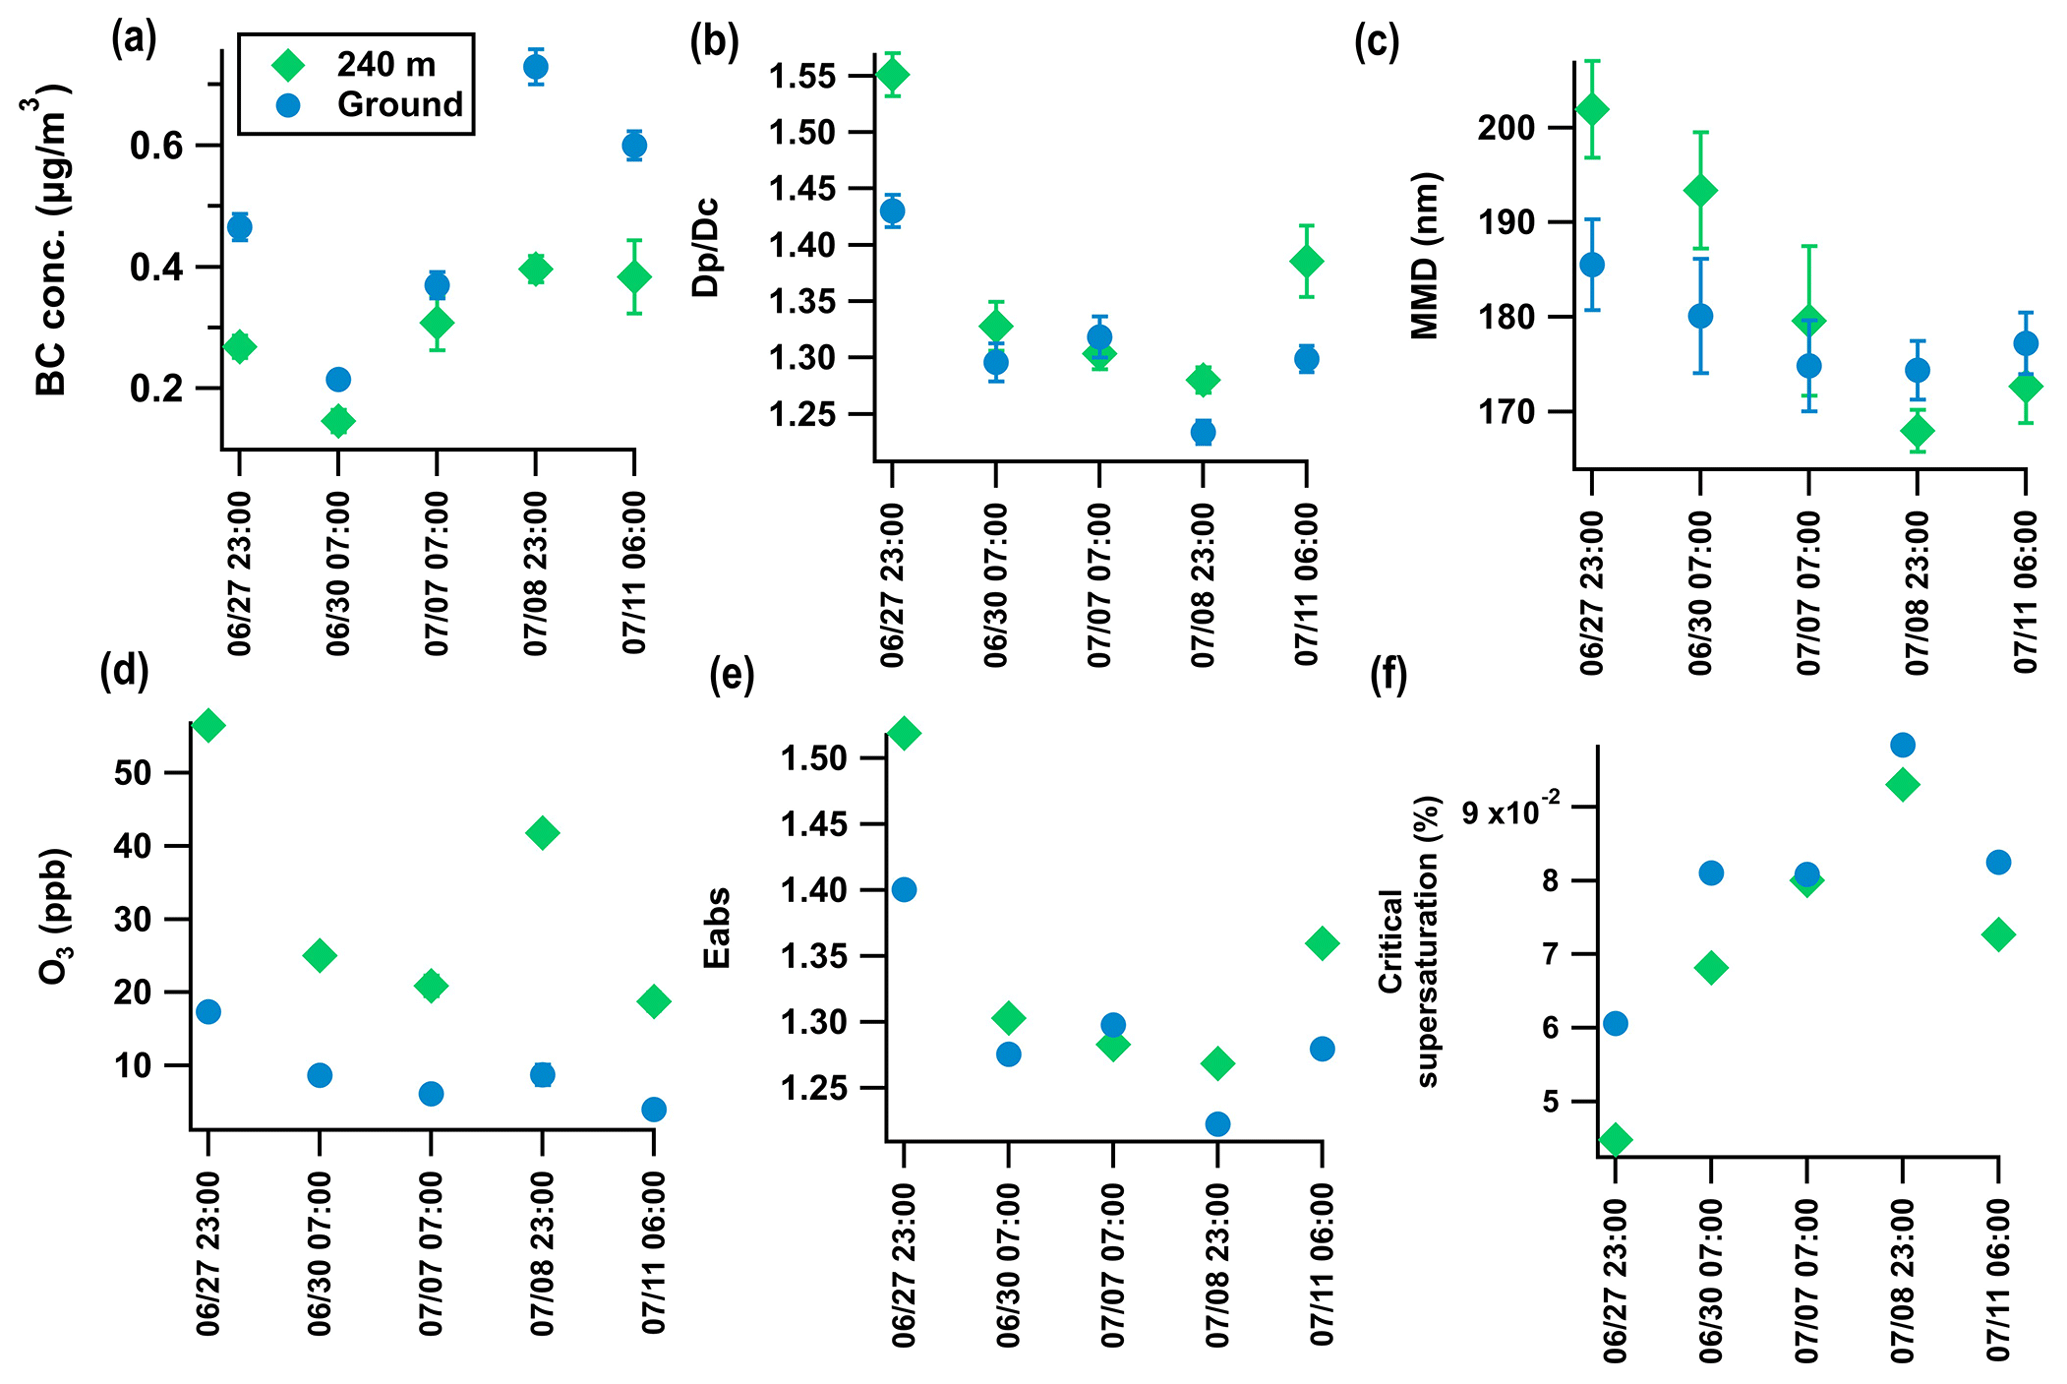
Figure 5Comparison between the surface and 240 m height in the sharp decrease type of major pollutant concentrations (BC, a; O3, d) and BC microphysical characteristics including coating thickness (, b), mass median diameter (MMD, c) of the BC core, absorption enhancement of BC due to coatings (Eabs, e) and critical supersaturation point of BC (f).
The O3 concentration showed an opposite and much more significant difference between the ground and residual layer compared with the concentration of BC. In the case at 23:00 on 27 June, the concentration of O3 at the 240 m height was 226.6 % higher than that on the ground, since the higher NOx concentration on the ground would decrease the O3 in the nocturnal boundary layer at night.
Previous studies found that the higher O3 concentration in the residual layer could increase the O3 concentration on the ground in the early morning with the development of the mixing layer and entrainment of O3 from the residual layer (Xu et al., 2018; Hu et al., 2018). The transportation of O3 from the residual layer to the ground was also observed in this study. As shown in Fig. 6, the O3 concentration was nearly zero before 06:00. Two vertical measurements were conducted during 06:00–08:00, and a much higher O3 concentration was observed in the upper height. The O3 concentration significantly increased at 08:00 when the moveable container returned to the ground compared with the O3 concentration at 06:00, but the concentration stayed stable between 08:00 and 10:00 and rose again after 10:00. The stable concentration of O3 between 08:00–10:00 means that the photochemical reaction may not be very efficient before 10:00 in this case. The increase in the O3 concentration on the ground between 06:00 and 08:00 may not be mainly attributed to photochemical reactions but to transportation from the upper height with high O3 concentrations. Such development of the boundary layer and vertical mixing was caused by the quicker heating of the ground (Fig. 6e) and would decrease the O3 concentration in the upper heights in turn. As denoted by the dashed gray line in Fig. 6d, the O3 concentration remained invariable at the beginning and then started to decrease when the container was located at the 240 m height during 06:30–07:15.
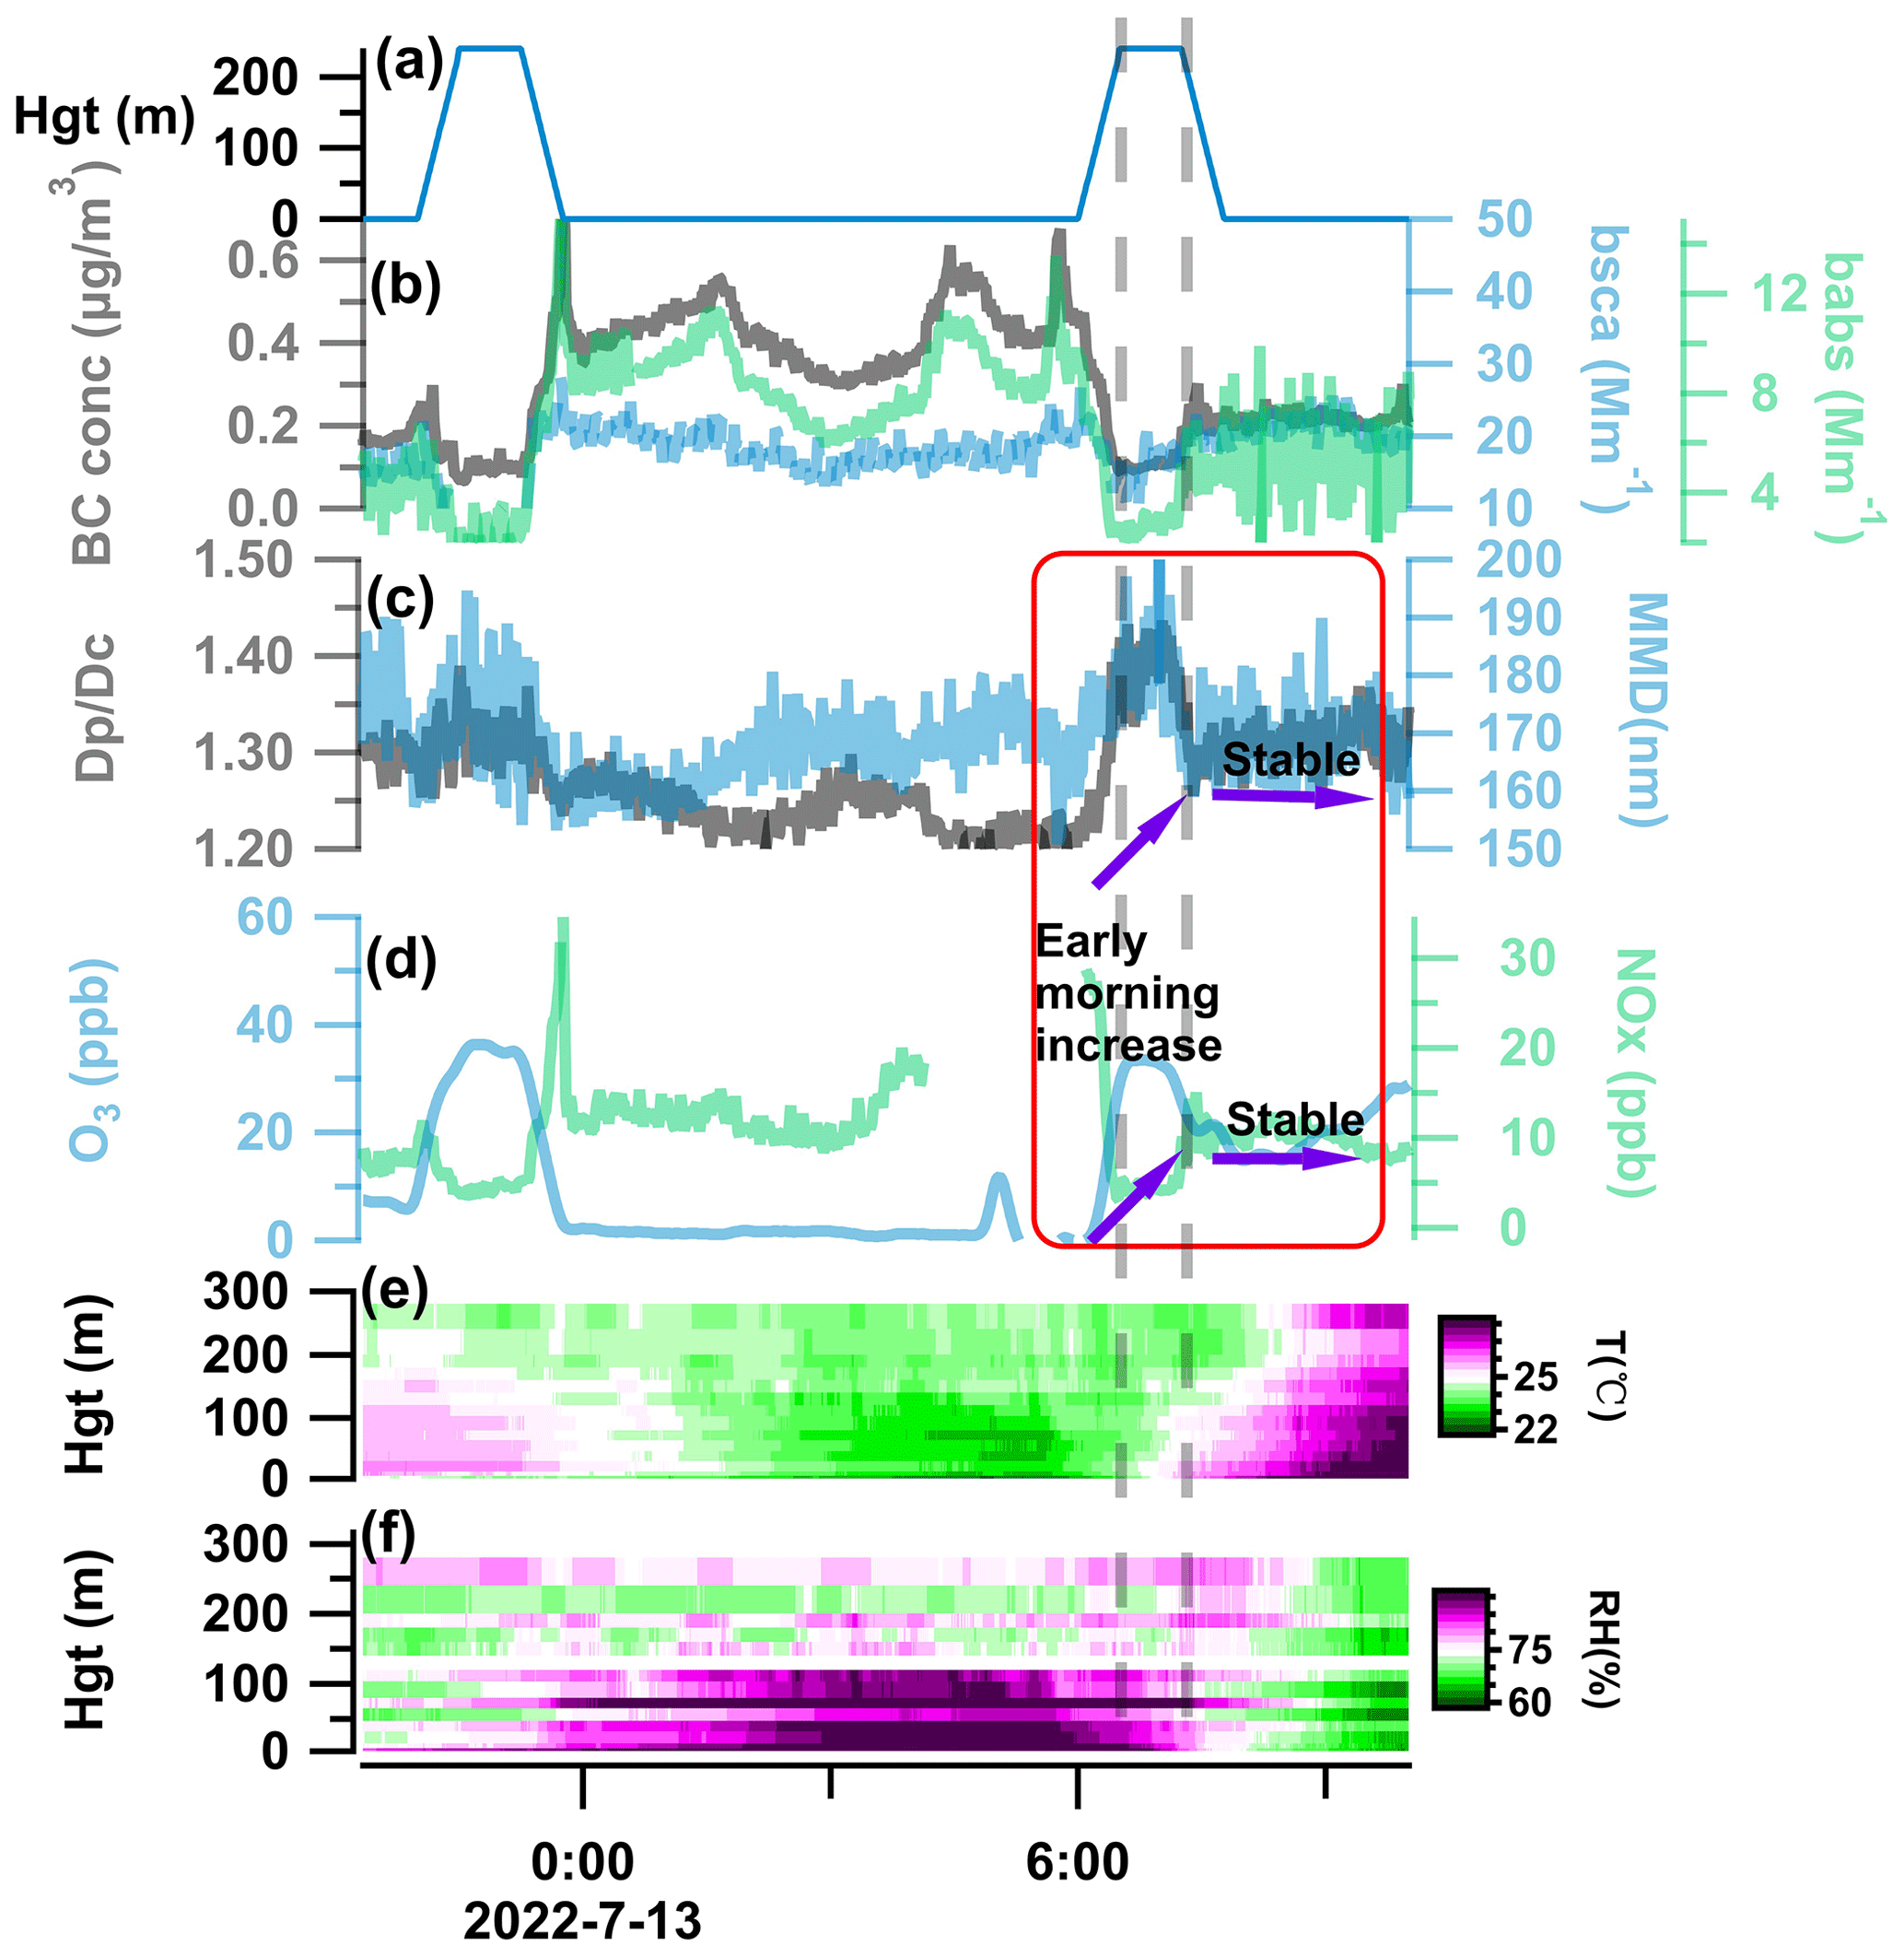
Figure 6A typical case of vertical mixing from the residual layer leading to an increase in O3 and in the early morning. (a) The height of a moveable container. (b–d) Time series (1 min average) of BC mass concentration, babs, bsca, , MMD, O3 and NOx. (e) Two-dimensional (height and time) plot of temperature (T); the colors denote the quantity of the temperature. (f) The same as (e) but for relative humidity (RH).
A similar variation tendency was also found for the value, as shown in Fig. 6c. The aged BC in the residual layer could also increase the on the ground in the early morning through entrainment and vertical mixing, even though the fresh BC emissions from traffic sources are substantial at the time. Another typical case of the increase in and O3 through vertical mixing occurred on 11 July. A similar increase in the early morning and stable condition at the later hours were found to those exhibited in Fig. S24. In the cases with enough photochemical reactions, stable conditions after the early morning increase may not be found, and the concentrations of O3 and continuously increase from the early morning. However, it is reasonable to infer that vertical mixing could also contribute to the increase in O3 and in the early morning, since O3 and were higher in the residual layer in most cases. From the profiles of O3 and on 13 July (Fig. S20), the pollutants from the residual layer are first influenced at the top of boundary layer during the daytime, as denoted by the large difference of O3 and between 240 m and the surface at 06:00. Then, with the development of vertical mixing due to the sunrise, pollutants at higher heights reached the surface. The O3 and at the surface increased and vertical profiles became uniform at 07:00. Such phenomenon could also be reflected on the averaged profiles (Fig. 4), since the averaged values of O3 and were higher at 240 m at 07:00. The presence of aerosol, especially the absorbing aerosols, would depress the development of the mixing layer (Ding et al., 2016; Z. L. Wang et al., 2018). The higher of BC in the residual layer may amplify the absorption of BC in the upper height in the early mornings, resulting in a more stable structure and deteriorating the air pollution.
The distinguished pollutants in the residual layer could also influence the chemical composition of particulate matter in the boundary layer (Lei et al., 2021). Due to the limitation of the observation height, the pollutant conditions at the top of the boundary during the daytime layer could not be detected. The above the boundary layer is reported to be higher than that on the ground under clean conditions (Ding et al., 2019). H. Liu et al. (2019a) reported rapid BC aging at the top of the boundary layer in summer due to intensive actinic flux. Besides the high actinic flux, the higher O3 concentration may also contribute to the increase in the upper height. Thus, the increase in the boundary layer due to vertical transportation may occur in the early morning, and entrainment from the lower troposphere may also lead to a increase in the daytime.
3.5 Optical properties of black carbon
The optical properties of BC aerosols are of utmost concern due to BC's strong absorption ability. Figure S25 exhibits the relationship between BC concentration and babs during the whole observation period. In general, babs increased with BC concentration. For the same BC concentration, babs increased with through the so-called “lensing effect”. The lensing effect also appeared in the vertical distribution. As shown in Fig. 4, the vertical distribution of Eabs shows a similar vertical variation in with a uniform distribution during the daytime and a slight increase at 150–240 m at night. The Eabs at the 240 m height is ∼ 1 %–2 % higher than that on the ground on average at night. The vertical difference in Eabs caused by thicker coatings is significantly lower than that of the BC concentration, as shown in Fig. 7. The vertical difference in BC concentration reached −40 %–40 % but was only −5 %–5 % for . Thus, the vertical distribution of babs is mainly determined by the variation in BC concentration, as proven by the similar average vertical profiles of BC concentration and babs. For the averaged profiles at 23:00 (the profiles with the most significant vertical difference), babs at 240 m is 29.3 % lower than that on the ground. Such a decrease could reach 30.3 % if the same coating thickness was used at all heights. In other words, the increase in absorption enhancement at the upper height due to coatings could slightly decrease the vertical difference of babs but could not compensate for the decrease of babs at the upper height due to the much more significant decrease of BC concentration.
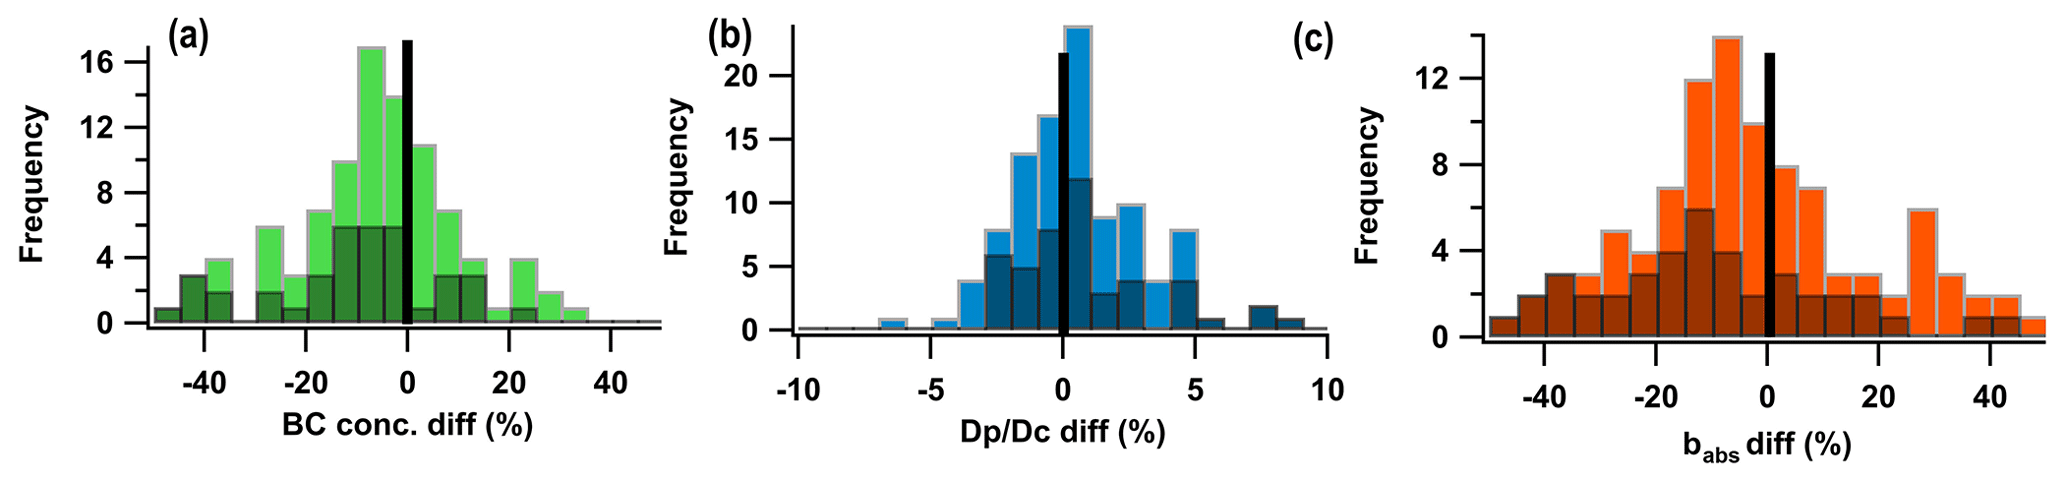
Figure 7Histogram of the number frequency of the relative differences between 240 m and the ground for (a) BC concentration, (b) and (c) babs. The black bars denote the number frequency at night and in the morning (06:00, 07:00, 08:00, 22:00, 23:00); the black line denotes no difference between 240 m and the ground.
Single-scattering albedo (SSA) is another key optical parameter for aerosols since the influence of aerosols on surface temperature could change from cooling to heating when the SSA is lower than the critical point of 0.90–0.93 (Hansen et al., 1997; Cook and Highwood, 2004). Although the lensing effect could increase the absorption ability for BC-containing aerosols, the scattering of BC-containing aerosols simultaneously increases with , leading to an increase in SSA, as shown in Fig. S26. For the bulk aerosols (including BC and non-BC aerosols) in the ambient atmosphere, the SSA also increases with increasing (Fig. S25b). The increase in SSA for bulk aerosols with may be influenced by the higher SSA for BC-containing particles with higher . Another reason is that the BC fraction in bulk aerosols may be lower in the air mass with a higher , since is an indicator for secondary aging processes and BC is the product of primary emissions. The vertical distribution of SSA exhibited a uniform type during the daytime. At nighttime, bsca and babs generally decrease with increasing height, but babs decreases at a quicker rate, resulting in an increase in SSA with height at night. Such an SSA variation trend has also been reported in previous vertical measurements (Li et al., 2022).
The mixing state of black carbon (BC) is crucial for estimating its climatic and environmental impact, but there is limited research on the vertical distribution of the BC mixing state. In the summer of 2022, continuous vertical measurements (0–240 m) of the BC mixing state were conducted in the urban area of Beijing using a meteorological tower. The goal of this study was to fill the observation gap of the BC mixing state distribution in an urban area with significant fresh BC emissions and explore the aging process of BC at the initial emission stage. The major findings are summarized below.
-
Based on the vertical distribution of BC concentrations, the profiles were classified into four categories: uniform, gradual decrease, sharp decrease and sudden increase. The uniform type indicates sufficient vertical mixing in the boundary layer and accounts for ∼ 80 % of the total profiles during the daytime. The gradual decrease and sharp decrease types suggest stable vertical conditions and account for ∼ 40 %–90 % of the total profiles at midnight and early morning. The vertical variation of O3 is different from other pollutants, and the O3 concentration generally increases with height, even in the uniform type for other pollutants due to the large emission of NOx on the ground.
-
The mass median diameter (MMD) and the diameter ratio between the BC-containing particles and BC core () were used to represent the size distribution of the BC core and coating thickness. The MMD and followed a generally uniform vertical distribution in the boundary layer. Under some stable conditions, such as a nocturnal boundary layer or cloudy days, increased with height. However, the vertical difference in BC concentration is much more significant than that in under stable conditions. For the average profiles at 23:00, the BC concentration at a height of 240 m could be 34.6 % lower than that on the ground, but the at a height of 240 m was only ∼ 2 % higher than that on the ground, leading to a 1 %–2 % absorption enhancement (Eabs) difference. Although coatings could increase absorption, they increase the absorption to a similar degree in the lower boundary layer. The vertical variation in BC concentration plays a more critical role in the vertical difference of BC's absorption ability.
-
The study obtained BC properties in both the boundary layer and residual layer in special cases. Compared with the ground, the residual layer generally has BC with a higher , lower concentration and a more variable MMD. In some cases, the in the residual layer could be 8.4 % higher than that on the ground, which could lead to an 8.6 % absorption increase and 25.0 % critical supersaturation decrease. Pollutants with distinct properties in the residual layer would influence the pollutants in the boundary layer in the early morning through entrainment and vertical mixing with the development of the boundary layer. It was observed that aged BC and a high concentration of O3 in the residual layer could lead to a quick increase in and O3 concentrations on the ground in the early morning (06:00–08:00).
Our study has revealed that the mixing state of BC is nearly vertically uniform within the boundary layer due to strong vertical mixing. Therefore, assuming constant microphysical properties of BC in the boundary layer for model simulations such as radiative transfer models is acceptable without additional information. However, with higher actinic flux and O3 concentration, the aging process of BC may be more efficient at the top of the boundary layer. Additionally, fresh BC tends to accumulate in the boundary layer at night. The difference in between the boundary layer and residual layer could be significant in some cases and should not be ignored. Such a difference could lead to a larger absorption enhancement of BC in the top of the boundary layer, potentially suppressing boundary layer development in the morning.
To request the data given in this study, please contact Hang Liu at the Institute of Atmospheric Physics, Chinese Academy of Sciences, via email (liuhang@mail.iap.ac.cn).
The supplement related to this article is available online at: https://doi.org/10.5194/acp-23-7225-2023-supplement.
HL: conceptualization, methodology, software. XP: conceptualization. SL: investigation. YZ: investigation. AD: investigation. WY: investigation. GT: investigation. TW: visualization. JX: resources. JL: visualization. YS: resources. JC: resources. ZW: resources, supervision.
The contact author has declared that none of the authors has any competing interests.
Publisher's note: Copernicus Publications remains neutral with regard to jurisdictional claims in published maps and institutional affiliations.
We thank the Public Technology Service Center, Institute of Atmospheric Physics, Chinese Academy of Sciences, for the technique support during the measurements.
This research has been supported by the National Natural Science Foundation of China (grant nos. 92044301 and 42177092), the National Key Research and Development Program of China (grant no. 2022YFC3701000, Task 4), and the China Postdoctoral Science Foundation (grant no. 2022M713094).
This paper was edited by Ottmar Möhler and reviewed by three anonymous referees.
Bond, T. C. and Bergstrom, R. W.: Light absorption by carbonaceous particles: An investigative review, Aerosol Sci. Tech., 40, 27–67, https://doi.org/10.1080/02786820500421521, 2006.
Bond, T. C., Doherty, S. J., Fahey, D., Forster, P., Berntsen, T., DeAngelo, B., Flanner, M., Ghan, S., Kärcher, B., and Koch, D.: Bounding the role of black carbon in the climate system: A scientific assessment, J. Geophys. Res.-Atmos., 118, 5380–5552, 2013.
Cook, J. and Highwood, E. J.: Climate response to tropospheric absorbing aerosols in an intermediate general-circulation model, Q. J. Roy. Meteor. Soc., 130, 175–191, https://doi.org/10.1256/qj.03.64, 2004.
Ding, A. J., Huang, X., Nie, W., Sun, J. N., Kerminen, V. M., Petaja, T., Su, H., Cheng, Y. F., Yang, X. Q., Wang, M. H., Chi, X. G., Wang, J. P., Virkkula, A., Guo, W. D., Yuan, J., Wang, S. Y., Zhang, R. J., Wu, Y. F., Song, Y., Zhu, T., Zilitinkevich, S., Kulmala, M., and Fu, C. B.: Enhanced haze pollution by black carbon in megacities in China, Geophys. Res. Lett., 43, 2873–2879, https://doi.org/10.1002/2016gl067745, 2016.
Ding, S., Liu, D. T., Zhao, D. L., Hu, K., Tian, P., Zhou, W., Huang, M. Y., Yang, Y., Wang, F., Sheng, J. J., Liu, Q., Kong, S. F., Cui, P. Y., Huang, Y. D., He, H., Coe, H., and Ding, D. P.: Size-Related Physical Properties of Black Carbon in the Lower Atmosphere over Beijing and Europe, Environ. Sci. Technol., 53, 11112–11121, https://doi.org/10.1021/acs.est.9b03722, 2019.
Ditas, J., Ma, N., Zhang, Y., Assmann, D., Neumaier, M., Riede, H., Karu, E., Williams, J., Scharffe, D., Wang, Q. Q., Saturno, J., Schwarz, J. P., Katich, J. M., McMeeking, G. R., Zahn, A., Hermann, M., Brenninkmeijer, C. A. M., Andreae, M. O., Poschl, U., Su, H., and Cheng, Y. F.: Strong impact of wildfires on the abundance and aging of black carbon in the lowermost stratosphere, P. Natl. Acad. Sci. USA, 115, E11595–E11603, https://doi.org/10.1073/pnas.1806868115, 2018.
Dominguez-Rodriguez, A., Rodriguez, S., Abreu-Gonzalez, P., Avanzas, P., and Juarez-Prera, R. A.: Black carbon exposure, oxidative stress markers and major adverse cardiovascular events in patients with acute coronary syndromes, Int. J. Cardiol., 188, 47–49, https://doi.org/10.1016/j.ijcard.2015.04.023, 2015.
Gao, R. S., Schwarz, J. P., Kelly, K. K., Fahey, D. W., Watts, L. A., Thompson, T. L., Spackman, J. R., Slowik, J. G., Cross, E. S., Han, J. H., Davidovits, P., Onasch, T. B., and Worsnop, D. R.: A novel method for estimating light-scattering properties of soot aerosols using a modified single-particle soot photometer, Aerosol Sci. Tech., 41, 125–135, https://doi.org/10.1080/02786820601118398, 2007.
Guan, X., Zhang, N. Y., Tian, P. F., Tang, C. G., Zhang, Z. D., Wang, L. G., Zhang, Y. S., Zhang, M., Guo, Y. M., Du, T., Cao, X. J., Liang, J. N., and Zhang, L.: Wintertime vertical distribution of black carbon and single scattering albedo in a semi-arid region derived from tethered balloon observations, Sci. Total Environ., 807, 150790, https://doi.org/10.1016/j.scitotenv.2021.150790, 2022.
Guimaraes, P., Ye, J. H., Batista, C., Barbosa, R., Ribeiro, I., Medeiros, A., Souza, R., and Martin, S. T.: Vertical Profiles of Ozone Concentration Collected by an Unmanned Aerial Vehicle and the Mixing of the Nighttime Boundary Layer over an Amazonian Urban Area, Atmosphere-Basel, 10, 599, https://doi.org/10.3390/atmos10100599, 2019.
Hansen, J., Sato, M., and Ruedy, R.: Radiative forcing and climate response, J. Geophys. Res.-Atmos., 102, 6831–6864, https://doi.org/10.1029/96jd03436, 1997.
He, C., Liou, K.-N., Takano, Y., Zhang, R., Levy Zamora, M., Yang, P., Li, Q., and Leung, L. R.: Variation of the radiative properties during black carbon aging: theoretical and experimental intercomparison, Atmos. Chem. Phys., 15, 11967–11980, https://doi.org/10.5194/acp-15-11967-2015, 2015.
Holder, A. L., Hagler, G. S. W., Yelverton, T. L. B., and Hays, M. D.: On-road black carbon instrument intercomparison and aerosol characteristics by driving environment, Atmos. Environ., 88, 183–191, https://doi.org/10.1016/j.atmosenv.2014.01.021, 2014.
Hu, J., Li, Y., Zhao, T., Liu, J., Hu, X.-M., Liu, D., Jiang, Y., Xu, J., and Chang, L.: An important mechanism of regional O3 transport for summer smog over the Yangtze River Delta in eastern China, Atmos. Chem. Phys., 18, 16239–16251, https://doi.org/10.5194/acp-18-16239-2018, 2018.
Hu, K., Zhao, D. L., Liu, D. T., Ding, S., Tian, P., Yu, C. J., Zhou, W., Huang, M. Y., and Ding, D. P.: Estimating radiative impacts of black carbon associated with mixing state in the lower atmosphere over the northern North China Plain, Chemosphere, 252, 126455, https://doi.org/10.1016/j.chemosphere.2020.126455, 2020.
Hu, K., Liu, D. T., Tian, P., Wu, Y. Z., Deng, Z. Z., Wu, Y. F., Zhao, D. L., Li, R. J., Sheng, J. J., Huang, M. Y., Ding, D. P., Li, W. J., Wang, Y. Y., and Wu, Y.: Measurements of the Diversity of Shape and Mixing State for Ambient Black Carbon Particles, Geophys. Res. Lett., 48, e2021GL094522, https://doi.org/10.1029/2021GL094522, 2021.
Katich, J. M., Samset, B. H., Bui, T. P., Dollner, M., Froyd, K. D., Campuzano-Jost, P., Nault, B. A., Schroder, J. C., Weinzierl, B., and Schwarz, J. P.: Strong Contrast in Remote Black Carbon Aerosol Loadings Between the Atlantic and Pacific Basins, J. Geophys. Res.-Atmos., 123, 13386–13395, https://doi.org/10.1029/2018jd029206, 2018.
Kwak, K. H., Lee, S. H., Kim, A. Y., Park, K. C., Lee, S. E., Han, B. S., Lee, J., and Park, Y. S.: Daytime Evolution of Lower Atmospheric Boundary Layer Structure: Comparative Observations between a 307-m Meteorological Tower and a Rotary-Wing UAV, Atmosphere-Basel, 11, 1142, https://doi.org/10.3390/atmos11111142, 2020.
Laborde, M., Mertes, P., Zieger, P., Dommen, J., Baltensperger, U., and Gysel, M.: Sensitivity of the Single Particle Soot Photometer to different black carbon types, Atmos. Meas. Tech., 5, 1031–1043, https://doi.org/10.5194/amt-5-1031-2012, 2012.
Lei, L., Sun, Y. L., Ouyang, B., Qiu, Y. M., Xie, C. H., Tang, G. Q., Zhou, W., He, Y., Wang, Q. Q., Cheng, X. L., Fu, P. Q., and Wang, Z. F.: Vertical Distributions of Primary and Secondary Aerosols in Urban Boundary Layer: Insights into Sources, Chemistry, and Interaction with Meteorology, Environ. Sci. Technol., 55, 4542–4552, https://doi.org/10.1021/acs.est.1c00479, 2021.
Li, J., Carlson, B. E., Yung, Y. L., Lv, D. R., Hansen, J., Penner, J. E., Liao, H., Ramaswamy, V., Kahn, R. A., Zhang, P., Dubovik, O., Ding, A. J., Lacis, A. A., Zhang, L., and Dong, Y. M.: Scattering and absorbing aerosols in the climate system, Nat. Rev. Earth Env., 3, 363–379, https://doi.org/10.1038/s43017-022-00296-7, 2022.
Li, M., Liu, H., Geng, G. N., Hong, C. P., Liu, F., Song, Y., Tong, D., Zheng, B., Cui, H. Y., Man, H. Y., Zhang, Q., and He, K. B.: Anthropogenic emission inventories in China: a review, Natl. Sci. Rev., 4, 834–866, https://doi.org/10.1093/nsr/nwx150, 2017.
Lin, W. W., Huang, W., Zhu, T., Hu, M., Brunekreef, B., Zhang, Y. H., Liu, X. G., Cheng, H., Gehring, U., Li, C. C., and Tang, X. Y.: Acute Respiratory Inflammation in Children and Black Carbon in Ambient Air before and during the 2008 Beijing Olympics, Environ. Health Persp., 119, 1507–1512, https://doi.org/10.1289/ehp.1103461, 2011.
Liu, B., Wu, C., Ma, N., Chen, Q., Li, Y. W., Ye, J. H., Martin, S. T., and Li, Y. J.: Vertical profiling of fine particulate matter and black carbon by using unmanned aerial vehicle in Macau, China, Sci. Total Environ., 709, 136109, https://doi.org/10.1016/j.scitotenv.2019.136109, 2020.
Liu, D., Allan, J. D., Young, D. E., Coe, H., Beddows, D., Fleming, Z. L., Flynn, M. J., Gallagher, M. W., Harrison, R. M., Lee, J., Prevot, A. S. H., Taylor, J. W., Yin, J., Williams, P. I., and Zotter, P.: Size distribution, mixing state and source apportionment of black carbon aerosol in London during wintertime, Atmos. Chem. Phys., 14, 10061–10084, https://doi.org/10.5194/acp-14-10061-2014, 2014.
Liu, D. T., Taylor, J. W., Young, D. E., Flynn, M. J., Coe, H., and Allan, J. D.: The effect of complex black carbon microphysics on the determination of the optical properties of brown carbon, Geophys. Res. Lett., 42, 613–619, https://doi.org/10.1002/2014gl062443, 2015.
Liu, D., Joshi, R., Wang, J., Yu, C., Allan, J. D., Coe, H., Flynn, M. J., Xie, C., Lee, J., Squires, F., Kotthaus, S., Grimmond, S., Ge, X., Sun, Y., and Fu, P.: Contrasting physical properties of black carbon in urban Beijing between winter and summer, Atmos. Chem. Phys., 19, 6749–6769, https://doi.org/10.5194/acp-19-6749-2019, 2019.
Liu, D. T., Whitehead, J., Alfarra, M. R., Reyes-Villegas, E., Spracklen, D. V., Reddington, C. L., Kong, S. F., Williams, P. I., Ting, Y. C., Haslett, S., Taylor, J. W., Flynn, M. J., Morgan, W. T., McFiggans, G., Coe, H., and Allan, J. D.: Black-carbon absorption enhancement in the atmosphere determined by particle mixing state, Nat. Geosci., 10, 184–188, https://doi.org/10.1038/Ngeo2901, 2017.
Liu, H., Pan, X., Wu, Y., Wang, D., Tian, Y., Liu, X., Lei, L., Sun, Y., Fu, P., and Wang, Z.: Effective densities of soot particles and their relationships with the mixing state at an urban site in the Beijing megacity in the winter of 2018, Atmos. Chem. Phys., 19, 14791–14804, https://doi.org/10.5194/acp-19-14791-2019, 2019.
Liu, H., Pan, X. L., Wu, Y. F., Ji, D. S., Tian, Y., Chen, X. S., and Wang, Z. F.: Size-resolved mixing state and optical properties of black carbon at an urban site in Beijing, Sci. Total Environ., 749, 141523. https://doi.org/10.1016/j.scitotenv.2020.141523, 2020a.
Liu, H., Pan, X., Liu, D., Liu, X., Chen, X., Tian, Y., Sun, Y., Fu, P., and Wang, Z.: Mixing characteristics of refractory black carbon aerosols at an urban site in Beijing, Atmos. Chem. Phys., 20, 5771–5785, https://doi.org/10.5194/acp-20-5771-2020, 2020b.
Liu, J. J., Zheng, Y. F., Li, Z. Q., Flynn, C., and Cribb, M.: Seasonal variations of aerosol optical properties, vertical distribution and associated radiative effects in the Yangtze Delta region of China, J. Geophys. Res.-Atmos., 117, D00K38, https://doi.org/10.1029/2011jd016490, 2012.
Lu, K. F., He, H. D., Wang, H. W., Li, X. B., and Peng, Z. R.: Characterizing temporal and vertical distribution patterns of traffic-emitted pollutants near an elevated expressway in urban residential areas, Build. Environ., 172, 106678, https://doi.org/10.1016/j.buildenv.2020.106678, 2020.
Lu, Y., Zhu, B., Huang, Y., Shi, S. S., Wang, H. L., An, J. L., and Yu, X. N.: Vertical distributions of black carbon aerosols over rural areas of the Yangtze River Delta in winter, Sci. Total Environ., 661, 1–9, https://doi.org/10.1016/j.scitotenv.2019.01.170, 2019.
Luo, J., Li, Z., Zhang, C., Zhang, Q., Zhang, Y., Zhang, Y., Curci, G., and Chakrabarty, R. K.: Regional impacts of black carbon morphologies on shortwave aerosol–radiation interactions: a comparative study between the US and China, Atmos. Chem. Phys., 22, 7647–7666, https://doi.org/10.5194/acp-22-7647-2022, 2022.
Matsui, H., Hamilton, D. S., and Mahowald, N. M.: Black carbon radiative effects highly sensitive to emitted particle size when resolving mixing-state diversity, Nat. Commun., 9, 3446, https://doi.org/10.1038/s41467-018-05635-1, 2018.
Moteki, N. and Kondo, Y.: Dependence of Laser-Induced Incandescence on Physical Properties of Black Carbon Aerosols: Measurements and Theoretical Interpretation, Aerosol Sci. Tech., 44, 663–675, https://doi.org/10.1080/02786826.2010.484450, 2010.
Moteki, N., Kondo, Y., and Nakamura, S.: Method to measure refractive indices of small nonspherical particles: Application to black carbon particles, J. Aerosol Sci., 41, 513–521, https://doi.org/10.1016/j.jaerosci.2010.02.013, 2010.
Pan, X., Kanaya, Y., Taketani, F., Miyakawa, T., Inomata, S., Komazaki, Y., Tanimoto, H., Wang, Z., Uno, I., and Wang, Z.: Emission characteristics of refractory black carbon aerosols from fresh biomass burning: a perspective from laboratory experiments, Atmos. Chem. Phys., 17, 13001–13016, https://doi.org/10.5194/acp-17-13001-2017, 2017.
Pikridas, M., Bezantakos, S., Močnik, G., Keleshis, C., Brechtel, F., Stavroulas, I., Demetriades, G., Antoniou, P., Vouterakos, P., Argyrides, M., Liakakou, E., Drinovec, L., Marinou, E., Amiridis, V., Vrekoussis, M., Mihalopoulos, N., and Sciare, J.: On-flight intercomparison of three miniature aerosol absorption sensors using unmanned aerial systems (UASs), Atmos. Meas. Tech., 12, 6425–6447, https://doi.org/10.5194/amt-12-6425-2019, 2019.
Pringle, K. J., Tost, H., Pozzer, A., Pöschl, U., and Lelieveld, J.: Global distribution of the effective aerosol hygroscopicity parameter for CCN activation, Atmos. Chem. Phys., 10, 5241–5255, https://doi.org/10.5194/acp-10-5241-2010, 2010.
Ramanathan, V. and Carmichael, G.: Global and regional climate changes due to black carbon, Nat. Geosci., 36, 335–358, 2008.
Samad, A., Vogt, U., Panta, A., and Uprety, D.: Vertical distribution of particulate matter, black carbon and ultra-fine particles in Stuttgart, Germany, Atmos. Pollut. Res., 11, 1441–1450, https://doi.org/10.1016/j.apr.2020.05.017, 2020.
Schulz, H., Zanatta, M., Bozem, H., Leaitch, W. R., Herber, A. B., Burkart, J., Willis, M. D., Kunkel, D., Hoor, P. M., Abbatt, J. P. D., and Gerdes, R.: High Arctic aircraft measurements characterising black carbon vertical variability in spring and summer, Atmos. Chem. Phys., 19, 2361–2384, https://doi.org/10.5194/acp-19-2361-2019, 2019.
Schwarz, J. P., Gao, R. S., Spackman, J. R., Watts, L. A., Thomson, D. S., Fahey, D. W., Ryerson, T. B., Peischl, J., Holloway, J. S., Trainer, M., Frost, G. J., Baynard, T., Lack, D. A., de Gouw, J. A., Warneke, C., and Del Negro, L. A.: Measurement of the mixing state, mass, and optical size of individual black carbon particles in urban and biomass burning emissions, Geophys. Res. Lett., 35, L13810, https://doi.org/10.1029/2008gl033968, 2008.
Schwarz, J. P., Samset, B. H., Perring, A. E., Spackman, J. R., Gao, R. S., Stier, P., Schulz, M., Moore, F. L., Ray, E. A., and Fahey, D. W.: Global-scale seasonally resolved black carbon vertical profiles over the Pacific, Geophys. Res. Lett., 40, 5542–5547, https://doi.org/10.1002/2013gl057775, 2013.
Schwarz, J. P., Weinzierl, B., Samset, B. H., Dollner, M., Heimerl, K., Markovic, M. Z., Perring, A. E., and Ziemba, L.: Aircraft measurements of black carbon vertical profiles show upper tropospheric variability and stability, Geophys. Res. Lett., 44, 1132–1140, https://doi.org/10.1002/2016gl071241, 2017.
Shiraiwa, M., Kondo, Y., Moteki, N., Takegawa, N., Sahu, L., Takami, A., Hatakeyama, S., Yonemura, S., and Blake, D.: Radiative impact of mixing state of black carbon aerosol in Asian outflow, J. Geophys. Res.-Atmos., 113, D24210, https://doi.org/10.1029/2008JD010546, 2008.
Shiraiwa, M., Kondo, Y., Iwamoto, T., and Kita, K.: Amplification of Light Absorption of Black Carbon by Organic Coating, Aerosol Sci. Tech., 44, 46–54, https://doi.org/10.1080/02786820903357686, 2010.
Stokes, R. H. and Robinson, R. A.: Interactions in Aqueous Nonelectrolyte Solutions. I. Solute-Solvent Equilibria, J. Phys. Chem., 70, 2126–2131, https://doi.org/10.1021/j100879a010, 1966.
Sun, Y. L., Wang, Z. F., Wild, O., Xu, W. Q., Chen, C., Fu, P. Q., Du, W., Zhou, L. B., Zhang, Q., Han, T. T., Wang, Q. Q., Pan, X. L., Zheng, H. T., Li, J., Guo, X. F., Liu, J. G., and Worsnop, D. R.: “APEC Blue”: Secondary Aerosol Reductions from Emission Controls in Beijing, Sci. Rep.-UK, 6, 20668, https://doi.org/10.1038/srep20668, 2016.
Tang, G., Zhu, X., Hu, B., Xin, J., Wang, L., Münkel, C., Mao, G., and Wang, Y.: Impact of emission controls on air quality in Beijing during APEC 2014: lidar ceilometer observations, Atmos. Chem. Phys., 15, 12667–12680, https://doi.org/10.5194/acp-15-12667-2015, 2015.
Tang, G., Zhang, J., Zhu, X., Song, T., Münkel, C., Hu, B., Schäfer, K., Liu, Z., Zhang, J., Wang, L., Xin, J., Suppan, P., and Wang, Y.: Mixing layer height and its implications for air pollution over Beijing, China, Atmos. Chem. Phys., 16, 2459–2475, https://doi.org/10.5194/acp-16-2459-2016, 2016.
Taylor, J. W., Allan, J. D., Allen, G., Coe, H., Williams, P. I., Flynn, M. J., Le Breton, M., Muller, J. B. A., Percival, C. J., Oram, D., Forster, G., Lee, J. D., Rickard, A. R., Parrington, M., and Palmer, P. I.: Size-dependent wet removal of black carbon in Canadian biomass burning plumes, Atmos. Chem. Phys., 14, 13755–13771, https://doi.org/10.5194/acp-14-13755-2014, 2014.
Taylor, J. W., Allan, J. D., Liu, D., Flynn, M., Weber, R., Zhang, X., Lefer, B. L., Grossberg, N., Flynn, J., and Coe, H.: Assessment of the sensitivity of core / shell parameters derived using the single-particle soot photometer to density and refractive index, Atmos. Meas. Tech., 8, 1701–1718, https://doi.org/10.5194/amt-8-1701-2015, 2015.
Wang, Q., Sun, Y., Xu, W., Du, W., Zhou, L., Tang, G., Chen, C., Cheng, X., Zhao, X., Ji, D., Han, T., Wang, Z., Li, J., and Wang, Z.: Vertically resolved characteristics of air pollution during two severe winter haze episodes in urban Beijing, China, Atmos. Chem. Phys., 18, 2495–2509, https://doi.org/10.5194/acp-18-2495-2018, 2018.
Wang, Q. L., Wang, L. L., Gong, C. S., Li, M. G., Xin, J. Y., Tang, G. Q., Sun, Y., Gao, J. H., Wang, Y. H., Wu, S., Kang, Y. Y., Yang, Y., Li, T. T., Liu, J. D., and Wang, Y. S.: Vertical evolution of black and brown carbon during pollution events over North China Plain, Sci. Total Environ., 806, 150950, https://doi.org/10.1016/j.scitotenv.2021.150950, 2022.
Wang, Q. Y., Huang, R.-J., Cao, J. J., Tie, X. X., Ni, H. Y., Zhou, Y. Q., Han, Y. M., Hu, T. F., Zhu, C. S., Feng, T., Li, N., and Li, J. D.: Black carbon aerosol in winter northeastern Qinghai–Tibetan Plateau, China: the source, mixing state and optical property, Atmos. Chem. Phys., 15, 13059–13069, https://doi.org/10.5194/acp-15-13059-2015, 2015.
Wang, Y. Y., Liu, F. S., He, C. L., Bi, L., Cheng, T. H., Wang, Z. L., Zhang, H., Zhang, X. Y., Shi, Z. B., and Li, W. J.: Fractal Dimensions and Mixing Structures of Soot Particles during Atmospheric Processing, Environ. Sci. Tech. Let., 4, 487–493, https://doi.org/10.1021/acs.estlett.7b00418, 2017.
Wang, Z., Huang, X., and Ding, A.: Dome effect of black carbon and its key influencing factors: a one-dimensional modelling study, Atmos. Chem. Phys., 18, 2821–2834, https://doi.org/10.5194/acp-18-2821-2018, 2018.
Wilcox, E. M., Thomas, R. M., Praveen, P. S., Pistone, K., Bender, F. A. M., and Ramanathan, V.: Black carbon solar absorption suppresses turbulence in the atmospheric boundary layer, P. Natl. Acad. Sci. USA, 113, 11794–11799, https://doi.org/10.1073/pnas.1525746113, 2016.
Wu, C., Liu, B., Wu, D., Yang, H. L., Mao, X., Tan, J., Liang, Y., Sun, J. Y., Xia, R., Sun, J. R., He, G. W., Li, M., Deng, T., Zhou, Z., and Li, Y. J.: Vertical profiling of black carbon and ozone using a multicopter unmanned aerial vehicle (UAV) in urban Shenzhen of South China, Sci. Total Environ., 801, 149689, https://doi.org/10.1016/j.scitotenv.2021.149689, 2021.
Wu, Y., Cheng, T. H., Liu, D. T., Allan, J. D., Zheng, L. J., and Chen, H.: Light Absorption Enhancement of Black Carbon Aerosol Constrained by Particle Morphology, Environ. Sci. Technol., 52, 6912–6919, https://doi.org/10.1021/acs.est.8b00636, 2018.
Wu, Y., Wang, X., Tao, J., Huang, R., Tian, P., Cao, J., Zhang, L., Ho, K.-F., Han, Z., and Zhang, R.: Size distribution and source of black carbon aerosol in urban Beijing during winter haze episodes, Atmos. Chem. Phys., 17, 7965–7975, https://doi.org/10.5194/acp-17-7965-2017, 2017.
Wu, Y. F., Xia, Y. J., Zhou, C., Tian, P., Tao, J., Huang, R. J., Liu, D. T., Wang, X., Xia, X. G., Han, Z. W., and Zhang, R. J.: Effect of source variation on the size and mixing state of black carbon aerosol in urban Beijing from 2013 to 2019: Implication on light absorption, Environ. Pollut., 270, 116089, https://doi.org/10.1016/j.envpol.2020.116089, 2021.
Xie, C., Xu, W., Wang, J., Wang, Q., Liu, D., Tang, G., Chen, P., Du, W., Zhao, J., Zhang, Y., Zhou, W., Han, T., Bian, Q., Li, J., Fu, P., Wang, Z., Ge, X., Allan, J., Coe, H., and Sun, Y.: Vertical characterization of aerosol optical properties and brown carbon in winter in urban Beijing, China, Atmos. Chem. Phys., 19, 165–179, https://doi.org/10.5194/acp-19-165-2019, 2019.
Xu, Z. N., Huang, X., Nie, W., Shen, Y. C., Zheng, L. F., Xie, Y. N., Wang, T. Y., Ding, K., Liu, L. X., Zhou, D. R., Qi, X. M., and Ding, A. J.: Impact of Biomass Burning and Vertical Mixing of Residual-Layer Aged Plumes on Ozone in the Yangtze River Delta, China: A Tethered-Balloon Measurement and Modeling Study of a Multiday Ozone Episode, J. Geophys. Res.-Atmos., 123, 11786–11803, https://doi.org/10.1029/2018jd028994, 2018.
Xue, T., Zheng, Y. X., Li, X., Liu, J., Zhang, Q., and Zhu, T.: A component-specific exposure-mortality model for ambient PM2.5 in China: findings from nationwide epidemiology based on outputs from a chemical transport model, Faraday Discuss., 226, 551–568, https://doi.org/10.1039/D0fd00093k, 2021.
Zhang, Y., Zhang, Q., Cheng, Y., Su, H., Li, H., Li, M., Zhang, X., Ding, A., and He, K.: Amplification of light absorption of black carbon associated with air pollution, Atmos. Chem. Phys., 18, 9879–9896, https://doi.org/10.5194/acp-18-9879-2018, 2018.
Zhang, Y. X., Zhang, Q., Wu, N. N., and Ding, A. J.: Weakened Haze Mitigation Induced by Enhanced Aging of Black Carbon in China, Environ. Sci. Technol., 56, 7629–7636, https://doi.org/10.1021/acs.est.2c00090, 2022.
Zhao, D. L., Liu, D. T., Yu, C. J., Tian, P., Hu, D. W., Zhou, W., Ding, S., Hu, K., Sun, Z. B., Huang, M. Y., Huang, Y., Yang, Y., Wang, F., Sheng, J. J., Liu, Q., Kong, S. F., Li, X. M., He, H., and Ding, D. P.: Vertical evolution of black carbon characteristics and heating rate during a haze event in Beijing winter, Sci. Total Environ., 709, 136251, https://doi.org/10.1016/j.scitotenv.2019.136251, 2020.
Zhao, G., Tan, T., Hu, S., Du, Z., Shang, D., Wu, Z., Guo, S., Zheng, J., Zhu, W., Li, M., Zeng, L., and Hu, M.: Mixing state of black carbon at different atmospheres in north and southwest China, Atmos. Chem. Phys., 22, 10861–10873, https://doi.org/10.5194/acp-22-10861-2022, 2022.