the Creative Commons Attribution 4.0 License.
the Creative Commons Attribution 4.0 License.
 | 21 Jun 2023
Comprehensive simulations of new particle formation events in Beijing with a cluster dynamics–multicomponent sectional model
Chenxi Li
Yuyang Li
Xiaoxiao Li
Runlong Cai
Yaxin Fan
Xiaohui Qiao
Rujing Yin
Yishuo Guo
Yongchun Liu
Jun Zheng
Veli-Matti Kerminen
Markku Kulmala
Huayun Xiao
Jingkun Jiang
New particle formation (NPF) and growth are a major source of atmospheric fine particles. In polluted urban environments, NPF events are frequently observed with characteristics distinct from those in clean environments. Here we simulate NPF events in urban Beijing with a discrete-sectional model that couples cluster dynamics and multicomponent particle growth. In the model, new particles are formed by sulfuric acid–dimethylamine nucleation, while particle growth is driven by particle coagulation and the condensation of sulfuric acid, its clusters, and oxygenated organic molecules (OOMs). A variable simulation domain in the particle size space is applied to isolate newly formed particles from preexisting ones, which allows us to focus on new particle formation and growth rather than the evolution of particles of non-NPF origin. The simulation yields a rich set of information including the time-dependent NPF rates, the cluster concentrations, the particle size distributions, and the time- and size-specific particle chemical compositions. These can be compared with the field observations to comprehensively assess the simulation–observation agreement. Sensitivity analysis with the model further quantifies how metrics of NPF events (e.g., particle survival probability) respond to model input variations and serves as a diagnostic tool to pinpoint the key parameter that leads to simulation–observation discrepancies. Seven typical NPF events in urban Beijing were analyzed. We found that with the observed gaseous precursor concentrations and coagulation sink as model inputs, the simulations roughly captured the evolution of the observed particle size distributions; however, the simulated particle growth rate was insufficient to yield the observed particle number concentrations, survival probability, and mode diameter. With the aid of sensitivity analysis, we identified under-detected OOMs as a likely cause for the discrepancy, and the agreement between the simulation and the observation was improved after we modulated particle growth rates in the simulation by adjusting the abundance of OOMs.
- Article
(4661 KB) - Full-text XML
-
Supplement
(2298 KB) - BibTeX
- EndNote


New particle formation (NPF) is frequently observed around the globe and affects the formation of cloud condensation nuclei (CCN) and air quality (Gordon et al., 2017; Kerminen et al., 2018; Lee et al., 2019; Kulmala et al., 2021). NPF events are initiated by the formation of stable molecular clusters by gaseous precursors, followed by the growth of these clusters through condensation and coagulation. The mechanisms of new particle formation and growth (NPFG) are complex. For instance, particle formation has numerous potential participants that interact with one another (Li and Signorell, 2020; Elm et al., 2020), while particle growth could involve poorly characterized condensables and heterogeneous reactions (Wang et al., 2020; Li et al., 2022; Wang et al., 2010; Kulmala et al., 2022). Additionally, the unfolding of NPF events is critically influenced by the ambient conditions, including the temperature (Frege et al., 2018; Yu et al., 2017), the distribution of pre-existing particles (Deng et al., 2021; Kulmala et al., 2021; Li et al., 2023), and air mass transport (Cai et al., 2018). The complexity of NPFG as well as its sensitivity to ambient conditions has made it a challenge to interpret NPF field observations.
To facilitate the extraction of the underlying mechanisms from observations, particle formation and subsequent growth are often analyzed in an isolated manner. In this isolation, the NPF rate is defined as the particle flux past a size threshold (in practice the instrument detection limit is often used), and the particle growth rate is retrieved by tracking the variation of a representative particle size (Kulmala et al., 2012; Li and McMurry, 2018). The particle formation mechanism is then obtained by statistically matching NPF models with the observed rates in many NPF events (Jen et al., 2014; Cai and Jiang, 2017; Cai et al., 2021b), and the particle growth mechanism is retrieved in a similar fashion by contrasting the calculated and the observed particle growth rates (Mohr et al., 2019; Qiao et al., 2021). This type of isolated analysis has been instrumental in deciphering the NPFG mechanisms. However, mechanisms thus extracted are statistically averaged, which do not necessarily apply to individual NPF events. Additionally, the prediction of atmospherically relevant quantities, e.g., the contribution of NPF to CCN sizes, requires the synchronization of particle formation and growth. Therefore, the isolated analyses are ideally followed by their coupling to “reproduce” the development of NPF events with simulations, which is a stringent test on the applicability of the extracted mechanisms.
The simulation of the evolving particle size distribution (PSD) during NPF events is a built-in feature of some global or regional air quality models. Simulations conducted with these models usually apply large size grids that coarsely simulate the particle size distributions, focusing on the evaluation of the climatic implications of NPFG rather than the elucidation or verification of their mechanisms (Matsui et al., 2011; Roldin et al., 2019). Some works have applied more elaborate zero-dimensional models to simulate NPF events with greater detail. Huang et al. (2016) combined the WRF-Chem regional chemical transport model and the MALTE-BOX sectional model (Boy et al., 2006) and simulated three representative NPF events at the SORPES station in Nanjing, China. They applied a simplified kinetic nucleation theory to calculate the NPF rates and showed that the low-volatility products of biogenic vapor oxidation play an essential role in the early growth of freshly formed particles. In a subsequent work, Qi et al. (2018) used a sulfuric acid–highly oxidized molecule (HOM) NPF scheme to describe particle formation and compared HOMs' contributions to particle growth at the SMEAR II and the SORPES station. They reported that it was more difficult to reproduce the PSDs observed at the SORPES station, possibly due to unaccounted for particle growth mechanisms or underestimated condensing organic vapor concentrations of anthropogenic origin. These detailed simulations provided valuable mechanistic insights into NPFG.
NPF events in urban Beijing are characterized by high NPF rates and comparatively slow particle growth in a polluted environment (Li et al., 2022; Cai et al., 2021b). Compared with NPF events observed in cleaner environments, the PSDs observed in Beijing tend to be more polydisperse due to the long-lasting formation of new particles, and the high concentration of newly formed particles makes coagulation a potentially important mechanism for particle growth (Cai et al., 2021a). Previously, we have performed isolated analysis of particle formation and particle growth in Beijing, demonstrating that sulfuric acid–dimethylamine (SA-DMA) nucleation governs new particle formation, while the condensation of SA and oxygenated organic molecules (OOMs) contributes significantly to particle growth (Cai et al., 2021b; Deng et al., 2020; Qiao et al., 2021; Li et al., 2022; Yan et al., 2021). To date, however, it has not been shown if simulation based on these mechanisms can describe the development of individual NPF events.
In this work, we simulated several NPF events in Beijing with a discrete-sectional model. New particle formation was modeled with cluster dynamics based on the SA-DMA nucleation mechanism, which considered the varying ambient temperature and produced time-dependent cluster concentrations not obtainable from simpler parameterized nucleation rate expressions (Huang et al., 2016; Qi et al., 2018). Particle growth was modeled considering particle condensational growth as well as coagulation, which produced time-dependent PSDs and time- and size-specific particle compositions. Compared to growth simulation of monodisperse particles (Hodshire et al., 2016; Qiao et al., 2021), this method was particularly suitable for simulating the highly polydisperse PSDs observed in urban Beijing. With the model we assessed to what extent the simulation based on the assumed NPFG mechanism can retrieve the observed evolution of individual NPF events. We further analyzed the likely causes for the simulation–observation discrepancies; towards this goal, sensitivity analysis was applied as a diagnostic tool, based on which attempts were made to bridge the gap between the simulation and the observation.
2.1 The discrete-sectional model
We apply a zero-dimensional model which couples a cluster dynamics module and a sectional module to simulate new particle formation and growth. Our previous work has shown that despite fluctuations in the measured PSD and relevant atmospheric conditions, NPF and subsequent growth in urban Beijing usually occur on a regional scale (Cai et al., 2018); hence it is reasonable to apply zero-dimensional simulations to analyze the selected NPF events. Air mass transport and primary particle emissions are not incorporated, although their influence on some NPF events is of interest for future investigations. A schematic of the model is shown in Fig. 1. The model considers the formation, growth, and coagulation of both molecular clusters and particles, as well as their loss to pre-existing particles. Input to the model includes the ambient temperature, the cluster free energies, the time-resolved concentrations of gaseous precursors, and the particle size distribution outside the simulation domain (explained below).
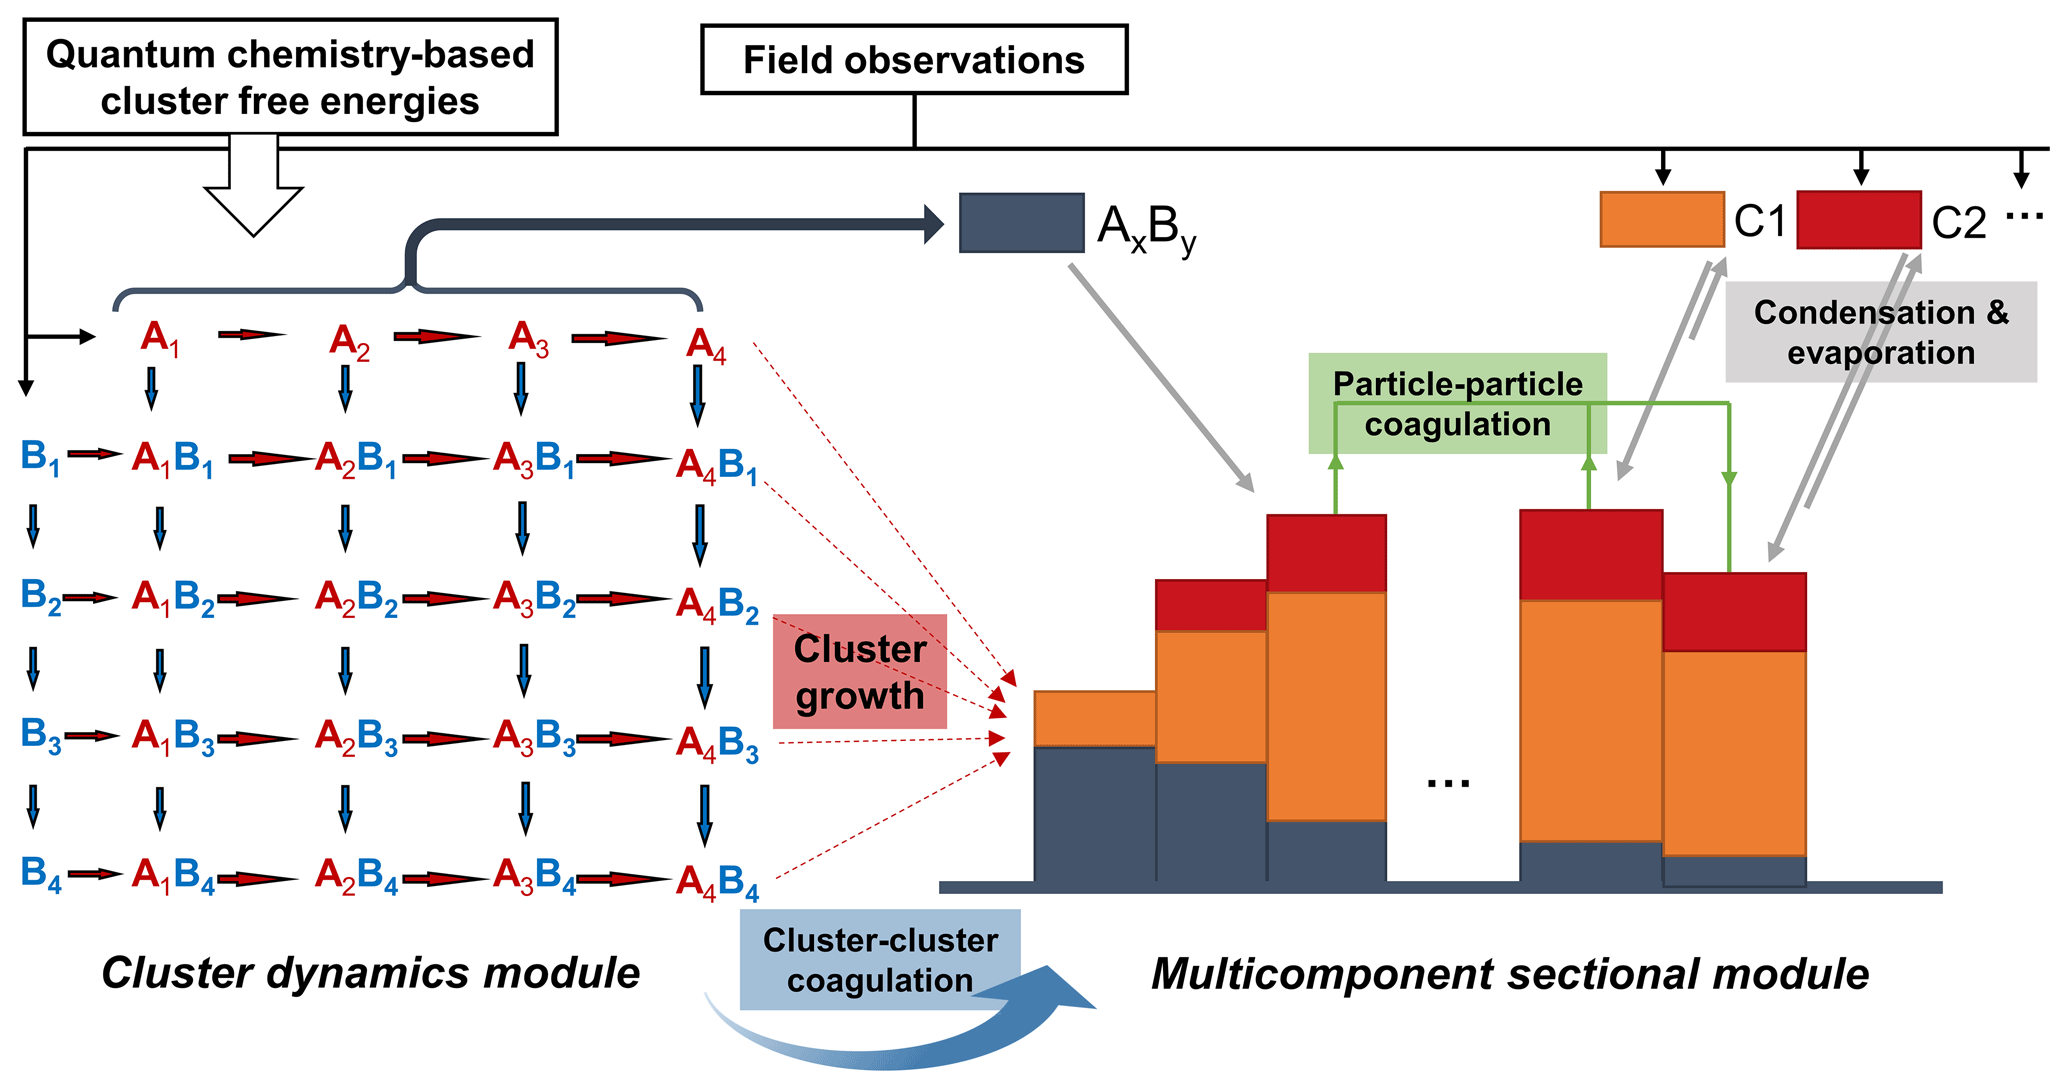
Figure 1A schematic of the simulation model used in this work. A and B represent acid and base molecules, respectively, and C1 and C2 represent two condensing organic vapors of different volatilities. Cluster formation by cluster–cluster association is not shown in this figure but is included in the simulations.
The cluster dynamics module simulates new particle formation from sulfuric acid (SA) and dimethylamine (DMA). Although other binary or ternary nucleation mechanisms (e.g., SA–NH3, SA–organics, SA–NH3–DMA) might contribute to NPF in some environments, here we only consider SA-DMA because our previous work has shown that the NPF rates in Beijing can be well explained by the SA-DMA nucleation without invoking other mechanisms (Cai et al., 2021b). The DMA concentration is assumed to be the same as the C2 amine concentrations observed in the field (Cai et al., 2021b). Collision rate coefficients between molecules and clusters are calculated with the collision kernel given by Chan and Mozurkewich (2001) with a Hamaker constant of 6.4 × 10⁻²⁰ J, which accounts for the collision enhancement due to van der Waals interactions. The evaporation rates of the clusters are calculated with the collision rate coefficients and the free energy of cluster formation (McGrath et al., 2012), which are available from the literature (Ortega et al., 2012; Myllys et al., 2019; Li et al., 2020). The free energies of SAxDMAy clusters at 298 K are taken from Ortega et al. (2012), but the Gibbs free energy of formation of SA1DMA1 is set to −14.0 kcal mol−1 at 298 K. This free energy of SA1DMA1 is the same as that in Cai et al. (2021b), which was chosen to improve the agreement between simulated and observed NPF rates. The Gibbs free energy of formation at different temperatures is estimated with Eq. (S15) in Cai et al. (2021b). Clusters containing more than four SA molecules are treated as nucleated particles and enter the smallest section.
The sectional module simulates the PSD and size-resolved particle compositions as a function of time. The particles are divided into sections according to their volume, and the width of the sections (in terms of the particle volume) increases geometrically by a factor of 20.1 = 1.0718. Processes considered in the sectional module include particle condensational growth by SAxDMAy (, ) and OOMs, particle coagulation, and loss to pre-existing particles, with the collision rate coefficients between all colliding entities calculated with the collision kernel given by Chan and Mozurkewich (2001). The heterogenous uptake of HNO3 and organic acids by the growing particles is not included in the simulations since they constitute only a minor fraction of particle composition in Beijing according to our previous measurements (Li et al., 2022). More volatile organics may react in the particle phase to form low-volatility products and promote particle growth (Heitto et al., 2022); this process is also not simulated since it is poorly understood. To track the composition of the particles, each section is further divided into subsections, with one subsection recording the mass of SAxDMAy and the other subsections recording the mass of the organic components with different volatilities. Particles in each section are assumed to be internally mixed; i.e., all particles within the same section have the same composition. As a result, when particles coagulate, the chemical composition of the coalesced particles are averaged out by all particles in the section in which they are located.
In the simulation of particle condensational growth, the model treats SAxDMAy as non-evaporative, which means that once these clusters condense onto the particles, they do not transfer back into the gas phase. In contrast, to simulate OOM condensation, the organic vapors are classified into nine volatility bins, with log 10C∗ ranging from −8 to 0 (C∗ is the saturation vapor concentration in units of µg m−3). Vapors that have higher volatilities are not included since they are not supposed to condense on the freshly formed nanoparticles (Qiao et al., 2021). All vapors that have lower volatilities are classified into the volatility bin. Extending the number of volatility bins to 11 with –0 does not affect the simulation results (Fig. S6 in the Supplement). Evaporation rates of OOMs are calculated with their estimated vapor pressures (Qiao et al., 2021), the ambient temperature, and their molar fraction in the particle, with the Kelvin effect included in the calculation. The sum of condensation and evaporation rates of SAxDMAy and OOMs determines the net mass growth rate of the particles, which is given by
where mp is the particle mass, mp,i is the mass of species i in the particle, mi is the mass of the i molecules, α is the accommodation coefficient (assumed to be 1 for all species), βi is the collision constant of species i with the particle, and Ei is the evaporation rate of species i from the particle. Ei is calculated by
where Ni,sat is the saturation concentration of species i, vi is the molecular volume, σ is the surface tension of the particle (assumed to be 0.023 N m−1 for all particles; Tröstl et al., 2016), dp is the particle diameter, kB is the Boltzmann constant, T is the ambient temperature, and fi is the molar fraction of species i in the particle. The exponential term in Eq. (2) represents the Kelvin effect. Particle mass change causes the particles to migrate across sections. Both particle number and mass concentrations are conserved during transfer of particles across sections using the method given by Warren and Seinfeld (1985; Li and Cai, 2020).
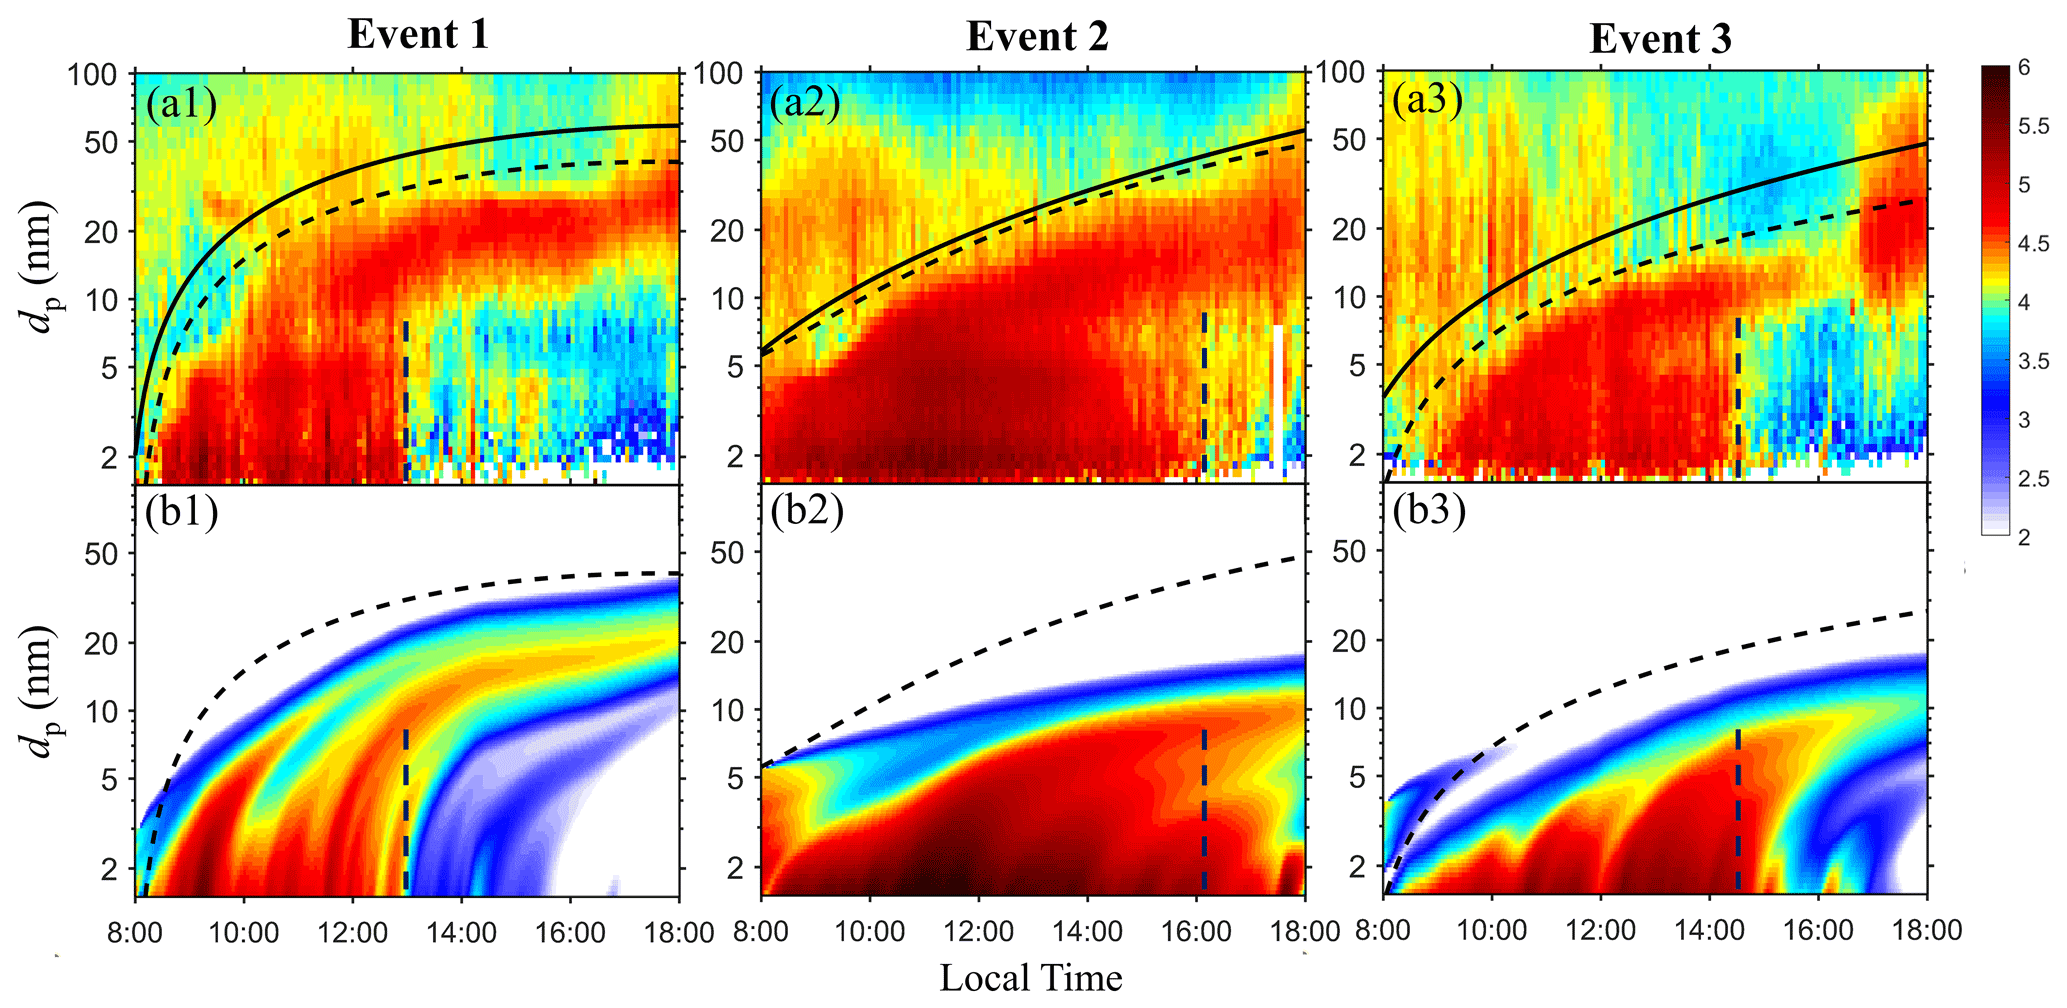
Figure 2Comparison between the observed and the simulated PSDs in events 1–3. The color bar shows the log 10 values of the particle size distribution ( in units of cm−3). (a) The observed particle size distribution. (b) The simulated particle size distribution. The solid black curves in panels (a1)–(a3) are the variable simulation domain boundaries applied in the simulation (see Sect. 2.1). Two additional visual guides are also plotted to facilitate the simulation–observation comparison. The vertical dashed lines approximately mark the end of the observed NPF, and the dashed black curves are reference curves which mark the upper boundary of the observed PSDs.
Since this work focuses on new particle formation and growth, we apply a variable simulation domain in the particle size space as a function of time to exclude simulating particles that apparently do not originate from the occurring NPF event. This is done by first picking 10–20 time-size points in the pseudo color plots of the measured PSD (i.e., Fig. 2a). These points are above the upper end of particle size distribution originated from NPF by some margins. A second-order polynomial is used to fit these points, i.e., to obtain the particle size as a function of time. The fitted polynomial is subsequently used to calculate the simulation boundary at a given time in the simulations. A variable simulation domain helps reduce the computational cost of the simulation and allows us to focus on NPFG itself rather than the evolution of pre-existing particles or large primary particles. The condensation, evaporation, and coagulation of the particles within the simulation domain are treated explicitly with the methods outlined above, while the particles outside the simulation domain collectively serve as the coagulation sink (CoagS) for the clusters and the particles inside the domain. The CoagS is calculated with the Fuchs equation (Kulmala et al., 2001; Fuchs, 1964).
The differential equations of all simulated variables are solved with the MATLAB ode23tb solver. Simulations are conducted in 5 min intervals, corresponding to the resolution of the field measurements. At the start of each interval, the ambient temperature and SA, DMA, and OOM concentrations are updated to the observed values and are held constant during this interval. Additionally, the collision and evaporation rate constants are updated if the ambient temperature differs from the previous update by 1 K, which ensures that the influence of ambient temperature variation on the rate constants is timely reflected in the simulation. Simulation results at the end of one interval are used as the initial condition for the next interval.
2.2 Field measurement and selected NPF events
The measurement data used in this work were obtained from the ambient observation between 1 October to 31 December 2018 at the AHL/BUCT station. The station is located on the fifth floor of a teaching building in the west campus of Beijing University of Chemical Technology (39∘94′ N, 116∘30′ E), which is a typical urban site with three traffic roads and residential buildings nearby within a few hundred of meters (Liu et al., 2020). State-of-the-art instruments were deployed to measure the key parameters for new particle formation and growth. Specifically, the concentration of H2SO4 and OOMs was measured with a chemical ionization high-resolution time-of-flight mass spectrometer (HToF-CIMS; Aerodyne Research Inc. and Tofwerk AG) using the nitrate ion and its clusters ((HNO3)0–2NO) as the reagent ions. To quantify H2SO4 and OOM concentrations, the H2SO4 sensitivity and -dependent transmission efficiency of the HToF-CIMS were calibrated using published methods (Kürten et al., 2012; Heinritzi et al., 2016). The saturation vapor pressure of OOMs was estimated using the parameterization method in our previous study (Qiao et al., 2021). The concentrations of amines were measured using a modified HToF-CIMS with H3O+ and its clusters as the reagent ions (Zheng et al., 2015). The aerosol size distribution ranging from 1 nm to 10 µm was measured using a diethylene glycol scanning mobility particle spectrometer (DEG-SMPS; 1–7.5 nm) (Jiang et al., 2011; Cai et al., 2017) combined with a 3 nm–10 µm particle size spectrometer (Liu et al., 2016). More details of the instrument operation, calibration, and quantification of gaseous species and particles can be found in our previous studies (Cai et al., 2021b; Qiao et al., 2021; Yin et al., 2021; Yan et al., 2021).
Table 1Case numbers, dates, the concentrations of SA and C2 amine (assumed to be equal to the DMA concentration in this work), the condensation sink of SA1DMA1, the temperature, and the RH for the seven selected NPF events. Note that the concentrations, CS, temperature, and RH are the average values between 08:00 and 18:00 BJT on each event day.
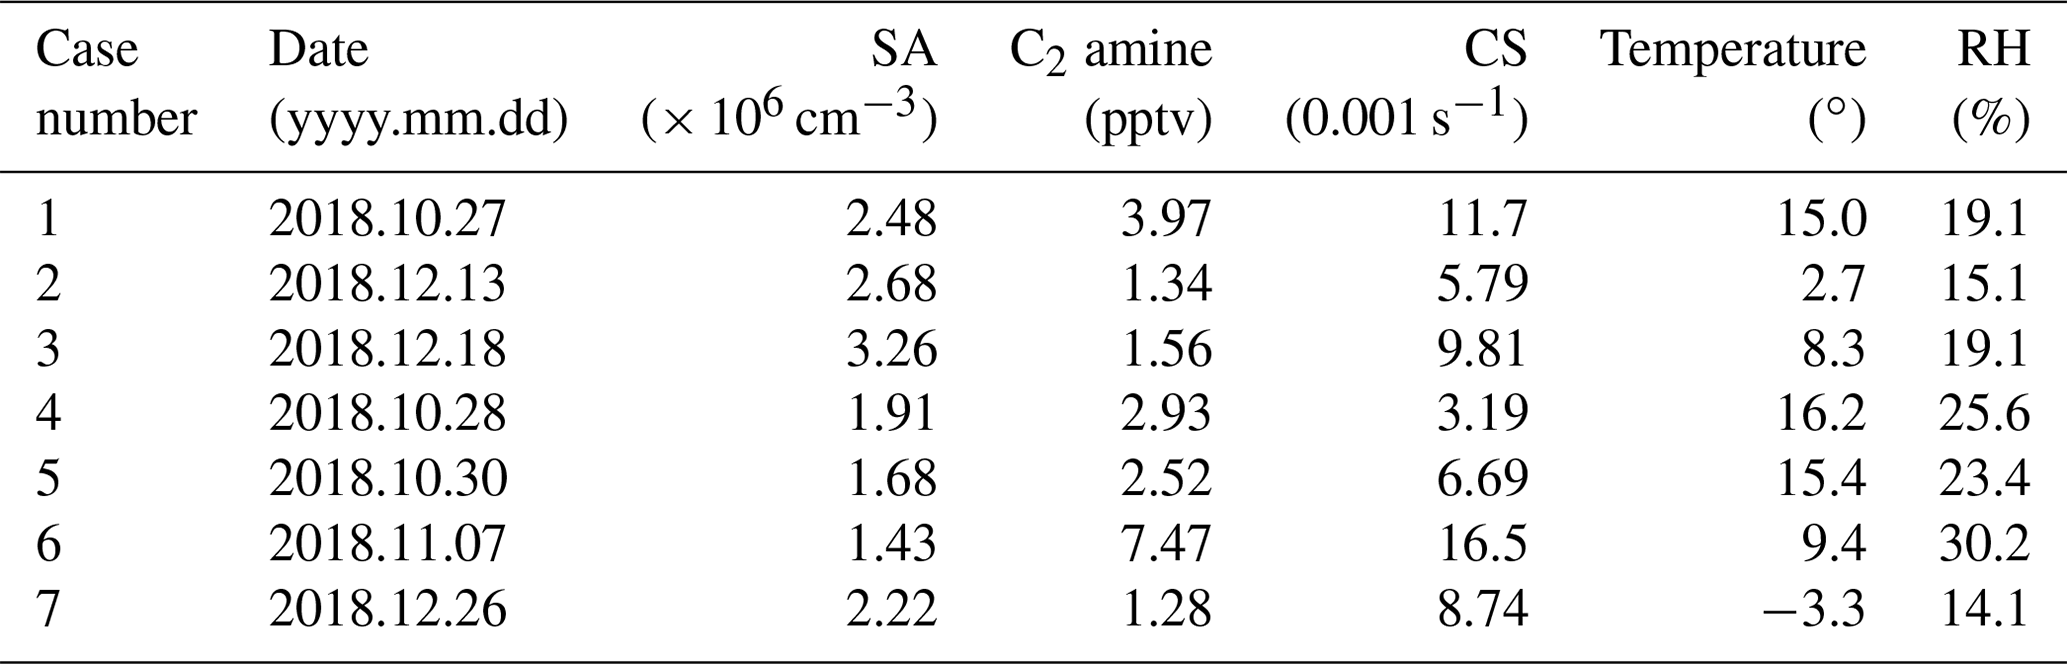
We selected seven NPF events for analysis based on the availability of measurement data, i.e., of meteorological conditions; the PSD; and the concentrations of SA, DMA, and OOMs. The average temperature and RH, SA, and DMA concentrations between 08:00–18:00 Beijing time (BJT, UTC+8) on the 7 event days are summarized in Table 1. Out of the seven events, new particle formation and growth were “fully developed” during events 1–3. In these events, new particle formation was observed with high sub-3 nm particle number concentrations, and the particles grew smoothly during most of the event without abrupt changes (as shown in Fig. 2a). In contrast, during events 4–7 (Fig. S1a in the Supplement) NPFG seems to be partially influenced by air mass transport or primary particle emissions (as indicated by the sudden disappearance of grown particles at ∼ 14:30 BJT in event 4 and the sudden appearance of ∼ 5 nm particles at ∼ 09:30 BJT in event 5), or sustained particle growth were not observed (events 6 and 7). Since events 1–3 offer the most comprehensive data for comparison with the simulations, in this work the quantitative discussions are focused on events 1–3, but simulation results for events 4–7 are also presented in the Supplement for completeness.
2.3 Simulations conducted and comparison metrics
With the numerical model we conduct three types of simulations for the selected NPF events. The first type of simulation is the base simulation, in which the input concentrations of SA, DMA, and OOMs and CoagS to the model are the same as observed. The second type of simulation is the improved simulation, in which we modulate model inputs to improve simulation–observation agreement. The third type of simulation is what we refer to as 5+ simulation (see the Supplement). In the 5+ simulation, we only simulate particle growth above 5 nm, using the observed PSDs below 5 nm as model inputs; this type of simulation is conducted for diagnostic purposes.
In the comparison of the simulation and the observation, we focus on the metrics listed in Appendix A. Brief descriptions of these metrics are given in Appendix A.
2.4 Sensitivity analysis
We perform sensitivity tests to understand the model response to input variations as well as to diagnose the cause for simulation–observation discrepancies. In the sensitivity analysis, one of the model inputs, i.e., the SA, DMA, and OOM concentrations and the CoagS, is scaled by a factor on top of the base simulations, while the rest remain unchanged. The scaling factors are from 0.5 to 1.5 for SA, DMA, and CoagS, while the OOM concentrations are scaled by factors from 0.2 to 5. The range 0.5–1.5 is a conservative estimate of the SA and DMA measurement uncertainties (Cai et al., 2021b), while the range 0.2–5 covers the OOM concentration scaling factors applied in the improved simulations and overlaps with scaling factors used in previous investigations of OOMs' contribution to particle growth (Yan et al., 2022; Tröstl et al., 2016).
As the model inputs are varied, we select four metrics in Appendix A to quantify the model response. The four metrics are , , , and . Physically, these four quantities represent the average simulated NPF rate, the particle number concentration, the average particle survival probability, and the average mode diameter normalized by the respective observed values. Because of the normalization, metric values close to unity indicate good agreement between the simulation and the observation.
3.1 Base simulations
Figure 2 shows the observed and simulated PSDs from 1.5 to 100 nm for events 1–3. For all the three events, the simulation exhibits an overall resemblance to the observation in terms of the PSD shape as well as the timing of NPF. Through visual inspection, intense NPF was observed between 08:00–13:00, 08:00–16:00, and 09:00–14:30 BJT during events 1–3, respectively (Fig. 2a). Despite the high coagulation sink on these event days (Table 1), the simulations predict that NPF occurs between 08:00–13:00, 08:00–17:30, and 09:00–15:30 BJT, respectively (Fig. 2b). In event 1, the simulated NPF timing is a perfect match with the observation; in events 2 and 3, the simulation slightly overestimates the NPF duration. The PSDs for events 4–7 are shown in Fig. S1. For events 4 and 5, the simulated NPF time window largely overlaps with the observation, although the discrepancies between simulated and observed PSDs seem larger than those of events 1–3, possibly due to processes not considered in the model (i.e., air mass transport or primary particle emissions); for events 6 and 7, both the observation and the simulation show new particle formation without sustained particle growth.
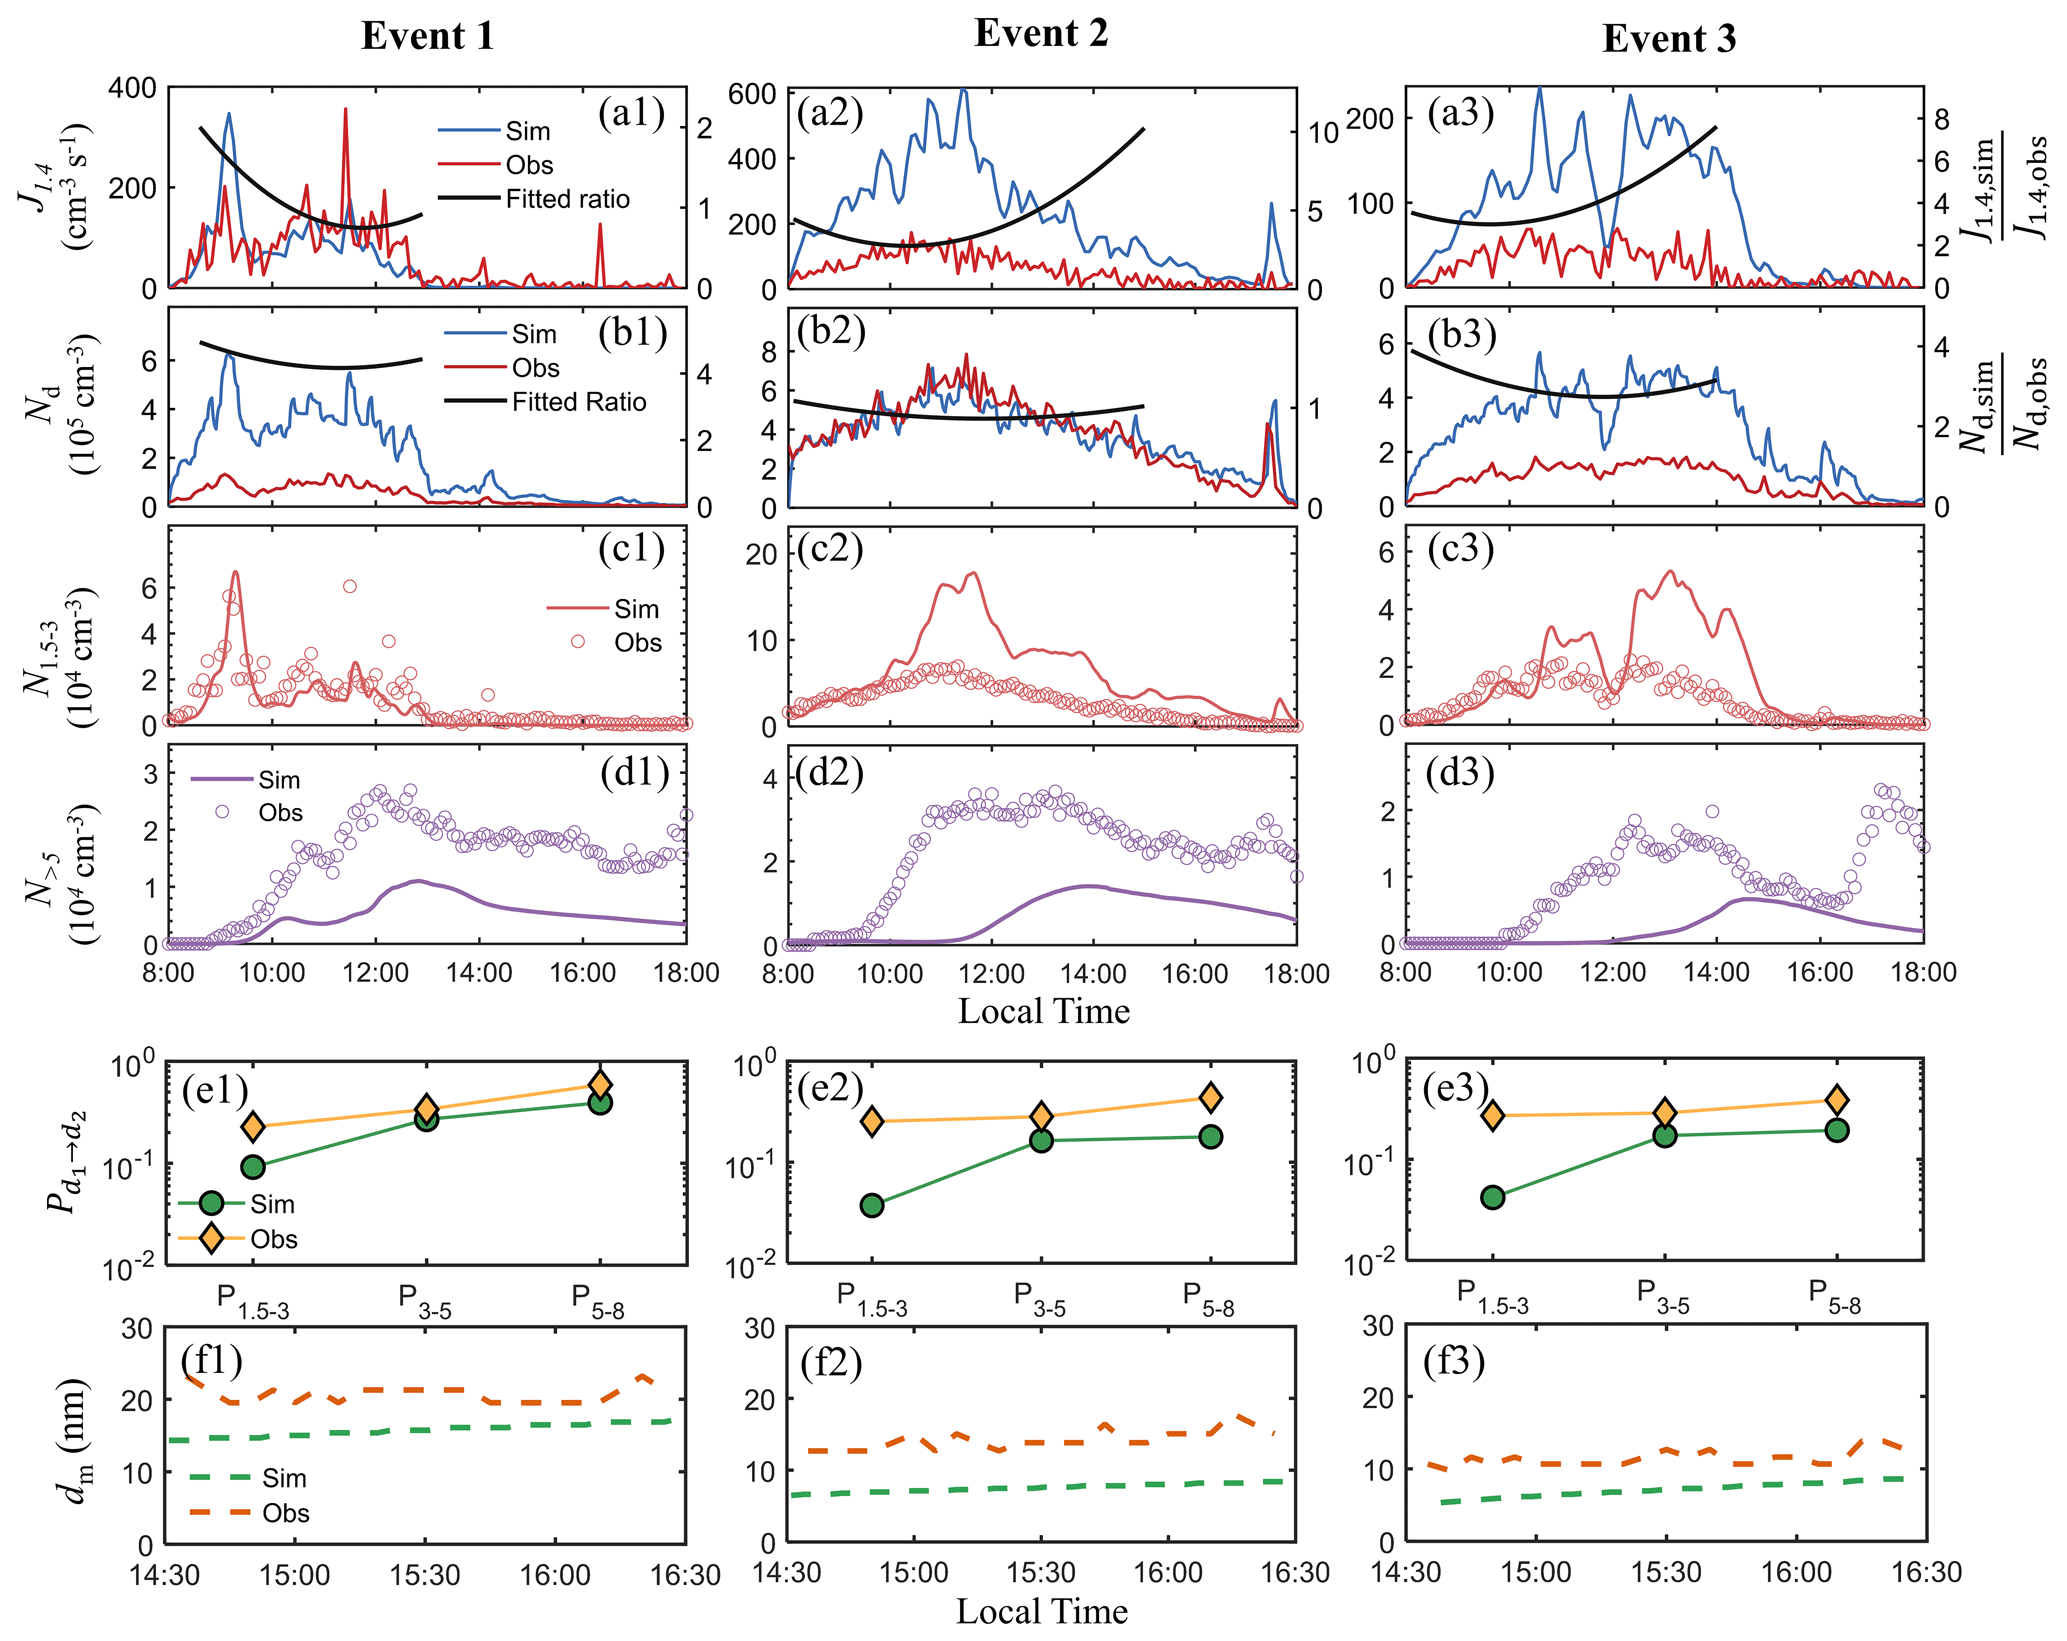
Figure 3(a) The simulated NPF rates J1.4,sim, the observed NPF rates J1.4,obs (left axis), and their ratios fitted to second-order polynomials (right axis). (b) The simulated SA dimer concentration Nd,sim, the observed SA dimer concentration Nd,obs (left axis), and their ratios fitted to second-order polynomials (right axis). (c, d) The simulated and observed particle number concentrations between 1.5–3 nm and between 5 nm and the reference curves (see Fig. 2). (e) The simulated and the observed particle survival probability from 1.5 to 3 nm (P1.5–3), from 3 to 5 nm (P3–5), and from 5 to 8 nm (P5–8). (f) The simulated and the observed mode diameters between 14:30 and 16:30 BJT.
We next quantitatively compare the simulation and the observation with respect to the NPF rates, the SA dimer concentration, the particle number concentration, the particle survival probability, and the particle mode diameter. Figure 3a compares the simulated and observed NPF rates at an electrical mobility diameter of 1.4 nm for events 1–3. Figure 3a shows that the simulated rates differ from the observation to various extents. In event 1, the simulated and the observed rates are very close, with a value of between 0.8 and 2; in events 2 and 3, lies within 3–10 and 3–8, respectively. Considering the high uncertainties of both NPF rate measurement and modeling, the agreement of J1.4,sim and J1.4,obs is fair, and their discrepancies are within the ranges reported by previous works which compared simulated and observed NPF rates (Cai et al., 2021b; Jen et al., 2014; Kürten et al., 2018). Figure 3b compares the simulated and the observed SA dimer concentrations. The ratio lies in the range of 4–5, 0.9–1.1, and 2–4 for events 1–3, respectively, which are also within ranges reported by our previous work on NPF rates in urban Beijing (Cai et al., 2021b).
Figure 3c–d compare the simulated and observed particle number concentrations in the size range 1.5–3 nm (N1.5–3) and between 5 nm and the reference curve (N>5), respectively. The simulated N1.5–3 is similar to or higher than the observation (Fig. 3c), but the simulated N>5 is lower than the observation (Fig. 3d). This flip of order means that a higher percentage of particles are lost during growth in the simulation than in the observation. Figure 3e quantitatively compares the simulated and observed particle survival probability from 1.5 to 3 nm, from 3 to 5 nm, and from 5 to 8 nm. The simulated particle survival probability is lower than the observation for all the three events, but the underestimation is less an order of magnitude. A few previous works have discussed new particle survival in Beijing (Kulmala et al., 2017; Tuovinen et al., 2022; Cai et al., 2022b). Kulmala et al. (2017) showed that for sub-3 nm particles, the theoretical survival probability could be several orders of magnitude lower than the observation in polluted megacities; more recently, Tuovinen et al. (2022) showed that for Beijing this discrepancy can be smaller but is still 1–2 orders of magnitude at high CS GR (GR stands for growth rate) conditions. In this context, the disagreement of the simulation and the observation is not large although there is room for improvement. Since particle survival probability is mainly governed by GR CoagS, the lower simulated particle survival probabilities suggest underestimated GR, overestimated CoagS, or both in the simulation (Kerminen and Kulmala, 2002; Cai et al., 2022b).
In terms of the mode diameter dm, Fig. 3f compares the simulated and the observed dm between 14:30 and 16:30 BJT, during which the mode diameter is clearly identifiable. The dm after 16:30 BJT is not considered because in some events the PSDs go through abrupt changes (as shown clearly at 17:00 BJT in Fig. 2a3) with increased particle number concentrations in the mode, possibly attributed to air mass transport, primary particle emissions, or the shrink of the atmospheric boundary layer. Figure 3f shows that the simulated particle mode diameters are a few nanometers smaller than the observation (the averaged difference is 4.9, 6.7, and 4.2 nm for events 1–3, respectively). The smaller simulated dm could indicate low simulated GR but could also be influenced by other factors such as the delayed end of simulated NPF which may shift dm to smaller sizes at a given time (particles formed later in an event have shorter growth time and contribute smaller particles to the mode).
The analysis above suggests that the discrepancy between the simulation and the observation could have convoluted origins. Other than the inaccuracy of the assumed NPFG mechanism (which is beyond the scope of this study), a possible cause for the discrepancy is that the model inputs, i.e., the concentrations of SA, DMA, and OOMs and the CoagS, deviate from their actual values since they are subject to non-negligible measurement uncertainties (Cai et al., 2021b; Qiao et al., 2021). To further pinpoint the cause for the discrepancy, we next tune the simulation inputs systematically to understand the model response to input variations.
3.2 Sensitivity analysis
Figure 4 shows the response of , , , and (see Appendix A) to variations of model inputs for event 1. We remind the readers that , , , and are the average NPF rates, the average > 5 nm particle number concentrations, the particle survival probability from 3 to 5 nm, and the average mode diameter normalized by the observed values, respectively. Similar plots for events 2 and 3 are shown in Fig. S2 in the Supplement.
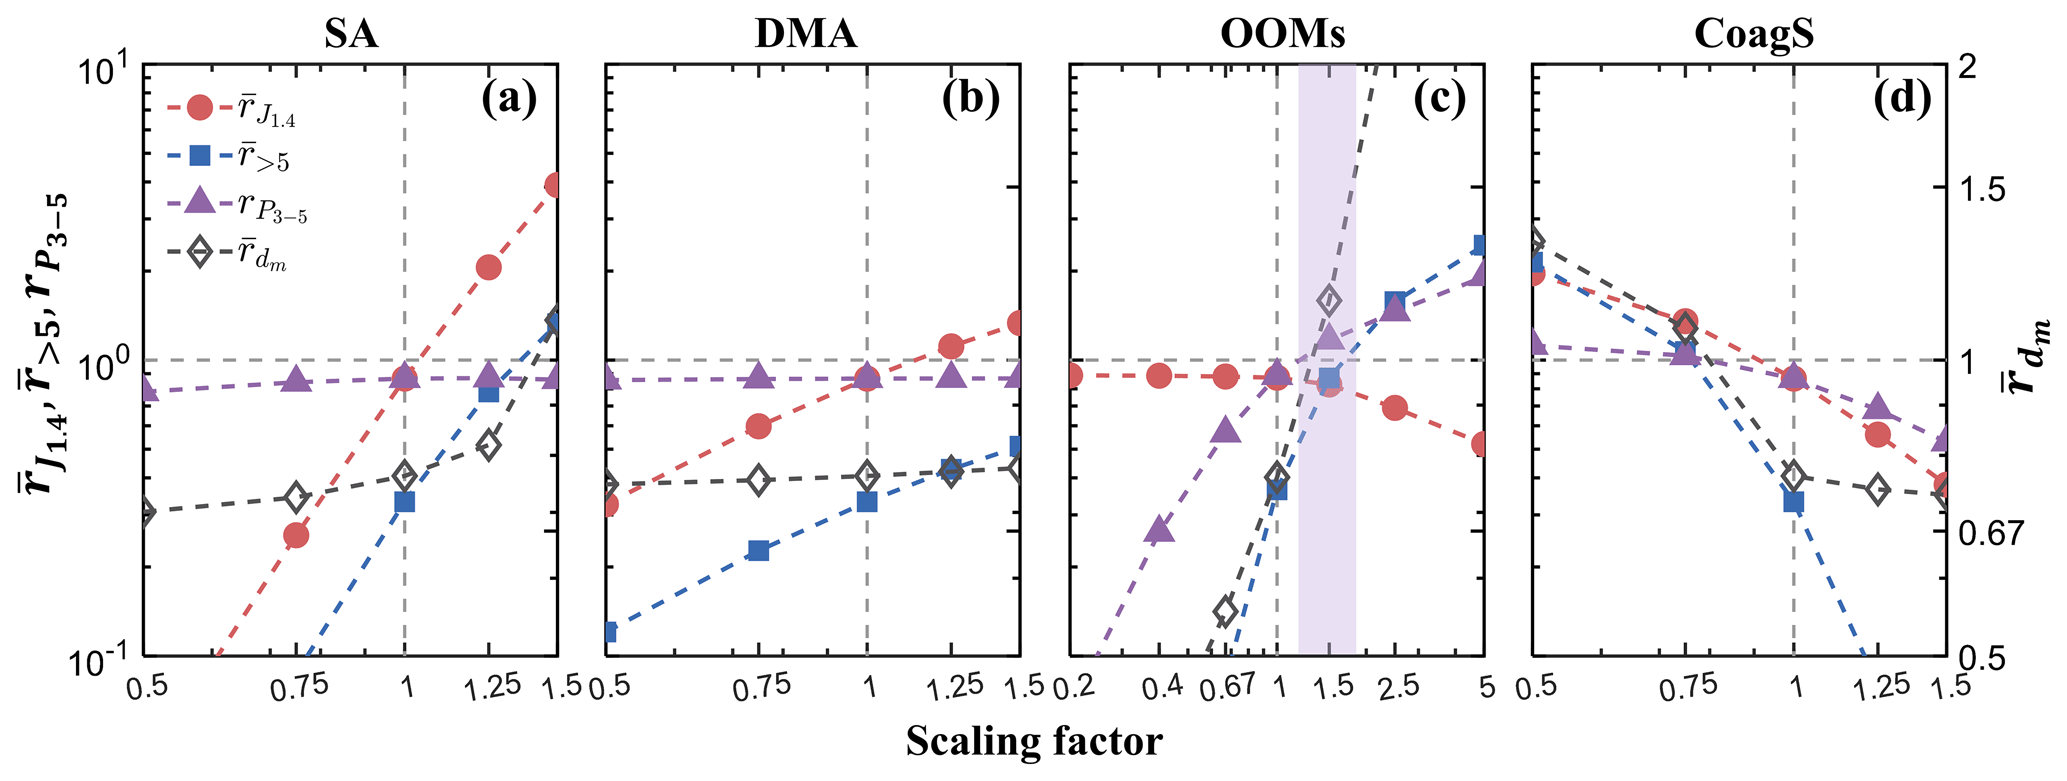
Figure 4The sensitivity of , , , and (see Table 2 for explanations of these quantities) to the scaling of SA, DMA, and OOM concentrations and the CoagS for event 1. In the calculation, and were calculated with values averaged from 08:00 to 18:00 BJT, while was calculated with values averaged between 14:30 and 16:30 BJT. , , and correspond to the left y axis, and corresponds to the right y axis. Two reference lines are shown to aid visualization: the horizontal dashed line corresponds to a ratio of unity, while the vertical dashed line corresponds to the base simulation condition. The purple shade in (c) approximately includes the OOM scaling factors which lead to the convergence of the sensitivity curves.
Figure 4a indicates that and increase substantially as SA concentration increases, with variations of SA by ±50 % leading to changes of and by 1–2 orders of magnitude. The high sensitivity of and with respect to the SA concentration is expected since the NPF rate is a strong function of SA concentrations in polluted regions with high CoagS (Cai et al., 2021b). In contrast to and the particle survival probability is a weak function of SA when it is scaled between 0.5–1.5. The weak dependence occurs for two reasons. First, compared to OOMs, SA is a minor contributor to particle growth in event 1 (shown later in Sect. 3.4); hence its variation within a modest range does not strongly influence GR Coag. Second, higher SA concentrations lead to higher particle number concentrations as well as particle number consumptions by coagulation. Consequently, as the SA concentration increases, the coagulational loss of particle numbers partially offsets the effect of higher GR on survival probability. Figure 4a lastly shows that is more sensitive to SA at higher SA concentration, which means the mode diameter is more affected by SA variations when SA is a more important contributor to particle growth.
Figure 4b shows that, compared with SA, increasing DMA concentration has a modest effect on and . The weaker dependency is explained by the overall weaker dependence of the NPF rates on DMA concentration during NPF events in Beijing (Cai et al., 2021b). The DMA concentration barely influences and because DMA does not directly participate in particle growth.
Figure 4c shows that as the OOM concentration increases, decreases slightly, but , , and increase considerably. Increasing OOM concentration can significantly promote particle growth in event 1 as OOMs are the main contributors to particle growth in this event (shown later in Sect. 3.4). Consequently, decreases as OOMs increase the surface areas of particles which scavenge SAxDMAy clusters and suppress NPF. Simultaneously, higher OOMs lead to higher GR and GR CoagS which increases , , and . Interestingly, the scaling of OOM concentration has a converging effect on the sensitivity curves towards unity in the vicinity of 1.5 (shaded in purple) in Fig. 4c, corresponding to a good agreement of the four selected metrics. A similar converging effect on , and by OOM scaling is also seen in events 2 and 3 with scaling factors of approximately 4 and 2, respectively (Fig. S2 in the Supplement). Such convergence of comparison metrics implies that adjusting OOM concentrations is probably more effective to bring the simulation closer to the observation than adjusting other model input parameters for which similar converging effects are not seen. The difference between the curve-converging scaling factors might be partially caused by the different ambient conditions on the event days; for events 1–3, the scaling factor is larger for colder days (Table 1).
Figure 4d shows the effect of CoagS on the simulation. The increase in CoagS strongly decreases , and because the CoagS frustrates particle formation and survival by scavenging clusters and particles. Although CoagS does not directly affect the particle growth rate, becomes large at low CoagS values. This occurs due to enhanced coagulational growth as low CoagS leads to high particle number concentrations and promotes particle coagulation. Compared to SA, DMA, and OOMs, the CoagS has a lower measurement uncertainty of 10 % (Cai et al., 2021b); however, in the calculation of the CoagS, including collision enhancement effect by long range interactions (e.g., van der Waals forces) can increase the CoagS by 30 %–40 % (Chan and Mozurkewich, 2001; Cai et al., 2022a). In this work we have used the Fuchs equation to calculate CoagS (Kulmala et al., 2001), which is in line with most of the previous works but does not consider the effect of collision enhancement. Figure 4d suggests that scaling CoagS by a factor of 1.3–1.4 significantly decreases particle number concentrations and worsens the agreement between the simulation and the observation. With the limited number of NPF events examined in this work, it is difficult to conclude on the appropriate functional form of the CoagS for simulating NPF events.
We note that at a CoagS scaling factor of 0.75, the selected metrics also converge to ∼ 1 in Fig. 4d, suggesting adjusting CoagS could narrow the gap between the simulation and the observation for event 1 (similar to OOM scaling). However, the analysis above suggests it is more likely that the CoagS is underestimated in our simulation due to the neglect of coagulation rate enhancement. Additionally, similar converging effects are not obvious for the other two events (Fig. S2). Therefore, the convergence shown in Fig. 4d is likely to be fortuitous.
Overall, Fig. 4 demonstrates that the simulation is sensitive to the model input parameters, which implies that if systematic errors exist in measurements, albeit moderate and unavoidable from the perspective of measurement (e.g., an ±50 % uncertainty in condensable concentrations), the simulated quantities could change by more than an order of magnitude. Figures 4 and S2 also reveal that the OOMs are somewhat unique among the inputs because scaling their concentration to higher values leads to the convergence of the sensitivity curves. This hints that it is possible that the organic condensable vapors were under-detected during the field observations.
In a previous work (Qiao et al., 2021) we have shown with single-particle growth simulations that the condensation of SAxDMAy and OOMs can (on average) explain the particle growth in spring, summer, and autumn in Beijing during 2018–2019 but is insufficient to explain the particle growth in winter (events 2 and 3 occurred in winter). The low simulated particle growth in winter was tentatively attributed to the observed condensable organic vapor concentration being systematically biased low at low temperatures or heterogeneous growth processes (e.g., oligomerization) being neglected (Qiao et al., 2021). Additionally, it has been shown that the nitrate chemical-ionization–atmospheric pressure interface–time-of-flight mass spectrometer (CI-APi-ToF) is mainly sensitive to highly oxygenated organic molecules (oxygen number > 5); thus it may underestimate low and semi volatility organic compounds due to the lower ionization efficiencies (Riva et al., 2019; Hyttinen et al., 2015). Scaling their concentration accounting for the weaker ionization efficiency can effectively improve the growth simulation (Tröstl et al., 2016). Based on the probably under-detected condensable vapor concentrations suggested by these previous works as well as the converging effect of OOM scaling in the sensitivity analysis, we next adjust the OOM concentration in the simulation to modulate particle growth, with the goal to improve the simulation–observation agreement. Note that although heterogeneous processes are not considered in the simulation (mainly because these processes in the newly formed particles are poorly understood with highly uncertain rate constants; Kolesar et al., 2015; Roldin et al., 2014; Yao et al., 2022), OOM concentration amplification may have similar enhancing effects on particle growth as incorporating heterogeneous reactions which leads to the formation of low-volatility products.
3.3 Simulations with improved parameters
OOM concentrations were adjusted on top of the base simulations so that the simulated and the observed particle mode diameters agree between 16:00–16:30 BJT. We refer to the simulations with OOM concentration adjustment as the improved simulations. Figure 5 compares the improved simulations with the observations for events 1–3, while Fig. S3 shows the comparison for events 4–5. For events 6–7 the OOM concentration was not adjusted since well-defined mode diameters do not exist in these short-lived NPF events.
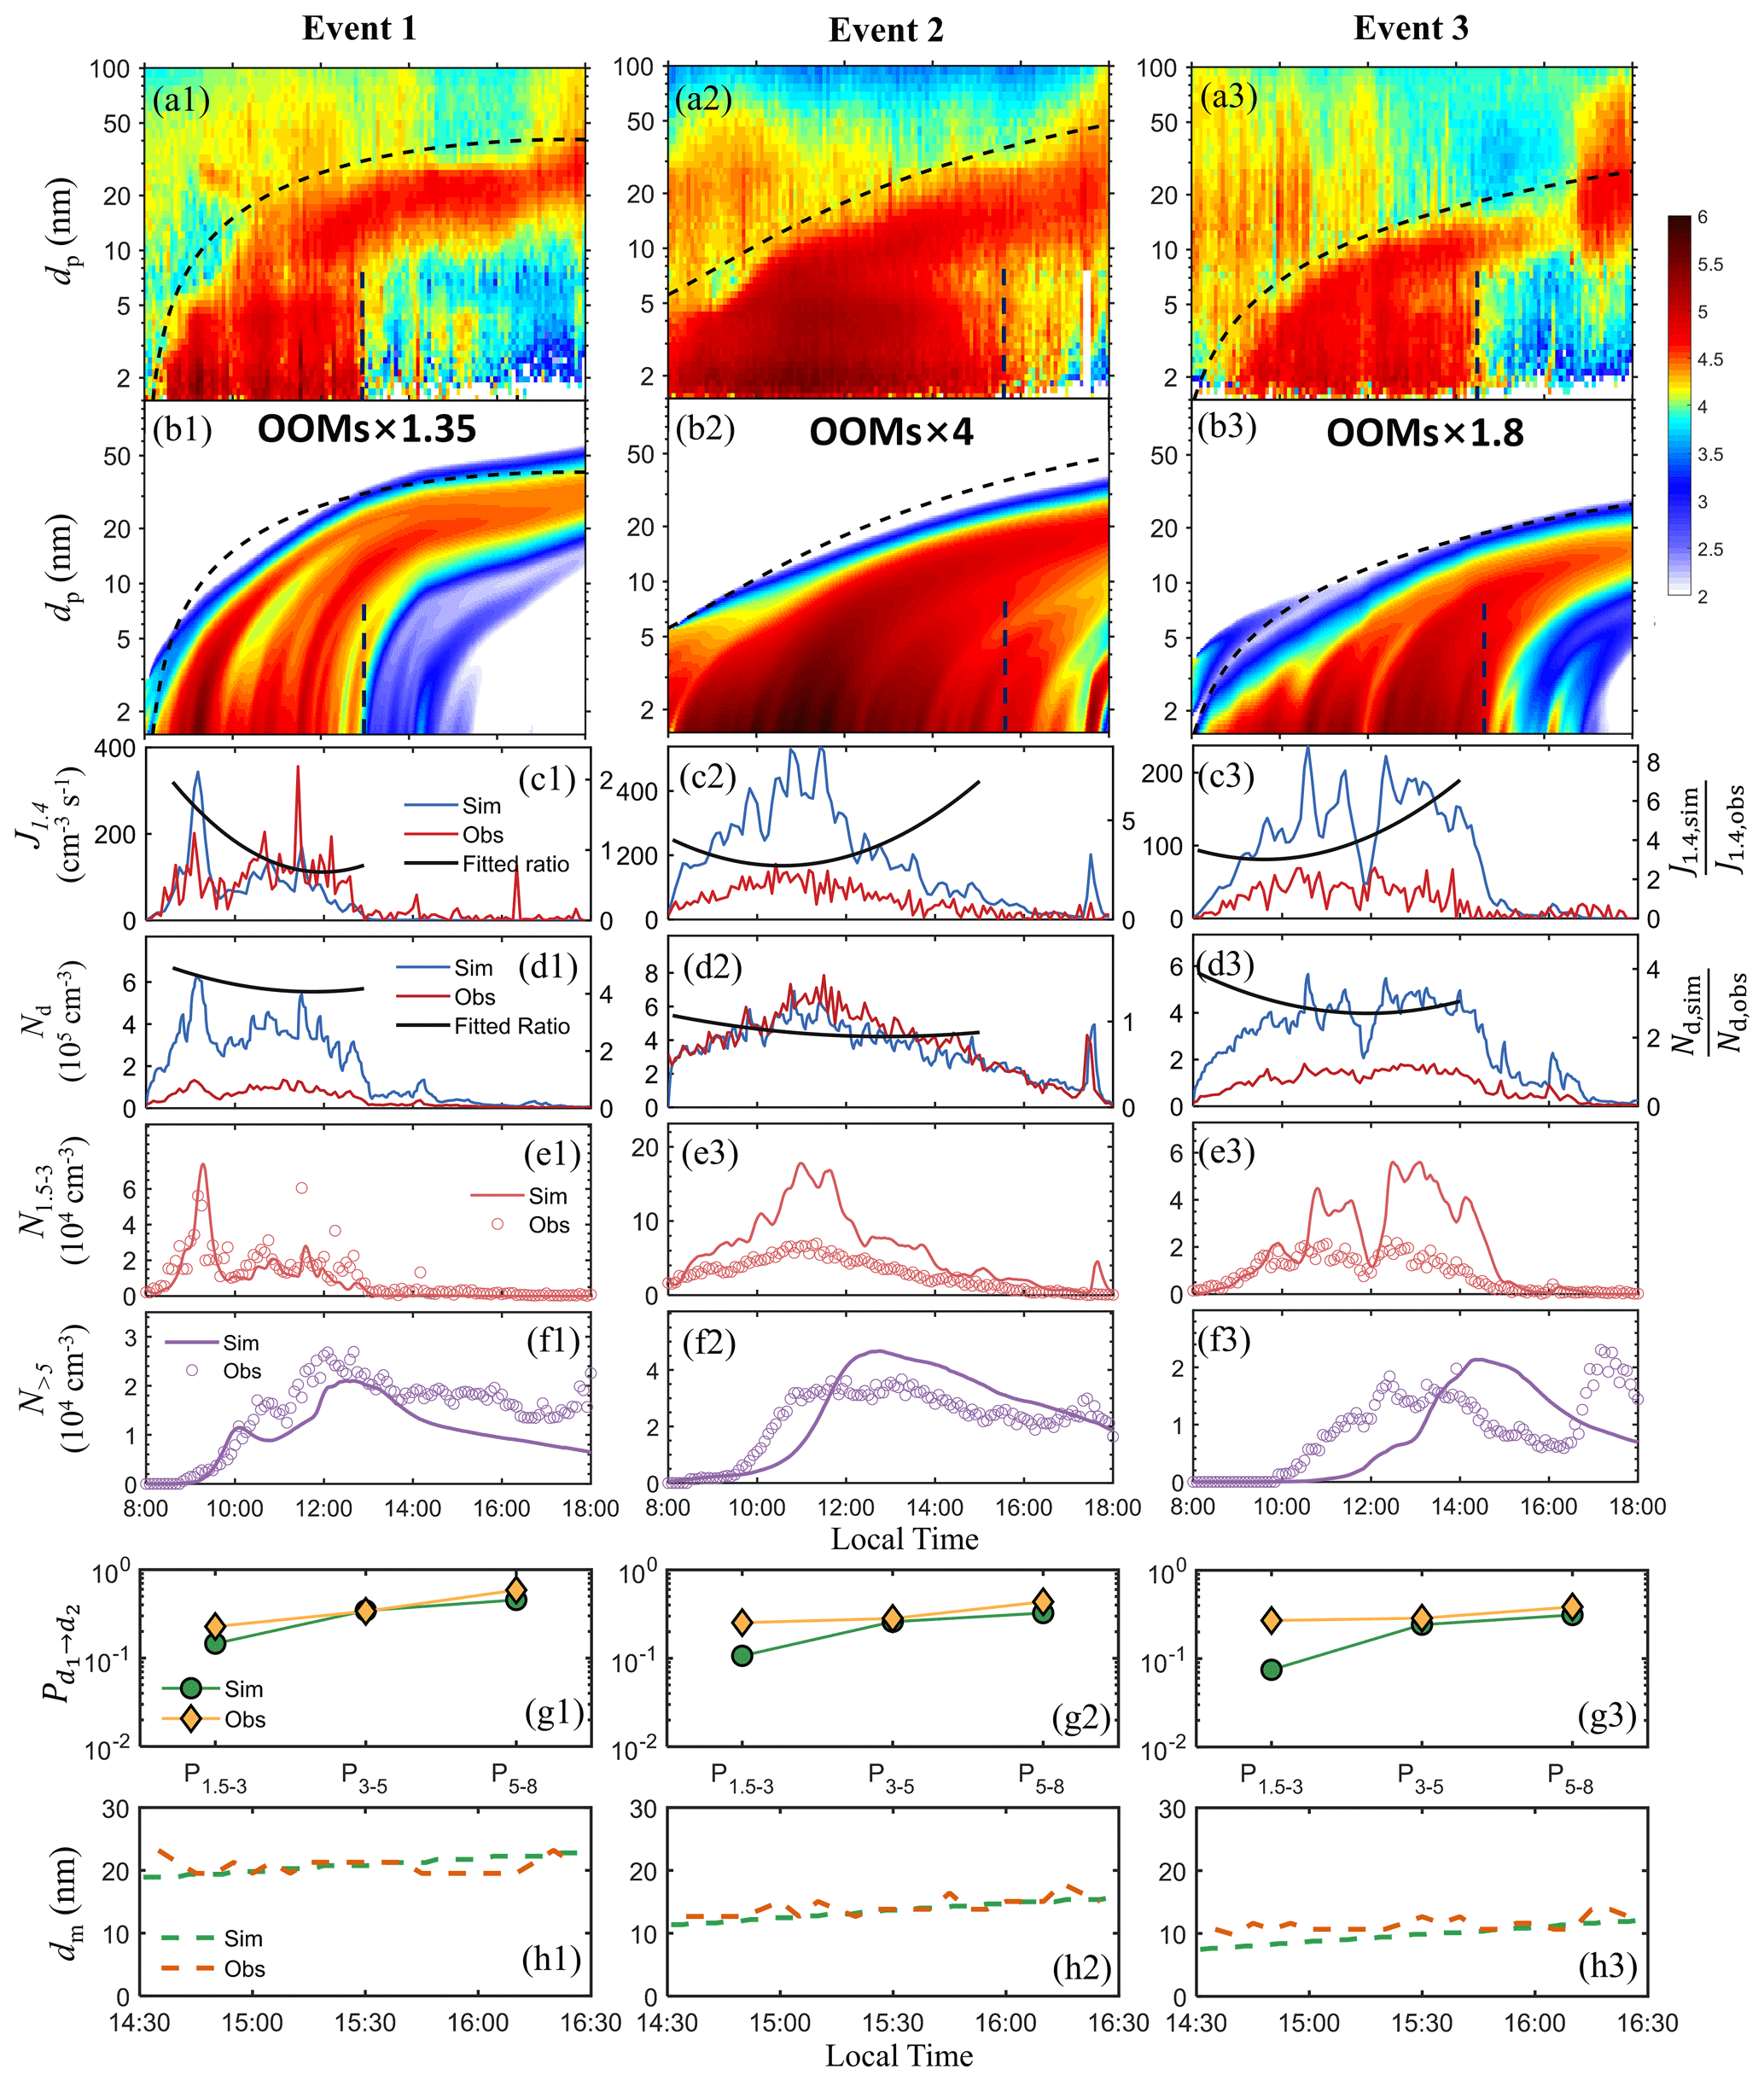
Figure 5(a) The observed particle size distribution. (b) The simulated particle size distribution. In (a) and (b), the dashed black curves are reference curves that enclose the upper boundary of the observed PSDs which appear to originate from NPF. Vertical dashed lines approximately mark the end of the observed NPF events. (c) The simulated NPF rates J1.4,sim, the observed NPF rates J1.4,obs (left axis), and their ratios fitted to second-order polynomials (right axis). (d) The simulated SA dimer concentration Nd,sim, the observed SA dimer concentration Nd,obs (left axis), and their ratios fitted to second-order polynomials (right axis). (e, f) The simulated and observed particle number concentrations between 1.5–3 nm and between 5 nm and the reference curves. (g) The simulated and the observed particle survival probability from 1.5 to 3 nm, from 3 to 5 nm, and from 5 to 8 nm. (h) The simulated and the observed mode diameters between 14:30 and 16:30 BJT.
Figure 5h shows that the simulated and the observed dm almost overlap in the improved simulations. To achieve this agreement, the OOM concentrations were scaled by factors of 1.35, 4, and 1.8 in events 1–3, respectively. These factors were obtained by fitting the simulated mode diameter to the observation, so these factors are fitting parameters to account for the possible under-detection of OOMs by a nitrate CIMS. After scaling, the average condensable OOM concentration are 4.13×10⁷, 1.12×10⁷, and 1.79×107 cm−3 for events 1–3, respectively. By comparison to Fig. 2 in Qiao et al. (2021), it is clear that even after scaling, these concentrations are within or close to the typical ranges of OOMs observed in Beijing. (Note that the OOM concentrations shown in Fig. 2 of Qiao et al. (2021) are as measured by a nitrate CIMS, i.e., without any scaling.) Comparison of Fig. 5a and b indicates that the improved simulations still roughly capture the timing of NPF and better capture the shape of the PSDs compared to the base simulations. Figure 5c and d show that the NPF rates and the SA dimer concentration in the improved simulations are very close to the base simulations (Fig. 3a and b), which is expected since OOMs do not directly affect new particle formation in the model. Figure 5e and f show that although the simulated N1.5–3 values are close to the base simulations (Fig. 3c), the N>5 in the improved simulation is significantly higher than the base simulation (Fig. 3d) and is closer to the observed values. In terms of the particle survival probability, Fig. 5g indicates that the gap between simulated and observed particle survival probability is narrowed after OOM concentration adjustment, with the simulated and the observed P3–5 and P5–8 almost the same. Apparently, the increase in OOM concentration in the simulation increases GR, which leads to better agreement of the simulated and observed particle survival probability.
Despite the improved agreement, discrepancies between the simulation and the observation still exist. One notable discrepancy is that the simulated P1.5–3 is lower than the observation, in particular for events 2 and 3 (Fig. 5g2 and g3). The low simulated P1.5–3 could be caused by the insufficient simulated GR in the 1.5–3 nm range. Particles in this size range are subject to strong Kelvin effects; hence their growth is mainly subject to the concentration of extremely low-volatility vapors. An underestimation of the concentration of such vapors even in the improved simulations may have led to slow particle growth between 1.5 and 3 nm. Alternatively, an overestimation of the Kelvin effect (which leads to overestimated vapor pressure at the particle surface and hence overestimated evaporation rate) or the neglect of the heterogenous reactions that produce low-volatility products in the particle phase may also cause low simulated GR. Apart from insufficient GR, another plausible explanation for the low simulated P1.5–3 (or the high observed P1.5–3) could be that the particle number concentration in the 1.5–3 nm range is under-detected compared to that in the > 3 nm range, which causes the observed P1.5–3 values to be higher than they really are. Lastly, primary emissions of particles above 3 nm can also elevate the observed P1.5–3 above their real values, which is not considered in the simulation.
A second discrepancy between the simulation and the observation is the delayed rise of the simulated N>5 compared to the observed N>5 for event 2 (by about 1 h) and event 3 (by about 2 h), as shown in f2 and f3 of Fig. 5. To identify the underlying cause for this discrepancy, we conducted 5+ simulations on top of the improved simulations (see Sect. S2). In the 5+ simulations we only simulated particle growth above 5 nm and used the observed sub-5 nm PSDs as model input. As shown in Fig. S4, the N>5 from the 5+ simulations closely follows the observation, which suggests that (a) at the conditions of the improved simulations, the model can describe particle growth and loss of the ≥ 5 nm particles relatively well, and (b) the delay in Fig. 5f largely originates from the inability of the model to reproduce the observed PSD the in the ≤ 5 nm size range. The reason behind this “inability” could be complex. First, it is possible that the freshly formed particles grow too slowly in the sub-5 nm size range to allow ∼ 5 nm particles to appear in time in the simulations. Second, there might be < 5 nm particles formed elsewhere transported to the observation site which offer a starting point for particle growth, leading to the early appearance of > 5 nm particles in the field observations, but such transport of particles is unaccounted for in the simulation. Third, the NPF rates might be underestimated in the simulation at the start of the NPF events but correctly simulated later, which causes an “uneven” appearance of > 5 nm particles. A revisit to Fig. 5c gives a hint of the validity of this hypothesis. The ratio should be lower at the early stage of the events if this hypothesis is correct. As shown in Fig. 5c by the fitted ratios (i.e., the solid black line), is not ostensibly lower at the start of events 2 and 3; hence this hypothesis is unlikely to be the cause of the delay.
To summarize this section, with moderate OOM concentration adjustment, we have been able to narrow the gap between the simulation and the observation in terms of particle number concentration, particle survival probability, and particle mode diameter simultaneously, which implies that the OOM concentrations might have been overall under-detected during field observations and contributed to the disagreement in the base simulations. However, we do not rule out the possibility that the neglect of heterogeneous growth process in the base simulation also contributed to the gap shown in Sect. 3.1; if this is the case, the scaling of OOM concentration could be interpreted as compensation for this missing growth mechanism. We also note that with a combined tuning of multiple model input parameters (i.e., not limited to OOM concentration scaling) or compound-specific OOM scaling (e.g., based on the O C ratio of the compound), even better simulation–observation agreement might be achieved. Here we restrain parameter tuning to uniform OOM concentration adjustment to avoid over-interpreting the simulation results with only a limited number of NPF cases. More systematic investigations to identify the underlying cause for simulation–observation gaps can be facilitated by analyzing a larger NPF dataset with improved OOM measurements.
3.4 Particle compositions
An advantage of the current simulation compared to single-particle growth models is the retrieval of the particle chemical composition for any particle size at any time from the simulations. We next examine (1) particle composition variation as a function of particle size at a fixed time and (2) particle composition variation as a function of time at fixed particle sizes. The former reveals information on the major participants of particle growth at different particle sizes, while the latter is relevant to particle composition field measurements with instruments such as the TDCIMS (Smith et al., 2010; Li et al., 2022).
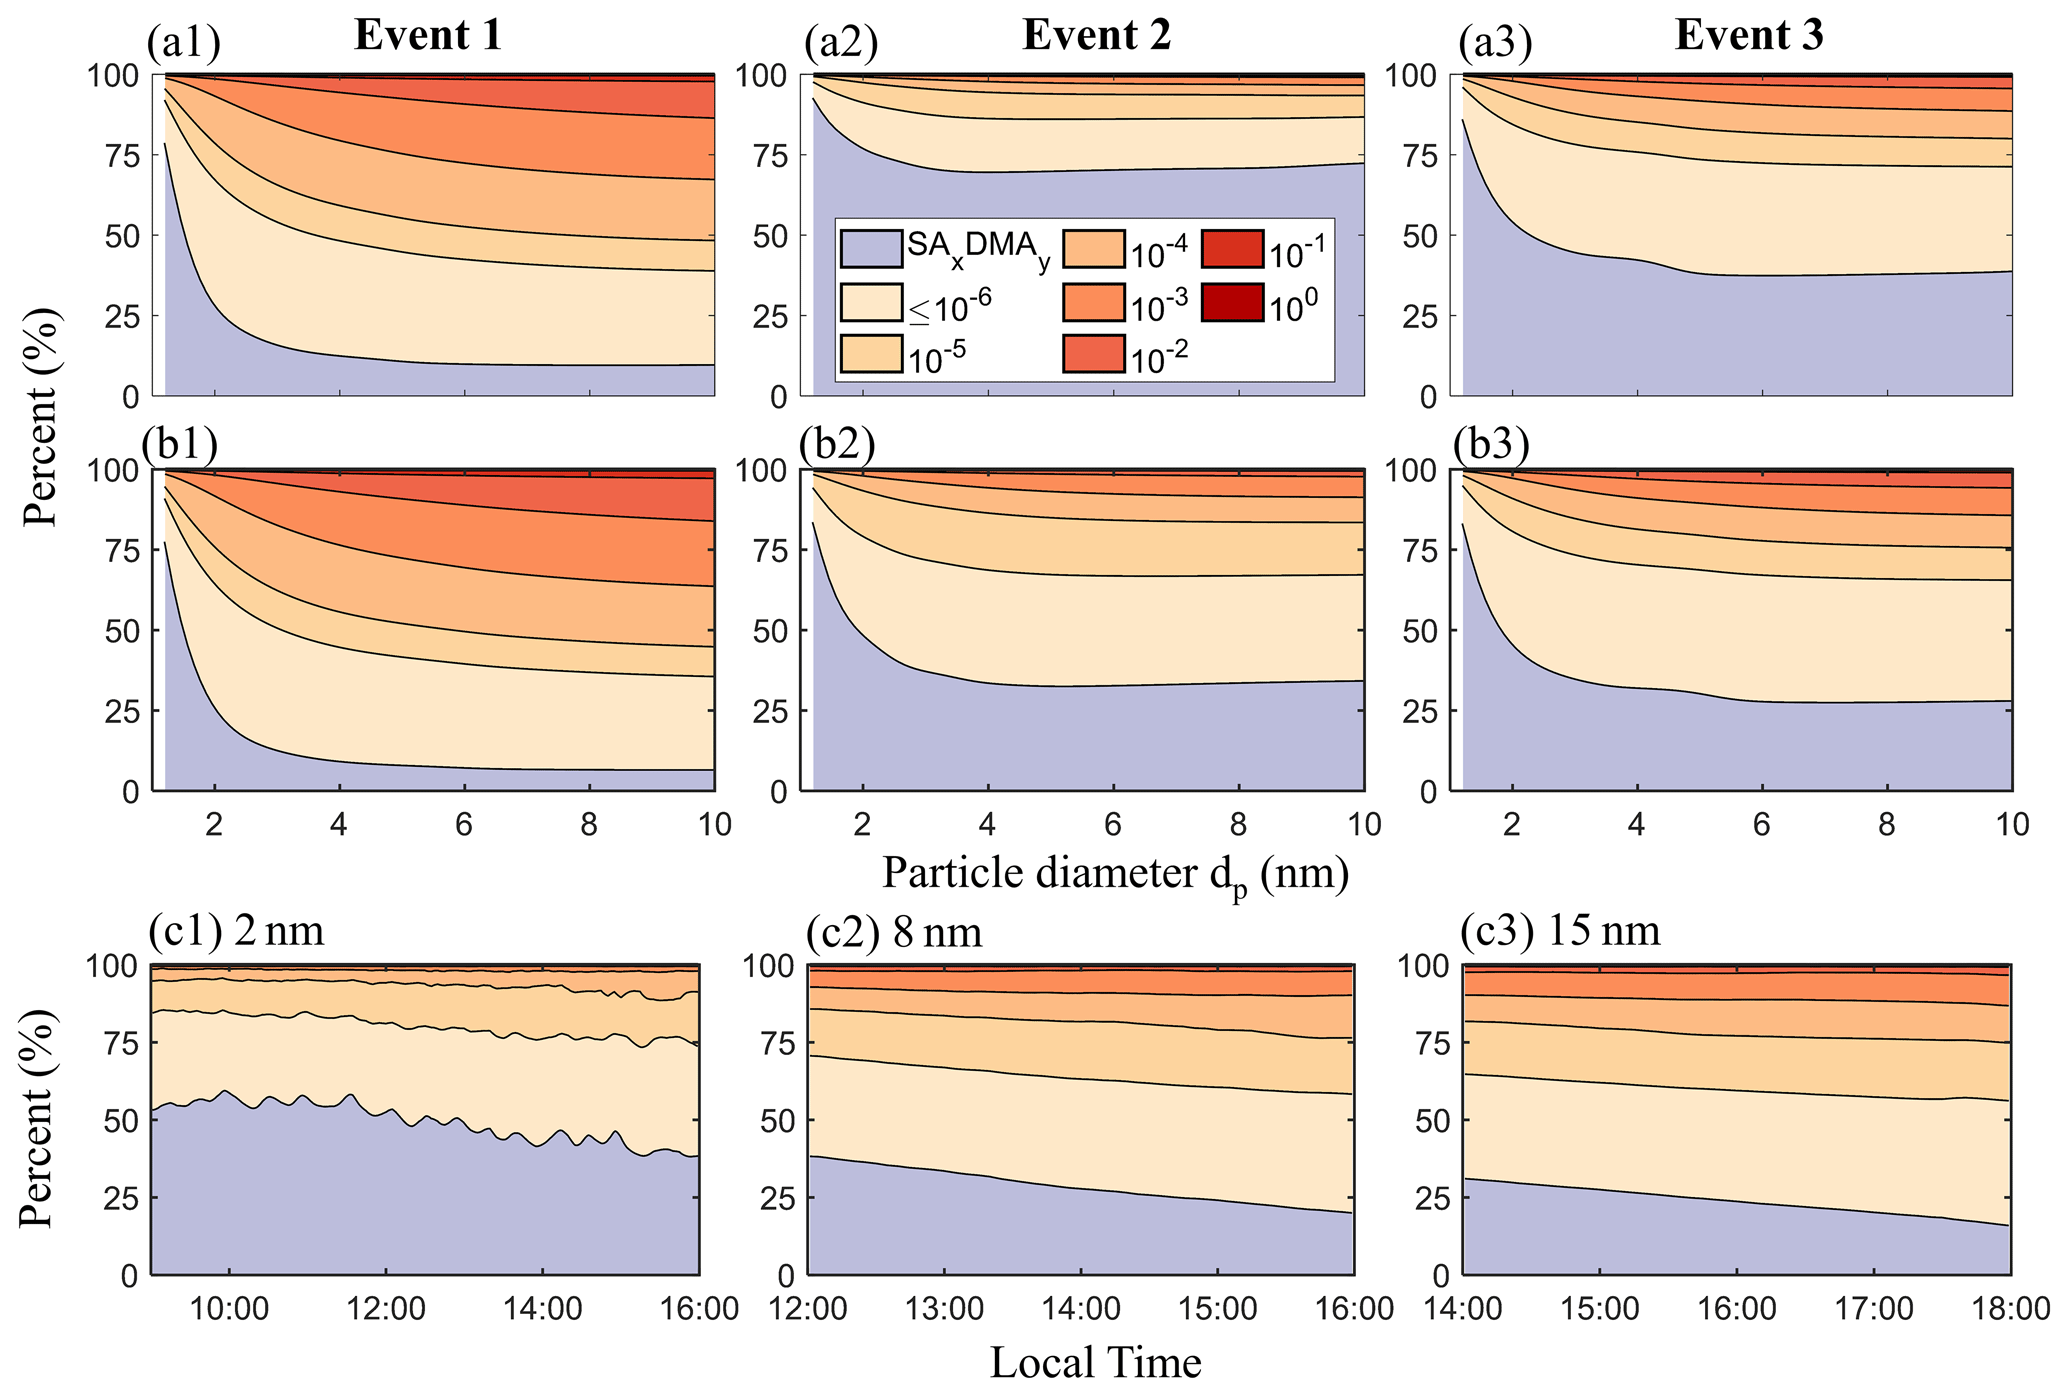
Figure 6(a, b) Composition of the particles smaller than 10 nm at 13:00 BJT for events 1–3. Panels (a) and (b) correspond to the base simulations and the improved simulations, respectively. (c) Particle composition variation with time in event 2 at fixed particle sizes (2, 8, and 15 nm) in the improved simulations. The color–species relation is shown in (a2), where the numbers correspond to the volatility of the organics (in units of µg m−3). Note that the organic species with µg m−3 are binned together and labeled “”.
Figure 6a and b show the simulated particle mass composition as a function of particle size at 13:00 BJT for the base and the improved simulations. For the three events, SAxDMAy dominates the composition of small particles, while OOMs take up higher mass fractions in larger particles, indicating more organics contribute to particle growth as the Kelvin effect decreases with particle size. At small particle sizes (e.g., sub-3 nm) the particle composition varies strongly as a function of particle size, but this variation gradually levels off as the particle size further increases. The nearly constant particle compositions at larger particle sizes indicate that the Kelvin effect itself does not significantly influence particle compositions for above-3 nm particles. This is in agreement with our previous report that the size dependence of particle composition for 8–40 nm new particles is not simply caused by the Kelvin effect but also the variations of precursor concentrations with time (Li et al., 2022). Additionally, the variation of particle composition with particle sizes is not unique to a specific time; the plots of the particle composition at 11:00 BJT have similar trends and are shown in Fig. S5.
OOM contribution to particle growth differs for the three events. In the base simulations (Fig. 6a), OOMs mainly drive particle growth in event 1, SAxDMAy mainly drives particle growth in event 2, and the contributions of SAxDMAy and OOMs to particle growth are comparable in event 3. In the improved simulations (Fig. 6b), OOMs still dominate particle growth in event 1, but their contribution to particle growth becomes on par with SAxDMAy in event 2. The contrast of particle composition between a2 and b2 of Fig. 6 demonstrates the importance of constraining the simulation with particle composition measurements, as it is conceivable that measurement-constrained particle sulfate-to-organics ratios could support or oppose adjusting OOM concentration by a factor of 4 in event 2. In fact, the composition in the improved simulation is closer to our recent field measurements of 8–40 nm new particle compositions, where organic compositions always dominate (Li et al., 2022).
Figure 6c shows the composition variation of 2, 8, and 15 nm particles as a function of time in the improved simulation of event 2. The same plots for events 1 and 3 are shown in Fig. S5. The fraction of SAxDMAy in the particle has an overall decreasing trend with time (the same trend is observed for events 1 and 3 as shown in Fig. S5). This occurs because the SA concentration usually reaches its peak earlier than the OOM concentration in urban Beijing; consequently, SAxDMAy takes up a higher mass fraction of the particles that appear early in the day (Li et al., 2021, 2022). Compared to the 8 and 15 nm particles, the composition of 2 nm particles is oscillatory. Because it takes a short time for new particles to grow to 2 nm, the composition of 2 nm particles reflects the temporal variations of gaseous species, e.g., SA and OOMs. In contrast, it takes a much longer time for particles to grow to 8 or 15 nm. As a result, the variations of gaseous species concentrations are smoothed out in the composition of 8 and 15 nm particles.
Figure 6c additionally shows that the variation of SAxDMAy fraction in 4 h is less than 25 % for both 8 and 15 nm particles, and the fractional change within a time span of half an hour is less than 4 %. This level of particle composition change indicates that TDCIMS measurement, which typically collects particles at fixed sizes for no more than half an hour during NPF events in Beijing (Li et al., 2022), should have a composition measurement uncertainty of no more than a few percent, attributable to particle composition variation with time.
We simulated the development of several NPF events in urban Beijing with a discrete-sectional model. NPF formation by SA-DMA nucleation was simulated with a cluster dynamics module, while particle growth was simulated considering vapor condensation and particle coagulation. A variable simulation domain was applied, which enabled the isolation of new particle formation and growth from the evolution of larger particles of non-NPF origin. With a set of selected metrics, e.g., the NPF rates and the particle survival probability, the simulation was comprehensively assessed by comparison with the observation. We additionally designed sensitivity analysis and targeted simulations (i.e., the 5+ simulations) to trace the cause for simulation–observation discrepancies.
With the observed gas precursor concentrations as model inputs (i.e., the base simulations), we found that the simulation can roughly capture the development of several selected NPF events which were not apparently influenced by unaccounted processes (e.g., air mass transport). The base simulations underestimated the particle growth rates in these events, which led to lower than observed particle number concentrations, survival probabilities, and particle mode diameters. Sensitivity analysis was then conducted to identify the cause for the discrepancy. The analysis suggested that the simulation could be sensitive to model input uncertainties. For instance, in event 1, an ±50 % variation of SA and CoagS could cause more than an order of magnitude differences in simulated particle formation rates and number concentrations, while increasing the OOM concentration considerably promoted particle growth. The sensitivity analysis also showed that OOM scaling had a converging effect on the sensitivity curves and implied that the OOM concentration might have been under-detected during the field observations. With additional rationale supported by our previous work on new particle growth in urban Beijing, we conducted improved simulations with scaled OOM concentrations and were able to narrow the gap between the simulation and the observation. Further analysis of particle chemical composition showed that the organic fraction was significantly increased in the improved simulations for event 2; such a change can be coupled with field measurements of particle compositions to constrain the actual condensable concentrations during the NPF events.
While most of the work on NPFG focuses on the statistical analysis of many NPF events, this work analyzed NPFG in detail with an event-based approach. This approach is complementary to the statistical method and demonstrates to what extent individual events simulated with an assumed NPFG mechanism agree with the observations. Both approaches have their strengths and should be conducted in the analysis of NPF field observations if feasible.
| Metric | Description |
| The new particle formation rate at a threshold diameter dp, calculated by applying a particle population balance formula (Eq. S1 in the Supplement) to the simulated or the observed PSDs. | |
| Nd | The SA dimer concentration, calculated by adding the concentrations of all SA2DMAy () clusters in the simulation or in the field observation. |
| The particle number concentration in the diameter range [d1,d2], obtained by integrating the number-based PSDs from d1 to d2. | |
| The particle survival probability from d1 to d2, calculated by dividing the time-integrated by time-integrated (Eq. S2 in the Supplement). | |
| dm | The mode diameter, determined by locating the local maxima of the PSD in the form. |
| The ratio of the simulated and the observed . | |
| , , | The ratios of the average J1.4, , and dm between the simulation and the observation. |
The simulation data and the MATLAB code that produces all figures in the manuscript are available from the corresponding authors upon request.
The supplement related to this article is available online at: https://doi.org/10.5194/acp-23-6879-2023-supplement.
CL and JJ initialized the study. CL developed the model and did the simulations. YL, XL, RC, XQ, RY, CY, YG, YL, JZ, VMK, MK, and JJ supported the study with field measurements and data analysis. CL took the lead in writing the manuscript, and the other authors contributed to the writing and revision of the manuscript.
At least one (co-)author is a member of the editorial board of Atmospheric Chemistry and Physics. The peer-review process was guided by an independent editor, and the authors also have no other competing interests to declare.
Publisher’s note: Copernicus Publications remains neutral with regard to jurisdictional claims in published maps and institutional affiliations.
This research has been supported by the National Key R&D Program of China (grant no. 2022YFC3704100), the Natural Science Foundation of Shanghai (grant no. 21ZR1430100), the State Key Joint Laboratory of Environmental Simulation and Pollution Control, the National Natural Science Foundation of China (grant nos. 22188102 and 92044301), Samsung (PM2.5 SRP), and the Academy of Finland (grant no. 332547).
This paper was edited by Maria Kanakidou and reviewed by three anonymous referees.
Boy, M., Hellmuth, O., Korhonen, H., Nilsson, E. D., ReVelle, D., Turnipseed, A., Arnold, F., and Kulmala, M.: MALTE – model to predict new aerosol formation in the lower troposphere, Atmos. Chem. Phys., 6, 4499–4517, https://doi.org/10.5194/acp-6-4499-2006, 2006.
Cai, R. and Jiang, J.: A new balance formula to estimate new particle formation rate: reevaluating the effect of coagulation scavenging, Atmos. Chem. Phys., 17, 12659–12675, https://doi.org/10.5194/acp-17-12659-2017, 2017.
Cai, R., Chen, D.-R., Hao, J., and Jiang, J.: A miniature cylindrical differential mobility analyzer for sub-3 nm particle sizing, J. Aerosol Sci., 106, 111–119, https://doi.org/10.1016/j.jaerosci.2017.01.004, 2017.
Cai, R., Chandra, I., Yang, D., Yao, L., Fu, Y., Li, X., Lu, Y., Luo, L., Hao, J., Ma, Y., Wang, L., Zheng, J., Seto, T., and Jiang, J.: Estimating the influence of transport on aerosol size distributions during new particle formation events, Atmos. Chem. Phys., 18, 16587–16599, https://doi.org/10.5194/acp-18-16587-2018, 2018.
Cai, R., Li, C., He, X.-C., Deng, C., Lu, Y., Yin, R., Yan, C., Wang, L., Jiang, J., Kulmala, M., and Kangasluoma, J.: Impacts of coagulation on the appearance time method for new particle growth rate evaluation and their corrections, Atmos. Chem. Phys., 21, 2287–2304, https://doi.org/10.5194/acp-21-2287-2021, 2021a.
Cai, R., Yan, C., Yang, D., Yin, R., Lu, Y., Deng, C., Fu, Y., Ruan, J., Li, X., Kontkanen, J., Zhang, Q., Kangasluoma, J., Ma, Y., Hao, J., Worsnop, D. R., Bianchi, F., Paasonen, P., Kerminen, V.-M., Liu, Y., Wang, L., Zheng, J., Kulmala, M., and Jiang, J.: Sulfuric acid–amine nucleation in urban Beijing, Atmos. Chem. Phys., 21, 2457–2468, https://doi.org/10.5194/acp-21-2457-2021, 2021b.
Cai, R., Häkkinen, E., Yan, C., Jiang, J., Kulmala, M., and Kangasluoma, J.: The effectiveness of the coagulation sink of 3–10 nm atmospheric particles, Atmos. Chem. Phys., 22, 11529–11541, https://doi.org/10.5194/acp-22-11529-2022, 2022a.
Cai, R., Deng, C., Stolzenburg, D., Li, C., Guo, J., Kerminen, V.-M., Jiang, J., Kulmala, M., and Kangasluoma, J.: Survival probability of new atmospheric particles: closure between theory and measurements from 1.4 to 100 nm, Atmos. Chem. Phys., 22, 14571–14587, https://doi.org/10.5194/acp-22-14571-2022, 2022b.
Chan, T. W. and Mozurkewich, M.: Measurement of the coagulation rate constant for sulfuric acid particles as a function of particle size using tandem differential mobility analysis, J. Aerosol Sci., 32, 321–339, https://doi.org/10.1016/S0021-8502(00)00081-1, 2001.
Deng, C., Fu, Y., Dada, L., Yan, C., Cai, R., Yang, D., Zhou, Y., Yin, R., Lu, Y., Li, X., Qiao, X., Fan, X., Nie, W., Kontkanen, J., Kangasluoma, J., Chu, B., Ding, A., Kerminen, V.-M., Paasonen, P., Worsnop, D. R., Bianchi, F., Liu, Y., Zheng, J., Wang, L., Kulmala, M., and Jiang, J.: Seasonal Characteristics of New Particle Formation and Growth in Urban Beijing, Environ. Sci. Technol., 54, 8547–8557, https://doi.org/10.1021/acs.est.0c00808, 2020.
Deng, C., Cai, R., Yan, C., Zheng, J., and Jiang, J.: Formation and growth of sub-3 nm particles in megacities: impact of background aerosols, Faraday Discuss., 226, 348–363, https://doi.org/10.1039/D0FD00083C, 2021.
Elm, J., Kubečka, J., Besel, V., Jääskeläinen, M. J., Halonen, R., Kurtén, T., and Vehkamäki, H.: Modeling the formation and growth of atmospheric molecular clusters: A review, J. Aerosol Sci., 149, 105621, https://doi.org/10.1016/j.jaerosci.2020.105621, 2020.
Frege, C., Ortega, I. K., Rissanen, M. P., Praplan, A. P., Steiner, G., Heinritzi, M., Ahonen, L., Amorim, A., Bernhammer, A.-K., Bianchi, F., Brilke, S., Breitenlechner, M., Dada, L., Dias, A., Duplissy, J., Ehrhart, S., El-Haddad, I., Fischer, L., Fuchs, C., Garmash, O., Gonin, M., Hansel, A., Hoyle, C. R., Jokinen, T., Junninen, H., Kirkby, J., Kürten, A., Lehtipalo, K., Leiminger, M., Mauldin, R. L., Molteni, U., Nichman, L., Petäjä, T., Sarnela, N., Schobesberger, S., Simon, M., Sipilä, M., Stolzenburg, D., Tomé, A., Vogel, A. L., Wagner, A. C., Wagner, R., Xiao, M., Yan, C., Ye, P., Curtius, J., Donahue, N. M., Flagan, R. C., Kulmala, M., Worsnop, D. R., Winkler, P. M., Dommen, J., and Baltensperger, U.: Influence of temperature on the molecular composition of ions and charged clusters during pure biogenic nucleation, Atmos. Chem. Phys., 18, 65–79, https://doi.org/10.5194/acp-18-65-2018, 2018.
Fuchs, N. A.: The Mechanics of Aerosols, Macmillan, New York, ISBN 0486660559, 1964.
Gordon, H., Kirkby, J., Baltensperger, U., Bianchi, F., Breitenlechner, M., Curtius, J., Dias, A., Dommen, J., Donahue, N. M., Dunne, E. M., Duplissy, J., Ehrhart, S., Flagan, R. C., Frege, C., Fuchs, C., Hansel, A., Hoyle, C. R., Kulmala, M., Kürten, A., Lehtipalo, K., Makhmutov, V., Molteni, U., Rissanen, M. P., Stozkhov, Y., Tröstl, J., Tsagkogeorgas, G., Wagner, R., Williamson, C., Wimmer, D., Winkler, P. M., Yan, C., and Carslaw, K. S.: Causes and importance of new particle formation in the present-day and preindustrial atmospheres, J. Geophys. Res.-Atmos., 122, 8739–8760, https://doi.org/10.1002/2017JD026844, 2017.
Heinritzi, M., Simon, M., Steiner, G., Wagner, A. C., Kürten, A., Hansel, A., and Curtius, J.: Characterization of the mass-dependent transmission efficiency of a CIMS, Atmos. Meas. Tech., 9, 1449–1460, https://doi.org/10.5194/amt-9-1449-2016, 2016.
Heitto, A., Lehtinen, K., Petäjä, T., Lopez-Hilfiker, F., Thornton, J. A., Kulmala, M., and Yli-Juuti, T.: Effects of oligomerization and decomposition on the nanoparticle growth: a model study, Atmos. Chem. Phys., 22, 155–171, https://doi.org/10.5194/acp-22-155-2022, 2022.
Hodshire, A. L., Lawler, M. J., Zhao, J., Ortega, J., Jen, C., Yli-Juuti, T., Brewer, J. F., Kodros, J. K., Barsanti, K. C., Hanson, D. R., McMurry, P. H., Smith, J. N., and Pierce, J. R.: Multiple new-particle growth pathways observed at the US DOE Southern Great Plains field site, Atmos. Chem. Phys., 16, 9321–9348, https://doi.org/10.5194/acp-16-9321-2016, 2016.
Huang, X., Zhou, L., Ding, A., Qi, X., Nie, W., Wang, M., Chi, X., Petäjä, T., Kerminen, V.-M., Roldin, P., Rusanen, A., Kulmala, M., and Boy, M.: Comprehensive modelling study on observed new particle formation at the SORPES station in Nanjing, China, Atmos. Chem. Phys., 16, 2477–2492, https://doi.org/10.5194/acp-16-2477-2016, 2016.
Hyttinen, N., Kupiainen-Määttä, O., Rissanen, M. P., Muuronen, M., Ehn, M., and Kurtén, T.: Modeling the Charging of Highly Oxidized Cyclohexene Ozonolysis Products Using Nitrate-Based Chemical Ionization, J. Phys. Chem. A, 119, 6339–6345, https://doi.org/10.1021/acs.jpca.5b01818, 2015.
Jen, C. N., McMurry, P. H., and Hanson, D. R.: Stabilization of sulfuric acid dimers by ammonia, methylamine, dimethylamine, and trimethylamine, J. Geophys. Res.-Atmos., 119, 7502–7514, https://doi.org/10.1002/2014JD021592, 2014.
Jiang, J., Chen, M., Kuang, C., Attoui, M., and McMurry, P. H.: Electrical Mobility Spectrometer Using a Diethylene Glycol Condensation Particle Counter for Measurement of Aerosol Size Distributions Down to 1 nm, Aerosol Sci. Technol., 45, 510–521, https://doi.org/10.1080/02786826.2010.547538, 2011.
Kerminen, V.-M. and Kulmala, M.: Analytical formulae connecting the “real” and the “apparent” nucleation rate and the nuclei number concentration for atmospheric nucleation events, J. Aerosol Sci., 33, 609–622, https://doi.org/10.1016/S0021-8502(01)00194-X, 2002.
Kerminen, V.-M., Chen, X., Vakkari, V., Petäjä, T., Kulmala, M., and Bianchi, F.: Atmospheric new particle formation and growth: review of field observations, Environ. Res. Lett., 13, 103003, https://doi.org/10.1088/1748-9326/aadf3c, 2018.
Kolesar, K. R., Chen, C., Johnson, D., and Cappa, C. D.: The influences of mass loading and rapid dilution of secondary organic aerosol on particle volatility, Atmos. Chem. Phys., 15, 9327–9343, https://doi.org/10.5194/acp-15-9327-2015, 2015.
Kulmala, M., Maso, M. D., Mäkelä, J. M., Pirjola, L., Väkevä, M., Aalto, P., Miikkulainen, P., Hämeri, K., and O'dowd, C. D.: On the formation, growth and composition of nucleation mode particles, Tellus B, 53, 479–490, https://doi.org/10.3402/tellusb.v53i4.16622, 2001.
Kulmala, M., Petäjä, T., Nieminen, T., Sipilä, M., Manninen, H. E., Lehtipalo, K., Dal Maso, M., Aalto, P. P., Junninen, H., Paasonen, P., Riipinen, I., Lehtinen, K. E. J., Laaksonen, A., and Kerminen, V.-M.: Measurement of the nucleation of atmospheric aerosol particles, Nat. Protoc., 7, 1651–1667, https://doi.org/10.1038/nprot.2012.091, 2012.
Kulmala, M., Kerminen, V. M., Petäjä, T., Ding, A. J., and Wang, L.: Atmospheric gas-to-particle conversion: why NPF events are observed in megacities?, Faraday Discuss., 200, 271–288, https://doi.org/10.1039/C6FD00257A, 2017.
Kulmala, M., Dada, L., Daellenbach, K. R., Yan, C., Stolzenburg, D., Kontkanen, J., Ezhova, E., Hakala, S., Tuovinen, S., Kokkonen, T. V., Kurppa, M., Cai, R., Zhou, Y., Yin, R., Baalbaki, R., Chan, T., Chu, B., Deng, C., Fu, Y., Ge, M., He, H., Heikkinen, L., Junninen, H., Liu, Y., Lu, Y., Nie, W., Rusanen, A., Vakkari, V., Wang, Y., Yang, G., Yao, L., Zheng, J., Kujansuu, J., Kangasluoma, J., Petäjä, T., Paasonen, P., Järvi, L., Worsnop, D., Ding, A., Liu, Y., Wang, L., Jiang, J., Bianchi, F., and Kerminen, V.-M.: Is reducing new particle formation a plausible solution to mitigate particulate air pollution in Beijing and other Chinese megacities?, Faraday Discuss., 226, 334–347, https://doi.org/10.1039/D0FD00078G, 2021.
Kulmala, M., Cai, R., Stolzenburg, D., Zhou, Y., Dada, L., Guo, Y., Yan, C., Petäjä, T., Jiang, J., and Kerminen, V.-M.: The contribution of new particle formation and subsequent growth to haze formation, Environmental Science: Atmospheres, 2, 352–361, https://doi.org/10.1039/D1EA00096A, 2022.
Kürten, A., Rondo, L., Ehrhart, S., and Curtius, J.: Calibration of a Chemical Ionization Mass Spectrometer for the Measurement of Gaseous Sulfuric Acid, J. Phys. Chem. A, 116, 6375–6386, https://doi.org/10.1021/jp212123n, 2012.
Kürten, A., Li, C., Bianchi, F., Curtius, J., Dias, A., Donahue, N. M., Duplissy, J., Flagan, R. C., Hakala, J., Jokinen, T., Kirkby, J., Kulmala, M., Laaksonen, A., Lehtipalo, K., Makhmutov, V., Onnela, A., Rissanen, M. P., Simon, M., Sipilä, M., Stozhkov, Y., Tröstl, J., Ye, P., and McMurry, P. H.: New particle formation in the sulfuric acid–dimethylamine–water system: reevaluation of CLOUD chamber measurements and comparison to an aerosol nucleation and growth model, Atmos. Chem. Phys., 18, 845–863, https://doi.org/10.5194/acp-18-845-2018, 2018.
Lee, S.-H., Gordon, H., Yu, H., Lehtipalo, K., Haley, R., Li, Y., and Zhang, R.: New Particle Formation in the Atmosphere: From Molecular Clusters to Global Climate, J. Geophys. Res.-Atmos., 124, 7098–7146, https://doi.org/10.1029/2018jd029356, 2019.
Li, C. and Cai, R.: Tutorial: The discrete-sectional method to simulate an evolving aerosol, J. Aerosol Sci., 150, 105615, https://doi.org/10.1016/j.jaerosci.2020.105615, 2020.
Li, C. and McMurry, P. H.: Errors in nanoparticle growth rates inferred from measurements in chemically reacting aerosol systems, Atmos. Chem. Phys., 18, 8979–8993, https://doi.org/10.5194/acp-18-8979-2018, 2018.
Li, C. and Signorell, R.: Understanding vapor nucleation on the molecular level: A review, J. Aerosol Sci., 153, 105676, https://doi.org/10.1016/j.jaerosci.2020.105676, 2020.
Li, C., Zhao, Y., Li, Z., Liu, L., Zhang, X., Zheng, J., Kerminen, V.-M., Kulmala, M., Jiang, J., Cai, R., and Xiao, H.: The dependence of new particle formation rates on the interaction between cluster growth, evaporation, and condensation sink, Environmental Science: Atmospheres, 3, 168–181, https://doi.org/10.1039/D2EA00066K, 2023.
Li, H., Ning, A., Zhong, J., Zhang, H., Liu, L., Zhang, Y., Zhang, X., Zeng, X. C., and He, H.: Influence of atmospheric conditions on sulfuric acid-dimethylamine-ammonia-based new particle formation, Chemosphere, 245, 125554, https://doi.org/10.1016/j.chemosphere.2019.125554, 2020.
Li, X., Li, Y., Lawler, M. J., Hao, J., Smith, J. N., and Jiang, J.: Composition of Ultrafine Particles in Urban Beijing: Measurement Using a Thermal Desorption Chemical Ionization Mass Spectrometer, Environ. Sci. Technol., 55, 2859–2868, https://doi.org/10.1021/acs.est.0c06053, 2021.
Li, X., Li, Y., Cai, R., Yan, C., Qiao, X., Guo, Y., Deng, C., Yin, R., Chen, Y., Li, Y., Yao, L., Sarnela, N., Zhang, Y., Petäjä, T., Bianchi, F., Liu, Y., Kulmala, M., Hao, J., Smith, J. N., and Jiang, J.: Insufficient Condensable Organic Vapors Lead to Slow Growth of New Particles in an Urban Environment, Environ. Sci. Technol., 56, 9936–9946, https://doi.org/10.1021/acs.est.2c01566, 2022.
Liu, J., Jiang, J., Zhang, Q., Deng, J., and Hao, J.: A spectrometer for measuring particle size distributions in the range of 3 nm to 10 µm, Front. Env. Sci. Eng., 10, 63–72, https://doi.org/10.1007/s11783-014-0754-x, 2016.
Liu, Y., Yan, C., Feng, Z., Zheng, F., Fan, X., Zhang, Y., Li, C., Zhou, Y., Lin, Z., Guo, Y., Zhang, Y., Ma, L., Zhou, W., Liu, Z., Dada, L., Dällenbach, K., Kontkanen, J., Cai, R., Chan, T., Chu, B., Du, W., Yao, L., Wang, Y., Cai, J., Kangasluoma, J., Kokkonen, T., Kujansuu, J., Rusanen, A., Deng, C., Fu, Y., Yin, R., Li, X., Lu, Y., Liu, Y., Lian, C., Yang, D., Wang, W., Ge, M., Wang, Y., Worsnop, D. R., Junninen, H., He, H., Kerminen, V.-M., Zheng, J., Wang, L., Jiang, J., Petäjä, T., Bianchi, F., and Kulmala, M.: Continuous and comprehensive atmospheric observations in Beijing: a station to understand the complex urban atmospheric environment, Big Earth Data, 4, 295–321, https://doi.org/10.1080/20964471.2020.1798707, 2020.
Matsui, H., Koike, M., Kondo, Y., Takegawa, N., Wiedensohler, A., Fast, J. D., and Zaveri, R. A.: Impact of new particle formation on the concentrations of aerosols and cloud condensation nuclei around Beijing, J. Geophys. Res.-Atmos., 116, D19208, https://doi.org/10.1029/2011JD016025, 2011.
McGrath, M. J., Olenius, T., Ortega, I. K., Loukonen, V., Paasonen, P., Kurtén, T., Kulmala, M., and Vehkamäki, H.: Atmospheric Cluster Dynamics Code: a flexible method for solution of the birth-death equations, Atmos. Chem. Phys., 12, 2345–2355, https://doi.org/10.5194/acp-12-2345-2012, 2012.
Mohr, C., Thornton, J. A., Heitto, A., Lopez-Hilfiker, F. D., Lutz, A., Riipinen, I., Hong, J., Donahue, N. M., Hallquist, M., Petäjä, T., Kulmala, M., and Yli-Juuti, T.: Molecular identification of organic vapors driving atmospheric nanoparticle growth, Nat. Commun., 10, 4442, https://doi.org/10.1038/s41467-019-12473-2, 2019.
Myllys, N., Chee, S., Olenius, T., Lawler, M., and Smith, J.: Molecular-Level Understanding of Synergistic Effects in Sulfuric Acid–Amine–Ammonia Mixed Clusters, J. Phys. Chem. A, 123, 2420–2425, https://doi.org/10.1021/acs.jpca.9b00909, 2019.
Ortega, I. K., Kupiainen, O., Kurtén, T., Olenius, T., Wilkman, O., McGrath, M. J., Loukonen, V., and Vehkamäki, H.: From quantum chemical formation free energies to evaporation rates, Atmos. Chem. Phys., 12, 225–235, https://doi.org/10.5194/acp-12-225-2012, 2012.
Qi, X., Ding, A., Roldin, P., Xu, Z., Zhou, P., Sarnela, N., Nie, W., Huang, X., Rusanen, A., Ehn, M., Rissanen, M. P., Petäjä, T., Kulmala, M., and Boy, M.: Modelling studies of HOMs and their contributions to new particle formation and growth: comparison of boreal forest in Finland and a polluted environment in China, Atmos. Chem. Phys., 18, 11779–11791, https://doi.org/10.5194/acp-18-11779-2018, 2018.
Qiao, X., Yan, C., Li, X., Guo, Y., Yin, R., Deng, C., Li, C., Nie, W., Wang, M., Cai, R., Huang, D., Wang, Z., Yao, L., Worsnop, D. R., Bianchi, F., Liu, Y., Donahue, N. M., Kulmala, M., and Jiang, J.: Contribution of Atmospheric Oxygenated Organic Compounds to Particle Growth in an Urban Environment, Environ. Sci. Technol, 55, 13646–13656, https://doi.org/10.1021/acs.est.1c02095, 2021.
Riva, M., Rantala, P., Krechmer, J. E., Peräkylä, O., Zhang, Y., Heikkinen, L., Garmash, O., Yan, C., Kulmala, M., Worsnop, D., and Ehn, M.: Evaluating the performance of five different chemical ionization techniques for detecting gaseous oxygenated organic species, Atmos. Meas. Tech., 12, 2403–2421, https://doi.org/10.5194/amt-12-2403-2019, 2019.
Roldin, P., Eriksson, A. C., Nordin, E. Z., Hermansson, E., Mogensen, D., Rusanen, A., Boy, M., Swietlicki, E., Svenningsson, B., Zelenyuk, A., and Pagels, J.: Modelling non-equilibrium secondary organic aerosol formation and evaporation with the aerosol dynamics, gas- and particle-phase chemistry kinetic multilayer model ADCHAM, Atmos. Chem. Phys., 14, 7953–7993, https://doi.org/10.5194/acp-14-7953-2014, 2014.
Roldin, P., Ehn, M., Kurtén, T., Olenius, T., Rissanen, M. P., Sarnela, N., Elm, J., Rantala, P., Hao, L., Hyttinen, N., Heikkinen, L., Worsnop, D. R., Pichelstorfer, L., Xavier, C., Clusius, P., Öström, E., Petäjä, T., Kulmala, M., Vehkamäki, H., Virtanen, A., Riipinen, I., and Boy, M.: The role of highly oxygenated organic molecules in the Boreal aerosol-cloud-climate system, Nat. Commun., 10, 4370, https://doi.org/10.1038/s41467-019-12338-8, 2019.
Smith, J. N., Barsanti, K. C., Friedli, H. R., Ehn, M., Kulmala, M., Collins, D. R., Scheckman, J. H., Williams, B. J., and McMurry, P. H.: Observations of aminium salts in atmospheric nanoparticles and possible climatic implications, P. Natl. Acad. Sci. USA, 107, 6634–6639, 2010.
Tröstl, J., Chuang, W. K., Gordon, H., Heinritzi, M., Yan, C., Molteni, U., Ahlm, L., Frege, C., Bianchi, F., Wagner, R., Simon, M., Lehtipalo, K., Williamson, C., Craven, J. S., Duplissy, J., Adamov, A., Almeida, J., Bernhammer, A.-K., Breitenlechner, M., Brilke, S., Dias, A., Ehrhart, S., Flagan, R. C., Franchin, A., Fuchs, C., Guida, R., Gysel, M., Hansel, A., Hoyle, C. R., Jokinen, T., Junninen, H., Kangasluoma, J., Keskinen, H., Kim, J., Krapf, M., Kürten, A., Laaksonen, A., Lawler, M., Leiminger, M., Mathot, S., Möhler, O., Nieminen, T., Onnela, A., Petäjä, T., Piel, F. M., Miettinen, P., Rissanen, M. P., Rondo, L., Sarnela, N., Schobesberger, S., Sengupta, K., Sipilä, M., Smith, J. N., Steiner, G., Tomè, A., Virtanen, A., Wagner, A. C., Weingartner, E., Wimmer, D., Winkler, P. M., Ye, P., Carslaw, K. S., Curtius, J., Dommen, J., Kirkby, J., Kulmala, M., Riipinen, I., Worsnop, D. R., Donahue, N. M., and Baltensperger, U.: The role of low-volatility organic compounds in initial particle growth in the atmosphere, Nature, 533, 527–531, https://doi.org/10.1038/nature18271, 2016.
Tuovinen, S., Cai, R., Kerminen, V.-M., Jiang, J., Yan, C., Kulmala, M., and Kontkanen, J.: Survival probabilities of atmospheric particles: comparison based on theory, cluster population simulations, and observations in Beijing, Atmos. Chem. Phys., 22, 15071–15091, https://doi.org/10.5194/acp-22-15071-2022, 2022.
Wang, L., Khalizov, A. F., Zheng, J., Xu, W., Ma, Y., Lal, V., and Zhang, R.: Atmospheric nanoparticles formed from heterogeneous reactions of organics, Nat. Geosci., 3, 238–242, https://doi.org/10.1038/ngeo778, 2010.
Wang, M., Kong, W., Marten, R., He, X.-C., Chen, D., Pfeifer, J., Heitto, A., Kontkanen, J., Dada, L., Kürten, A., Yli-Juuti, T., Manninen, H. E., Amanatidis, S., Amorim, A., Baalbaki, R., Baccarini, A., Bell, D. M., Bertozzi, B., Bräkling, S., Brilke, S., Murillo, L. C., Chiu, R., Chu, B., De Menezes, L.-P., Duplissy, J., Finkenzeller, H., Carracedo, L. G., Granzin, M., Guida, R., Hansel, A., Hofbauer, V., Krechmer, J., Lehtipalo, K., Lamkaddam, H., Lampimäki, M., Lee, C. P., Makhmutov, V., Marie, G., Mathot, S., Mauldin, R. L., Mentler, B., Müller, T., Onnela, A., Partoll, E., Petäjä, T., Philippov, M., Pospisilova, V., Ranjithkumar, A., Rissanen, M., Rörup, B., Scholz, W., Shen, J., Simon, M., Sipilä, M., Steiner, G., Stolzenburg, D., Tham, Y. J., Tomé, A., Wagner, A. C., Wang, D. S., Wang, Y., Weber, S. K., Winkler, P. M., Wlasits, P. J., Wu, Y., Xiao, M., Ye, Q., Zauner-Wieczorek, M., Zhou, X., Volkamer, R., Riipinen, I., Dommen, J., Curtius, J., Baltensperger, U., Kulmala, M., Worsnop, D. R., Kirkby, J., Seinfeld, J. H., El-Haddad, I., Flagan, R. C., and Donahue, N. M.: Rapid growth of new atmospheric particles by nitric acid and ammonia condensation, Nature, 581, 184–189, https://doi.org/10.1038/s41586-020-2270-4, 2020.
Warren, D. R. and Seinfeld, J. H.: Simulation of Aerosol Size Distribution Evolution in Systems with Simultaneous Nucleation, Condensation, and Coagulation, Aerosol Sci. Technol., 4, 31–43, https://doi.org/10.1080/02786828508959037, 1985.
Yan, C., Yin, R., Lu, Y., Dada, L., Yang, D., Fu, Y., Kontkanen, J., Deng, C., Garmash, O., Ruan, J., Baalbaki, R., Schervish, M., Cai, R., Bloss, M., Chan, T., Chen, T., Chen, Q., Chen, X., Chen, Y., Chu, B., Dällenbach, K., Foreback, B., He, X., Heikkinen, L., Jokinen, T., Junninen, H., Kangasluoma, J., Kokkonen, T., Kurppa, M., Lehtipalo, K., Li, H., Li, H., Li, X., Liu, Y., Ma, Q., Paasonen, P., Rantala, P., Pileci, R. E., Rusanen, A., Sarnela, N., Simonen, P., Wang, S., Wang, W., Wang, Y., Xue, M., Yang, G., Yao, L., Zhou, Y., Kujansuu, J., Petäjä, T., Nie, W., Ma, Y., Ge, M., He, H., Donahue, N. M., Worsnop, D. R., Veli-Matti, K., Wang, L., Liu, Y., Zheng, J., Kulmala, M., Jiang, J., and Bianchi, F.: The Synergistic Role of Sulfuric Acid, Bases, and Oxidized Organics Governing New-Particle Formation in Beijing, Geophys. Res. Lett., 48, e2020GL091944, https://doi.org/10.1029/2020GL091944, 2021.
Yan, C., Shen, Y., Stolzenburg, D., Dada, L., Qi, X., Hakala, S., Sundström, A.-M., Guo, Y., Lipponen, A., Kokkonen, T. V., Kontkanen, J., Cai, R., Cai, J., Chan, T., Chen, L., Chu, B., Deng, C., Du, W., Fan, X., He, X.-C., Kangasluoma, J., Kujansuu, J., Kurppa, M., Li, C., Li, Y., Lin, Z., Liu, Y., Liu, Y., Lu, Y., Nie, W., Pulliainen, J., Qiao, X., Wang, Y., Wen, Y., Wu, Y., Yang, G., Yao, L., Yin, R., Zhang, G., Zhang, S., Zheng, F., Zhou, Y., Arola, A., Tamminen, J., Paasonen, P., Sun, Y., Wang, L., Donahue, N. M., Liu, Y., Bianchi, F., Daellenbach, K. R., Worsnop, D. R., Kerminen, V.-M., Petäjä, T., Ding, A., Jiang, J., and Kulmala, M.: The effect of COVID-19 restrictions on atmospheric new particle formation in Beijing, Atmos. Chem. Phys., 22, 12207–12220, https://doi.org/10.5194/acp-22-12207-2022, 2022.
Yao, M., Li, Z., Li, C., Xiao, H., Wang, S., Chan, A. W. H., and Zhao, Y.: Isomer-Resolved Reactivity of Organic Peroxides in Monoterpene-Derived Secondary Organic Aerosol, Environ. Sci. Technol., 56, 4882–4893, https://doi.org/10.1021/acs.est.2c01297, 2022.
Yin, R., Yan, C., Cai, R., Li, X., Shen, J., Lu, Y., Schobesberger, S., Fu, Y., Deng, C., Wang, L., Liu, Y., Zheng, J., Xie, H., Bianchi, F., Worsnop, D. R., Kulmala, M., and Jiang, J.: Acid–Base Clusters during Atmospheric New Particle Formation in Urban Beijing, Environ. Sci. Technol, 55, 10994–11005, https://doi.org/10.1021/acs.est.1c02701, 2021.
Yu, F., Luo, G., Nadykto, A. B., and Herb, J.: Impact of temperature dependence on the possible contribution of organics to new particle formation in the atmosphere, Atmos. Chem. Phys., 17, 4997–5005, https://doi.org/10.5194/acp-17-4997-2017, 2017.
Zheng, J., Ma, Y., Chen, M., Zhang, Q., Wang, L., Khalizov, A. F., Yao, L., Wang, Z., Wang, X., and Chen, L.: Measurement of atmospheric amines and ammonia using the high resolution time-of-flight chemical ionization mass spectrometry, Atmos. Environ., 102, 249–259, https://doi.org/10.1016/j.atmosenv.2014.12.002, 2015.
- Abstract
- Introduction
- Methods
- Results and discussions
- Conclusions
- Appendix A: Metrics for comparison between the simulation and the observation, along with the method to calculate these metrics
- Code and data availability
- Author contributions
- Competing interests
- Disclaimer
- Financial support
- Review statement
- References
- Supplement