the Creative Commons Attribution 4.0 License.
the Creative Commons Attribution 4.0 License.
 | 21 Jun 2023
Saturation vapor pressure characterization of selected low-volatility organic compounds using a residence time chamber
Noora Hyttinen
Miika Vainikka
Olli-Pekka Tikkasalo
Siegfried Schobesberger
Taina Yli-Juuti
Saturation vapor pressure (psat) is an important thermodynamic property regulating the gas-to-particle partitioning of organic compounds in the atmosphere. Low-volatility organic compounds (LVOCs), with sufficiently low psat values, primarily stay in the particle phase and contribute to aerosol formation. Obtaining accurate information on the psat of LVOCs requires volatility measurements performed at temperatures relevant to atmospheric aerosol formation. Here, we present an isothermal evaporation method using a residence time chamber to measure psat for dry single-compound nanoparticles at 295 K. Our method is able to characterize organic compounds with psat spanning from 10−8 to 10−4 Pa at 295 K. The compounds included four polyethylene glycols (PEGs: PEG6, PEG7, PEG8, and PEG9), two monocarboxylic acids (palmitic acid and stearic acid), two dicarboxylic acids (azelaic acid and sebacic acid), two alcohols (meso-erythritol and xylitol), and one ester (di-2-ethylhexyl sebacate). There was a good agreement between our measured psat values and those reported by previous volatility studies using different measurement techniques, mostly within 1 order of magnitude. Additionally, quantum-chemistry-based COSMOtherm calculations were performed to estimate the psat values of the studied compounds. COSMOtherm predicted the psat values for most of the studied compounds within 1 order of magnitude difference between the experimental and computational estimates.
- Article
(2531 KB) - Full-text XML
-
Supplement
(1426 KB) - BibTeX
- EndNote


Secondary organic aerosol (SOA) particles account for 64 % to 95 % of submicron organic aerosol particles measured at different locations, from urban to remote areas (Zhang et al., 2007; Jimenez et al., 2009). Gas-phase oxidation of volatile organic compounds leads to a range of organic vapors with different functionalities and thus volatility. Organic vapors with sufficiently low volatility can condense onto existing particles or form new particles (Hallquist et al., 2009). Particular attention has been paid to low-volatility organic compounds (LVOCs), which significantly contribute to SOA formation (Ehn et al., 2014; Mohr et al., 2019; Schwantes et al., 2019). Under gas–particle equilibrium, nearly all (≈ 100 %) LVOCs partition into the particle phase in the presence of ambient aerosol mass loadings. The volatility of an organic compound can be quantified by its saturation vapor pressure (psat) which is the key thermodynamic property describing the equilibrium gas–particle partitioning of the compound (Pankow, 1994). LVOCs typically refer to organic compounds with psat between 10−8 and 10−6 Pa (saturation mass concentration on the order between 10−3 and 10−1 µg m−3). Numerous measurement techniques have been used to estimate the psat values of organic compounds (e.g., dicarboxylic acids; Bilde et al., 2015).
The thermal desorption method is typically achieved by the desorption of particle samples from a collection plate at elevated temperature and the follow-up gas-phase measurements of the evaporating molecules with mass spectrometers. Examples of this method include thermal desorption particle beam mass spectrometry (TDPB-MS; Chattopadhyay and Ziemann, 2005), thermal desorption proton transfer reaction mass spectrometry (TPD-PT-RMS; Cappa et al., 2008; Holzinger et al., 2010; Eichler et al., 2015), atmospheric solids analysis probe mass spectrometry (ASAP-MS; Bruns et al., 2012), and Filter Inlet for Gases and AEROsols coupled with time-of-flight chemical ionization mass spectrometer (FIGAERO-ToF-CIMS; Lopez-Hilfiker et al., 2014). Estimation of psat using the thermal desorption method can be biased by either high sample mass loading (i.e., on the order of micrograms; Huang et al., 2018) or thermal decomposition of heat-labile organic compounds (Schobesberger et al., 2018; Yang et al., 2021).
For the method based on particle size changes, a population of monodisperse particles are placed in a non-equilibrium condition so that their particle sizes decrease due to evaporation. Typically, a tandem differential mobility analyzer (TDMA) is used to monitor particle size changes during evaporation with residence times from seconds to minutes. Such a method can determine the volatilities of organic compounds with psat as low as 10−6 Pa (Bilde et al., 2003). The size-selected particles are in the size range from several tens to hundreds of nanometers, with number concentrations from several tens to thousands per cubic centimeter. A flow tube TDMA (FT-TDMA) has been deployed to probe the psat from the evaporation of dry particles or aqueous droplets under ambient temperature and relative humidity (RH) conditions (Koponen et al., 2007; Yli-Juuti et al., 2013; Emanuelsson et al., 2016). Furthermore, working at elevated temperatures up to 573 K, volatility TDMA (V-TDMA) has been used to probe not only psat but also enthalpy of vaporization or sublimation of organic compounds by passing dry aerosol particles through a stainless steel thermodenuder at different controlled temperatures (Salo et al., 2010). To absorb the evaporated gas molecules from particle samples, the thermodenuder can be either filled up with activated charcoal (Saha et al., 2015) or followed by an activated charcoal scrubber (Salo et al., 2010). Since V-TDMA measurements are performed with elevated temperatures, the psat values derived from the measurements of thermally labile compounds can be potentially biased by thermal decomposition, as in the thermal desorption method mentioned above.
Furthermore, an electrodynamic balance (EDB; Zardini and Krieger, 2009) or optical tweezer (Cai et al., 2015) can be used to determine the psat of organic compounds, in a manner similar to the TDMA method, by monitoring the size changes of trapped single micrometer-sized particles. A single particle typically in the size range of 2–20 µm is trapped in an environmental cell. As the cell is continuously flushed with a clean air flow at a controlled temperature and RH, organic molecules keep evaporating from the particle phase to the gas phase in a non-equilibrium condition, and the particle size decreases accordingly. The psat of an organic compound can be determined by the optical measurement of particle size changes during evaporation (Zardini et al., 2006; Mitchem and Reid, 2008). For organic molecules with psat of 10−6 Pa or lower, it would take more than 24 h using the single particle method to obtain measurable particle size changes with minimum size measurement errors (Cai et al., 2015; Krieger et al., 2018).
Different from the TDMA method, an integrated volume method (IVM) developed by Saleh et al. (2008) estimates psat of organic compounds on the basis of the change in the total aerosol volume under quasi-equilibrium conditions. In a typical measurement, dry polydisperse particles pass through a thermodenuder with no absorbing material and reach equilibration with the surrounding air at a set temperature, thereby leading to changes in particle size and volume. Equilibrium conditions are ensured by applying high aerosol mass concentrations (∼ 500 µg m−3) to saturate the gas phase and residence times of tens of seconds to complete evaporation kinetics, with no interaction between the investigated compounds and wall material of the thermodenuder (Saleh et al., 2008). Since saturating the gas phase is essential in the IVM method, it might be challenging to apply such a method to investigate compounds of high volatilities even with mass loading of hundreds of micrograms per cubic meter. So far, the IVM method has been used to characterize the volatilities of atmospheric-relevant organic compounds with psat (298 K) between 10−5 and 10−4 Pa (Saleh et al., 2008, 2010; Babar et al., 2020).
Knudsen cells can be also utilized for psat measurements of organic compounds. A macroscopic particle sample will be first placed in the cell with operation pressure of 10−2 Pa or below and then allowed to establish an equilibrium with the gas phase. The psat of an organic compound can be determined by measuring either the mass change with mass balance over time (Ribeiro da Silva et al., 2001) or the effusion rate of gas-phase organic molecules from the cell with a mass spectrometer (Booth et al., 2009; Dang et al., 2019; Shelley et al., 2020). Using mass balance as the detection method typically requires undertaking experiments at elevated temperatures (e.g., up to 421 K) to ensure sufficient material loss from samples with psat (298 K) as low as 10−8 Pa (Goldfarb and Suuberg, 2008). The psat measurements using this technique can be biased if the particle samples are contaminated by compounds of high volatilities (Bilde et al., 2015). When using a mass spectrometer that has high sensitivity as the detection method, volatility measurements can be performed at around ambient temperatures (298–338 K; Booth et al., 2009). So far, such a technique has been used to study organic compounds with psat (298 K) down to 10−6 Pa in aerosol research (Booth et al., 2009; Krieger et al., 2018).
To date, many empirical models have been developed to estimate psat of organic compounds. The simplest models use elemental compositions (Donahue et al., 2011; Bianchi et al., 2019), while group contribution methods require knowledge on the functional groups of organic compounds (Nannoolal et al., 2008; Pankow and Asher, 2008; Compernolle et al., 2011). For a multifunctional compound, the interaction between its functional groups is an important factor for describing the intermolecular interaction in the condensed phase. The conductor-like screening model for real solvents (COSMO-RS; Klamt, 1995; Klamt et al., 1998; Eckert and Klamt, 2002) has therefore recently been used to estimate the psat of multifunctional organic compounds that are atmospherically relevant (Kurten et al., 2016, 2018; Hyttinen et al., 2021, 2022; Stahn et al., 2022). However, few comparisons have been made between COSMO-RS-estimated and experimental psat values of LVOCs due to the scarcity of reliable psat measurements of relevant compounds.
Experimentally determining the psat of LVOCs is challenging. All of the measurement techniques presented above have their advantages and disadvantages, and multiple techniques are needed to obtain a comprehensive view on the psat. Similar new methods for determining psat are desired, especially for measuring psat of LVOCs that are particularly relevant for atmospheric SOA formation. In this study, we present an isothermal particle evaporation method using a TDMA setup for psat characterization. Without any additional heating, the method can determine psat values of LVOCs down to 10−8 Pa by monitoring the evaporation of monodisperse nanoparticles in a residence time chamber (RTC) under dry conditions at room temperature (i.e., 295 K) within a timescale of hours. No calibrant with known psat is required. The RTC method has been also used to study volatilities of biogenic SOA particles in previous studies (Yli-Juuti et al., 2017; Buchholz et al., 2019; Li et al., 2019, 2021, 2023). Different from our RTC approach, Cain et al. (2020) used a dilution chamber filled with clean air to isothermally dilute the polydisperse aerosol particles by a factor of 10 to initiate particle evaporation. Using the approach of Cain et al. (2020) to estimate particle volatility requires corrections for size-dependent particle wall loss and coagulation.
Here we used the RTC method to study a set of LVOCs of which psat values have been reported in the literature. Moreover, quantum chemistry calculations with COSMO-RS were performed to estimate psat values of the selected LVOCs. A comparison between experimental and calculated psat values helps us evaluate the accuracy of the psat calculations of the studied LVOCs.
2.1 Particle evaporation measurements
In this study, a set of pure organic compounds were chosen for psat characterization and used as received without any purification. The polyethylene glycol (PEG, Polypure AS) standards used were PEG6, PEG7, PEG8, and PEG9. The mono- and dicarboxylic acids used were palmitic acid (Sigma Aldrich, ≥ 99 %), stearic acid (Sigma Aldrich, 95 %), azelaic acid (Sigma Aldrich, 98 %), and sebacic acid (Sigma Aldrich, 99 %). The remaining chemicals were meso-erythritol (Alfa Aesar, 99 %), xylitol (Sigma Aldrich, ≥ 99 %), and di-2-ethylhexyl sebacate (DEHS, Topas GmbH, > 98 %). The properties of individual organic compounds are summarized in Table 1. Acetonitrile (Fisher Scientific, 99.8 %) was used as a solvent for stock solutions in this study, with the exception of meso-erythritol and xylitol, which were dissolved using deionized water (18.2 MΩ).
Table 1Properties of the organic compounds used in this study.
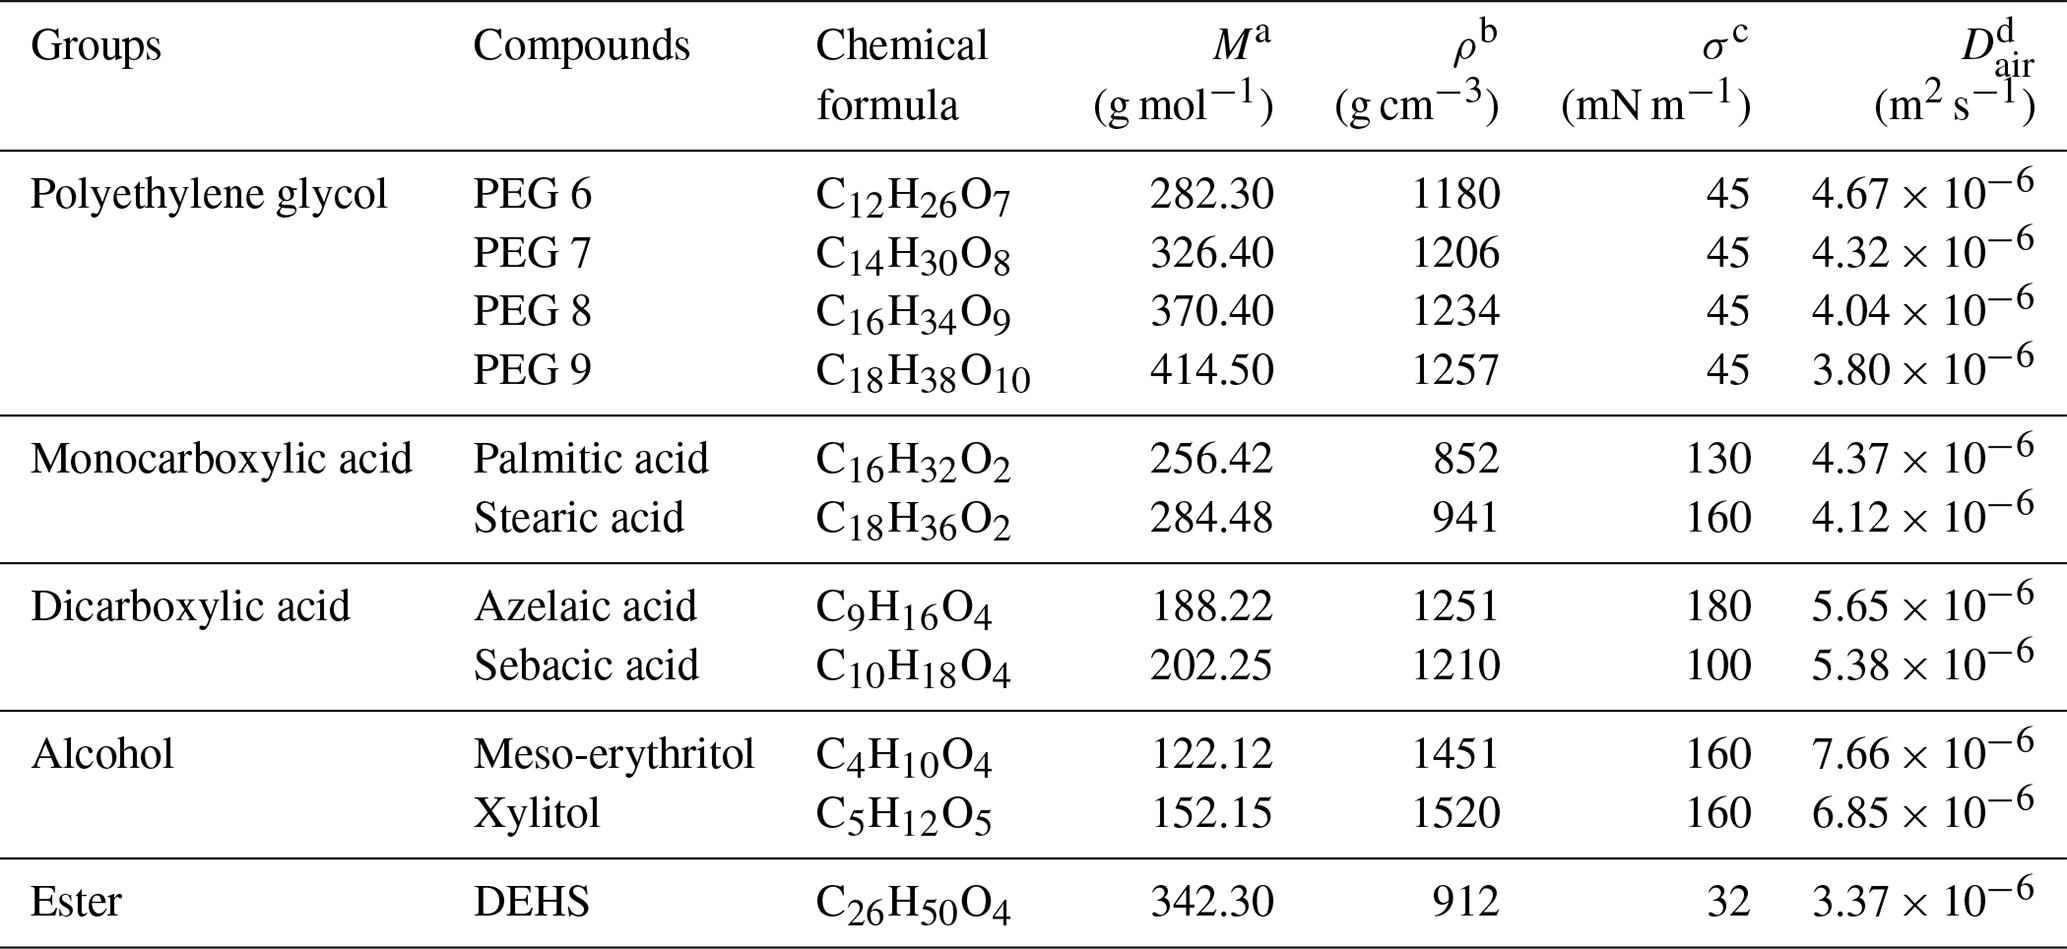
a Molecular weight. b Density; for references, see Table S1 in the Supplement. c Surface tension or energy; for references, see Table S2 in the Supplement. d Gas-phase diffusivity of a compound in air calculated using Eq. (2).
Particle samples were generated by nebulizing solutions of organic compounds with an atomizer (ATM 226, Topas GmbH). Prior to the size selection, either a silica gel diffusion dryer or a large dilution flow of dry purified air was used to remove the solvent (i.e., water or acetonitrile). The schematic diagram of the measurement setup is shown in Fig. S1 in the Supplement. Two parallel nanometer aerosol mobility analyzers (NanoDMA, model 3085, TSI) were used to select particles of 80 nm electrical mobility diameter. We operated the two NanoDMAs in an open-loop setting with a sample to sheath flow ratio of 1 : 8 with clean, dry air as the sheath flow. Such a configuration ensured a gas phase free of the studied compounds (Li and Chen, 2005). Eventually, the resultant monodisperse aerosol was fed into either the bypass lines of varying lengths or into a stainless-steel RTC of either 25 or 100 L in volume for prolonged isothermal evaporation. This setup for particle evaporation measurements enables residence times from 1 s to nearly 7 h. Vapor wall losses in the bypass lines and RTCs were rapid enough to ensure negligible amounts of vapor in the gas phase (Yli-Juuti et al., 2017). The whole setup was maintained under dry conditions (RH < 5 %) at 295 K. Before each isothermal evaporation experiment, the NanoDMAs, bypass tubing, and RTCs were flushed for hours with dry purified air.
Particle size changes due to isothermal evaporation were periodically measured with a scanning mobility particle sizer (SMPS, TSI; DMA 3080, CPC 3775). Under the assumption of particle sphericity, the extent of particle evaporation was quantified using the evaporation factor (EF). Independent of particle number concentration or mass loading, the EF was determined as . We chose the measured size with the least amount of evaporation (residence time = 1s following size selection) as Dp,0 and the measured size after residence time t of evaporation as Dp,t.
2.2 Determination of psat values
For each of the studied compounds, the psat value can be determined from the isothermal evaporation data (Riipinen et al., 2006; Salo et al., 2010). The particle size change due to evaporation can be expressed as
where Di,air is the gas-phase diffusivity of molecule i in air, Mi is the molecular weight, ρi is the density, Dpis the particle diameter, R is the universal gas constant, T is the temperature (i.e., 295 K), σi is the surface tension or energy, and β is a factor correcting the condensation mass flux in the transition regime (Dp in between 0.02 and 3 µm).
The gas-phase diffusivity of molecule i in air, Di,air, can be estimated using Fuller's semi-empirical method (Fuller et al., 1966):
where p is the experimental pressure (i.e., 1 atm) and Mair is the molecular weight of air. In addition, Vi and Vair are the corresponding diffusion volumes for molecules i and air. For a molecule, the diffusion volume can be calculated by adding the diffusion volumes of all the atoms. Here we used 15.9 for C, 2.31 for H, and 6.11 for O (Reid et al., 1987).
For the transition regime correction factor β, we used Fuchs–Sutugin approximation to describe the gas diffusion in the transition regime (Fuchs and Sutugin, 1971):
where Kn is the Knudsen number and α is the accommodation coefficient. Chamber partitioning studies (Krechmer et al., 2017; Liu et al., 2019) and molecular dynamics simulations (Julin et al., 2014; Von Domaros et al., 2020) suggested that α was close to unity for LVOCs, and thus α was set to unity in this study. Kn is 2 times the ratio between the mean free path of the molecule i in air (λi,air) and particle diameter (Dp):
The value of λi,air can be further expressed following Fuchs and Sutugin (1971):
where is the mean speed of a molecule of i in pure gas of i. For a molecule i, the value of can be described as follows (Moore, 1962):
The psat value for each organic compound was estimated using approximate Bayesian computation with sequential Monte Carlo (ABC-SMC; Sisson et al., 2007; Toni et al., 2009; Liepe et al., 2014). The ABC-SMC algorithm for a single parameter (i.e., psat) works by first drawing samples of psat from a pre-determined prior distribution. For each sample of psat, a loss function is used to measure the difference between the simulation based on Eq. (1) and observed evaporation data. Only those samples which have their computed losses below the acceptance threshold (ε1) will be accepted, resulting in the first posterior distribution of sample size N. Subsequently, new samples are drawn from the previous posterior distribution with a probability proportional to the associated weight and then are perturbed as in Toni et al. (2009). Applying the defined loss function and a smaller acceptance threshold (ε2 < ε1), we produce a new posterior distribution of N samples of psat. The procedure of generating a new set of N accepted samples from the previous posterior distribution is repeated J times with continuously decreasing acceptance thresholds (εJ < εJ−1 < … < ε2 < ε1). This finally leads to an estimate which can be approximated as the true psat of the compound of interest given the observed particle evaporation data.
The ABC-SMC sampling process was performed using the Python package pyABC
(Klinger et al., 2018). For each organic compound, the mean value of
psat and the 95 % credible interval (CrI) were calculated using all accepted samples from the final set of N samples at the end of the pyABC run.
The sample size N was defined as 500. The number of iterations typically
ranges from 10 to 30 (Schälte and Hasenauer, 2020), and here we set
the iteration time J to 10. The prior distribution was set to be a
log-uniform distribution between 10−10 and 10−3 Pa.
The sum of the squared residuals between the observed and simulated evaporation data was defined as the loss function. The number of data points with residence time longer than 1 h was typically less than the number of data points with residence time of 1 h or less. To prevent data points with short residence times from dominating the fittings, the squared difference for each data point with residence time longer than 1 h was scaled with a scaling factor of the number of data points with residence times of 1 h or less. The minimum acceptance threshold was defined as the total sum of the maximum uncertainties (±1.875 % in particle size) from all observation data points. By default, the acceptance thresholds (ε1 to εJ) are automatically calibrated and updated in pyABC. The sampling in pyABC was terminated once either the minimum acceptance threshold or maximum number of iterations (i.e., here set to 10) was reached, whichever came first.
2.3 Quantum chemical calculations using COSMOtherm
Conductor-like screening model for real solvents (COSMO-RS; Klamt, 1995; Klamt et al., 1998; Eckert and Klamt, 2002) uses a combination of quantum chemistry and statistical thermodynamics to estimate condensed-phase thermodynamic properties, e.g., psat of pure compounds. The COSMO-RS model is implemented in the COSMOtherm2021 program (BIOVIA COSMOtherm, 2021), where the model has been parametrized using experiments of a large set of compounds. The COSMOtherm2021 program was used to calculate the psat of the organic compounds. The input files for mono- and dicarboxylic acids and alcohols were taken from the COSMObase2021, which contains COSMOtherm input files of the most commonly used compounds. Input files for the other compounds (i.e., DEHS, PEGs) were generated using the BP-TZVPD-FINE-COSMO+GAS_18 template of COSMOconf2021 (BIOVIA COSMOconf, 2021), which has been created for finding suitable conformer sets for COSMOtherm calculations. The density functional theory calculations were performed using the TURBOMOLE program version 7.4.1 (TURBOMOLE, 2019). In COSMOtherm, we used the BP_TZVPD_FINE_21 parametrization and 295 K temperature. For each compound, the psat in the subcooled liquid state () is calculated using its free energy values in the gas (Gg) and pure liquid phases (Gl):
Some of the studied compounds can be crystalline solid in bulk at the experimental temperature (i.e., 295 K), which needs to be considered in the psat calculations. COSMOtherm is able to estimate saturation vapor pressures in the crystalline-solid state (), if experimental melting temperature and the heat of fusion are given as input. The experimental melting temperatures and heats of fusion used in the COSMOtherm calculations are correspondingly listed in Tables S3 and S4 in the Supplement. The free energy of fusion (ΔGfus) at the given temperature is calculated from the given experimental values of the melting temperature and enthalpy of fusion and added to the free energy of vaporization. For each compound, its can be estimated as follows:
With the use of the ABC-SMC method to optimize the evaporation model, we determined the psat values from the data points collected in the isothermal evaporation measurements under dry conditions at 295 K. The optimized psat values for the studied compounds are summarized in Table 2. In the following sections for each compound group, we also included the psat values (at 298 K) reported by previous studies for systematic comparisons. Details of each included study can be found in Tables S6–S12 in the Supplement. Similarly to Bilde et al. (2015), we used two different symbols to distinguish psat measurements assumed to be taken in crystalline-solid or liquid states. In Figs. 1e, 2, and 4, filled squares indicate psat values assumed to be measured in a crystalline-solid state, while open circles represent psat values assumed to be measured in a liquid state.
Table 2Summary of psat at 295 K for the organic compounds measured in this study.
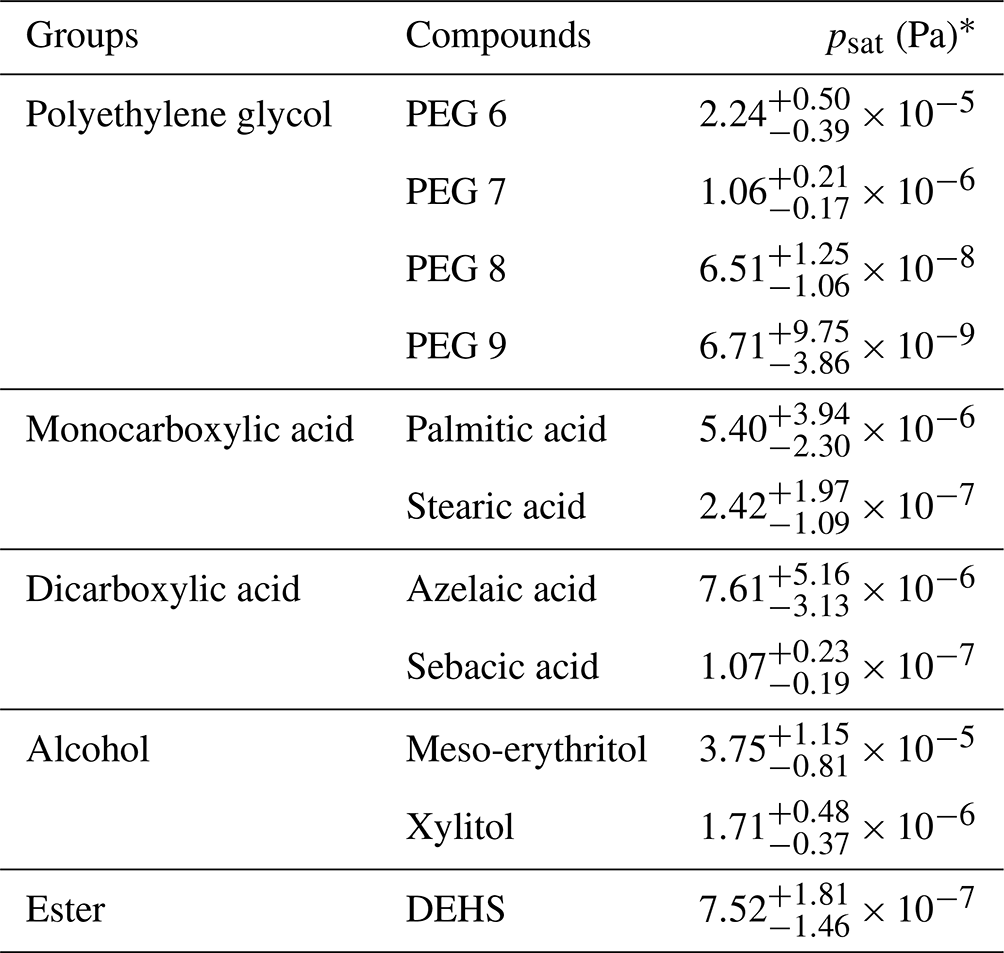
∗ The optimized psat values were estimated using α = 1, and the presented uncertainty ranges for psat include ±50 % variation in the chosen σ and the fitting uncertainties (i.e., 95 % CrIs).
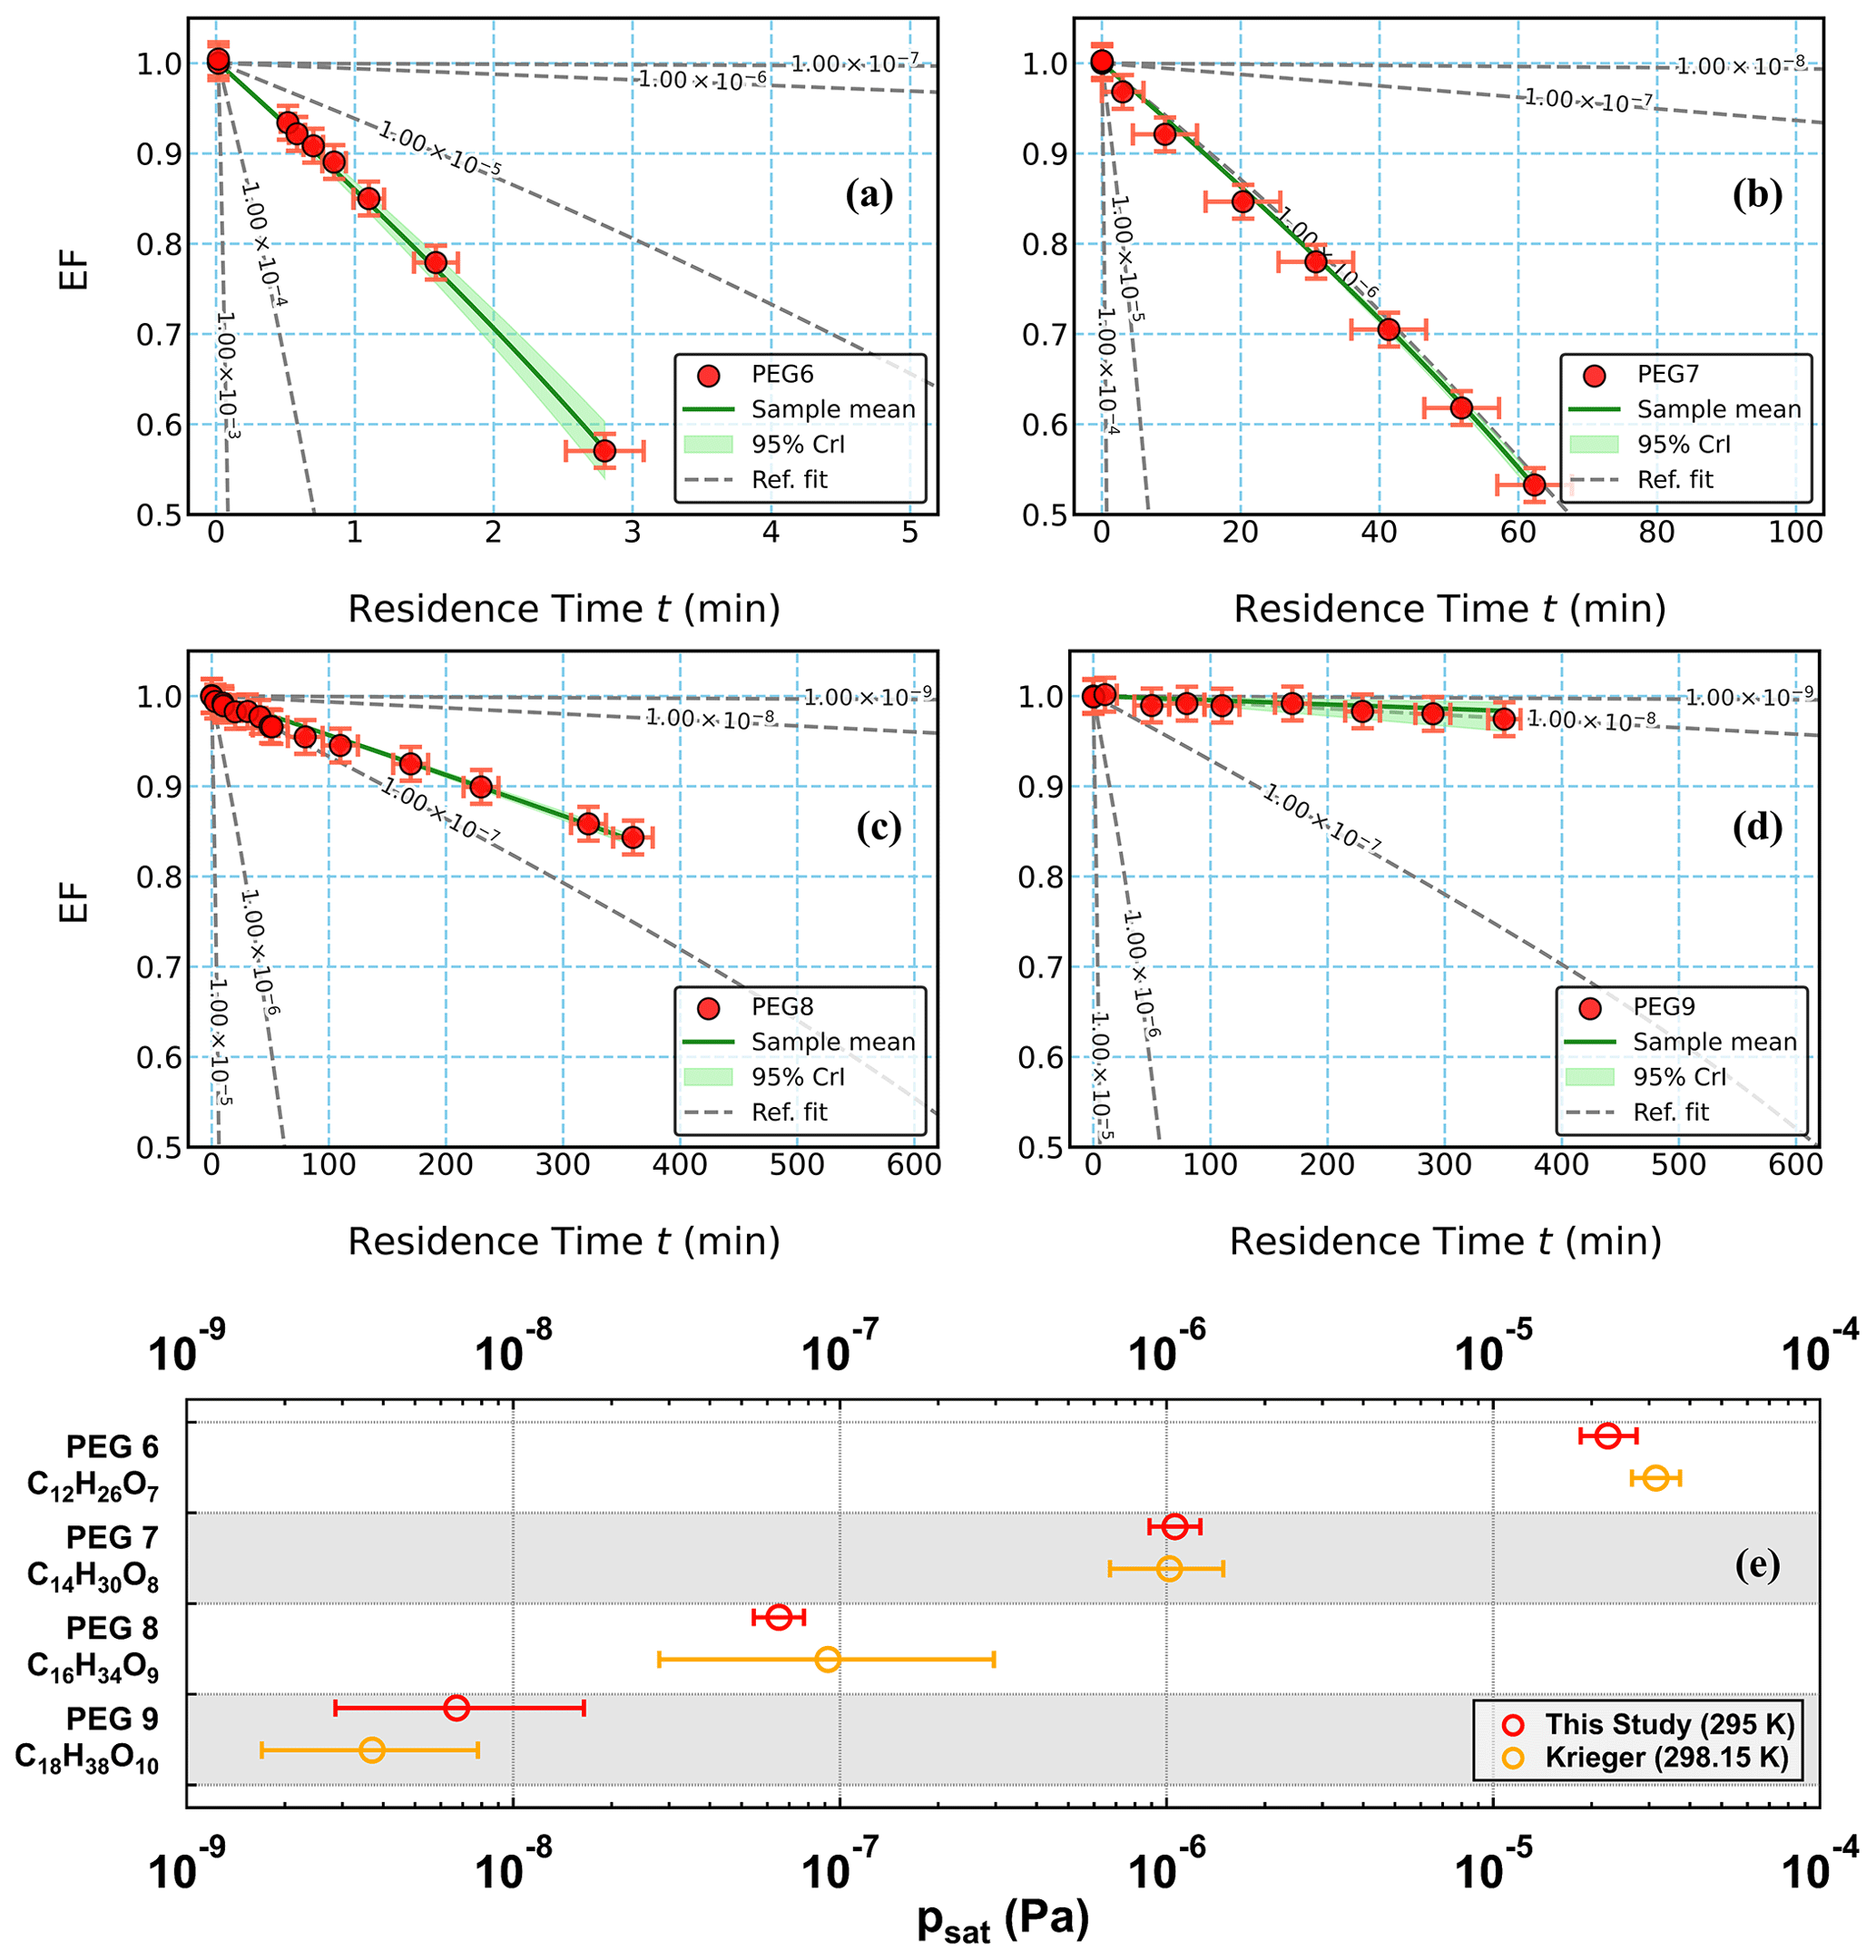
Figure 1(a–d) Measured evaporation factors (EFs; circles) as a function of residence time for PEGs (PEG 6–9), simulations with the average optimized psat values (solid green lines) and 95 % credible intervals (95 % CrIs; shaded areas in green), and simulated evaporation curves with a set of reference psat values (10−9 to 10−3 Pa, with 1-decade intervals, dashed grey lines). All simulated evaporation curves were computed using α = 1 and the chosen σ shown in Table 1. For the measured data points of EF in (a)–(d), the error bars represent a maximum uncertainty of ±1.875 % in particle size measurements on the y axis and the minimum and maximum residence times on the x axis. (e) Measured psat values for PEGs in this study shown in red together with the those reported by Krieger et al. (2018) in yellow. The psat values in this study were estimated using α = 1, with error bars including ±50 % variation in the chosen σ and the fitting uncertainties (i.e., 95 % CrIs).
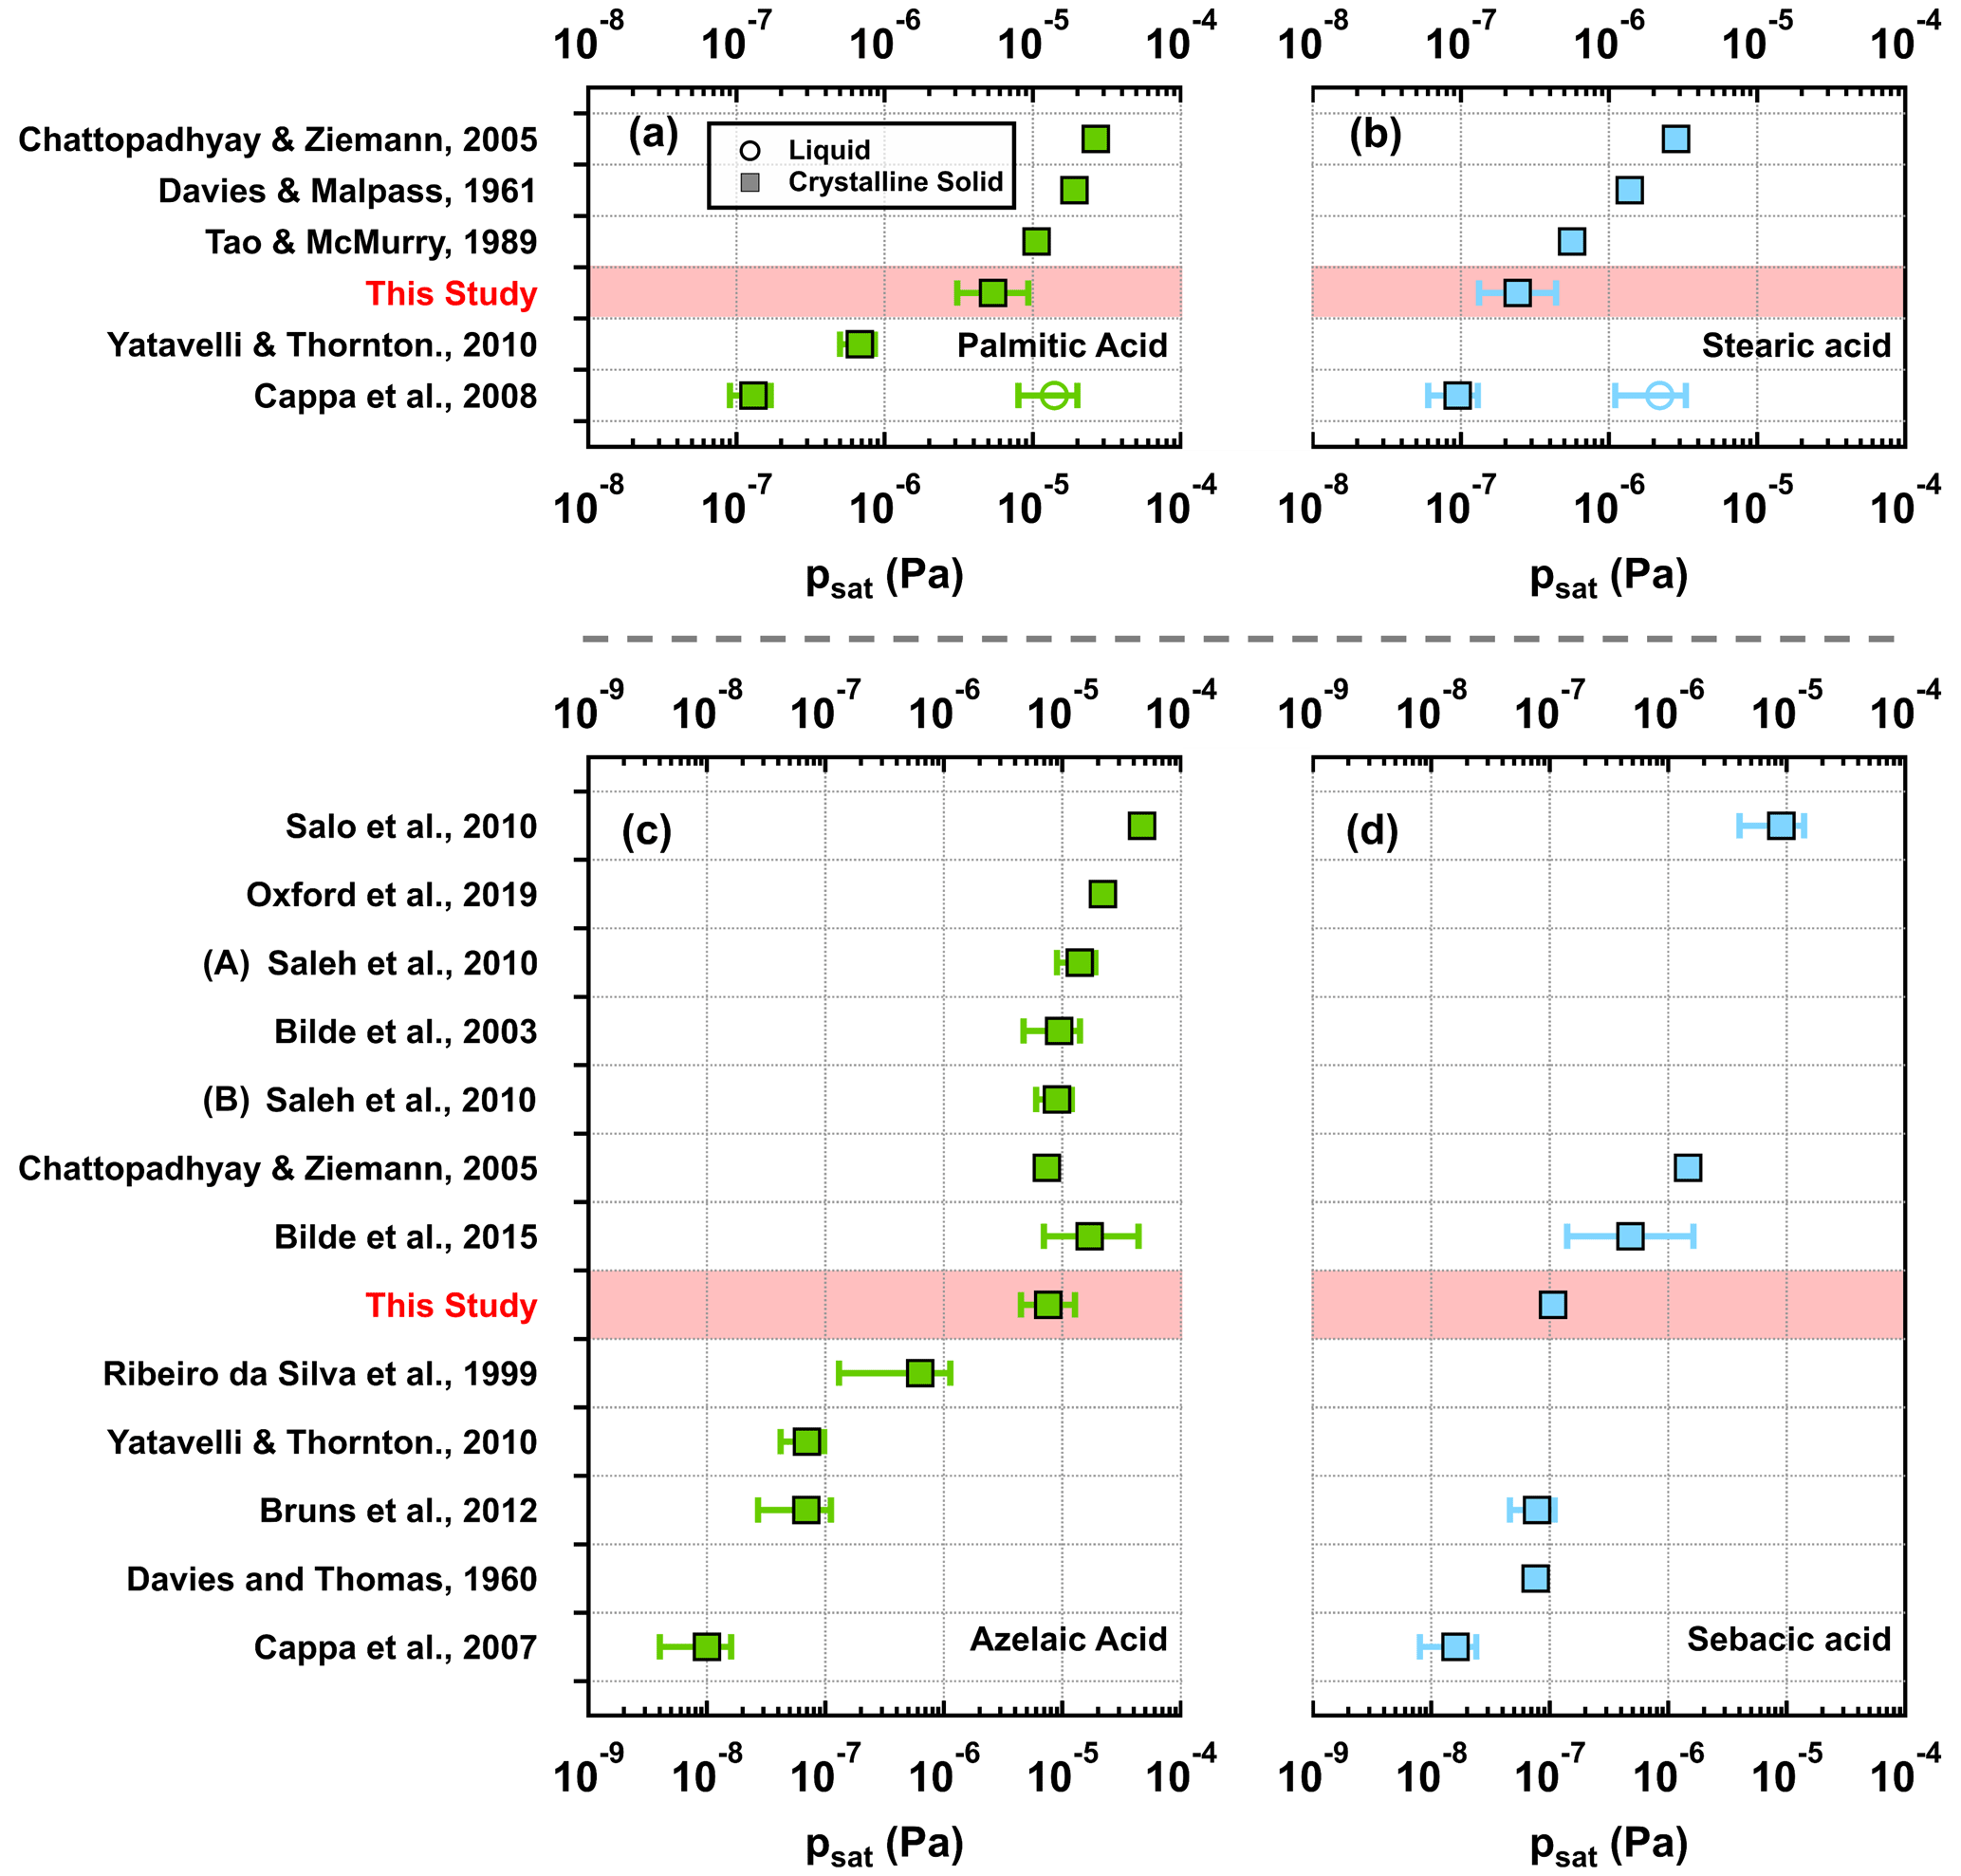
Figure 2Measured psat values from this study (squares in red shaded areas) together with those reported in the literature for palmitic acid (a; green), stearic acid (b; blue), azelaic acid (c; green), and sebacic acid (d; blue). Note that the psat values and their uncertainties from Bilde et al. (2015) were based on the combined data sets of different studies but not from a particular study or experimental method. For the psat values from this study, they were estimated using α = 1, with error bars including ±50 % variation in the chosen σ and the fitting uncertainties (i.e., 95 % CrIs).
Note that there could be uncertainties from the chosen sets of α and σ for individual compounds. To examine their impacts on the estimated psat values, we performed several sensitivity analyses, as shown in Figs. S2–S6 in the Supplement. As α decreased, the estimated psat values increased by a factor of 2 for α = 0.5 and increased by a factor of 9 for α = 0.1 compared with those estimated with α = 1. When varying σ by ±50 %, we found mostly small, and in all cases below 1 order of magnitude, changes in the estimated psat values for all three tested values of α. Previous experimental (Krechmer et al., 2017; Liu et al., 2019) and computational works (Julin et al., 2014; Von Domaros et al., 2020) have suggested that α is close to unity for the LVOC category, which the selected compounds of this study fall into. Therefore, the optimized psat values were estimated using α = 1, and the presented uncertainty ranges for psat include ±50 % variation in the chosen σ and the fitting uncertainties (i.e., 95 % CrIs). Depending on the studied compounds, the contributions of the fitting uncertainties to the presented uncertainty ranges varied from 3 % to 95 %.
3.1 Polyethylene glycols
The measured and simulated EFs of the four PEG compounds are shown in Fig. 1a–d. For the remaining compounds, the measured and simulated EFs can be found in Figs. S7–S10 in the Supplement. With increasing monomer units, the PEG particles showed slower evaporation rates and thus lower volatilities, as expected based on previous measurements (Krieger et al., 2018) and in agreement with their increasing maximum desorption temperatures measured by FIGAERO-CIMS (Ylisirniö et al., 2021). For the investigated PEGs, the psat values at 295 K were estimated to be in the range between 10−9 and 10−4 Pa. Bulk PEG6–8 were in liquid states at the experimental temperature, which was above or close to their melting points (Table S3). Given the waxy form of PEG9 at the experimental temperature of 295 K, PEG9 particles were most likely in an amorphous solid state; therefore, the psat value of PEG9 from our study should be close to that of the subcooled liquid (Bilde et al., 2015). Among these four PEGs, the estimated psat value of PEG9 has the largest relative uncertainty. This is due to the relatively small size changes of PEG9 particles within the experimental timescale of nearly 7 h. Compared with literature values for PEG6-9 reported by Krieger et al. (2018), our newly derived values agree within a factor of 2 (Fig. 1e).
3.2 Mono- and dicarboxylic acids
For the mono- and dicarboxylic acids, the measured psat values from this study and previous studies are depicted in Fig. 2a–d. Our results are in the range between 10−7 and 10−5 Pa at 295 K. All of these four compounds have melting points higher than the experimental temperature (Table S3), and therefore the psat values are here assumed to correspond to the crystalline-solid phase, although the subcooled liquid phase cannot be ruled out. For each of the four carboxylic acids, the psat value from this study is in the range of values reported by other independent measurements (Fig. 2a–d). Among all studies compared in Fig. 2, Cappa et al. (2007, 2008) reported the lowest solid psat values from their measurements (Fig. 2a–d; bottom rows). Different from other studies, they specifically preheated the particle samples for 30–60 min at a temperature slightly above the melting points in order to remove any solvent molecules which could remain in the particles after sample preparation. Prior to psat characterization with temperature-programmed desorption, the preheated samples were cooled down to 273 K to ensure that the particle samples were in crystalline-solid states.
It has been suggested that quick drying after atomization of aqueous organic droplets might not be sufficient to remove all solvents from the particles (Bilde et al., 2015). Cappa et al. (2007) concluded that the retained solvent molecules might (1) disrupt the crystal structure at the sample surface, allowing many carboxylic acid molecules to exist in configurations favoring evaporation, and (2) increase surface areas for evaporation by increasing surface roughness and porosity. These two effects could possibly increase the evaporation rates of the studied carboxylic acid molecules. For instance, the crystalline-solid psat values of palmitic acid from our study and other three independent measurements (Davies and Malpass, 1961; Tao and McMurry, 1989; Chattopadhyay and Ziemann, 2005), which used atomized samples after quick drying, are much higher than the crystalline-solid psat values from samples with less likely impact from solvent molecules (Cappa et al., 2008; Yatavelli and Thornton, 2010) but very close to the liquid psat value which was predicted by Cappa et al. (2008) based on their crystalline-solid psat value (Fig. 2a). Different from palmitic acid, our crystalline-solid psat value of stearic acid from atomized samples is very close to the crystalline-solid psat value but not the liquid one reported by Cappa et al. (2008; Fig. 2b). Furthermore, Saleh et al. (2010) found very similar psat values of azelaic acid between two sample types that were prepared using atomization (thereby involving solvent; labeled “A”) and homogeneous condensation (involving no solvent; labeled “B”; Fig. 2c).
To assess whether retention of solvents impacted our measured psat values, we normalized the crystalline-solid psat values from other studies (excluding Bilde et al., 2015) to the one obtained in our study for comparison, as shown in Fig. 3. Depending on the carboxylic acid studied, the range of the reported psat values (grey bars) spans from over 1 to almost 4 orders of magnitude. We further categorized the studies into two groups according to how the particle samples were prepared. Descriptions of sample preparation in different studies can be found in Tables S7–S10 in the Supplement. In the first group, we included studies where aerosol particles were generated by atomization followed by quick drying, while in the second group we included studies where additional procedures (e.g., preheating, homogenous nucleation) were applied to eliminate the solvents from the samples. In general, the group potentially impacted by solvents (blue bar) has higher normalized psat values compared with the group with no impact from solvents (yellow bar). Divisions between the two sample groups are clearly observed in the two dicarboxylic acids but not in the two monocarboxylic acids. Understanding whether the impact of retained solvent molecules on psat measurements is compound dependent or not would require further investigations with more organic compounds.
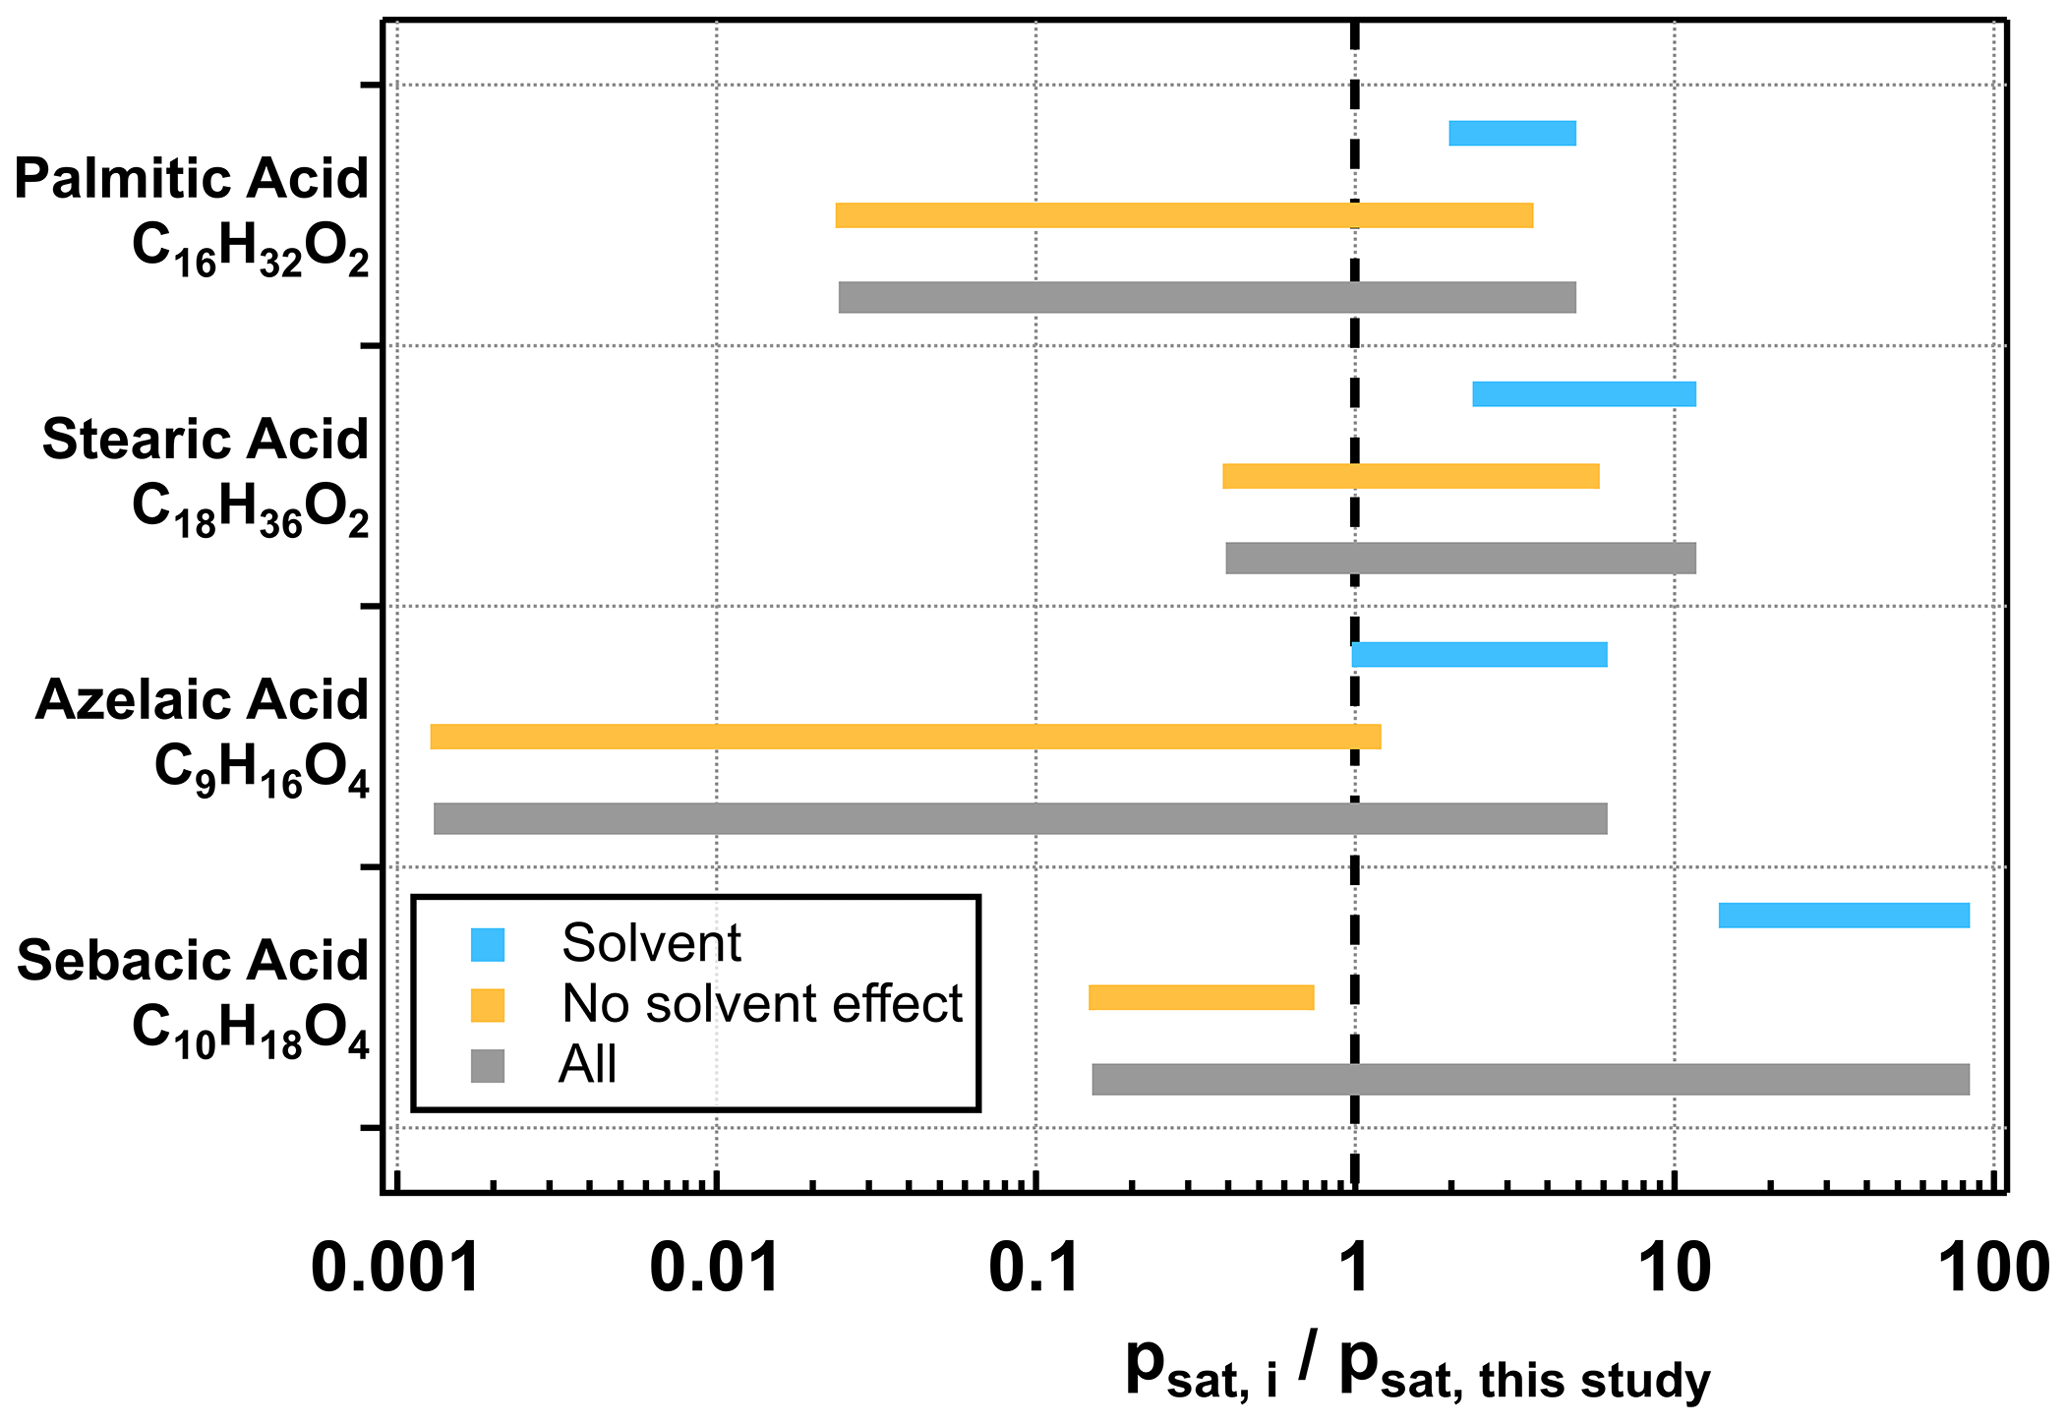
Figure 3Ranges of normalized psat values for palmitic, stearic, azelaic, and sebacic acids. Each reported psat value in the literature was normalized to that of our study. The whole range of normalized psat of each compound is shown as a grey bar. The group of samples potentially impacted by solvents is shown as a blue bar, while that with no impact from solvents is shown as a yellow bar. Note that data from Bilde et al. (2015) shown in Fig. 2 were not included for these analyses.
Among the studied carboxylic acids, the span of the measured psat values for azelaic acid is relatively large, even when only considering those studies with no impact from solvent molecules. As azelaic acid is a dicarboxylic acid with nine carbon atoms, polymorphism is one potential factor to be considered when comparing the psat values between different studies. Previous thermal desorption measurements suggested the presence of polymorphism in dicarboxylic acids with odd numbers of carbon atoms (≤ 9; Chattopadhyay and Ziemann, 2005; Salo et al., 2010) as bimodal size distribution was observed during particle evaporation at elevated temperatures (313–333 K). However, we did not observe any bimodal distributions of evaporating particles for azelaic acid in the present study, which was carried out at 295 K.
3.3 DEHS and alcohols
The measured and simulated EFs for DEHS as a function of residence time are presented in Fig. S9 in the Supplement. DEHS is in a liquid state at the experimental temperature, which is much higher than its melting point (Table S3). The psat value from our study is Pa for DEHS. We could not find any literature psat value for DEHS. However, dioctyl sebacate (DOS; an isomer with very similar structure) has a comparable psat value of Pa at 298 K (Rader et al., 1987).
For xylitol, with an additional –CHOH– in the carbon backbone, the measured psat value is approximately 1 order of magnitude lower than that of meso-erythritol (Fig. 4; bottom row). The psat value of meso-erythritol agrees with literature data within less than a factor of 2, while the psat value of xylitol agrees with that extrapolated from the measurement in Barone et al. (1990) within approximately a factor of 3 (Fig. 4).
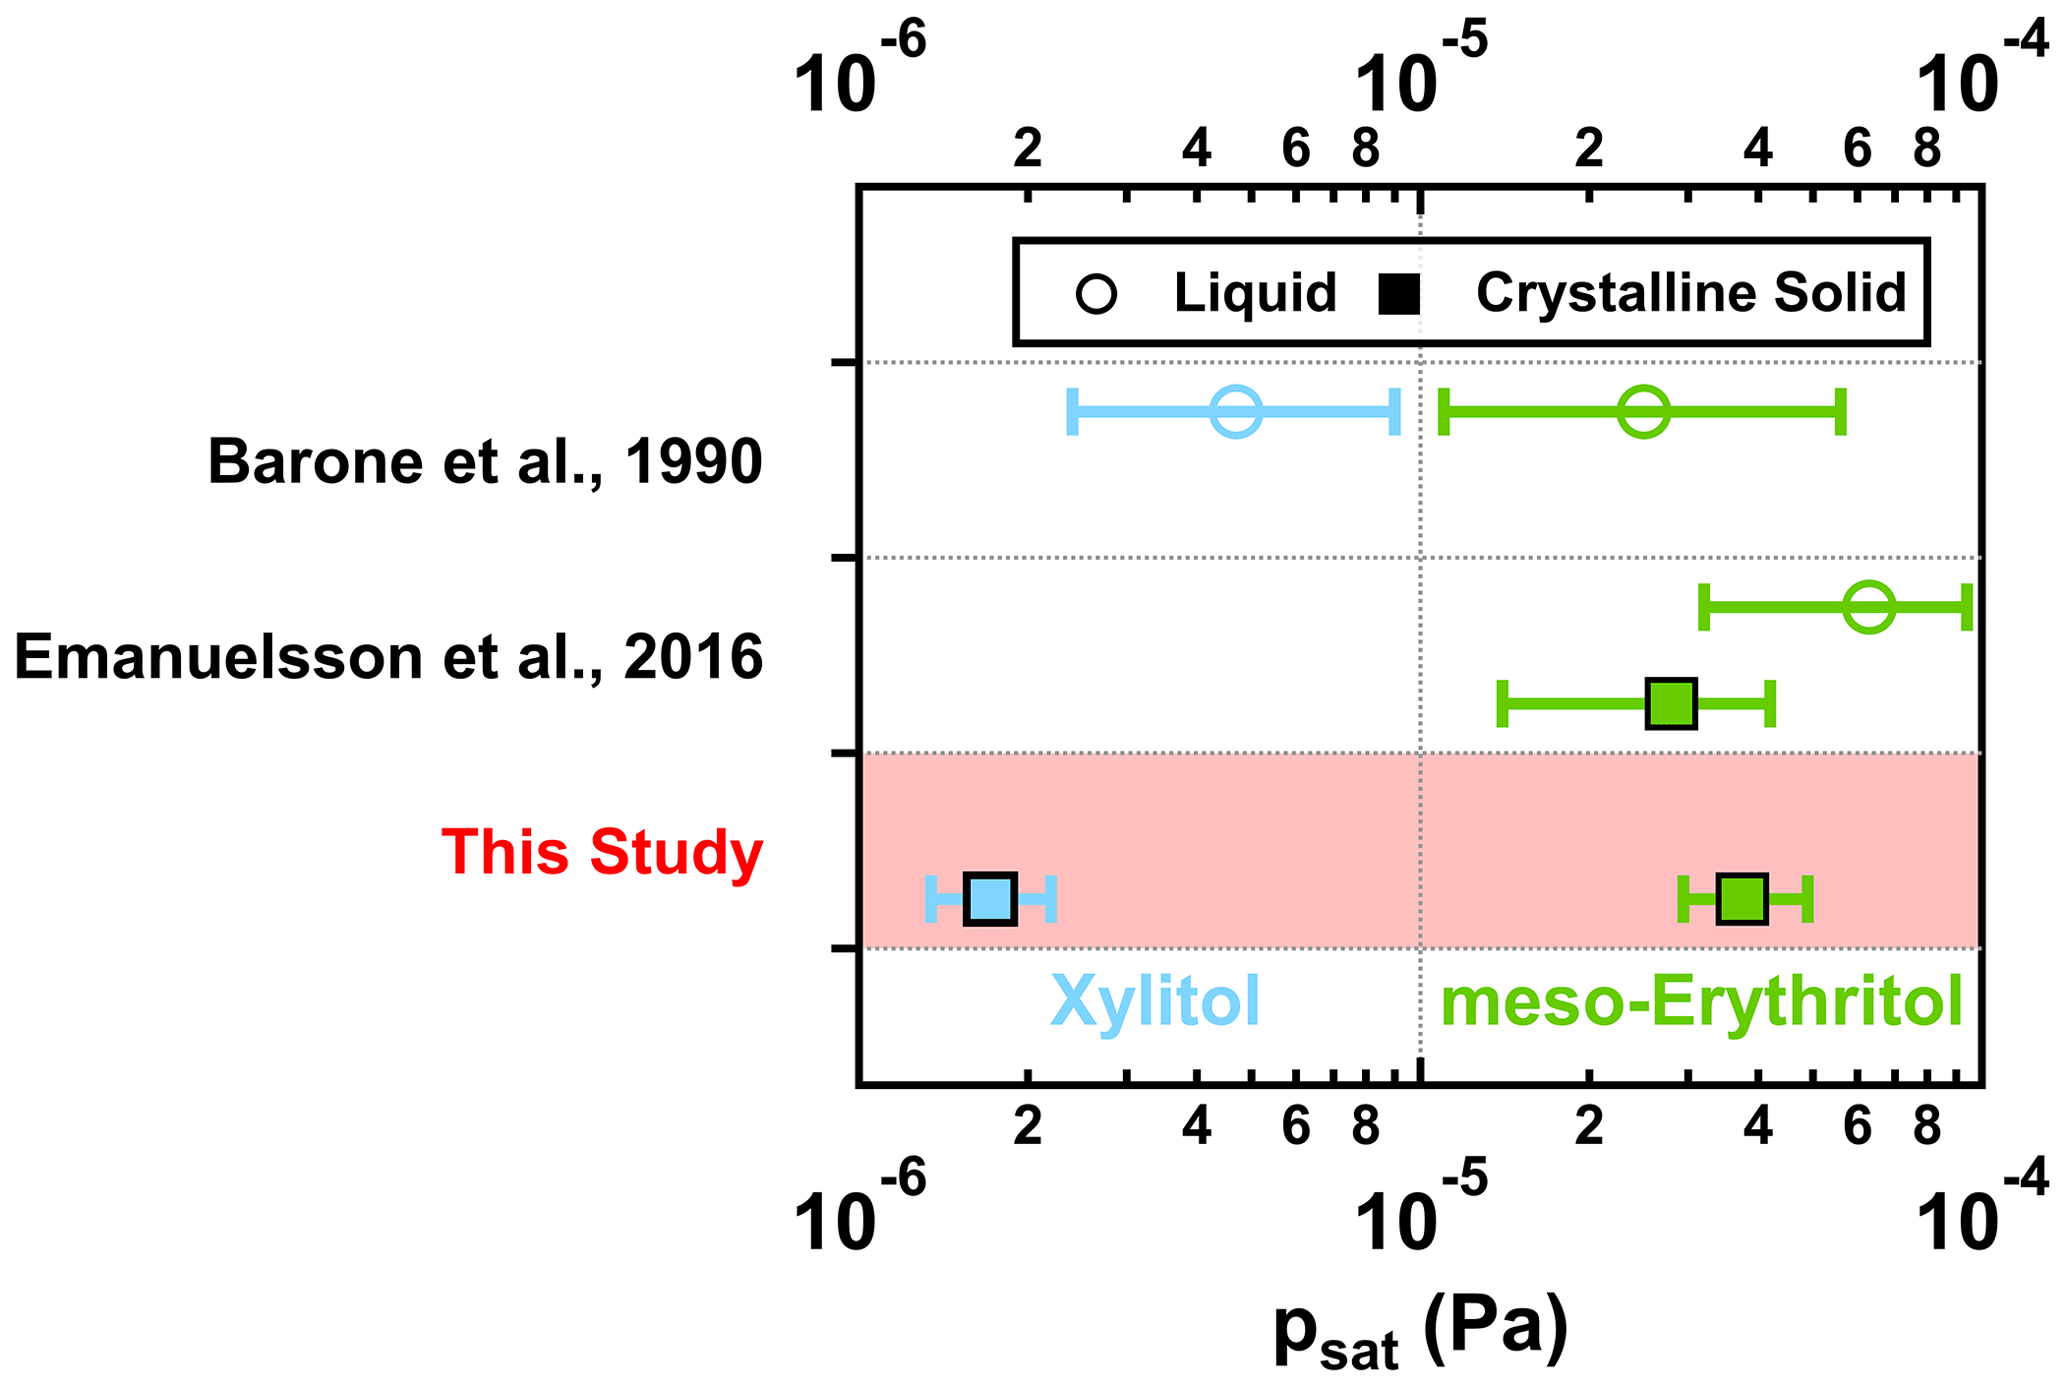
Figure 4Measured psat values from this study (squares in red shaded area) together with those reported in the literature for meso-erythritol (green) and xylitol (blue). For the psat values from this study, they were estimated using α = 1, with error bars including ±50 % variation in the chosen σ and the fitting uncertainties (i.e., 95 % CrIs).
The melting points of both bulk xylitol and meso-erythritol are above the experimental temperature (Table S3). However, Emanuelsson et al. (2016) observed a bimodal distribution of meso-erythritol particles after evaporation, indicative of two types of particles with different volatilities, and suggested the coexistence of crystalline-solid and liquid phases. The presence of such bimodal behavior becomes increasingly important with decreasing particle size and/or increasing experimental temperature (298 K: < 64 nm; 303 K: < 83 nm; 308 K: < 180 nm; Emanuelsson et al., 2016). Cheng et al. (2015) found that aerosol particles smaller than certain critical sizes tend to remain in a liquid state, even at a temperature below the bulk phase transition temperature. However, we did not observe any bimodal distributions of evaporating particles for meso-erythritol in our study. This is likely due to the fact that the particle sizes in our study were mostly larger (61–77 nm) than the size range (i.e., < 64 nm at 298 K) which exhibited bimodal evaporation behavior in Emanuelsson et al. (2016). Even though the bimodal behavior of evaporated meso-erythritol particles was not observed in our study, we cannot rule out the coexistence of crystalline-solid and liquid phase states for the meso-erythritol particles.
3.4 Comparison with psat values derived from COSMOtherm computations
The psat values of the organic compounds were estimated using COSMOtherm calculations. The results for DEHS and PEGs were estimated with the input files generated using the COSMOconf2021 program, while those for the studied carboxylic acids and alcohols were computed using the input files from COSMObase2021. At the experimental temperature of 295 K, DEHS and the four PEGs (PEG6–9) remain in liquid or amorphous states for their bulk. Thus, only their corresponding values were derived from COSMOtherm. For the remaining compounds of interest (i.e., carboxylic acids, alcohols), the bulk materials are in a crystalline-solid state at 295 K. We computed their values but also further derived their values by accounting for ΔGfus (see Eq. 8) for comparing with the measured psat values. For the values, we found the upper and lower limits of estimates using the lowest and highest experimental ΔGfus values from the literature (Table S4), respectively.
We compared the measured psat values with the and/or values estimated by COSMOtherm, as shown in Fig. 5. The psat values predicted by COSMOtherm were in reasonable agreement with the experimental values for most of the studied compounds when considering a reasonable difference of 1 log unit between measurements and COSMOtherm estimates. Based on bulk thermodynamics, the carboxylic acids and alcohols should be in a crystalline-solid phase at the experimental temperature of 295 K. Their values agree better with the experimental values compared with the values. Exceptions are found in the two dicarboxylic acids for which the values (open blue circles) are equally close to or agree better with the experimental psat value compared with the values (filled blue bars). However, the COSMOtherm systematically underpredicted the experimental psat values of PEGs by orders of magnitude. This is the opposite of what occurred in a previous computational study on multifunctional compounds, where an older parametrization (BP_TZVPD_FINE_18) of COSMOtherm was seen to overestimate the psat by a factor of 5 for every intramolecular hydrogen bond in the compound (Kurtén et al., 2018). Here, the large underestimation of the psat of the PEGs by COSMOtherm suggests that COSMOtherm overestimates the stability of condensed-phase molecules relative to gas-phase molecules.
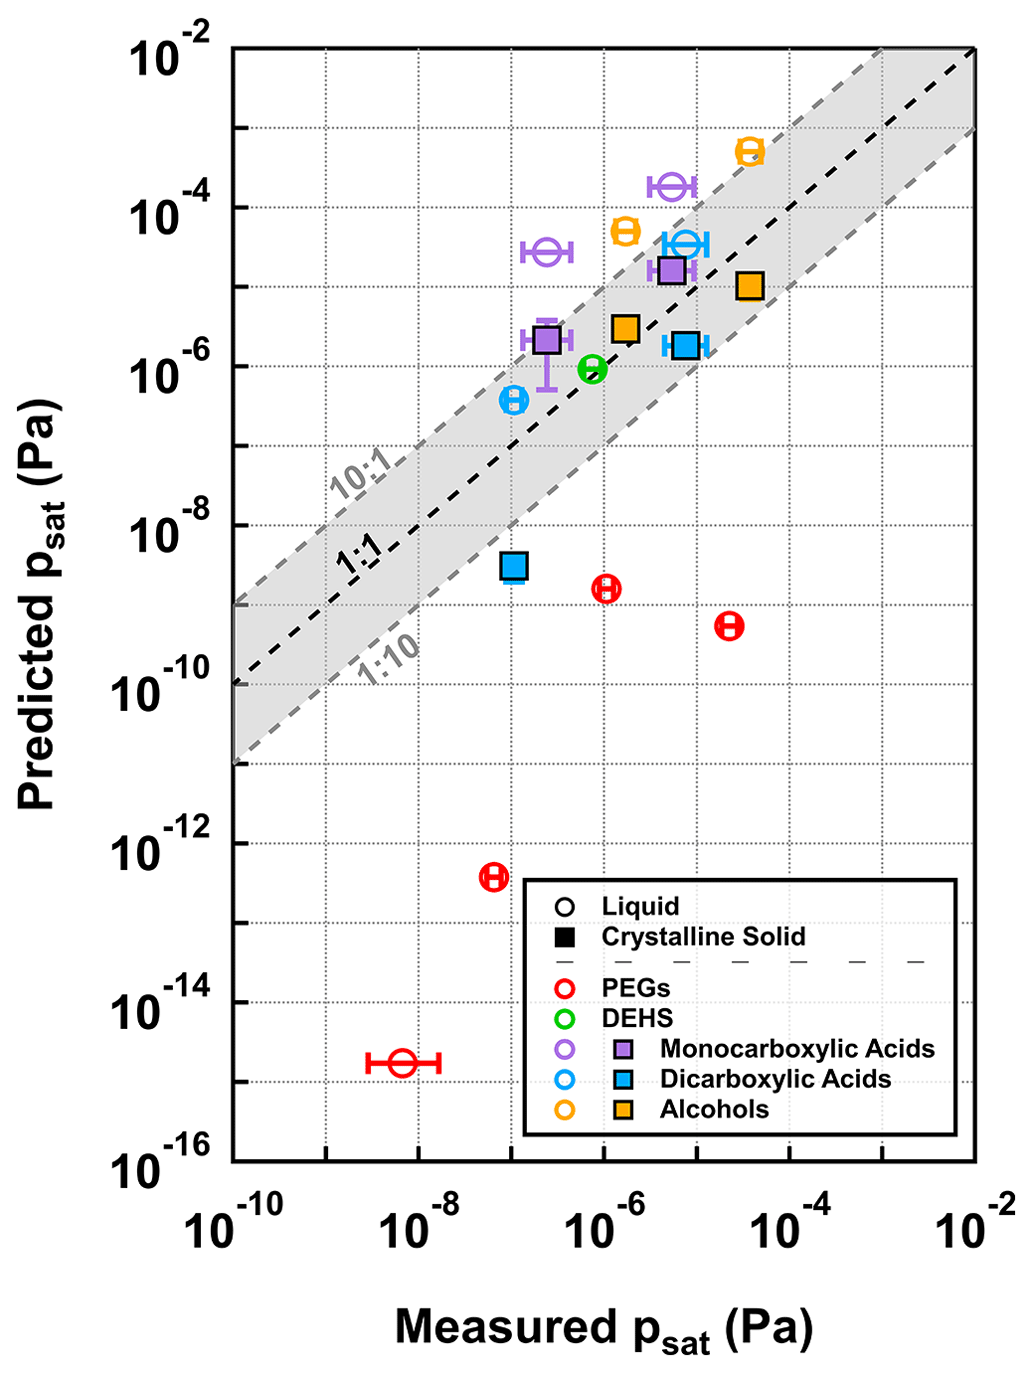
Figure 5Comparison of psat values between the measurement in this study (x axis) and different COSMOtherm predictions (y axis) at 295 K. The two different markers represent the comparisons of measured psat values with the COSMOtherm-estimated psat values of liquid (open circles) and crystalline-solid (filled squares) phase states, respectively. The error bar of each marker on the x axis represents the uncertainty range for the psat value estimated using α = 1, which includes ±50 % variation in the chosen σ and the fitting uncertainties (i.e., 95 % CrIs). The error bar of each filled square on the y axis shows the range between the maximum and minimum COSMOtherm-estimated crystalline-solid psat values. The dashed black line is the 1 : 1 line, with grey shaded areas showing a deviation of 1 log unit.
Kurtén et al. (2018) recommended selecting conformers to COSMOtherm calculations based on their intramolecular hydrogen bonding in order to improve the psat estimations of multifunctional compounds. The best agreement between experimental and computed psat values was found by using only conformers that contain no intramolecular hydrogen bonds in the COSMOtherm calculations (Kurtén et al., 2018). Here we found that the conformers of multifunctional carboxylic acids and alcohols included in the COSMObase produce accurate psat estimates even if conformers containing intramolecular hydrogen bonds were not excluded from the calculations. Note that the COSMObase conformers of the studied multifunctional carboxylic acids and alcohols were likely used in the parametrization of the psat estimates for the quantum chemistry input in the COSMO-RS model. This may explain why the conformers of COSMObase produce accurate psat estimates for these compounds. Systematic conformer sampling and selecting conformers based on their intramolecular hydrogen bonding, suggested by Kurtén et al. (2018), led to higher psat values (lower psat for xylitol) than the conformers of COSMObase, worsening the agreement with experiments (Table S13). The discrepancy between the COSMOtherm-derived and experimental psat of the PEGs may be caused by the lack of organic compounds similar to large PEGs in the set of compounds used in the BP_TZVPD_FINE_21 parametrization of COSMOtherm.
Here we presented a TDMA-based method to investigate the isothermal evaporation of dry organic nanoparticles that consist of a single compound in an RTC. Using this method, we characterized organic compounds with psat spanning from 10−8 to 10−4 Pa at 295 K. The experimentally determined psat values from this study are within the ranges of those reported in previous studies based on different measurement techniques. The advantages of our method are that the evaporation measurements are performed at an atmospherically relevant temperature and its ability to determine psat values down to 10−8 Pa in the LVOC range. We acknowledge that there could be uncertainties regarding the particle phase state and the presence of polymorphism, which have been also discussed in previous volatility studies (Bilde et al., 2003; Chattopadhyay and Ziemann, 2005; Cappa et al., 2007; Emanuelsson et al., 2016). To address such uncertainties would require in situ spectroscopic methods (e.g., Mie resonance spectroscopy, Raman spectroscopy) that are sensitive enough to differentiate between crystalline-solid, amorphous, and subcooled liquid states (Price et al., 2022) and to identify different polymorphic forms (Yeung et al., 2010). In addition, it has been suggested that aerosol materials with high bulk melting points would be in liquid states at room temperature, once reaching a critical diameter between 12 and 40 nm (Cheng et al., 2015). However, the experimental data on such phase changes are limited to a very small set of compounds (e.g., sodium chloride, ammonium sulfate, polystyrene). Future investigations on the size dependence of phase transitions of LVOCs are warranted. Such knowledge will advance our understanding about phase states but also the volatilities of LVOCs, when they exist in a particle size range (50–100 nm) highly relevant to cloud condensation nuclei activation (Kerminen et al., 2012). Furthermore, we found that COSMOtherm is able to reproduce our measured psat values for the studied compounds except PEGs, mostly within 1 order of magnitude. The large difference between the measured and calculated psat values of PEG highlights the importance of conformer selection in COSMOtherm calculations for new types of compounds that have not been used in the parametrization of the model. Unsuitable conformer selection may therefore lead to substantial uncertainties, especially for LVOCs that have not been used in the parametrization of the model.
The current study was focused on psat characterization for dry single-compound particles at one set temperature. Nonetheless, our method can be further used to perform isothermal evaporation experiments at different temperature and RH settings. This will help probe two other important thermodynamics properties – enthalpy of vaporization and organic activity coefficient – which are important in the gas-to-particle partitioning of organic compounds. Furthermore, the method can be extended to study interactions between compounds in multicomponent aerosol particles, e.g., the matrix effect of inorganic salts and non-volatile organics on the isothermal evaporation of LVOCs (Liu et al., 2020). For atmospheric SOA particles which consist of hundreds or even thousands of compounds, their evaporation rates are regulated by the complex interplay between volatility distribution, particle viscosity, and particle-phase chemistry. Previous studies with a similar experimental setup have shown biogenic SOA particle evaporation to be dependent on RH (Yli-Juuti et al., 2017), temperature (Li et al., 2019), oxidation levels (Buchholz et al., 2019), or molecular composition (Li et al., 2021, 2023). This study, together with previous studies on SOA particles, has shown the applicability of combining RTC experiments with process modeling. The RTC method was used here only to probe size changes during particle evaporation; obtaining molecular-level insights into SOA particle evaporation processes requires further detailed composition analysis.
The data set is available upon request from the corresponding author.
The supplement related to this article is available online at: https://doi.org/10.5194/acp-23-6863-2023-supplement.
ZL designed the study. ZL and MV carried out the laboratory experiments. NH performed the COSMOtherm calculations. ZL and OPT ran the optimization model. ZL, NH, SS, and TYJ analyzed and interpreted data. ZL wrote the paper with contributions from all coauthors.
The contact author has declared that none of the authors has any competing interests.
Publisher’s note: Copernicus Publications remains neutral with regard to jurisdictional claims in published maps and institutional affiliations.
The authors would like to thank Angela Buchholz for their useful assistance with the measurement setup. We also thank CSC – IT Center for Science, Finland, for their computational resources.
This research has been supported by the Academy of Finland (grant nos. 337550, 317373, 338171, and 346371) and the Itä-Suomen Yliopisto (Doctoral Program in Environmental Physics, Health and Biology).
This paper was edited by Thomas Berkemeier and reviewed by two anonymous referees.
Babar, Z. B., Ashraf, F., Park, J.-H., and Lim, H.-J.: Volatility parameters of secondary organic aerosol components determined using a thermal denuder, Atmos. Environ., 226, 117405, https://doi.org/10.1016/j.atmosenv.2020.117405, 2020.
Barone, G., Della Gatta, G., Ferro, D., and Piacente, V.: Enthalpies and entropies of sublimation, vaporization and fusion of nine polyhydric alcohols, Journal of the Chemical Society, Faraday Transactions, 86, 75–79, 1990.
Bianchi, F., Kurten, T., Riva, M., Mohr, C., Rissanen, M. P., Roldin, P., Berndt, T., Crounse, J. D., Wennberg, P. O., Mentel, T. F., Wildt, J., Junninen, H., Jokinen, T., Kulmala, M., Worsnop, D. R., Thornton, J. A., Donahue, N., Kjaergaard, H. G., and Ehn, M.: Highly oxygenated organic molecules (HOM) from gas-phase autoxidation involving peroxy radicals: A key contributor to atmospheric aerosol, Chem. Rev., 119, 3472–3509, https://doi.org/10.1021/acs.chemrev.8b00395, 2019.
Bilde, M., Svenningsson, B., Mønster, J., and Rosenørn, T.: Even- odd alternation of evaporation rates and vapor pressures of C3–C9 dicarboxylic acid aerosols, Environ. Sci. Technol., 37, 1371–1378, 2003.
Bilde, M., Barsanti, K., Booth, M., Cappa, C. D., Donahue, N. M., Emanuelsson, E. U., McFiggans, G., Krieger, U. K., Marcolli, C., Topping, D., Ziemann, P., Barley, M., Clegg, S., Dennis-Smither, B., Hallquist, M., Hallquist, A. M., Khlystov, A., Kulmala, M., Mogensen, D., Percival, C. J., Pope, F., Reid, J. P., Ribeiro da Silva, M. A., Rosenoern, T., Salo, K., Soonsin, V. P., Yli-Juuti, T., Prisle, N. L., Pagels, J., Rarey, J., Zardini, A. A., and Riipinen, I.: Saturation vapor pressures and transition enthalpies of low-volatility organic molecules of atmospheric relevance: From dicarboxylic acids to complex mixtures, Chem. Rev., 115, 4115–4156, https://doi.org/10.1021/cr5005502, 2015.
BIOVIA COSMOconf: 2021, Dassault Systèmes, http://www.3ds.com, last access: 29 January 2021.
BIOVIA COSMOtherm: Release 2021, Dassault Systèmes, http://www.3ds.com, last access: 1 April 2021.
Booth, A. M., Markus, T., McFiggans, G., Percival, C. J., Mcgillen, M. R., and Topping, D. O.: Design and construction of a simple Knudsen Effusion Mass Spectrometer (KEMS) system for vapour pressure measurements of low volatility organics, Atmos. Meas. Tech., 2, 355–361, https://doi.org/10.5194/amt-2-355-2009, 2009.
Bruns, E. A., Greaves, J., and Finlayson-Pitts, B. J.: Measurement of vapor pressures and heats of sublimation of dicarboxylic acids using atmospheric solids analysis probe mass spectrometry, J. Phys. Chem. A, 116, 5900–5909, https://doi.org/10.1021/jp210021f, 2012.
Buchholz, A., Lambe, A. T., Ylisirniö, A., Li, Z., Tikkanen, O.-P., Faiola, C., Kari, E., Hao, L., Luoma, O., Huang, W., Mohr, C., Worsnop, D. R., Nizkorodov, S. A., Yli-Juuti, T., Schobesberger, S., and Virtanen, A.: Insights into the O : C-dependent mechanisms controlling the evaporation of α-pinene secondary organic aerosol particles, Atmos. Chem. Phys., 19, 4061–4073, https://doi.org/10.5194/acp-19-4061-2019, 2019.
Cai, C., Stewart, D. J., Reid, J. P., Zhang, Y. H., Ohm, P., Dutcher, C. S., and Clegg, S. L.: Organic component vapor pressures and hygroscopicities of aqueous aerosol measured by optical tweezers, J. Phys. Chem. A, 119, 704–718, https://doi.org/10.1021/jp510525r, 2015.
Cain, K. P., Karnezi, E., and Pandis, S. N.: Challenges in determining atmospheric organic aerosol volatility distributions using thermal evaporation techniques, Aerosol Sci. Tech., 54, 941–957, 2020.
Cappa, C. D., Lovejoy, E. R., and Ravishankara, A.: Determination of evaporation rates and vapor pressures of very low volatility compounds: A study of the C4–C10 and C12 dicarboxylic acids, J. Phys. Chem. A, 111, 3099–3109, 2007.
Cappa, C. D., Lovejoy, E. R., and Ravishankara, A. R.: Evaporation rates and vapor pressures of the even-numbered C8–C18 monocarboxylic acids, J. Phys. Chem. A, 112, 3959–3964, https://doi.org/10.1021/jp710586m, 2008.
Chattopadhyay, S. and Ziemann, P. J.: Vapor pressures of substituted and unsubstituted monocarboxylic and dicarboxylic acids measured using an improved thermal desorption particle beam mass spectrometry method, Aerosol Sci. Tech., 39, 1085–1100, 2005.
Cheng, Y., Su, H., Koop, T., Mikhailov, E., and Poschl, U.: Size dependence of phase transitions in aerosol nanoparticles, Nat. Commun., 6, 5923, https://doi.org/10.1038/ncomms6923, 2015.
Compernolle, S., Ceulemans, K., and Müller, J.-F.: EVAPORATION: a new vapour pressure estimation methodfor organic molecules including non-additivity and intramolecular interactions, Atmos. Chem. Phys., 11, 9431–9450, https://doi.org/10.5194/acp-11-9431-2011, 2011.
Dang, C., Bannan, T., Shelley, P., Priestley, M., Worrall, S. D., Waters, J., Coe, H., Percival, C. J., and Topping, D.: The effect of structure and isomerism on the vapor pressures of organic molecules and its potential atmospheric relevance, Aerosol Sci. Tech., 53, 1040–1055, 2019.
Davies, M. and Malpass, V.: 212. Heats of sublimation of straight-chain monocarboxylic acids, J. Chem. Soc., 1961, 1048–1055, https://doi.org/10.1039/jr9610001048, 1961.
Davies, M. and Thomas, G. H.: The lattice energies, infra-red spectra, and possible cyclization of some dicarboxylic acids, T. Faraday Soc., 56, 185–192, https://doi.org/10.1039/tf9605600185, 1960.
Donahue, N. M., Epstein, S. A., Pandis, S. N., and Robinson, A. L.: A two-dimensional volatility basis set: 1. organic-aerosol mixing thermodynamics, Atmos. Chem. Phys., 11, 3303–3318, https://doi.org/10.5194/acp-11-3303-2011, 2011.
Eckert, F. and Klamt, A.: Fast solvent screening via quantum chemistry: COSMO-RS approach, AIChE J., 48, 369–385, 2002.
Ehn, M., Thornton, J. A., Kleist, E., Sipila, M., Junninen, H., Pullinen, I., Springer, M., Rubach, F., Tillmann, R., Lee, B., Lopez-Hilfiker, F., Andres, S., Acir, I. H., Rissanen, M., Jokinen, T., Schobesberger, S., Kangasluoma, J., Kontkanen, J., Nieminen, T., Kurten, T., Nielsen, L. B., Jorgensen, S., Kjaergaard, H. G., Canagaratna, M., Maso, M. D., Berndt, T., Petaja, T., Wahner, A., Kerminen, V. M., Kulmala, M., Worsnop, D. R., Wildt, J., and Mentel, T. F.: A large source of low-volatility secondary organic aerosol, Nature, 506, 476–479, https://doi.org/10.1038/nature13032, 2014.
Eichler, P., Müller, M., D'Anna, B., and Wisthaler, A.: A novel inlet system for online chemical analysis of semi-volatile submicron particulate matter, Atmos. Meas. Tech., 8, 1353–1360, https://doi.org/10.5194/amt-8-1353-2015, 2015.
Emanuelsson, E. U., Tschiskale, M., and Bilde, M.: Phase state and saturation vapor pressure of submicron particles of meso-erythritol at ambient conditions, J. Phys. Chem. A, 120, 7183–7191, 2016.
Fuchs, N. and Sutugin, A.: High-dispersed aerosols, in: Topics in current aerosol research, Elsevier, p. 1, ISBN 9780080166742, https://doi.org/10.1016/b978-0-08-016674-2.50006-6, 1971.
Fuller, E. N., Schettler, P. D., and Giddings, J. C.: New method for prediction of binary gas-phase diffusion coefficients, Ind. Eng. Chem., 58, 18–27, 1966.
Goldfarb, J. L. and Suuberg, E. M.: Vapor pressures and thermodynamics of oxygen-containing polycyclic aromatic hydrocarbons measured using knudsen effusion, Environ. Toxicol. Chem., 27, 1244–1249, https://doi.org/10.1897/07-486, 2008.
Hallquist, M., Wenger, J. C., Baltensperger, U., Rudich, Y., Simpson, D., Claeys, M., Dommen, J., Donahue, N. M., George, C., Goldstein, A. H., Hamilton, J. F., Herrmann, H., Hoffmann, T., Iinuma, Y., Jang, M., Jenkin, M. E., Jimenez, J. L., Kiendler-Scharr, A., Maenhaut, W., McFiggans, G., Mentel, Th. F., Monod, A., Prévôt, A. S. H., Seinfeld, J. H., Surratt, J. D., Szmigielski, R., and Wildt, J.: The formation, properties and impact of secondary organic aerosol: current and emerging issues, Atmos. Chem. Phys., 9, 5155–5236, https://doi.org/10.5194/acp-9-5155-2009, 2009.
Holzinger, R., Williams, J., Herrmann, F., Lelieveld, J., Donahue, N. M., and Röckmann, T.: Aerosol analysis using a Thermal-Desorption Proton-Transfer-Reaction Mass Spectrometer (TD-PTR-MS): a new approach to study processing of organic aerosols, Atmos. Chem. Phys., 10, 2257–2267, https://doi.org/10.5194/acp-10-2257-2010, 2010.
Huang, W., Saathoff, H., Pajunoja, A., Shen, X., Naumann, K.-H., Wagner, R., Virtanen, A., Leisner, T., and Mohr, C.: α-Pinene secondary organic aerosol at low temperature: chemical composition and implications for particle viscosity, Atmos. Chem. Phys., 18, 2883–2898, https://doi.org/10.5194/acp-18-2883-2018, 2018.
Hyttinen, N., Wolf, M., Rissanen, M. P., Ehn, M., Perakyla, O., Kurtén, T., and Prisle, N. L.: Gas-to-particle partitioning of cyclohexene-and α-pinene-derived highly oxygenated dimers evaluated using COSMOtherm, J. Phys. Chem. A, 125, 3726–3738, 2021.
Hyttinen, N., Pullinen, I., Nissinen, A., Schobesberger, S., Virtanen, A., and Yli-Juuti, T.: Comparison of saturation vapor pressures of α-pinene + O3 oxidation products derived from COSMO-RS computations and thermal desorption experiments, Atmos. Chem. Phys., 22, 1195–1208, https://doi.org/10.5194/acp-22-1195-2022, 2022.
Jimenez, J. L., Canagaratna, M. R., Donahue, N. M., Prevot, A. S., Zhang, Q., Kroll, J. H., DeCarlo, P. F., Allan, J. D., Coe, H., Ng, N. L., Aiken, A. C., Docherty, K. S., Ulbrich, I. M., Grieshop, A. P., Robinson, A. L., Duplissy, J., Smith, J. D., Wilson, K. R., Lanz, V. A., Hueglin, C., Sun, Y. L., Tian, J., Laaksonen, A., Raatikainen, T., Rautiainen, J., Vaattovaara, P., Ehn, M., Kulmala, M., Tomlinson, J. M., Collins, D. R., Cubison, M. J., Dunlea, E. J., Huffman, J. A., Onasch, T. B., Alfarra, M. R., Williams, P. I., Bower, K., Kondo, Y., Schneider, J., Drewnick, F., Borrmann, S., Weimer, S., Demerjian, K., Salcedo, D., Cottrell, L., Griffin, R., Takami, A., Miyoshi, T., Hatakeyama, S., Shimono, A., Sun, J. Y., Zhang, Y. M., Dzepina, K., Kimmel, J. R., Sueper, D., Jayne, J. T., Herndon, S. C., Trimborn, A. M., Williams, L. R., Wood, E. C., Middlebrook, A. M., Kolb, C. E., Baltensperger, U., and Worsnop, D. R.: Evolution of organic aerosols in the atmosphere, Science, 326, 1525–1529, https://doi.org/10.1126/science.1180353, 2009.
Julin, J., Winkler, P. M., Donahue, N. M., Wagner, P. E., and Riipinen, I.: Near-unity mass accommodation coefficient of organic molecules of varying structure, Environ. Sci. Technol., 48, 12083–12089, https://doi.org/10.1021/es501816h, 2014.
Kerminen, V.-M., Paramonov, M., Anttila, T., Riipinen, I., Fountoukis, C., Korhonen, H., Asmi, E., Laakso, L., Lihavainen, H., Swietlicki, E., Svenningsson, B., Asmi, A., Pandis, S. N., Kulmala, M., and Petäjä, T.: Cloud condensation nuclei production associated with atmospheric nucleation: a synthesis based on existing literature and new results, Atmos. Chem. Phys., 12, 12037–12059, https://doi.org/10.5194/acp-12-12037-2012, 2012.
Klamt, A.: Conductor-like screening model for real solvents: A new approach to the quantitative calculation of solvation phenomena, J. Phys. Chem., 99, 2224–2235, 1995.
Klamt, A., Jonas, V., Bürger, T., and Lohrenz, J. C.: Refinement and parametrization of COSMO-RS, J. Phys. Chem. A, 102, 5074–5085, 1998.
Klinger, E., Rickert, D., and Hasenauer, J.: pyABC: Distributed, likelihood-free inference, Bioinformatics, 34, 3591–3593, https://doi.org/10.1093/bioinformatics/bty361, 2018.
Koponen, I. K., Riipinen, I., Hienola, A., Kulmala, M., and Bilde, M.: Thermodynamic properties of malonic, succinic, and glutaric acids: Evaporation rates and saturation vapor pressures, Environ. Sci. Technol., 41, 3926–3933, https://doi.org/10.1021/es0611240, 2007.
Krechmer, J. E., Day, D. A., Ziemann, P. J., and Jimenez, J. L.: Direct measurements of gas/particle partitioning and mass accommodation coefficients in environmental chambers, Environ. Sci. Technol., 51, 11867–11875, https://doi.org/10.1021/acs.est.7b02144, 2017.
Krieger, U. K., Siegrist, F., Marcolli, C., Emanuelsson, E. U., Gøbel, F. M., Bilde, M., Marsh, A., Reid, J. P., Huisman, A. J., Riipinen, I., Hyttinen, N., Myllys, N., Kurtén, T., Bannan, T., Percival, C. J., and Topping, D.: A reference data set for validating vapor pressure measurement techniques: homologous series of polyethylene glycols, Atmos. Meas. Tech., 11, 49–63, https://doi.org/10.5194/amt-11-49-2018, 2018.
Kurten, T., Tiusanen, K., Roldin, P., Rissanen, M., Luy, J.-N., Boy, M., Ehn, M., and Donahue, N.: α-Pinene autoxidation products may not have extremely low saturation vapor pressures despite high O : C ratios, J. Phys. Chem. A, 120, 2569–2582, 2016.
Kurtén, T., Hyttinen, N., D'Ambro, E. L., Thornton, J., and Prisle, N. L.: Estimating the saturation vapor pressures of isoprene oxidation products C5H12O6 and C5H10O6 using COSMO-RS, Atmos. Chem. Phys., 18, 17589–17600, https://doi.org/10.5194/acp-18-17589-2018, 2018.
Li, W. and Chen, D.-R.: Performance of nano-dma operated with different gases for sheath and aerosol carrier flows, Aerosol Sci. Tech., 39, 931–940, https://doi.org/10.1080/02786820500346520, 2005.
Li, Z., Tikkanen, O.-P., Buchholz, A., Hao, L., Kari, E., Yli-Juuti, T., and Virtanen, A.: Effect of decreased temperature on the evaporation of α-pinene secondary organic aerosol particles, ACS Earth Space Chem., 3, 2775–2785, 2019.
Li, Z., Buchholz, A., Ylisirniö, A., Barreira, L., Hao, L., Schobesberger, S., Yli-Juuti, T., and Virtanen, A.: Evolution of volatility and composition in sesquiterpene-mixed and α-pinene secondary organic aerosol particles during isothermal evaporation, Atmos. Chem. Phys., 21, 18283–18302, https://doi.org/10.5194/acp-21-18283-2021, 2021.
Li, Z., Buchholz, A., Barreira, L. M. F., Ylisirniö, A., Hao, L., Pullinen, I., Schobesberger, S., and Virtanen, A.: Isothermal evaporation of α-pinene secondary organic aerosol particles formed under low NOx and high NOx conditions, Atmos. Chem. Phys., 23, 203–220, https://doi.org/10.5194/acp-23-203-2023, 2023.
Liepe, J., Kirk, P., Filippi, S., Toni, T., Barnes, C. P., and Stumpf, M. P.: A framework for parameter estimation and model selection from experimental data in systems biology using approximate bayesian computation, Nat. Protoc., 9, 439–456, https://doi.org/10.1038/nprot.2014.025, 2014.
Liu, X., Day, D. A., Krechmer, J. E., Brown, W., Peng, Z., Ziemann, P. J., and Jimenez, J. L.: Direct measurements of semi-volatile organic compound dynamics show near-unity mass accommodation coefficients for diverse aerosols, Commun. Chem., 2, 98, https://doi.org/10.1038/s42004-019-0200-x, 2019.
Liu, X., Day, D. A., Krechmer, J. E., Ziemann, P. J., and Jimenez, J. L.: Determining activity coefficients of SOA from isothermal evaporation in a laboratory chamber, Environ. Sci. Technol. Lett., 8, 212–217, 2020.
Lopez-Hilfiker, F. D., Mohr, C., Ehn, M., Rubach, F., Kleist, E., Wildt, J., Mentel, Th. F., Lutz, A., Hallquist, M., Worsnop, D., and Thornton, J. A.: A novel method for online analysis of gas and particle composition: description and evaluation of a Filter Inlet for Gases and AEROsols (FIGAERO), Atmos. Meas. Tech., 7, 983–1001, https://doi.org/10.5194/amt-7-983-2014, 2014.
Mitchem, L. and Reid, J. P.: Optical manipulation and characterisation of aerosol particles using a single-beam gradient force optical trap, Chem. Soc. Rev., 37, 756–769, https://doi.org/10.1039/b609713h, 2008.
Mohr, C., Thornton, J. A., Heitto, A., Lopez-Hilfiker, F. D., Lutz, A., Riipinen, I., Hong, J., Donahue, N. M., Hallquist, M., Petaja, T., Kulmala, M., and Yli-Juuti, T.: Molecular identification of organic vapors driving atmospheric nanoparticle growth, Nat. Commun., 10, 4442, https://doi.org/10.1038/s41467-019-12473-2, 2019.
Moore, W.: Physical chemistry, 3rd edn., Prentice Hall, Englewood Cliffs, NJ, USA, ASIN B0073AA2OY, 1962.
Nannoolal, Y., Rarey, J., and Ramjugernath, D.: Estimation of pure component properties: Part 3. Estimation of the vapor pressure of non-electrolyte organic compounds via group contributions and group interactions, Fluid Phase Equilibr., 269, 117–133, 2008.
Oxford, C. R., Rapp, C. M., Wang, Y., Kumar, P., Watson, D., Portelli, J. L., Sussman, E. A., Dhawan, S., Jiang, J., and Williams, B. J.: Development and qualification of a VH-TDMA for the study of pure aerosols, Aerosol Sci. Tech., 53, 120–132, https://doi.org/10.1080/02786826.2018.1547358, 2019.
Pankow, J. F.: An absorption model of gas/particle partitioning of organic compounds in the atmosphere, Atmos. Environ., 28, 185–188, https://doi.org/10.1016/1352-2310(94)90093-0, 1994.
Pankow, J. F. and Asher, W. E.: SIMPOL.1: a simple group contribution method for predicting vapor pressures and enthalpies of vaporization of multifunctional organic compounds, Atmos. Chem. Phys., 8, 2773–2796, https://doi.org/10.5194/acp-8-2773-2008, 2008.
Price, C. L., Kaur Kohli, R., Shokoor, B., and Davies, J. F.: Connecting the phase state and volatility of dicarboxylic acids at elevated temperatures, J. Phys. Chem. A, 126, 6963–6972, 2022.
Rader, D., McMurry, P. H., and Smith, S.: Evaporation rates of monodisperse organic aerosols in the 0.02-to 0.2-µm-diameter range, Aerosol Sci. Tech., 6, 247–260, 1987.
Reid, R. C., Prausnitz, J. M., and Poling, B. E.: The properties of gases and liquids, 4th edn., McGraw Hill Book Co, New York, ISBN 0070517991, 1987.
Ribeiro da Silva, M. A., Monte, M. J., and Ribeiro, J. R.: Vapour pressures and the enthalpies and entropies of sublimation of five dicarboxylic acids, J. Chem. Thermodyn., 31, 1093–1107, https://doi.org/10.1006/jcht.1999.0522, 1999.
Ribeiro da Silva, M. A., Monte, M. J., and Ribeiro, J. R.: Thermodynamic study on the sublimation of succinic acid and of methyl-and dimethyl-substituted succinic and glutaric acids, J. Chem. Thermodyn., 33, 23–31, 2001.
Riipinen, I., Svenningsson, B., Bilde, M., Gaman, A., Lehtinen, K., and Kulmala, M.: A method for determining thermophysical properties of organic material in aqueous solutions: Succinic acid, Atmos. Res., 82, 579–590, 2006.
Saha, P. K., Khlystov, A., and Grieshop, A. P.: Determining aerosol volatility parameters using a “dual thermodenuder” system: Application to laboratory-generated organic aerosols, Aerosol Sci. Tech., 49, 620–632, 2015.
Saleh, R., Walker, J., and Khlystov, A.: Determination of saturation pressure and enthalpy of vaporization of semi-volatile aerosols: The integrated volume method, J. Aerosol Sci., 39, 876–887, https://doi.org/10.1016/j.jaerosci.2008.06.004, 2008.
Saleh, R., Khlystov, A., and Shihadeh, A.: Effect of aerosol generation method on measured saturation pressure and enthalpy of vaporization for dicarboxylic acid aerosols, Aerosol Sci. Tech., 44, 302–307, https://doi.org/10.1080/02786821003591810, 2010.
Salo, K., Jonsson, A. M., Andersson, P. U., and Hallquist, M.: Aerosol volatility and enthalpy of sublimation of carboxylic acids, J. Phys. Chem. A, 114, 4586–4594, https://doi.org/10.1021/jp910105h, 2010.
Schälte, Y. and Hasenauer, J.: Efficient exact inference for dynamical systems with noisy measurements using sequential approximate bayesian computation, Bioinformatics, 36, i551–i559, 2020.
Schobesberger, S., D'Ambro, E. L., Lopez-Hilfiker, F. D., Mohr, C., and Thornton, J. A.: A model framework to retrieve thermodynamic and kinetic properties of organic aerosol from composition-resolved thermal desorption measurements, Atmos. Chem. Phys., 18, 14757–14785, https://doi.org/10.5194/acp-18-14757-2018, 2018.
Schwantes, R. H., Charan, S. M., Bates, K. H., Huang, Y., Nguyen, T. B., Mai, H., Kong, W., Flagan, R. C., and Seinfeld, J. H.: Low-volatility compounds contribute significantly to isoprene secondary organic aerosol (SOA) under high-NOx conditions, Atmos. Chem. Phys., 19, 7255–7278, https://doi.org/10.5194/acp-19-7255-2019, 2019.
Shelley, P. D., Bannan, T. J., Worrall, S. D., Alfarra, M. R., Krieger, U. K., Percival, C. J., Garforth, A., and Topping, D.: Measured solid state and subcooled liquid vapour pressures of nitroaromatics using Knudsen effusion mass spectrometry, Atmos. Chem. Phys., 20, 8293–8314, https://doi.org/10.5194/acp-20-8293-2020, 2020.
Sisson, S. A., Fan, Y., and Tanaka, M. M.: Sequential monte carlo without likelihoods, P. Natl. Acad. Sci. USA, 104, 1760–1765, 2007.
Stahn, M., Grimme, S., Salthammer, T., Hohm, U., and Palm, W. U.: Quantum chemical calculation of the vapor pressure of volatile and semi volatile organic compounds, Environ. Sci.-Proc. Imp., 24, 2153–2166, https://doi.org/10.1039/d2em00271j, 2022.
Tao, Y. and McMurry, P. H.: Vapor pressures and surface free energies of C14-C18 monocarboxylic acids and C5 and C6 dicarboxylic acids, Environ. Sci. Technol., 23, 1519–1523, 1989.
Toni, T., Welch, D., Strelkowa, N., Ipsen, A., and Stumpf, M. P.: Approximate bayesian computation scheme for parameter inference and model selection in dynamical systems, J. Roy. Soc. Interface, 6, 187–202, https://doi.org/10.1098/rsif.2008.0172, 2009.
TURBOMOLE: TURBOMOLE V7.4.1, a development of University of Karlsruhe and Forschungszentrum Karlsruhe GmbH, 1989–2007, TURBOMOLE GmbH, since 2007, 2019.
von Domaros, M., Lakey, P. S. J., Shiraiwa, M., and Tobias, D. J.: Multiscale modeling of human skin oil-induced indoor air chemistry: Combining kinetic models and molecular dynamics, J. Phys. Chem. B, 124, 3836–3843, https://doi.org/10.1021/acs.jpcb.0c02818, 2020.
Yang, L. H., Takeuchi, M., Chen, Y., and Ng, N. L.: Characterization of thermal decomposition of oxygenated organic compounds in FIGAERO-CIMS, Aerosol Sci. Tech., 55, 1321–1342, https://doi.org/10.1080/02786826.2021.1945529, 2021.
Yatavelli, R. L. and Thornton, J. A.: Particulate organic matter detection using a micro-orifice volatilization impactor coupled to a chemical ionization mass spectrometer (MOVI-CIMS), Aerosol Sci. Tech., 44, 61–74, 2010.
Yeung, M. C., Ling, T. Y., and Chan, C. K.: Effects of the polymorphic transformation of glutaric acid particles on their deliquescence and hygroscopic properties, J. Phys. Chem. A, 114, 898–903, 2010.
Yli-Juuti, T., Zardini, A. A., Eriksson, A. C., Hansen, A. M., Pagels, J. H., Swietlicki, E., Svenningsson, B., Glasius, M., Worsnop, D. R., Riipinen, I., and Bilde, M.: Volatility of organic aerosol: Evaporation of ammonium sulfate/succinic acid aqueous solution droplets, Environ. Sci. Technol., 47, 12123–12130, https://doi.org/10.1021/es401233c, 2013.
Yli-Juuti, T., Pajunoja, A., Tikkanen, O. P., Buchholz, A., Faiola, C., Vaisanen, O., Hao, L., Kari, E., Perakyla, O., Garmash, O., Shiraiwa, M., Ehn, M., Lehtinen, K., and Virtanen, A.: Factors controlling the evaporation of secondary organic aerosol from alpha-pinene ozonolysis, Geophys. Res. Lett., 44, 2562–2570, https://doi.org/10.1002/2016GL072364, 2017.
Ylisirniö, A., Barreira, L. M. F., Pullinen, I., Buchholz, A., Jayne, J., Krechmer, J. E., Worsnop, D. R., Virtanen, A., and Schobesberger, S.: On the calibration of FIGAERO-ToF-CIMS: importance and impact of calibrant delivery for the particle-phase calibration, Atmos. Meas. Tech., 14, 355–367, https://doi.org/10.5194/amt-14-355-2021, 2021.
Zardini, A. A. and Krieger, U. K.: Evaporation kinetics of a non-spherical, levitated aerosol particle using optical resonance spectroscopy for precision sizing, Opt, Express, 17, 4659–4669, https://doi.org/10.1364/oe.17.004659, 2009.
Zardini, A. A., Krieger, U. K., and Marcolli, C.: White light mie resonance spectroscopy used to measure very low vapor pressures of substances in aqueous solution aerosol particles, Opt. Express, 14, 6951–6962, 2006.
Zhang, Q., Jimenez, J. L., Canagaratna, M. R., Allan, J. D., Coe, H., Ulbrich, I., Alfarra, M. R., Takami, A., Middlebrook, A. M., Sun, Y. L., Dzepina, K., Dunlea, E., Docherty, K., DeCarlo, P. F., Salcedo, D., Onasch, T., Jayne, J. T., Miyoshi, T., Shimono, A., Hatakeyama, S., Takegawa, N., Kondo, Y., Schneider, J., Drewnick, F., Borrmann, S., Weimer, S., Demerjian, K., Williams, P., Bower, K., Bahreini, R., Cottrell, L., Griffin, R. J., Rautiainen, J., Sun, J. Y., Zhang, Y. M., and Worsnop, D. R.: Ubiquity and dominance of oxygenated species in organic aerosols in anthropogenically-influenced northern hemisphere midlatitudes, Geophys. Res. Lett., 34, L13801, https://doi.org/10.1029/2007gl029979, 2007.