the Creative Commons Attribution 4.0 License.
the Creative Commons Attribution 4.0 License.
 | 21 Jun 2023
Contributions of primary emissions and secondary formation to nitrated aromatic compounds in themountain background region of Southeast China
Yanqin Ren
Jie Wei
Zhisheng Zhang
Hong Li
As a major component of brown carbon (BrC), nitrated aromatic compounds (NACs) have a significant role in the atmosphere's ability to absorb light. However, the sources and major influencing factors of NACs in the mountain background atmosphere are mostly lacking. Based on a thorough field investigation of NACs from fine particle samples taken in 2014 and 2015 at the peak of Mt. Wuyi (1139 m.a.s.l.), the current work discussed the seasonal fluctuations in their composition, their sources, and the important influencing factors. The total abundance of nine quantifiable NACs increased significantly in the winter (3.9 ± 1.5 ng m−3) and autumn (2.1 ± 0.94 ng m−3), whereas it decreased in the spring (1.3 ± 0.75 ng m−3) and summer (0.97 ± 0.36 ng m−3). According to the results of structural equation modeling, the majority of NACs (93 %) were influenced by biomass, coal, and petroleum combustion over the entire year. This work identified the origins of NACs with applying the positive matrix factorization receptor model. The five major source factors were biomass burning, coal combustion, secondary formation by nitration reaction, secondary formation by photochemical reaction, and other sources. Among them, biomass burning and coal combustion played an important role, especially in the wintertime, with a contribution of more than 50 %. Meanwhile, contributions from secondary formation were significant in these remote areas, which were mainly by photochemical reaction in the summertime and nitration reaction in the wintertime. Further analysis indicated that the formation of NACs was comparatively sensitive to NO2 under low-NOx conditions, suggesting that NACs would become significant in the aerosol characteristics when nitrate concentrations decreased as a result of emission reduction measures.
- Article
(3185 KB) - Full-text XML
-
Supplement
(406 KB) - BibTeX
- EndNote


Nitrated aromatic compounds (NACs) are the most important kind of constituents of BrC. They have an aromatic moiety and –OH and –NO2 functions (Desyaterik et al., 2013; Wu et al., 2020). Nitrophenols (NPs), nitrosalicylic acids (NSAs), nitroguaiacols (NGAs), and nitrocatechols (NCs) are the most common among various kinds of NACs. Due to their capacity to absorb light, they have received a lot of attention (X. Li et al., 2020; Wang et al., 2016, 2018; Teich et al., 2017). About 4 % of the net water-soluble BrC absorption has been ascribed to them as documented by several earlier studies (Mohr et al., 2013; Zhang et al., 2013). Moreover, they manifest an influence on human health because of NACs' strong mutagenicity, cytotoxicity, and carcinogenicity (Iinuma et al., 2010).
Various ambient atmospheres have been shown to have NACs, including rural (Liang et al., 2020; Teich et al., 2017; Lv et al., 2022), urban (J. Li et al., 2020; M. Li et al., 2020; X. Li et al., 2020; Wang et al., 2019; Ren et al., 2022), suburban (Kitanovski et al., 2021), and mountain areas (Wang et al., 2018). Biomass burning (Wang et al., 2017; Lin et al., 2017; Chow et al., 2015; Gaston et al., 2016; Salvador et al., 2021), traffic emissions (Lu et al., 2019a), and coal combustion (Lu et al., 2019b) are the key primary sources of NACs. Several works indicated that the primary cause of the generation of NACs is biomass burning (Lin et al., 2017; Wang et al., 2017; Mohr et al., 2013), whereas several other studies consider road traffic emissions the primary cause of the origin of nitrophenols (Zhang et al., 2010). Secondary formation is also a very important source of particulate NACs, although NACs are highly affected by primary emissions, and NO2 is a very important factor during the process (Ren et al., 2022; Cai et al., 2022; Cheng et al., 2021). Secondary chemistry, primarily classified as the nitration of aromatic compounds, may occur in both aqueous and gas phases (X. Li et al., 2020; Harrison et al., 2005; Wang et al., 2019). According to recent research, phenolic volatile organic compounds (VOCs) that are oxidized by the nitrate radical () at night may also function as a notable source of nitrophenols and additional BrC species (Mayorga et al., 2021). Studies have revealed that there is a closer link between NACs and NO2 for samples taken at night, further pointing to the importance of -initiated oxidation in the generation of NACs at night (Wang et al., 2018; X. Li et al., 2020; Cai et al., 2022). According to the previous research, the intermediate formed when phenol reacts with either •OH during the daytime or during the night, producing the phenoxy radical (C6H5O•), which is where nitrophenol is produced (Berndt and Bge, 2003). Even though researchers have started to study NACs, very little is known regarding the relative significance of their corresponding primary and secondary sources. The fundamental variables affecting the generation of NACs are also little known because only a few investigations have been conducted thus far, in particular within China.
Field observations in both clean and polluted environments are essential for better identifying elements that have previously gone unnoticed and for confirming the mechanistic understanding attained from research on smog chambers. In our earlier research, we examined how biomass burning affects biogenic secondary organic aerosol (BSOA) production from long-range transport and how biogenic volatile organic compounds (BVOCs) contribute to the generation of BSOA in high mountain locations, which proved the effect of long-range transport of air pollutants (Ren et al., 2019). In the current study, nine NACs (NPs, NGAs, NCs, and NSAs) in the PM2.5 were studied at the same sampling site, to further understand ambient characteristics of NACs, their primary sources, and the principal factors influencing their secondary formation in the mountain background region. The outcome of the current research offers useful insight into the pollution characteristics and sources of NACs, and the potential influences on secondary formation in background environments.
One national atmospheric background monitoring station is located at Mt. Wuyi station (27∘35′ N, 117∘43′ E; 1139 m a.s.l.; Fig. 1). There are no evident sources of atmospheric pollution within 50 km2 of the monitoring station, which is located at the southern tip of the Mt. Wuyi national reserve. As a result, it can accurately depict the atmospheric background conditions of Southeast China's forest and mountain region. Due to its high altitude and active airstream, it can also be used to observe the effects of long-range transport. In this work, we used a high-volume air sampler (TE-6070DV-BLX, Tisch Environmental Inc., USA) to gather PM2.5 samples with an airflow equivalent to 1.13 m3 min−1. In total, 49 PM2.5 samples were taken over 7 d. During the sampling, four blank specimens (one for individual seasons) were obtained by mounting the filters onto the sampler without pumping any air. The samples and blanks were collected onto a pre-combusted quartz filter (450∘ for 8 h). After the sampling and before any analysis, all filters were sealed individually in an aluminum bag and stored in a freezer below −18∘. At the same time, we gathered data on conventional pollutants and meteorological parameters, including temperature (T), relative humidity (RH), SO2, NO2, and O3. The meteorological data were monitored by a Vaisala MAWS301 (Helsinki, Finland) automatic weather station, and the conventional pollutants were monitored with a model 43i SO2 analyzer for SO2, a model 17i NH3 analyzer for NO2, and a model 49i O3 analyzer for O3 (Thermo Scientific Company, Waltham, MA, USA). Sample site and sampling information has been reported in detail in the literature (Ren et al., 2019).
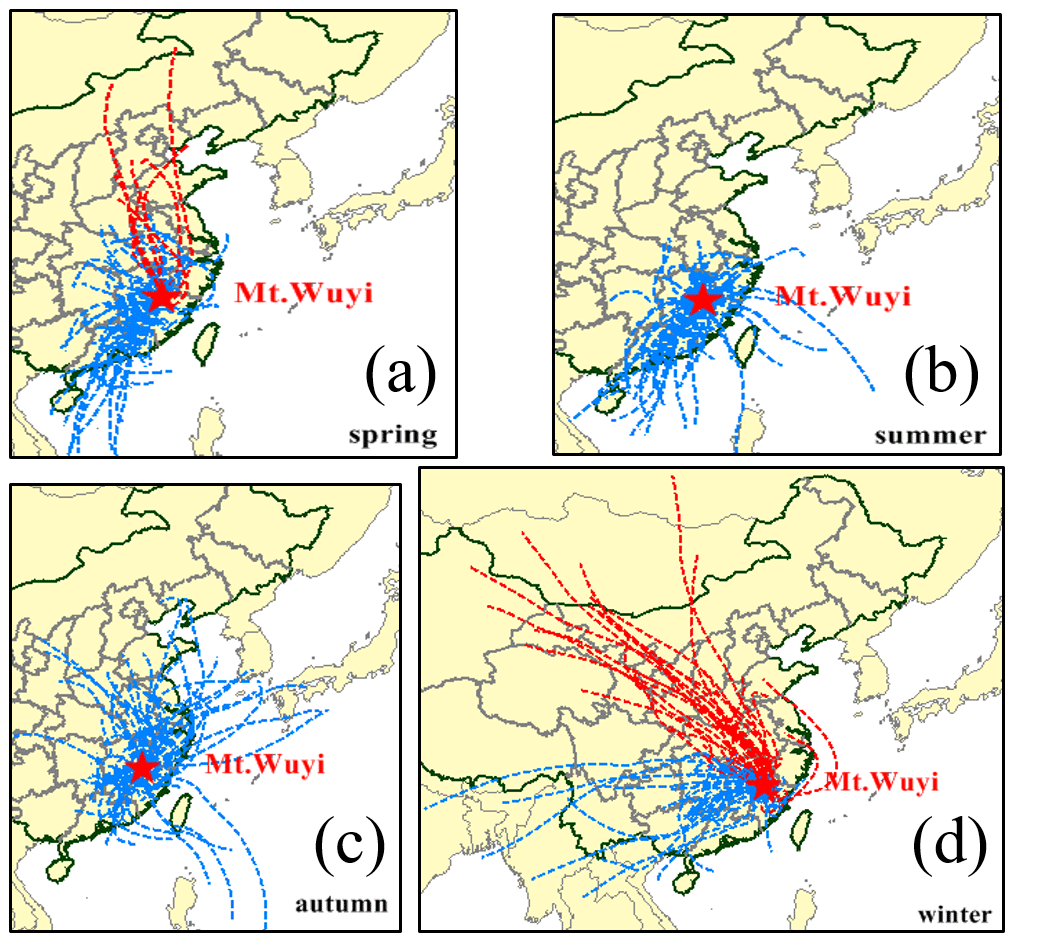
Figure 1Location of the sampling site (Mt. Wuyi: 27∘35′ N, 117∘43′ E; 1139 m a.s.l.) and 48 h backward trajectories reaching the summit during the sampling (spring: 20 March–4 June 2014; summer: 4 June–2 September 2014; autumn: 2 September–4 December 2014; winter: 4 December 2014–25 February 2015. Red dotted line: the air masses coming from north and northwest; Blue dotted line: the air masses coming from other directions).
3.1 Chemical analysis
Organic compounds, including nine NACs (3-methyl-4-nitrophenol (3M4NP), 4-nitrophenol (4NP), 2,4-dinitrophenol (2, 4-DNP), 4-nitroguaiacol (4NGA), 5-nitroguaiacol (5NGA), 4-nitrocatechol (4NC), 4-methyl-5-nitrocatechol (4M5NC), 3-nitro-salicylic acid (3NSA), and 5-nitro-salicylic acid (5NSA)), fossil fuel n-alkanes (ff-n-alkanes), polycyclic aromatic hydrocarbons (PAHs), and sugars (e.g., trehalose, and levoglucosan), were identified in the samples. Elemental carbon (EC), organic carbon (OC), and some inorganic ions (i.e., SO, NO, NH, K+) were also the constituents of the samples. The procedures for sample extraction and derivatization have been elaborated elsewhere (Ren et al., 2022, 2019). Briefly stated, an aliquot of the filter was extracted with a mixture of methanol and dichloromethane (DCM; 1:2) under ultrasonication three times. The extracts are concentrated and dried using pure nitrogen, derivatized with N, O-bis-(trimethylsilyl) trifluoroacetamide (BSTFA) and analyzed using gas chromatography equipped with mass spectroscopy (GC-MS, 7890A/5975C, Agilent Co., USA). The GC separation was carried out on a DB-5MS fused silica capillary column, and the GC oven temperature was programmed from 50∘ (2 min) to 120∘ with 15∘ min−1 and then to 300∘ with 5∘ min−1, with a final isothermal hold at 300∘ for 16 min. The sample was injected in a splitless mode at an injector temperature of 280∘ and scanned from 50 to 650 Da (daltons) using electron impact (EI) mode at 70eV. Using the Interagency Monitoring of Protected Visual Environments (IMPROVE) thermal–optical reflectance (TOR) methodology, OC and EC were measured by a DRI model 2001 carbon analyzer (Atmoslytic Inc., Calabasas, CA, USA). OC collected by a filter membrane is first volatilized with the increase in temperature up to 580∘ in the presence of He and determined. EC is then analyzed with the increase in temperature to 840∘ in the presence of He and O2 by the NDIR (non-dispersive infrared) CO2 detector. Dionex-600 ion chromatography was used to quantify inorganic ions in samples after extraction with Milli-Q pure water (Thermo Fisher Scientific Inc., USA).
3.2 Model calculation
As a receptor model, positive matrix factorization (PMF) (EPA PMF 5.0 version) has been extensively employed for the source distribution of atmospheric pollutants (Ren et al., 2022; Wu et al., 2020; Wang et al., 2018). To quantify the source apportionment for NACs, the mass concentrations of SO2, NO2, CO, O3, sulfate (SO, nitrate (NO, NH, K+, ff-n-alkanes, PAHs, levoglucosan, trehalose, 3M4NP, 4NP, 4NGA, 5NGA, 2,4-DNP, 4M5NC, 4NC, 5NSA, and 3NSA, were employed as input data. The direct and indirect effects of air pollutant variables on NACs were quantified by utilizing structural equation modeling (SEM). Initially, a conceptual model of hypothetical linkages was developed using past and theoretical information. The measured data were then integrated into the model using the maximum-likelihood estimation technique. AMOS 24.0 (IBM, Chicago, IL, USA) was used to analyze the above statistical analyses.
3.3 Quality assurance and quality control (QA/QC)
For pre-treatment experiments, all glassware used was rinsed and baked at 450∘ for 8 h and further cleaned using methanol, DCM and hexane immediately before using. Limits of detection (LOD) of the target compounds were calculated with signal-to-noise ratios of 3:1, according to the method reported by previous studies (Bandowe et al., 2014; Li et al., 2016). In this work LOD of NAC species were in the range of 0.0001–0.002 (Table S1 in the Supplement). Field blank sample analysis showed no serious contamination (less than 5 % of real samples). GC/MS response factors of all organic species were used according to authentic standards. The recovery experiment was done by spiking the standard solution onto blank filters (n=3) and analyzing it using the above procedure. Recoveries of the quantified organic compounds were generally between 80 % and 110 %. Data reported here were all corrected for the blanks.
For PMF, the model was iterated upon using a variety of combinations of the concentration data set and three to six covariates. Q value and r, which were defined as the agreement between the model fit and the correlation between estimated and measured concentrations, respectively, are used to determine the appropriate factor number for modeling (Comero et al., 2009). The best solution was determined to be five components based on the Q value and r2 (Table S2) values. For SEM, we identified the model that best fits the data by methodically deleting non-significant routes from the base model. The p value, χ2 test, goodness-of-fit index (GFI) and root mean square error of approximation (RMSEI) index were used to assess the model's suitability. The conceptual model was acceptable if the p value > 0.05, if the RMSEA was low (<0.08), and if the GFI was high (>0.9). Low χ2 values were regarded as positive model fits. In this work, the model fits the data well; i.e., χ2=0.235, df = 1, p=0.628, GFI = 0.999, and RMSEA = 0.000 annually and χ2=0.690, df = 2, p=0.708, GFI = 0.980, and RMSEA = 0.000 in winter.
4.1 Meteorological features and air masses
From March 2014 through February 2015, a total of four seasons were covered by the sampling campaign. In the area under investigation, the four seasons are typically referred to as spring (March through May), summer (June through August), autumn (September through November), and winter (December through February). The rise in temperature starts in March and peaks in July (25 ∘C), before falling to a minimal value of 2.9∘ in January–February. When determining the origin of air masses at a certain location, air mass backward trajectories are taken into account. The Hybrid Single-Particle Lagrangian Integrated Trajectories (HYSPLIT) model supplied 48 h air mass backward trajectories for this study. The source regions of primary aerosol gathered from an area located at a distance from the source location have also been identified using air mass backward trajectories (Chiapello et al., 1997; Wang et al., 2013, 2014). The 48 h backward trajectories (Fig. 1) show that during the sampling, winds from the north were reaching the top, particularly in winter (Fig. 1d), when there were large concentrations of air pollutants due to anthropogenic emissions. This explains why SO2, NO2, ff-n-alkanes (fossil fuel markers), PAHs (coal and fossil fuel markers), levoglucosan (biomass burning markers), SO, NO, and other anthropogenic pollutants were typically higher in winter (Table 1). This has been demonstrated in our previous studies that these anthropogenic pollutants can affect the generation of certain SOA species (Ren et al., 2019).
Table 1Concentrations (ng m−3) of organic compounds in PM2.5 samples in Mt. Wuyi during the sampling time.
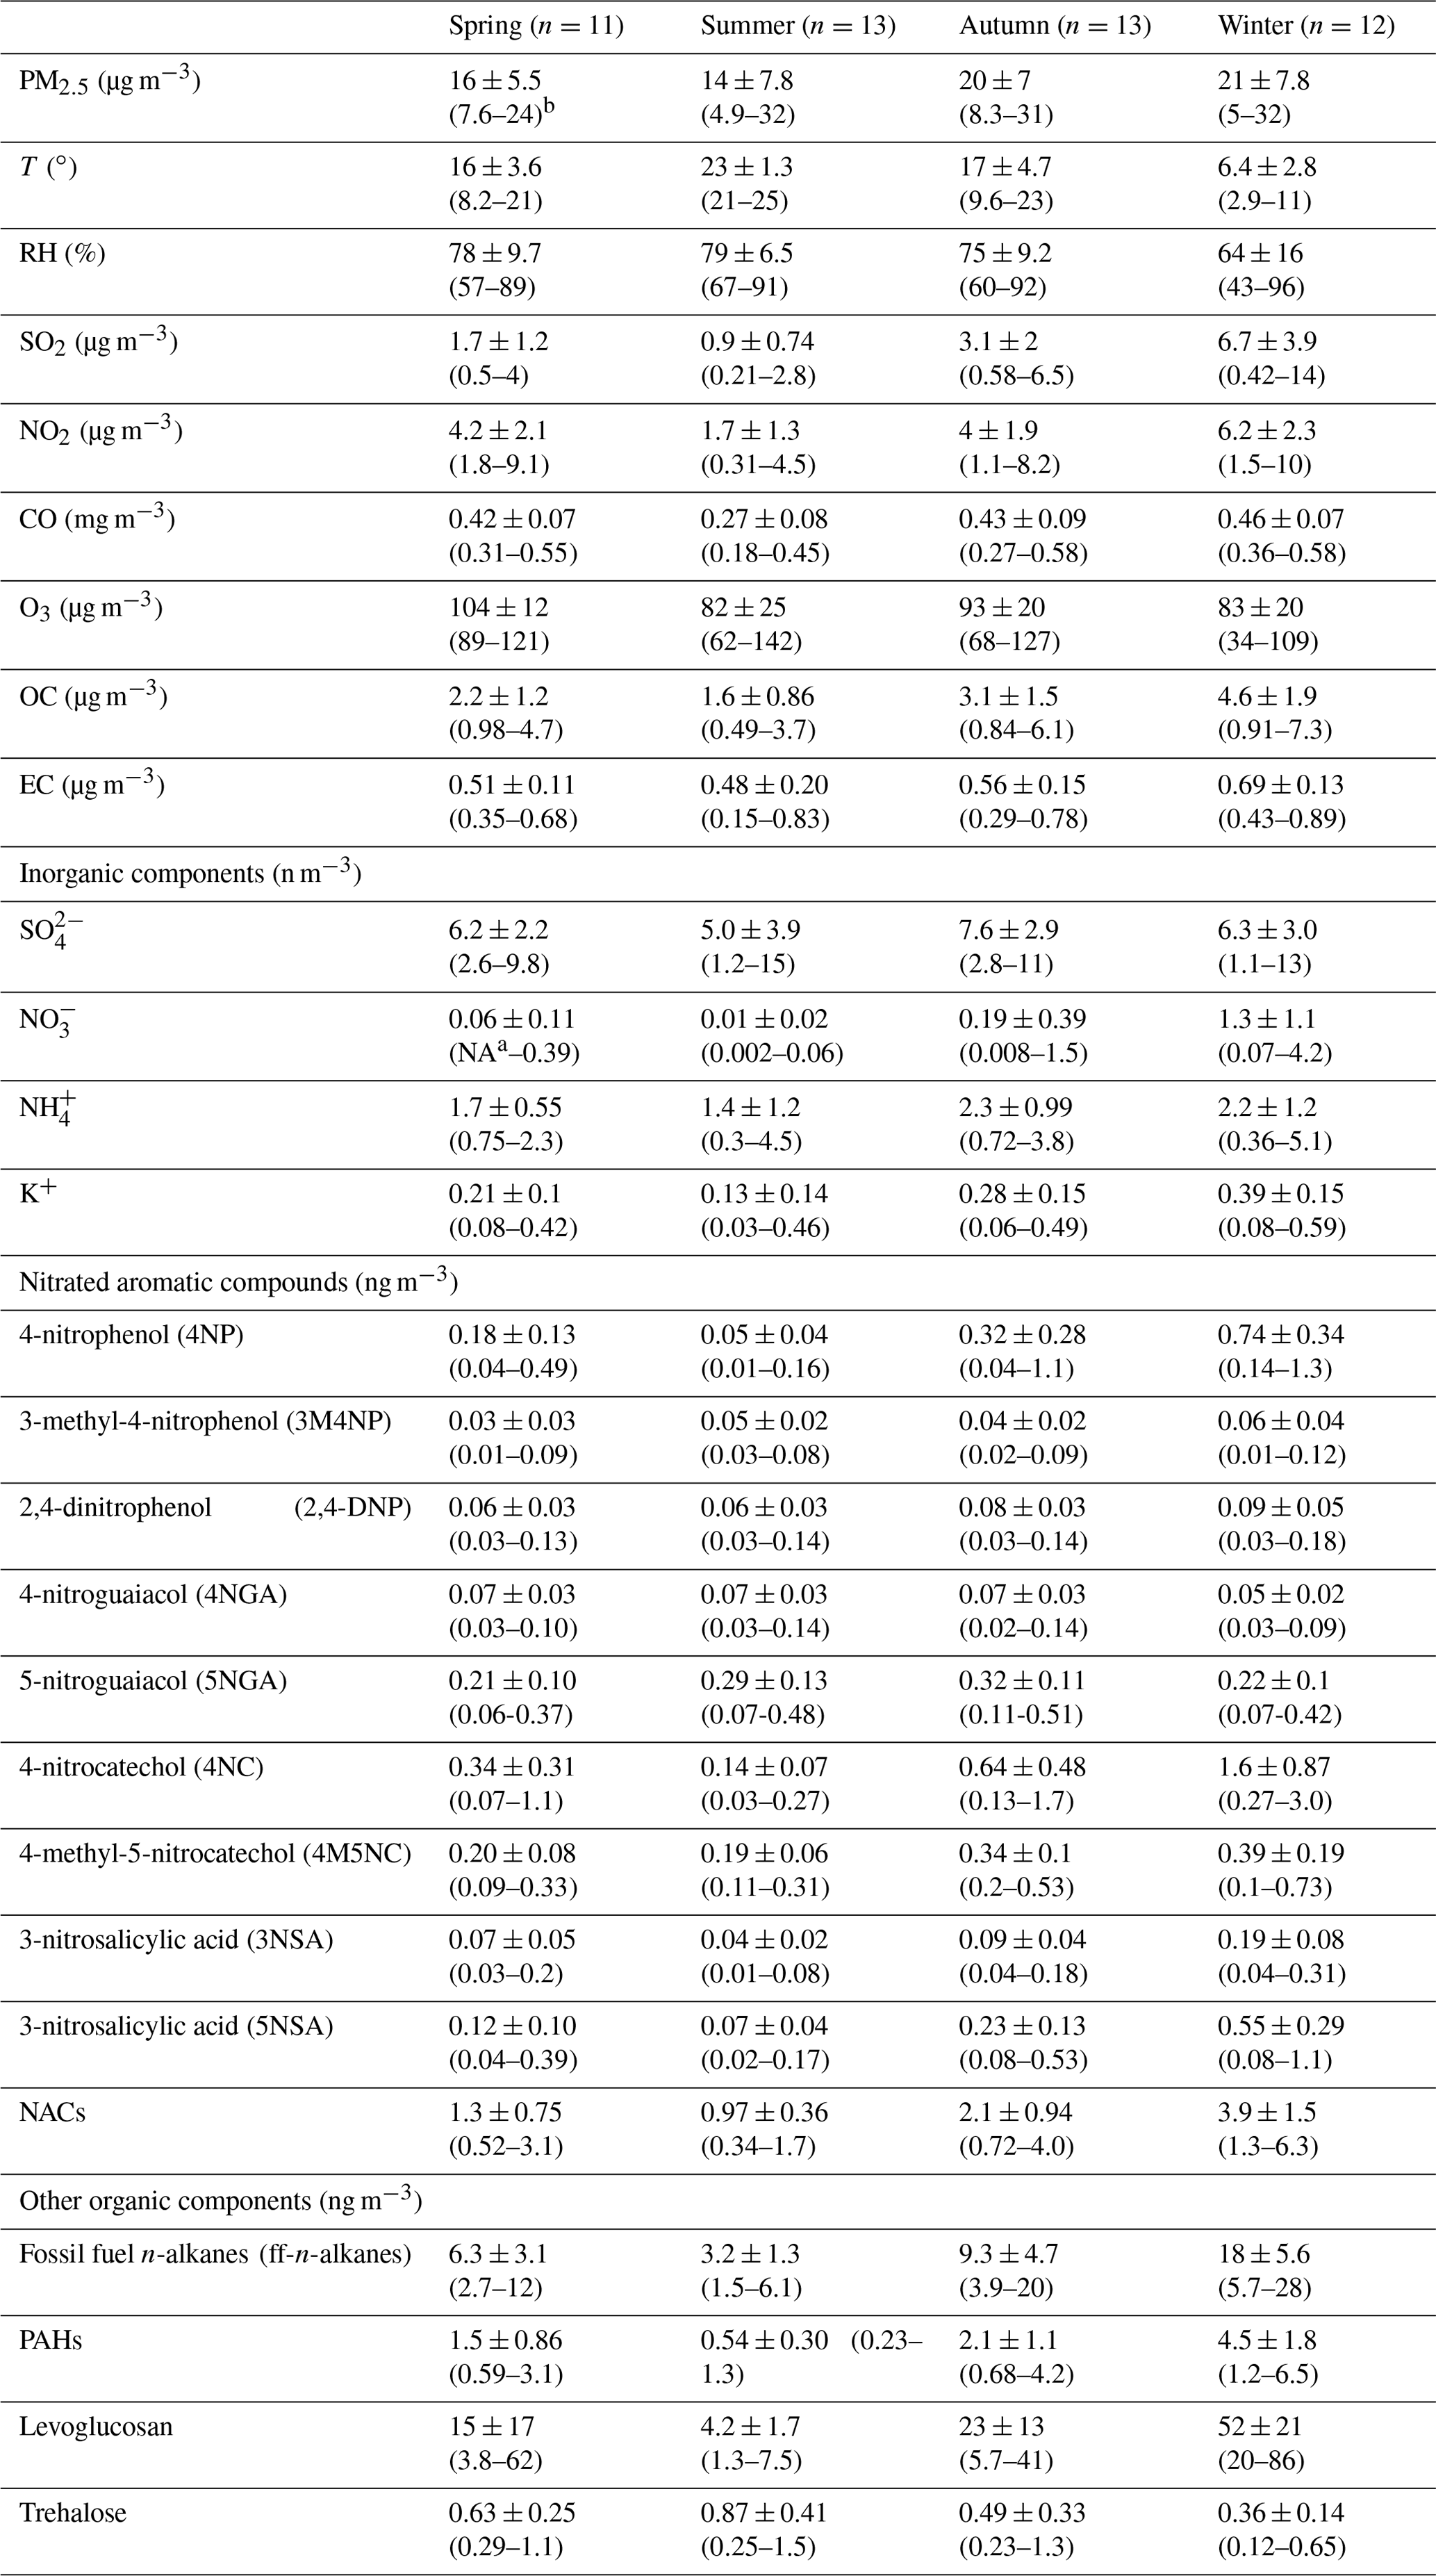
a NA: not available. b The numbers in the first line indicate mean ± SD, and the numbers in the second line indicate lowest value–highest value.
4.2 Abundance and seasonal variations of NACs
Table 1 lists the measured concentrations of the major PM2.5 constituents, and Fig. 2 shows the seasonal fluctuations of the nine NACs throughout the year. Nine different NACs' average concentrations varied significantly throughout the year, with winter having the greatest levels (3.9 ± 1.5 ng m−3), followed by autumn (2.1 ± 0.94 ng m−3), spring (1.3 ± 0.75 ng m−3), and summer (0.97 ± 0.36 ng m−3). The total NAC concentrations in the current and earlier works are compared in Table 2. The total NAC concentration in this study was significantly lower in comparison to that predicted for urban sites in China, particularly in winter and autumn, such as in Beijing (20 ± 12 ng m−3 in autumn, 74 ± 51 ng m−3 in winter) (X. Li et al., 2020), Jinan (9.8 ± 4.2 ng m−3 in autumn, 48 ± 26 ng m−3 in winter) (Wang et al., 2018), Xi'an (17 ± 12 ng m−3 in winter) (Wu et al., 2020), and Hong Kong (12 ± 14 ng m−3 in winter) (Chow et al., 2015). The main reason was that there are more pollutant emissions in and around urban areas, with high levels of precursors and oxidants. Moreover, as compared to the levels in rural and background sites during summertime in China, the levels in this work were also much lower, for instance, Wangdu (Wang et al., 2018), Yucheng, (Wang et al., 2018), Mt. Tai (Wang et al., 2018), and Xianghe (Teich et al., 2017). The anthropogenic pollutants (e.g., SO2, NO2, CO) were typically lower in summer, indicating the air at the time of sampling was relatively clean in this work, while at the above-mentioned rural and background sites, the atmospheric environment in summer is often affected by surrounding pollution sources (e.g., coal combustion from nearby industries) (Wang et al., 2018). In comparison with studies abroad, the total NAC concentrations in this investigation were also comparatively lower than the measurements in winter, such as in Detling, UK (Mohr et al., 2013); the TROPOS institute and the Melpitz research site, Germany (Teich et al., 2017); Ljubljana, Slovenia (Kitanovski et al., 2012); and Hamme, Belgium (Kahnt et al., 2013), where NACs measured all had a significant contribution from biomass burning during the sampling time.
Table 2Measured concentrations of nitrated aromatic compounds in domestic and foreign research studies over the last decade.
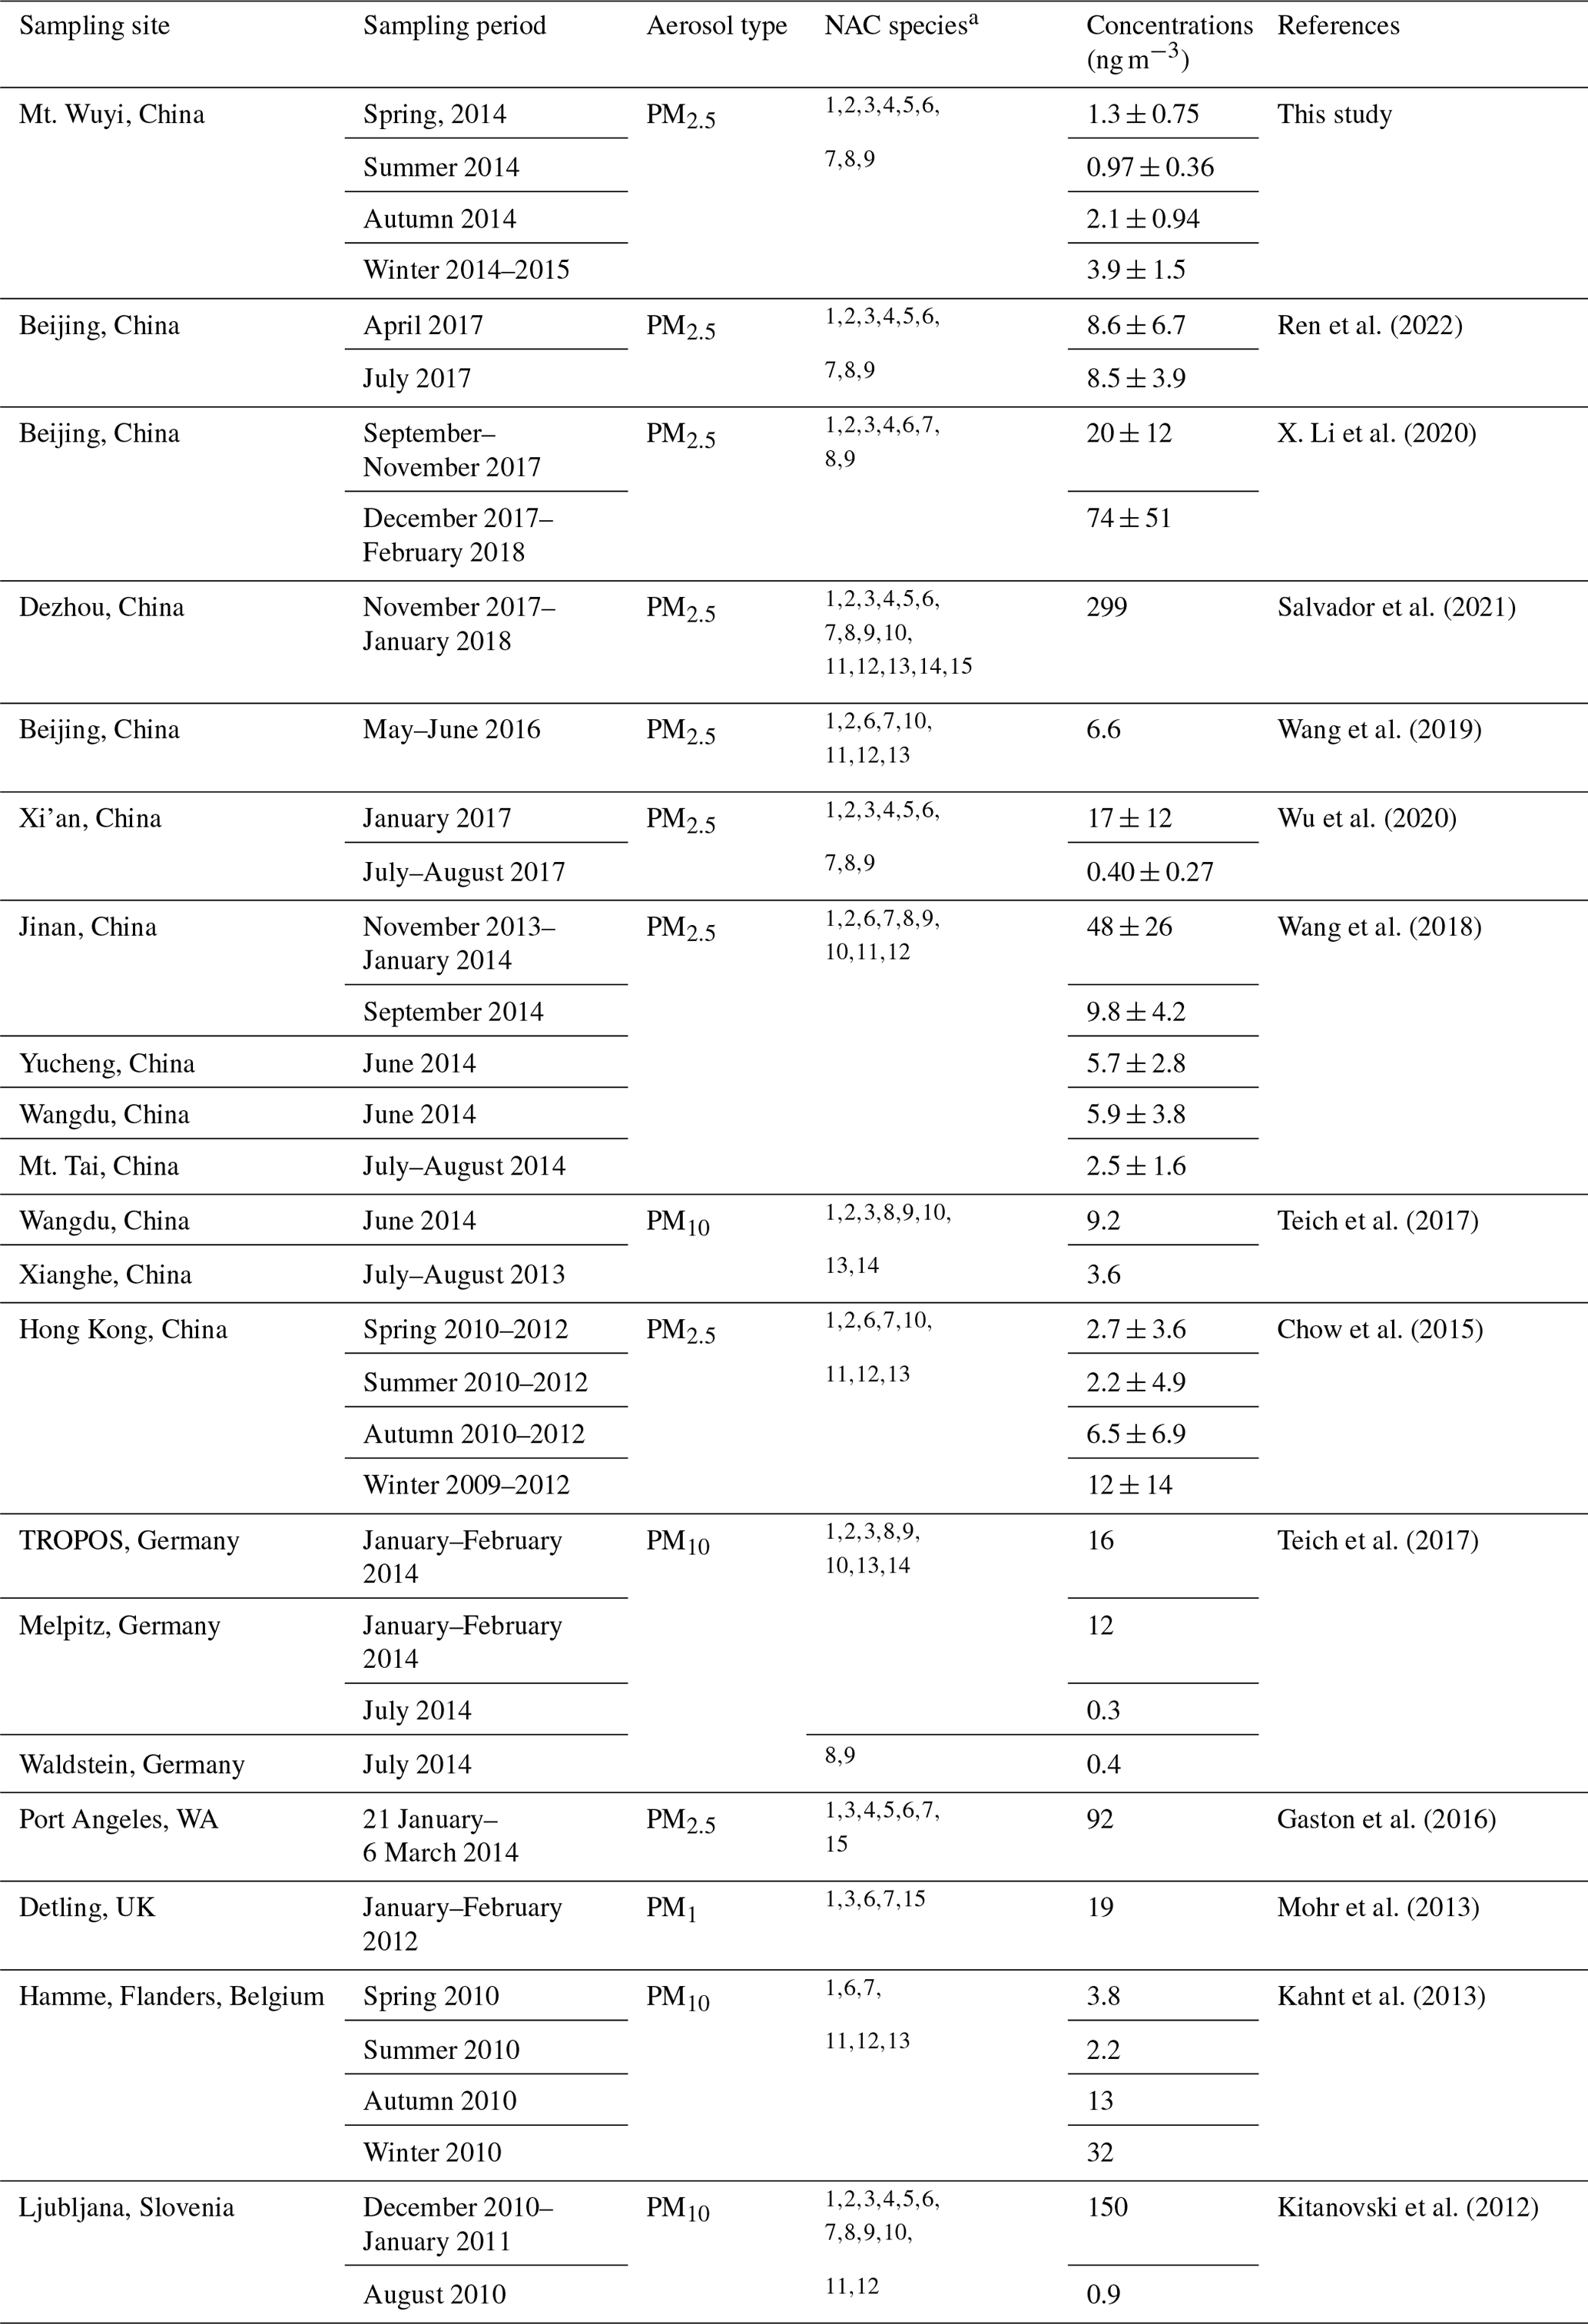
1 4-nitrophenol. 2 3-methyl-4-nitrophenol. 3 2,4-dinitrophenol. 4 4-nitroguaiacol. 5 5-nitroguaiacol. 6 4-nitrocatechol. 7 4-methyl-5-nitrocatechol. 8 3-nitro-salicylic acid. 9 5-nitro-salicylic acid. 10 2-methyl-4-nitrophenol. 11 3-methyl-5-nitrocatechol. 12 3-methyl-6-nitrocatechol. 13 2,6-dimethyl-4-nitrophenol. 14 3,4-dinitrophenol. 15 4-methyl-2-nitrophenol.
For each NAC species, NPs (including 4NP, 3M4NP, 2, 4-DNP) (Fig. 2a), NCs (including 4NC, 4M5NC) (Fig. 2c), and NSAs (including 3NSA, 5NSA) (Fig. 2d) have the same seasonal trends as the total NACs, with characteristics of higher concentrations in winter than in other seasons. It should be noted that some NP species, such as 2,4-DNP, did not have a distinct seasonal variation mainly due to the different generation mechanisms. Our previous work has shown that 2,4-DNP was primarily produced by secondary formation with aqueous-phase oxidation as the major route of production (Ren et al., 2022), which is consistent with other research studies (Cheng et al., 2021). However, conversely, there were no obvious seasonal trends for NGAs (including 4NAG and 5NGA) (Fig. 2b). Averagely, 4NC was the most abundant species throughout the year (25.8 %), followed by 5NGA (17.6 %) (Fig. S1 in the Supplement), with different proportions of molecular composition in different seasons (Fig. 3). 4NC was the only NACs species that accounted for more than 20 % in spring (23.7 %), autumn (27 %), and winter (39.7 %). The most prevalent compound over the summer was 5NGA (28.7 %), followed by 4M5NC (20.9 %). These findings contrasted with those of earlier studies on urban areas, which often revealed that 4NP had the greatest levels, followed by 4NC (X. Li et al., 2020; Wang et al., 2018, 2019).
As mentioned above, obvious seasonal variations were observed in the concentrations and compositions of NACs in Mt. Wuyi. The following sections comprise the implied differences in the primary sources and the secondary formation pathways.
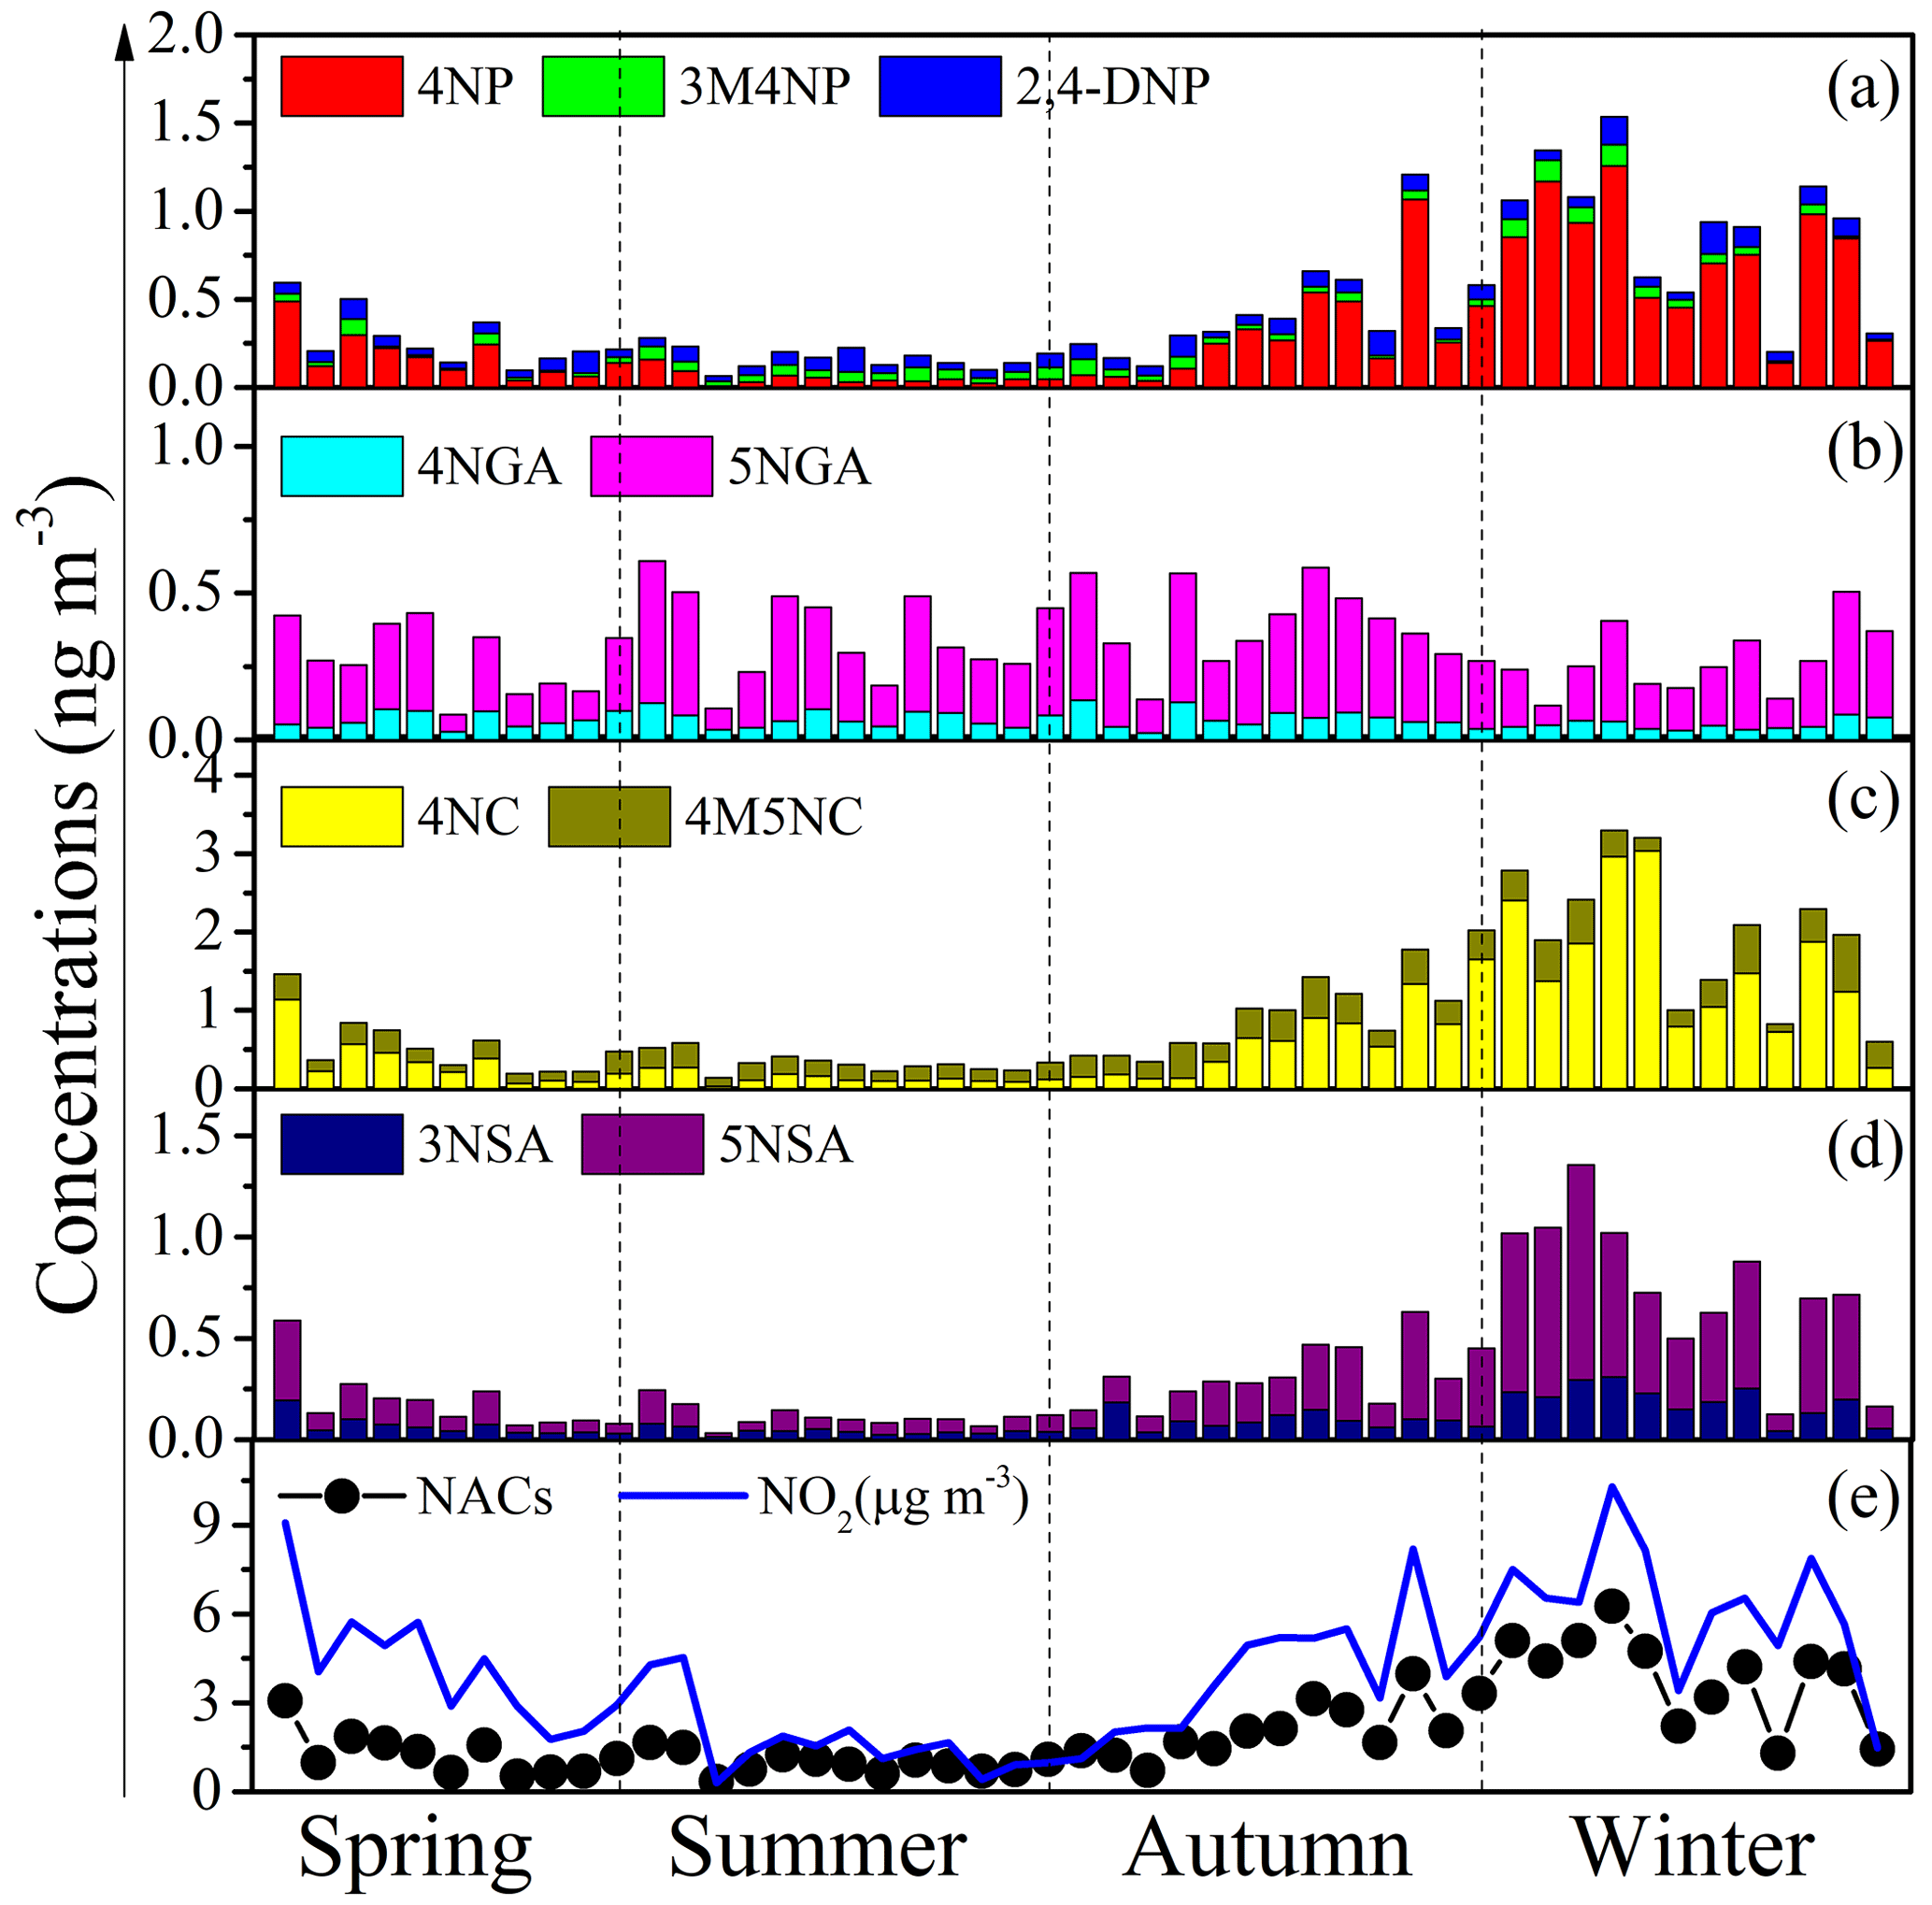
Figure 2Temporal variations of each NACs species (4NP – 4-nitrophenol, 3M4NP – 3-methyl-4-nitrophenol, 2,4-DNP – 2,4-dinitrophenol, 4NGA – 4-nitroguaiacol, 5NGA – 5-nitroguaiacol, 4NC – 4-nitrocatechol, 4M5NC – 4-methyl-5-nitrocatechol, 3NSA – 3-nitrosalicylic acid, and 5NSA – 5-nitrosalicylic acid).
4.3 Source apportionment
4.3.1 Source identification
For further clarification regarding the influencing factors and sources of NACs, the relationship between total and individual NAC species and the related pollutants was analyzed based on the results of Pearson correlations depicted in Table 3 (for the whole campaign) and Tables S3–S6 (for the four seasons), including PM2.5, SO2, NO2, O3, and other chemical components. It is noteworthy that total NACs and all identified NACs species manifested strong correlations with PM2.5 in the whole year, indicating that they are important components of PM2.5. There were good relationships between NACs and primary pollutants in the whole year, such as SO2 (r=0.859, p<0.01), ff-n-alkanes (r=0.927, p<0.01), PAHs (r=0.927, p<0.01), levoglucosan (r=0.931, p<0.01), and K+ (i.e., a biomass burning tracer, r=0.817, p<0.01) (Table 3). Furthermore, the model calculation results of SEM indicated ff-n-alkanes, SO2, and levoglucosan would account for 93 % of NACs (Fig. 4a). All of these connections indicated that burning emissions throughout the year, such as the burning of coal (Lu et al., 2019b), biomass (Wang et al., 2017; Lin et al., 2017; Chow et al., 2015), and burning of petroleum (Lu et al., 2019a), had a substantial impact on NACs.
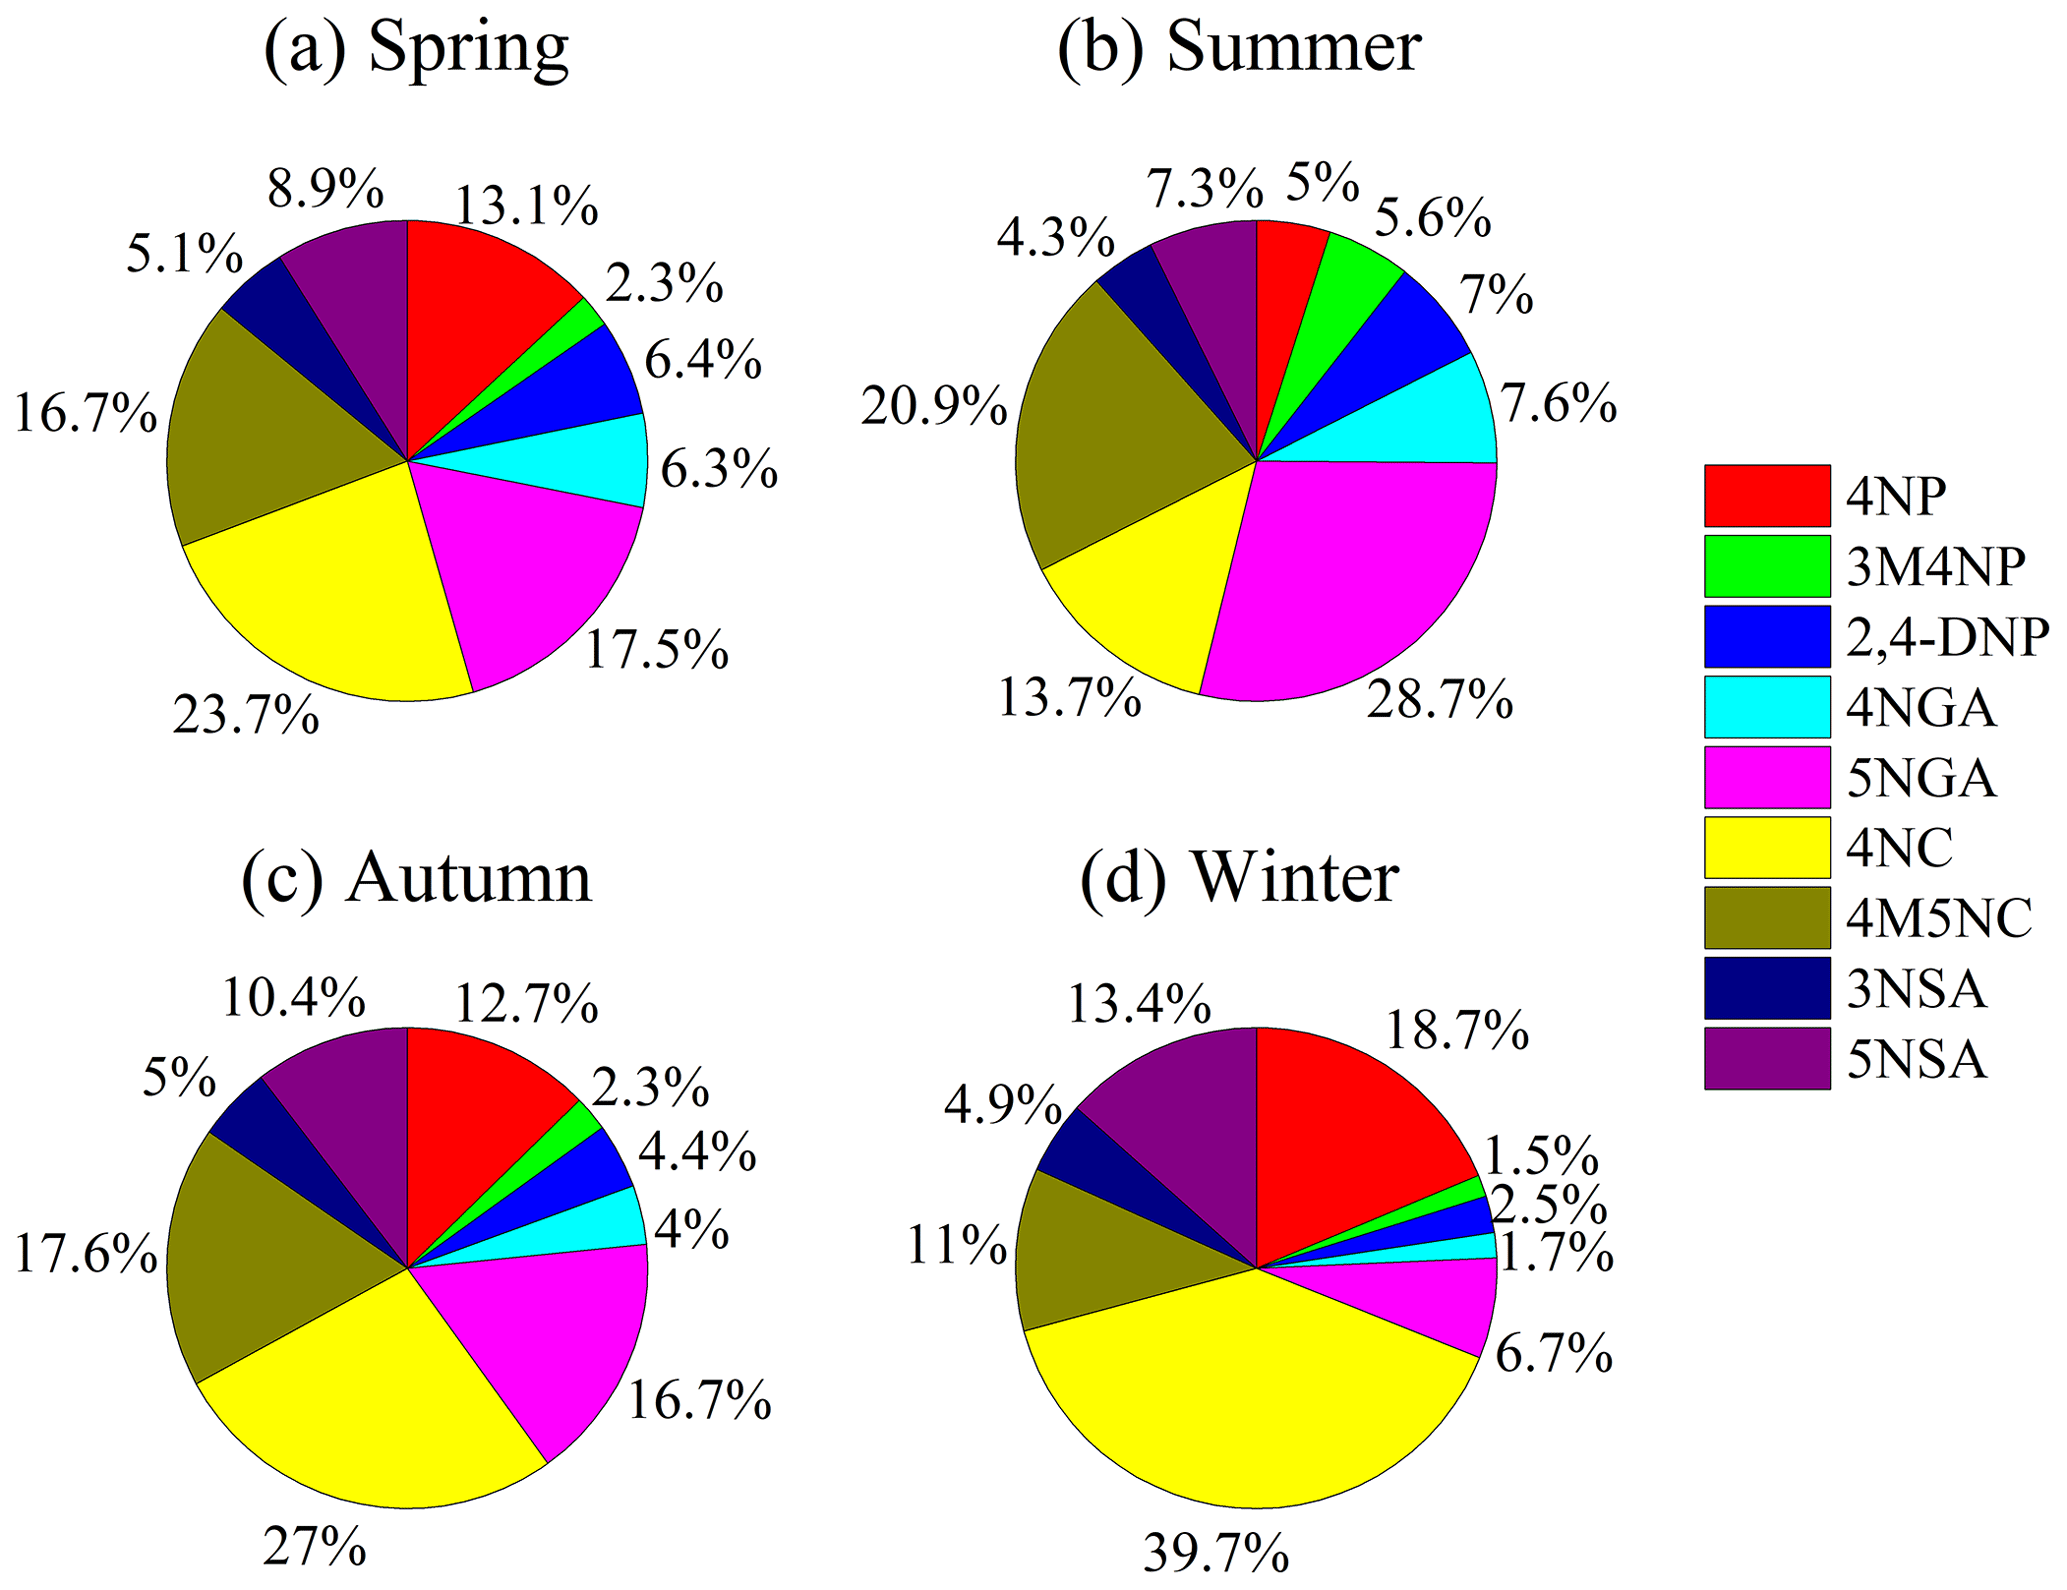
Figure 3Relative contribution of each NACs species during the sampling time (4NP – 4-nitrophenol, 3M4NP – 3-methyl-4-nitrophenol, 2,4-DNP – 2,4-dinitrophenol, 4NGA – 4-nitroguaiacol, 5NGA – 5-nitroguaiacol, 4NC – 4-nitrocatechol, 4M5NC – 4-methyl-5-nitrocatechol, 3NSA – 3-nitrosalicylic acid, and 5NSA – 5-nitrosalicylic acid).
Additionally, total NACs also showed strong correlations with NO2 (r=0.862, p<0.01), SO (r=0.396, p<0.01), NO (r=0.757, p<0.01), and NH (r=0.524, p<0.01), probably suggesting that secondary formation of NACs was also important in the campaign. Here, the NAC concentration was strongly associated with NO2, especially in the winter (Figs. 2e, 4b), and correlated better than other secondary tracers (Table 3), suggesting that NO2 is a relatively important component in the creation of NACs.
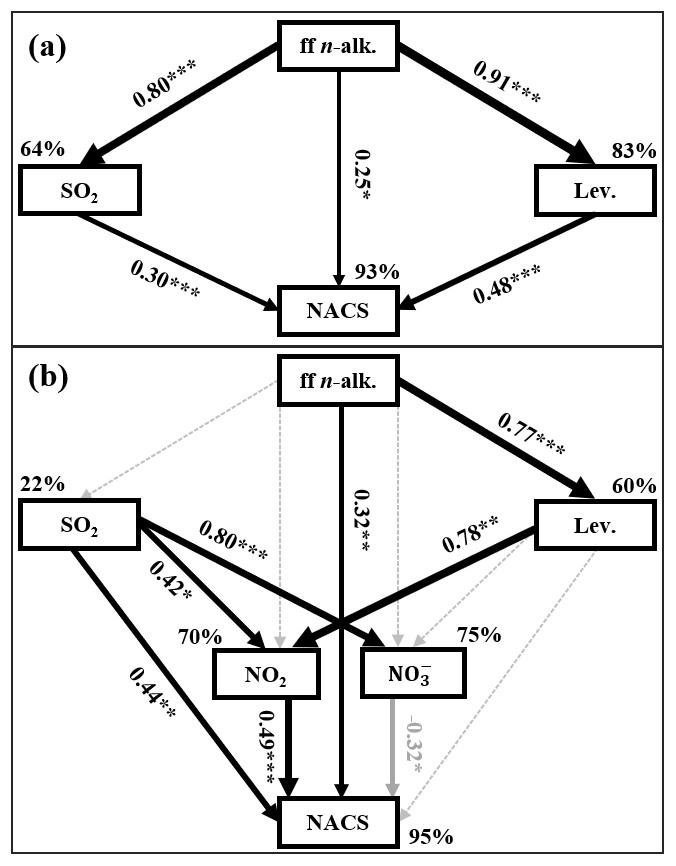
Figure 4Structural equation model (SEM) demonstrating the effects of ff-n-alk., SO2, Lev. (levoglucosan), and NO2 on annual (a) or winter (b) mean NACs. Black solid arrows indicate significant positive relationships, gray solid arrows indicate significant negative relationships, and black dashed arrows indicate nonsignificant path coefficients. The width of arrows is proportional to the strength of path coefficients. Numbers on arrows are standardized path coefficients (equivalent to correlation coefficients), and asterisks following the numbers imply significant relationships (, , ). Percentages (R2) close to endogenous variables indicate the variance explained by the ff-n-alk., SO2, Lev., and NO2.
Table 3Pearson correlations between individual NAC species and meteorological parameters, aerosol components, and gas pollutants during the whole campaign (n=49).
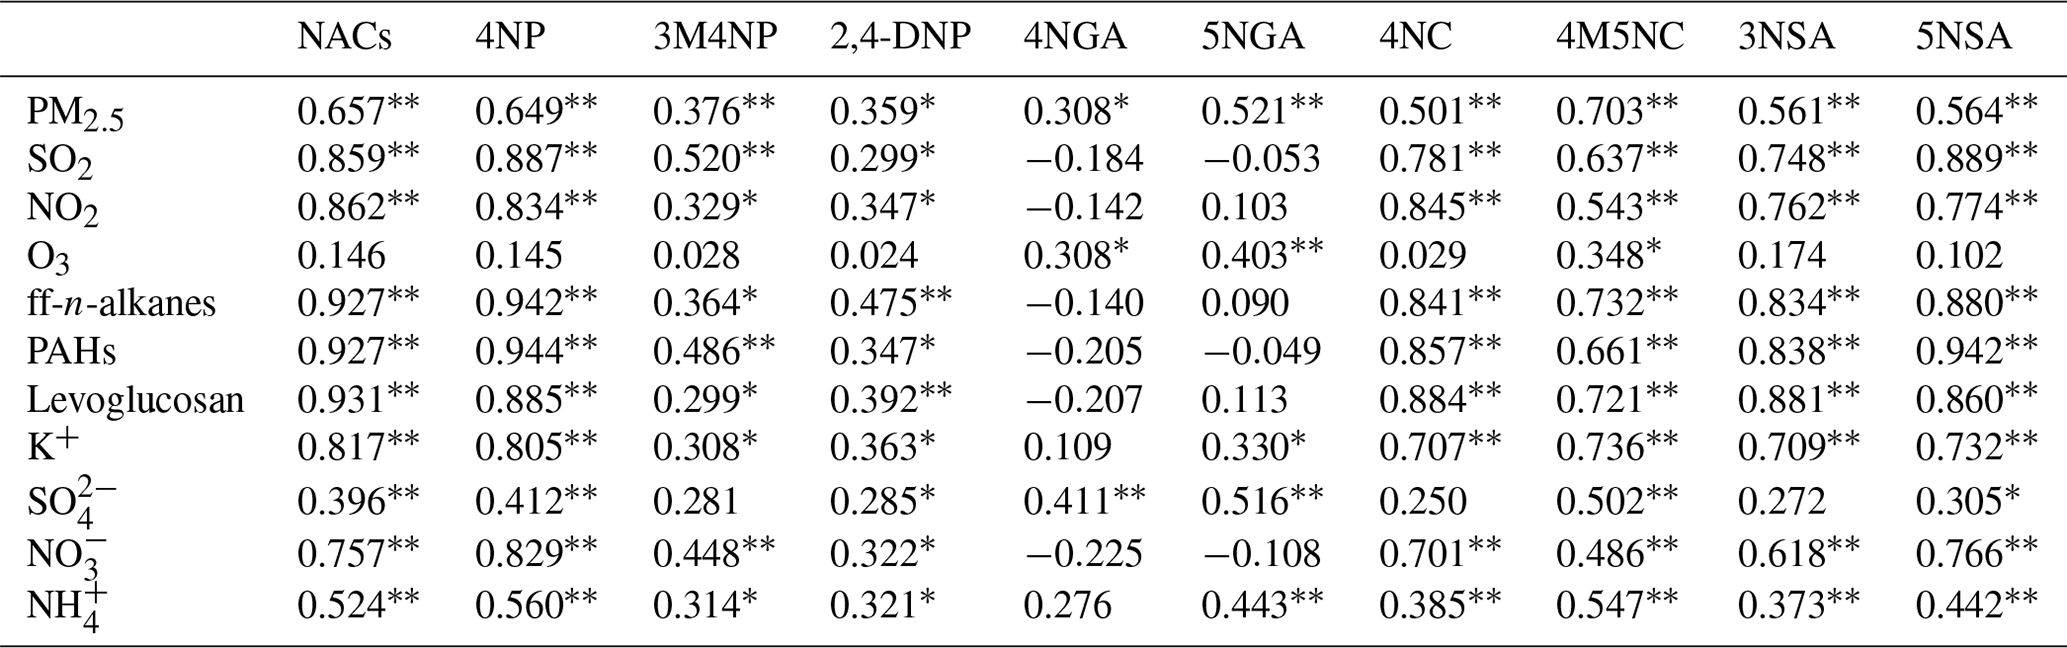
* Significant correlation at the 0.05 level. Significant correlation at the 0.01 level.
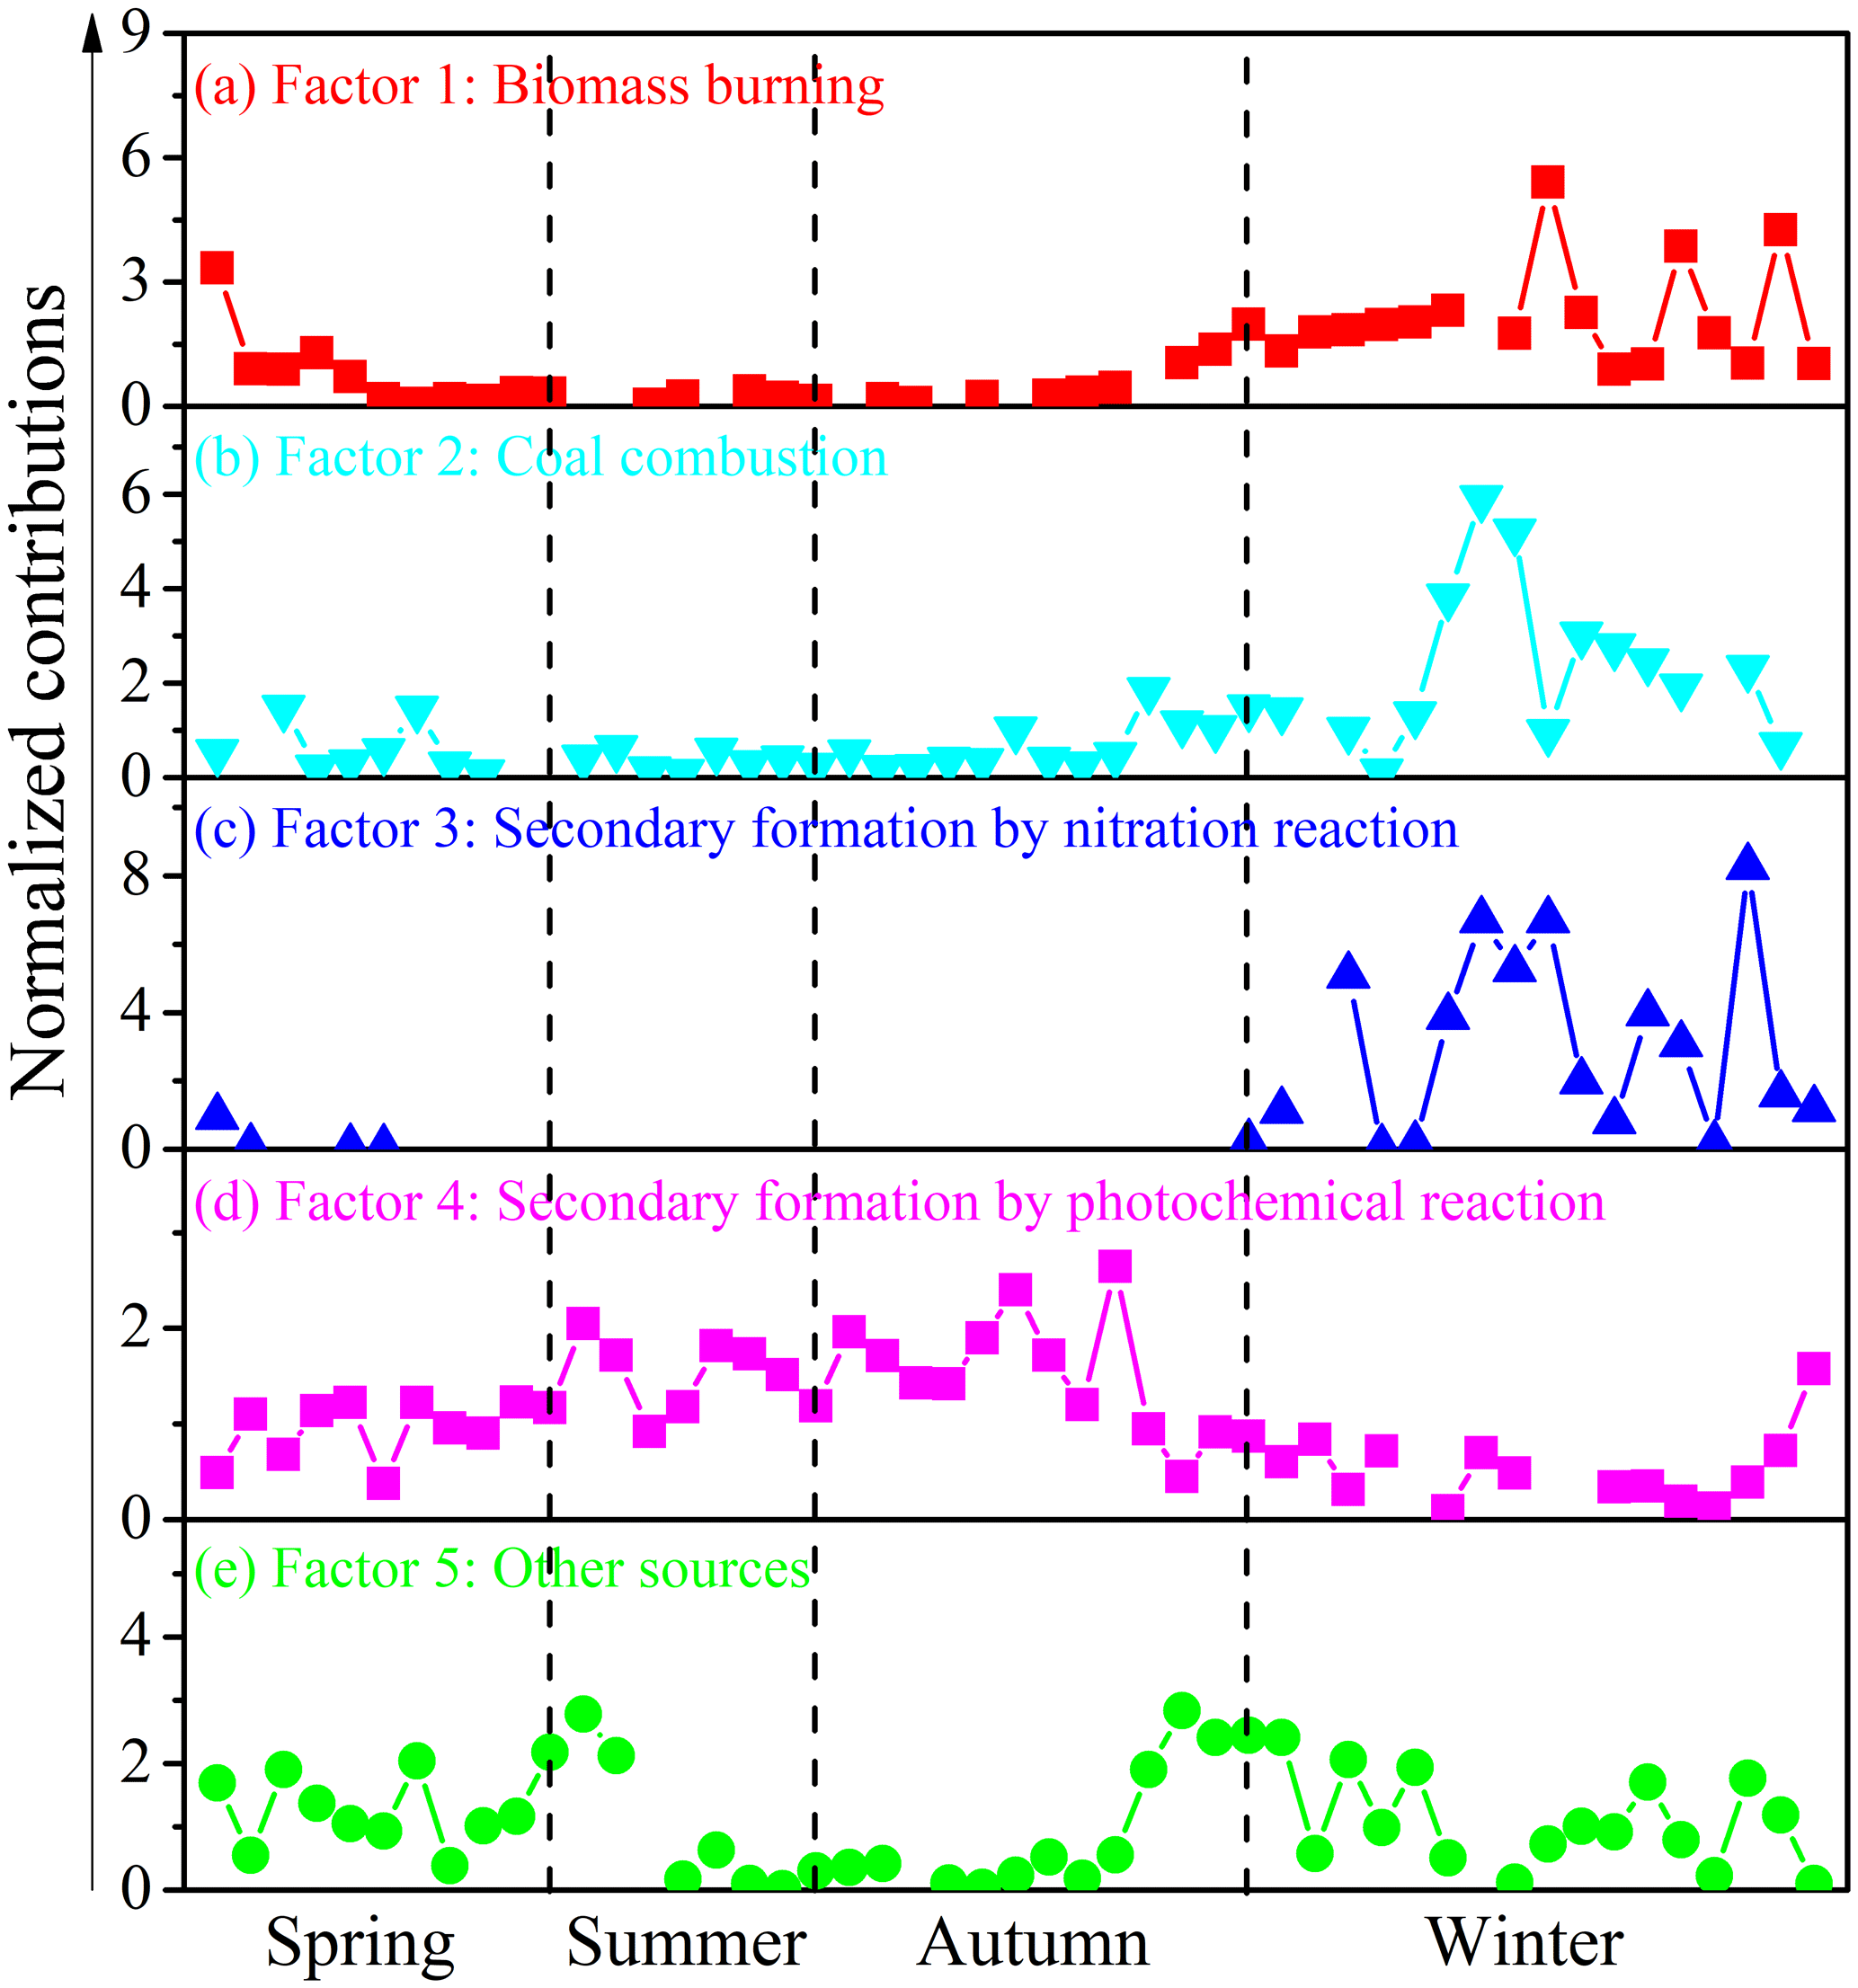
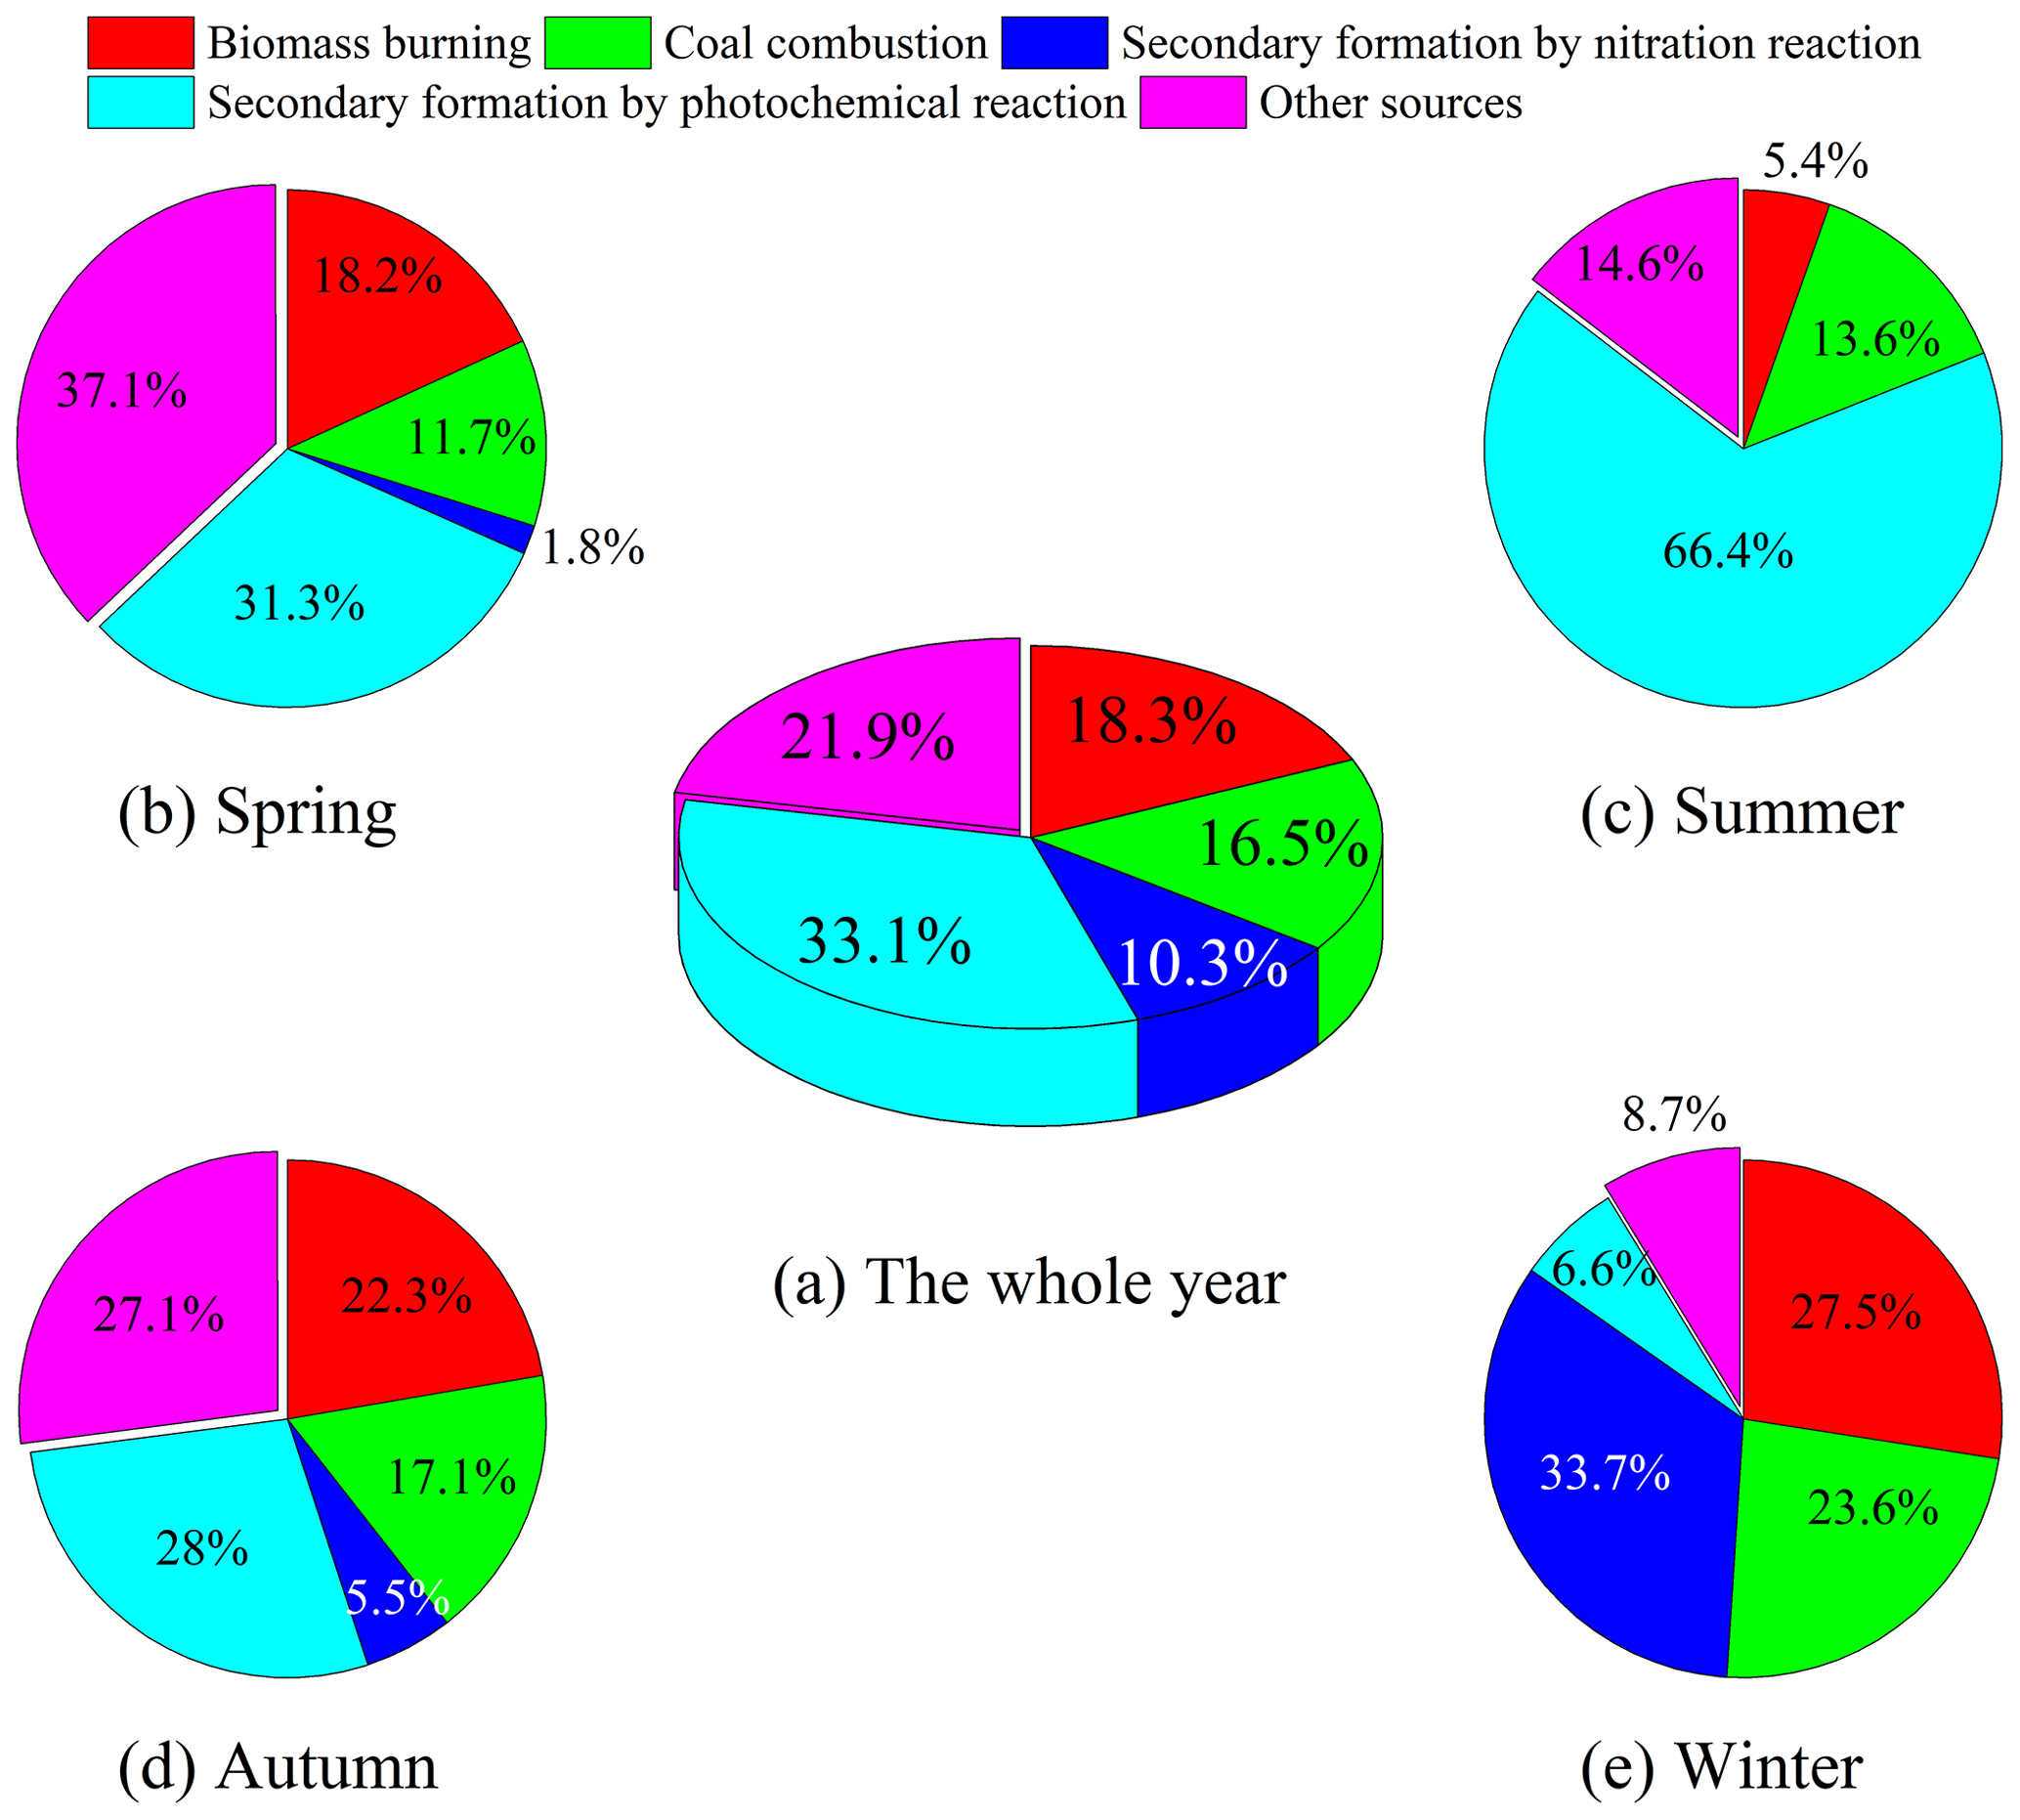
To further quantify the effects of various pollutants' emissions on NACs during the campaign, this work identified five sources by applying the PMF model. These sources have been shown in Figs. 5 and 6. For the first source factor, biomass burning, it was identified that levoglucosan loading was larger in this component profile than in others. Furthermore, there were also other high-loading anthropogenic primary organic markers, including ff-n-alkanes, PAHs, SO2, and NO2 (Fig. 5a). These sources had obvious seasonal variation characteristics which were much more intense in winter and early spring than in other seasons (Fig. 6a). It contributed 18.3 % of the total particulate NACs at the summit of Mt. Wuyi during the whole campaign (Fig. 7a). Based on the air mass backward trajectories, it was assumed to originate from the long-range transport (Fig. 1). Coal combustion was identified as the second source factor, with high levels of SO2 (Fig. 5b). This source was also much more intense in winter than in other seasons and affected by the transport of pollutants. (Fig. 6b). It contributed 16.5 % of the total particulate NACs at the summit of Mt. Wuyi during the whole campaign (Fig. 7a). The third source factor, namely secondary formation by nitration reaction, showed high concentrations of NO (Fig. 5c). This source was much more intense in winter than in other seasons (Fig. 6c). It contributed 10.3 % of the total particulate NACs at the summit of Mt. Wuyi during the whole campaign (Fig. 7a). And this source may be mainly affected by the transport of pollutants. Secondary formation by photochemical reaction was recognized as the fourth source factor, with relatively high levels of O3 and low levels of anthropogenic pollutants (e.g., SO2, NO2, ff-n-alkanes, PAHs, levoglucosan), indicating it to be mostly a local source (Fig. 5d). It is noteworthy that trehalose also showed relatively high levels because this component is a naturally existing carbohydrate in vegetation that was abundant at the sampling site. Different from the above-mentioned sources, contributions from this source were higher on average in summer than in other seasons (Fig. 6d). It contributed 33 % of the total particulate NACs at the summit of Mt. Wuyi during the whole campaign (Fig. 7a). Other sources were identified as the last factor including primary emissions and secondary formation (Fig. 5e), due to the highest loading of SO2, NO2, and K+ as well as O3, SO, and NH. The contribution of this source was more significant in spring and later autumn, with the least amount in later summer and early autumn (Fig. 6e). Based on these variations of markers, this source was influenced by both transport and local pollutants. It contributed 21.9 % of the total particulate NACs at the summit of Mt. Wuyi during the whole campaign year (Fig. 7a).
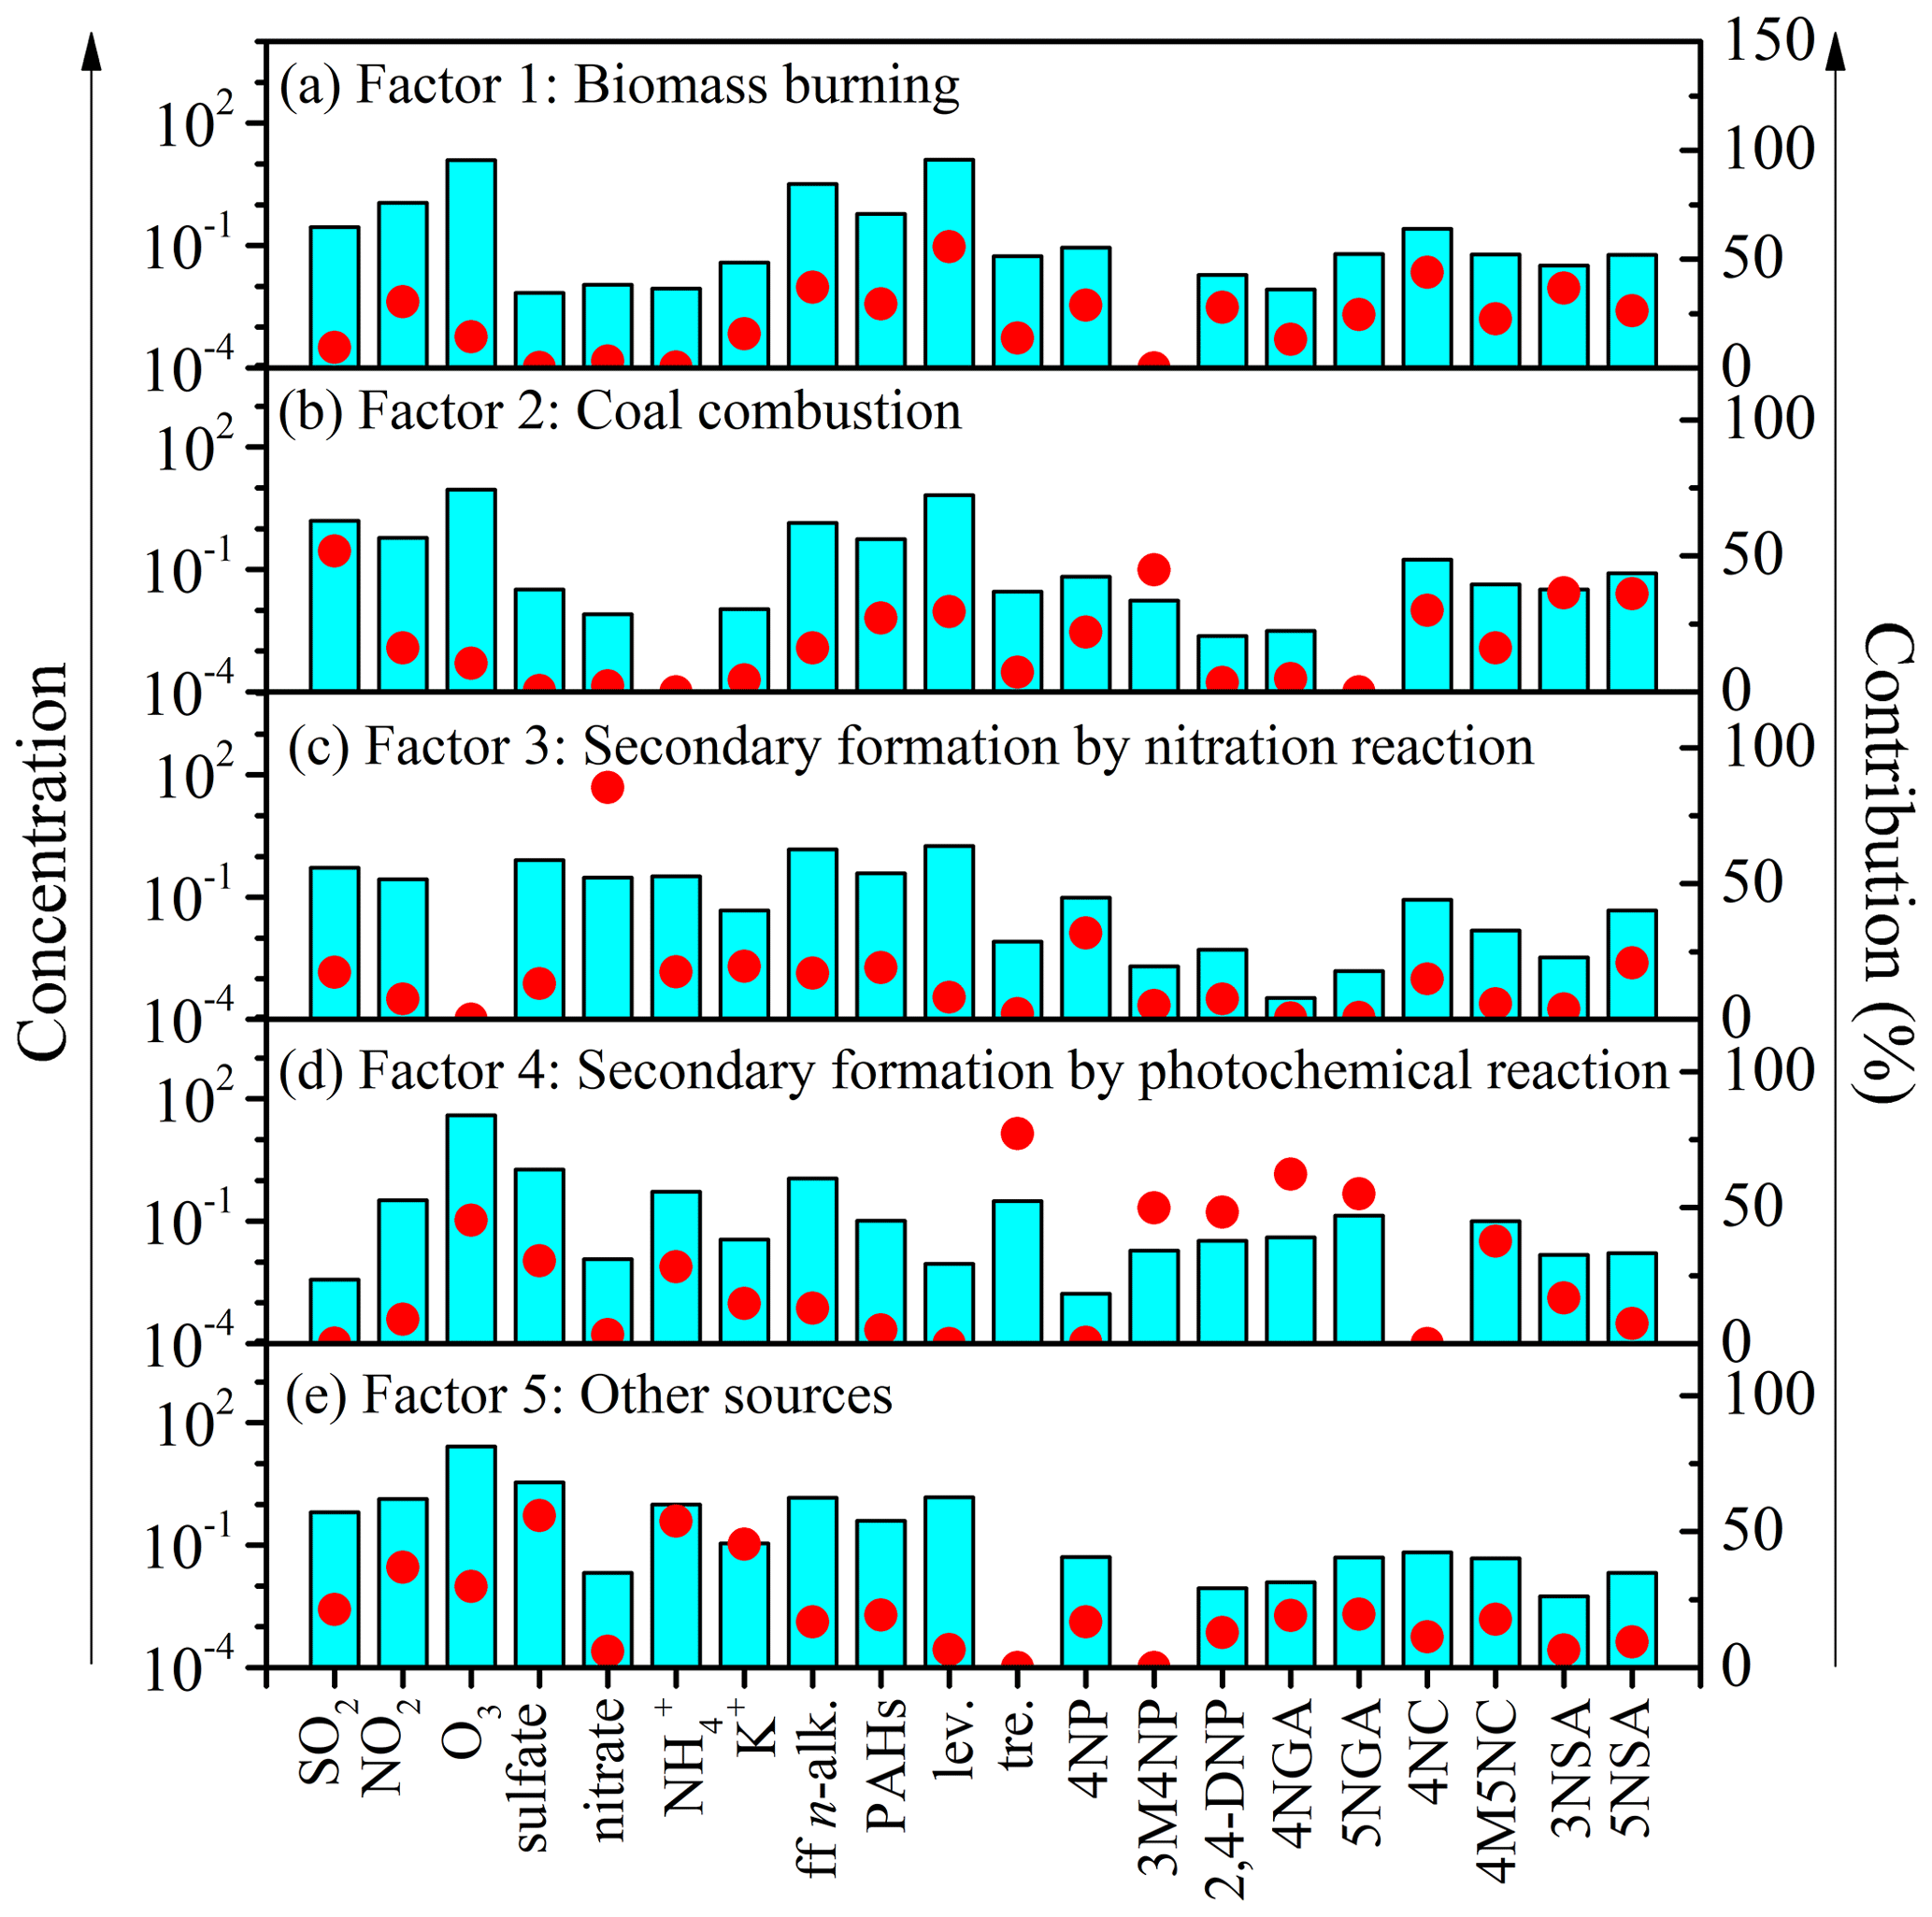
Figure 5Source profiles of NACs obtained from PMF analysis (ff-n-alk.– ff-n-alkane, lev. – levoglucosan, and tre. – trehalose).
4.3.2 Contributions of each source in different seasons
As mentioned above, those five sources had obviously different seasonal variation characteristics. Figure 7 compared the average contributions of the five source factors to the concentrations of total particulate NACs at the summit of Mt. Wuyi. This clarifies the difference in the sources of them in the four seasons at the mountain background station of Southeast China.
During springtime, other sources had the biggest influence on NACs, followed by secondary formation by photochemical reaction, which accounted respectively for 37.1 % and 31.3 % of the total (Fig. 7b). For total NACs, the correlation coefficient (Pearson r) was strong with SO2, ff-n-alkanes, PAHs, levoglucosan, and K+ (r>0.73, p<0.01), and the total NACs correlated well with NO2, O3, NO, and NH (r>0.70, p<0.01) (Table S3). The outcome indicated that NACs originate not only from primary emissions but also from secondary formation. Furthermore, the Pearson r values for levoglucosan (r=0.933, p<0.01) and NO2 (r=0.945, p<0.01) were higher in comparison to other parameters, suggesting that biomass burning and NO2 had significant effects on NACs at the summit of Mt. Wuyi in spring.
During summertime, secondary formation by photochemical reaction was the largest contributor to NACs, with the relative contributions accounting for more than 65 % of the total (Fig. 7c). The photochemical production of NACs is related to the oxidation of aromatics in the presence of NO2, including the ••OH oxidation and the oxidation (Cai et al., 2022; Ren et al., 2022; Chen et al., 2022; Finewax et al., 2018). The correlation coefficient (Pearson r) of total NACs was strong with NO2 (r=0.869, p<0.01), O3 (r=0.786, p<0.01), SO (r=0.884, p<0.01), NO (r=0.678, p<0.05), and NH (r=0.881, p<0.01) (Table S4), suggesting that secondary formation contributes significantly to the summertime NACs at the summit of Mt. Wuyi. And the strong associations between O3 and NACs further support the significance of photochemical oxidation for NACs. Secondary formation has been identified as a major cause of the origin of atmospheric nitrated phenols, particularly in the summer, during the various field and modeling investigations conducted recently (Yuan et al., 2016; Mayorga et al., 2021; Xie et al., 2017; Cai et al., 2022; Wang et al., 2019).
During autumn, the relative contributions of each source of NACs were similar to those observed in spring. Secondary formation by photochemical reaction and other sources made almost equal contributions to NACs, which accounted for 28 % and 27.1 %, respectively (Fig. 7d). Biomass burning also made a relatively large contribution to NACs (22.3 %). There was still a strong correlation between NACs and NO2 (r=0.886, p<0.01). It is noteworthy that the correlation coefficient (Pearson r) of total NACs was stronger with SO2 (r=0.805, p<0.01) and SO (r=0.615, p<0.05), and weaker with O3 (r=0.165) in autumn than with the same in spring (Table S5). The findings revealed that at the summit of Mt. Wuyi in autumn, the proportional contribution of coal combustion was rising, and the impact of photochemical reaction was declining.
During wintertime, secondary formation by nitration reaction was the largest contributor for NACs (33.7 %), followed by biomass burning (27.5 %) and coal combustion (23.6 %) (Fig. 7e). The total NACs correlated better with NO2 (r=0.879, p<0.01) than any other parameters (Table S6), thereby pointing towards significant involvement of NO2 in NACs formation. According to earlier research, coal combustion and biomass burning had a greater contribution to NACs in the winter (Cai et al., 2022), with direct emissions from biomass burning in the range of 0.4 to 11.1 mg kg−1 (Iinuma et al., 2007; Wang et al., 2017). Furthermore, earlier research suggested that the detection of increased amounts of particulate phenols could be significantly attributed to coal combustion activities. The emission factors ranged from 0.2 to 10.1 mg kg−1 for bituminite, anthracite, lignite chunks, and briquettes. The residential coal combustion resulted in a net emission of 178 ± 42 Mg of fine particles of nitrated phenols, according to statistics of domestic coal consumption in a total of 30 provinces in Chinese in 2016 (Lu et al., 2019b).
4.4 Impact of NO2 on NACs
The total measured NACs and NO2 in our study displayed comparable temporal fluctuations (Fig. 2e), and they revealed strong correlations in the course of the entire campaign (r=0.879, p<0.01). To examine the impact of NO2 abundance further on the second generation of NACs and the current form, concentrations of total NACs and nitrate (NO as a function of NO2 abundance and the fluctuations of [NACs] [NO] mass ratios were plotted in Fig. 8. Generally, with increasing NO2 abundance, the concentrations of NACs and NO were higher (Fig. 8a, b), consistent with earlier investigations (Cai et al., 2022; Wang et al., 2018; Ren et al., 2022). It was worth noting that the encouraging effect of NO2 was more pronounced in winter than in other seasons (Fig. 8a). This is perhaps because winter had much higher NOx abundance with higher VOC precursor oxidation capacity (Cai et al., 2022). Moreover, the results of SEM also proved this point. The influence of the weight of NO2 on NACs was significantly greater than that of other factors in winter, such as ff-n-alkane and SO2, although they all had significant effects on NACs (Fig. 4b). Fig. 8c showed the variations of [NACs] [NO] mass ratios in different seasons. In general, the mass ratios ranged from 1 to 285 ng µg−1 with an average of 73 ng µg−1 during the whole campaign. In previous studies, this ratio was generally between 1 ng µg−1 and 14 ng µg−1 at urban stations. For example, it was on average 13.5 ng µg−1 in Beijing during spring and summer (Ren et al., 2022), 1.4 ng µg−1 and 2.1 ng µg−1 in Jinan during summer and winter, respectively (Wang et al., 2018), and from 1 to 9 ng µg−1 in Shanghai (Cai et al., 2022). This mass ratio was obviously much higher in comparison to that observed in urban sites, and this phenomenon would suggest that NACs were more likely generated in the background site at low NOx levels. According to certain studies conducted in urban centers, when NO2 levels were high (NO2>30 ppb), the NO2 excess would be further oxidized to generate inorganic nitrate, which would lead to a change in the relative dominance of organic and inorganic compounds. When NO2 was scarcer, a higher portion of NO2 was covered into organic nitrogen (Cai et al., 2022; Wang et al., 2018). The NO2 levels on the summit of Mt. Wuyi were much lower than those in the urban atmosphere. Moreover, the ratio of [NACs] [NO] was highest, with the lowest NO2 levels in summer compared to the other three seasons (Fig. 8c). These results further indicated that the formation of organic nitrated aerosols was relatively sensitive to NO2 at the low-NOx level. In addition, the possible reason for the low level of [NACs] [NO] in winter was that NO was an increasingly important component of PM2.5, especially during heavy pollution (Wang et al., 2023; Fu et al., 2020).
To investigate the influence of NO2 on NAC compositions, the variation of NAC compositions as a function of NO2 levels is shown in Fig. 9. In this work, NO2 levels had an impact on NAC composition besides encouraging their synthesis, especially for NCs (Fig. 9a). The contributions of 4NC for total NACs were significant at elevated NO2 levels. When NO2 reached above 8µg m−3, the concentrations of NACs reached their maximum values, and 4NC made the greatest contribution to the total NACs followed by 4NP at this time (Fig. 9b). The role of elevated NO2 in promoting formation of NCs was more obvious than NPs, mainly because of their difference in generation mechanism. The major formation pathway of NCs was the oxidation of aromatics in the presence of NO2 (Wang et al., 2019; Xie et al., 2017). While NPs could originate through gas-phase oxidation of phenol, benzene, and toluene by OH or NO3 radicals in the presence of NO2, particle-phase NPs were strongly dependent on the gas-to-particle partitioning and gas-phase loss (Wang et al., 2019; Ji et al., 2017; Yuan et al., 2016).
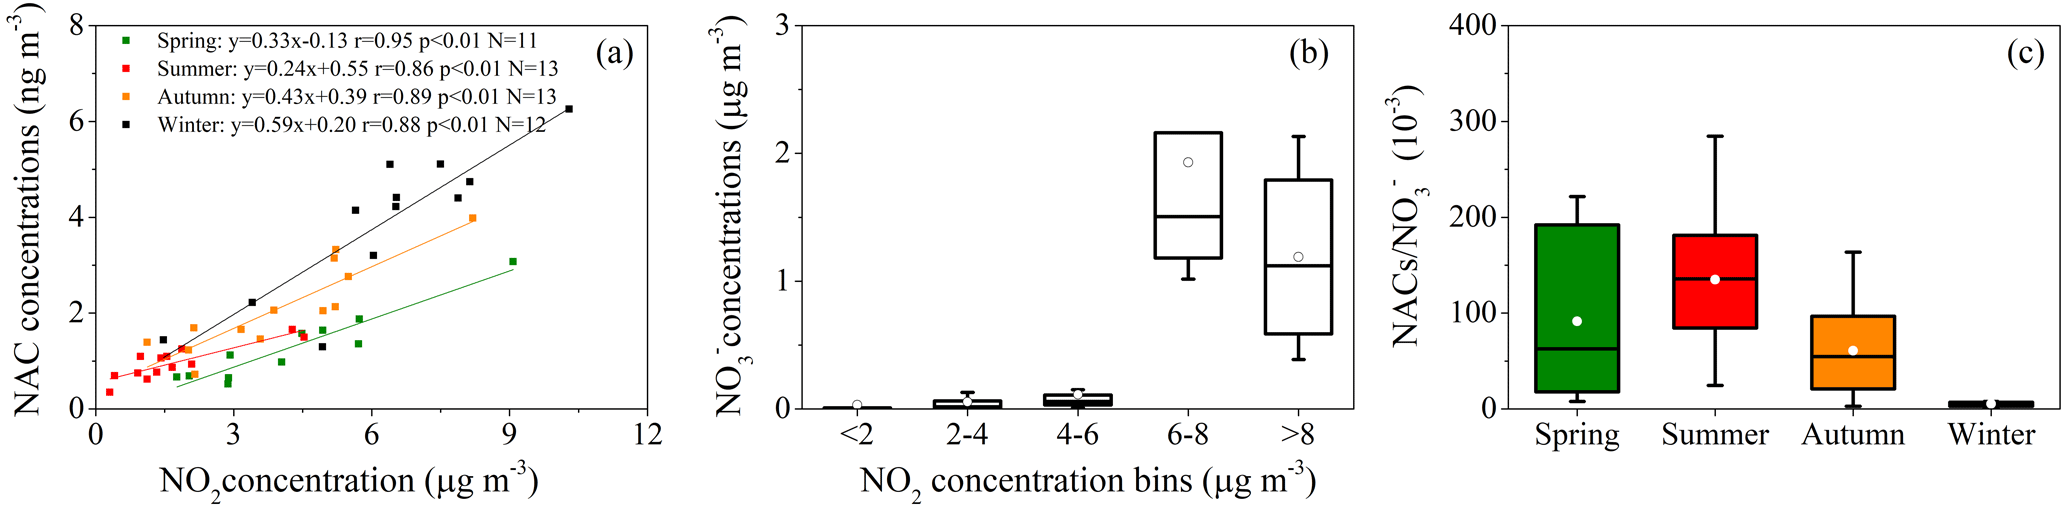
Figure 8Concentrations of NACs (a) and nitrate (NO (b) as a function of NO2 concentration bins and NAC NO ratios (c) during the whole sampling time. The mean values are represented by the markers, and the 25th and 75th percentiles are represented by whiskers.
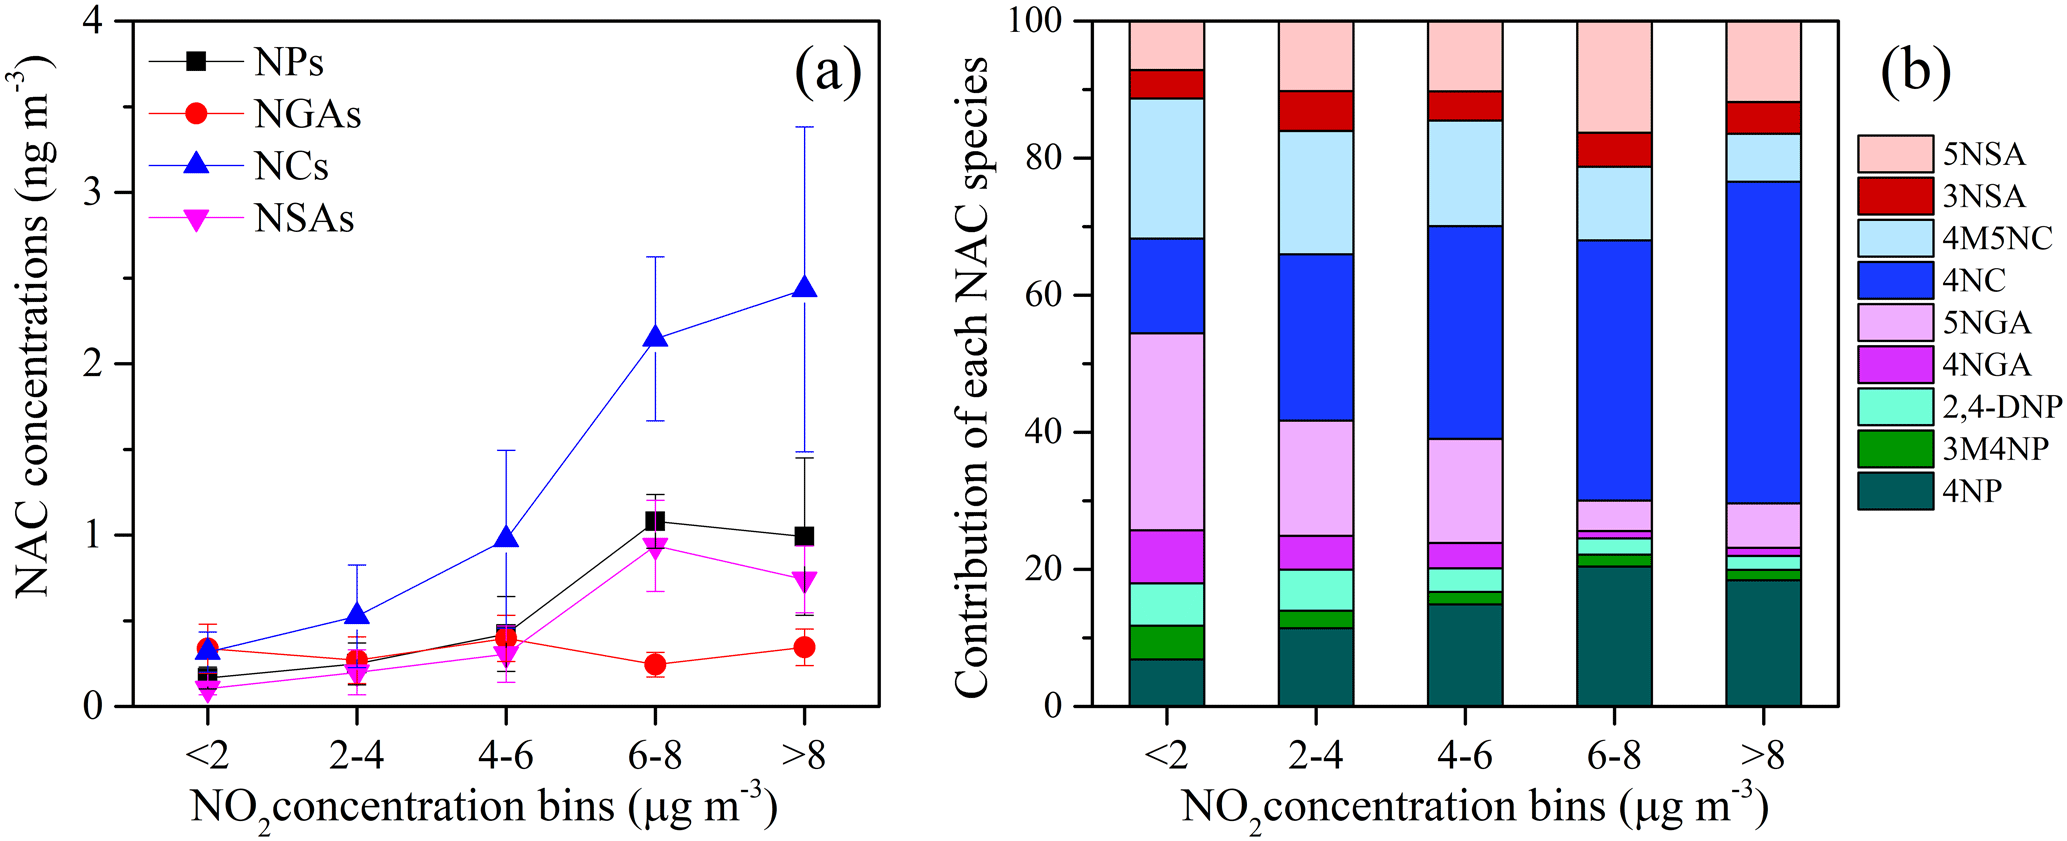
Figure 9Concentrations of NACs (a) and (b) contribution of each NACs species as a function of NO2 concentration bins. (NPs – 4NP, 3M4NP, and 2,4-DNP; NGAs – 4NGA and 5NGA; NCs – 4NC and 4M5NC; and NSAs – 3NSA and 5NSA).
NACs in fine particle were examined at the peak of Mt. Wuyi in 2014 and 2015. Nine quantified NACs manifested a significant rise in overall abundance in the winter and autumn, partly as a result of air masses traveling primarily through northern heating regions and indicating strong influences of anthropogenic activities. To identify the sources of NACs, the PMF receptor model was applied. There were five source factors identified, including biomass burning, coal combustion, secondary formation by nitration reaction, secondary formation by photochemical reaction, and other sources. Due to the impact of long-range transport of air pollutants, biomass burning and coal combustion were important primary sources. It is important to note that secondary generation was an important source of NAC in these remote areas during the sampling time, and the production of organic nitrated aerosols was relatively responsive to NO2 under low-NOx conditions. This work clearly demonstrated that anthropogenic emissions could impact the pollution levels and variation characteristics of NACs in the atmosphere and the crucial roles of secondary formation in remote mountain regions.
Previous studies came to a consensus that organic nitrated aerosols were relatively sensitive to NO2 under low levels. However, in different atmospheric conditions, different levels of NO2 may have different effects on nitrate aerosols, especially at high NOx levels. In Beijing, our prior research showed that at NO2 concentrations above 30 ppb, inorganic nitrates were converted more quickly during the day, while in the night, there was a shift in the corresponding products of oxidation to predominantly organic ones (Ren et al., 2022). The transition from organic- to inorganic-dominated products takes place in line with the switch from low- to high-NOx regimes according to Wang et al. (2019), with low-NOx conditions being predominated by organic-dominated products and a switch from majorly organic-entities to inorganic ones at high-NOx conditions (NO2∼25 ppb for the night and NO2 ∼20 ppb for the day). Cai et al. (2022) also indicated that inorganic nitrate predominated among the NOx oxidation products in high-NOx concentrations (NO2>30 ppb). These variations could be caused by different precursor kinds and concentrations, as well as other variables. Therefore, additional and more thorough research is required to fully understand the quantitative impact of NO2 on nitrate aerosols under various atmospheric conditions using laboratory simulation and field measurements.
The field observational and the lab experimental data used in this study are available from the corresponding author upon request (Gehui Wang via ghwang@geo.ecnu.edu.cn).
The supplement related to this article is available online at: https://doi.org/10.5194/acp-23-6835-2023-supplement.
GW designed the research; JT and ZZ collected the samples; YR conducted the experiments; YR and JW analyzed the data and wrote the paper; and GW, JW, and HL contributed to the paper with useful scientific discussions and comments.
The contact author has declared that none of the authors has any competing interests.
Publisher's note: Copernicus Publications remains neutral with regard to jurisdictional claims in published maps and institutional affiliations.
This work is financially supported by a program of the National Natural Science Foundation of China (grant no. 41907197) and the Fundamental Research Funds for Central Public Welfare Scientific Research Institutes of China, Chinese Research Academy of Environmental Sciences (grant no. 2019YSKY-018).
This research has been supported by the National Natural Science Foundation of China (grant no. 41907197) and the Chinese Research Academy of Environmental Sciences (grant no. 2019YSKY-018).
This paper was edited by Ivan Kourtchev and reviewed by two anonymous referees.
Bandowe, B. A. M., Meusel, H., Huang, R.-J., Ho, K., Cao, J., Hoffmann, T., and Wilcke, W.: PM 2.5-bound oxygenated PAHs, nitro-PAHs and parent-PAHs from the atmosphere of a Chinese megacity: seasonal variation, sources and cancer risk assessment, Sci. Total. Environ., 473, 77–87, 2014.
Berndt, T. and Bge, O.: Gas-phase reaction of OH radicals with phenol, PCCP, 5, 342–350, https://doi.org/10.1039/B208187C, 2003.
Cai, D., Wang, X., George, C., Cheng, T., Herrmann, H., Li, X., and Chen, J.: Formation of Secondary Nitroaromatic Compounds in Polluted Urban Environments, J. Geophys. Res.-Atmos., 127, e2021JD036167, https://doi.org/10.1029/2021JD036167, 2022.
Chen, Y. Zheng, P., Wang, Z., Pu, W., Tan, Y., Yu, C., Xia, M., Wang, W., Guo, J., Huang, D., Yan, C., Nie, W., Ling, Z., Chen, Q., Lee, S., and Wang, T.: Secondary Formation and Impacts of Gaseous Nitro-Phenolic Compounds in the Continental Outflow Observed at a Background Site in South China, Environ. Sci. Technol., 56, 6933–6943, https://doi.org/10.1021/acs.est.1c04596, 2022.
Cheng, X., Chen, Q., Li, Y., Huang, G., Liu, Y., Lu, S., Zheng, Y., Qiu, W., Lu, K., Qiu, X., Bianchi, F., Yan, C., Yuan, B., Shao, M., Wang, Z., Canagaratna, M. R., Zhu, T., Wu, Y., and Zeng, L.: Secondary Production of Gaseous Nitrated Phenols in Polluted Urban Environments, Environ. Sci. Technol., 55, 4410–4419, https://doi.org/10.1021/acs.est.0c07988, 2021.
Chiapello, I., Bergametti, G., and Chaten, B.: Origins of African dusttransported over the northeastern tropical Atlantic, J. Geophys. Res.-Atmos., 102, 13701–13709, https://doi.org/10.1029/97JD00259, 1997.
Chow, K. S., Huang, X. H. H., and Yu, J. Z.: Quantification of nitroaromatic compounds in atmospheric fine particulate matter in Hong Kong over 3 years: field measurement evidence for secondary formation derived from biomass burning emissions, Environ. Chem., 13, 665, https://doi.org/10.1071/EN15174, 2015.
Comero, S., Capitani, L., and Gawlik, B.: Positive Matrix Factorisation (PMF)–An introduction to the chemometric evaluation of environmental monitoring data using PMF, Office for Official Publications of the European Communities, Luxembourg, 59, JRC-IES, 978-92-79-12954-4, 2009.
Desyaterik, Y., Sun, Y., Shen, X., Lee, T., Wang, X., Tao, W., and Collett, J. L.: Speciation of “brown” carbon in cloud water impacted by agricultural biomass burning in eastern China, J. Geophys. Res.-Atmos., 118, 7389–7399, https://doi.org/10.1002/jgrd.50561, 2013.
Finewax, Z., de Gouw, J. A., and Ziemann, P. J.: Identification and Quantification of 4-Nitrocatechol Formed from OH and NO3 Radical-Initiated Reactions of Catechol in Air in the Presence of NOx: Implications for Secondary Organic Aerosol Formation from Biomass Burning, Environ. Sci. Technol., 52, 19811989, https://doi.org/10.1021/acs.est.7b05864, 2018.
Fu, X., Wang, T., Gao, J., Wang, P., and Xue, L.: Persistent Heavy Winter Nitrate Pollution Driven by Increased Photochemical Oxidants in Northern China, Environ. Sci. Technol., 54, 3881–3889, https://doi.org/10.1021/acs.est.9b07248, 2020.
Gaston, C. J., Lopez-Hilfiker, F. D., Whybrew, L. E., Hadley, O., Mcnair, F., Gao, H., Jaffe, D. A., and Thornton, J. A.: Online molecular characterization of fine particulate matter in Port Angeles, WA: Evidence for a major impact from residential wood smoke, Atmos. Environ., 138, 99–107, 2016.
Harrison, M. A. J., Barra, S., Borghesi, D., Vione, D., Arsene, C., and Olariu, R. I.: Nitrated phenols in the atmosphere: a review, Atmos. Environ., 39, 231–248, https://doi.org/10.1016/j.atmosenv.2004.09.044, 2005.
Iinuma, Y., Brüggemann, E., Gnauk, T., Müller, K., Andreae, M. O., Helas, G., Parmar, R., and Herrmann, H.: Source characterization of biomass burning particles: The combustion of selected European conifers, African hardwood, savanna grass, and German and Indonesian peat, J. Geophys. Res.-Atmos., 112, D08209, https://doi.org/10.1029/2006JD007120, 2007.
Iinuma, Y., Boge, O., Graefe, R., and Herrmann, H.: Methyl-Nitrocatechols: Atmospheric Tracer Compounds for Biomass Burning Secondary Organic Aerosols, Environ. Sci. Technol., 44, 8453–8459, https://doi.org/10.1021/es102938a, 2010.
Ji, Y., Zhao, J., Terazono, H., Misawa, K., and Zhang, R.: Reassessing the atmospheric oxidation mechanism of toluene, P. Natl. Acad. Sci. USA, 114, 8169–8174, 2017.
Kahnt, A., Behrouzi, S., Vermeylen, R., Shalamzari, M. S., Vercauteren, J., Roekens, E., Claeys, M., and Maenhaut, W.: One-year study of nitro-organic compounds and their relation to wood burning in PM10 aerosol from a rural site in Belgium, Atmos. Environ., 81, 561–568, https://doi.org/10.1016/j.atmosenv.2013.09.041, 2013.
Kitanovski, Z., Grgic, I., Vermeylen, R., Claeys, M., and Maenhaut, W.: Liquid chromatography tandem mass spectrometry method for characterization of monoaromatic nitro-compounds in atmospheric particulate matter, J. Chromatogr., 1268, 35–43, https://doi.org/10.1016/j.chroma.2012.10.021, 2012.
Kitanovski, Z., Hovorka, J., Kuta, J., Leoni, C., Proke, R., Sáňka, O., Shahpoury, P., and Lammel, G.: Nitrated monoaromatic hydrocarbons (nitrophenols, nitrocatechols, nitrosalicylic acids) in ambient air: levels, mass size distributions and inhalation bioaccessibility, Environ. Sci. Pollut. Res., 28, 59131–59140, https://doi.org/10.1007/S11356-020-09540-3, 2021.
Li, J., Wang, G., Ren, Y., Wang, J., Wu, C., Han, Y., Zhang, L., Cheng, C., and Meng, J.: Identification of chemical compositions and sources of atmospheric aerosols in Xi'an, inland China during two types of haze events, Sci. Total. Environ., 566, 230–237, 2016.
Li, J., Zhang, Q., Wang, G., Li, J., Wu, C., Liu, L., Wang, J., Jiang, W., Li, L., Ho, K. F., and Cao, J.: Optical properties and molecular compositions of water-soluble and water-insoluble brown carbon (BrC) aerosols in northwest China, Atmos. Chem. Phys., 20, 4889–4904, https://doi.org/10.5194/acp-20-4889-2020, 2020.
Li, M., Wang, X., Lu, C., Li, R., Zhang, J., Dong, S., Yang, L., Xue, L., Chen, J., and Wang, W.: Nitrated phenols and the phenolic precursors in the atmosphere in urban Jinan, China, Sci. Total. Environ., 714, 136760, https://doi.org/10.1016/j.scitotenv.2020.136760, 2020.
Li, X., Yang, Y., Liu, S., Zhao, Q., Wang, G., and Wang, Y.: Light absorption properties of brown carbon (BrC) in autumn and winter in Beijing: Composition, formation and contribution of nitrated aromatic compounds, Atmos. Environ., 223, 117289, https://doi.org/10.1016/j.atmosenv.2020.117289, 2020.
Liang, Y., Wang, X., Dong, S., Liu, Z., Mu, J., Lu, C., Zhang, J., Li, M., Xue, L., and Wang, W.: Size distributions of nitrated phenols in winter at a coastal site in north China and the impacts from primary sources and secondary formation, Chemosphere, 250, 126256, https://doi.org/10.1016/j.chemosphere.2020.126256, 2020.
Lin, P., Bluvshtein, N., Rudich, Y., Nizkorodov, S. A., Laskin, J., and Laskin, A.: Molecular Chemistry of Atmospheric Brown Carbon Inferred from a Nationwide Biomass Burning Event, Environ. Sci. Technol., 51, 11561–11570, https://doi.org/10.1021/acs.est.7b02276, 2017.
Lu, C., Wang, X., Dong, S., Zhang, J., and Wang, W.: Emissions of fine particulate nitrated phenols from various on-road vehicles in China, Environ. Res., 179, 108709, https://doi.org/10.1016/j.envres.2019.108709, 2019a.
Lu, C., Wang, X., Li, R., Gu, R., Zhang, Y., Li, W., Gao, R., Chen, B., Xue, L., and Wang, W.: Emissions of fine particulate nitrated phenols from residential coal combustion in China, Atmos. Environ., 203, 10–17, https://doi.org/10.1016/j.atmosenv.2019.01.047, 2019b.
Lv, S., Wang, F., Wu, C., Chen, Y., Liu, S., Zhang, S., Li, D., Du, W., Zhang, F., Wang, H., Huang, C., Fu, Q., Duan, Y., and Wang, G.: Gas-to-aerosol phase partitioning of atmospheric water-soluble organic compounds at a rural site of China: An enhancing effect of NH3 on SOA formation, Environ. Sci. Technol., 56, 3915–3924, https://doi.org/10.1021/acs.est.1c06855, 2022.
Mayorga, R. J., Zhao, Z., and Zhang, H.: Formation of secondary organic aerosol from nitrate radical oxidation of phenolic VOCs: Implications for nitration mechanisms and brown carbon formation, Atmos. Environ., 244, 117910, https://doi.org/10.1016/j.atmosenv.2020.117910, 2021.
Mohr, C., Lopez-Hilfiker, F. D., Zotter, P., Prevot, A. S. H. P., Xu, L., Ng, N. L., Herndon, S. C., Williams, L. R., Franklin, J. P., Zahniser, M. S., Worsnop, D. R., Knighton, W. B., Aiken, A. C., Gorkowski, K. J., Dubey, M. K., Allan, J. D., and Thornton, J. A.: Contribution of Nitrated Phenols to Wood Burning Brown Carbon Light Absorption in Detling, United Kingdom during Winter Time, Environ. Sci. Technol., 47, 6316–6324, https://doi.org/10.1021/es400683v, 2013.
Ren, Y., Wei, J., Wang, G., Wu, Z., Ji, Y., and Li, H.: Evolution of aerosol chemistry in Beijing under strong influence of anthropogenic pollutants: Composition, sources, and secondary formation of fine particulate nitrated aromatic compounds, Environ. Res., 204, 111982, https://doi.org/10.1016/j.envres.2021.111982, 2022.
Ren, Y., Wang, G., Tao, J., Zhang, Z., Wu, C., Wang, J., Li, J., Wei, J., Li, H., and Meng, F.: Seasonal characteristics of biogenic secondary organic aerosols at Mt. Wuyi in Southeastern China: Influence of anthropogenic pollutants, Environ. Pollut., 252, 493–500, https://doi.org/10.1016/j.envpol.2019.05.077, 2019.
Salvador, C. M. G., Tang, R., Priestley, M., Li, L., Tsiligiannis, E., Le Breton, M., Zhu, W., Zeng, L., Wang, H., Yu, Y., Hu, M., Guo, S., and Hallquist, M.: Ambient nitro-aromatic compounds – biomass burning versus secondary formation in rural China, Atmos. Chem. Phys., 21, 1389–1406, https://doi.org/10.5194/acp-21-1389-2021, 2021.
Teich, M., van Pinxteren, D., Wang, M., Kecorius, S., Wang, Z., Müller, T., Močnik, G., and Herrmann, H.: Contributions of nitrated aromatic compounds to the light absorption of water-soluble and particulate brown carbon in different atmospheric environments in Germany and China, Atmos. Chem. Phys., 17, 1653–1672, https://doi.org/10.5194/acp-17-1653-2017, 2017.
Wang, G. H., Zhou, B. H., Cheng, C. L., Cao, J. J., Li, J. J., Meng, J. J., Tao, J., Zhang, R. J., and Fu, P. Q.: Impact of Gobi desert dust on aerosol chemistry of Xi'an, inland China during spring 2009: differences in composition and size distribution between the urban ground surface and the mountain atmosphere, Atmos. Chem. Phys., 13, 819–835, https://doi.org/10.5194/acp-13-819-2013, 2013.
Wang, G. H., Cheng, C. L., Huang, Y., Tao, J., Ren, Y. Q., Wu, F., Meng, J. J., Li, J. J., Cheng, Y. T., Cao, J. J., Liu, S. X., Zhang, T., Zhang, R., and Chen, Y. B.: Evolution of aerosol chemistry in Xi'an, inland China, during the dust storm period of 2013 – Part 1: Sources, chemical forms and formation mechanisms of nitrate and sulfate, Atmos. Chem. Phys., 14, 11571–11585, https://doi.org/10.5194/acp-14-11571-2014, 2014.
Wang, G., Zhang, R., Gomez, M. E., Yang, L., Levy, Z. M., Hu, M., Lin, Y., Peng, J., Guo, S., and Meng, J.: Persistent sulfate formation from London Fog to Chinese haze, P. Natl. Acad. Sci. USA, 113, 13630–13635, 2016.
Wang, H., Lu, K., Tan, Z., Chen, X., Liu, Y., and Zhang, Y.: Formation mechanism and control strategy for particulate nitrate in China, J. Environ. Sci., 123, 476–486, 2023.
Wang, L., Wang, X., Gu, R., Wang, H., Yao, L., Wen, L., Zhu, F., Wang, W., Xue, L., Yang, L., Lu, K., Chen, J., Wang, T., Zhang, Y., and Wang, W.: Observations of fine particulate nitrated phenols in four sites in northern China: concentrations, source apportionment, and secondary formation, Atmos. Chem. Phys., 18, 4349–4359, https://doi.org/10.5194/acp-18-4349-2018, 2018.
Wang, X., Gu, R., Wang, L., Xu, W., Zhang, Y., Chen, B., Li, W., Xue, L., Chen, J., and Wang, W.: Emissions of fine particulate nitrated phenols from the burning of five common types of biomass, Environ. Pollut., 230, 405–412, https://doi.org/10.1016/j.envpol.2017.06.072, 2017.
Wang, Y., Hu, M., Wang, Y., Zheng, J., Shang, D., Yang, Y., Liu, Y., Li, X., Tang, R., Zhu, W., Du, Z., Wu, Y., Guo, S., Wu, Z., Lou, S., Hallquist, M., and Yu, J. Z.: The formation of nitro-aromatic compounds under high NOx and anthropogenic VOC conditions in urban Beijing, China, Atmos. Chem. Phys., 19, 7649–7665, https://doi.org/10.5194/acp-19-7649-2019, 2019.
Wu, C., Wang, G., Li, J., Li, J., Cao, C., Ge, S., Xie, Y., Chen, J., Li, X., Xue, G., Wang, X., Zhao, Z., and Cao, F.: The characteristics of atmospheric brown carbon in Xi'an, inland China: sources, size distributions and optical properties, Atmos. Chem. Phys., 20, 2017–2030, https://doi.org/10.5194/acp-20-2017-2020, 2020.
Xie, M., Chen, X., Hays, M. D., Lewandowski, M., Offenberg, J. H., Kleindienst, T. E., and Holder, A. L.: Light Absorption of Secondary Organic Aerosol: Composition and Contribution of Nitroaromatic Compounds, Environ. Sci. Technol., 51, 11607–11616, https://doi.org/10.1021/acs.est.7b03263, 2017.
Yuan, B., Liggio, J., Wentzell, J., Li, S.-M., Stark, H., Roberts, J. M., Gilman, J., Lerner, B., Warneke, C., Li, R., Leithead, A., Osthoff, H. D., Wild, R., Brown, S. S., and de Gouw, J. A.: Secondary formation of nitrated phenols: insights from observations during the Uintah Basin Winter Ozone Study (UBWOS) 2014, Atmos. Chem. Phys., 16, 2139–2153, https://doi.org/10.5194/acp-16-2139-2016, 2016.
Zhang, X., Lin, Y. H., Surratt, J. D., and Weber, R. J.: Sources, Composition and Absorption ngstrm Exponent of Light-absorbing Organic Components in Aerosol Extracts from the Los Angeles Basin, Environ. Sci. Technol., 47, 3685–3693, https://doi.org/10.1021/es305047b, 2013.
Zhang, Y. Y., Müller, L., Winterhalter, R., Moortgat, G. K., Hoffmann, T., and Pöschl, U.: Seasonal cycle and temperature dependence of pinene oxidation products, dicarboxylic acids and nitrophenols in fine and coarse air particulate matter, Atmos. Chem. Phys., 10, 7859–7873, https://doi.org/10.5194/acp-10-7859-2010, 2010.