the Creative Commons Attribution 4.0 License.
the Creative Commons Attribution 4.0 License.
 | 19 Jun 2023
Measurement report: The 4-year variability and influence of the Winter Olympics and other special events on air quality in urban Beijing during wintertime
Yishuo Guo
Chenjuan Deng
Aino Ovaska
Feixue Zheng
Chenjie Hua
Junlei Zhan
Yiran Li
Jin Wu
Zongcheng Wang
Jiali Xie
Ying Zhang
Tingyu Liu
Yusheng Zhang
Boying Song
Wei Ma
Yongchun Liu
Jingkun Jiang
Veli-Matti Kerminen
Tuomo Nieminen
Markku Kulmala
Comprehensive measurements are vital to obtain big enough datasets for better understanding the complex atmosphere and further improving the air quality. To investigate the 4-year variation of air quality and the influences of special events (Beijing Winter Olympics, COVID lockdown and Chinese New Year) on it during the wintertime in polluted urban air, we conducted comprehensive observations in Beijing, China, during 1 January–20 February, in the years from 2019 to 2022. The mass concentration of PM2.5 and its composition (organics, nitrate, sulfate, ammonium, chloride and black carbon) and the number size distributions of particles (down to ∼1 nm) and ions, gaseous pollutants (CO, NOx, SO2, O3) and condensable vapors (sulfuric acid and oxygenated organic molecules), as well as meteorological parameters, were simultaneously measured. The days before 22 January without any special events in each year were selected to investigate the 4-year variability of air quality. We found that the concentrations of CO, NOx, total oxygenated organic molecules (OOMs), total PM2.5, organics, chloride and black carbon and the number concentration of sub-3 nm particles (N1.3−3) showed similar variations, decreasing from 2019 to 2021 and then increasing in 2022. For SO2, however, its concentration decreased year by year due to the significant emission reduction, further leading to the decrease of gaseous sulfuric acid and particulate sulfate from 2019 to 2022. O3 concentration showed an opposite 4-year variation compared with NOx. Meanwhile, both the oxygen and nitrogen contents of oxygenated organic molecules increased year by year, implying that not only the oxidation state of those compounds increased, but also NOx was involved more efficiently in their formation processes. With higher sulfuric acid concentrations and new particle formation (NPF) frequencies in 2021 than in 2022, and with the lowest concentrations of background aerosols and the lowest ambient temperatures in 2021, N1.3−3 was still the lowest in 2021. Unlike N1.3−3, the ion concentrations in both 0.8–2 and 2–4 nm size ranges were higher in 2021 than in the other years. Then, the days after 4 February were chosen to explore the influence of special events. The non-event days within this date range in 2019 and 2021 were chosen as the reference period. Due to the favorable meteorological conditions together with reductions in anthropogenic emissions, there were basically no haze events during the Olympics. Therefore, CO, NOx, SO2, total OOMs, accumulation-mode particles (N100−1000), and total PM2.5 and its composition were much lower, while ion concentrations were much higher compared with the reference period. Although there was also emission reduction during COVID, especially for NOx, the enhancement of secondary inorganic aerosol formation, together with unfavorable meteorological conditions, caused severe haze events during this period. Hence, CO, total OOMs and all PM2.5 compositions during COVID increased dramatically compared with the reference period. Influenced by SO2, condensation sink and sunlight, sulfuric acid concentration was found to be comparable between the Olympics and the reference period but was lower during COVID and Chinese New Year. Additionally, N1.3−3 was almost at the same level during different periods, indicating that the special events only had little impact on the NPF processes. These results provide useful information to the development of more targeted pollution control plans.
- Article
(10467 KB) - Full-text XML
-
Supplement
(4090 KB) - BibTeX
- EndNote


Beijing and the surrounding areas suffer from poor air quality associated with high particulate matter (PM) concentrations, especially during wintertime. To improve the air quality, extensive studies have been carried out to understand the sources, formation and evolution of air pollutants in Beijing (An et al., 2019; Sun et al., 2014; Zheng et al., 2015; Shang et al., 2020; Cheng et al., 2016). Primary emission sources, including traffic, cooking, coal combustion and biomass burning, have been identified (Du et al., 2022b; Cai et al., 2020; Z. Liu et al., 2016). Of primary emissions, those from combustions were found to be the major contributors to haze, especially during the heating season (Cheng et al., 2013; Y. L. Sun et al., 2013, 2014).
Compared with primary emissions, secondary aerosols have been shown to play a more important role in haze formation, with contributions higher than 60 % of PM1 mass concentration in Beijing (Shang et al., 2020; Huang et al., 2014; Kulmala et al., 2022). Secondary organic aerosols (SOAs), nitrate (NO3) and sulfate (SO4) originate from their gaseous precursors, e.g., volatile organic compounds (VOCs), nitrogen oxides (NOx) and sulfur dioxide (SO2). VOCs, NOx and SO2 further produce oxygenated organic molecules (OOMs), nitric acid (HNO3) and sulfuric acid (H2SO4), respectively, via homogeneous reactions, which can contribute to particle growth by condensation (Bianchi et al., 2019; M. Wang et al., 2020; Trostl et al., 2016; Yue et al., 2010). Most recently, Nie et al. (2022) reported that the condensation of OOMs contributed to >30 % of SOA in Beijing. Meanwhile, heterogeneous reactions were found to promote the formation of secondary aerosols. Dissolved SO2 can be oxidized into SO4 by atmospheric oxidants, e.g., H2O2, O3 and NO2 (Zhang et al., 2015; J. Wang et al., 2020; Cheng et al., 2016). Heterogeneous reactions between HNO3 and NH3 in daytime and hydrolysis of N2O5 during nighttime are the main pathways forming NO3 (Xue et al., 2014; Wang et al., 2017). Furthermore, liquid-phase-related SOAs were found to increase during severe haze when relatively humidity was high (Xu et al., 2017; Zhao et al., 2019). These results highlight the importance of reducing not only the primary particulate emissions but also the anthropogenic gaseous precursors to suppress secondary aerosol formation on regional scales (Kulmala et al., 2020; Du et al., 2021).
Regional transport and meteorological conditions also play roles in the evolution of haze episodes. Air masses coming from the south of Beijing often bring pollutants to this area and hence favor the rapid buildup of particle masses (Ma et al., 2017; Zheng et al., 2015; Sun et al., 2015). It has been found that 40 % of PM2.5 could originate from regional transport in an annual scale (Ge et al., 2018), and under very unfavorable meteorological conditions, it could contribute even up to 80 % of the total particle mass during a single haze episode (Sun et al., 2016). In addition, haze events occur typically under stagnant conditions (Zheng et al., 2015). Under such circumstances, high aerosol concentrations tend to delay the onset of precipitation (Guo et al., 2016), and thus, the relative humidity (RH) within the boundary layer is often rather high, which further promotes the heterogeneous reactions producing secondary aerosols (Y. Sun et al., 2013). Additionally, results have shown that when RH increased above 60 %, particles were found to be in a liquid state, thereby accelerating secondary formation (Liu et al., 2017).
The air quality in Beijing has improved substantially over the past decade, especially after introducing the “Action Plan for Air Pollution Prevention and Control” in 2013 (Wang et al., 2020b; Lu et al., 2020; W. Li et al., 2020). However, the particulate pollution in Beijing still exceeds the national air quality standards (Xiao et al., 2020). In addition, although the concentration of SO2 decreased significantly, the level of NOx remains still high, which results in NO3 becoming the main contributor of secondary inorganic aerosols (SIAs) (Xie et al., 2020). Furthermore, concurrent with the decreasing PM concentrations, ozone is rapidly becoming a year-round air pollution problem in China (Li et al., 2021).
In addition to long-term actions, Beijing has imposed strict short-term emission reductions during highly visible international events, such as the Beijing Summer Olympics in 2008 (Wang et al., 2010; Shou-bin et al., 2009; Okuda et al., 2011; Schleicher et al., 2012), the Asia-Pacific Economic Cooperation (APEC) summit in 2014 (Chen et al., 2015; Sun et al., 2016) and the Victory Day parade in 2015 (Zhao et al., 2017). More recently, after the start of the COVID-19 outbreak, the Chinese government carried out strong restrictions (COVID lockdown) in order to prevent the spread of the virus. Reduced anthropogenic activities resulted in decreased emissions, yet severe pollution episodes were still observed (Le et al., 2020). In preparation for the Beijing Winter Olympics, the Chinese government authorized necessary actions, successfully improving air quality during this period. Additionally, annual Chinese New Year celebrations are typically associated with reductions in anthropogenic emissions during the 7 d holiday (Tan et al., 2009; Lin and McElroy, 2011).
All these special events mentioned above have different characteristics in regard to emission reductions. During the COVID lockdown, traffic was reduced, but cooking emissions and industrial activities continued at least partially (Shi and Brasseur, 2020). During the Beijing Winter Olympics, heavy industrial activities were regulated to improve the air quality. During the Chinese New Year, a large proportion of Beijing migrant workers and students from other cities leave the city and return to their hometowns. Therefore, anthropogenic emissions from, e.g., traffic, cooking and industry are reduced substantially. Thus, a comparison between COVID lockdown, the Beijing Winter Olympics and Chinese New Year can provide a unique chance to investigate the response of air pollutants to different emission reduction actions.
In this study, we examined the wintertime (1 January to 20 February) air quality in urban Beijing during a 4-year period from 2019 to 2022. We utilized comprehensive observations of air pollutants in both gas phase (including carbon monoxide, sulfur dioxide, nitrogen oxides, ozone, sulfuric acid, and oxygenated organic molecules) and particle phase (including number size distributions of particles and ions and the mass concentrations of PM2.5 and its composition), as well as of meteorological conditions (including temperature, RH, UVB radiation, wind speed and direction, and boundary layer height) from the Aerosol and Haze Laboratory operated by the Beijing University of Chemical Technology (AHL-BUCT; Liu et al., 2020). The objectives of this study are (1) to investigate the 4-year variabilities of different pollutants and to understand their connections with emissions and meteorological conditions and (2) to examine the characteristics of the atmospheric pollution cocktail during different short-term special events (Beijing Winter Olympics, COVID lockdown and Chinese New Year periods) associated with substantial emission reductions. This study provides helpful information on pollution characteristics of urban Beijing both on a long-term scale and for short-term special periods with different emission reductions, which can give guidance for making targeted and sustainable emission control plans.
2.1 Site description
Beijing is located in the northwestern part of the North China Plain. There are two mountains and a sea nearby. The Taihang Mountain is to the west, and the Yanshan is to the northwest of Beijing, and the nearest sea, the Bohai Sea, is ∼150 km to the east. On the south of Beijing, there are several megacities, such as Baoding and Shijiazhuang. Our measurements were conducted in downtown Beijing, the west campus of Beijing University of Chemical Technology (39.95∘ N, 116.31∘ E). The instruments are located on the fifth floor of a teaching building, which is ∼20 m above the ground level. The station can be considered as a representative urban site, and more detailed information can be found elsewhere (Liu et al., 2020; Yan et al., 2021; Guo et al., 2021; Du et al., 2022a).
2.2 Instrumentation
Meteorological variables were measured with a weather station (AWS310, Vaisala Inc.), located on the rooftop of the building. The boundary layer height (BLH) was measured using a ceilometer (CL51, Vaisala). Mixing ratios of trace gases, including carbon monoxide (CO), sulfur dioxide (SO2), nitrogen oxides (NOx) and ozone (O3), were monitored using Thermo Environmental Instruments (models 48i, 43i-TLE, 42i, 49i, respectively).
The concentrations of neutral sulfuric acid (SA) and oxygenated organic molecules (OOMs) were measured by a chemical ionization atmospheric pressure interface long-time-of-flight (CI-APi-TOF; Aerodyne Research, Inc.) mass spectrometers using nitrate (NO) as the reagent ion. Detailed configurations and working parameters of this nitrate chemical ionization mass spectrometer (CIMS) can be found elsewhere (Yan et al., 2022; Guo et al., 2022b). The calibration of SA was implemented by introducing a known amount of gaseous SA produced by the reaction of SO2 and OH radical formed by UV photolysis of water vapor, which is similar to the method in previous literature (Kürten et al., 2012). The calibration factor of sulfuric acid was 6.07–7.47×109 cm−3 (normalized cps) from 2019 to 2022. For the quantification of OOMs, a mass-dependent transmission method was used, and details of this approach are described elsewhere (Heinritzi et al., 2016). The concentration of each molecular OOM species is calculated as follows:
where [OOM] is the concentration of one specific OOM molecule; the numerator on the right-hand side is the sum of detected signal of that OOM, either as a neutral molecule or as a de-protonated ion (OOM-H)−; the denominator is the sum of all measured reagent ions; C is the calibration factor of H2SO4; and TOOM is the relative transmission coefficient.
The mass concentration of PM2.5 was measured with a tapered element oscillating microbalance dichotomous ambient particulate monitor (TEOM 1405-DF; Thermo Fisher Scientific Inc, USA). Black carbon (BC) in PM2.5 was measured using a seven-wavelength aethalometer (AE33; Magee Scientific Crop.) (Drinovec et al., 2015). The non-refractory chemical compositions of fine particles (NR-PM2.5), including organics (Org), sulfate (SO4), nitrate (NO3), ammonium (NH4), and chloride (Chl), were measured using an online time-of-flight aerosol chemical speciation monitor (ToF-ACSM; Aerodyne Research Inc. U.S.) equipped with a PM2.5 aerodynamic lens and a standard vaporizer (Jayne et al., 2000; Drewnick et al., 2005; Cai et al., 2020).
Concerning particle number size distributions, particles in the size range of 1 nm–10 µm were measured using a diethylene glycol scanning mobility particle spectrometer (DEG-SMPS; 1–7.5 nm) (Jiang et al., 2011) and a particle size distribution system (PSD; 3 nm-10 µm) (J. Liu et al., 2016; Yan et al., 2021; Deng et al., 2020). Based on this particle distribution information, the condensation sink (CS) (Kulmala et al., 2005) of sulfuric acid was then calculated according to the method proposed by Kulmala et al. (2012). Additionally, a neutral cluster and air ion spectrometer (NAIS; model 4-11, Airel, Estonia) was used to detect ions in the size range of 0.7–42 nm (mobility diameter) and particles in the size range of 2.5–42 nm (mobility diameter) (Mirme and Mirme, 2013; Manninen et al., 2016; Zhou et al., 2020).
2.3 Calculation of averaged oxygen and nitrogen numbers of total OOMs
The fraction-weighted oxygen and nitrogen numbers of OOMs are calculated based on the following equations:
where n is the number of OOM molecules, i is one specific OOM molecule, nOi (nNi) is the number of oxygen (nitrogen) in OOMi, fractioni is the number fraction that OOMi takes and t is one certain moment. Then, nO and nN could reflect the averaged oxygen and nitrogen number of total OOMs at each moment. Here, we use nO to generally reflect the oxidation state of total OOMs, and the higher the nO, the more oxidized the total OOMs.
2.4 Division of different periods
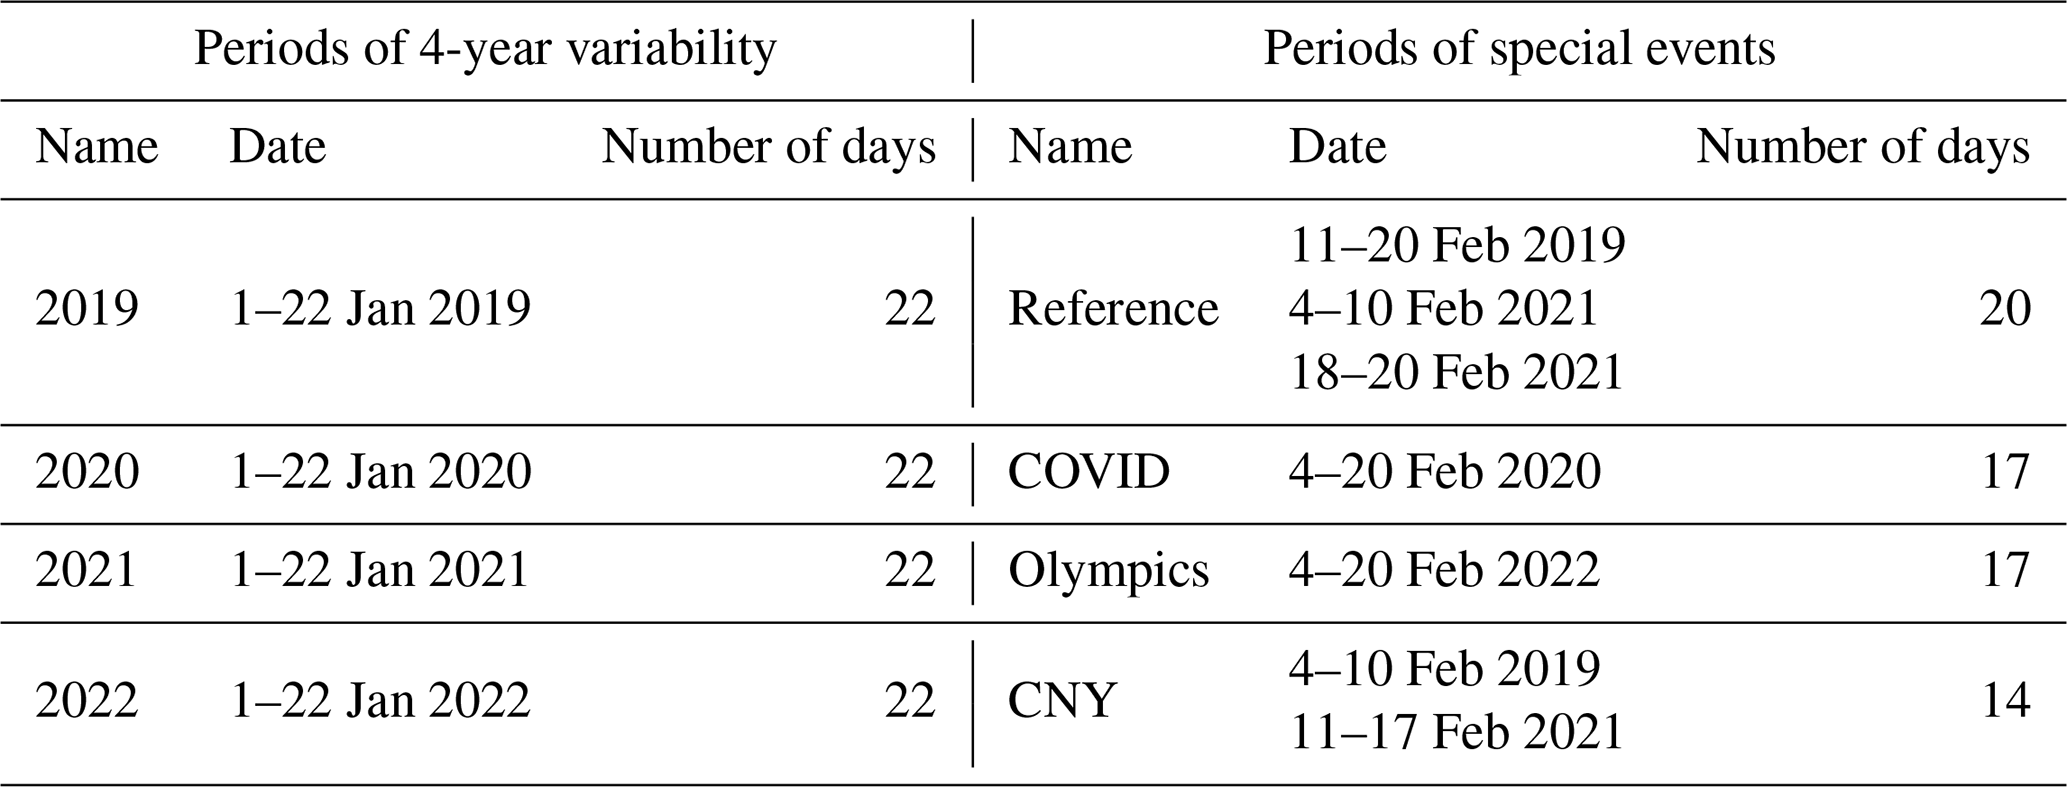
In this study, we focus on the 4-year variability of air quality in winter in Beijing (abbreviated as 4-year variability in the following text), as well as the influence of special events, including the Beijing Winter Olympics (Olympics), COVID lockdown (COVID) and Chinese New Year (CNY) during the 4 years from 2019 to 2022. Thus, the whole winter period from 1 January to 20 February was divided into two separate ones (Fig. S1 and Table 1):
-
Periods of 4-year variability. When the 4-year variability is investigated, there should be no disturbance from any of the special events, and the chosen days should be from the same periods of different years. Therefore, the period of 4-year variability covered days from 1 to 22 January of each year, lasting for 22 d.
-
Periods of special events. To ensure comparable durations for special events, days ranging from 4 to 20 February were chosen as the special event periods. The days within this date range in 2020 and 2022 are referred to as COVID and Olympics periods, respectively. Since CNY holidays in 2022 interfered with the Olympics, only CNY holidays in 2019 and 2021 were used and combined together as the CNY period. Finally, for a better understanding of the special event effect, a reference period including the non-event days in 2019 and 2021 was chosen as the “base” period.
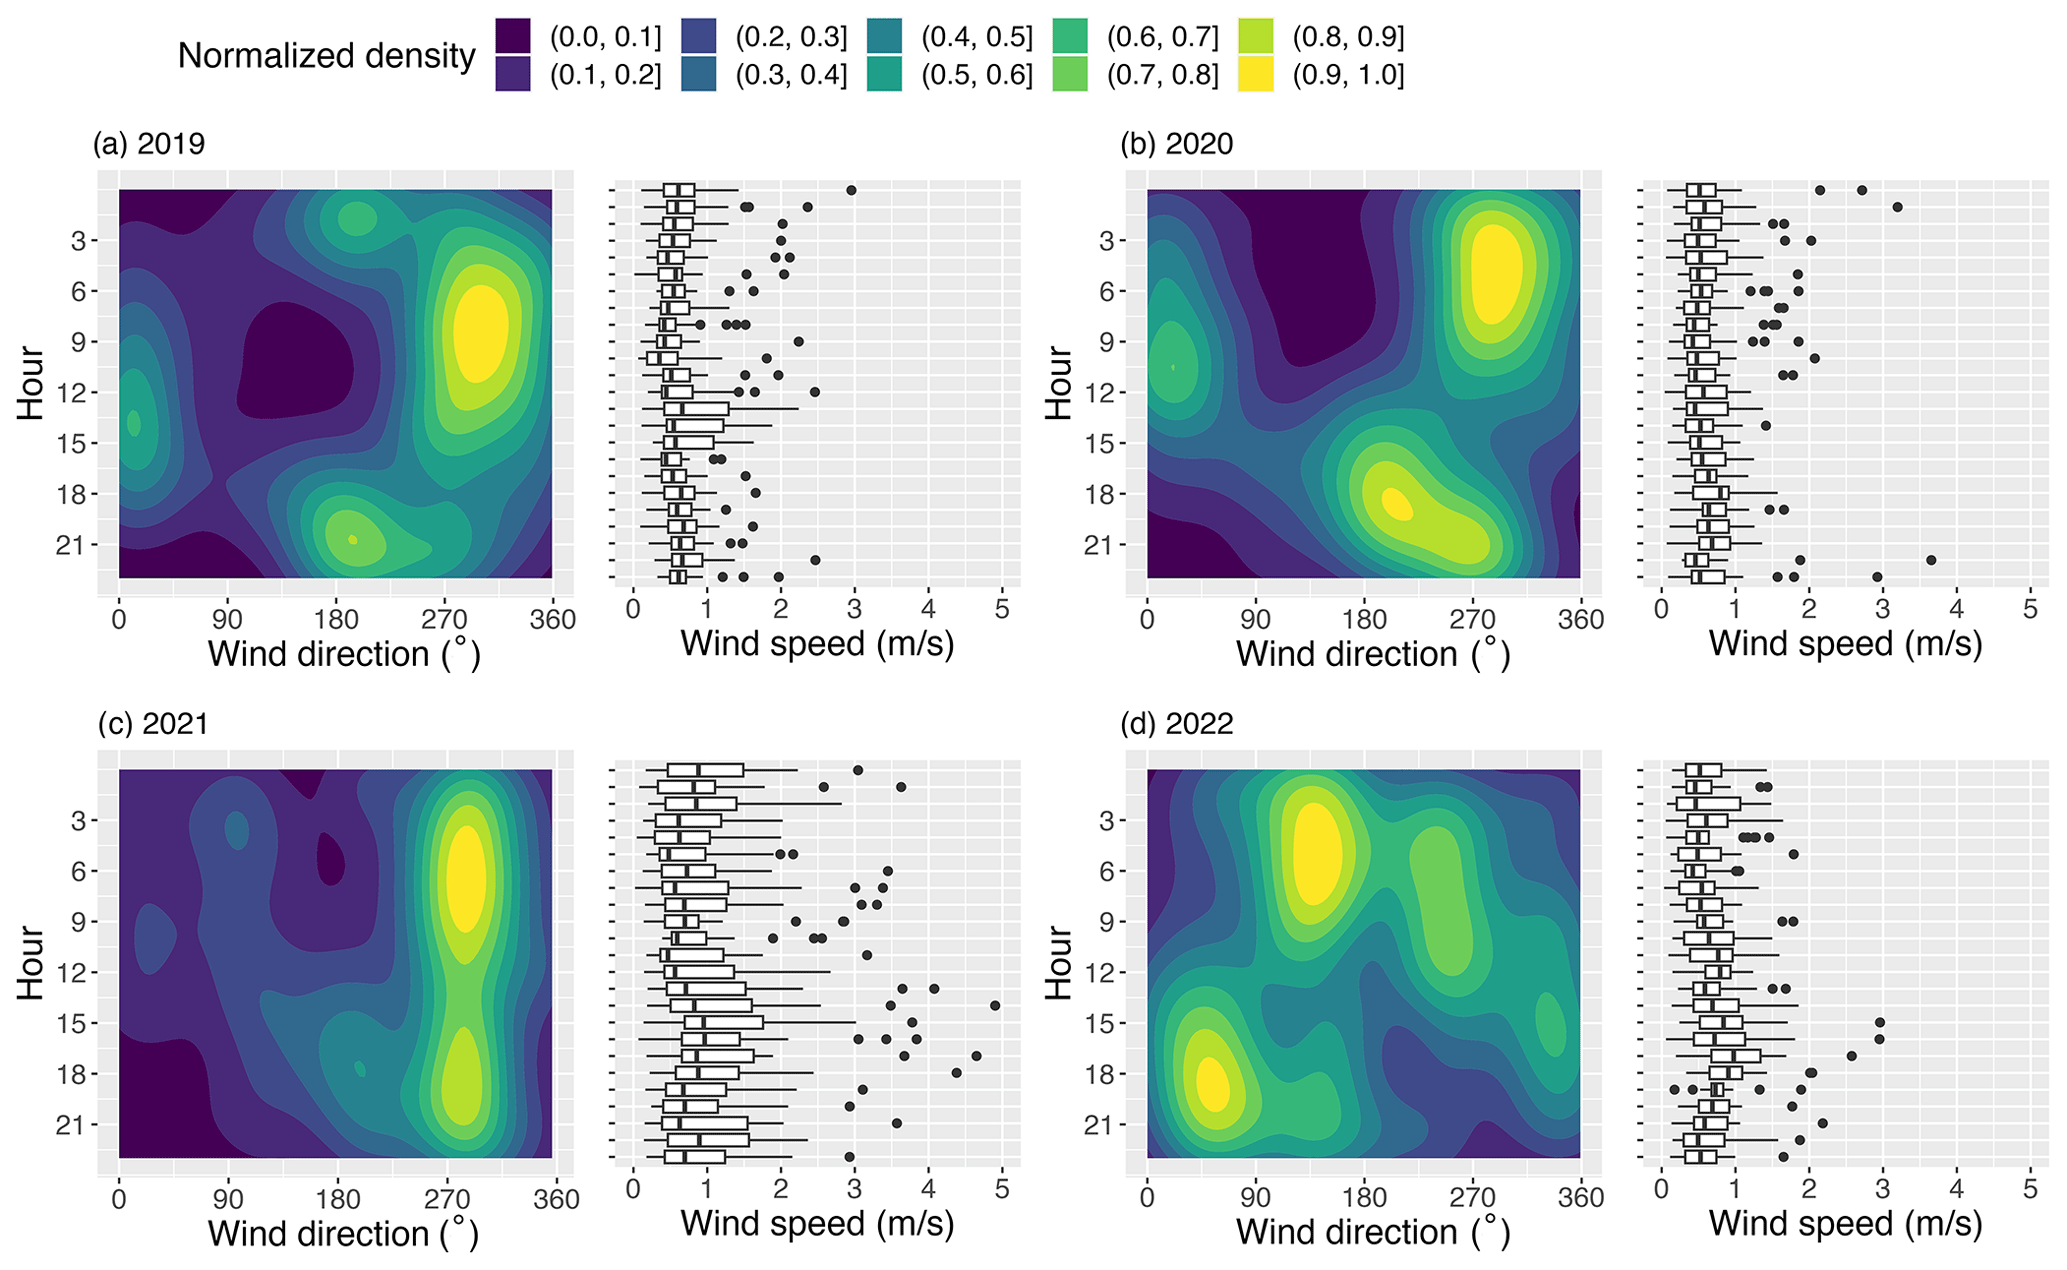
Figure 1Diurnal variations of wind direction and wind speed for different years (1 to 22 January). The wind direction and wind speed are depicted in wind contour plots and box plots respectively.
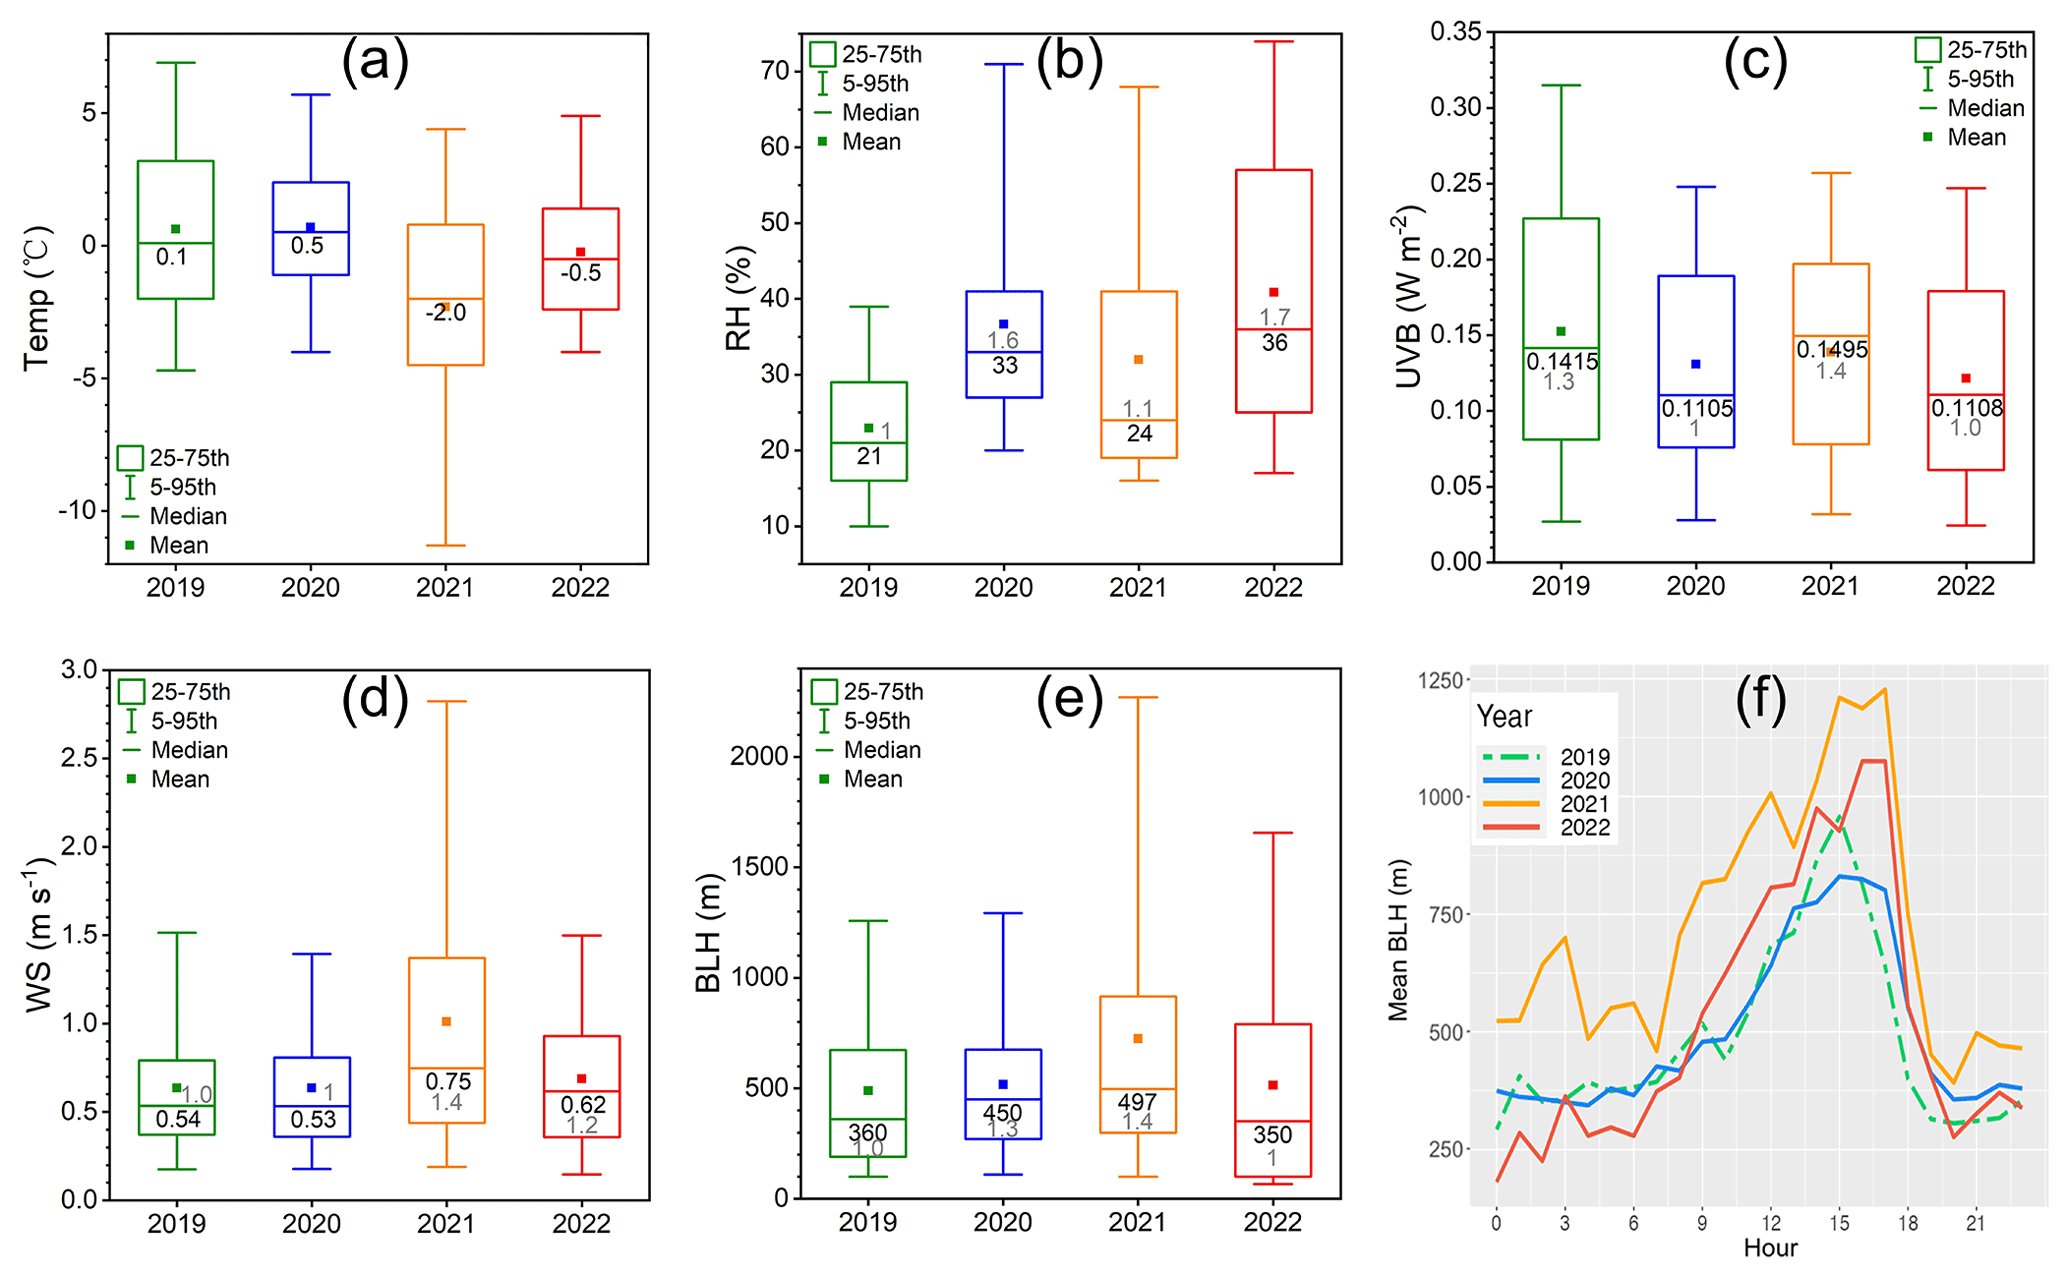
Figure 2(a) Temperature (Temp), (b) relatively humidity (RH), (c) UVB, (d) wind speed (WS) and (e) boundary layer height (BLH) for different years (1 to 22 January). (f) Averaged diurnal variations of boundary layer height (BLH) for different years (1 to 22 January). The black value inside each box is the median value of corresponding parameter. The gray values are the normalized median values to the lowest median value in each subplot, which is used for quantitative variation comparison between different parameters. Please note that for UVB, only the daytime (08:00–16:00 UTC+8) dataset was used.
3.1 The 4-year variability of air quality
3.1.1 Meteorological conditions
Meteorological conditions are strongly interlinked with air quality. Therefore, we first focus on the 4-year changes of meteorological parameters. The periods covered the days from 1 to 22 January of each year. As shown in Fig. 1, the local wind distributions in 2019 and 2020 were quite similar, following the typical diurnal wind pattern in Beijing induced by the mountain–valley breeze. From midnight to noon, the wind mainly blew from the northwest, and the wind speed (WS) was quite low (median ∼0.5 m s−1). From afternoon, however, the wind direction turned to a southerly wind. In 2021, the wind was mostly from the west and northwest without a clear diurnal variation. In 2022, the wind blew mostly from the southeast from midnight to noon but came from the northeast from the afternoon to midnight. Usually, the air masses coming from the south or east possess higher temperatures and bring more water vapor as well as pollutants, whereas air masses coming from the north or west are typically colder with a lower RH and lower pollutant concentrations (Wang et al., 2013; Zhong et al., 2018). The year of 2021 witnessed the lowest median temperature (−2.0 ∘C, Fig. 2a) and lower RH (24 %, Fig. 2b) compared with the other 3 years, which might be partly due to the wind coming mainly from the west and northwest throughout the day. Meanwhile, the overall wind speed in 2021 was also the highest (median 0.75 m s−1, Figs. 1 and 2d). As the typical diurnal pattern of wind direction in Beijing is induced by the mountain–valley breeze, which usually only occurs during rather stagnant synoptic conditions, the lack of diurnal pattern of wind direction and the higher wind speeds in 2021 suggest that the synoptic meteorological conditions might have been stronger during this period in 2021 than in the other years. Similarly, BLH in 2021 was also the highest throughout the day (Fig. 2e and f). During the other 3 years, the overall values of the temperature, wind speed and BLH were comparable to each other, whereas the RH was higher in 2020 and 2022, which could partly be attributed to more southern and eastern winds in these 2 years. In addition, differences in cloud conditions could have a minor effect on UVB together with varying pollution conditions. Higher values of RH may facilitate the hygroscopic growth of aerosol particles (Hodas et al., 2014; Cheng et al., 2016) and change the particle phase state, thereby likely promoting secondary aerosol formation via heterogeneous reactions (Hung et al., 2016; Chao et al., 2020; Shiraiwa et al., 2017; Sun et al., 2018). Furthermore, precipitation can increase the wet deposition of almost all gaseous and particulate species, influencing their concentrations in the atmosphere. However, since there was no reliable measurement of precipitation at our site, detailed conclusions on this matter cannot be drawn. It should be mentioned that the intensity of snow precipitation in winter in Beijing is generally small, except during special case(s), so the overall effects of precipitation in winter in Beijing are not as large as those in summer in Beijing or in other humid areas.
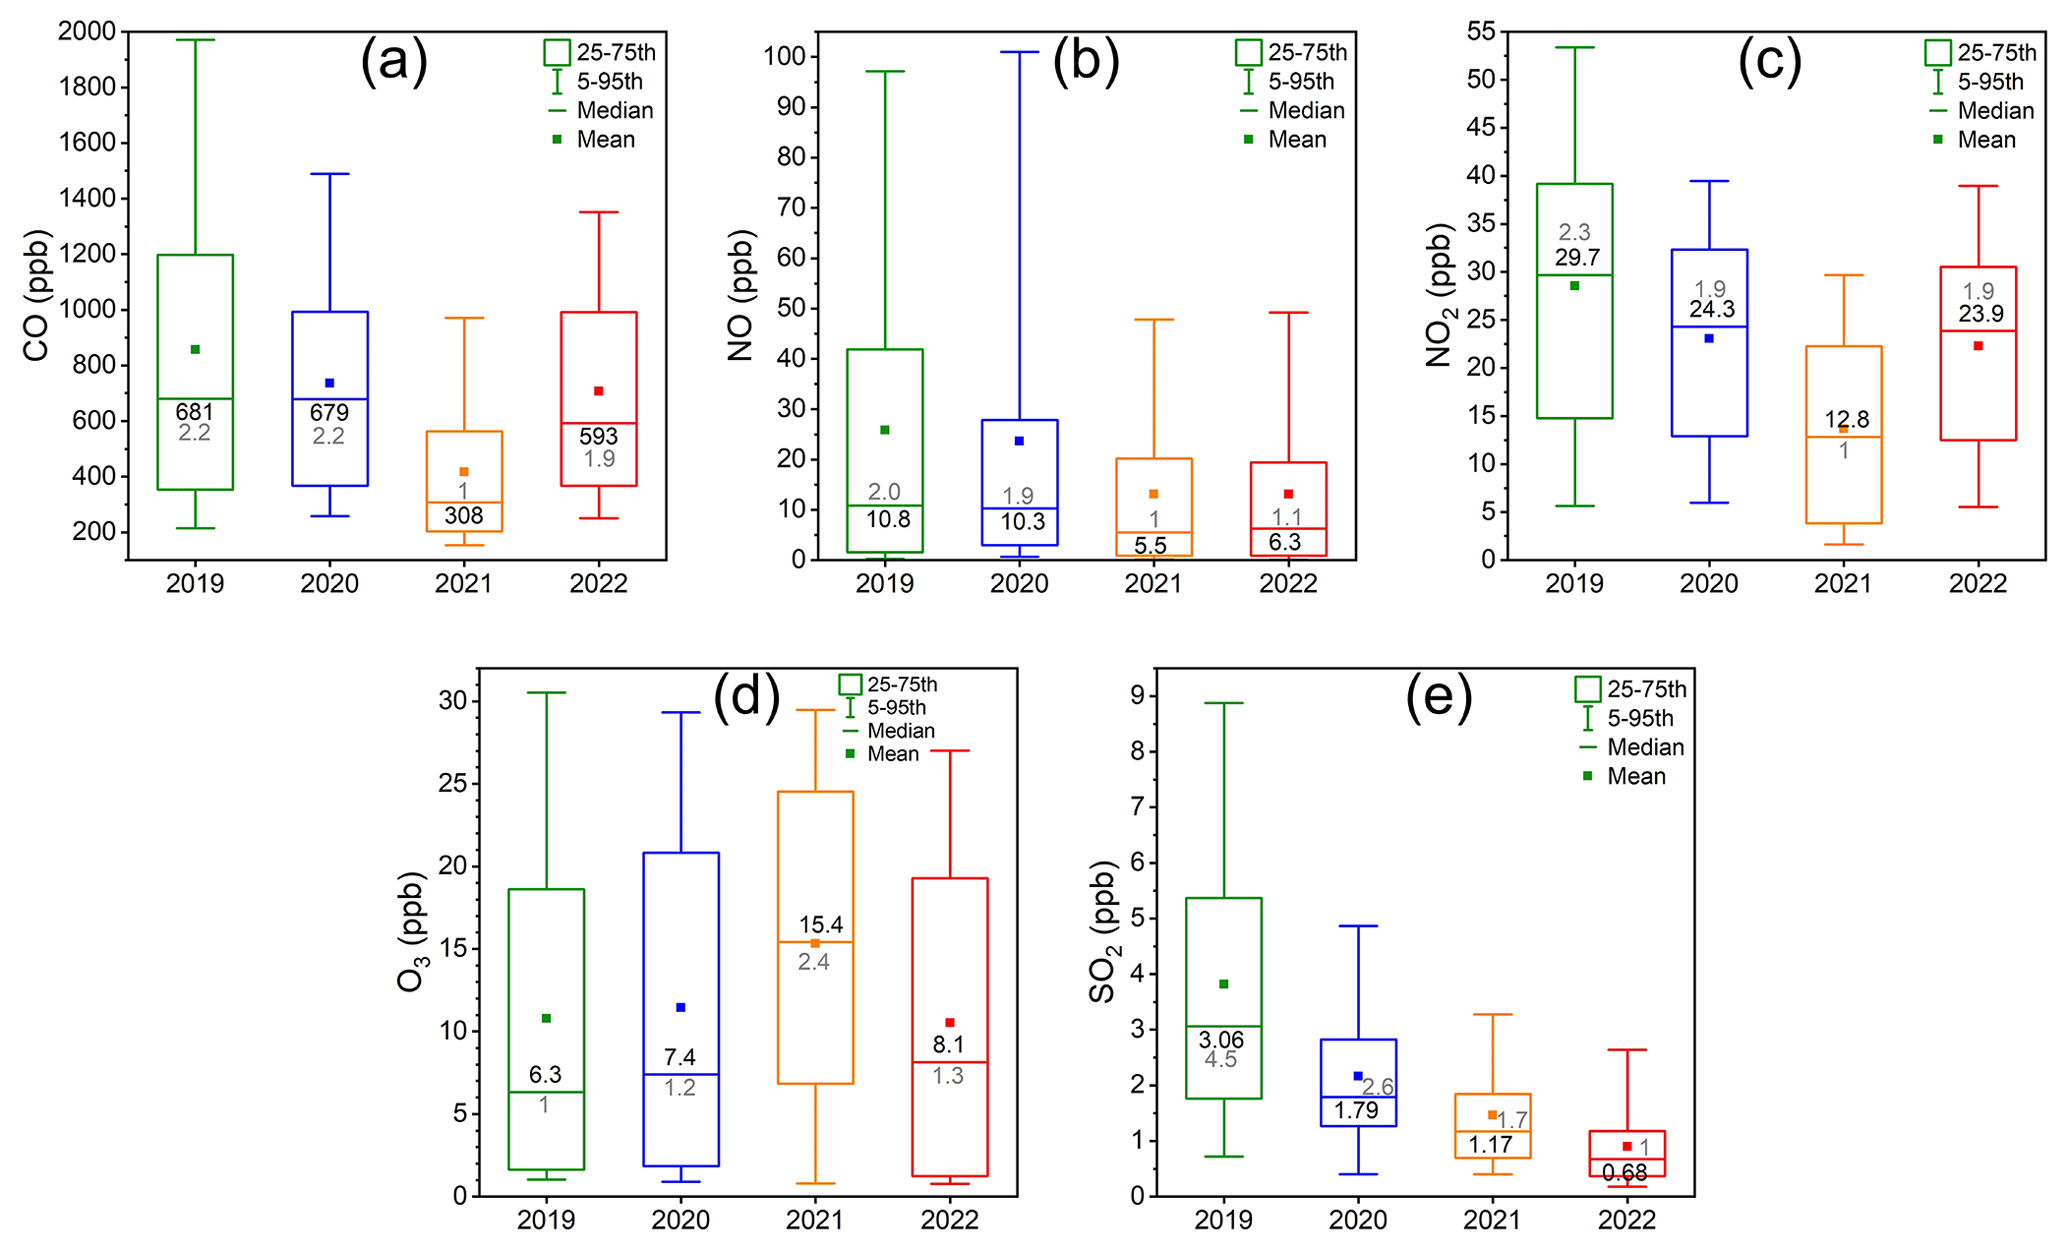
Figure 3Mixing ratios of (a) CO, (b) NO, (c) NO2, (d) O3 and (e) SO2 for different years (1 to 22 January). The black value inside each box is the median value of corresponding parameter. The gray values are the normalized median values to the lowest median value in each subplot, which is used for quantitative variation comparison between different parameters.
3.1.2 Trace gases
The 4-year variations of CO and NO2 were generally opposite to the variation of BLH, which decreased from 2019 to 2021 and rebounded in 2022, resulting in the lowest concentrations in 2021 (Fig. 3a and c; median values are 308 and 12.8 ppb for CO and NO2, respectively). Although the relative changes of them were larger than BLH, the variations of them should be partially attributed to the change in BLH or the change in atmospheric diffusion capacity. Further, the winds in 2021 came less frequently from polluted sectors, which might also play a role. For NO, it decreased from 2019 (median 10.8 ppb) to 2021 (median 5.5 ppb) and was around the same level in 2021 and 2022 (Fig. 3b). NO is mainly a primary emission, and in urban Beijing, it mainly comes from vehicle emissions. Although the BLH was lower and the wind was more polluted in 2022 than in 2021, NO levels between these 2 years are nearly the same, suggesting that traffic emissions might have reduced in 2022. Despite the influence of different wind direction and speed, SO2 concentration monotonically decreased from 2019 (median 3.06 ppb) to 2022 (median 0.68 ppb). In addition, this trend is quite different from that of BLH, indicating that the drop of SO2 is not caused by the variations of meteorology conditions but by the decline in SO2 emissions. Our result is in line with the long-term variation of SO2 in China, where SO2 decreased from 24.8 ppb in 2013 to 8.0 ppb in 2017 for the Beijing–Tianjin–Hebei area after the clean air action in 2013 (Y. Wang et al., 2020b). The 4-year variation of O3 was generally opposite to CO and NO2, and its concentration was the highest in 2021 (15.4 ppb, Fig. 3d). This highest O3 could be partly associated with the weakened titration effect of NO. Meanwhile, the level of O3 decreased with the increase of PM2.5 (Fig. S6), suggesting that O3 formation might be suppressed during haze episodes within the studied period.
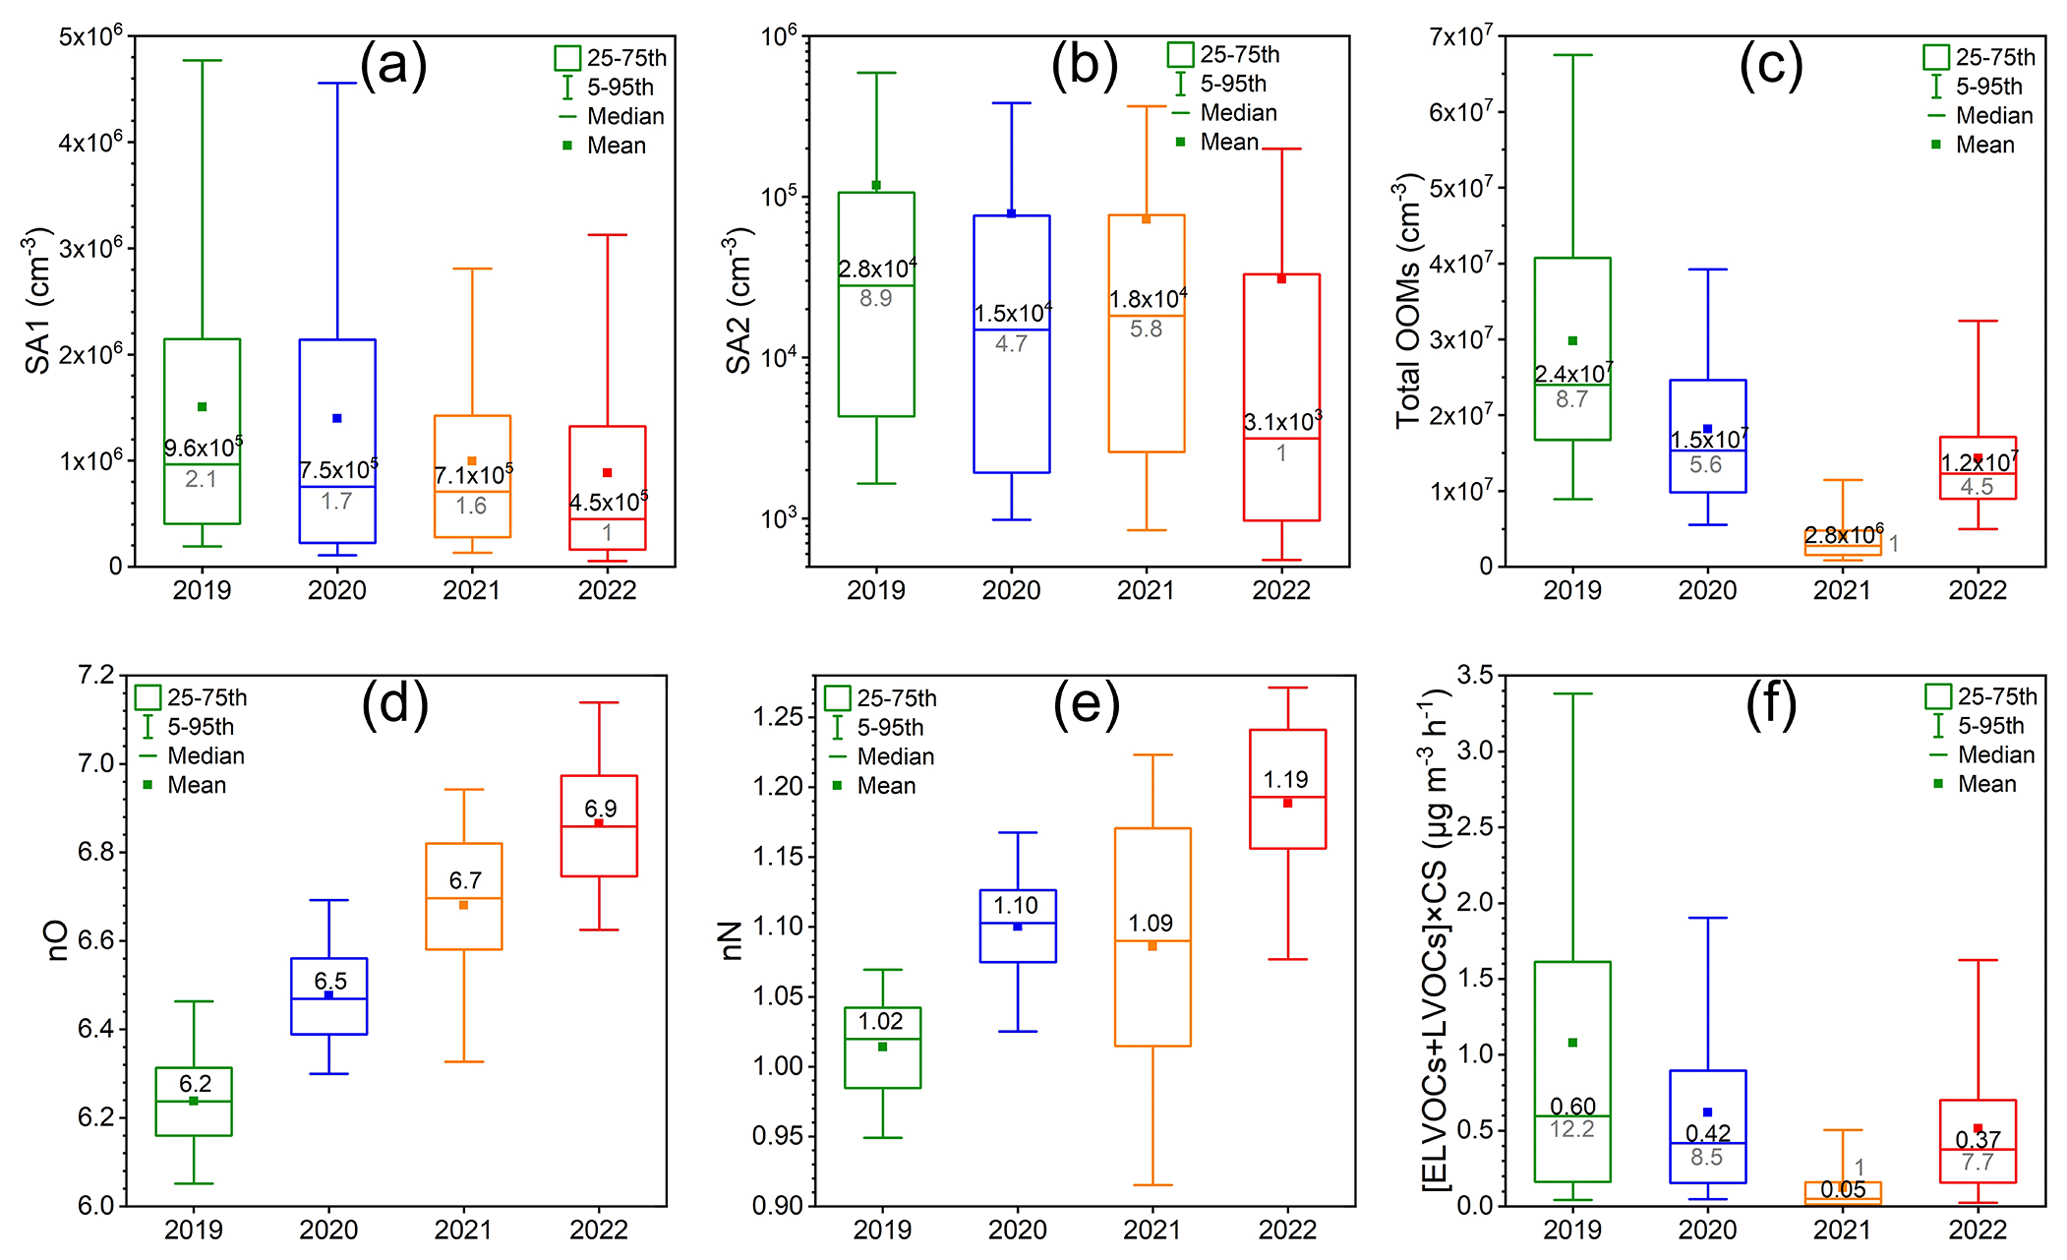
Figure 4(a) Concentration of sulfuric acid monomer (SA1), (b) concentration of sulfuric acid dimer (SA2), (c) concentration of total OOMs, (d) fraction-weighted oxygen number of OOMs (nO), (e) fraction-weighted nitrogen number of OOMs (nN) and (f) [ELVOCs + LVOCs] × CS for different years (1 to 22 January). The black value inside each box is the median value of corresponding parameter. The gray values are the normalized median values to the lowest median value in each subplot, which is used for quantitative variation comparison between different parameters.
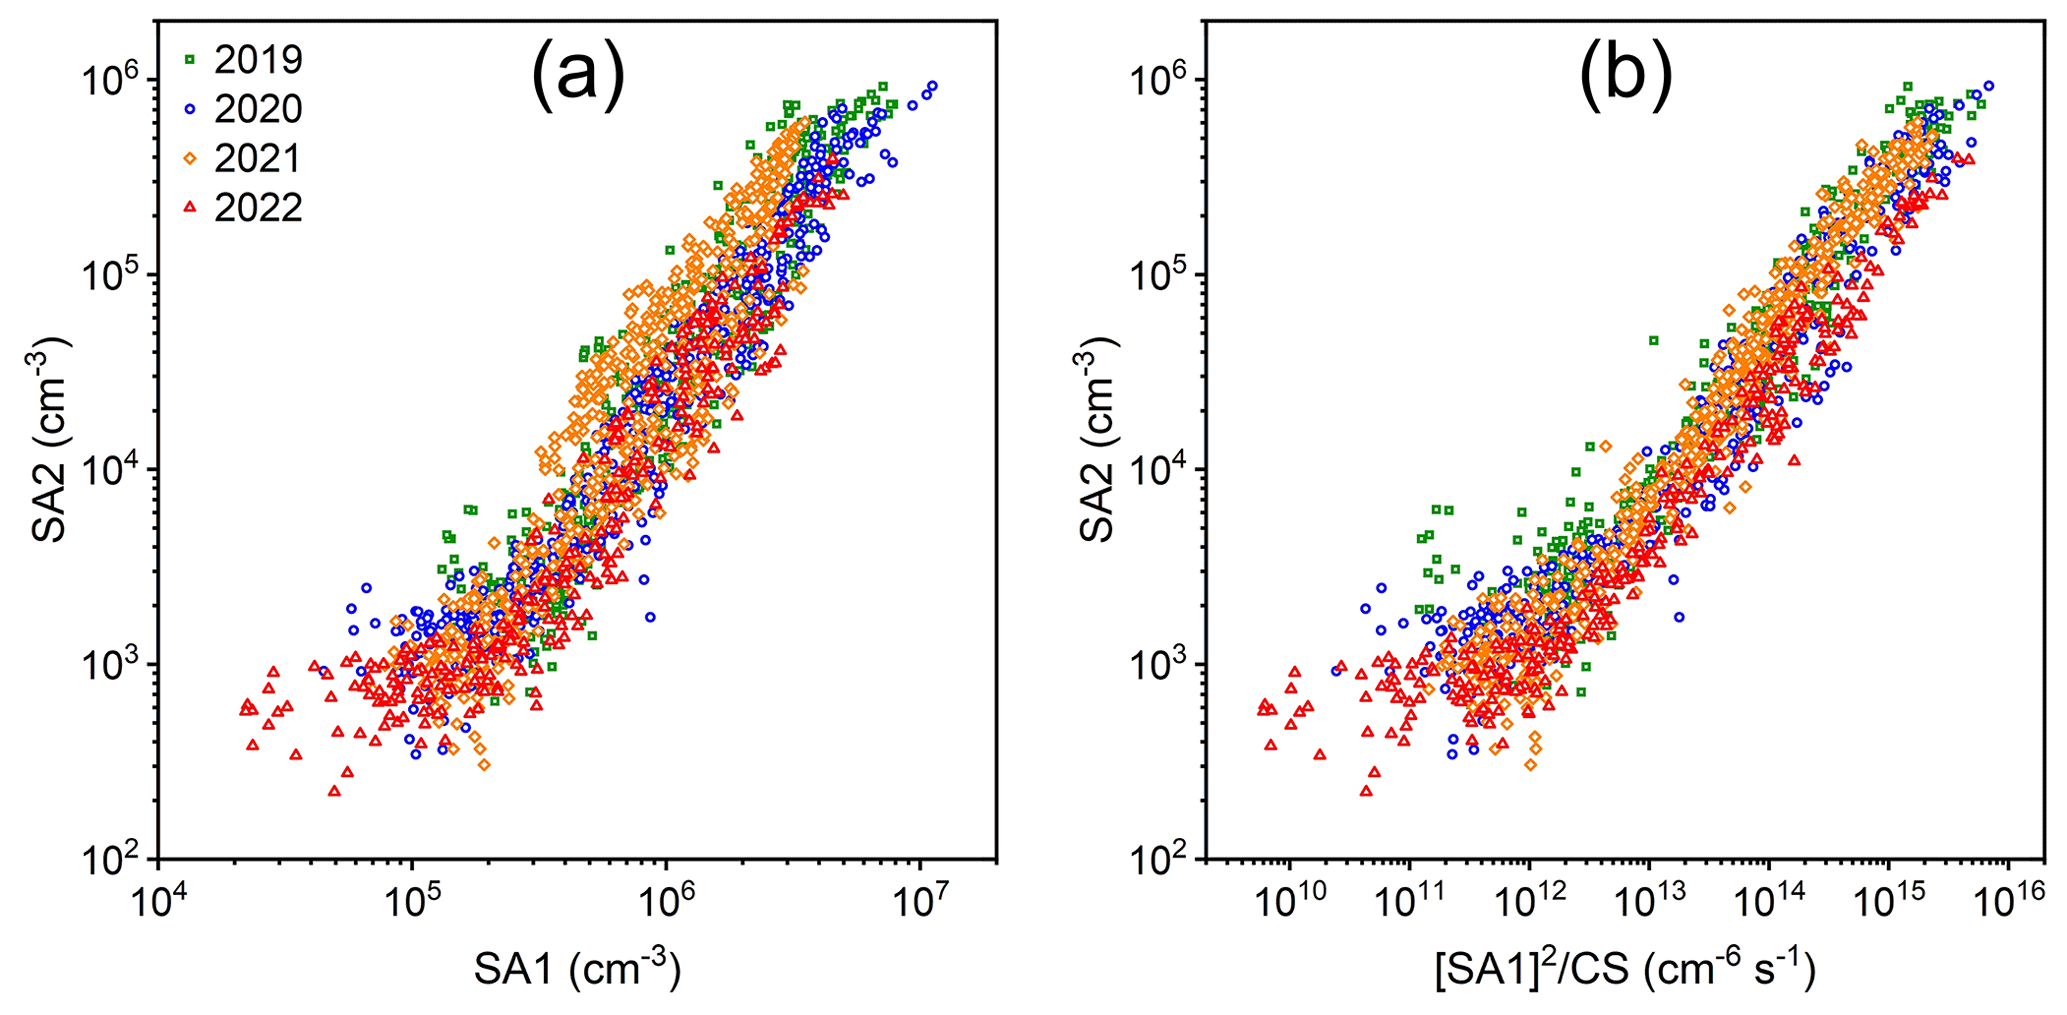
Figure 5Sulfuric acid dimer (SA2) vs. (a) sulfuric acid monomer (SA1) and (b) [SA1]2 CS from 2019 to 2022 (1 to 22 January).
3.1.3 Condensable vapors
SA is a key contributor to the formation and initial growth of aerosol particles (Sipilä et al., 2010; Paasonen et al., 2010; Kirkby et al., 2011; Yao et al., 2018; Yan et al., 2021), and OOMs are the main drivers of the particle growth and formation of secondary organic aerosol (SOA) (Ehn et al., 2014; Nie et al., 2022). Therefore, for further investigation of number size distributions and mass concentrations of particles, the 4-year changes of SA and OOMs were first analyzed. As shown in Fig. 4, the concentrations of sulfuric acid monomer (SA1; 4.5–9.6×105 cm−3, Fig. 4a) and dimer (SA2; 3.1×10³–2.8×104 cm−3, Fig. 4b) generally decreased from 2019 to 2022. This decreasing trend is similar to that of SO2, and therefore, the decline of SA1 and SA2 was probably mainly caused by the drop of the precursor SO2. Additionally, SA2 in 2021 was higher than 2020 and 2022. Figure 5 shows that although the data points in 2021 stand out in the SA2 vs. SA1 plot, they lie together with the data points of the other 3 years in the SA2 vs. [SA1]2 CS plot. Thus, the elevated SA2 in 2021 was likely caused by the low-level CS (Fig. S4).
The 4-year variation of the total OOM concentration was generally opposite to that of the BLH. Specifically, the median OOM concentration in 2019 (2.4×107 cm−3) was ∼8.6 times that in 2021 (2.8×106 cm−3) (Fig. 4c), while median and peak BLH values in 2019 (360 and ∼940 m for median and peak respectively) were only ∼0.7–0.8 times those in 2021 (497 and ∼1200 m for median and peak respectively) (Fig. 2e and f). Thus, the reasons behind this drastic yearly change of the OOM concentration cannot be solely attributed to changes in the BLH. Under polluted conditions, regional transportation of lower-volatility OOMs could result in higher concentration of OOMs (Guo et al., 2022b). In addition, accumulation of precursor VOCs, and possibly an enhancement of heterogeneous reactions (Riedel et al., 2015), may promote the chemical formation of OOMs. However, due to the lack of VOC measurements and inadequate understanding of heterogeneous reactions, it is hard to conclude which one is the determining factor for the observed OOM concentration changes. Additionally, the total OOM concentrations at same PM2.5 levels generally decreased from 2019 to 2022 (Fig. S7), which implies that the OOM concentrations have reduced in recent years. In terms of the OOM composition, Fig. 4d and e show that both oxygen and nitrogen contents of OOMs increased year by year. None of the meteorology parameters showed such a behavior, so changes in the chemical pathways are likely the main cause. The increase in the oxygen content indicates an enhancement of the overall oxidation state of OOMs, and the increase in the nitrogen content is related to an enhancement of the NOx involvement in OOM formation. Although there are no direct VOC measurements, studies have shown that the VOC levels are continuously decreasing in the region (Yao et al., 2022). Therefore, by assuming that the level of oxidants stays the same, the oxidant-to-VOC ratio increases, thus likely leading to more oxidation of each VOC molecule. In addition, long-term observations have shown that the concentration decrease of NOx is slower than that of VOCs (Yao et al., 2022; W. Li et al., 2020). As a result, the NOx : VOC ratio should have increased with time, which may partially explain the increased OOM nitrogen content. Furthermore, the oxygen content decreases as PM2.5 increases. This is not surprising, as OOMs with lower oxygen contents possess higher volatilities and thus are more easily to be re-evaporated back to the atmosphere and transported along with PM2.5. The nitrogen content first increases with an increasing PM2.5 level and then decreases when PM2.5 exceeds 150 µg cm−3. Higher PM 2.5 levels seem to be associated with higher NOx concentrations (Fig. S6), which promotes the formation of organonitrates, leading to a higher nitrogen content. But the reason why the nitrogen content decreases under serve haze remains a puzzle, deserving further studies. In order to evaluate the OOM contribution to SOA formation through condensation, the parameter [ELVOCs + LVOCs] × CS was used as a simple surrogate for OOM condensation flux (Fig. 4f), where ELVOCs and LVOCs stand for extremely low-volatility organic compounds and low-volatility organic compounds respectively. [ELVOCs + LVOCs] × CS was the highest in 2019 and the lowest in 2021, with 2020 and 2022 lying between and being comparable. This suggests that the SOA formation potential of OOMs was highest in 2019 and lowest in 2021, which is consistent with the organic aerosol concentration in Fig. 10.
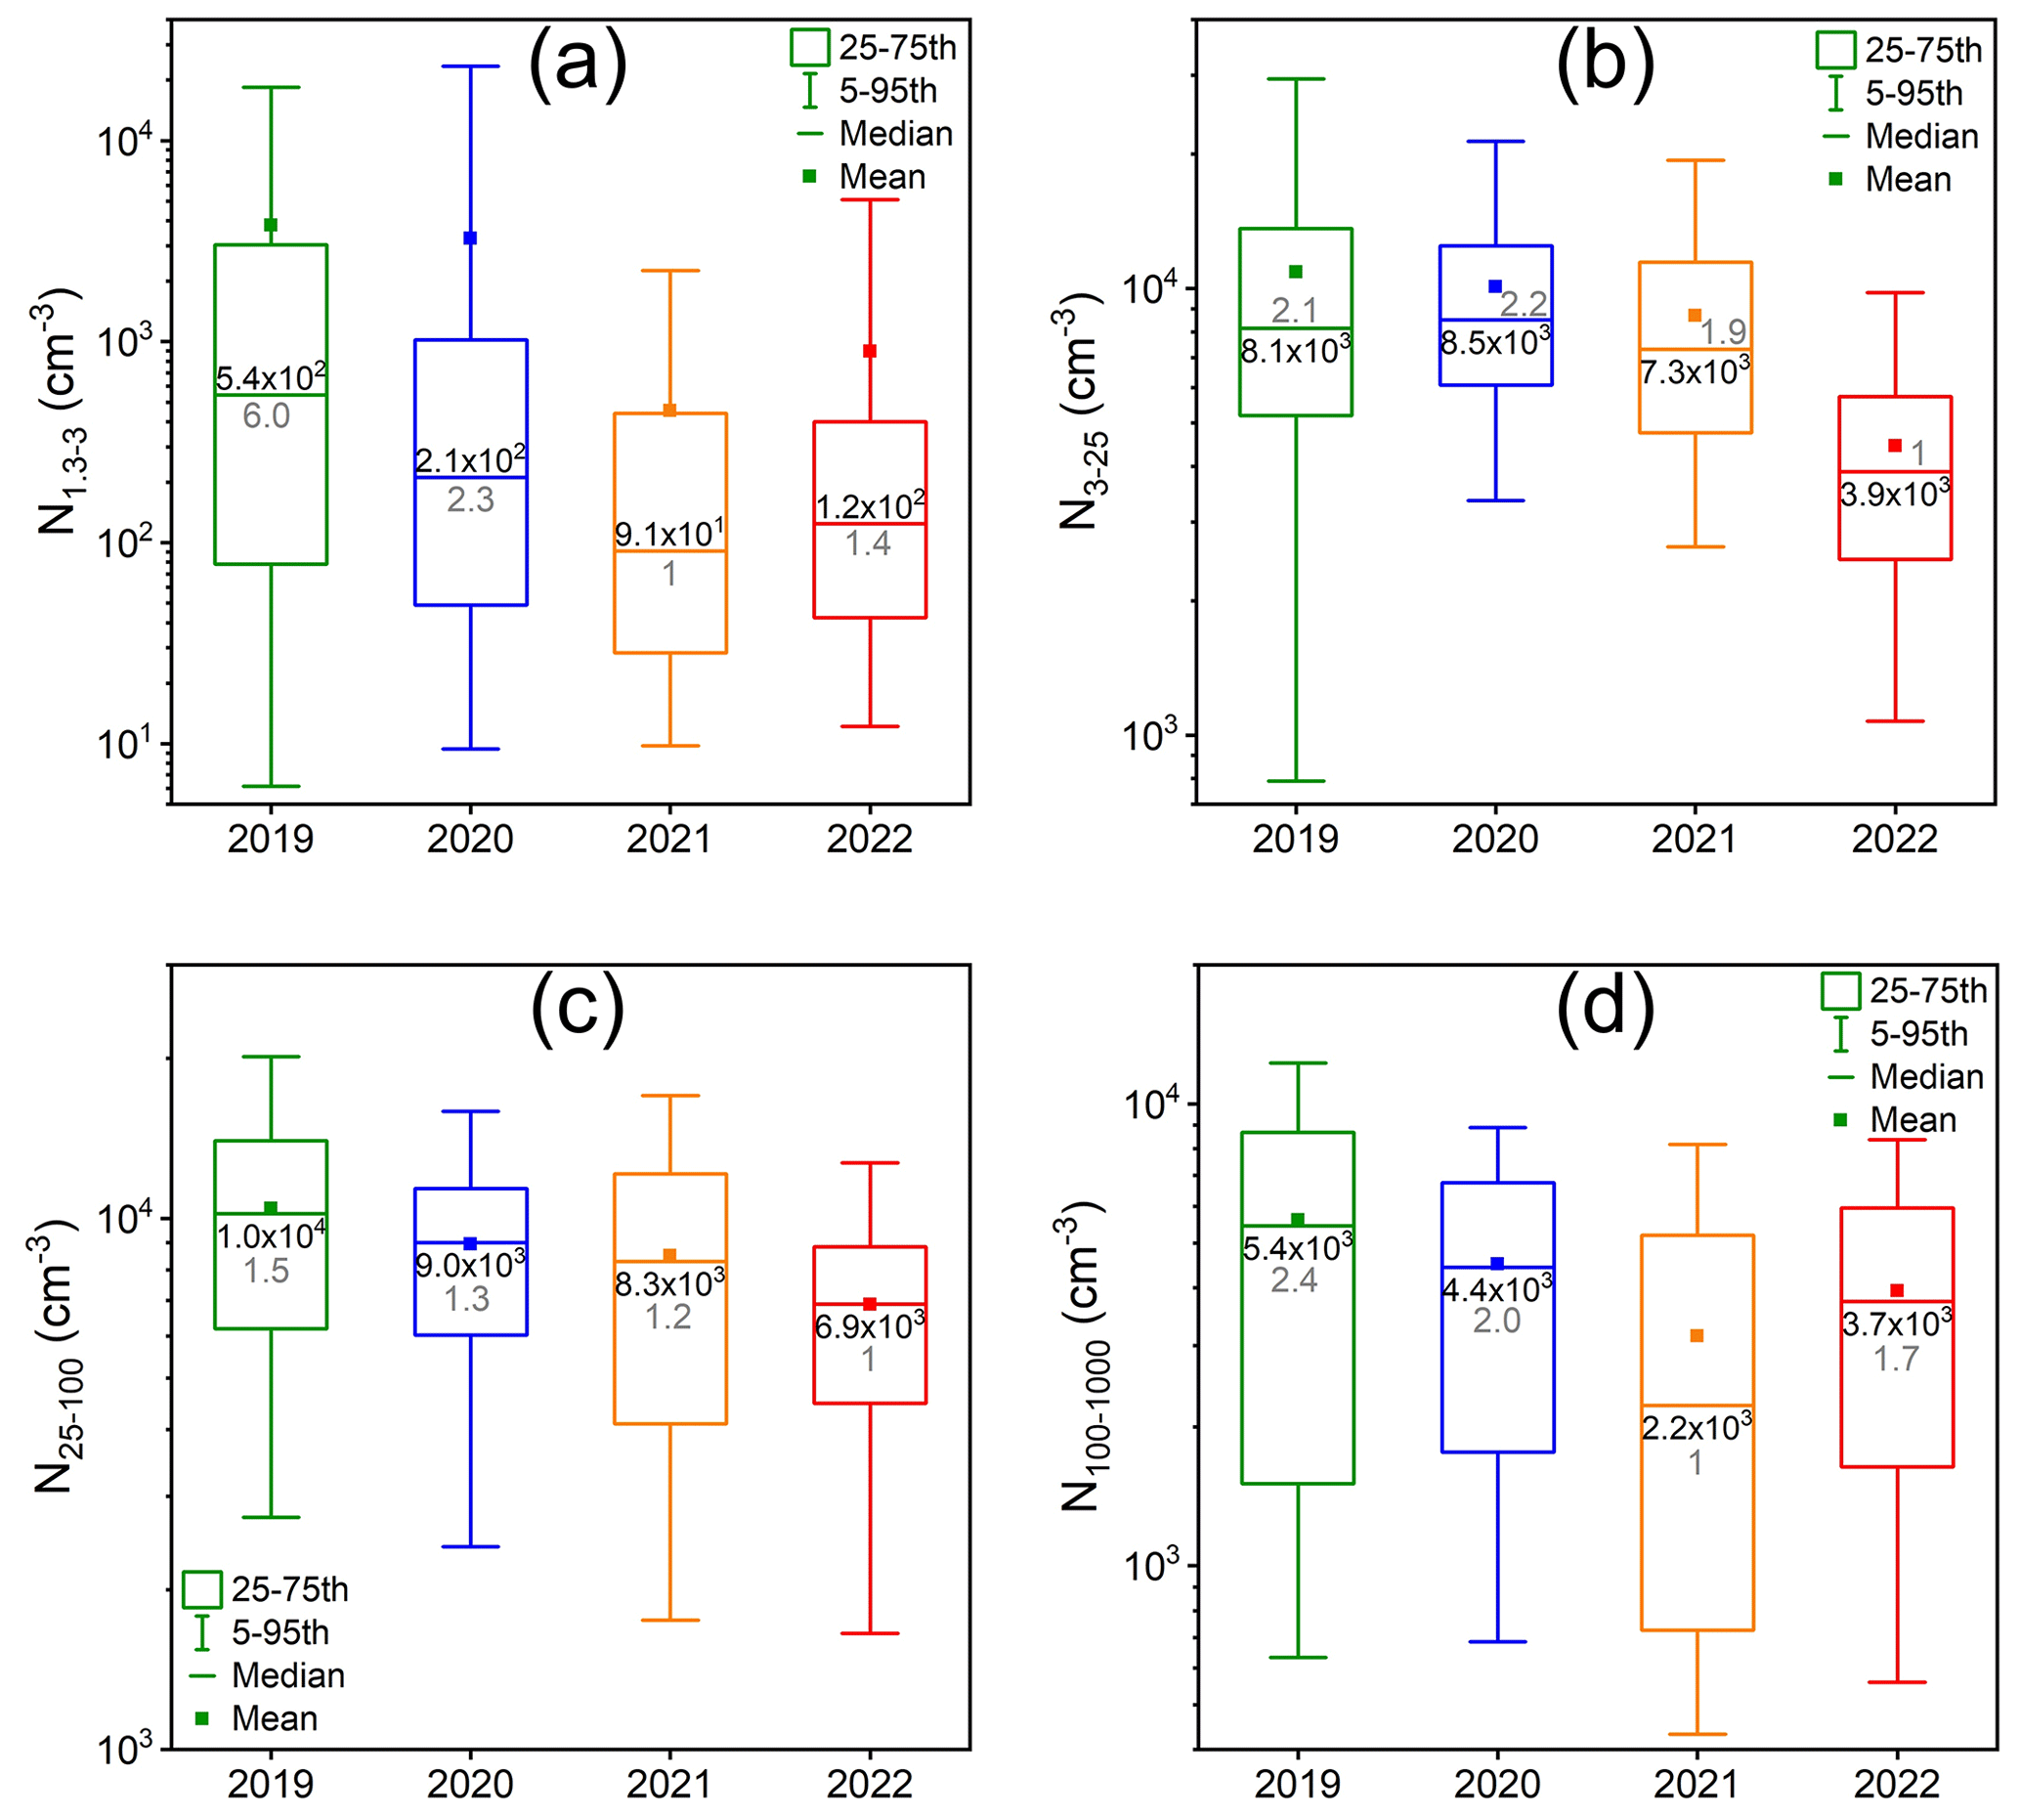
Figure 6Number concentration of (a) sub-3 nm particles (N1.3−3), (b) 3–25 nm particles (N3−25), (c) 25–100 nm particles (N25−100) and (d) 100–1000 nm particles (N100−1000) for different years (1 to 22 January). The black value inside each box is the median value of corresponding parameter. The gray values are the normalized median values to the lowest median value in each subplot, which is used for quantitative variation comparison between different parameters.
3.1.4 Particles and ions
Figure 6 shows the 4-year changes of number concentrations of particles in different size ranges. The number concentration of sub-3 nm particles (N1.3−3) decreased from 2019 to 2021 but increased slightly from 2021 to 2022. The influencing factors behind this variability are discussed in the following text. Number concentrations in the nucleation mode (3–25 nm, N3−25) and Aitken mode (25–100 nm, N25−100), generally decreased from 2019 to 2022. In particular, N3−25 was significantly lower in 2022 than in the other years, which could be attributed to fewer nucleated particles growing into larger sizes when new particle formation (NPF) events occurred in 2022 (as shown in Fig. S2). In contrast, the OOM concentration was higher in 2022 than in 2021 (Fig. 4c), so reasons for the less efficient growth of the nucleation-mode particles in 2022 should be explored further. The accumulation-mode particle number concentration (N100−1000) was significantly lower in 2021 than in other years, suggesting a suppressed growth of particles from the Aitken mode to larger sizes in measured air masses. This is consistent with the fact that the wind was mainly from the northwest in 2021, bringing clean air with low gaseous precursor concentrations. Thus, the overall low N100−1000 in 2021 could also be associated with the more frequent clean air episodes, with PM2.5≤35 µg cm−3 in 2021 (67 %, Fig. S3a).
The 4-year variation of N1.3−3 was contributed by several factors associated with both sources and sinks of these particles. In urban Beijing, as reported in previous studies (Cai et al., 2021; Deng et al., 2021, 2020; Du et al., 2022a), the formation and growth of new particles are influenced by the SA concentration, background aerosol population, amine concentration and ambient temperature, among other things. The SA concentration decreased from 2019 to 2022, and the PM2.5 mass concentration, which is strongly associated with the coagulation caused by background aerosols, was the lowest in 2021 (Fig. 9). Also, as shown in Fig. 2, the ambient temperature was the lowest in 2021, causing favorable conditions for the formation of new particles because small clusters evaporate less efficiently when temperatures are lower. However, with such favorable conditions, the N1.3−3 was still the lowest in 2021. The intensities of NPF events were lower in 2021 than 2022, while the NPF event frequency was higher in 2021. A possible reason for this observation is amines, the concentrations of which could have been reduced in 2021 due to limited traffic emissions (indicated by NOx). However, the influence of this factor is uncertain without simultaneous measurements. The opposite 4-year change of BLH can also partly explain that of N1.3−3.
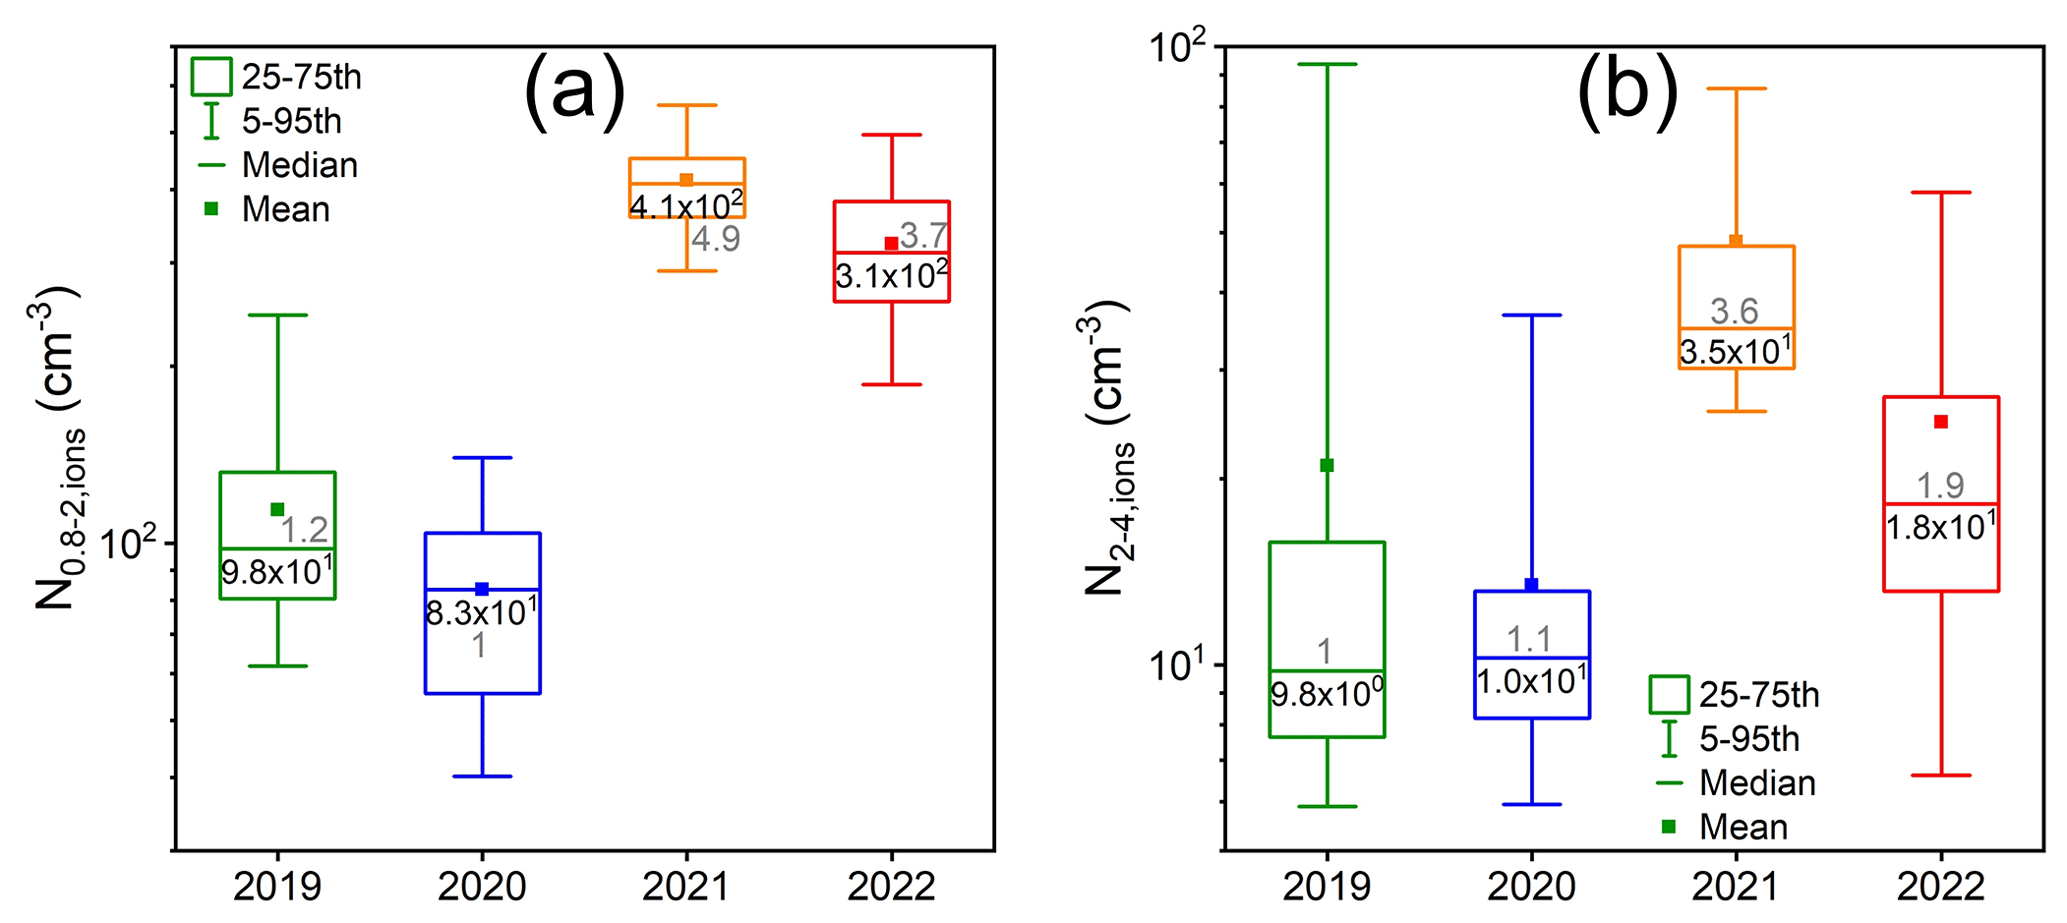
Figure 7Number concentration of (a) 0.8–2 nm () and (b) 2–4 nm () positive ions measured by a NAIS for different years (1 to 22 January). The black value inside each box is the median value of corresponding parameter. The gray values are the normalized median values to the lowest median value in each subplot, which is used for quantitative variation comparison between different parameters.
Unlike the number concentration of sub-3 nm particles, the ion concentrations in both 0.8–2 () and 2–4 nm () size ranges were higher in 2021 than in the other years (Fig. 7), possibly due to variations in ion source strengths. The ion concentration was higher in the size range of 0.8–2 nm than in the size range of 2–4 nm, which is consistent with previous studies (Kulmala et al., 2013). Figure S8 shows the levels of N1.3−3 and under different pollution levels among those 4 years. We found that N1.3−3 decreased with the increasing PM2.5 levels, while sub-2 nm ions showed relatively constant concentrations under different pollution levels. Both sub-3 nm particles and sub-2 nm ions are easily to be scavenged by larger particles, and ions are more vulnerable considering their higher diffusivity. The relatively constant concentrations of sub-2 nm ions under different pollution levels might result from the ion source strengths increasing as the PM2.5 concentration increased, which needs further exploration.
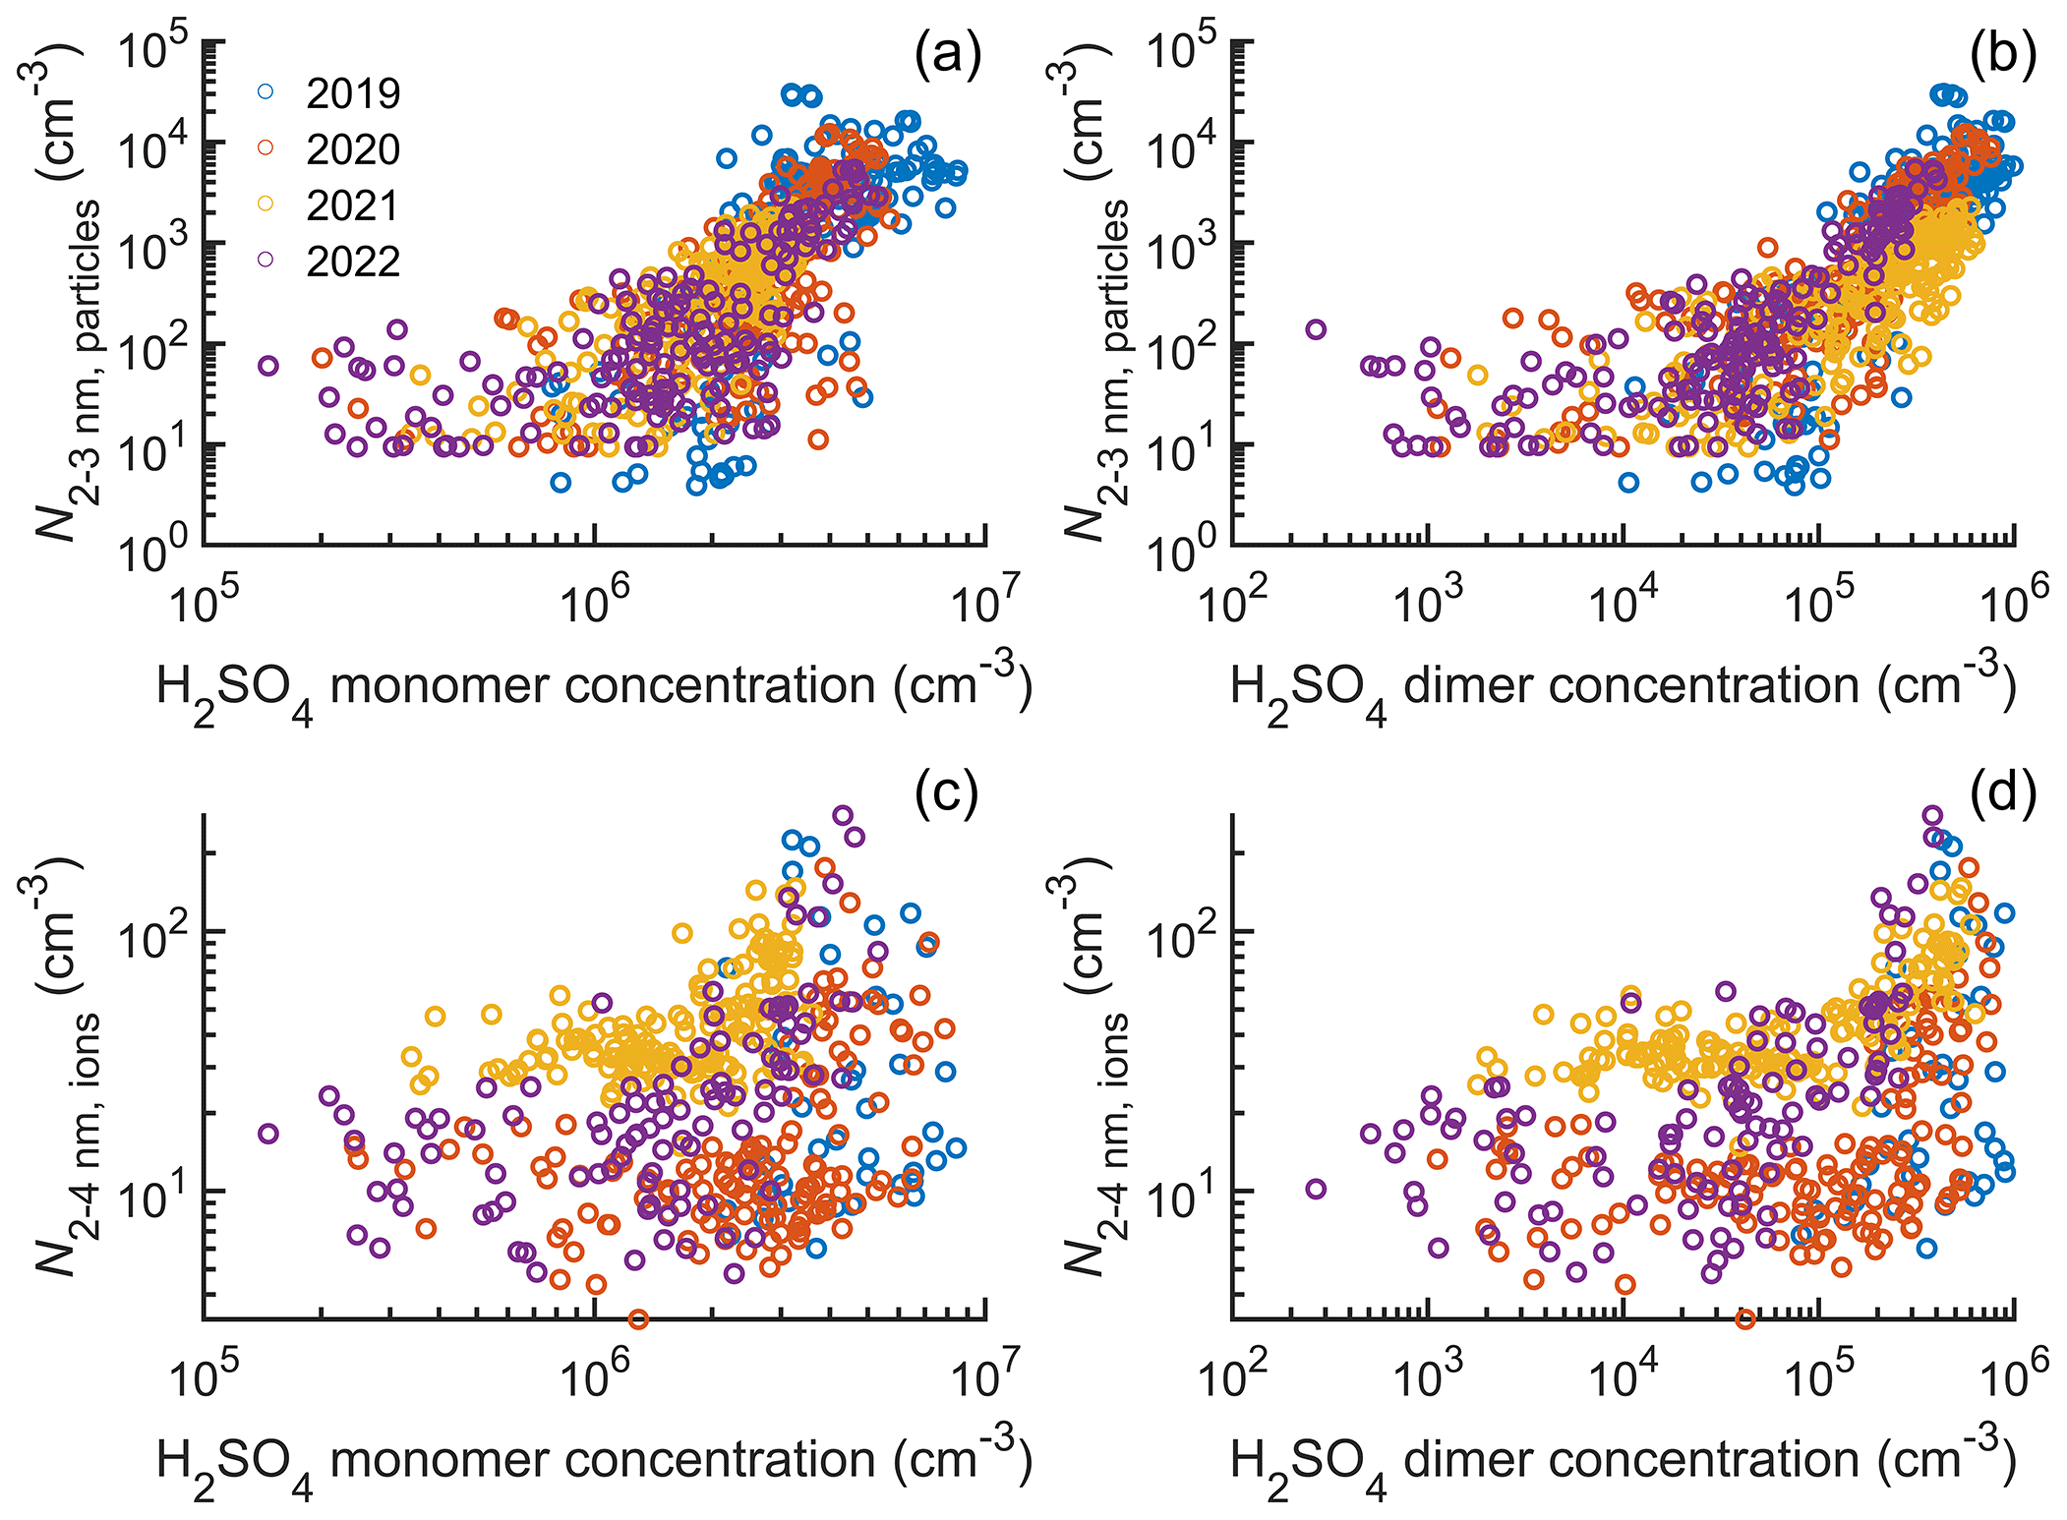
Figure 8The relations (a) between particle number concentration in 2–3 nm size range and H2SO4 monomer concentration, (b) between particle number concentration in 2–3 nm size range and H2SO4 dimer concentration, (c) between ion number concentration in 2–4 nm size range and H2SO4 monomer concentration, and (d) between ion number concentration in 2–4 nm size range and H2SO4 dimer concentration for different years (1 to 22 January).
Figure 8 shows that there was a positive and relatively strong association between the concentrations of 2–3 nm particles and the concentrations of SA1 and SA2 in every year, probably because the formation and growth of nucleated particles are strongly dependent on SA. A weak positive association was also observed between the 2–4 nm ion concentration and SA1 and SA2 concentration. Since 2–4 nm ions originate from collisions between small ions and particles, their concentration is expected to be correlated with SA2, especially as the concentrations of 2–3 nm particles were strongly correlated with concentrations of SA2.
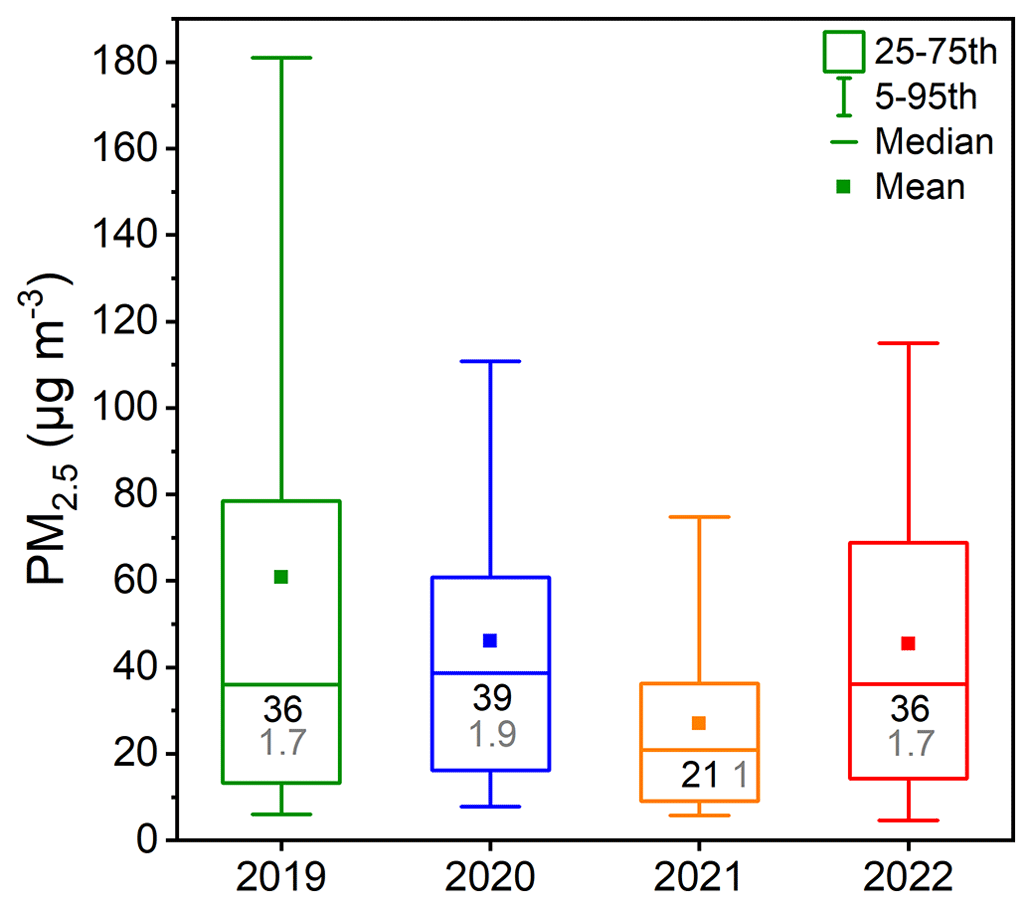
Figure 9PM2.5 mass concentration for different years (1 to 22 January). The black value inside each box is the median value of corresponding parameter. The gray values are the normalized median values to the lowest median value in each subplot, which is used for quantitative variation comparison between different parameters.
3.1.5 PM2.5 and its composition
The PM2.5 mass concentration generally decreased from 2019 to 2021 while rebounding in 2022 to reach a similar level as in 2020 (Fig. 9). In 2019, although the median value was similar to the values in 2020 and 2022, the average PM2.5 mass concentration was higher than in 2020 and 2022. This is because there were more severe haze events in 2019 (PM2.5 >150 µg cm−3, 7 %, Fig. S3a), which increased the average PM2.5 mass concentration considerably. The lowest PM2.5 mass concentration coincides with the highest BLH in 2021 (Fig. 2e and f). In addition, winds were mainly from the northwest in 2021, bringing clean air masses with low PM loadings, and hence the frequency of PM2.5≤35 µg cm−3 was the highest in 2021 (67 %, Fig. S3). These results indicate the important influence of meteorological conditions on air quality. PM2.5 concentrations are also driven by primary emissions and secondary production, discussed in more detail below.
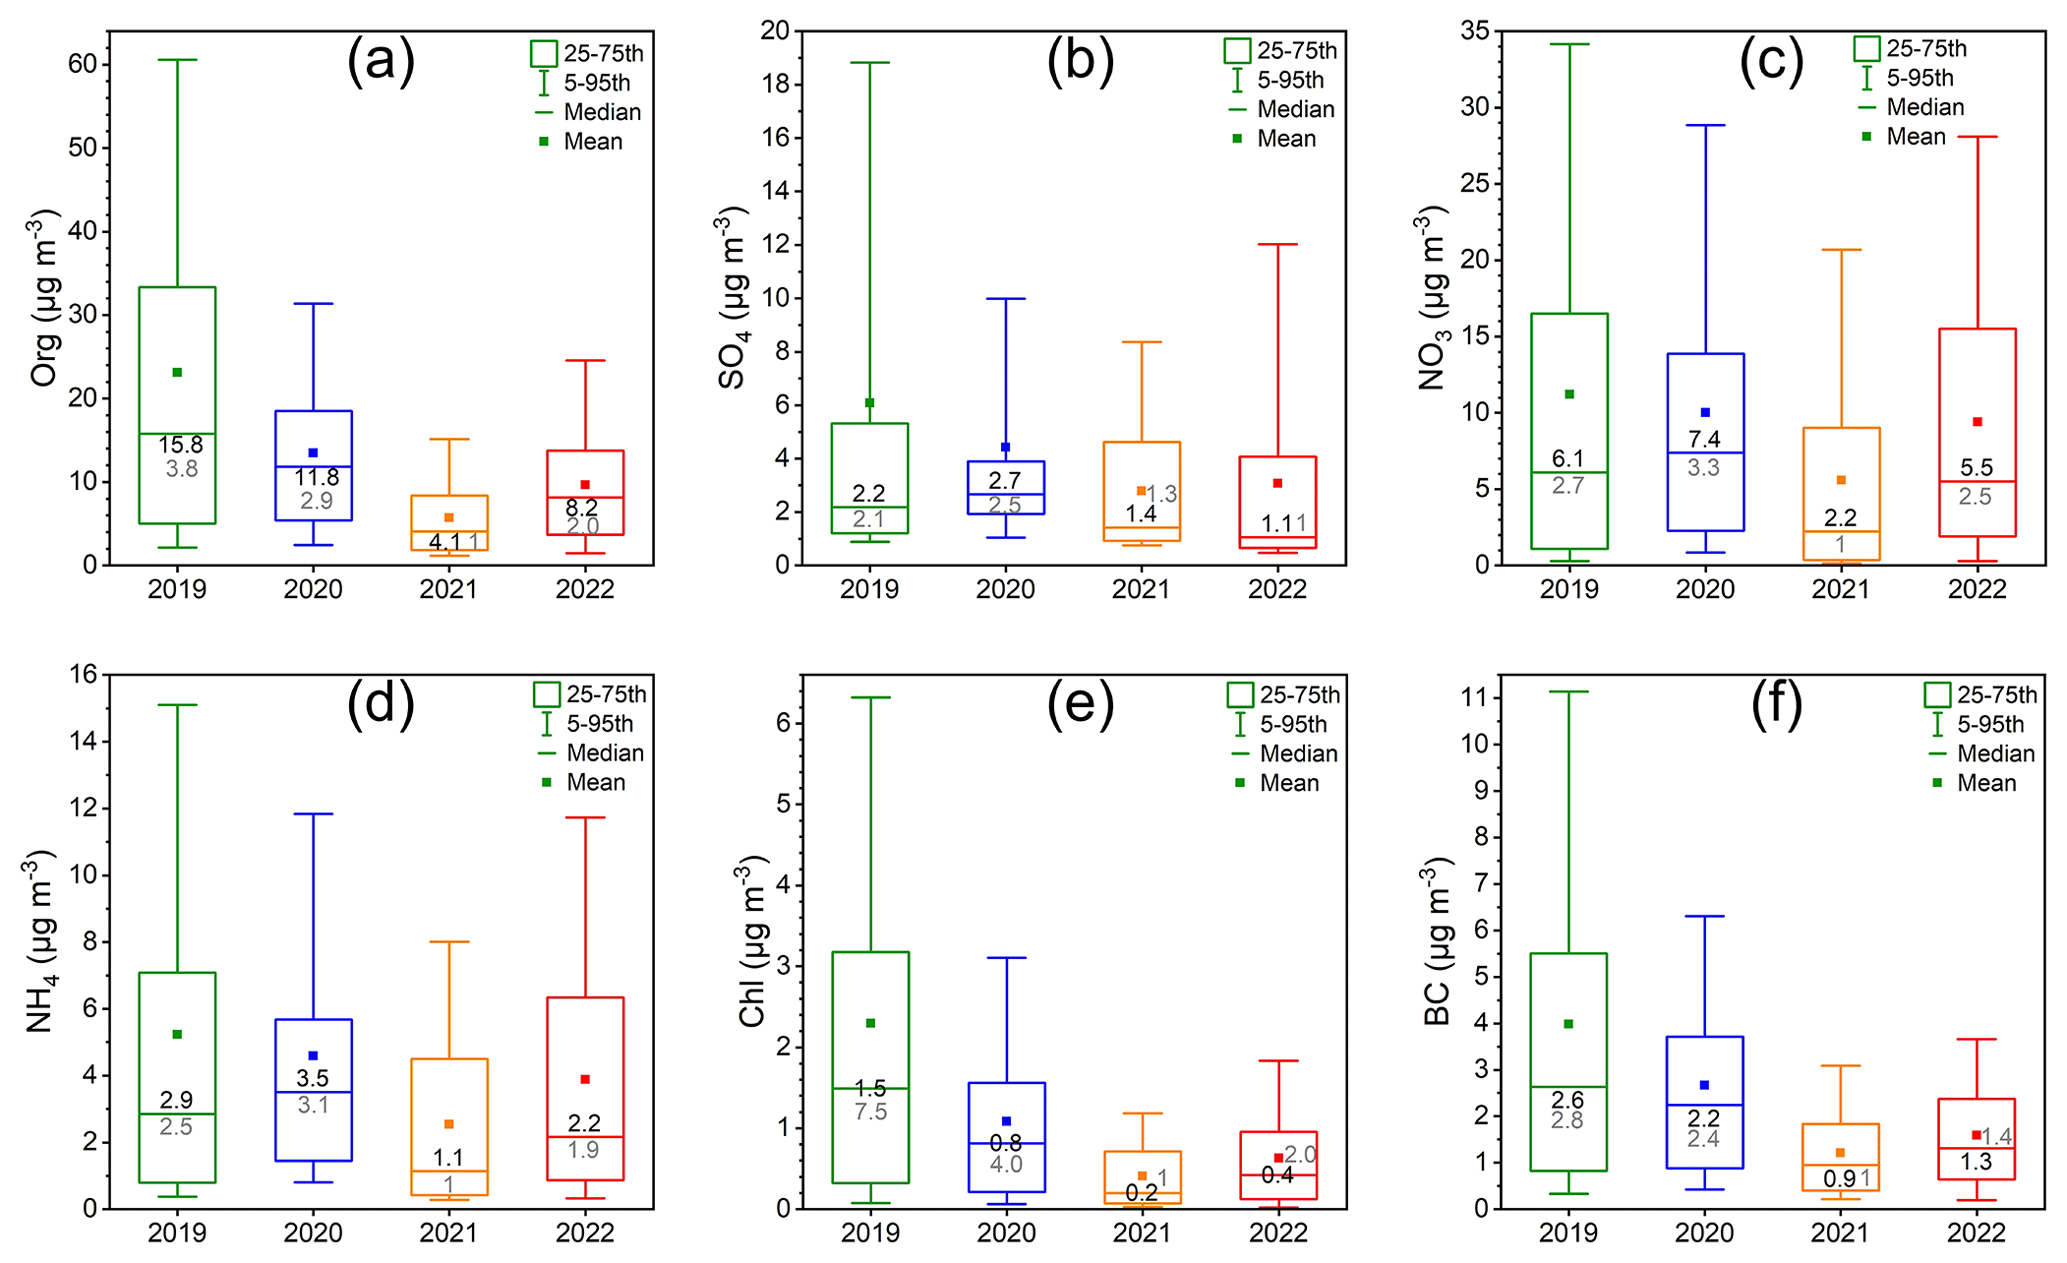
Figure 10Mass concentrations of PM2.5 compositions including (a) organics (Org), (b) sulfate (SO4), (c) nitrate (NO3), (d) ammonium (NH4), (e) chloride (Chl) and (f) black carbon (BC) for different years (1 to 22 January). The black value inside each box is the median value of corresponding parameter. The gray values are the normalized median values to the lowest median value in each subplot, which is used for quantitative variation comparison between different parameters.
The mass concentrations of Chl, BC and Org showed similar 4-year variations to the PM2.5 mass concentration, with a decrease from 2019 to 2021 and then an increase in 2022 (Fig. 10). Related mainly to primary sources, the mass concentrations of Chl and BC had similar 4-year variations to CO, a tracer for combustion sources. The mass concentration of Org had a similar 4-year variation to Chl and BC, which is because primary emissions like combustions partly contribute to the Org in the particle phase. Another important contributor to Org is secondary formation processes. Previous studies suggest that OOMs, which also decreased from 2019 to 2021 and then increased in 2022, can contribute a substantial fraction to secondary organic aerosol mass concentrations (Nie et al., 2022), Therefore, the 4-year variation of Org can be attributed to both primary emissions and secondary production processes.
However, unlike Chl, BC and Org, sulfate showed the lowest concentration in 2022. The generally decreasing trend of the sulfate mass concentration is consistent with the decreasing trend of the SO2 concentration from 2019 to 2022, reflecting the significant reduction of SO2 emissions that China has made during recent years, especially in winter.
Nitrate and ammonium had their lowest concentrations in 2021 with an increase in 2022, but, unlike Chl, BC and Org, they had higher concentrations in 2020 than in 2019. The similar 4-year changes of nitrate and ammonium are mainly because ammonium tends to be associated with nitrate and sulfate in the particle phase, and the contribution of nitrate becomes dominant due to the significant reduction of SO2 emissions. With lower NOx in 2020 than 2019 (Fig. 3b and c), the higher NO3 concentrations in 2020 than those in 2019 suggest that more nitrogen oxides were transformed into particulate nitrate. Figure S12 shows that at almost all PM2.5 levels, the mass concentration of nitrate in 2020 was higher than that in 2019, while NO2 and NO concentrations were generally lower in 2020. One possible reason for this is the much higher RH in 2020, leading to more aerosol liquid water content, which promotes the uptake of HNO3 and the hydrolysis of N2O5 (Y. Wang et al., 2020a).
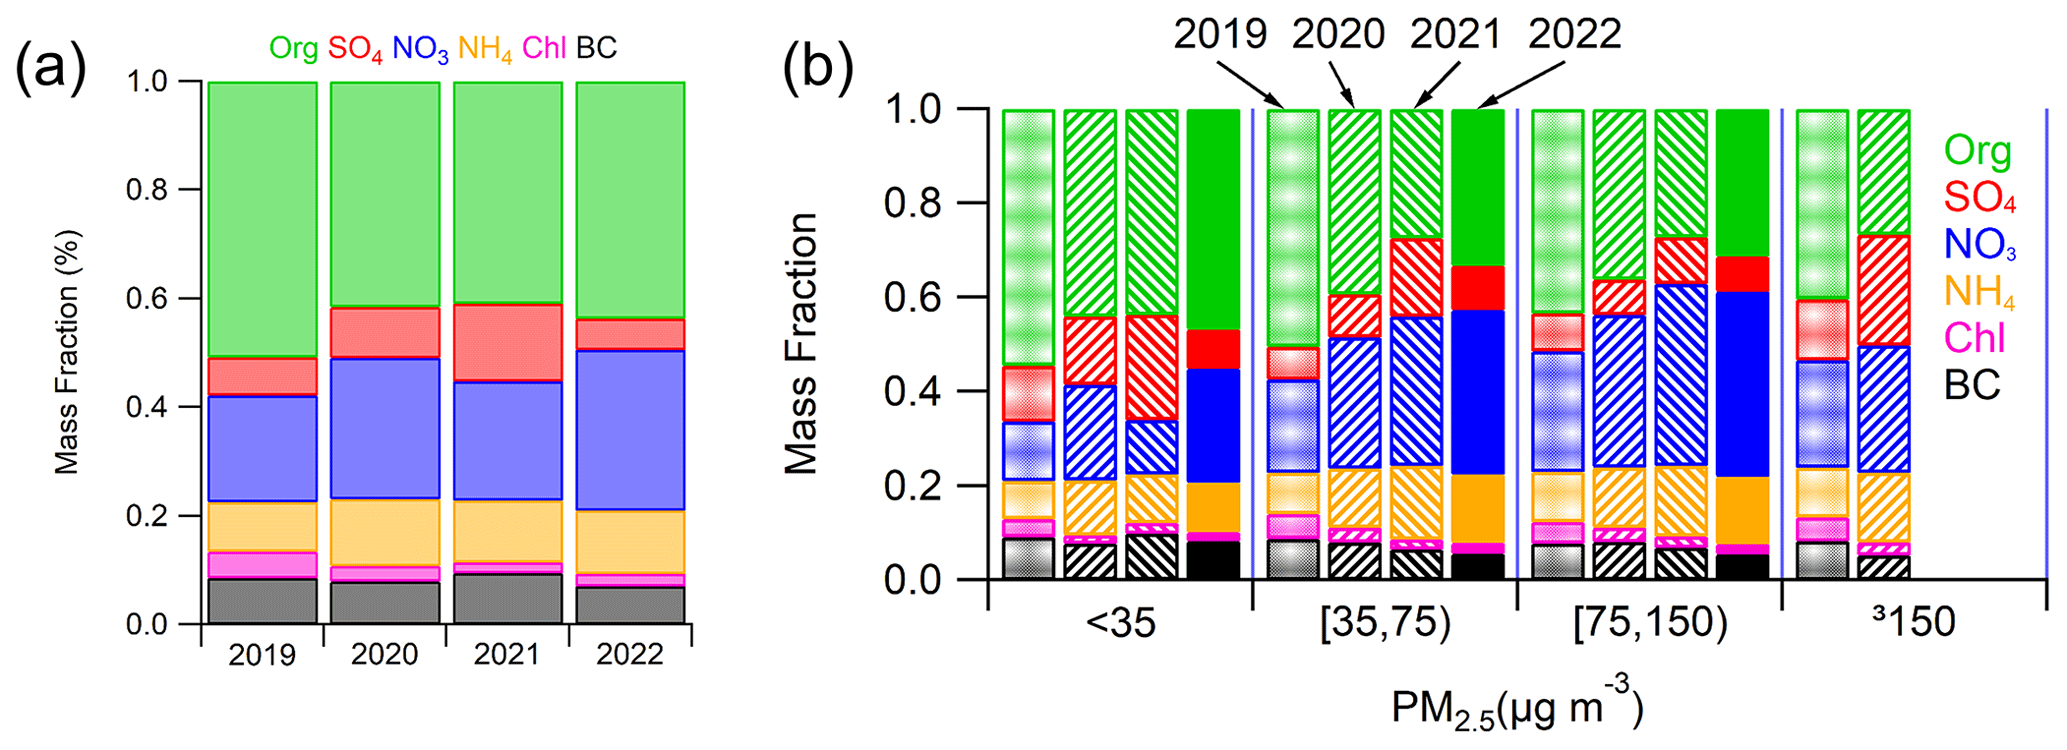
Figure 11Contributions of PM2.5 compositions including organics (Org), sulfate (SO4), nitrate (NO3), ammonium (NH4), chloride (Chl) and black carbon (BC) (a) for different years (1 to 22 January) and (b) under different PM2.5 levels.
Despite some 4-year variations of the mass fractions of the different aerosol component, Org always contributed the largest fraction to the mass concentration of PM2.5 in every year, followed by nitrate (Fig. 11a). The nitrate fraction generally increased from 20 % in 2019 to 28 % in 2022, suggesting a more and more important role of nitrate in PM pollution. The important role of the organics and nitrate in the PM2.5 composition has also been found in previous studies in Beijing (Xu et al., 2019; Sun et al., 2020; Hu et al., 2021).
Figure 11b shows that when the PM2.5 mass concentration increased from smaller than 35 µg m−3 to larger than 150 µg m−3, the mass fraction of secondary inorganic aerosol (SIA), including nitrate, sulfate and ammonium, increased, while the mass fraction of organics decreased in every year. This phenomenon was mainly driven by the increase of the nitrate fraction. Especially in 2021 and 2022 when the PM2.5 mass concentration was between 35 and 150 µg m−3, the mass fraction of nitrate was the largest among the different components. Our results indicate the important role of nitrate in haze formation and the urgent need for significant reductions in NOx emissions in order to improve the air quality in Beijing.
A number of studies have investigated the yearly changes of chemical compositions of particulate matter in Beijing in recent years (Wang et al., 2019; Xu et al., 2019; Zhou et al., 2019; Zhang et al., 2020; Hu et al., 2021). Due to the implementation of air quality regulations, most of the compounds in particulate matter have decreased significantly. For example, chloride of PM1 decreased by 65 %–89 % from 2011–2012 to 2017–2018 in urban Beijing, measured using an ACSM (Zhou et al., 2019). In this study, the organics concentration also decreased by 37 %–70 %. However, the nitrate concentration did not decrease but even increased. The nitrate concentration was also found to increase by ∼4 % during wintertime from 2007 to 2017 in a previous study (Zhang et al., 2020). Additionally, many studies found that nitrate gradually becomes the major contributor to the chemical composition of particulate matter, overweighing organics, especially during severe haze periods (Xu et al., 2019; Hu et al., 2021). These results are consistent with ours, indicating the importance of reducing NOx concentration in Beijing.
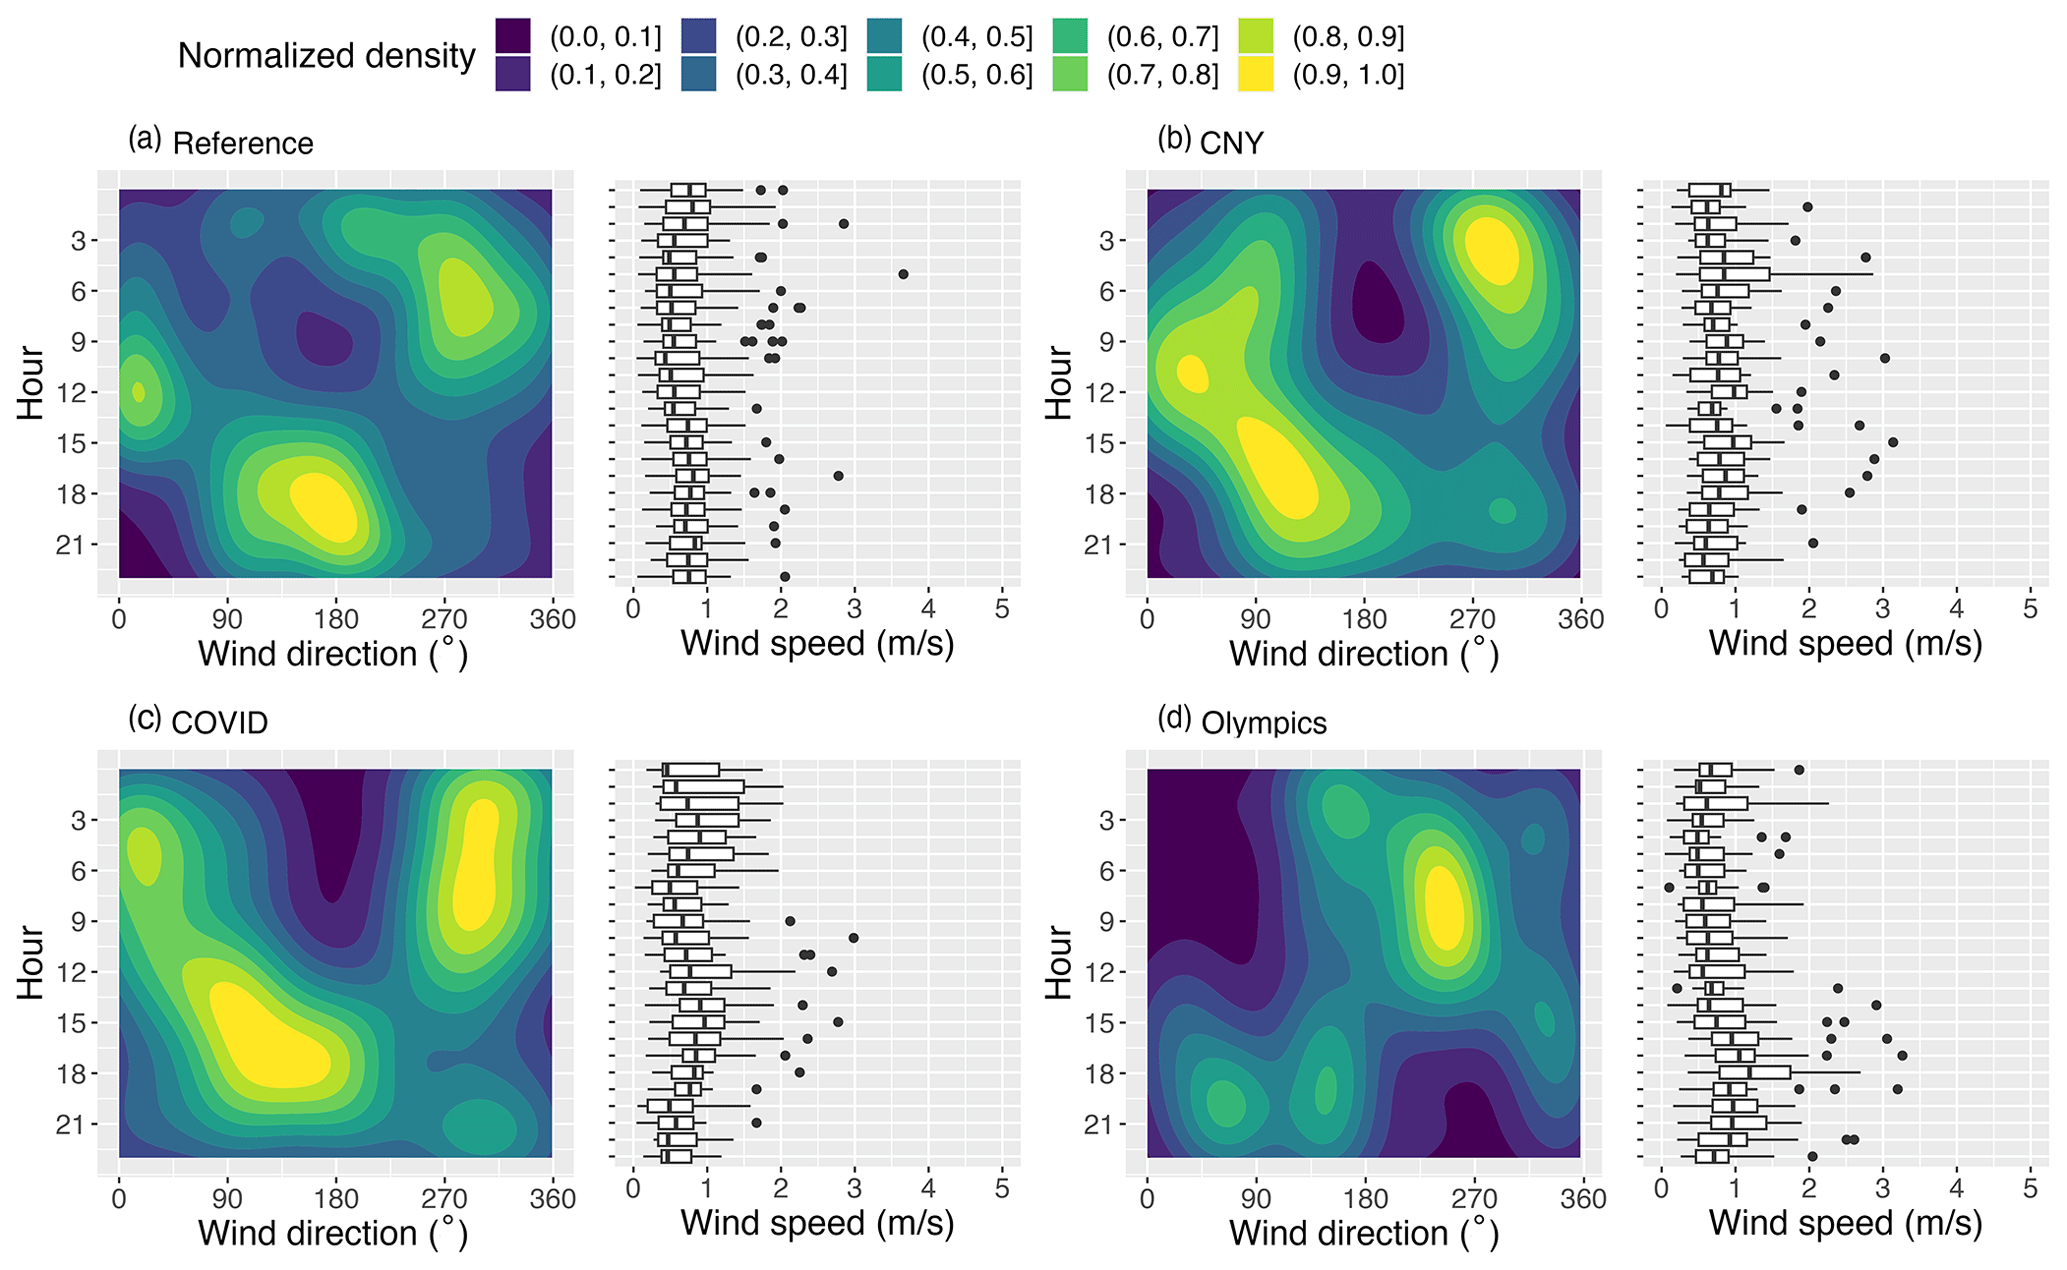
Figure 12Diurnal variations of wind direction and wind speed for reference, COVID, Olympics and CNY periods. The wind direction and wind speed are depicted in wind contour plots and box plots respectively.
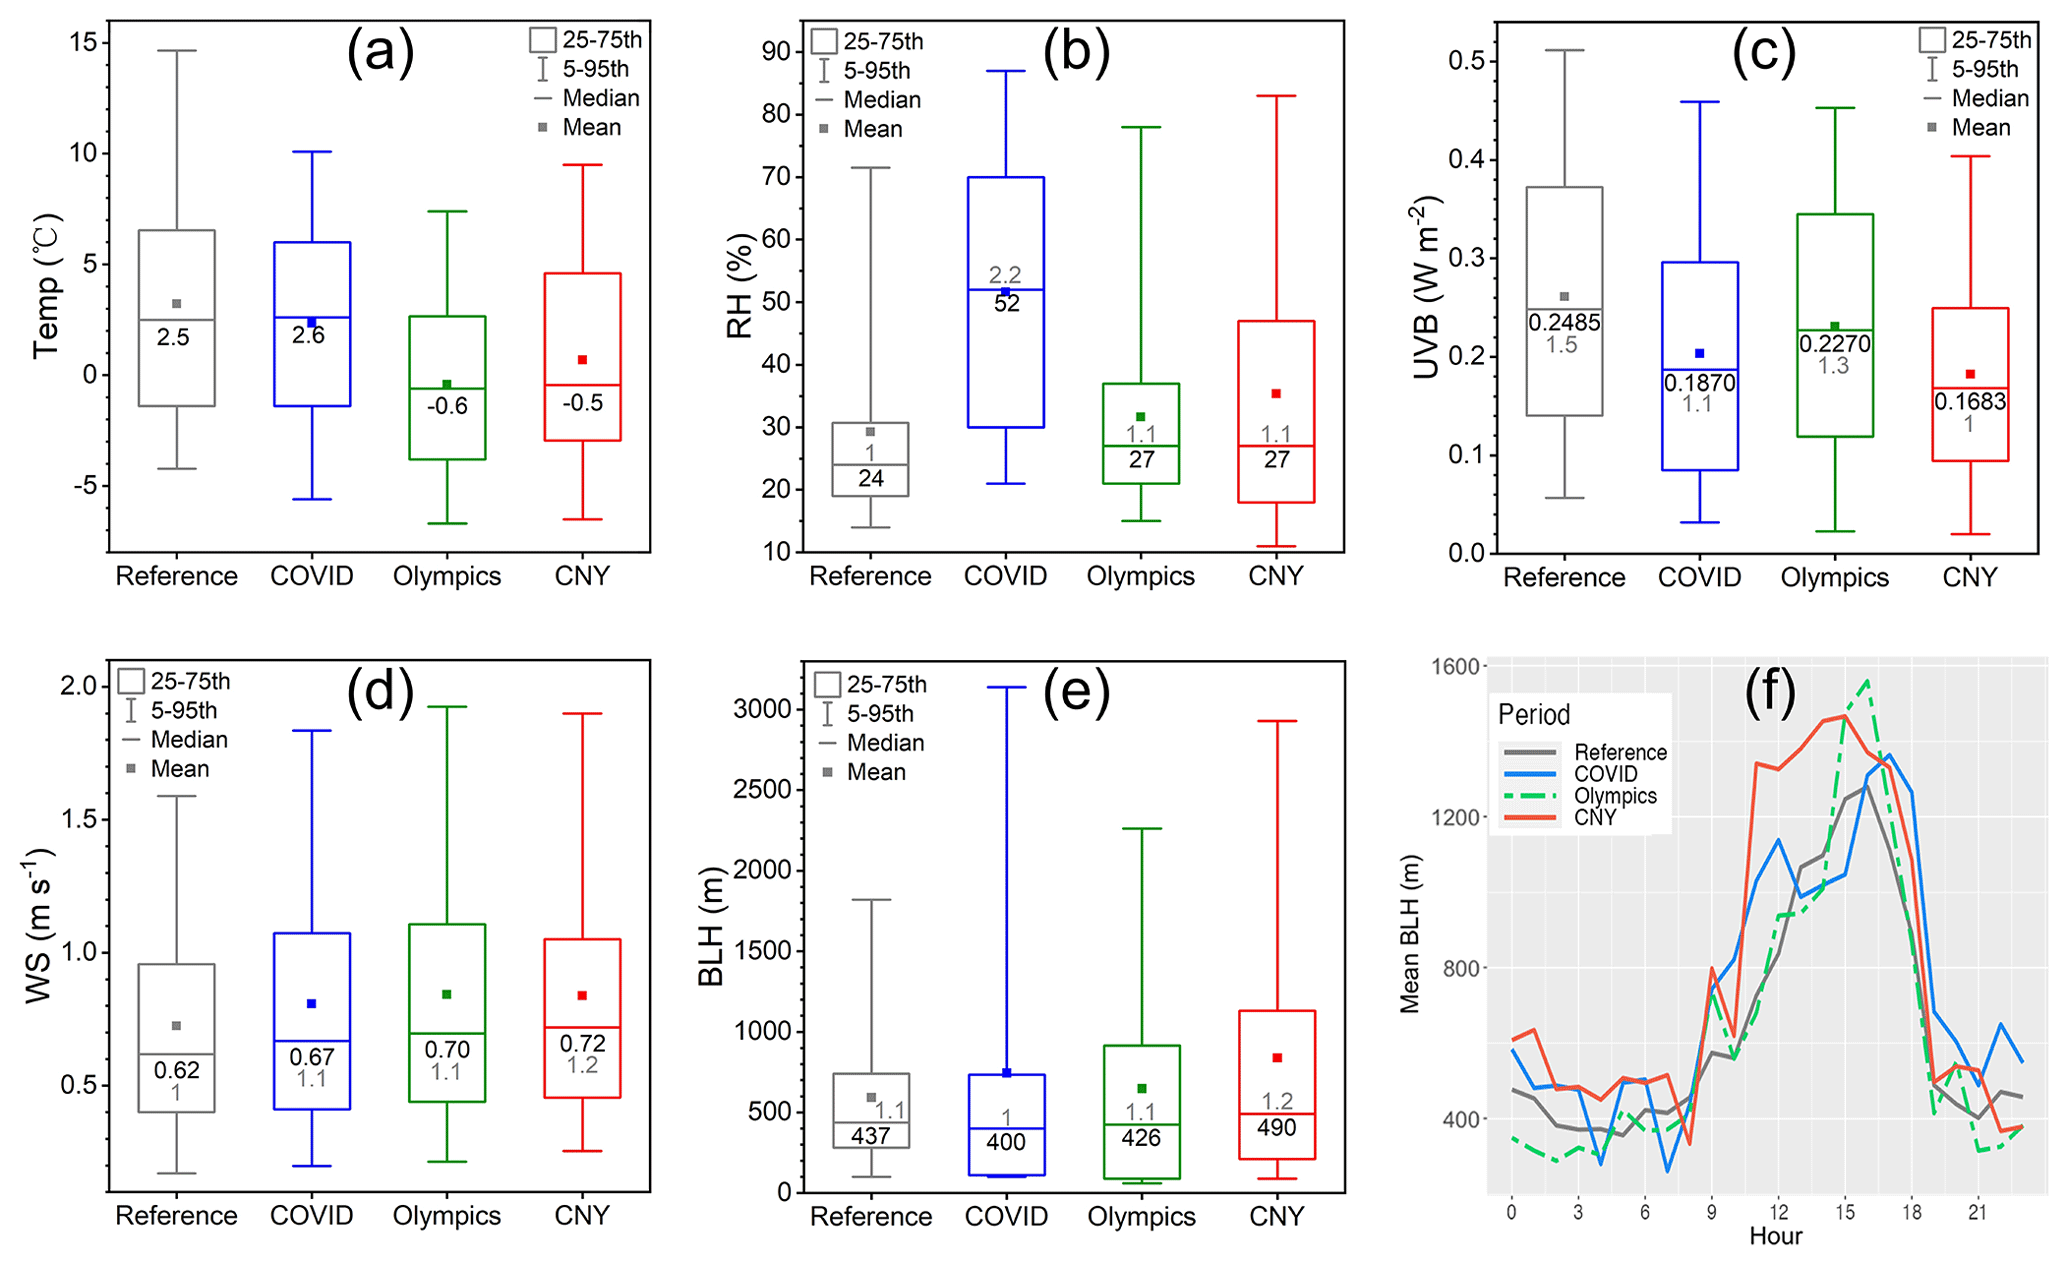
Figure 13(a) Temperature (Temp), (b) relatively humidity (RH), (c) UVB, (d) wind speed (WS) and (e) boundary layer height (BLH) for reference, COVID, Olympics and CNY periods. (f) Averaged diurnal variations of boundary layer height (BLH) for reference, COVID, Olympics and CNY periods. The black value inside each box is the median value of corresponding parameter. The gray values are the normalized median values to the lowest median value in each subplot, which is used for quantitative variation comparison between different parameters. Please note that for UVB, only the daytime (08:00–16:00) dataset was used.
3.2 The influence of different special events on air quality
3.2.1 Meteorological conditions
There are three notable meteorological characteristics for the special event periods. First, the wind direction distribution during reference, CNY and COVID periods were generally similar and followed the typical diurnal wind pattern in Beijing (Fig. 12a–c). Specifically, from midnight to noon, winds mostly blew from the northwest and sometimes also from the northeast, while from the afternoon to evening, the wind direction turned to the south or southeast. During the Olympics, however, the wind pattern was not as strong as in the other events (Fig. 12d). From midnight to noon, the dominant wind direction was the southwest, instead of northwest as during the other events, while from the afternoon to midnight, there was no prevailing wind direction. This feature could have affected the air quality positively during the Olympics as there were less frequent southerly winds which are typically associated with more polluted air masses. Second, the temperatures during the Olympics (median −0.6 ∘C) and CNY (median −0.5 ∘C) were lower than during reference (median 2.5 ∘C) and COVID (median 2.6 ∘C) periods (Fig. 13a). The temperature variation may cause changes in the rate of gas- and particle-phase reactions as well as in the volatility of oxygenated organic molecules and thereby may have a slight influence on the air quality. Third, the RH during the COVID period (median 52 %) was higher than during the other three periods (median 24 %–27 %) (Fig. 13b). And this high RH may change the phase state of particles and increase secondary aerosol formation through heterogeneous reactions. Meanwhile, the wind speeds (Figs. 12 and 13d) and BLH levels (Fig. 13e and f) during the four periods were comparable to each other, so the vertical mixing of air masses was likely relatively similar among different periods.
3.2.2 Trace gases
Since the restrictions during the COVID, Olympics and CNY periods focus on different sections of social life and production activities, trace gases may have different responses to different periods. During the Olympics, the southerly wind was not that frequent, so this period was the least influenced by polluted air masses. Consequently, CO, NO, NO2 and SO2 were the lowest, and O3 was the highest during the Olympics compared with other three periods. During COVID, however, the southerly wind appeared with the highest frequency, leading to the most severe pollution transportation. Thus, the CO concentration was the highest (849 ppb). It can also be found that, despite the most polluted air masses during COVID, the concentrations of NO, NO2 and SO2 were lower than the reference period, suggesting that the restrictions on NO, NO2 and SO2 during that period were quite efficient. In addition, compared with NO2, the restriction on NO and SO2 was much more obvious. NO2 has large sources from secondary formation and is able to transport over long distances (Zhu et al., 2021; Tan et al., 2022); hence, the transportation of NO2 likely partly compensates for the effect of the NO2 emission control. Under the synergistic influences of pollution transport and COVID control measures, the O3 concentration was only slightly higher during COVID than during the reference period. As mentioned before, during CNY, the wind direction had a pattern similar to that during the reference period, and the wind speed as well as BLH was only slightly higher than during the reference period. Therefore, meteorological conditions were similar during these two periods. Consequently, CO was only a bit lower during CNY than during the reference period. For NO and NO2, however, their concentrations were much lower during CNY than during the reference period. This is likely due to the reduction of NOx emissions from vehicles, as a large fraction of people went to their hometowns from Beijing. Lower NOx levels also led to higher O3 levels. The SO2 concentration was only slightly lower during CNY than during the reference period. During the winter heating period in urban Beijing, SO2 should mainly come from the combustion of fossil fuel (Xu et al., 2016; Meng et al., 2016), so the reduced traffic emissions had a minor influence on SO2 concentrations. In addition, from New Year's Eve to the next following days, SO2 can also be emitted from fireworks (Foreback et al., 2022).
We then investigated these gases under different PM levels. When PM2.5 exceeded 35 µg m−3, SO2 during COVID was much lower than during other three periods (Fig. S10), and this feature was associated with higher RH (Fig. S9) and higher particulate sulfate concentrations (Fig. S13). Therefore, the conversion of gaseous SO2 to particulate sulfate was likely enhanced during COVID when PM2.5 was larger than 35 µg m−3, leading to the low concentration of gaseous SO2. Additionally, O3 and PM2.5 showed a non-linear relationship; O3 concentration first decreased and then increased with increasing PM2.5, for the period from 4 to 20 February (Fig. S10), which is consistent with previous studies (Y. Wang et al., 2020b; Zhao et al., 2020). As the level of O3 is affected by many factors, such as meteorological conditions, regional transport (Lin et al., 2019; Zhao et al., 2021; Liu et al., 2019; Ge et al., 2012), and photochemical processes associated with solar radiation, NOx and VOCs (Tan et al., 2018; Q. Li et al., 2020), further analysis is highly needed for delving into the reasons behind such behavior of O3.
In summary, in urban Beijing, concentrations of gaseous pollutants are controlled by their emission sources and the meteorological conditions. Thus, during the Olympics, favored by the clean air mass, CO, NO, NO2 and SO2 were dramatically reduced. During COVID, under the influence of extremely polluted air masses, the strict restrictions on people's movement which affected traffic emissions and probably other production activities, CO concentration increased a lot, while NO and SO2 concentrations reduced, and NO2 reduced slightly. During CNY, under the influence of unfavorable meteorological conditions, reduced traffic emission and probably some other reduced production activities, CO and SO2 concentrations did not decrease, while NOx reduced.
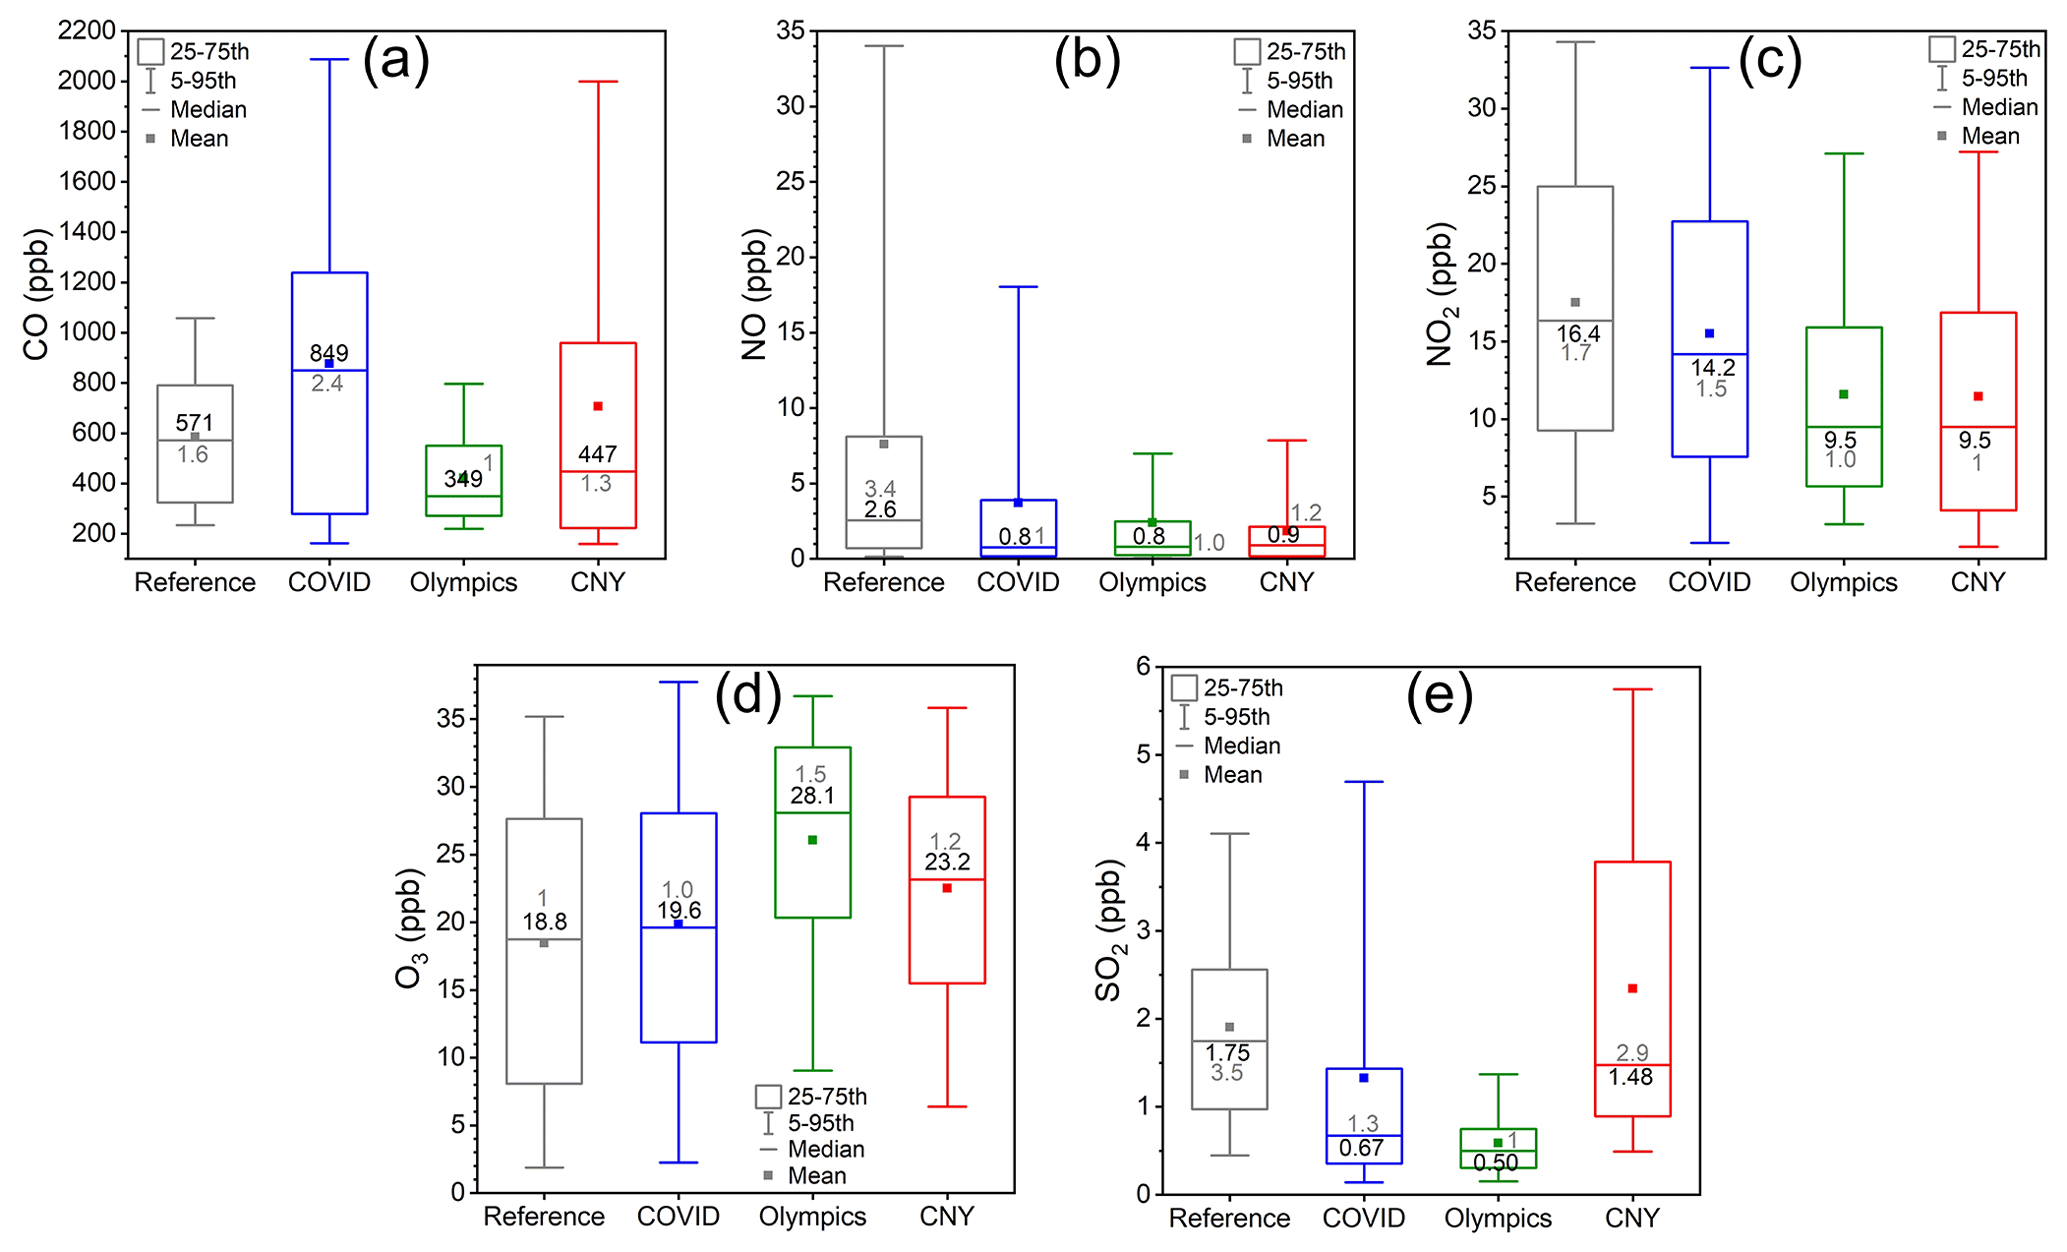
Figure 14Mixing ratios of (a) CO, (b) NO, (c) NO2, (d) O3 and (e) SO2 for reference, COVID, Olympics and CNY periods. The black value inside each box is the median value of corresponding parameter. The gray values are the normalized median values to the lowest median value in each subplot, which is used for quantitative variation comparison between different parameters.
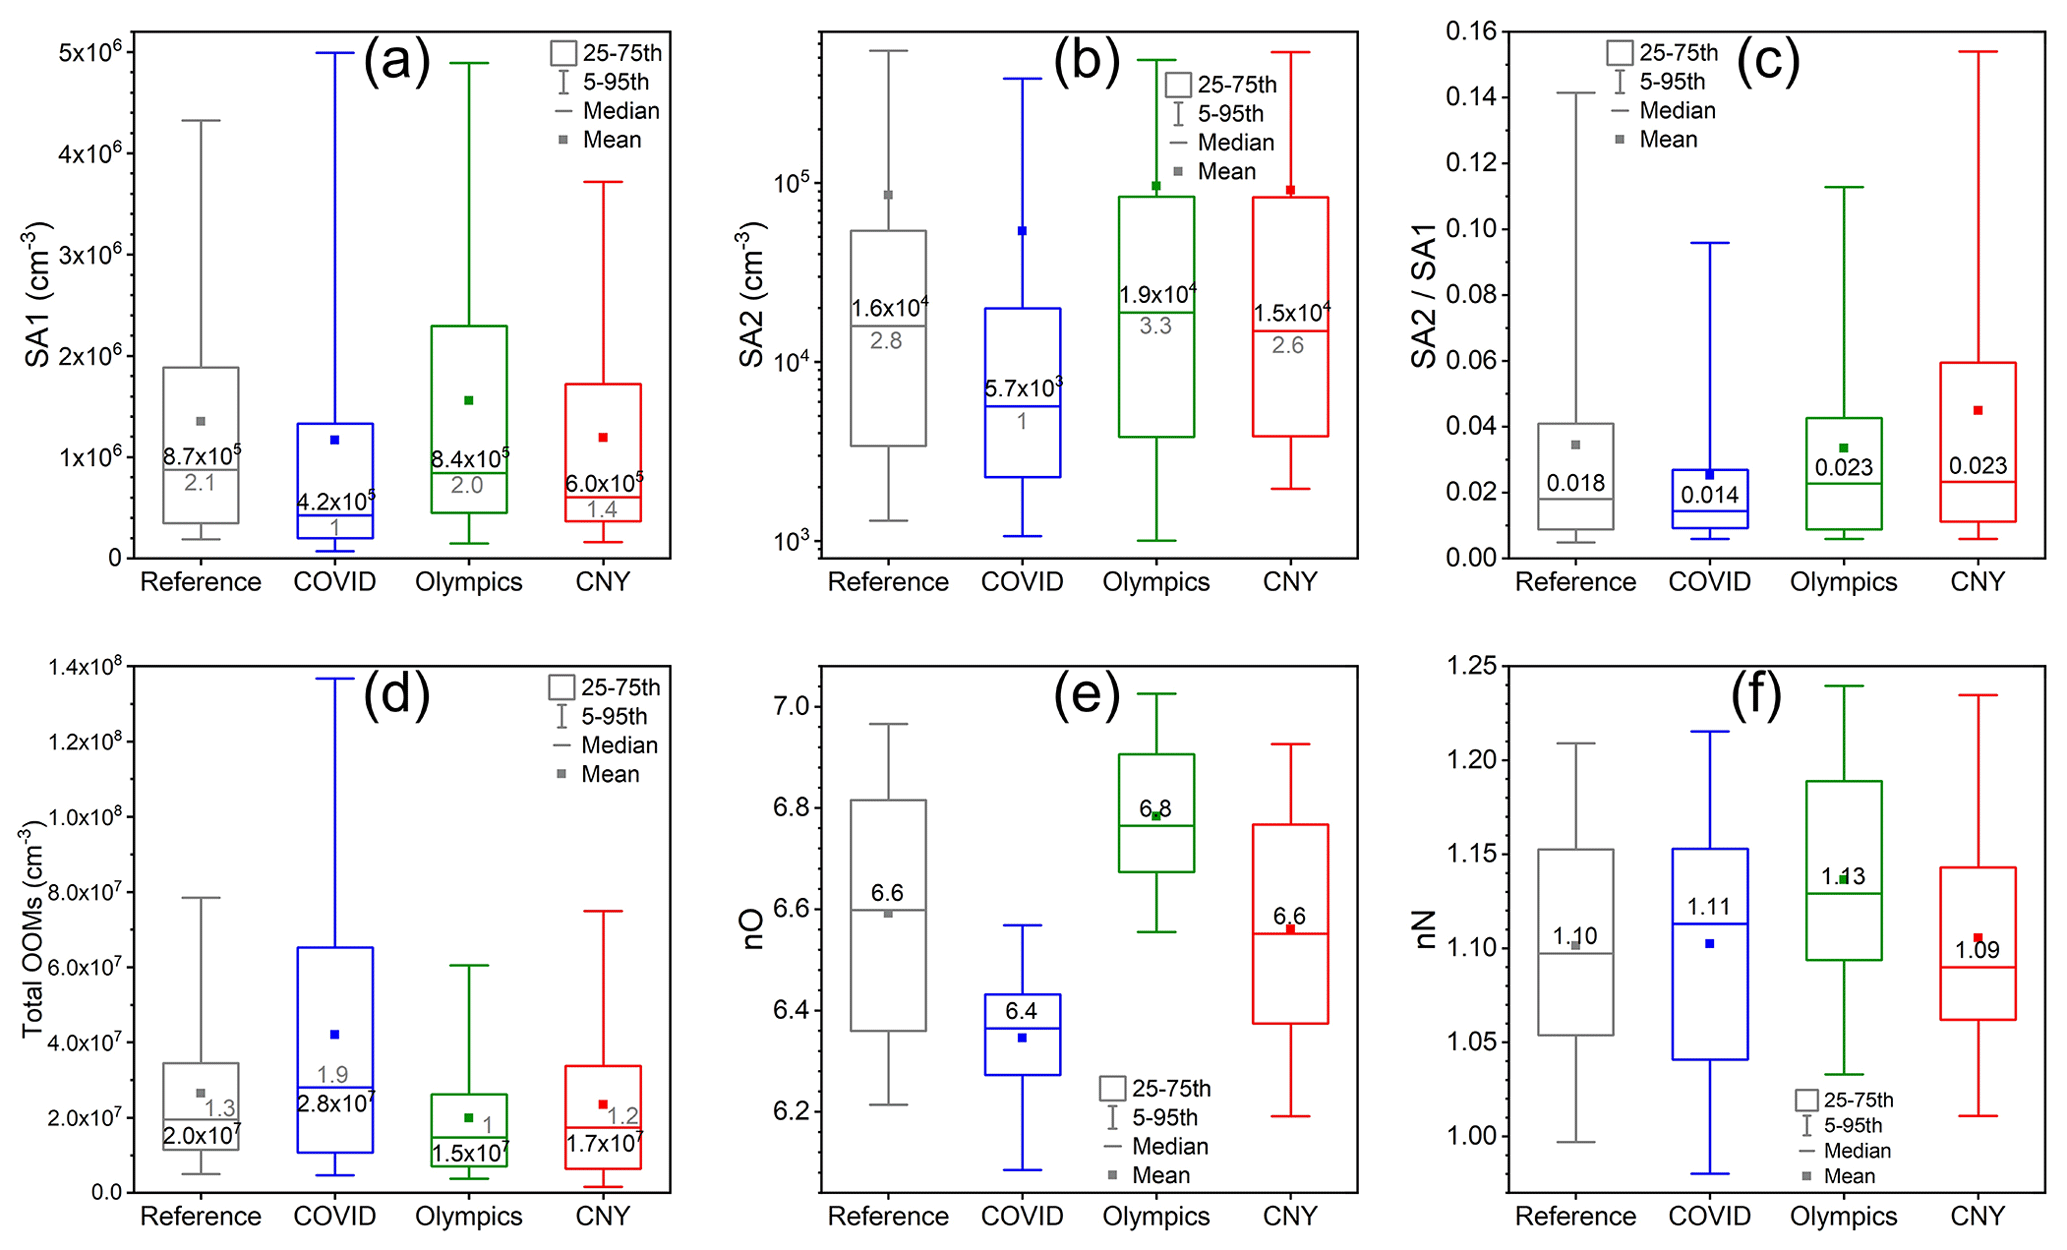
Figure 15(a) Concentration of sulfuric acid monomer (SA1), (b) concentration of sulfuric acid dimer (SA2), (c) ratio of SA2 to SA1, (d) concentration of total OOMs, (e) fraction-weighted oxygen number of OOMs (nO) and (f) fraction-weighted nitrogen number of OOMs (nN) for reference, COVID, Olympics and CNY periods. The black value inside each box is the median value of corresponding parameter. The gray values are the normalized median values to the lowest median value in each subplot, which is used for quantitative variation comparison between different parameters.
3.2.3 Condensable vapors
The responses of SA and OOMs to the three restriction periods were quite different. For SA, the concentrations of SA1 and SA2 were the lowest during COVID (median value are 4.2×10⁵ and 5.7×103 cm−3 for SA1 and SA2, respectively) and were comparable in the other three periods (median values are 6.0–8.7×10⁵ and 1.5–1.9×104 cm−3 for SA1 and SA2, respectively) (Fig. 15a and b). Since SA is mainly produced from SO2 oxidation by OH radicals (Finlayson-Pitts and Pitts, 2000) and is primarily scavenged by condensation onto particles (Dada et al., 2020; Guo et al., 2021; Yang et al., 2021), the lowest concentration during COVID could be attributed to the highest condensation sink (Fig. S4b) accompanied by the low SO2 concentration (Fig. 14e). Despite the lowest SO2 concentrations during the Olympics, SA1 was not low (Fig. 15a), and SA2 was even the highest (Fig. 15b). This was probably caused by the synergistic effects of decreased condensation sink (Fig. S4b) and increased atmospheric oxidation capacity during the Olympics (which could be partially indicated by the highest O3, Fig. 14d). Meanwhile, compared with COVID and reference periods, the ratios of SA2 SA1 during the Olympics and CNY were higher, suggesting that the cluster formation efficiency of sulfuric acid was enhanced during those two periods.
The concentration of the total OOMs (median values are 1.5–2.8×107 cm−3, Fig. 15d) was the highest during COVID. Compared with SA, the production and loss processes of OOMs are much more complex: they can be generated from the oxidation of VOCs (volatile organic compounds) and OVOCs (oxygenated volatile organic compounds) or be evaporated from the particle phase (Kohli and Davies, 2021; Yli-Juuti et al., 2017; Wilson et al., 2015). When it comes to the loss processes, OOMs can be consumed by further oxidation processes or through absorption onto particle surfaces via pure condensation or reactive uptake. Among all these factors, precursor VOCs and OVOCs could have great impacts. Since such precursors tend to come along with pollution (Yao et al., 2021; Niu et al., 2022), OOM concentration also showed a strong association with the pollution level (Fig. S11). This is probably why the OOM concentration was the highest during COVID when severe haze (PM2.5>75 µg m−3) was most frequent and the lowest during the Olympics when there was almost no severe haze (Fig. 3b). For OOMs themselves, Figs. 15 and S11 together show that under the same PM2.5 level, both the averaged oxygen and nitrogen numbers during the Olympics were the highest, which implies that not only the oxidation state of OOMs was enhanced, but also the involvement of NOx was more effective during the Olympics.
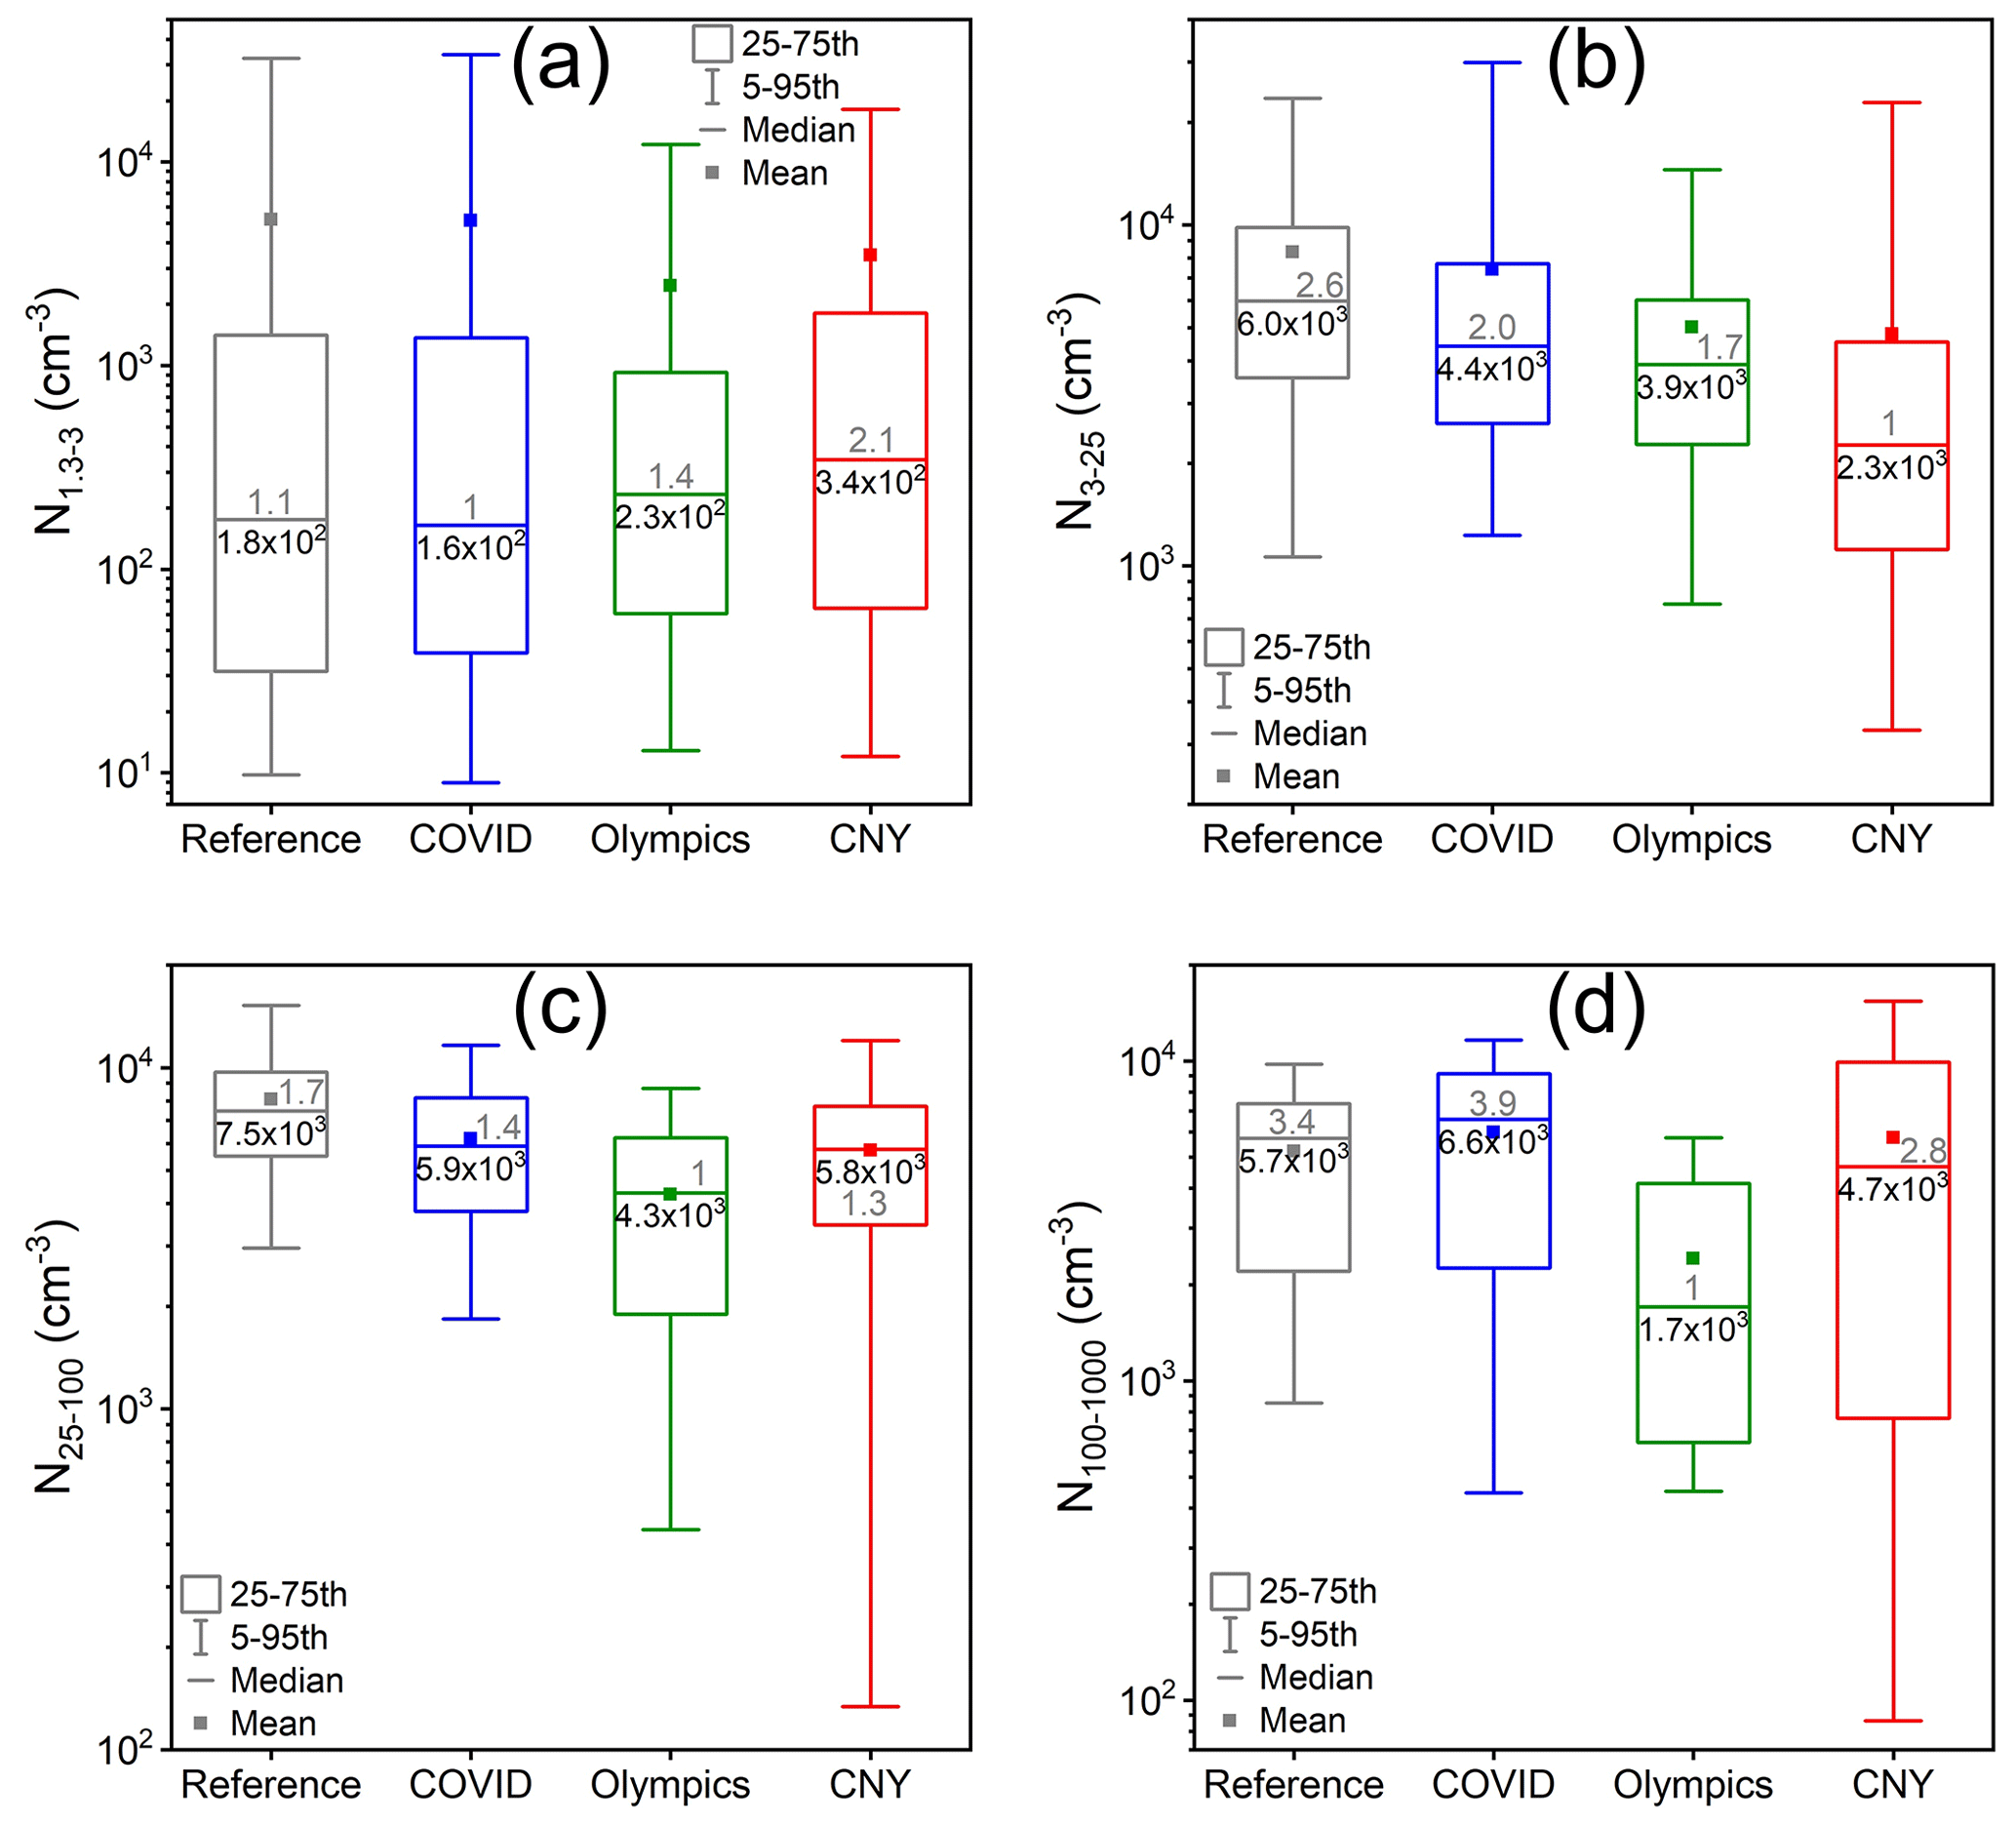
Figure 16Comparisons of number concentration of (a) sub-3 nm particles (N1.3−3), (b) 3–25 nm particles (N3−25), (c) 25–100 nm particles (N25−100) and (d) 100–1000 nm particles (N100−1000) for reference, COVID, Olympics and CNY periods. The black value inside each box is the median value of corresponding parameter. The gray values are the normalized median values to the lowest median value in each subplot, which is used for quantitative variation comparison between different parameters.
3.2.4 Particles and ions
As shown in Fig. 16, N1.3−3 was almost at the same level during the reference, COVID, Olympics and CNY periods. N3−25 was lower during CNY period, and N25−100 was slightly lower during the Olympics than during the other periods. However, N100−1000 was significantly lower during the Olympics compared with the other periods.
The small variability of N1.3−3 between the different periods indicates that the special events may have only little effect on the formation of sub-3 nm particles, i.e., new particle formation processes, consistent with a previous study (Yan et al., 2022). However, for the accumulation particles, the significantly lower number concentrations during the Olympics indicates a great impact of the reduction of anthropogenic emissions on large particles during this period. Also, the frequent wind direction from the north indicates the transport of clean air mass during the Olympics.
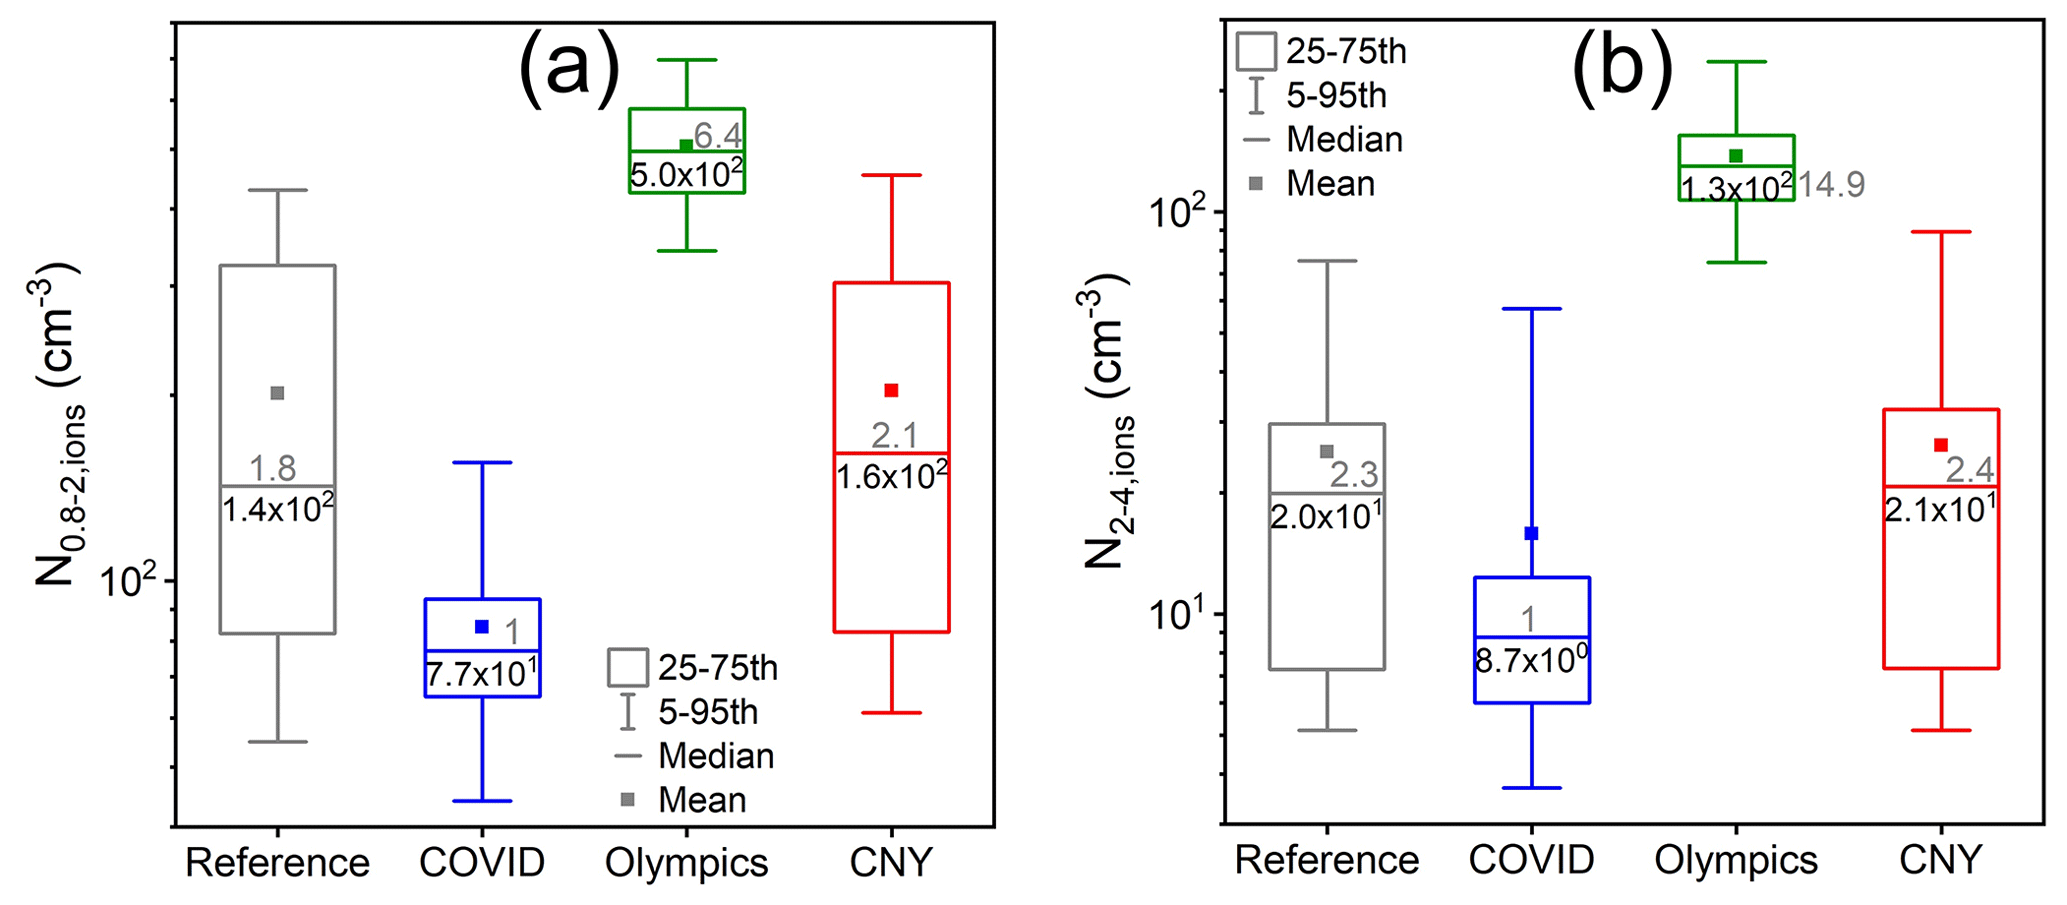
Figure 17Comparisons of number concentration of (a) 0.8–2 nm (N0.8−2) and (b) 2–4 nm positive ions (N2−4) for reference, COVID, Olympics and CNY periods. The black value inside each box is the median value of corresponding parameter. The gray values are the normalized median values to the lowest median value in each subplot, which is used for quantitative variation comparison between different parameters.
Ion concentrations in the different size ranges were significantly higher during the Olympics compared with the other periods (Fig. 17). During COVID, the ion concentrations were the lowest. Such differences between the different periods basically follow the 4-year changes of ion concentrations. As discussed in Sect. 3.1.5, the ion concentrations were higher in 2022 compared with the other years, which is consistent with the higher ion concentrations during the Olympics in 2022 than during the COVID, CNY and reference periods.
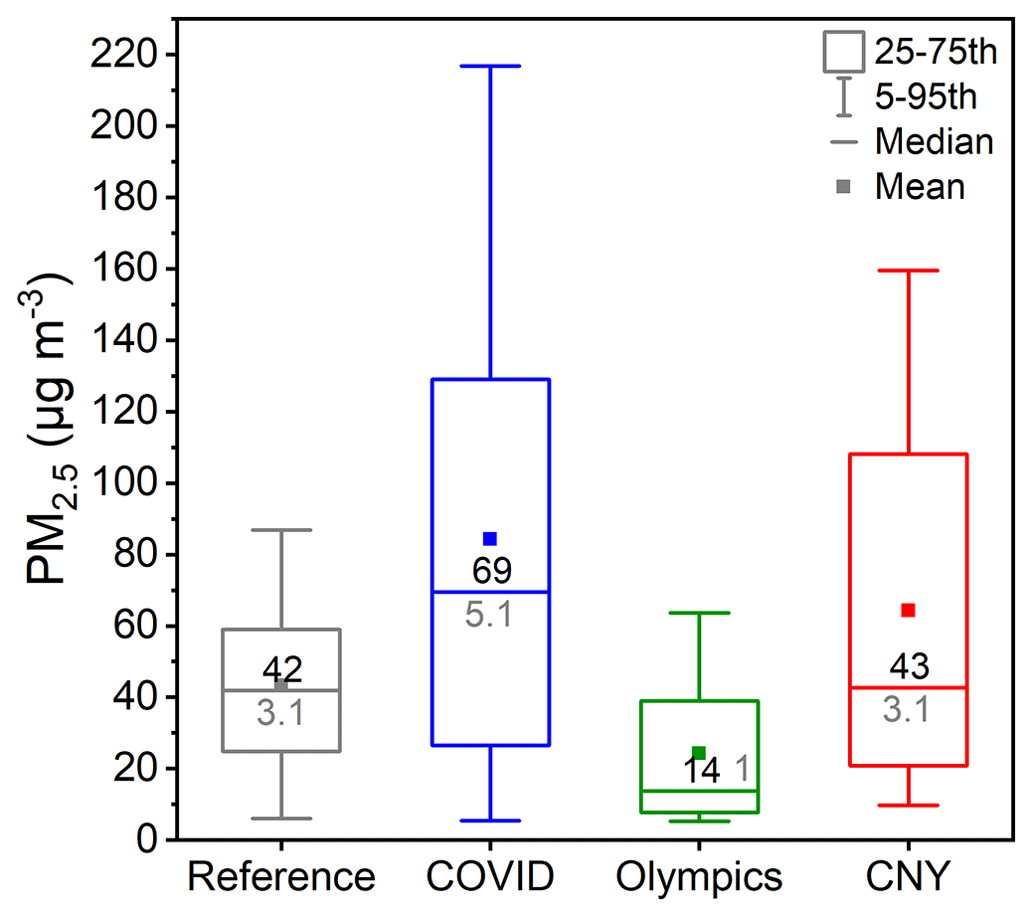
Figure 18PM2.5 mass concentration for reference, COVID, Olympics and CNY periods. The black value inside each box is the median value of corresponding parameter. The gray values are the normalized median values to the lowest median value in each subplot, which is used for quantitative variation comparison between different parameters.
3.2.5 PM2.5 and its composition
The median mass concentration of PM2.5 was the lowest during the Olympics and the highest during COVID, as compared with the other periods (Fig. 18). During the CNY period, the median mass concentration of PM2.5 was the second highest. The differences in the PM2.5 mass concentration between the different periods were not due to different values of the BLH, since the BLH was similar between the COVID and Olympics periods and the highest during the CNY period (Fig. 13e).
Favorable meteorological conditions for transport of clean air mass during the Olympics are one of the main reasons leading to the lowest PM2.5 mass concentration. In contrast, unfavorable meteorological conditions during the COVID and CNY periods worsened air quality during these two periods. As shown in Fig. 12, the wind cycle was obviously different during the Olympics than during the other periods. In urban Beijing, surrounded by mountains to its west, north and northeast, there is a typical wind cycle, with winds tending to come from the north or northwest in the morning and from the south or southeast in the evening. Such a cycle was obvious during the CNY and COVID periods, allowing the transport of polluted air masses to urban Beijing from the south or southeast, thereby leading to severe haze events.
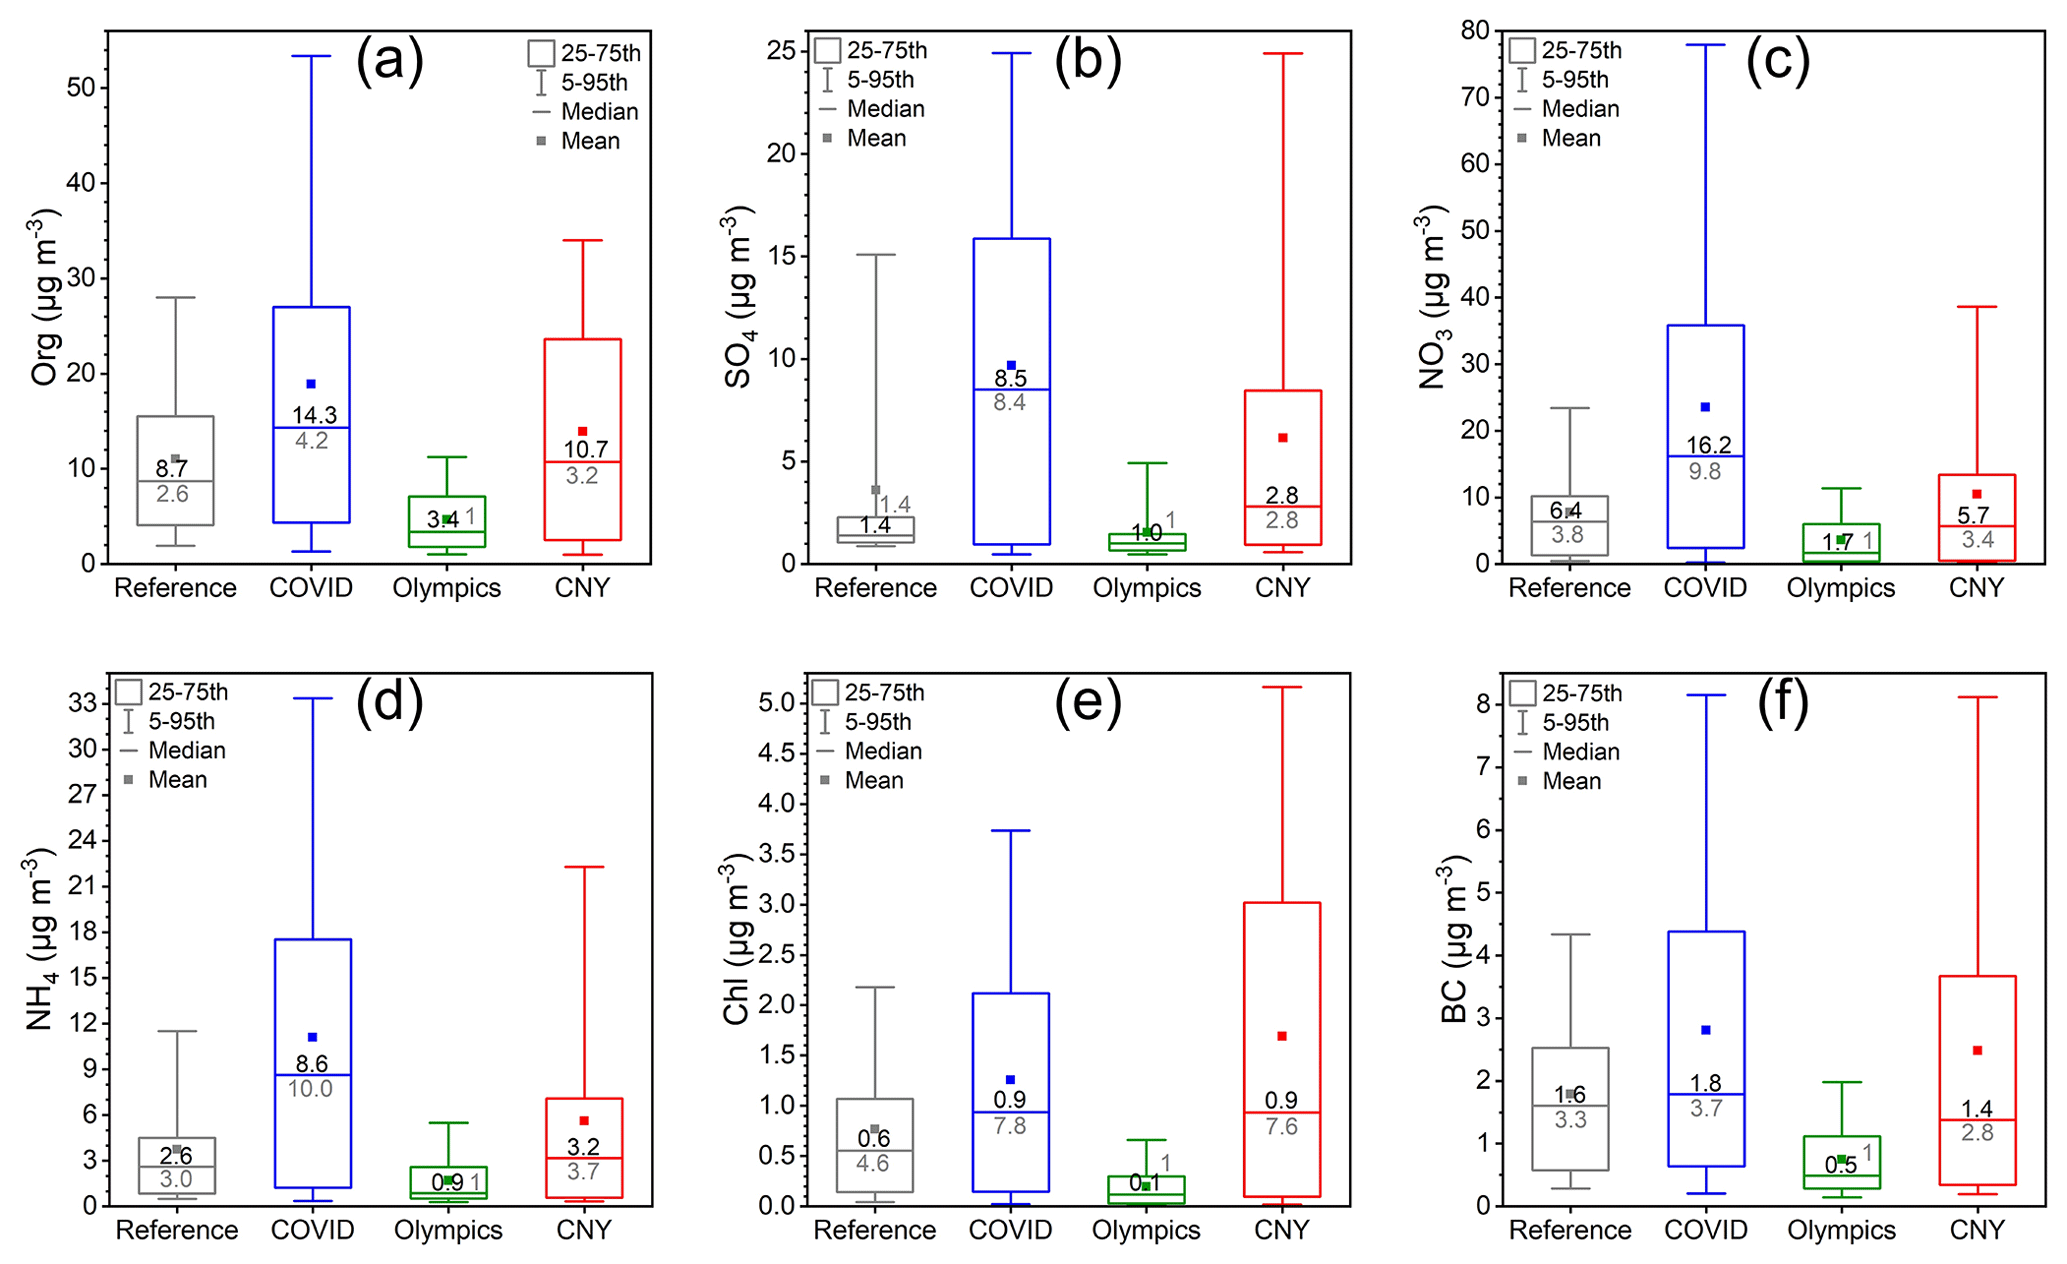
Figure 19Mass concentrations of PM2.5 compositions including (a) organics (Org), (b) sulfate (SO4), (c) nitrate (NO3), (d) ammonium (NH4), (e) chloride (Chl), and (f) black carbon (BC) for reference, COVID, Olympics and CNY periods. The black value inside each box is the median value of corresponding parameter. The gray values are the normalized median values to the lowest median value in each subplot, which is used for quantitative variation comparison between different parameters.
Another reason for the much lower mass concentrations of PM2.5 during the Olympics compared with the reference period was the restriction measures on reducing anthropogenic emissions during this time period. Consistently, there were much lower concentrations of primary particles, i.e., BC and Chl, during the Olympics than during the reference period (Fig. 19). Although strict restrictions were also performed during COVID, BC and Chl concentrations were slightly higher than during the reference period. This should not be interpreted as emission control not being effective during COVID. In fact, BC during COVID was lower than during the reference at the same PM2.5 levels (Fig. 13f). The higher average BC concentration during COVID was associated with the higher frequency of haze episodes during COVID. During CNY, the relatively high primary aerosol concentrations seem to be associated with fireworks.
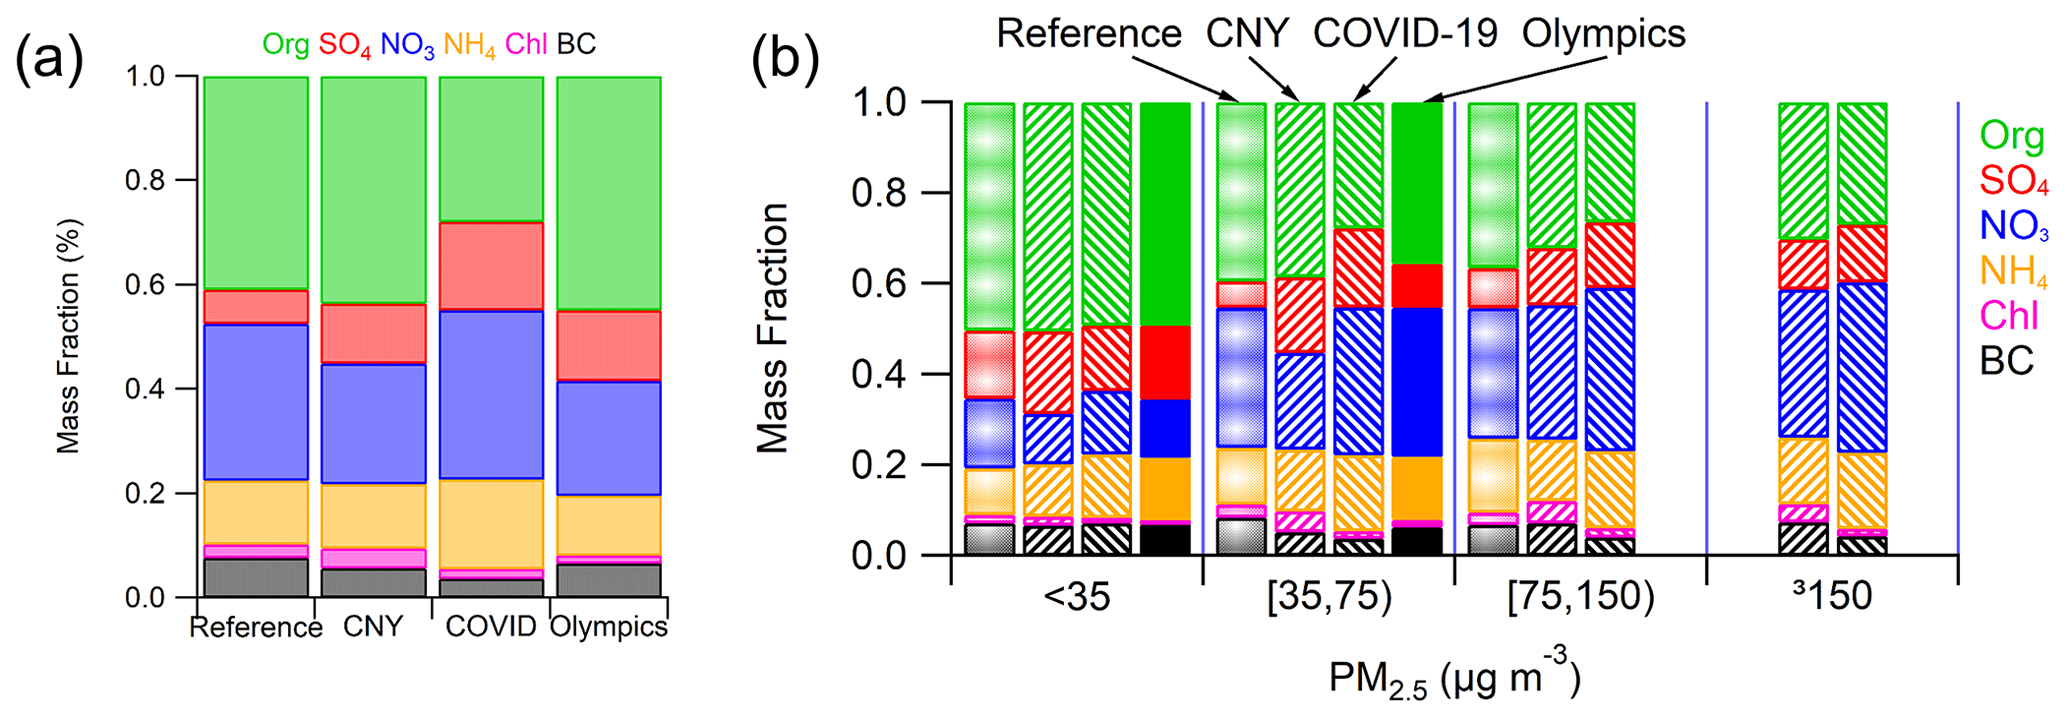
Figure 20Contributions of PM2.5 compositions including organics (Org), sulfate (SO4), nitrate (NO3), ammonium (NH4), chloride (Chl), and black carbon (BC) (a) for reference, COVID, Olympics and CNY periods and (b) under different PM2.5 levels.
Secondary aerosol formation is important in understanding PM2.5 levels as this process is often the main contributor to the particle mass concentration. The much higher fraction of SIA compared to the other components during COVID (Fig. 20a) indicates the enhancement of atmospheric oxidation capacity, which might explain the more severe haze events during this period compared with the other periods. As shown in Fig. 20b, the mass fraction of SIA was much higher during COVID, and when the PM2.5 mass concentration was higher than 35 µg m−3, the mass fraction of SIA reached almost 70 %. The much higher values of RH during COVID could have promoted heterogeneous reactions to produce higher SIA concentrations (Fig. 13b). In addition, nitrate showed higher concentrations and mass fractions when PM2.5 increased from 35 µg m−3 to larger concentrations during COVID than other periods, although there was a reduction in NOx emissions due to strict restrictions on vehicles this period. This phenomenon indicates that secondary formation of nitrate was enhanced and thus contributed to the formation of haze during COVID. In the case of sulfate, although the SO2 concentration was low during COVID, the overall mass concentration and mass fraction of sulfate were higher than during the other periods, which might be associated with the much higher values of RH during COVID. With higher mass concentrations and fractions of nitrate and sulfate, the ammonium was correspondingly higher during COVID than during the other periods.
This study investigated the air quality in the megacity of Beijing during wintertime, with an emphasis on the 4-year changes and the influences of special events (COVID, Olympics and CNY). Numerous variables, including meteorological parameters, concentrations of trace gases, gaseous sulfuric acid and oxygenated organic molecules, and number concentrations of atmospheric particles and ions, as well as PM2.5 and its composition, were systematically analyzed. The comprehensive datasets span the dates from 1 January to 20 February in the years from 2019 to 2022.
In the first part, the 4-year changes of atmospheric parameters were explored, using the datasets from 1 to 22 January. Generally, the meteorological conditions for 2019 and 2020 were similar, where temperature, wind speed and BLH are comparable, and the wind mainly blew from the northwest from night to noon and turned to the south from the afternoon. In 2022, the wind mostly blew from the southeast from midnight to noon and turned to the northeast from the afternoon. The wind speed in that year was a little higher than 2019 and 2020, and the temperature and BLH were slightly lower than 2019 and 2020. In 2021, the wind was mostly from the west or northwest. Thus, the air masses in this year were much cleaner than other 3 years due to the least influence of polluted south air masses. This clean condition in 2021 was also associated with the highest wind speed and the maximum BLH, leading to the strongest atmospheric diffusion capacity. Besides, RH showed an increasing pattern from 2019 to 2022, which may facilitate the formation of secondary aerosols through heterogeneous reactions (Sun et al., 2018).
For conventional gaseous and particulate pollutants, the 4-year changes of CO, NO2, total PM2.5, organic aerosol, chloride and black carbon were generally opposite to those of BLH which decreased from 2019 to 2021 and increased in 2022. The atmospheric conditions of 2021 were also the cleanest. Thus, the atmospheric diffusion capacity and the overall cleanness of the air masses may control the variations of the above pollutants. Unlike them, SO2 monotonically decreased from 2019 (3.06 ppb) to 2022 (0.68 ppb) regardless of the changes in meteorological conditions, suggesting that SO2 emissions and sources decreased year by year. Due to the decline of SO2, particulate sulfate also decreased from 2019 (2.2 µg m−3) to 2022 (1.1 µg m−3). NO in 2022 was around the same as 2021 despite more polluted conditions, indicating that the traffic emission in 2022 might have reduced. For O3, it showed an opposite variation with NO2 as it increased from 2019 (6.3 ppb) to 2021 (15.4 ppb) and dropped in 2022 (8.1 ppb). For nitrate, its contribution to PM2.5 increased from 20 % in 2019 to 28 % in 2022. Moreover, its contribution to PM2.5 was more pronounced during polluted conditions (PM >35 µg m−3), indicating the important role of nitrate in haze formation and the urgent need for significant reductions in NOx emissions.
For unconventional parameters, owing to the reduction of SO2, the concentrations of gaseous sulfuric acid monomer and dimer generally decreased from 2019 (9.6×10⁵ and 2.8×104 cm−3 for sulfuric acid monomer and dimer respectively) to 2022 (4.5×10⁵ and 3.1×103 cm−3 for sulfuric acid monomer and dimer respectively). For total OOMs, however, its concentration decreased from 2019 to 2021 and increased in 2022. This variation was generally opposite to BLH but with larger extent, suggesting that OOM concentration was controlled both by meteorological conditions and local chemical production. Meanwhile, both oxygen and nitrogen contents of gas-phase OOMs increased year by year, implying that not only the oxidation state of those compounds was increased, but also NOx was involved more efficiently in their formation processes. For particles, it was found that with higher SA concentrations and NPF frequencies in 2021 than in 2022, and with the lowest concentrations of background aerosols and the lowest ambient temperatures in 2021, N1.3−3 was still the lowest in 2021. This is out of the scope of conventional understanding, and further studies are needed to explore the reasons behind this phenomenon.
In the second part, the influences of special events, including COVID lockdown, the Beijing Winter Olympics and Chinese New Year, were investigated, using the datasets from 4 to 20 February. The wind direction distribution during the reference, COVID and CNY periods were similar in that the wind mostly blew from the northwest or northeast from midnight to noon and turned to the south or southeast in the afternoon. During the Olympics, however, the dominant wind was from the southwest from midnight to noon, while there was no prevailing wind from the afternoon. Thus, the air masses during the Olympics were the cleanest due to less frequent southerly wind. In addition, there was not too much difference in wind speed and BLH for four periods. One thing that needs to be mentioned is that the RH during COVID was much higher than the other three periods, which should promote the growth of secondary aerosols.
During the Olympics, favored by the clean conditions, most trace gases (CO, NO, NO2 and SO2) and particulate matters (total PM2.5, organic aerosol, nitrate, ammonium, chloride and black carbon) were dramatically reduced compared with the reference period. During COVID, influenced by the extremely polluted conditions, CO and all particulate matter (total PM2.5, organic aerosol, sulfate, nitrate, ammonium, chloride and black carbon) increased a lot. Despite the severe haze, NO and SO2 reduced, and NO2 reduced slightly, suggesting that the restrictions on traffic emission and probably on other production activities were effective in reducing NOx and SO2. Further, the high RH during COVID likely facilitated the gas-to-particle conversion of sulfur- and nitrogen-containing compounds, resulting in particularly high concentrations of sulfate (8.5 µg m−3), nitrate (16.2 µg m−3) and ammonium (8.6 µg m−3). During CNY, affected by unfavorable meteorological conditions, reduced traffic emission and probably other reduced production activities, CO, SO2, total PM2.5, nitrate and black carbon were comparable with the reference period, while NOx reduced; organic aerosol, ammonium and chloride increased; and sulfate increased to a large extent. During that period, O3 had a non-linear relationship with PM2.5 that its concentration first decreased and then increased with increasing PM2.5, which is different from the period of 1–22 January. This suggests that the synergetic control strategy of PM2.5 and O3 should consider the effect of seasonality.
SA and OOMs are secondary products, so their variations were complex and were not directly linked to the changes of meteorology or restriction. The level of SA1 was mainly influenced by CS, SO2 and UVB (Petäjä et al., 2009; Yang et al., 2021). Compared with the reference period, SA1 was comparable during the Olympics, lower during CNY and much lower during COVID. The concentration of SA2 was mainly controlled by SA1 and CS. Compared with the reference period, SA2 during the Olympics and CNY was comparable, while it was much lower during COVID. As the COVID period was the most polluted, the above results suggest that the formation of SA was suppressed under polluted condition. For total OOMs, however, it had the lowest concentration in the Olympics while the highest concentration in COVID, indicating that the level of total OOMs was higher under polluted conditions. Meanwhile, the oxygen content was the highest during the Olympics while the lowest during COVID, which implies the oxidation state of OOMs likely decreased with increasing pollution level. For atmospheric particles, N1.3−3 was almost the same during reference, COVID, Olympics and CNY periods, indicating that the special events may only have little impact on new particle formation processes. However, N100−1000 was significantly lower during the Olympics than other periods, suggesting the significant reduction of anthropogenic emissions during this period.
These results provide useful information on how the air quality in urban Beijing has changed in recent for years and how the air quality was affected by meteorological conditions as well as different emission reduction scenarios. All of these will help in planning more targeted and sustainable long-term pollution control plans.
Datasets for this paper can be accessed at https://doi.org/10.5281/zenodo.7100748 (Guo et al., 2022a).
The supplement related to this article is available online at: https://doi.org/10.5194/acp-23-6663-2023-supplement.
YG, CD, TK, WD and MK designed the research; YG, CD, FZ, YiL, JW, CH, JZ, ZW, JJ, YiZ, TL, YuZ, BS, WM, YoL, CY, and MK collected the data; YG, CD and AO analyzed data with the help from TK, WD, TN, VMK, MX, CY and MK; and YG, CD, TK and WD wrote the paper with inputs from all co-authors.
At least one of the (co-)authors is a member of the editorial board of Atmospheric Chemistry and Physics. The peer-review process was guided by an independent editor, and the authors also have no other competing interests to declare.
Publisher's note: Copernicus Publications remains neutral with regard to jurisdictional claims in published maps and institutional affiliations.
This article is part of the special issue “Pan-Eurasian Experiment (PEEX) – Part II”. It is not associated with a conference.
Technical and scientific staff at the AHL-BUCT laboratory, Beijing, are acknowledged.
This research has been supported by the National Natural Science Foundation of China (grant no. 92044301), the Academy of Finland (grant nos. 337549, 302958, 1325656, 311932, 316114, 332547 and 325647), the Jane ja Aatos Erkon Säätiö (Quantifying carbon sink, CarbonSink+ and their interaction with air quality), the European Research Council, H2020 European Research Council (ATM-GTP (grant no. 742206)) and the Jenny ja Antti Wihurin Rahasto (Air pollution cocktail in Gigacity).
Open-access funding was provided by the Helsinki University Library.
This paper was edited by Paul Zieger and reviewed by two anonymous referees.
An, Z., Huang, R. J., Zhang, R., Tie, X., Li, G., Cao, J., Zhou, W., Shi, Z., Han, Y., Gu, Z., and Ji, Y.: Severe haze in northern China: A synergy of anthropogenic emissions and atmospheric processes, P. Natl. Acad. Sci. USA, 116, 8657–8666, https://doi.org/10.1073/pnas.1900125116, 2019.
Bianchi, F., Kurten, T., Riva, M., Mohr, C., Rissanen, M. P., Roldin, P., Berndt, T., Crounse, J. D., Wennberg, P. O., Mentel, T. F., Wildt, J., Junninen, H., Jokinen, T., Kulmala, M., Worsnop, D. R., Thornton, J. A., Donahue, N., Kjaergaard, H. G., and Ehn, M.: Highly Oxygenated Organic Molecules (HOM) from Gas-Phase Autoxidation Involving Peroxy Radicals: A Key Contributor to Atmospheric Aerosol, Chem. Rev., 119, 3472–3509, https://doi.org/10.1021/acs.chemrev.8b00395, 2019.
Cai, J., Chu, B., Yao, L., Yan, C., Heikkinen, L. M., Zheng, F., Li, C., Fan, X., Zhang, S., Yang, D., Wang, Y., Kokkonen, T. V., Chan, T., Zhou, Y., Dada, L., Liu, Y., He, H., Paasonen, P., Kujansuu, J. T., Petäjä, T., Mohr, C., Kangasluoma, J., Bianchi, F., Sun, Y., Croteau, P. L., Worsnop, D. R., Kerminen, V.-M., Du, W., Kulmala, M., and Daellenbach, K. R.: Size-segregated particle number and mass concentrations from different emission sources in urban Beijing, Atmos. Chem. Phys., 20, 12721–12740, https://doi.org/10.5194/acp-20-12721-2020, 2020.
Cai, R., Yan, C., Yang, D., Yin, R., Lu, Y., Deng, C., Fu, Y., Ruan, J., Li, X., Kontkanen, J., Zhang, Q., Kangasluoma, J., Ma, Y., Hao, J., Worsnop, D. R., Bianchi, F., Paasonen, P., Kerminen, V.-M., Liu, Y., Wang, L., Zheng, J., Kulmala, M., and Jiang, J.: Sulfuric acid–amine nucleation in urban Beijing, Atmos. Chem. Phys., 21, 2457–2468, https://doi.org/10.5194/acp-21-2457-2021, 2021.
Chao, H.-J., Huang, W.-C., Chen, C.-L., Chou, C. C. K., and Hung, H.-M.: Water Adsorption vs Phase Transition of Aerosols Monitored by a Quartz Crystal Microbalance, ACS Omega, 5, 31858–31866, https://doi.org/10.1021/acsomega.0c04698, 2020.
Chen, C., Sun, Y. L., Xu, W. Q., Du, W., Zhou, L. B., Han, T. T., Wang, Q. Q., Fu, P. Q., Wang, Z. F., Gao, Z. Q., Zhang, Q., and Worsnop, D. R.: Characteristics and sources of submicron aerosols above the urban canopy (260 m) in Beijing, China, during the 2014 APEC summit, Atmos. Chem. Phys., 15, 12879–12895, https://doi.org/10.5194/acp-15-12879-2015, 2015.
Cheng, Y., Engling, G., He, K.-B., Duan, F.-K., Ma, Y.-L., Du, Z.-Y., Liu, J.-M., Zheng, M., and Weber, R. J.: Biomass burning contribution to Beijing aerosol, Atmos. Chem. Phys., 13, 7765–7781, https://doi.org/10.5194/acp-13-7765-2013, 2013.
Cheng, Y., Zheng, G., Wei, C., Mu, Q., Zheng, B., Wang, Z., Gao, M., Zhang, Q., He, K., Carmichael, G., Pöschl, U., and Su, H.: Reactive nitrogen chemistry in aerosol water as a source of sulfate during haze events in China, Sci. Adv., 2, e1601530, https://doi.org/10.1126/sciadv.1601530, 2016.
Dada, L., Ylivinkka, I., Baalbaki, R., Li, C., Guo, Y., Yan, C., Yao, L., Sarnela, N., Jokinen, T., Daellenbach, K. R., Yin, R., Deng, C., Chu, B., Nieminen, T., Wang, Y., Lin, Z., Thakur, R. C., Kontkanen, J., Stolzenburg, D., Sipilä, M., Hussein, T., Paasonen, P., Bianchi, F., Salma, I., Weidinger, T., Pikridas, M., Sciare, J., Jiang, J., Liu, Y., Petäjä, T., Kerminen, V.-M., and Kulmala, M.: Sources and sinks driving sulfuric acid concentrations in contrasting environments: implications on proxy calculations, Atmos. Chem. Phys., 20, 11747–11766, https://doi.org/10.5194/acp-20-11747-2020, 2020.
Deng, C., Fu, Y., Dada, L., Yan, C., Cai, R., Yang, D., Zhou, Y., Yin, R., Lu, Y., Li, X., Qiao, X., Fan, X., Nie, W., Kontkanen, J., Kangasluoma, J., Chu, B., Ding, A., Kerminen, V. M., Paasonen, P., Worsnop, D. R., Bianchi, F., Liu, Y., Zheng, J., Wang, L., Kulmala, M., and Jiang, J.: Seasonal Characteristics of New Particle Formation and Growth in Urban Beijing, Environ. Sci. Technol., 54, 8547–8557, https://doi.org/10.1021/acs.est.0c00808, 2020.
Deng, C., Cai, R., Yan, C., Zheng, J., and Jiang, J.: Formation and growth of sub-3 nm particles in megacities: impact of background aerosols, Faraday Discuss., 226, 348–363, https://doi.org/10.1039/d0fd00083c, 2021.
Drewnick, F., Hings, S. S., DeCarlo, P., Jayne, J. T., Gonin, M., Fuhrer, K., Weimer, S., Jimenez, J. L., Demerjian, K. L., Borrmann, S., and Worsnop, D. R.: A new Time-of-Flight Aerosol Mass Spectrometer (ToF-AMS) – Instrument description and first field deployment, Aerosol Sci. Technol., 39, 637–658, https://doi.org/10.1080/02786820500182040, 2005.
Drinovec, L., Močnik, G., Zotter, P., Prévôt, A. S. H., Ruckstuhl, C., Coz, E., Rupakheti, M., Sciare, J., Müller, T., Wiedensohler, A., and Hansen, A. D. A.: The “dual-spot” Aethalometer: an improved measurement of aerosol black carbon with real-time loading compensation, Atmos. Meas. Tech., 8, 1965–1979, https://doi.org/10.5194/amt-8-1965-2015, 2015.
Du, W., Dada, L., Zhao, J., Chen, X., Daellenbach, K. R., Xie, C., Wang, W., He, Y., Cai, J., Yao, L., Zhang, Y., Wang, Q., Xu, W., Wang, Y., Tang, G., Cheng, X., Kokkonen, T. V., Zhou, W., Yan, C., Chu, B., Zha, Q., Hakala, S., Kurppa, M., Järvi, L., Liu, Y., Li, Z., Ge, M., Fu, P., Nie, W., Bianchi, F., Petäjä, T., Paasonen, P., Wang, Z., Worsnop, D. R., Kerminen, V.-M., Kulmala, M., and Sun, Y.: A 3D study on the amplification of regional haze and particle growth by local emissions, npj Climate and Atmospheric Science, 4, 4, https://doi.org/10.1038/s41612-020-00156-5, 2021.
Du, W., Cai, J., Zheng, F., Yan, C., Zhou, Y., Guo, Y., Chu, B., Yao, L., Heikkinen, L. M., Fan, X., Wang, Y., Cai, R., Hakala, S., Chan, T., Kontkanen, J., Tuovinen, S., Petäjä, T., Kangasluoma, J., Bianchi, F., Paasonen, P., Sun, Y., Kerminen, V.-M., Liu, Y., Daellenbach, K. R., Dada, L., and Kulmala, M.: Influence of Aerosol Chemical Composition on Condensation Sink Efficiency and New Particle Formation in Beijing, Environ. Sci. Technol. Lett., 9, 375–382, https://doi.org/10.1021/acs.estlett.2c00159, 2022a.
Du, W., Wang, W., Liu, R., Wang, Y., Zhang, Y., Zhao, J., Dada, L., Xie, C., Wang, Q., Xu, W., Zhou, W., Zhang, F., Li, Z., Fu, P., Li, J., Kangasluoma, J., Wang, Z., Ge, M., Kulmala, M., and Sun, Y.: Insights into vertical differences of particle number size distributions in winter in Beijing, China, Sci. Total Environ., 802, 149695, https://doi.org/10.1016/j.scitotenv.2021.149695, 2022b.
Ehn, M., Thornton, J. A., Kleist, E., Sipilä, M., Junninen, H., Pullinen, I., Springer, M., Rubach, F., Tillmann, R., Lee, B., Lopez-Hilfiker, F., Andres, S., Acir, I.-H., Rissanen, M., Jokinen, T., Schobesberger, S., Kangasluoma, J., Kontkanen, J., Nieminen, T., Kurtén, T., Nielsen, L. B., Jørgensen, S., Kjaergaard, H. G., Canagaratna, M., Maso, M. D., Berndt, T., Petäjä, T., Wahner, A., Kerminen, V.-M., Kulmala, M., Worsnop, D. R., Wildt, J., and Mentel, T. F.: A large source of low-volatility secondary organic aerosol, Nature, 506, 476–479, https://doi.org/10.1038/nature13032, 2014.
Finlayson-Pitts, B. J., and Pitts Jr., J. N. (Eds.): Chemistry of the Upper and Lower Atmosphere: Theory, Experiments, and Applications, Academic Press, San Diego, CA, USA, 298–299 pp., ISBN 9780122570605, 2000.
Foreback, B., Dada, L., Daellenbach, K. R., Yan, C., Wang, L., Chu, B., Zhou, Y., Kokkonen, T. V., Kurppa, M., Pileci, R. E., Wang, Y., Chan, T., Kangasluoma, J., Zhuohui, L., Guo, Y., Li, C., Baalbaki, R., Kujansuu, J., Fan, X., Feng, Z., Rantala, P., Gani, S., Bianchi, F., Kerminen, V.-M., Petäjä, T., Kulmala, M., Liu, Y., and Paasonen, P.: Measurement report: A multi-year study on the impacts of Chinese New Year celebrations on air quality in Beijing, China, Atmos. Chem. Phys., 22, 11089–11104, https://doi.org/10.5194/acp-22-11089-2022, 2022.
Ge, B., Wang, Z., Lin, W., Xu, X., Li, J., Ji, D., and Ma, Z.: Air pollution over the North China Plain and its implication of regional transport: A new sight from the observed evidences, Environ. Pollut., 234, 29–38, https://doi.org/10.1016/j.envpol.2017.10.084, 2018.
Ge, B. Z., Xu, X. B., Lin, W. L., Li, J., and Wang, Z. F.: Impact of the regional transport of urban Beijing pollutants on downwind areas in summer: ozone production efficiency analysis, Tellus B, 64, 17348, https://doi.org/10.3402/tellusb.v64i0.17348, 2012.
Guo, J., Deng, M., Lee, S. S., Wang, F., Li, Z., Zhai, P., Liu, H., Lv, W., Yao, W., and Li, X.: Delaying precipitation and lightning by air pollution over the Pearl River Delta. Part I: Observational analyses, J. Geophys. Res.-Atmos., 121, 6472–6488, https://doi.org/10.1002/2015jd023257, 2016.
Guo, Y., Yan, C., Li, C., Ma, W., Feng, Z., Zhou, Y., Lin, Z., Dada, L., Stolzenburg, D., Yin, R., Kontkanen, J., Daellenbach, K. R., Kangasluoma, J., Yao, L., Chu, B., Wang, Y., Cai, R., Bianchi, F., Liu, Y., and Kulmala, M.: Formation of nighttime sulfuric acid from the ozonolysis of alkenes in Beijing, Atmos. Chem. Phys., 21, 5499–5511, https://doi.org/10.5194/acp-21-5499-2021, 2021.
Guo, Y., Deng, C., Du, W., Kokkonen, T., Ovaska, A., Zheng, F., Hua, C., Zhan, J., Li, Y., Wu, J., Wang, Z., Xie, J., Zhang, Y., Liu, T., Zhang, Y., Song, B., Ma, W., Liu, Y., Yan, C., Jiang, J., Kerminen, V.-M., Xia, M., Nieminen, T., and Kulmala, M.: Measurement Report: Year-to-year Variability and Influence of Winter Olympics and other Special Events on Air Quality in Urban Beijing during Wintertime, Zenodo [data set], https://doi.org/10.5281/zenodo.7100748, 2022a.
Guo, Y., Yan, C., Liu, Y., Qiao, X., Zheng, F., Zhang, Y., Zhou, Y., Li, C., Fan, X., Lin, Z., Feng, Z., Zhang, Y., Zheng, P., Tian, L., Nie, W., Wang, Z., Huang, D., Daellenbach, K. R., Yao, L., Dada, L., Bianchi, F., Jiang, J., Liu, Y., Kerminen, V.-M., and Kulmala, M.: Seasonal variation in oxygenated organic molecules in urban Beijing and their contribution to secondary organic aerosol, Atmos. Chem. Phys., 22, 10077–10097, https://doi.org/10.5194/acp-22-10077-2022, 2022b.
Heinritzi, M., Simon, M., Steiner, G., Wagner, A. C., Kürten, A., Hansel, A., and Curtius, J.: Characterization of the mass-dependent transmission efficiency of a CIMS, Atmos. Meas. Tech., 9, 1449–1460, https://doi.org/10.5194/amt-9-1449-2016, 2016.
Hodas, N., Sullivan, A. P., Skog, K., Keutsch, F. N., Collett, J. L., Decesari, S., Facchini, M. C., Carlton, A. G., Laaksonen, A., and Turpin, B. J.: Aerosol Liquid Water Driven by Anthropogenic Nitrate: Implications for Lifetimes of Water-Soluble Organic Gases and Potential for Secondary Organic Aerosol Formation, Environ. Sci. Technol., 48, 11127–11136, https://doi.org/10.1021/es5025096, 2014.
Hu, S., Zhao, G., Tan, T., Li, C., Zong, T., Xu, N., Zhu, W., and Hu, M.: Current challenges of improving visibility due to increasing nitrate fraction in PM2.5 during the haze days in Beijing, China, Environ. Pollut., 290, 118032, https://doi.org/10.1016/j.envpol.2021.118032, 2021.
Huang, R. J., Zhang, Y., Bozzetti, C., Ho, K. F., Cao, J. J., Han, Y., Daellenbach, K. R., Slowik, J. G., Platt, S. M., Canonaco, F., Zotter, P., Wolf, R., Pieber, S. M., Bruns, E. A., Crippa, M., Ciarelli, G., Piazzalunga, A., Schwikowski, M., Abbaszade, G., Schnelle-Kreis, J., Zimmermann, R., An, Z., Szidat, S., Baltensperger, U., El Haddad, I., and Prevot, A. S.: High secondary aerosol contribution to particulate pollution during haze events in China, Nature, 514, 218–222, https://doi.org/10.1038/nature13774, 2014.
Hung, H.-M., Hsu, C.-H., Lin, W.-T., and Chen, Y.-Q.: A case study of single hygroscopicity parameter and its link to the functional groups and phase transition for urban aerosols in Taipei City, Atmos. Environ., 132, 240–248, https://doi.org/10.1016/j.atmosenv.2016.03.008, 2016.
Jayne, J. T., Leard, D. C., Zhang, X., Davidovits, P., Smith, K. A., Kolb, C. E., and Worsnop, D. R.: Development of an aerosol mass spectrometer for size and composition analysis of submicron particles, Aerosol Sci. Technol., 33, 49–70, https://doi.org/10.1080/027868200410840, 2000.
Jiang, J., Chen, M., Kuang, C., Attoui, M., and McMurry, P. H.: Electrical Mobility Spectrometer Using a Diethylene Glycol Condensation Particle Counter for Measurement of Aerosol Size Distributions Down to 1 nm, Aerosol Sci. Technol., 45, 510–521, https://doi.org/10.1080/02786826.2010.547538, 2011.
Kirkby, J., Curtius, J., Almeida, J., Dunne, E., Duplissy, J., Ehrhart, S., Franchin, A., Gagne, S., Ickes, L., Kuerten, A., Kupc, A., Metzger, A., Riccobono, F., Rondo, L., Schobesberger, S., Tsagkogeorgas, G., Wimmer, D., Amorim, A., Bianchi, F., Breitenlechner, M., David, A., Dommen, J., Downard, A., Ehn, M., Flagan, R. C., Haider, S., Hansel, A., Hauser, D., Jud, W., Junninen, H., Kreissl, F., Kvashin, A., Laaksonen, A., Lehtipalo, K., Lima, J., Lovejoy, E. R., Makhmutov, V., Mathot, S., Mikkila, J., Minginette, P., Mogo, S., Nieminen, T., Onnela, A., Pereira, P., Petaja, T., Schnitzhofer, R., Seinfeld, J. H., Sipila, M., Stozhkov, Y., Stratmann, F., Tome, A., Vanhanen, J., Viisanen, Y., Vrtala, A., Wagner, P. E., Walther, H., Weingartner, E., Wex, H., Winkler, P. M., Carslaw, K. S., Worsnop, D. R., Baltensperger, U., and Kulmala, M.: Role of sulphuric acid, ammonia and galactic cosmic rays in atmospheric aerosol nucleation, Nature, 476, 429–433, https://doi.org/10.1038/nature10343, 2011.
Kohli, R. K. and Davies, J. F.: Measuring the Chemical Evolution of Levitated Particles: A Study on the Evaporation of Multicomponent Organic Aerosol, Anal. Chem., 93, 12472–12479, https://doi.org/10.1021/acs.analchem.1c02890, 2021.
Kulmala, M., Petäjä, T., Mönkkönen, P., Koponen, I. K., Dal Maso, M., Aalto, P. P., Lehtinen, K. E. J., and Kerminen, V.-M.: On the growth of nucleation mode particles: source rates of condensable vapor in polluted and clean environments, Atmos. Chem. Phys., 5, 409–416, https://doi.org/10.5194/acp-5-409-2005, 2005.
Kulmala, M., Petaja, T., Nieminen, T., Sipila, M., Manninen, H. E., Lehtipalo, K., Dal Maso, M., Aalto, P. P., Junninen, H., Paasonen, P., Riipinen, I., Lehtinen, K. E., Laaksonen, A., and Kerminen, V. M.: Measurement of the nucleation of atmospheric aerosol particles, Nature Protocols, 7, 1651–1667, https://doi.org/10.1038/nprot.2012.091, 2012.
Kulmala, M., Kontkanen, J., Junninen, H., Lehtipalo, K., Manninen, H. E., Nieminen, T., Petäjä, T., Sipilä, M., Schobesberger, S., Rantala, P., Franchin, A., Jokinen, T., Järvinen, E., Äijälä, M., Kangasluoma, J., Hakala, J., Aalto, P. P., Paasonen, P., Mikkilä, J., Vanhanen, J., Aalto, J., Hakola, H., Makkonen, U., Ruuskanen, T., Mauldin, R. L., 3rd, Duplissy, J., Vehkamäki, H., Bäck, J., Kortelainen, A., Riipinen, I., Kurtén, T., Johnston, M. V., Smith, J. N., Ehn, M., Mentel, T. F., Lehtinen, K. E., Laaksonen, A., Kerminen, V. M., and Worsnop, D. R.: Direct observations of atmospheric aerosol nucleation, Science, 339, 943–946, https://doi.org/10.1126/science.1227385, 2013.
Kulmala, M., Dada, L., Dällenbach, K., Yan, C., Stolzenburg, D., Kontkanen, J., Ezhova, E., Hakala, S., Tuovinen, S., Kokkonen, T., Kurppa, M., Cai, R., Zhou, Y., Yin, R., Baalbaki, R., Chan, T., Chu, B., Deng, C., Fu, Y., Ge, M., He, H., Heikkinen, L., Junninen, H., Nei, W., Rusanen, A., Vakkari, V., Wang, Y., Wang, L., yao, l., Zheng, J., Kujansuu, J., Kangasluoma, J., Petäjä, T., Paasonen, P., Järvi, L., Worsnop, D., Ding, A., Liu, Y., Jiang, J., Bianchi, F., Yang, G., Liu, Y., Lu, Y., and Kerminen, V.-M.: Is reducing new particle formation a plausible solution to mitigate particulate air pollution in Beijing and other Chinese megacities?, Faraday Discuss., 226, 334–347, https://doi.org/10.1039/d0fd00078g, 2021.
Kulmala, M., Cai, R., Stolzenburg, D., Zhou, Y., Dada, L., Guo, Y., Yan, C., Petaja, T., Jiang, J., and Kerminen, V. M.: The contribution of new particle formation and subsequent growth to haze formation, Environ. Sci.-Atmos., 2, 352–361, https://doi.org/10.1039/d1ea00096a, 2022.
Kürten, A., Rondo, L., Ehrhart, S., and Curtius, J.: Calibration of a chemical ionization mass spectrometer for the measurement of gaseous sulfuric acid, J. Phys. Chem. A, 116, 6375–6386, https://doi.org/10.1021/jp212123n, 2012.
Le, T., Wang, Y., Liu, L., Yang, J., Yung, Y. L., Li, G., and Seinfeld, J. H.: Unexpected air pollution with marked emission reductions during the COVID-19 outbreak in China, Science, 369, 702–706, https://doi.org/10.1126/science.abb7431, 2020.
Li, K., Jacob, D. J., Liao, H., Qiu, Y., Shen, L., Zhai, S., Bates, K. H., Sulprizio, M. P., Song, S., Lu, X., Zhang, Q., Zheng, B., Zhang, Y., Zhang, J., Lee, H. C., and Kuk, S. K.: Ozone pollution in the North China Plain spreading into the late-winter haze season, P. Natl. Acad. Sci. USA, 118, e2015797118, https://doi.org/10.1073/pnas.2015797118, 2021.
Li, Q., Su, G., Li, C., Liu, P., Zhao, X., Zhang, C., Sun, X., Mu, Y., Wu, M., Wang, Q., and Sun, B.: An investigation into the role of VOCs in SOA and ozone production in Beijing, China, Sci. Total Environ., 720, 137536, https://doi.org/10.1016/j.scitotenv.2020.137536, 2020.
Li, W., Shao, L., Wang, W., Li, H., Wang, X., Li, Y., Li, W., Jones, T., and Zhang, D.: Air quality improvement in response to intensified control strategies in Beijing during 2013–2019, Sci. Total Environ., 744, 140776, https://doi.org/10.1016/j.scitotenv.2020.140776, 2020.
Lin, J.-T. and McElroy, M. B.: Detection from space of a reduction in anthropogenic emissions of nitrogen oxides during the Chinese economic downturn, Atmos. Chem. Phys., 11, 8171–8188, https://doi.org/10.5194/acp-11-8171-2011, 2011.
Lin, X., Yuan, Z., Yang, L., Luo, H., and Li, W.: Impact of Extreme Meteorological Events on Ozone in the Pearl River Delta, China, Aerosol Air Qual. Res., 19, 1307–1324, https://doi.org/10.4209/aaqr.2019.01.0027, 2019.
Liu, H., Zhang, M., Han, X., Li, J., and Chen, L.: Episode analysis of regional contributions to tropospheric ozone in Beijing using a regional air quality model, Atmos. Environ., 199, 299–312, https://doi.org/10.1016/j.atmosenv.2018.11.044, 2019.
Liu, J., Jiang, J., Zhang, Q., Deng, J., and Hao, J.: A spectrometer for measuring particle size distributions in the range of 3 nm to 10 µm, Front. Environ. Sci. Eng., 10, 63–72, https://doi.org/10.1007/s11783-014-0754-x, 2016a.
Liu, Y., Wu, Z., Wang, Y., Xiao, Y., Gu, F., Zheng, J., Tan, T., Shang, D., Wu, Y., Zeng, L., Hu, M., Bateman, A. P., and Martin, S. T.: Submicrometer Particles Are in the Liquid State during Heavy Haze Episodes in the Urban Atmosphere of Beijing, China, Environ. Sci. Technol. Lett., 4, 427–432, https://doi.org/10.1021/acs.estlett.7b00352, 2017.
Liu, Y., Yan, C., Feng, Z., Zheng, F., Fan, X., Zhang, Y., Li, C., Zhou, Y., Lin, Z., Guo, Y., Zhang, Y., Ma, L., Zhou, W., Liu, Z., Dada, L., Dällenbach, K., Kontkanen, J., Cai, R., Chan, T., Chu, B., Du, W., Yao, L., Wang, Y., Cai, J., Kangasluoma, J., Kokkonen, T., Kujansuu, J., Rusanen, A., Deng, C., Fu, Y., Yin, R., Li, X., Lu, Y., Liu, Y., Lian, C., Yang, D., Wang, W., Ge, M., Wang, Y., Worsnop, D. R., Junninen, H., He, H., Kerminen, V.-M., Zheng, J., Wang, L., Jiang, J., Petäjä, T., Bianchi, F., and Kulmala, M.: Continuous and comprehensive atmospheric observations in Beijing: A station to understand the complex urban atmospheric environment, Big Earth Data, 4, 295–321, https://doi.org/10.1080/20964471.2020.1798707, 2020.
Liu, Z., Wang, Y., Hu, B., Ji, D., Zhang, J., Wu, F., Wan, X., and Wang, Y.: Source appointment of fine particle number and volume concentration during severe haze pollution in Beijing in January 2013, Environ. Sci. Pollut. Res. Int., 23, 6845–6860, https://doi.org/10.1007/s11356-015-5868-6, 2016b.
Lu, X., Zhang, S., Xing, J., Wang, Y., Chen, W., Ding, D., Wu, Y., Wang, S., Duan, L., and Hao, J.: Progress of Air Pollution Control in China and Its Challenges and Opportunities in the Ecological Civilization Era, Engineering, 6, 1423–1431, https://doi.org/10.1016/j.eng.2020.03.014, 2020.
Ma, Q., Wu, Y., Zhang, D., Wang, X., Xia, Y., Liu, X., Tian, P., Han, Z., Xia, X., Wang, Y., and Zhang, R.: Roles of regional transport and heterogeneous reactions in the PM2.5 increase during winter haze episodes in Beijing, Sci. Total Environ., 599–600, 246–253, https://doi.org/10.1016/j.scitotenv.2017.04.193, 2017.
Manninen, H. E., Mirme, S., Mirme, A., Petäjä, T., and Kulmala, M.: How to reliably detect molecular clusters and nucleation mode particles with Neutral cluster and Air Ion Spectrometer (NAIS), Atmos. Meas. Tech., 9, 3577–3605, https://doi.org/10.5194/amt-9-3577-2016, 2016.
Meng, K., Cheng, X., Xu, X., Qu, X., Ma, C., Zhao, Y., Li, Y., Yang, Y., Zhang, W., and Ding, G.: Spatial-temporal variations of pollutant emission sources inversed by adaptive nudging scheme over Beijing-Tianjin-Hebei region based on the CMAQ model, J. Environ. Sci., 37, 52–60, https://doi.org/10.13671/j.hjkxxb.2016.0240, 2016.
Mirme, S. and Mirme, A.: The mathematical principles and design of the NAIS – a spectrometer for the measurement of cluster ion and nanometer aerosol size distributions, Atmos. Meas. Tech., 6, 1061–1071, https://doi.org/10.5194/amt-6-1061-2013, 2013.
Nie, W., Yan, C., Huang, D. D., Wang, Z., Liu, Y., Qiao, X., Guo, Y., Tian, L., Zheng, P., Xu, Z., Li, Y., Xu, Z., Qi, X., Sun, P., Wang, J., Zheng, F., Li, X., Yin, R., Dallenbach, K. R., Bianchi, F., Petäjä, T., Zhang, Y., Wang, M., Schervish, M., Wang, S., Qiao, L., Wang, Q., Zhou, M., Wang, H., Yu, C., Yao, D., Guo, H., Ye, P., Lee, S., Li, Y. J., Liu, Y., Chi, X., Kerminen, V.-M., Ehn, M., Donahue, N. M., Wang, T., Huang, C., Kulmala, M., Worsnop, D., Jiang, J., and Ding, A.: Secondary organic aerosol formed by condensing anthropogenic vapours over China's megacities, Nat. Geosci., 15, 255–261, https://doi.org/10.1038/s41561-022-00922-5, 2022.
Niu, Y., Yan, Y., Chai, J., Zhang, X., Xu, Y., Duan, X., Wu, J., and Peng, L.: Effects of regional transport from different potential pollution areas on volatile organic compounds (VOCs) in Northern Beijing during non-heating and heating periods, Sci. Total Environ., 836, 155465, https://doi.org/10.1016/j.scitotenv.2022.155465, 2022.
Okuda, T., Matsuura, S., Yamaguchi, D., Umemura, T., Hanada, E., Orihara, H., Tanaka, S., He, K., Ma, Y., Cheng, Y., and Liang, L.: The impact of the pollution control measures for the 2008 Beijing Olympic Games on the chemical composition of aerosols, Atmos. Environ., 45, 2789–2794, https://doi.org/10.1016/j.atmosenv.2011.01.053, 2011.
Paasonen, P., Nieminen, T., Asmi, E., Manninen, H. E., Petäjä, T., Plass-Dülmer, C., Flentje, H., Birmili, W., Wiedensohler, A., Hõrrak, U., Metzger, A., Hamed, A., Laaksonen, A., Facchini, M. C., Kerminen, V.-M., and Kulmala, M.: On the roles of sulphuric acid and low-volatility organic vapours in the initial steps of atmospheric new particle formation, Atmos. Chem. Phys., 10, 11223–11242, https://doi.org/10.5194/acp-10-11223-2010, 2010.
Petäjä, T., Mauldin, III, R. L., Kosciuch, E., McGrath, J., Nieminen, T., Paasonen, P., Boy, M., Adamov, A., Kotiaho, T., and Kulmala, M.: Sulfuric acid and OH concentrations in a boreal forest site, Atmos. Chem. Phys., 9, 7435–7448, https://doi.org/10.5194/acp-9-7435-2009, 2009.
Riedel, T. P., Lin, Y.-H., Budisulistiorini, S. H., Gaston, C. J., Thornton, J. A., Zhang, Z., Vizuete, W., Gold, A., and Surratt, J. D.: Heterogeneous Reactions of Isoprene-Derived Epoxides: Reaction Probabilities and Molar Secondary Organic Aerosol Yield Estimates, Environ. Sci. Technol. Lett., 2, 38–42, https://doi.org/10.1021/ez500406f, 2015.
Schleicher, N., Norra, S., Chen, Y., Chai, F., and Wang, S.: Efficiency of mitigation measures to reduce particulate air pollution – A case study during the Olympic Summer Games 2008 in Beijing, China, Sci. Total Environ., 427–428, 146–158, https://doi.org/10.1016/j.scitotenv.2012.04.004, 2012.
Shang, D., Peng, J., Guo, S., Wu, Z., and Hu, M.: Secondary aerosol formation in winter haze over the Beijing-Tianjin-Hebei Region, China, Front. Environ. Sci. Eng., 15, 34, https://doi.org/10.1007/s11783-020-1326-x, 2020.
Shi, X. and Brasseur, G. P.: The Response in Air Quality to the Reduction of Chinese Economic Activities during the COVID-19 Outbreak, Geophys. Res. Lett., 47, e2020GL088070, https://doi.org/10.1029/2020GL088070, 2020.
Shiraiwa, M., Li, Y., Tsimpidi, A. P., Karydis, V. A., Berkemeier, T., Pandis, S. N., Lelieveld, J., Koop, T., and Pöschl, U.: Global distribution of particle phase state in atmospheric secondary organic aerosols, Nat. Commun., 8, 15002, https://doi.org/10.1038/ncomms15002, 2017.
Shou-bin, F., Gang, T., Gang, L., Yu-hu, H., Jian-ping, Q., and Shui-yuan, C.: Road fugitive dust emission characteristics in Beijing during Olympics Game 2008 in Beijing, China, Atmos. Environ., 43, 6003–6010, https://doi.org/10.1016/j.atmosenv.2009.08.028, 2009.
Sipilä, M., Berndt, T., Petäjä, T., Brus, D., Vanhanen, J., Stratmann, F., Patokoski, J., Mauldin Roy, L., Hyvärinen, A.-P., Lihavainen, H., and Kulmala, M.: The Role of Sulfuric Acid in Atmospheric Nucleation, Science, 327, 1243–1246, https://doi.org/10.1126/science.1180315, 2010.
Sun, J., Liu, L., Xu, L., Wang, Y., Wu, Z., Hu, M., Shi, Z., Li, Y., Zhang, X., Chen, J., and Li, W.: Key Role of Nitrate in Phase Transitions of Urban Particles: Implications of Important Reactive Surfaces for Secondary Aerosol Formation, J. Geophys. Res.-Atmos., 123, 1234–1243, https://doi.org/10.1002/2017JD027264, 2018.
Sun, Y., Wang, Z., Fu, P., Jiang, Q., Yang, T., Li, J., and Ge, X.: The impact of relative humidity on aerosol composition and evolution processes during wintertime in Beijing, China, Atmos. Environ., 77, 927–934, https://doi.org/10.1016/j.atmosenv.2013.06.019, 2013.
Sun, Y., Jiang, Q., Wang, Z., Fu, P., Li, J., Yang, T., and Yin, Y.: Investigation of the sources and evolution processes of severe haze pollution in Beijing in January 2013, J. Geophys. Res., 119, 4380–4398, https://doi.org/10.1002/2014jd021641, 2014.
Sun, Y., Wang, Z., Wild, O., Xu, W., Chen, C., Fu, P., Du, W., Zhou, L., Zhang, Q., Han, T., Wang, Q., Pan, X., Zheng, H., Li, J., Guo, X., Liu, J., and Worsnop, D. R.: “APEC Blue”: Secondary Aerosol Reductions from Emission Controls in Beijing, Sci. Rep.-UK, 6, 20668, https://doi.org/10.1038/srep20668, 2016.
Sun, Y., Lei, L., Zhou, W., Chen, C., He, Y., Sun, J., Li, Z., Xu, W., Wang, Q., Ji, D., Fu, P., Wang, Z., and Worsnop, D. R.: A chemical cocktail during the COVID-19 outbreak in Beijing, China: Insights from six-year aerosol particle composition measurements during the Chinese New Year holiday, Sci. Total Environ., 742, 140739, https://doi.org/10.1016/j.scitotenv.2020.140739, 2020.
Sun, Y. L., Wang, Z. F., Fu, P. Q., Yang, T., Jiang, Q., Dong, H. B., Li, J., and Jia, J. J.: Aerosol composition, sources and processes during wintertime in Beijing, China, Atmos. Chem. Phys., 13, 4577–4592, https://doi.org/10.5194/acp-13-4577-2013, 2013.
Sun, Y. L., Wang, Z. F., Du, W., Zhang, Q., Wang, Q. Q., Fu, P. Q., Pan, X. L., Li, J., Jayne, J., and Worsnop, D. R.: Long-term real-time measurements of aerosol particle composition in Beijing, China: seasonal variations, meteorological effects, and source analysis, Atmos. Chem. Phys., 15, 10149–10165, https://doi.org/10.5194/acp-15-10149-2015, 2015.
Tan, P.-H., Chou, C., Liang, J.-Y., Chou, C. C. K., and Shiu, C.-J.: Air pollution “holiday effect” resulting from the Chinese New Year, Atmos. Environ., 43, 2114–2124, https://doi.org/10.1016/j.atmosenv.2009.01.037, 2009.
Tan, Q., Ge, B., Xu, X., Gan, L., Yang, W., Chen, X., Pan, X., Wang, W., Li, J., and Wang, Z.: Increasing impacts of the relative contributions of regional transport on air pollution in Beijing: Observational evidence, Environ. Pollut., 292, 118407, https://doi.org/10.1016/j.envpol.2021.118407, 2022.
Tan, Z., Lu, K., Dong, H., Hu, M., Li, X., Liu, Y., Lu, S., Shao, M., Su, R., Wang, H., Wu, Y., Wahner, A., and Zhang, Y.: Explicit diagnosis of the local ozone production rate and the ozone-NOx-VOC sensitivities, Sci. Bull., 63, 1067–1076, https://doi.org/10.1016/j.scib.2018.07.001, 2018.
Trostl, J., Chuang, W. K., Gordon, H., Heinritzi, M., Yan, C., Molteni, U., Ahlm, L., Frege, C., Bianchi, F., Wagner, R., Simon, M., Lehtipalo, K., Williamson, C., Craven, J. S., Duplissy, J., Adamov, A., Almeida, J., Bernhammer, A. K., Breitenlechner, M., Brilke, S., Dias, A., Ehrhart, S., Flagan, R. C., Franchin, A., Fuchs, C., Guida, R., Gysel, M., Hansel, A., Hoyle, C. R., Jokinen, T., Junninen, H., Kangasluoma, J., Keskinen, H., Kim, J., Krapf, M., Kurten, A., Laaksonen, A., Lawler, M., Leiminger, M., Mathot, S., Mohler, O., Nieminen, T., Onnela, A., Petaja, T., Piel, F. M., Miettinen, P., Rissanen, M. P., Rondo, L., Sarnela, N., Schobesberger, S., Sengupta, K., Sipila, M., Smith, J. N., Steiner, G., Tome, A., Virtanen, A., Wagner, A. C., Weingartner, E., Wimmer, D., Winkler, P. M., Ye, P., Carslaw, K. S., Curtius, J., Dommen, J., Kirkby, J., Kulmala, M., Riipinen, I., Worsnop, D. R., Donahue, N. M., and Baltensperger, U.: The role of low-volatility organic compounds in initial particle growth in the atmosphere, Nature, 533, 527–531, https://doi.org/10.1038/nature18271, 2016.
Wang, H., Lu, K., Chen, X., Zhu, Q., Chen, Q., Guo, S., Jiang, M., Li, X., Shang, D., Tan, Z., Wu, Y., Wu, Z., Zou, Q., Zheng, Y., Zeng, L., Zhu, T., Hu, M., and Zhang, Y.: High N2O5 Concentrations Observed in Urban Beijing: Implications of a Large Nitrate Formation Pathway, Environ. Sci. Technol. Lett., 4, 416–420, https://doi.org/10.1021/acs.estlett.7b00341, 2017.
Wang, J., Li, J., Ye, J., Zhao, J., Wu, Y., Hu, J., Liu, D., Nie, D., Shen, F., Huang, X., Huang, D. D., Ji, D., Sun, X., Xu, W., Guo, J., Song, S., Qin, Y., Liu, P., Turner, J. R., Lee, H. C., Hwang, S., Liao, H., Martin, S. T., Zhang, Q., Chen, M., Sun, Y., Ge, X., and Jacob, D. J.: Fast sulfate formation from oxidation of SO2 by NO2 and HONO observed in Beijing haze, Nat. Commun., 11, 2844, https://doi.org/10.1038/s41467-020-16683-x, 2020.
Wang, M., Kong, W., Marten, R., He, X. C., Chen, D., Pfeifer, J., Heitto, A., Kontkanen, J., Dada, L., Kurten, A., Yli-Juuti, T., Manninen, H. E., Amanatidis, S., Amorim, A., Baalbaki, R., Baccarini, A., Bell, D. M., Bertozzi, B., Brakling, S., Brilke, S., Murillo, L. C., Chiu, R., Chu, B., De Menezes, L. P., Duplissy, J., Finkenzeller, H., Carracedo, L. G., Granzin, M., Guida, R., Hansel, A., Hofbauer, V., Krechmer, J., Lehtipalo, K., Lamkaddam, H., Lampimaki, M., Lee, C. P., Makhmutov, V., Marie, G., Mathot, S., Mauldin, R. L., Mentler, B., Muller, T., Onnela, A., Partoll, E., Petaja, T., Philippov, M., Pospisilova, V., Ranjithkumar, A., Rissanen, M., Rorup, B., Scholz, W., Shen, J., Simon, M., Sipila, M., Steiner, G., Stolzenburg, D., Tham, Y. J., Tome, A., Wagner, A. C., Wang, D. S., Wang, Y., Weber, S. K., Winkler, P. M., Wlasits, P. J., Wu, Y., Xiao, M., Ye, Q., Zauner-Wieczorek, M., Zhou, X., Volkamer, R., Riipinen, I., Dommen, J., Curtius, J., Baltensperger, U., Kulmala, M., Worsnop, D. R., Kirkby, J., Seinfeld, J. H., El-Haddad, I., Flagan, R. C., and Donahue, N. M.: Rapid growth of new atmospheric particles by nitric acid and ammonia condensation, Nature, 581, 184–189, https://doi.org/10.1038/s41586-020-2270-4, 2020.
Wang, S., Zhao, M., Xing, J., Wu, Y., Zhou, Y., Lei, Y., He, K., Fu, L., and Hao, J.: Quantifying the Air Pollutants Emission Reduction during the 2008 Olympic Games in Beijing, Environ. Sci. Technol., 44, 2490–2496, https://doi.org/10.1021/es9028167, 2010.
Wang, Y., Wang, Q., Ye, J., Yan, M., Qin, Q., Prévôt, A. S. H., and Cao, J.: A Review of Aerosol Chemical Composition and Sources in Representative Regions of China during Wintertime, Atmosphere, 10, 277, https://doi.org/10.3390/atmos10050277, 2019.
Wang, Y., Chen, Y., Wu, Z., Shang, D., Bian, Y., Du, Z., Schmitt, S. H., Su, R., Gkatzelis, G. I., Schlag, P., Hohaus, T., Voliotis, A., Lu, K., Zeng, L., Zhao, C., Alfarra, M. R., McFiggans, G., Wiedensohler, A., Kiendler-Scharr, A., Zhang, Y., and Hu, M.: Mutual promotion between aerosol particle liquid water and particulate nitrate enhancement leads to severe nitrate-dominated particulate matter pollution and low visibility, Atmos. Chem. Phys., 20, 2161–2175, https://doi.org/10.5194/acp-20-2161-2020, 2020a.
Wang, Y., Gao, W., Wang, S., Song, T., Gong, Z., Ji, D., Wang, L., Liu, Z., Tang, G., Huo, Y., Tian, S., Li, J., Li, M., Yang, Y., Chu, B., Petäjä, T., Kerminen, V.-M., He, H., Hao, J., Kulmala, M., Wang, Y., and Zhang, Y.: Contrasting trends of PM2.5 and surface-ozone concentrations in China from 2013 to 2017, Natl. Sci. Rev., 7, 1331–1339, https://doi.org/10.1093/nsr/nwaa032, 2020b.
Wang, Z. B., Hu, M., Wu, Z. J., Yue, D. L., He, L. Y., Huang, X. F., Liu, X. G., and Wiedensohler, A.: Long-term measurements of particle number size distributions and the relationships with air mass history and source apportionment in the summer of Beijing, Atmos. Chem. Phys., 13, 10159–10170, https://doi.org/10.5194/acp-13-10159-2013, 2013.
Wilson, J., Imre, D., Beránek, J., Shrivastava, M., and Zelenyuk, A.: Evaporation Kinetics of Laboratory-Generated Secondary Organic Aerosols at Elevated Relative Humidity, Environ. Sci. Technol., 49, 243–249, https://doi.org/10.1021/es505331d, 2015.
Xiao, C., Chang, M., Guo, P., Gu, M., and Li, Y.: Analysis of air quality characteristics of Beijing-Tianjin-Hebei and its surrounding air pollution transport channel cities in China, J. Environ. Sci. (China), 87, 213–227, https://doi.org/10.1016/j.jes.2019.05.024, 2020.
Xie, Y., Wang, G., Wang, X., Chen, J., Chen, Y., Tang, G., Wang, L., Ge, S., Xue, G., Wang, Y., and Gao, J.: Nitrate-dominated PM2.5 and elevation of particle pH observed in urban Beijing during the winter of 2017, Atmos. Chem. Phys., 20, 5019–5033, https://doi.org/10.5194/acp-20-5019-2020, 2020.
Xu, G., Wang, C., Xu, C., and Bai, P.: Evaluation of air pollutant emissions from scattered coal burning and electric heating in Beijing-Tianjin-Hebei region, Res. Environ. Sci., 29, 1735–1742, 2016.
Xu, Q., Wang, S., Jiang, J., Bhattarai, N., Li, X., Chang, X., Qiu, X., Zheng, M., Hua, Y., and Hao, J.: Nitrate dominates the chemical composition of PM2.5 during haze event in Beijing, China, Sci. Total Environ., 689, 1293–1303, https://doi.org/10.1016/j.scitotenv.2019.06.294, 2019.
Xu, W. Q., Han, T. T., Du, W., Wang, Q. Q., Chen, C., Zhao, J., Zhang, Y. J., Li, J., Fu, P. Q., Wang, Z. F., Worsnop, D. R., and Sun, Y. L.: Effects of Aqueous-Phase and Photochemical Processing on Secondary Organic Aerosol Formation and Evolution in Beijing, China, Environ. Sci. Technol., 51, 762–770, https://doi.org/10.1021/acs.est.6b04498, 2017.
Xue, J., Yuan, Z. B., Lau, A. K. H., and Yu, J. Z.: Insights into factors affecting nitrate in PM2.5 in a polluted high NOx environment through hourly observations and size distribution measurements, J. Geophys. Res.-Atmos., 119, 4888–4902, https://doi.org/10.1002/2013jd021108, 2014.
Yan, C., Yin, R., Lu, Y., Dada, L., Yang, D., Fu, Y., Kontkanen, J., Deng, C., Garmash, O., Ruan, J., Baalbaki, R., Schervish, M., Cai, R., Bloss, M., Chan, T., Chen, T., Chen, Q., Chen, X., Chen, Y., Chu, B., Dällenbach, K., Foreback, B., He, X., Heikkinen, L., Jokinen, T., Junninen, H., Kangasluoma, J., Kokkonen, T., Kurppa, M., Lehtipalo, K., Li, H., Li, H., Li, X., Liu, Y., Ma, Q., Paasonen, P., Rantala, P., Pileci, R. E., Rusanen, A., Sarnela, N., Simonen, P., Wang, S., Wang, W., Wang, Y., Xue, M., Yang, G., Yao, L., Zhou, Y., Kujansuu, J., Petäjä, T., Nie, W., Ma, Y., Ge, M., He, H., Donahue, N. M., Worsnop, D. R., Veli-Matti, K., Wang, L., Liu, Y., Zheng, J., Kulmala, M., Jiang, J., and Bianchi, F.: The synergistic role of sulfuric acid, bases, and oxidized organics governing new-particle formation in Beijing, Geophys. Res. Lett., 48, e2020GL091944, https://doi.org/10.1029/2020GL091944, 2021.
Yan, C., Shen, Y., Stolzenburg, D., Dada, L., Qi, X., Hakala, S., Sundström, A.-M., Guo, Y., Lipponen, A., Kokkonen, T. V., Kontkanen, J., Cai, R., Cai, J., Chan, T., Chen, L., Chu, B., Deng, C., Du, W., Fan, X., He, X.-C., Kangasluoma, J., Kujansuu, J., Kurppa, M., Li, C., Li, Y., Lin, Z., Liu, Y., Liu, Y., Lu, Y., Nie, W., Pulliainen, J., Qiao, X., Wang, Y., Wen, Y., Wu, Y., Yang, G., Yao, L., Yin, R., Zhang, G., Zhang, S., Zheng, F., Zhou, Y., Arola, A., Tamminen, J., Paasonen, P., Sun, Y., Wang, L., Donahue, N. M., Liu, Y., Bianchi, F., Daellenbach, K. R., Worsnop, D. R., Kerminen, V.-M., Petäjä, T., Ding, A., Jiang, J., and Kulmala, M.: The effect of COVID-19 restrictions on atmospheric new particle formation in Beijing, Atmos. Chem. Phys., 22, 12207–12220, https://doi.org/10.5194/acp-22-12207-2022, 2022.
Yang, L., Nie, W., Liu, Y., Xu, Z., Xiao, M., Qi, X., Li, Y., Wang, R., Zou, J., Paasonen, P., Yan, C., Xu, Z., Wang, J., Zhou, C., Yuan, J., Sun, J., Chi, X., Kerminen, V.-M., Kulmala, M., and Ding, A.: Toward building a physical proxy for gas-phase sulfuric acid concentration based on its budget analysis in polluted Yangtze River Delta, East China, Environ. Sci. Technol., 55, 6665–6676, https://doi.org/10.1021/acs.est.1c00738, 2021.
Yao, D., Tang, G., Wang, Y., Yang, Y., Wang, L., Chen, T., He, H., and Wang, Y.: Significant contribution of spring northwest transport to volatile organic compounds in Beijing, J. Environ. Sci., 104, 169–181, https://doi.org/10.1016/j.jes.2020.11.023, 2021.
Yao, D., Tang, G., Sun, J., Wang, Y., Yang, Y., Wang, Y., Liu, B., He, H., and Wang, Y.: Annual nonmethane hydrocarbon trends in Beijing from 2000 to 2019, J. Environ. Sci., 112, 210–217, https://doi.org/10.1016/j.jes.2021.04.017, 2022.
Yao, L., Garmash, O., Bianchi, F., Zheng, J., Yan, C., Kontkanen, J., Junninen, H., Mazon, S. B., Ehn, M., Paasonen, P., Sipila, M., Wang, M. Y., Wang, X. K., Xiao, S., Chen, H. F., Lu, Y. Q., Zhang, B. W., Wang, D. F., Fu, Q. Y., Geng, F. H., Li, L., Wang, H. L., Qiao, L. P., Yang, X., Chen, J. M., Kerminen, V. M., Petaja, T., Worsnop, D. R., Kulmala, M., and Wang, L.: Atmospheric new particle formation from sulfuric acid and amines in a Chinese megacity, Science, 361, 278–281, https://doi.org/10.1126/science.aao4839, 2018.
Yli-Juuti, T., Pajunoja, A., Tikkanen, O.-P., Buchholz, A., Faiola, C., Väisänen, O., Hao, L., Kari, E., Peräkylä, O., Garmash, O., Shiraiwa, M., Ehn, M., Lehtinen, K., and Virtanen, A.: Factors controlling the evaporation of secondary organic aerosol from α-pinene ozonolysis, Geophys. Res. Lett., 44, 2562–2570, https://doi.org/10.1002/2016GL072364, 2017.
Yue, D. L., Hu, M., Zhang, R. Y., Wang, Z. B., Zheng, J., Wu, Z. J., Wiedensohler, A., He, L. Y., Huang, X. F., and Zhu, T.: The roles of sulfuric acid in new particle formation and growth in the mega-city of Beijing, Atmos. Chem. Phys., 10, 4953–4960, https://doi.org/10.5194/acp-10-4953-2010, 2010.
Zhang, R., Wang, G., Guo, S., Zamora, M. L., Ying, Q., Lin, Y., Wang, W., Hu, M., and Wang, Y.: Formation of urban fine particulate matter, Chem. Rev., 115, 3803–3855, https://doi.org/10.1021/acs.chemrev.5b00067, 2015.
Zhang, Y., Vu, T. V., Sun, J., He, J., Shen, X., Lin, W., Zhang, X., Zhong, J., Gao, W., Wang, Y., Fu, T. M., Ma, Y., Li, W., and Shi, Z.: Significant Changes in Chemistry of Fine Particles in Wintertime Beijing from 2007 to 2017: Impact of Clean Air Actions, Environ. Sci. Technol., 54, 1344–1352, https://doi.org/10.1021/acs.est.9b04678, 2020.
Zhao, J., Du, W., Zhang, Y., Wang, Q., Chen, C., Xu, W., Han, T., Wang, Y., Fu, P., Wang, Z., Li, Z., and Sun, Y.: Insights into aerosol chemistry during the 2015 China Victory Day parade: results from simultaneous measurements at ground level and 260 m in Beijing, Atmos. Chem. Phys., 17, 3215–3232, https://doi.org/10.5194/acp-17-3215-2017, 2017.
Zhao, J., Qiu, Y., Zhou, W., Xu, W., Wang, J., Zhang, Y., Li, L., Xie, C., Wang, Q., Du, W., Worsnop, D. R., Canagaratna, M. R., Zhou, L., Ge, X., Fu, P., Li, J., Wang, Z., Donahue, N. M., and Sun, Y.: Organic Aerosol Processing During Winter Severe Haze Episodes in Beijing, J. Geophys. Res.-Atmos., 124, 10248–10263, https://doi.org/10.1029/2019jd030832, 2019.
Zhao, S., Yin, D., Yu, Y., Kang, S., Qin, D., and Dong, L.: PM2.5 and O3 pollution during 2015–2019 over 367 Chinese cities: Spatiotemporal variations, meteorological and topographical impacts, Environ. Pollut., 264, 114694, https://doi.org/10.1016/j.envpol.2020.114694, 2020.
Zhao, Z., Zhou, Z., Russo, A., Du, H., Xiang, J., Zhang, J., and Zhou, C.: Impact of meteorological conditions at multiple scales on ozone concentration in the Yangtze River Delta, Environ. Sci. Pollut. Res., 28, 62991–63007, https://doi.org/10.1007/s11356-021-15160-2, 2021.
Zheng, G. J., Duan, F. K., Su, H., Ma, Y. L., Cheng, Y., Zheng, B., Zhang, Q., Huang, T., Kimoto, T., Chang, D., Pöschl, U., Cheng, Y. F., and He, K. B.: Exploring the severe winter haze in Beijing: the impact of synoptic weather, regional transport and heterogeneous reactions, Atmos. Chem. Phys., 15, 2969–2983, https://doi.org/10.5194/acp-15-2969-2015, 2015.
Zhong, J., Zhang, X., Dong, Y., Wang, Y., Liu, C., Wang, J., Zhang, Y., and Che, H.: Feedback effects of boundary-layer meteorological factors on cumulative explosive growth of PM2.5 during winter heavy pollution episodes in Beijing from 2013 to 2016, Atmos. Chem. Phys., 18, 247–258, https://doi.org/10.5194/acp-18-247-2018, 2018.
Zhou, W., Gao, M., He, Y., Wang, Q., Xie, C., Xu, W., Zhao, J., Du, W., Qiu, Y., Lei, L., Fu, P., Wang, Z., Worsnop, D. R., Zhang, Q., and Sun, Y.: Response of aerosol chemistry to clean air action in Beijing, China: Insights from two-year ACSM measurements and model simulations, Environ. Pollut., 255, 113345, https://doi.org/10.1016/j.envpol.2019.113345, 2019.
Zhou, Y., Dada, L., Liu, Y., Fu, Y., Kangasluoma, J., Chan, T., Yan, C., Chu, B., Daellenbach, K. R., Bianchi, F., Kokkonen, T. V., Liu, Y., Kujansuu, J., Kerminen, V.-M., Petäjä, T., Wang, L., Jiang, J., and Kulmala, M.: Variation of size-segregated particle number concentrations in wintertime Beijing, Atmos. Chem. Phys., 20, 1201–1216, https://doi.org/10.5194/acp-20-1201-2020, 2020.
Zhu, Y., Hu, Q., Gao, M., Zhao, C., Zhang, C., Liu, T., Tian, Y., Yan, L., Su, W., Hong, X., and Liu, C.: Quantifying Contributions of Local Emissions and Regional Transport to NOx in Beijing Using TROPOMI Constrained WRF-Chem Simulation, Remote Sens., 13, 1798, https://doi.org/10.3390/rs13091798, 2021.