the Creative Commons Attribution 4.0 License.
the Creative Commons Attribution 4.0 License.
 | 19 Jun 2023
Implications of differences between recent anthropogenic aerosol emission inventories for diagnosed AOD and radiative forcing from 1990 to 2019
Marianne Tronstad Lund
Gunnar Myhre
Ragnhild Bieltvedt Skeie
Bjørn Hallvard Samset
Zbigniew Klimont
This study focuses on implications of differences between recent global emissions inventories for simulated trends in anthropogenic aerosol abundances and radiative forcing (RF) over the 1990–2019 period. We use the ECLIPSE version 6 (ECLv6) and CEDS year 2021 release (CEDS21) as input to the chemical transport model OsloCTM3 and compare the resulting aerosol evolution to corresponding results derived with the first CEDS release, as well as to observed trends in regional and global aerosol optical depth (AOD). Using CEDS21 and ECLv6 results in a 3 % and 6 % lower global mean AOD compared to CEDS in 2014, primarily driven by differences over China and India, where the area average AOD is up to 30 % lower. These differences are considerably larger than the satellite-derived interannual variability in AOD. A negative linear trend over 2005–2017 in global AOD following changes in anthropogenic emissions is found with all three inventories but is markedly stronger with CEDS21 and ECLv6. Furthermore, we confirm that the model better captures the sign and strength of the observed AOD trend over China with CEDS21 and ECLv6 compared to using CEDS, while the opposite is the case for South Asia. We estimate a net global mean aerosol-induced RF in 2014 relative to 1990 of 0.08 W m−2 for CEDS21 and 0.12 W m−2 for ECLv6, compared to 0.03 W m−2 with CEDS. Using CEDS21, we also estimate the RF in 2019 relative to 1990 to be 0.10 W m−2, reflecting the continuing decreasing trend in aerosol loads post-2014. Our results facilitate more rigorous comparison between existing and upcoming studies of climate and health effects of aerosols using different emission inventories.
- Article
(5424 KB) - Full-text XML
-
Supplement
(3172 KB) - BibTeX
- EndNote


Human activities have led to a substantial increase in atmospheric abundances of aerosols relative to pre-industrial conditions. While increasing emissions of greenhouse gases is the dominant driver of recent global warming, aerosols play a key role in shaping regional and global climate through their interactions with radiation and clouds. The Sixth Assessment Report (AR6) of the Intergovernmental Panel on Climate Change (IPCC) estimates that changes in atmospheric aerosols have contributed an effective radiative forcing (ERF) of −1.3 W m−2 over the industrial era (1750–2014), albeit with a wide uncertainty range of −2.0 to −0.6 W m−2 (Forster et al., 2021).
Over recent decades, anthropogenic emissions of aerosols and their precursor gases have changed rapidly, with substantial spatiotemporal heterogeneity, particularly in Asia. Following decades of rapid economic growth in China, the combustion of coal, other fossil fuels, and biofuels increased considerably, resulting in the region becoming the dominant source of air pollution emissions. However, since the adoption of national action plans targeting particulate matter levels (i.e., Air Pollution Prevention and Control in 2013 (SCPRC, 2013) and Winning the Blue Sky Defense Battle in 2018; SCPRC, 2018), emissions of sulfur dioxide (SO2) and then nitrogen oxide (NOx) in China have declined rapidly (Klimont et al., 2013, 2017; Tong et al., 2020; Zheng et al., 2018). Recent studies suggest that black carbon (BC) emissions are also declining (Kanaya et al., 2020; Zheng et al., 2018). A strong growth in emissions of SO2 and other pollutants has been seen in South Asia (Kurokawa and Ohara, 2020), resulting, according to studies, in India overtaking China as the dominant emitter of SO2 (Li et al., 2017). These contrasting trends have given rise to a distinct dipole pattern of increasing and declining aerosol optical depth over South and East Asia, respectively, visible in satellite data (Samset et al., 2019). Such rapid changes are likely to affect the climate of the regions, as aerosols have been shown to have a notable influence on regional temperature and precipitation, including extremes (e.g., Bollasina et al., 2011; Hegerl et al., 2019; Marvel et al., 2020; Samset et al., 2018; Sillmann et al., 2013), with different responses to scattering and absorbing aerosols. However, the exact nature and magnitude of such climate implications need to be better quantified (Persad et al., 2022).
Robust quantification of the impacts of aerosols requires reliable and consistent estimates of anthropogenic emissions. However, currently there exist substantial differences, in both magnitudes and trends, between available emission inventories (e.g., Crippa et al., 2018; Elguindi et al., 2020; Smith et al., 2022). Emission inventories are quantifications of contributions from various industrial processes or other anthropogenic activities to the rate of emissions of various compounds to the atmosphere. They generally combine bottom-up information such as reported economic activities with direct observations and process modeling and are used extensively in essentially all efforts to quantify climate and air quality implications of human activities. While the overall scientific uncertainty on aerosol-induced global mean radiative forcing (RF) is larger than the estimated regional changes, the uncertainty also varies over recent decades depending on the overall level of emissions and their location relative to cloud decks and other climate features (Bellouin et al., 2020; Regayre et al., 2014; Samset et al., 2019; Szopa et al., 2021). Hence, understanding both the inherent inventory differences and the implications of these for downstream calculations and modeled quantities such as aerosol optical depths and radiative forcing is crucial.
As an example, a critical issue that has recently been highlighted is a notable underestimation of the decline in Chinese emissions of SO2 and NOx and overestimation of carbonaceous aerosol emissions in Asia and Africa in the Community Emissions Data System (CEDS) developed for the sixth cycle of the Coupled Model Intercomparison Project (CMIP6) (Szopa et al., 2021). Recent work has shown that results from the CMIP6 experiments fail to fully capture the observed recent trends in aerosol optical depth (AOD) in Asia (Cherian and Quaas, 2020; Ramachandran et al., 2022; Su et al., 2021; Wang et al., 2021), with the discrepancy largely attributed to the misrepresentation of emissions in the region in the last decade of the historical CMIP6 period. Other studies demonstrate that the poor representation of observed aerosol trends can propagate to further uncertainties in attribution of aerosol-induced impacts, such as the East Asian monsoon (Wang et al., 2022) and health impacts (Cheng et al., 2021). In addition to CMIP6, the CEDS emissions have also been used in individual model studies of historical aerosol evolution, radiative forcing, sector attribution, and air quality assessments (e.g., Bauer et al., 2020; Chowdhury et al., 2022; Lund et al., 2018, 2020; Paulot et al., 2018). Moreover, uncertainties and biases in the baseline historical inventory may influence scenario-based assessments of near-term future regional climate risk.
Since the initial parts of the CMIP6 exercise, the CEDS inventory has undergone several revisions. The most recent version from 2021, covering the period up to 2019, exhibits several key differences compared to the initial release – for some species all the way back to the early 2000s. More specifically, emissions of BC, OC, and NOx are all substantially lower in the update, in global totals and, particularly, in Asia, and the decreasing trend in Chinese SO2 is more pronounced. However, the implications of these differences in input data for simulated anthropogenic aerosol distributions, globally and regionally, and the resulting radiative forcing have not been fully quantified and cannot be directly extrapolated. Furthermore, as the update to CEDS came too late for uptake in IPCC AR6, it is pertinent to ask if the influence of these emission inventory differences affected the assessed evolution of atmospheric aerosol trends and subsequent climate implications.
Here, we present an investigation of the implications of known differences in recent emission inventories for quantified aerosol burdens, optical depth, and radiative forcing, over the period 1990–2019. Using the chemical transport model OsloCTM3, we perform simulations with the CEDS21 emission inventory and compare it to previously published results derived from the original CEDS release (Lund et al., 2018, 2019). We also perform simulations with a third recent global inventory, the Evaluating the Climate and Air Quality Impacts of Short-Lived Pollutants (ECLIPSE) version 6b, where emissions are similar in evolution but generally even lower than in CEDS21, especially in the most recent period. We explore the differences in the simulated evolution of global and regional anthropogenic aerosol loads between experiments using the different inventories, comparing optical depth to remote sensing observations, and quantify the resulting radiative forcing. Our aims are to document the model's ability to represent recent observed aerosol trends and to quantify the implications of differences in inventories available to the community for downstream diagnosed quantities critical for assessing the air quality and climate implications of anthropogenic aerosol.
Atmospheric concentrations of aerosols are simulated with the global chemical transport model OsloCTM3 (Lund et al., 2018; Søvde et al., 2012). The model is driven by meteorological data from the European Centre for Medium-Range Weather Forecast (ECMWF) OpenIFS model updated every 3 h and is run in a 2.25∘ × 2.25∘ horizontal resolution, with 60 vertical levels (the uppermost centered at 0.1 hPa). OsloCTM3 treats tropospheric and stratospheric chemistry, as well as modules for carbonaceous, secondary organic, sulfate, ammonium nitrate, sea salt, and dust aerosols. Aerosols are scavenged by convective and large-scale rain (ice and liquid phase), with rainfall calculated from ECMWF data for convective activity, cloud fraction, and rainfall. Dry deposition applies prescribed deposition velocities for different land cover types. For further details we refer to Lund et al. (2018) and Søvde et al. (2012).
The aerosol optical depth (AOD) and instantaneous top-of-atmosphere radiative forcing due to aerosol–radiation interactions (RFari) are calculated offline using a multi-stream model with the discrete ordinate method DISORT (Myhre et al., 2013; Stamnes et al., 1988). The same radiative transfer model is also used to estimate the radiative forcing of aerosol–cloud interactions (RFaci) (earlier denoted the cloud albedo effect or Twomey effect). To account for the change in cloud droplet concentration resulting from anthropogenic aerosols, which alter the cloud effective radius and thus the optical properties of the clouds, the approach from Quaas et al. (2006) is used. Briefly, this approach is based on a statistical relationship between cloud droplet number concentrations and fine-mode AOD derived from satellite data from the MODerate Resolution Imaging Spectroradiometer (MODIS).
Modeled AOD is compared with retrievals from the MODIS instrument on the Aqua satellite, which is available for the period 2003–2020 (MOD08, 2018). We use the combined Dark Target and Deep Blue AOD at 550 nm, release version MOD08 M3 v6.1, downloaded from NASA's Giovanni interface. The MODIS Terra AOD is also available for the same period and is, for most years, around 10 % lower than MODIS Aqua on a global average. However, based on previous evaluations of the MODIS AOD and a reported drift in the Terra data (Levy et al., 2010; Sherman et al., 2017), we choose to use MODIS Aqua for the model comparison in the current study. Temporal trends in the simulated and observed AOD are estimated on a global mean and grid point basis by linear least-square fitting and defined as statistically significant (from no trend) when the linear Pearson correlation coefficient is significant at the 0.05 level. To minimize the influence of individual years, e.g., with higher biomass burning influence, we calculate a set of trends removing one year at a time from the sample and then take the average of this set of coefficients. Interannual variability is estimated on a grid point basis as the standard deviation of the residual when subtracting a 10-year boxcar average (with mirrored data around the end points). We also compare modeled AOD with ground-based measurements from the AErosol RObotic NETwork (AERONET) (Holben et al., 1998) version 3 level-2.0 retrievals at 500 nm. The comparison uses all available data from all months and stations for a given year, with modeled AOD linearly interpolated to the latitude and longitude of each station.
Five different time series of simulated aerosol distributions covering the 1990–2019 period are included in this analysis, using three different emission inventories and either fixed or actual (i.e., corresponding to the emission year) meteorology. The fixed meteorology runs form the basis for investigating differences in simulated anthropogenic aerosol and corresponding RF, while the latter is used in the comparison with observed AOD. Table 1 provides a summary of the experiments.
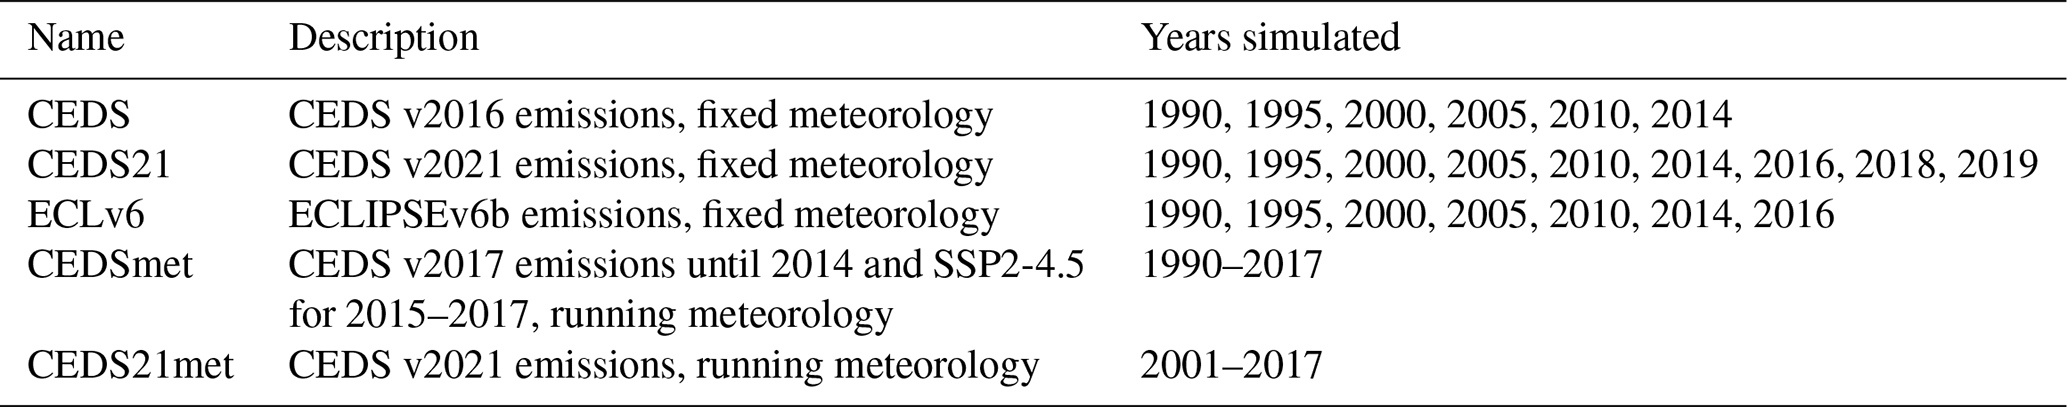
Two sets of fixed meteorology simulations are performed using anthropogenic emissions from CEDS version 2021 (O'Rourke et al., 2021) (CEDS21) and ECLIPSEv6b (ECLv6) inventories. The ECLv6 emissions are developed with the Greenhouse Gas–Air Pollution Interactions and Synergies (GAINS) model (Amann et al., 2011). Version 6b (IIASA, 2022) consists of gridded aerosol and reactive gas emissions in 5-year intervals over the period 1990–2015, as well as emissions for 2008, 2009, 2014, and 2016. The Community Emissions Data System (CEDS) inventory has provided a gridded inventory of anthropogenic greenhouse gas, reactive gases, and aerosols since 1750 (Hoesly et al., 2018). In the first release, the most recent year was 2014, while the 2021 release covers the period until 2019. Simulations are performed for 1990, 1995, 2000, 2005, 2010, 2014, and 2016 emissions, as well as the years 2018 and 2019 for CEDS21. Results from the current study are compared with previously published results from simulations over 1990 to 2014 performed with the first release of the CEDS emissions (Lund et al., 2018) and three of the Shared Socioeconomic Pathway (SSP) scenarios (SSP1-1.9, SSP2-4.5, and SSP3-7.0) from 2015 to 2100 (here we use data for 2020 and 2030) (Lund et al., 2019). These three scenarios broadly span the range of aerosol and precursor emissions projected in the SSPs. In line with the experimental design in Lund et al. (2018), we use the year 2010 meteorological data, and each simulation is run for 1 year, with 6 months' spin-up. All three time series use biomass burning emissions from van Marle et al. (2017) from 1990 to 2014 and the Global Fire Emissions Database version 4 (GFED4, Randerson et al., 2017) thereafter. We note that van Marle et al.'s (2017) emissions are also based on GFED. Other natural emissions (dust and sea salt aerosols, precursor gases from the ocean, soil, and vegetation) are fixed at the year 2010 levels.
For the comparison with MODIS data, we use a time series of OsloCTM3 simulations with CEDS emissions and actual meteorology covering the period 1990–2017 (the last 3 years use Shared Socioeconomic Pathway (SSP) 2-4.5 emissions (Fricko et al., 2017) linearly interpolated between 2015 and 2020) (hereafter CEDSmet). These simulations were originally performed for phase III of the AeroCom project (e.g., Gliß et al., 2021). For the present study, we also produce an updated version covering the 2001–2017 period using CEDS version 2021 emissions (hereafter CEDS21met). While differences in emissions also exist in the years prior, we restrict the use of resources by only going back to the start of the MODIS record, covering the period when the differences are most pronounced. In these simulations, the other natural aerosol emissions also vary following the meteorological year.
Here we first document the differences in simulated global and regional aerosol abundances and trends arising from the spread between emission inventories. We then investigate how AOD diagnosed from experiments using old and new emission estimates compare with observed AOD. Finally, we present updated estimates of radiative forcing relative to 1990.
3.1 Influence of emission inventory differences on simulated aerosol distributions
Figure 1 shows global total emissions of SO2, BC, OC, NOx, ammonium (NH3), and non-methane volatile organic compound (NMVOC) over the 1990–2019 period in the inventories used here. The differences are particularly pronounced after 2005. Both ECLv6 and CEDS21 show substantially lower emissions of most species during this period, relative to CEDS. In 2014, the largest relative differences between CEDS21 and CEDS are in BC and OC emissions, where CEDS21 is 20 %–30 % lower. For SO2, NOx, and NMVOC, the corresponding number is approximately 10 %. ECLv6 is generally lower than both CEDS inventories, particularly for SO2 and NMVOC, by about 30 %. While not used in this study, we also note that similar differences have also been found between CEDS and two other recent global inventories, the Emissions Database for Global Atmospheric Research (EDGAR) version 5 (Crippa et al., 2020) and Hemispheric Transport of Air Pollution (HTAP) version 3 (Crippa et al., 2022).
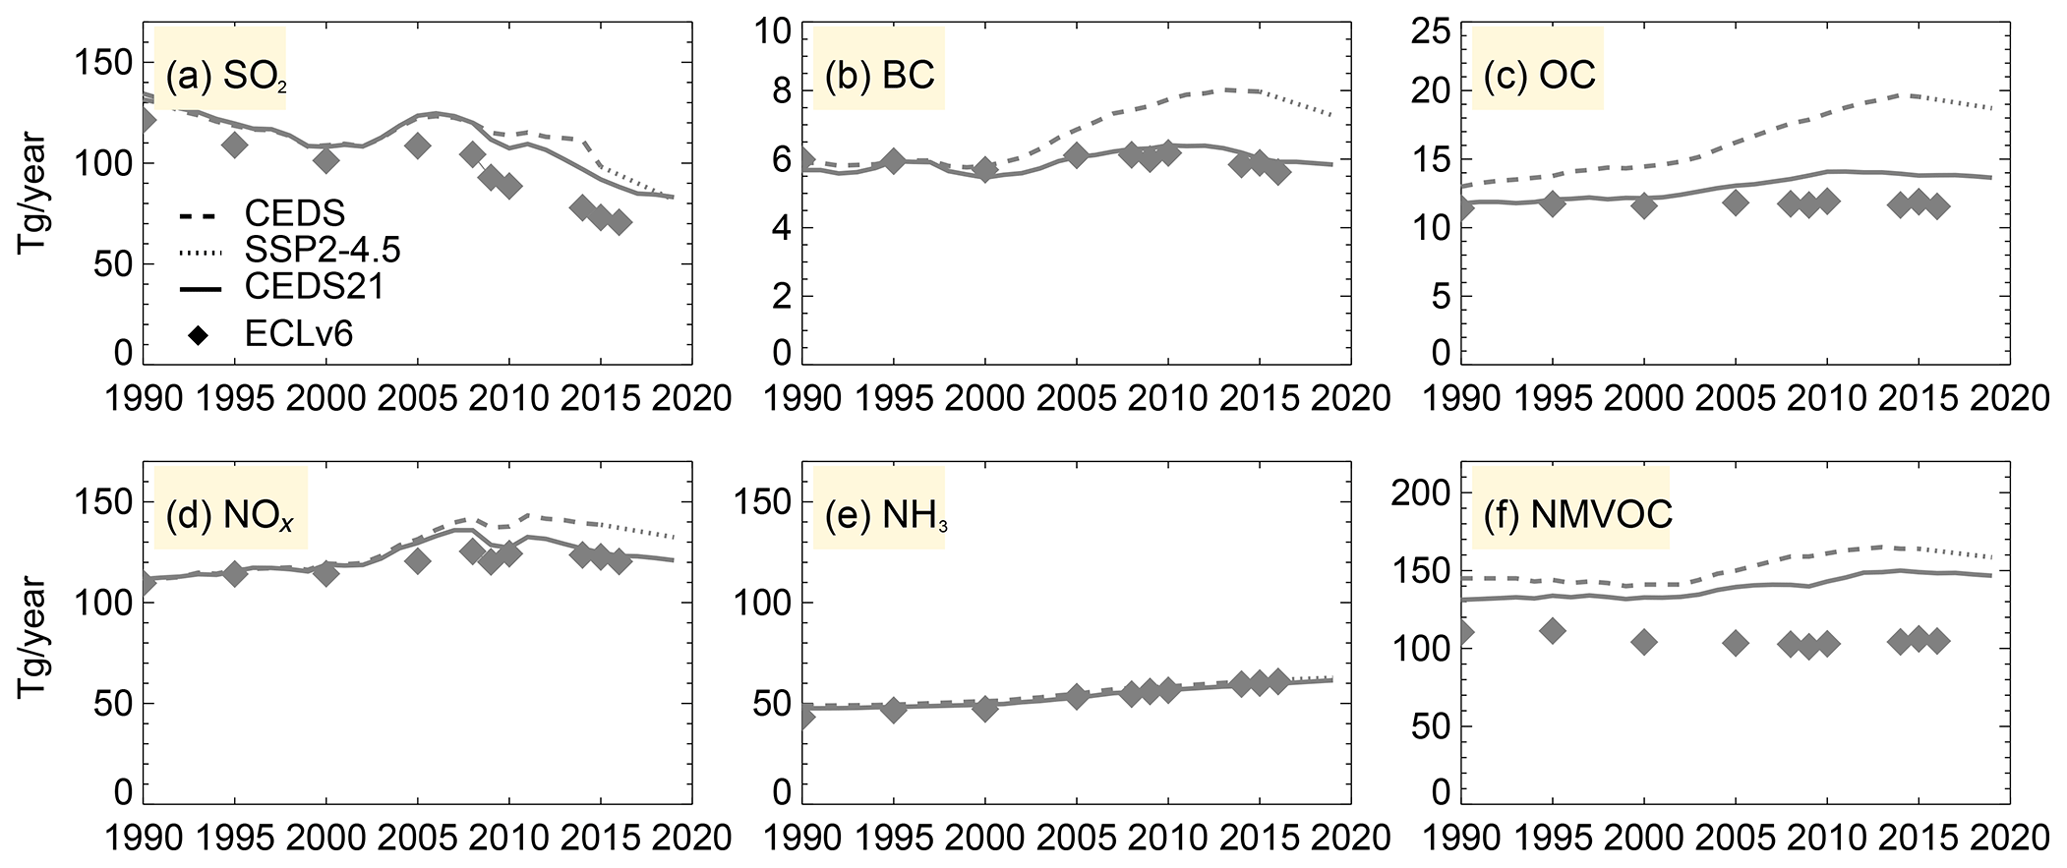
Figure 1Global total anthropogenic emissions of SO2, BC, OC, NOx, NH3, and NMVOC in the CEDS21, ECLv6, and CEDS inventories for the period 1990 to the most recent inventory year (2019, 2016, and 2014, respectively). Dotted lines show emissions from the SSP2-4.5 scenario, linearly interpolated from 2015 to 2019.
Important geographical distinctions underlie these global differences, as demonstrated in Fig. S1 for selected main source regions. While a comprehensive investigation of causes for the inventory differences is beyond the scope of the present study, and can be difficult due to the number of underlying assumptions, input data, and revisions, we discuss some key features here. All three inventories rely on the energy statistical data from the International Energy Agency (IEA); however, there are differences in assumptions about emission rates, implementation of policies, and data on non-energy sources. The ECLv6 estimates include explicit representation of air quality policies and their implementation efficiency, drawing on national information and, if not available, extrapolation of trends considering capacity replacement (e.g., new vehicles, newly built power plant capacity) and emission performance of these new technologies. The result is, among other things, estimated faster decline of SO2 and NOx emissions from power and industry (in turn in total emissions) in China over recent years than in CEDS (Fig. S1a, d). This decline has also been confirmed in Zheng et al. (2018). CEDS21 made a correction to CEDS, mirroring the estimates in the GAINS model for ECLv6. In South Asia, dominated by India, ECLv6 and CEDS21 show a difference similar to CEDS emissions in SO2 and NOx, representing the use of updated emission characteristics for coal power plants. India has had a slower economic growth and less heavy industry than China. While some policies aimed at controlling NOx from transport have been introduced, the limited polices in the power and industry sector have resulted in increasing Indian SO2 and NOx emissions, but the growth has been slower than that in China in the 2000s. For BC and OC (Fig. S1b, c), the largest inventory differences are found in East Asia, mainly China, owing to differences in estimates of emissions from coal use in industries, with ECLv6 applying the lowest emission factors, and from open burning of municipal waste. For the latter category, CEDS has originally relied on the rather high estimates of waste generation and share of generated waste that is burnt (using Wiedinmyer et al., 2014), while ECLv6 used independently estimated generation rates (Gómez-Sanabria et al., 2022). The declining BC trends in East Asia, as shown in ECLv6 and CEDS21, have been supported by measurements (e.g., Kanaya et al., 2020). Estimates for some species, e.g., NH3, are often based on very similar sources of information, as, apart from in Europe and North America, these have received less attention from policymakers and measurement (emissions) communities. Consequently, estimates are similar across all inventories at the aggregated regional level (Fig. S1e). Aside from East and South Asia, the overall temporal evolution is generally similar in the main source regions across inventories, although magnitudes can differ.
3.1.1 Global and regional aerosol burdens in 2014
The differences between inventories are substantial enough to influence simulated aerosol burdens (i.e., column-integrated aerosol mass, in mg m−2) at the global mean level. For 2014, i.e., the most recent common year for all three emission inventories, we estimate 4 % and 8 % lower global mean burdens of total BC when using CEDS21 and ECLv6 (6 % and 11 % if considering aerosols only from fossil fuel and biofuel combustion), respectively, compared to CEDS (Table S1). For primary organic aerosol (POA), the corresponding numbers are 11 % and 13 % (30 % and 40 %), while the global mean total sulfate burden is 8 % and 15 % lower with CEDS21 and ECLv6. Smaller reductions of the order of 3 %–4 % are also seen in the global mean SOA burden. Biogenic VOC emissions, the main source of SOA, are the same in all simulations. However, the SOA abundance is affected by the lower emissions of anthropogenic VOCs in both CEDS21 and ECLv6 than in CEDS (Fig. 1), as well as by the lower amount of POAs, which serve as substrates for SOA formation.
For all these aerosol species, the burden differences are consistently the largest over East Asia, followed by South Asia, and larger for ECLv6 than for CEDS21. Figure 2 shows the absolute regional mean burden (with corresponding relative changes given in Fig. S3). Regions considered are East Asia (EAS), South Asia (SAS), sub-Saharan Africa (SAF), North America (NAM), South America (SAM), North Africa and the Middle East (NAF), Europe (EUR), Southeast Asia (SEA), and Russia (RBU) (see also Fig. S2). For EAS, the new simulated burden of BC and POA is 30 %–40 % lower, depending on inventory, compared to simulations using CEDS, following 50 %–60 % lower BC and OC emissions. The 40 %–50 % lower SO2 emissions translate to a 20 %–30 % lower regional sulfate burden in our simulations. A similar relationship between emission and burden differences is simulated for SAS, where the burdens of BC, POA, and sulfate are 6 %, 27 %, and 30 % lower, respectively, in experiments with ECLv6 than with CEDS. Lower burdens of sulfate and POA are simulated for all other regions as well and in particular over NAF with ECLv6. In some regions, like SAM, NAF, and SAF, the new inventories estimate 20 %–30 % lower BC emissions than CEDS; however, due to the lower absolute magnitudes, the simulated burden differences are small compared to other aerosols. We note that regional burdens can be influenced by long-range transport and thus affected by inventory differences outside the main source region. We also note that we find differences in surface concentrations between simulations that are broadly similar to the burden changes. While beyond the scope of the present study, this may have implications for assessments of air-pollution-related health impacts.
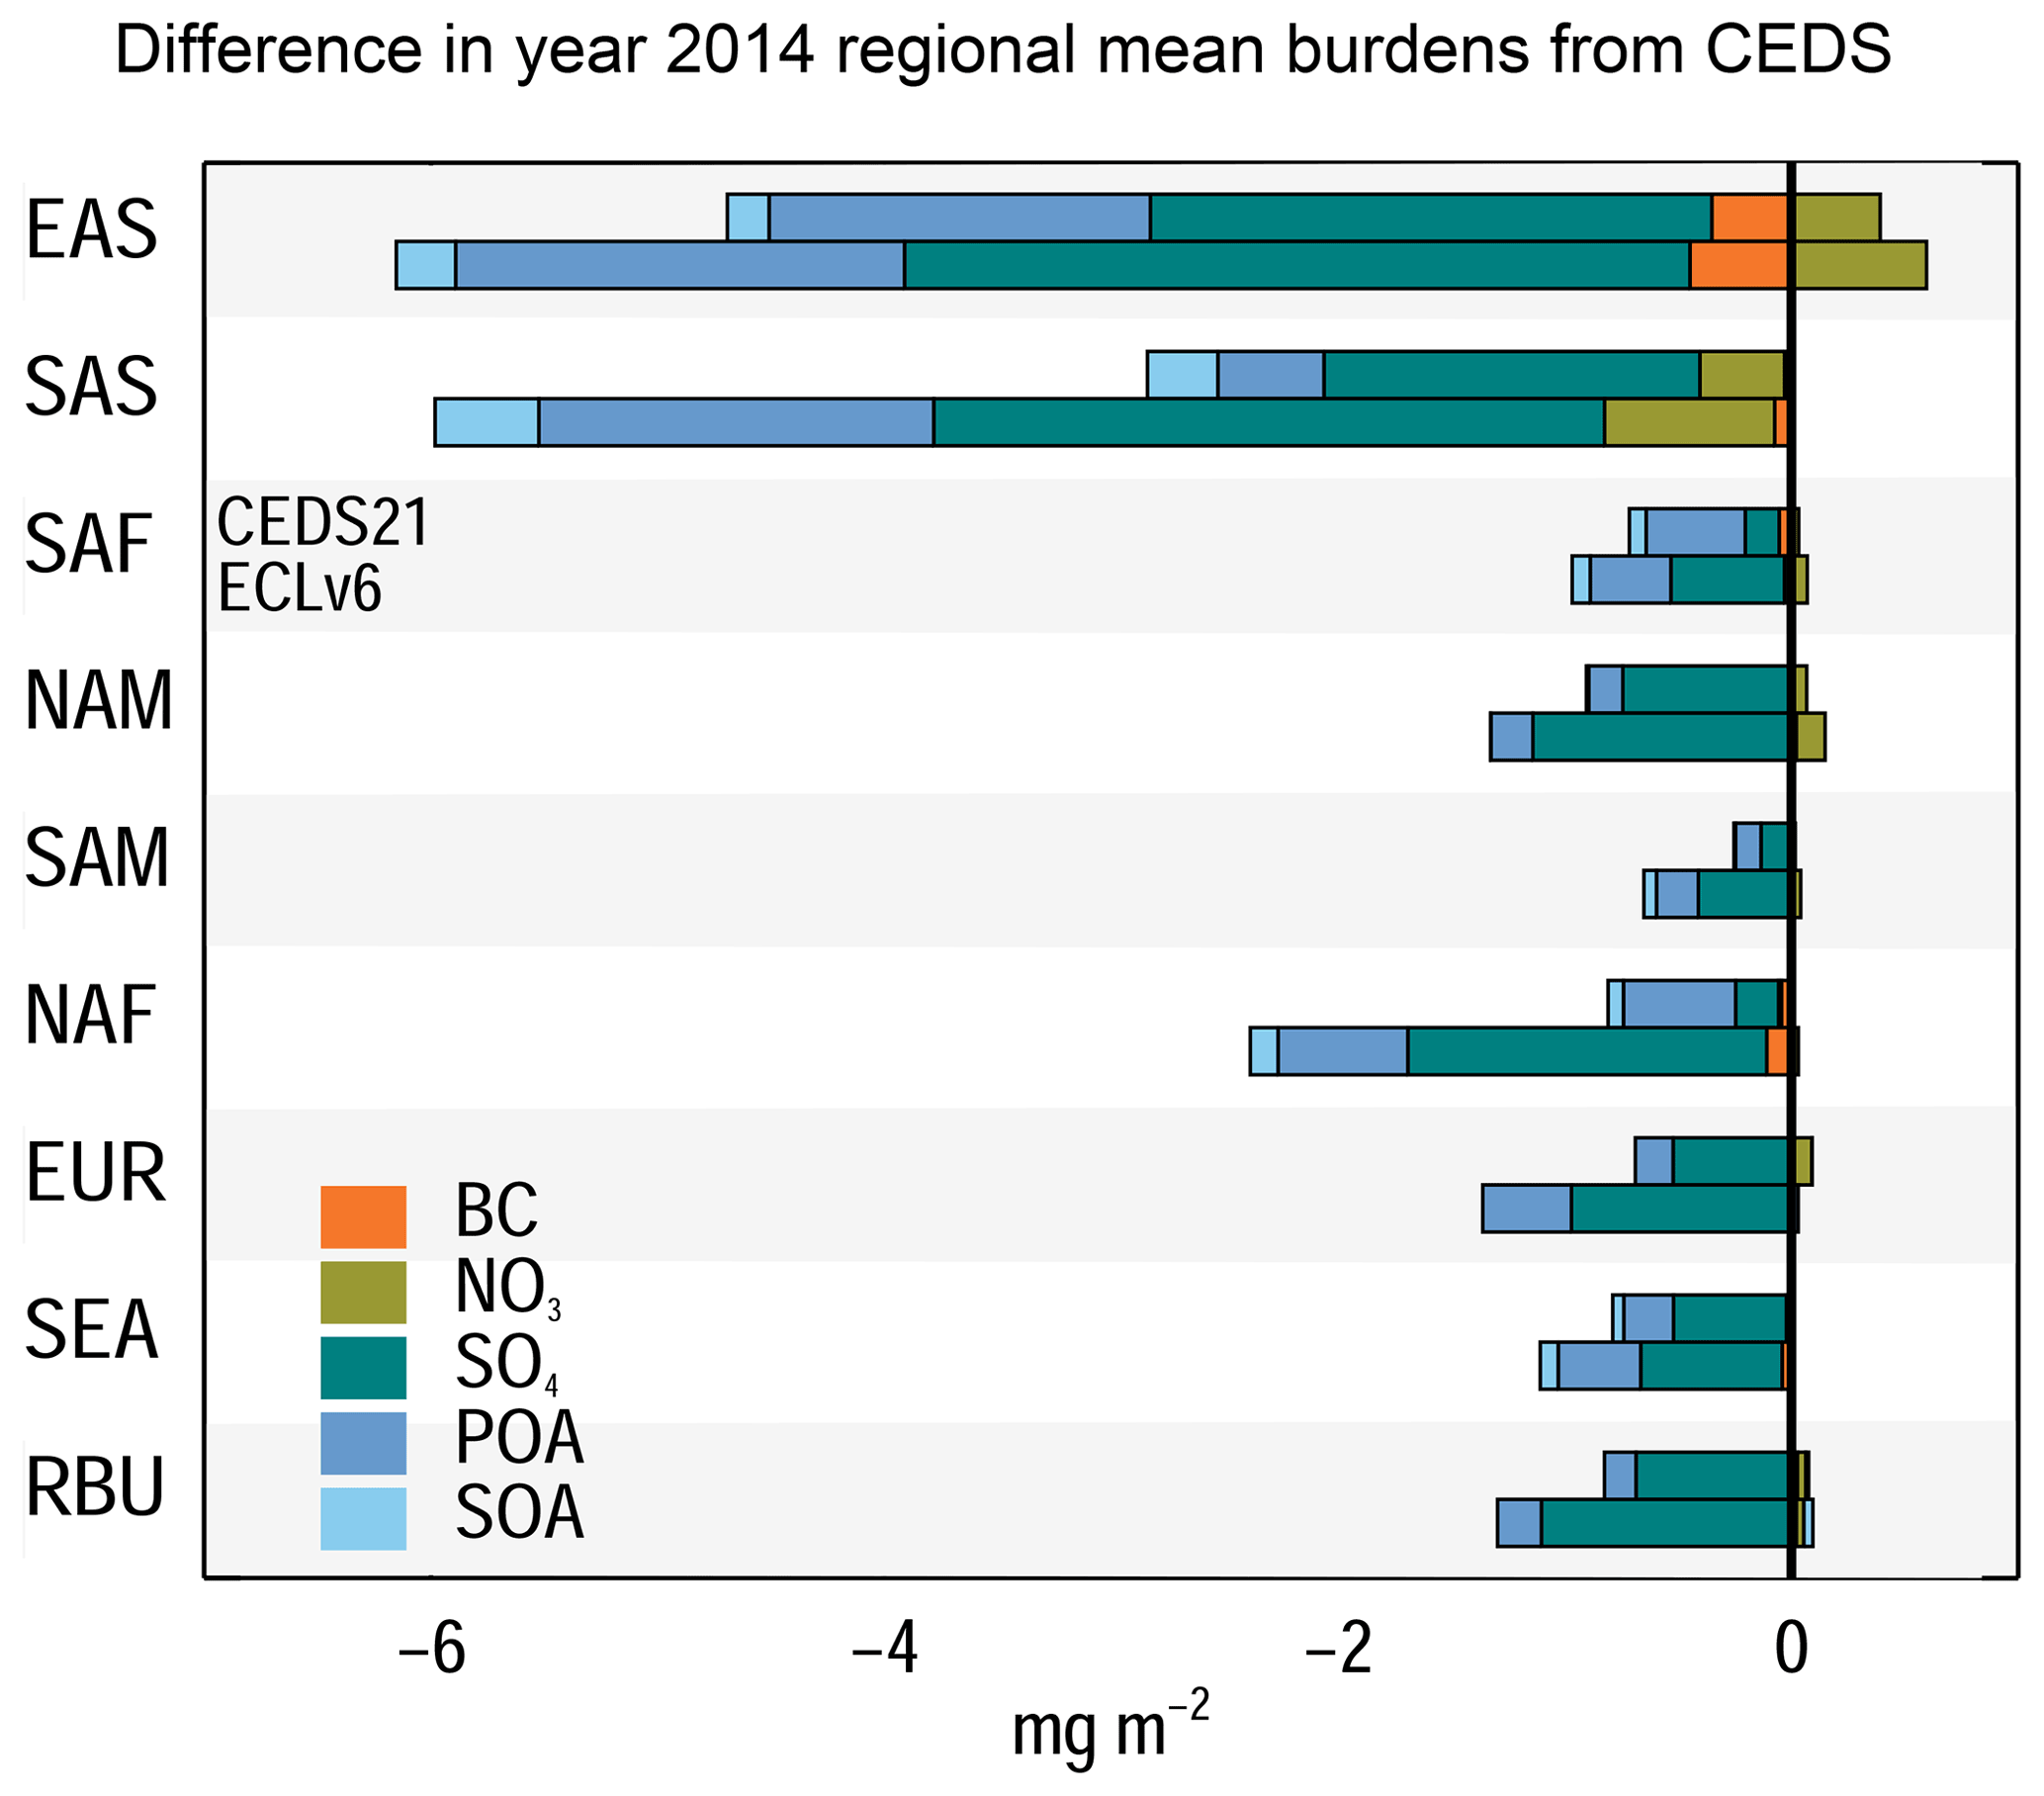
Figure 2Absolute difference in the regional mean burden of the key anthropogenic aerosol species between simulations with CEDS21 and CEDS (upper bar) and ECLv6 and CEDS (lower bar). Regions are the same as in Lund et al. (2019): EAS, East Asia; SAS, South Asia; SAF, sub-Saharan Africa; NAM, North America; SAM, South America; NAF, North Africa and the Middle East; EUR, Europe; SEA, South East Asia; and RBU, Russia.
The only species that is globally more abundant in simulations with the two new inventories is nitrate. There is considerable regional heterogeneity, where the burden is lower compared to the CEDS experiments in South Asia and on the US east coast but higher in the US Midwest; parts of Africa and South America; and, especially, over East Asia (Figs. 2 and S3). While absolute differences are small in many regions compared to other species, the net effect is nevertheless a 15 % and 24 % higher global mean nitrate burden with CEDS21 and ECLv6, respectively, compared to using CEDS emissions. Changes in the atmospheric nitrate distribution result from a complex interplay between differences in emissions of NOx, NH3, and SO2. Studies have also shown that nitrate formation can be influenced by background concentrations of VOCs (e.g., Womack et al., 2019) We find the largest absolute difference in nitrate in EAS and SAS, however, of opposite sign. In EAS, emissions of SO2 and NOx are both lower in ECLv6 and CEDS21 than in CEDS, whereas NH3 emissions are higher (Figs. 1 and S1). This results in lower chemical competition for available sulfate and, in turn, enhanced formation of nitrate aerosol. In SAS, SO2, NOx, and NH3 are all lower in the two new inventories than in CEDS, as is the nitrate burden. Differences in concentrations of VOCs in the simulations with different inventories is a further complicating factor. Studies have suggested that nitrate formation can be more sensitive to changes in VOCs than NOx; however, this is highly site specific (Yang et al., 2022). Further delineating the role of individual factors in nitrate differences would require simulations beyond what is available for the current study. The potential for an increasing relative role of nitrate in air pollution and climate in a world with concurrent declines in SO2 and NOx emissions but little in NH3 has also been discussed in previous studies (e.g., Bauer et al., 2007; Bellouin et al., 2011; Zhai et al., 2021). However, while more studies have focused on local air pollution impacts of nitrate and associated mitigation strategies, nitrate is still missing from many global climate models. Moreover, when included, the model diversity in simulated distributions is large (Bian et al., 2017). Our results suggest that uncertainties in emissions and choice of inventory can contribute to spread in simulated nitrate aerosols and confound the comparison of conclusions across modeling studies. Moreover, the complexity of the nitrate response demonstrates that the impact of inventory differences on simulated aerosols cannot be understood from scaling with the changes in individual emissions but requires explicit modeling.
To place the range in estimates between simulations with different inventories into more context, we compare the differences in simulated aerosol burdens in 2014 to the difference in burdens over the 5-year period from 2014 to 2019 using CEDS21. Both globally and regionally, the spread in burdens between simulations with different inventories and the 2014–2019 burden changes are of the same order of magnitude. In other words, at least in this case, the changes resulting from inventory differences are as large as those due to the recent overall change in anthropogenic emissions.
Combined, these burden differences translate to a 3 % and 6 % lower global annual mean AOD with CEDS21 and ECLv6, respectively, compared to CEDS in 2014 in our simulations. As expected, the differences are most pronounced over China and India (Fig. S4), where we estimate a 20 % and 30 % lower regional mean AOD in 2014 using the two new emission inventories, respectively, compared to using CEDS. For context, Fig. S4 also shows the interannual variability in AOD from MODIS Aqua (see Sect. 2): in these regions the differences between inventories are markedly larger than what can be expected from natural year-to-year variations.
3.1.2 Global and regional AOD 1990–2019
Next, we take a closer look at differences in the simulated temporal trend, focusing on total AOD. Figure 3 shows the global and regional mean AOD from 1990 to 2019. Also shown is the linear trend from 2005 to 2017 for each of the time series. This period overlaps with the availability of remotely sensed AOD measurements, discussed in Sect. 3.1.3, as well as the most pronounced differences in the inventories. However, as there is a certain extent of inventory differences prior to 2005, we also provide corresponding linear trends over the full 1990–2017 period in Table S2.
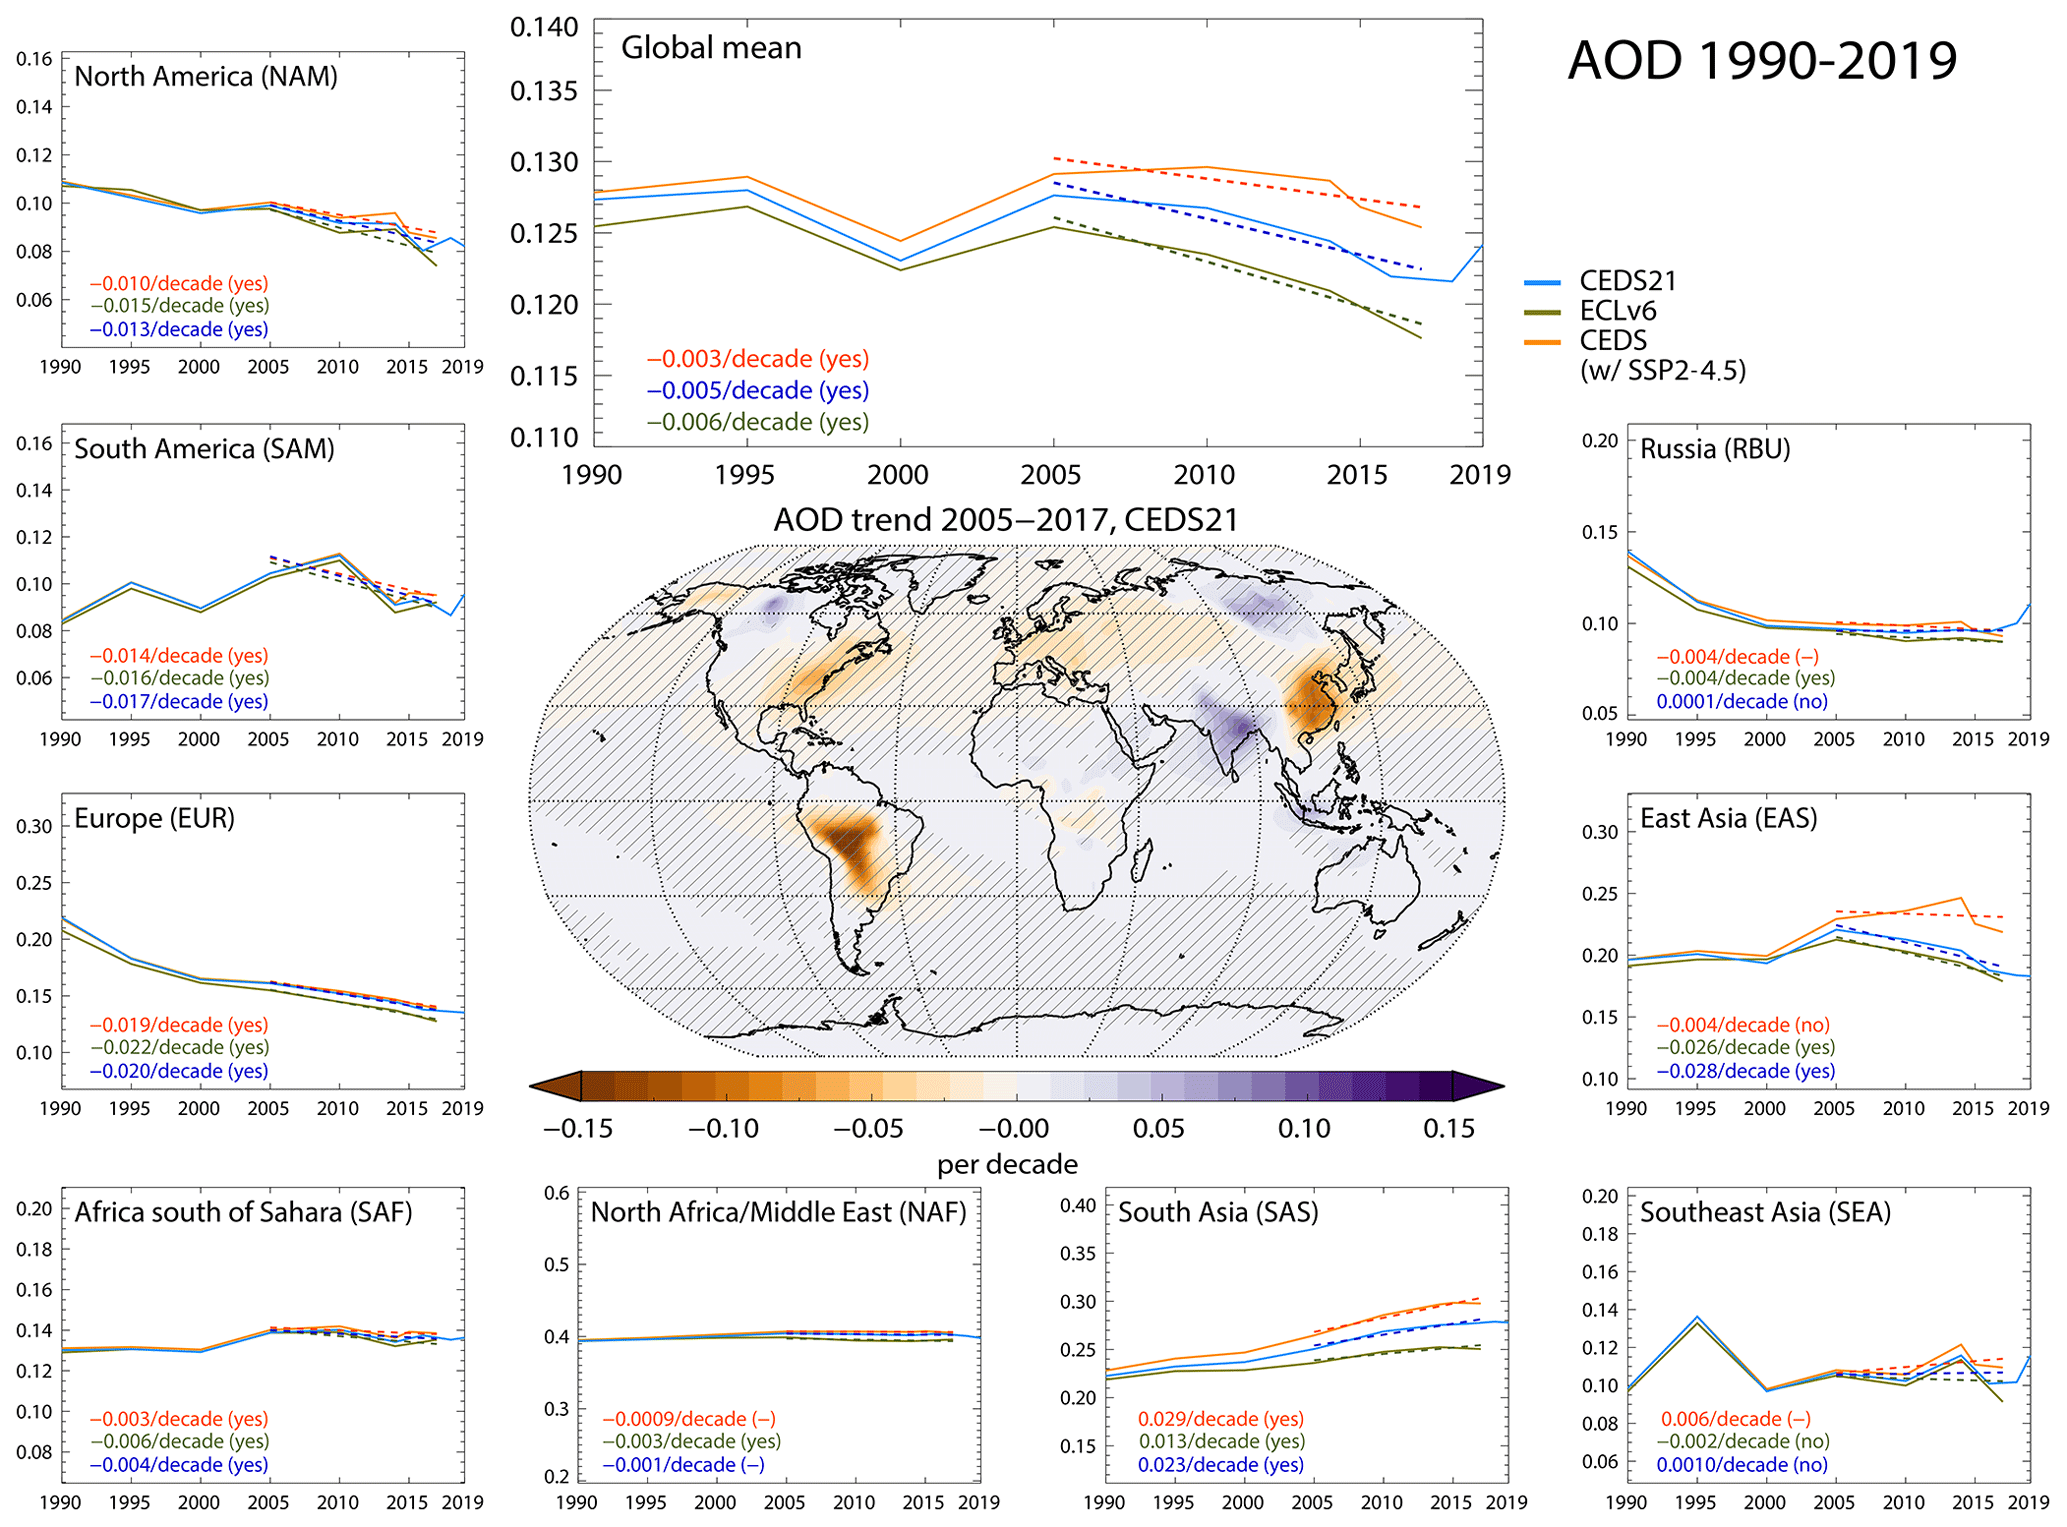
Figure 3Global and regional mean total AOD simulated with emissions from the CEDS21, ECLv6, and CEDS inventories. In the case of CEDS, the time series is extended from 2014 to 2017 using SSP2-4.5 emissions. Dashed lines show the linear 2005–2017 trend, defined as statistically significant from no trend when the linear Pearson correlation coefficient is significant at the 0.05 level. To reduce any influence of individual, outlier years on the trends, we calculate a set of trends removing one year at a time from the sample and show the average. Significance is given in the parenthesis. If a dash is given, individual trends from the sample differed from each other in terms of significance.
The simulated AOD is consistently lower when using CEDS21 and ECLv6 emissions compared to CEDS over the full period studied, with increasing divergence over time, especially after 2005. We estimate a significant (at the 0.05 level – see Sect. 2) negative linear trend in the global mean AOD of −0.005 and −0.006 per decade in simulations with CEDS21 and ECLv6, respectively. This trend strengthens when extended to 2019 based on simulations with CEDS21. A negative global trend is also found when using the first CEDS release; however, it is smaller and not significant over the period 2005–2014. Extending the time series to 2017 by assuming that emissions follow SSP2-4.5 after 2014 (see Sect. 2), as in Fig. 3, the negative trend strengthens and switches to significant as per our definition, but it remains weaker than for the other two inventories. Considering the full period, we estimate a significant negative trend in simulations with CEDS21 and ECLv6 but no trend when using CEDS (Table S2). This long-term decline in the total AOD is primarily driven by the decline in sulfate AOD, following the emission decline after the introduction of air quality policies, first in the US and Europe, then in China, and the collapse of the Soviet Union (e.g., Aas et al., 2019). Over the full period, we simulate increasing trends in BC and nitrate AOD, significant at the 0.05 level, with all three inventories (not shown); however, their contributions to the total AOD are much smaller than that of sulfate. Robust evidence of a declining influence of aerosols on climate since 1990 was recently found from observables (Quaas et al., 2022). Our model simulations capture this overall trend, and the findings reinforce the role of changes in anthropogenic emission, particularly since 2005. Furthermore, we suggest that if using the original CEDS emissions, models may have failed to capture this trend. We note that biomass burning emissions also change over time in our simulations, but we do not find any significant trend in the AOD of biomass aerosols (BC and POA) on the global mean scale over this period. We do note that years of high biomass burning activity, such as in 2019 where GFED4 emissions are 25 % higher than in 2018, can lead to marked jumps in simulated AOD. We have limited possible influence of such years on the linear trend calculated (see Sect. 2).
Regionally, we simulate significant declining trends in AOD over 2005–2017 for EUR and NAM, with this trend extending back to 1990 (Table S2), as expected. This is also consistent with surface observations for both AOD and atmospheric sulfur and is in agreement with other models (Mortier et al., 2020; Aas et al., 2019); we capture the decline regardless of which emission inventory is used. In both regions, and across simulations with all three scenarios, we find a decline in the AOD of BC, OA, and sulfate but an increasing trend in nitrate AOD. Over RBU, we also simulate a significant decline in the area average AOD over the full 1990–2017 period but a flatter evolution when considering only 2005–2017. However, the results are also similar with all three scenarios here. In parts of the RBU region, GFED4 shows an increase in emissions over the latter period, resulting in a positive trend in the AOD of biomass aerosols from 2005. On the African continent, we simulate a negative, albeit weak, trend in AOD over the 2005–2017 period for SAF. In contrast, the trend over the full period is positive. Anthropogenic emissions in SAF have increased (Fig. S1), although less steeply than in Asia, and we find significant increases in the AOD of all the anthropogenic species with all inventories from 1990 to 2017. However, from 2005 onwards, there has been a decreasing trend in GFED4 emissions, following a reduction in the burned area of savannas (Wu et al., 2021). Biomass burning aerosols contribute relatively more to the total AOD here than in the Northern Hemisphere regions and hence impose a stronger effect on the area average trend. A similar pattern is seen for SAM, while for SEA, another biomass-burning-influenced region, we find less clear trends. While diagnosed trends in the total AOD in these regions are mostly of a similar sign across simulations with the three inventories, we find that the trend in sulfate AOD diverges between model runs using CEDS or CEDS21 (positive trend) and ECLv6 (negative trend) in SAF and NAF, pointing to a need to better understand the drivers of emission changes in these regions and homogenize between inventories. As expected, the key differences between simulations with different inventories arise over Asia. Simulations with both CEDS21 and ECLv6 show a significant decreasing trend in the total AOD over EAS between 2005 and 2017. While a decline is found using CEDS, it is much weaker and not significant. Moreover, differences between inventories affect the sign of the simulated trend when considering the full period, owing primarily to the spread in estimated sulfate AOD. For SAS, we simulate a consistent positive trend, but ranging from 0.01 per decade with ECLv6 to 0.03 per decade with CEDS, with increasing divergence in AOD over time. Similar magnitude differences between the sets of experiments exist for the AOD of all anthropogenic aerosols in this region.
3.1.3 Comparison with observed AOD
To explore whether the model captures observed global and regional trends better with the CEDS21 emissions than with CEDS, we compare simulated AOD to MODIS Aqua retrievals and ground-based AERONET measurement. For this evaluation, we also use simulations where the model is driven by meteorology for the respective years, referred to as CEDSmet and CEDS21met (see Sect. 2), for more realistic comparison with the observations. Using both these, we also estimate negative linear trends in the simulated global mean AOD from 2005 to 2017, strengthening from −0.001 per decade in CEDSmet to −0.003 per decade in CEDS21met. These are, however, weaker than the trends derived from the fixed meteorology simulations in Sect. 3.1.2 (Fig. 3) and not significant at the 0.05 level, demonstrating the notable influence of variability in meteorology and natural aerosols, masking trends due to changes in anthropogenic emissions. This influence is particularly visible for the area average AOD for SAF and NAF, where the diagnosed trend is positive but non-significant in these simulations, in contrast to the negative trend found in simulations with fixed meteorology above. The negative trend over SAM is also not significant at the at the 0.05 level in these runs. For other focus regions, results are similar between fixed and actual meteorology runs, and significant trends arise over the natural variability.
Figure 4a shows the annual global mean simulated AOD from 1990 to 2017 and the MODIS Aqua AOD from 2003 to 2019. Dashed lines show the linear 2005–2017 trends. Figure 4b–d show the spatially explicit trends. We first note that the magnitude of the simulated global mean AOD is lower than that derived from MODIS Aqua by around 20 %. However, the overall geographical pattern of observed AOD is captured by the model (Fig. S5). Furthermore, the AOD simulated by the OsloCTM3 is within, although in the lower range, the spread in AOD between the CMIP and AeroCom models (Vogel et al., 2022). As also shown by Vogel et al. (2022), there can be a notable spread in AOD derived from different satellite products. They found a 13 % standard deviation range in the global mean AOD between eight satellite products, with MODIS retrievals in the upper end. Although again in the lower range, the OsloCTM3 AOD falls within the full range of the satellite-derived annual mean AOD. Overall, this suggests a reasonable OsloCTM3 performance in terms of magnitude and distribution.
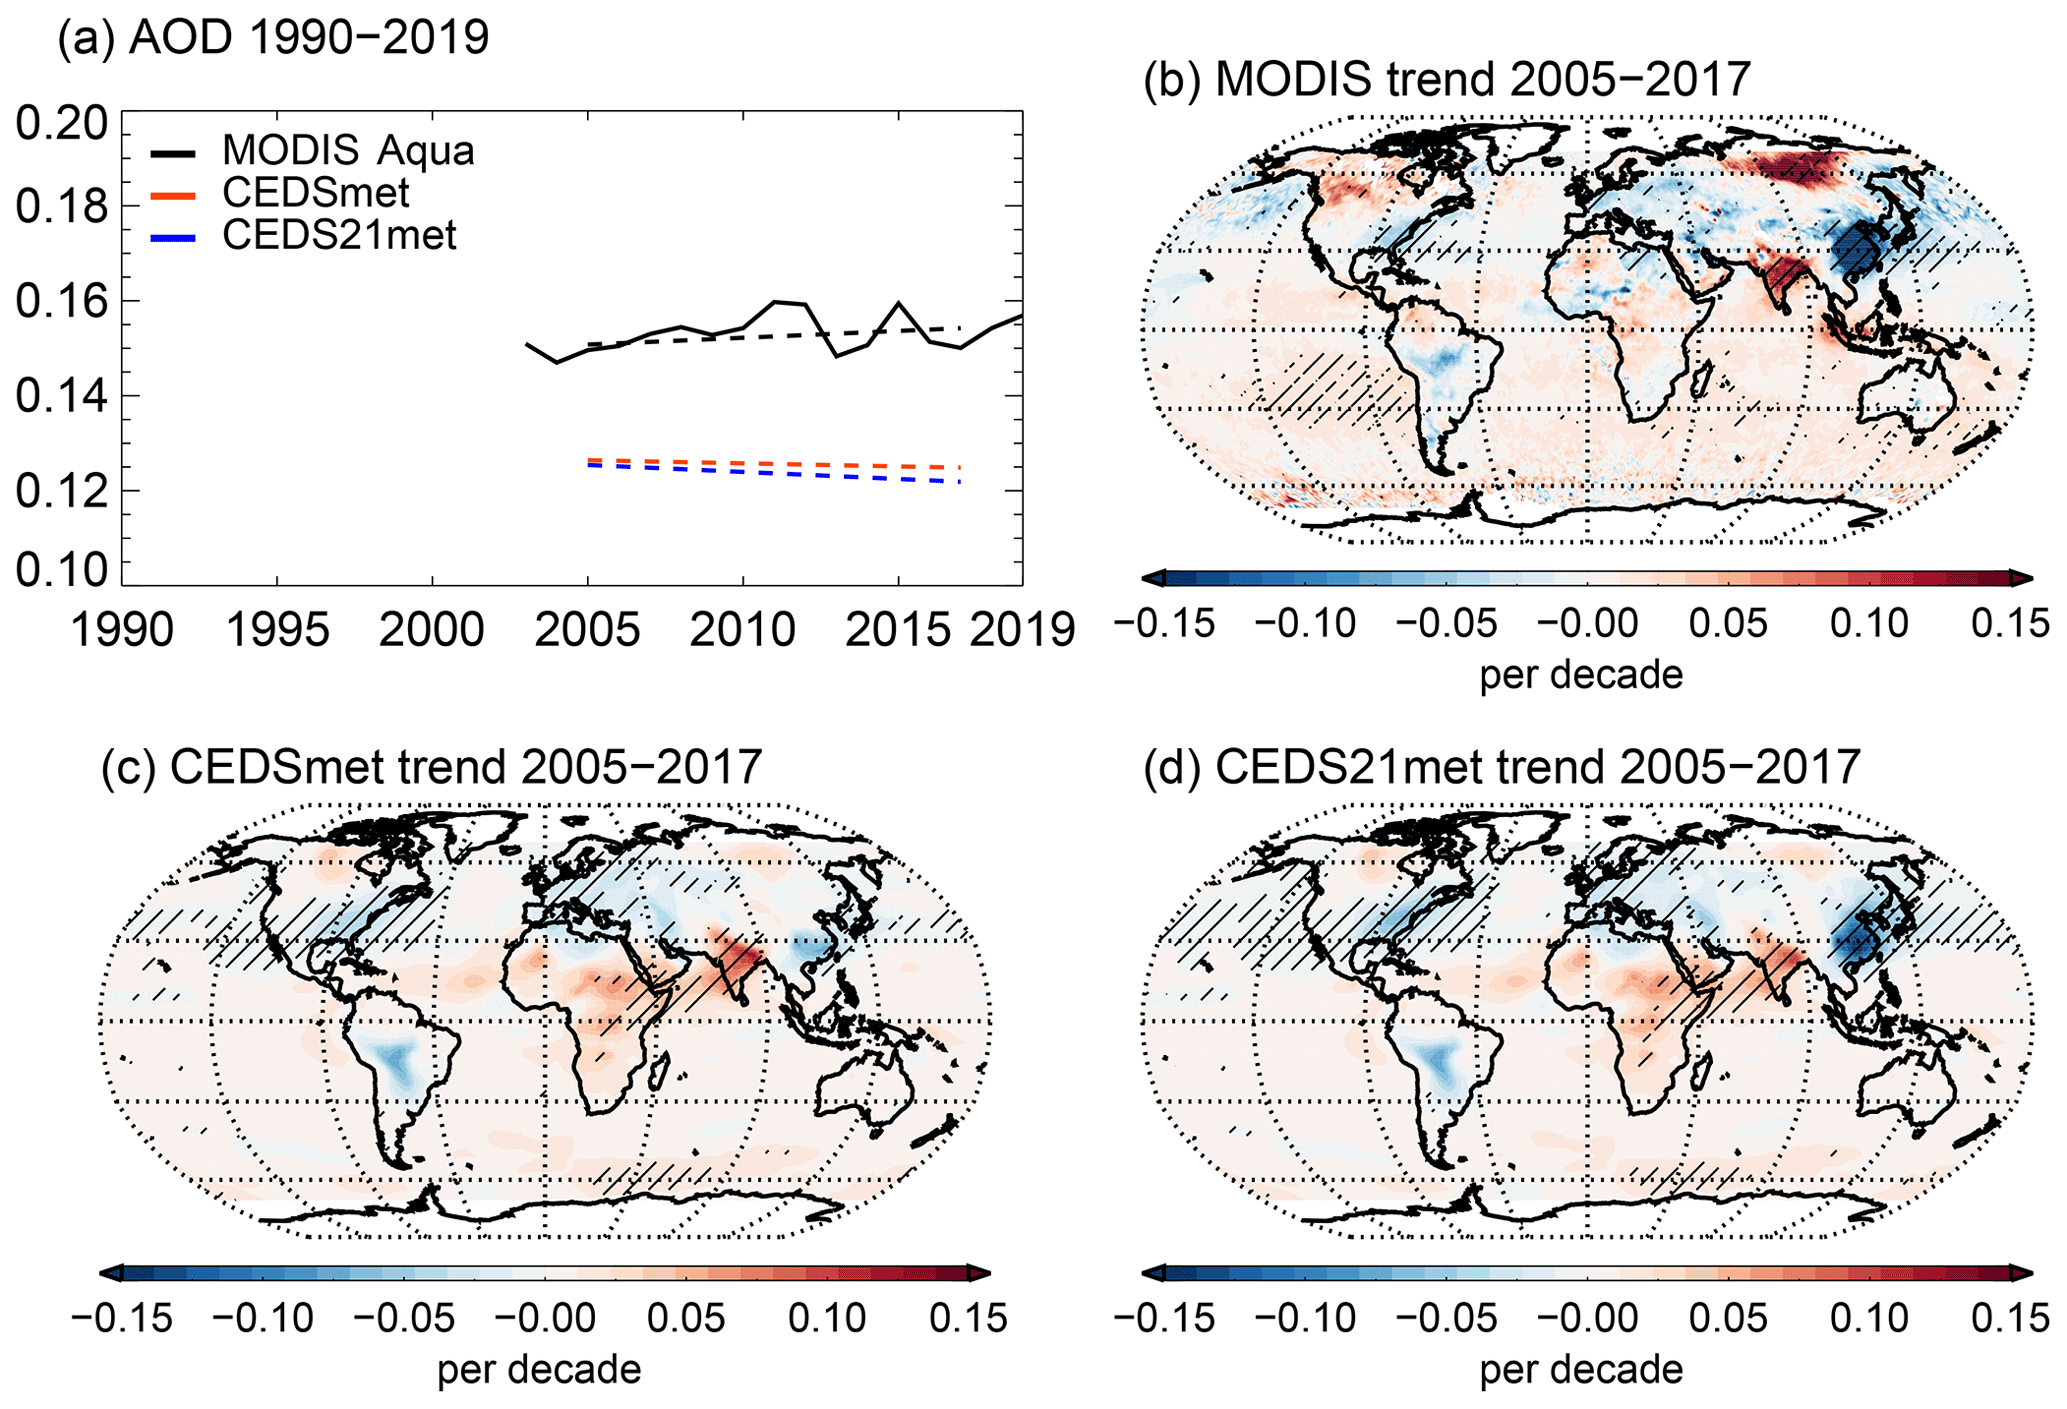
Figure 4(a) Global annual mean AOD from MODIS Aqua and the OsloCTM3 over the 1990–2019 period. Note that data north and south of 70∘ are excluded here due to the limited MODIS Aqua coverage. Dashed lines show a linear trend from 2005 to 2017. (b–d) Spatially resolved linear trends in observed and simulated AOD. Hatching indicates where the linear trend is significantly different from 0 at the 0.05 level.
In terms of temporal evolution, MODIS Aqua data indicate a very weak positive linear trend of 0.001 per decade in the global mean AOD over the 2005–2017 period (0.004 per decade when extending the data to 2019). We do not, however, find this trend to be significant. MODIS data are influenced by substantial year-to-year variability, in particular after 2010, which was also pointed out by Vogel et al. (2022). Regions with significant positive observed AOD trends include parts of the ocean in the Southern Hemisphere (Fig. 4b). Here, sea salt aerosols could be causing the increase. However, Quaas et al. (2022) recently showed that this positive trend is not clear in Multi-angle Imaging SpectroRadiometer (MISR) data. While we are focused on the anthropogenically influenced regions in the present analysis, we briefly note that the magnitude of the trends over the Southern Hemisphere oceanic regions is also not captured by the model (Fig. 4c–d). We also simulate weaker trends in the boreal regions of North America and Russia contributing to the model–observation difference.
Over the main anthropogenic emission source regions, there are significant observed declines in AOD over East Asia, the US, and Europe (Fig. 4b). These trends have been confirmed by both ground-based and remote sensing observations of AOD and other variables (Gui et al., 2021; Moseid et al., 2020; Paulot et al., 2018; Quaas et al., 2022). For NAM and EUR, we calculate an area average negative observed trend of −0.006 and −0.009, respectively, from MODIS Aqua. This is of the same sign but weaker than the trend simulated with both emission inventories. For the latter, this contrasts with findings by Mortier et al. (2020), where models in general were found to underestimate the observed decrease in AOD seen in surface observations. Over EAS, where the influence of inventory differences is most pronounced, a significant negative observed trend of −0.044 per decade is calculated. This is in very close agreement with the −0.40 per decade AOD trend simulated with CEDS21, while simulations with CEDS do not show a significant trend. Hence, the model is clearly able to better represent observed trends with the updated inventory. This is further confirmed in Fig. 5, where we show 5-year average deviations from the period 2003–2017 in both MODIS Aqua and simulated AOD. Using CEDS21 results in marked improvements compared to observed AOD trends over China, both for the first and most recent full 5-year periods. However, the opposite tendency is found for AOD over SAS. Here observations suggest a significant positive trend of 0.04 per decade. The diagnosed trends are also positive in simulations using both inventories but somewhat weaker, especially when switching from CEDS to CEDS21 (and even more so when using EClv6 emissions – Fig. 3). Figure 5 suggests that this discrepancy arises in the more recent decade. Furthermore, simulated AOD and underlying emissions suggest a leveling off in recent years, which is not seen from MODIS Aqua. Whether this is due to inaccurate representation of the evolution of anthropogenic emissions in the inventories or poor model representation of other aerosols such as dust from agricultural soils and urban areas (e.g., construction, non-exhaust transport emissions) is however not clear from this analysis. We note that the model underestimates the magnitude of AOD observed by MODIS Aqua in both EAS and SAS. To the extent that the MODIS is accurate, this could support the latter. This type of dust is suggested to give an important contribution to the particulate matter load (e.g., Chen et al., 2019; Xia et al., 2022) but is still missing from many global models. Other contributing factors include the representation of processes related to aerosol transport and scavenging. Finally, we also note that the 5-year deviations in Fig. 5 show quite some variability over the Middle East, with both positive and negative deviations from the baseline period. While anthropogenic emissions in this region increase steadily over the period (by 13 %–40 % depending on species) in the inventories used in the present study, the strong influence from dust emissions in this region likely dominates the temporal variability.
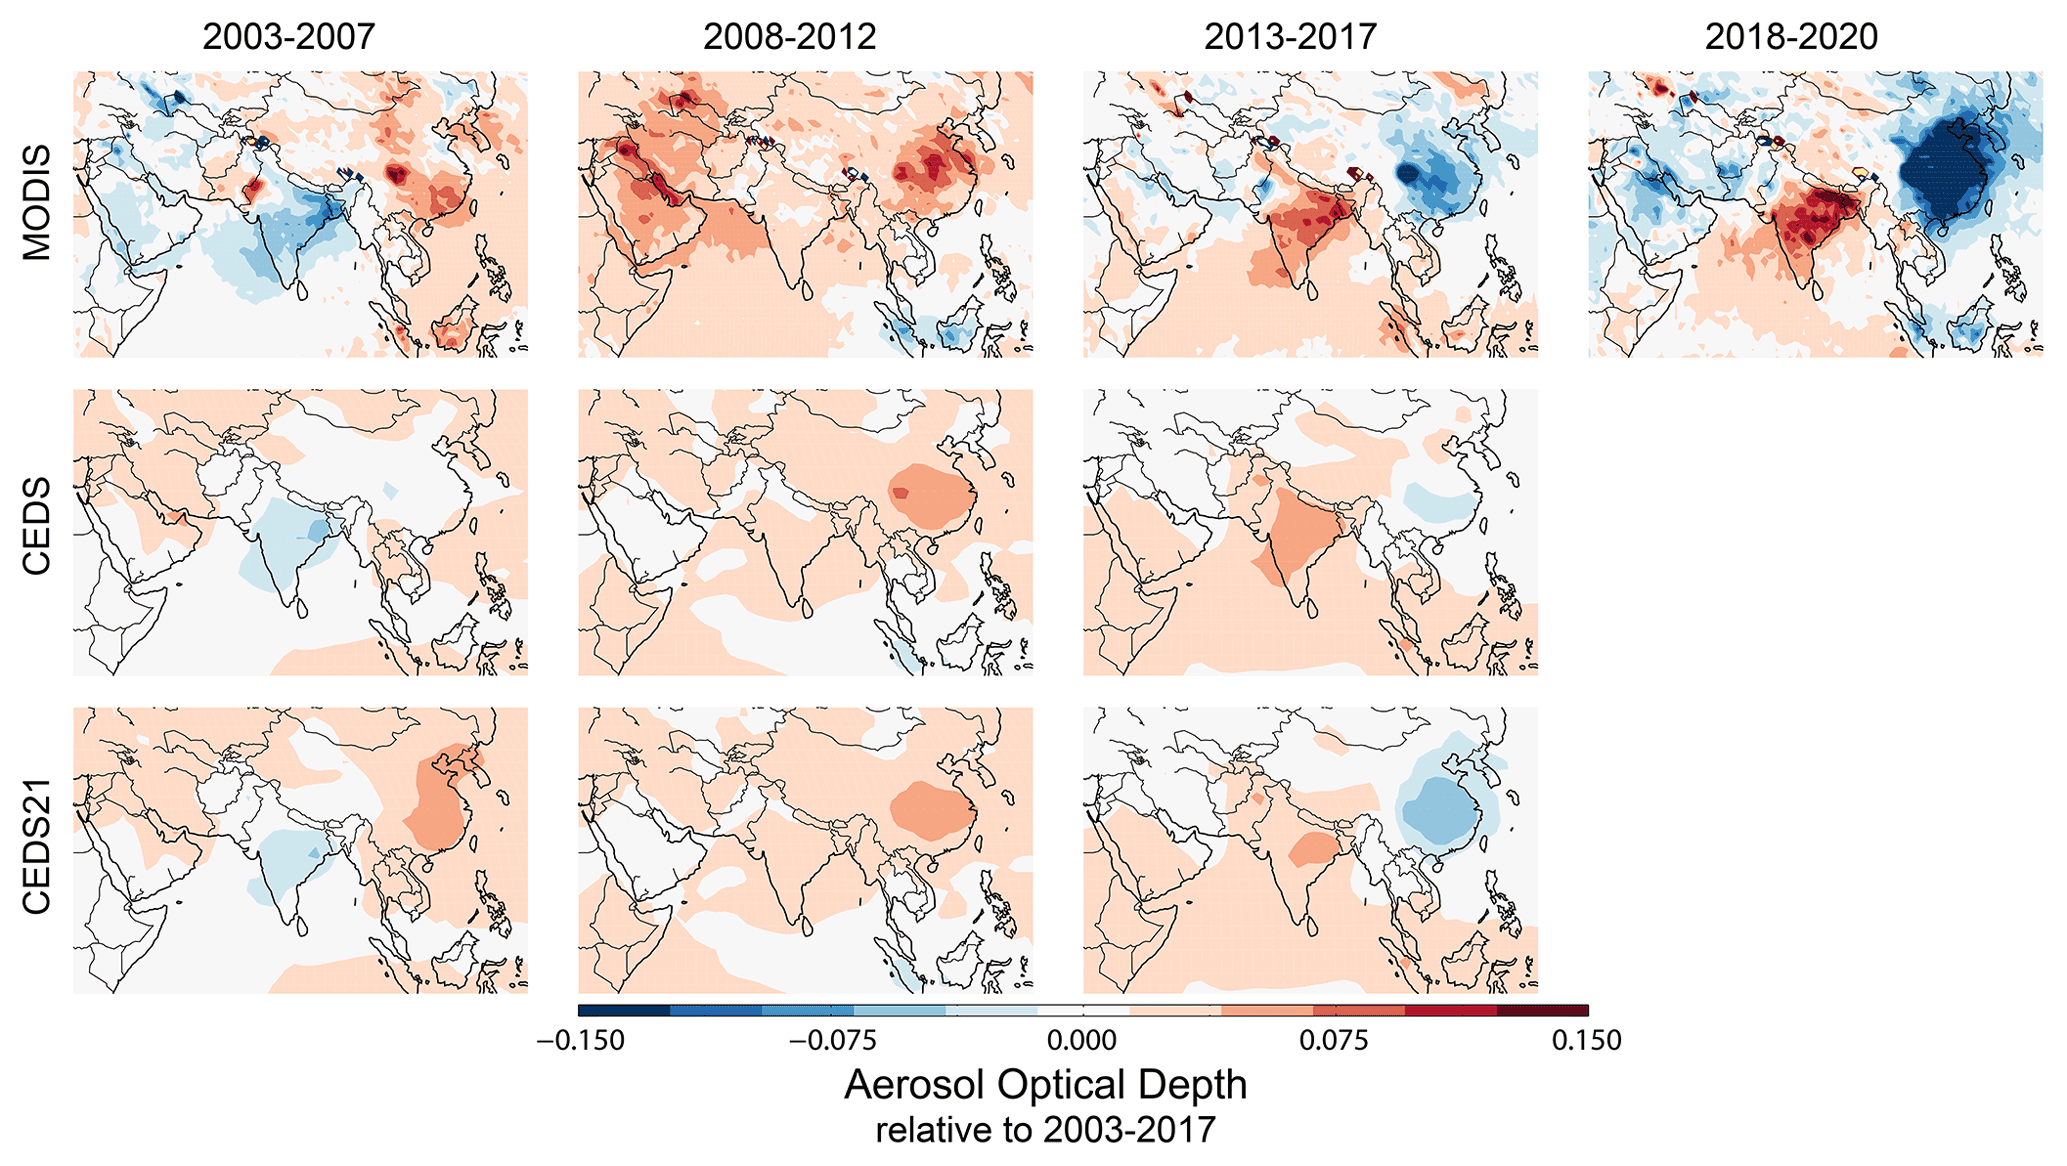
Figure 5Evolution of AOD over South and East Asia and the Middle East over the period 2003–2020. All panels show 5-year average deviations from the period 2003–2017, except the rightmost MODIS Aqua panel, which shows the 3-year average deviation (same baseline). The top row shows retrievals from MODIS Aqua; the two bottom rows show model calculations with OsloCTM3 based on the CEDS and CEDS21 emission inventories.
A previous OsloCTM3 study by Lund et al. (2018) found an improved agreement between the year 2010 ground-based AERONET observations and model output, including over Asia, when switching from CMIP5 and ECLIPSEv5 emissions to CEDS, the latter having higher emissions. This seemingly contradicts expectations following the now-known biases in this first release of CEDS. Here we repeat the comparison with AERONET but for the year 2014. Resulting scatter-density plots are given in Fig. S6. The normalized mean bias (NMB) compared to AERONET ranges from −21 to −29 % in the simulations with fixed and actual meteorology. We find higher bias and lower correlation when switching from the original CEDS release to CEDS21 and ECLv6. Hence, while the model is better able to represent observed recent aerosol trends over East Asia with newer emission inventories, these results point to other issues that may have been concealed by too high anthropogenic emissions. Dust and atmospheric processing, as discussed above, are again possible contributing factors.
3.2 Impact of inventory differences on estimated anthropogenic aerosol RF
Finally, we quantify the aerosol-induced RF from the three sets of experiments. Figure 6a shows the RFari, RFaci, and net aerosol radiative forcing (RFnet, RFari plus RFaci) relative to 1990 for the three sets of experiments. The net RF of changes in anthropogenic (and biomass burning) aerosol has been positive since 1990, except for 1995 and 2005, where a small negative forcing is estimated. As shown in Fig. 1, global anthropogenic SO2 emissions show a peak in 2005, and the biomass burning emissions are relatively high. This positive global mean net RF is determined mainly by the balance between a positive forcing over the northern extratropics, dominated by aerosol–radiation interactions, and a negative forcing over Asia and parts of South America and Africa with stronger contributions from aerosol–cloud interactions (Fig. S7).
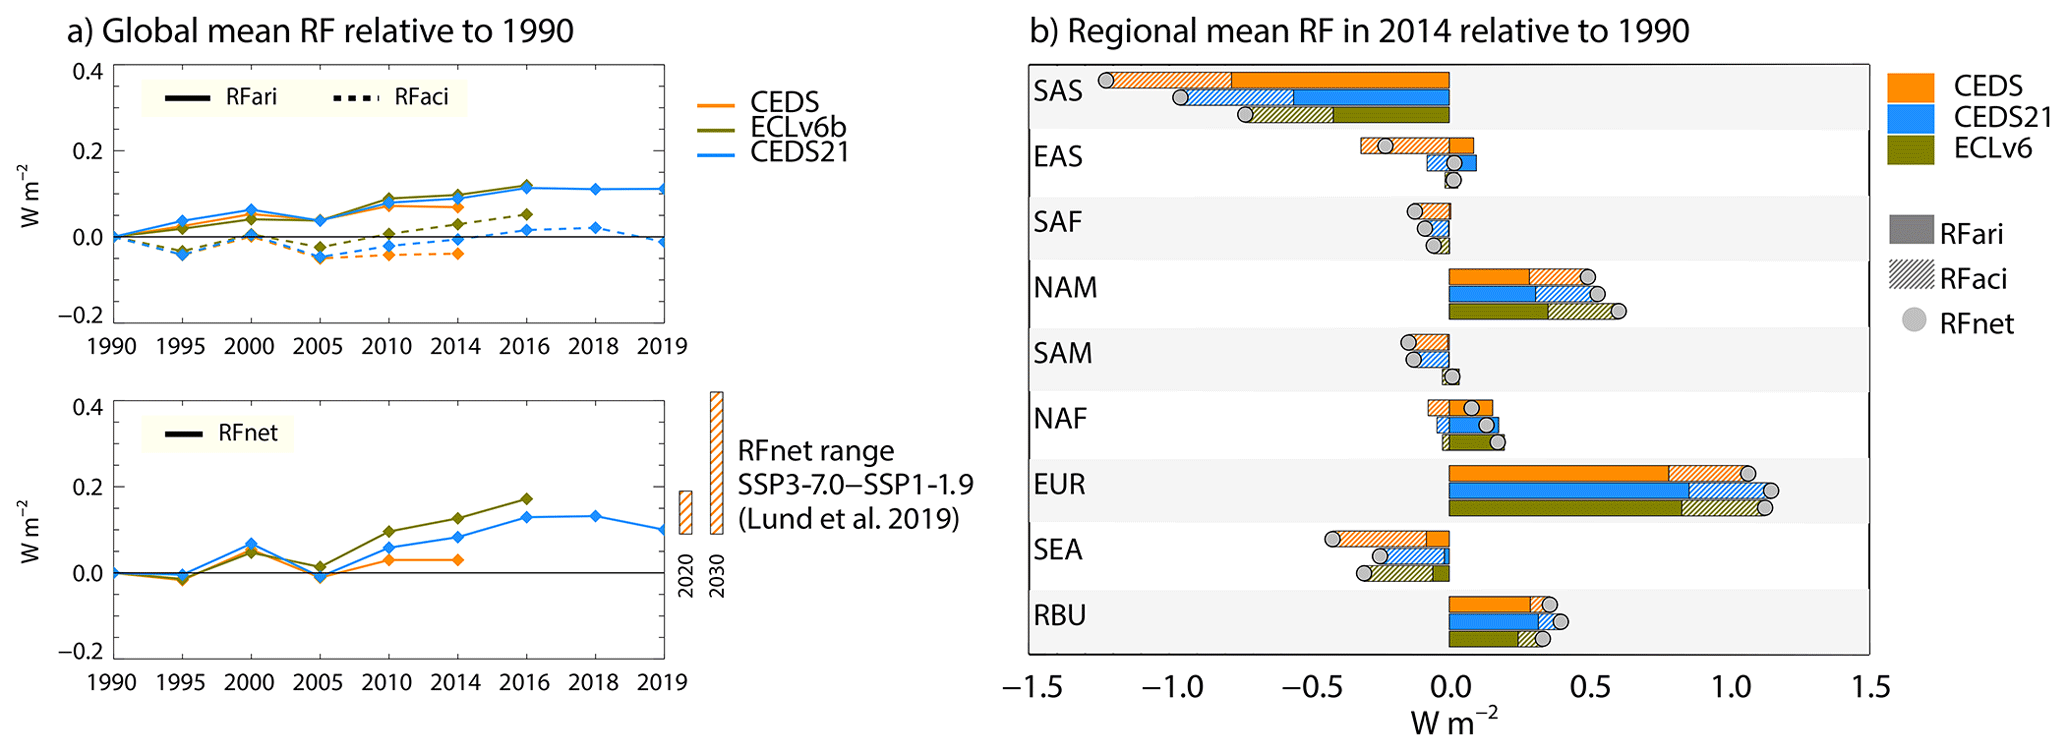
Figure 6(a) Global mean RFari and RFaci (top) and RFnet (RFari + RFaci) (bottom) relative to 1990 from simulations using the CEDS, CEDS21, and ECLv6 emission inventories. The vertical bars to the right show the range in RFnet in 2020 and 2030 (relative to 1990) estimated with the SSP1-1.9 and SSP3-7.0 emissions (adapted from Lund et al., 2019). (b) Regional mean RFnet, RFari, and RFaci in 2014 relative to 1990 in simulations with the CEDS, CEDS21, and ECLv6 inventories.
In 2014, we estimate a global mean RFnet of 0.03 W m−2 for CEDS, 0.08 W m−2 for CEDS21, and 0.12 W m−2 for ECLv6 relative to 1990, of which the RFari constitutes 0.07, 0.09, and 0.10 W m−2, respectively. We note that our framework only captures the cloud albedo effect and not radiative effects of any changes in cloud lifetimes that may arise through the influence of aerosols (i.e., we calculate RF, not ERF). Our RFari estimate using CEDS emissions is similar to the multi-model mean RFari of 0.05 W m−2 derived for the 1990–2015 period using ECLIPSE version 5 emissions by Myhre et al. (2017). The same study estimated a model mean RFnet of 0.1 W m−2 but with a significant intermodel spread from close to 0 to more than 0.2 W m−2. This spread is larger than the difference between estimates with different inventories in the present analysis. Nevertheless, the differences in emissions between CEDS and CEDS21 (ECLv6) translate to a factor 3 (5) stronger RFnet in our calculations.
Figure 6b shows regional mean RF, including the balance between RFari and RFaci. Following the significant decline in AOD over EUR and NAM, the dominant contributions to positive RF are found here, followed by Russia. There is however little difference between simulations with the three inventories. In contrast, the net RF over EAS switches signs from negative in simulations with CEDS to positive when using CEDS21 or ECLv6 due to the observed decline in emissions now captured. While negative in all three sets of experiments, the net RF over SAS is 40 % (20 %) weaker when ECLv6 (CEDS21) emissions are used compared to CEDS. This results from a 50 % (20 %) lower net area average AOD change between 1990 and 2014 compared to simulations with CEDS.
The CEDS21 inventory extends to 2019 compared to 2014 in CEDS. The global mean net RF over this 5-year period is estimated to be 0.10 W m−2, driven primarily by a further positive forcing over China in line with the continued decline in SO2 emissions following the implementation of measures targeting improved air quality. Over India, the forcing in 2019 relative to 2014 remains negative but weaker than during the preceding period, while over Europe and western Russia, the RF is low, suggesting little further recent emission changes. We note however that this is a short period, and results should be interpreted with that in mind. Using a selection of the SSP scenarios, Lund et al. (2019) extended simulations from 2014 CEDS emissions and quantified the projected aerosol-induced RF. The orange hatched bars in Fig. 6 show the range in RFnet in 2020 and 2030 (relative to 1990) estimated with SSP1-1.9, SSP2-4.5, and SSP3-7.0 in that study. The RFnet in 2019 estimated with CEDS21 here is close to the lower end of the bar, i.e., the RFnet projected under SSP3-7.0. However, prior to this higher biomass burning year, there are indications that the RFnet from simulations with CEDS21 tracked closer to SSP2-4.5 or an even lower emission pathway.
The dipole pattern of aerosol changes, and resulting RF, over India versus China that can be seen in observations and is expected to impose regional climate impacts was first highlighted by Samset et al. (2019). Using emissions from CEDS and SSP1-1.9, SSP2-4.5, and SSP3-7.0, combined with a radiative kernel approach, that study estimated a range of 2014–2030 aerosol (SO2 and BC) net RF of −1.0 (SSP1-1.9) to 0.82 W m−2 (SSP2-4.5) over India and 0.06 (SSP2-4.5) to 1.10 W m−2 (SSP3-7.0) over China. Part of this range can be attributed to poor knowledge of current, and hence also future, regional emissions (Samset et al., 2019). In the present study, we estimate regionally averaged RFnet in 2019 relative to 2014 of −0.09 and 0.22 W m−2 over India and China, respectively. For China, this recent RFnet is about 20 % of the previously estimated difference between high and low future aerosol emission scenarios in 2030 (SSP2-4.5 and SSP3-7.0). Missing or incorrectly captured past emission trends can therefore markedly affect assessments of projected near-term aerosol-induced climate impacts, as they depend on a well-constrained starting point.
We have investigated the impact of differences between recent global emission inventories available to the aerosol and climate modeling community on simulated anthropogenic aerosol abundances and associated radiative forcing from 1990 to 2019. Simulations with the chemical transport model OsloCTM3 and the CEDS emission inventory, developed for the sixth cycle of the IPCC, have been compared with corresponding results using two newer inventories: the CEDS 2021 update (CEDS21) and the ECLIPSE version 6b (ECLv6). Our objective was to evaluate the model performance considering revisions to the emissions input data, partly done to correct known regional biases, and to investigate the implications of inventory differences for downstream diagnosed quantities critical for assessing the air quality and climate effects of anthropogenic aerosol.
We have found that, apart from nitrate, simulations with the CEDS21 (ECLv6) inventory give lower global mean aerosol burdens than corresponding runs with CEDS, ranging from 4 % (6 %) for BC to approx. 10 % (15 %) for sulfate and POA in 2014 (the most recent historical year common for all scenarios). Differences are consistently most pronounced over East Asia, followed by South Asia, where they are of the order of 30 %–60 % depending on species and scenario. Differences in the underlying anthropogenic emissions arise from different assumptions about emission rates; data on non-energy sources; and, importantly, representation of air quality policies and their implementation efficiency. In our model, the global mean fine-mode nitrate burden is 15 % (24 %) higher with CEDS21 (ECLv6) relative to CEDS but with regional heterogeneity in the sign of the difference. Overall, we estimate a 3 % (6 %) lower total AOD with CEDS21 (ECLv6) compared to CEDS in 2014. The difference reaches approx. 20 % and 30 % over East and South Asia.
Over East Asia, we diagnose a significant negative linear trend in the total area average AOD from 2005 to 2017 of −0.03 per decade in simulations using the ECLv6 emissions. In contrast, we find no significant trend in corresponding experiments with CEDS. Importantly, we find that the model is better able to capture the trend observed by MODIS Aqua with both new inventories. In all three sets of simulations, we estimate a significant positive linear AOD trend over South Asia. The simulated trend is, however, weaker than that derived from MODIS Aqua, and this gap increases when switching from CEDS to the CEDS21 and ECLv6 inventories. We also underestimate the magnitude of observed AOD in the region, at least compared to this specific satellite product. Recent emission trends are less well constrained by observations in India than, e.g., in China. The extent to which the model–observation difference arises from the input of anthropogenic emissions or could be influenced by poor model representation of other aerosol sources or atmospheric processes is not clear from the present analysis. For other regions considered, there is generally agreement in the sign of the simulated area average AOD trend between the three sets of simulations, although the magnitude can differ, in particular for the AOD of individual species. For instance, there is an increasing (over time) divergence in the sulfate AOD over Africa between simulations using CEDS and ECLv6. Over most regions, nitrate AOD increases; however, nitrate contributes relatively less to the total AOD than sulfate and OA.
Using offline radiative transfer calculations, we estimate a global mean net aerosol RF in 2014 relative to 1990 of 0.03 W m−2 for CEDS, 0.08 W m−2 for CEDS21, and 0.12 W m−2 for ECLv6. Regionally, the sign of the net aerosol-induced RF switched from negative to positive when replacing CEDS emissions with CEDS21 or ECLv6 in our study. Hence, the failure to capture recent observed emission trends in China may have resulted in the wrong sign in estimates of the regional effect on the energy balance over recent decades. Over South Asia, the area average net RF is up to 40 % lower in simulations with the updated inventories compared to CEDS.
While the focus of the present study is on anthropogenic aerosols, our comparison with observed AOD reveals potential issues related to the representation of natural aerosols or other processes in the OsloCTM3. In particular, the model does not capture the strength of the positive AOD trend observed over high-latitude North America and Russia, likely due to an increase in biomass burning aerosols. For individual years, we also find a larger underestimation in AOD compared to AERONET measurements when switching from CEDS to the lower CEDS21 and ECLv6 emissions, despite better representation of some key regional observed trends. Further studies are required to investigate this in more detail.
Anthropogenic aerosols are changing rapidly, particularly in Asia, with potentially large but insufficiently quantified implications for regional climate. We have demonstrated that differences between recent emission inventories translate to notable differences in global and regional trends in anthropogenic aerosol distributions and in turn in estimates of radiative forcing. Although additional studies are required to fully quantify the broader implications for aerosol-induced climate and health impacts, our results facilitate comparisons between existing and upcoming studies, using different emission inventories, of anthropogenic aerosols and their effects.
The OsloCTM3 is available from https://github.com/NordicESMhub/OsloCTM3 (Søvde et al., 2023).
Model data underlying the paper figures are available from https://doi.org/10.6084/m9.figshare.20254764 (Lund et al., 2023). AERONET data are downloaded from https://aeronet.gsfc.nasa.gov/cgi-bin/webtool_aod_v3 (AERONET, 2023), MODIS data from https://giovanni.gsfc.nasa.gov/giovanni/#service=TmAvMp&starttime=&endtime=&data=MYD08_M3_6_1_AOD_550_Dark_Target_Deep_Blue_Combined_Mean_Mean&variableFacets=dataFieldDiscipline:Aerosols;dataFieldMeasurement:Aerosol Optical Depth;dataProductPlatformInstrument:MODIS-Aqua; (see also Platnick et al., 2015), CEDS21 emissions from https://doi.org/10.5281/zenodo.4509372 (O'Rourke et al., 2021), and GFED4 emissions from https://doi.org/10.3334/ORNLDAAC/1293 (Randerson et al. 2017).
The supplement related to this article is available online at: https://doi.org/10.5194/acp-23-6647-2023-supplement.
MTL led the study design, analysis, and writing. The OsloCTM3 model experiments were performed by MTL and RBS. GM performed the radiative transfer modeling, and BHS contributed to graphics and MODIS analysis. All authors contributed to the discussions and writing.
The contact author has declared that none of the authors has any competing interests.
Publisher's note: Copernicus Publications remains neutral with regard to jurisdictional claims in published maps and institutional affiliations.
The authors acknowledge the UNINETT Sigma2 – the National Infrastructure for High-Performance Computing and Data Storage in Norway – resources (grant no. NN9188K).
This research has been supported by the Norges Forskningsråd (grant nos. 248834, 314997, and 324182).
This paper was edited by Qiang Zhang and reviewed by two anonymous referees.
Aas, W., Mortier, A., Bowersox, V., Cherian, R., Faluvegi, G., Fagerli, H., Hand, J., Klimont, Z., Galy-Lacaux, C., Lehmann, C. M. B., Myhre, C. L., Myhre, G., Olivié, D., Sato, K., Quaas, J., Rao, P. S. P., Schulz, M., Shindell, D., Skeie, R. B., Stein, A., Takemura, T., Tsyro, S., Vet, R., and Xu, X.: Global and regional trends of atmospheric sulfur, Sci. Rep.-UK., 9, 953, https://doi.org/10.1038/s41598-018-37304-0, 2019.
AERONET: The AERONET Data Download Tool, AERONET [data set], https://aeronet.gsfc.nasa.gov/cgi-bin/webtool_aod_v3 (last access: June 2023), 2023.
Bauer, S. E., Koch, D., Unger, N., Metzger, S. M., Shindell, D. T., and Streets, D. G.: Nitrate aerosols today and in 2030: a global simulation including aerosols and tropospheric ozone, Atmos. Chem. Phys., 7, 5043–5059, https://doi.org/10.5194/acp-7-5043-2007, 2007.
Bauer, S. E., Tsigaridis, K., Faluvegi, G., Kelley, M., Lo, K. K., Miller, R. L., Nazarenko, L., Schmidt, G. A., and Wu, J.: Historical (1850–2014) Aerosol Evolution and Role on Climate Forcing Using the GISS ModelE2.1 Contribution to CMIP6, J. Adv. Model. Earth Sy., 12, e2019MS001978, https://doi.org/10.1029/2019MS001978, 2020.
Bellouin, N., Rae, J., Jones, A., Johnson, C., Haywood, J., and Boucher, O.: Aerosol forcing in the Climate Model Intercomparison Project (CMIP5) simulations by HadGEM2-ES and the role of ammonium nitrate, J. Geophys. Res.-Atmos., 116, D20206, https://doi.org/10.1029/2011jd016074, 2011.
Bellouin, N., Quaas, J., Gryspeerdt, E., Kinne, S., Stier, P., Watson-Parris, D., Boucher, O., Carslaw, K. S., Christensen, M., Daniau, A.-L., Dufresne, J.-L., Feingold, G., Fiedler, S., Forster, P., Gettelman, A., Haywood, J. M., Lohmann, U., Malavelle, F., Mauritsen, T., McCoy, D. T., Myhre, G., Mülmenstädt, J., Neubauer, D., Possner, A., Rugenstein, M., Sato, Y., Schulz, M., Schwartz, S. E., Sourdeval, O., Storelvmo, T., Toll, V., Winker, D., and Stevens, B.: Bounding Global Aerosol Radiative Forcing of Climate Change, Rev. Geophys., 58, e2019RG000660, https://doi.org/10.1029/2019RG000660, 2020.
Bian, H., Chin, M., Hauglustaine, D. A., Schulz, M., Myhre, G., Bauer, S. E., Lund, M. T., Karydis, V. A., Kucsera, T. L., Pan, X., Pozzer, A., Skeie, R. B., Steenrod, S. D., Sudo, K., Tsigaridis, K., Tsimpidi, A. P., and Tsyro, S. G.: Investigation of global particulate nitrate from the AeroCom phase III experiment, Atmos. Chem. Phys., 17, 12911–12940, https://doi.org/10.5194/acp-17-12911-2017, 2017.
Bollasina, M. A., Ming, Y., and Ramaswamy, V.: Anthropogenic Aerosols and the Weakening of the South Asian Summer Monsoon, Science, 334, 502–505, https://doi.org/10.1126/science.1204994, 2011.
Cheng, J., Tong, D., Liu, Y., Yu, S., Yan, L., Zheng, B., Geng, G., He, K., and Zhang, Q.: Comparison of Current and Future PM2.5 Air Quality in China Under CMIP6 and DPEC Emission Scenarios, Geophys. Res. Lett., 48, e2021GL093197, https://doi.org/10.1029/2021GL093197, 2021.
Chen, S., Zhang, X., Lin, J., Huang, J., Zhao, D., Yuan, T., Huang, K., Luo, Y., Jia, Z., Zang, Z., Qiu, Y. A., and Xie, L.: Fugitive Road Dust PM2.5 Emissions and Their Potential Health Impacts, Environ. Sci. Technol., 53, 8455–8465, https://doi.org/10.1021/acs.est.9b00666, 2019.
Cherian, R. and Quaas, J.: Trends in AOD, Clouds, and Cloud Radiative Effects in Satellite Data and CMIP5 and CMIP6 Model Simulations Over Aerosol Source Regions, Geophys. Res. Lett., 47, e2020GL087132, https://doi.org/10.1029/2020GL087132, 2020.
Chowdhury, S., Pozzer, A., Haines, A., Klingmüller, K., Münzel, T., Paasonen, P., Sharma, A., Venkataraman, C., and Lelieveld, J.: Global health burden of ambient PM2.5 and the contribution of anthropogenic black carbon and organic aerosols, Environ. Int., 159, 107020, https://doi.org/10.1016/j.envint.2021.107020, 2022.
Crippa, M., Guizzardi, D., Muntean, M., Schaaf, E., Dentener, F., van Aardenne, J. A., Monni, S., Doering, U., Olivier, J. G. J., Pagliari, V., and Janssens-Maenhout, G.: Gridded emissions of air pollutants for the period 1970–2012 within EDGAR v4.3.2, Earth Syst. Sci. Data, 10, 1987–2013, https://doi.org/10.5194/essd-10-1987-2018, 2018.
Crippa, M., Solazzo, E., Huang, G., Guizzardi, D., Koffi, E., Muntean, M., Schieberle, C., Friedrich, R., and Janssens-Maenhout, G.: High resolution temporal profiles in the Emissions Database for Global Atmospheric Research, Scientific Data, 7, 121, https://doi.org/10.1038/s41597-020-0462-2, 2020.
Crippa, M., Guizzardi, D., Butler, T., Keating, T., Wu, R., Kaminski, J., Kuenen, J., Kurokawa, J., Chatani, S., Morikawa, T., Pouliot, G., Racine, J., Moran, M. D., Klimont, Z., Manseau, P. M., Mashayekhi, R., Henderson, B. H., Smith, S. J., Suchyta, H., Muntean, M., Solazzo, E., Banja, M., Schaaf, E., Pagani, F., Woo, J.-H., Kim, J., Monforti-Ferrario, F., Pisoni, E., Zhang, J., Niemi, D., Sassi, M., Ansari, T., and Foley, K.: HTAP_v3 emission mosaic: a global effort to tackle air quality issues by quantifying global anthropogenic air pollutant sources, Earth Syst. Sci. Data Discuss. [preprint], https://doi.org/10.5194/essd-2022-442, in review, 2023.
Elguindi, N., Granier, C., Stavrakou, T., Darras, S., Bauwens, M., Cao, H., Chen, C., Denier van der Gon, H. A. C., Dubovik, O., Fu, T. M., Henze, D. K., Jiang, Z., Keita, S., Kuenen, J. J. P., Kurokawa, J., Liousse, C., Miyazaki, K., Müller, J.-F., Qu, Z., Solmon, F., and Zheng, B.: Intercomparison of Magnitudes and Trends in Anthropogenic Surface Emissions From Bottom-Up Inventories, Top-Down Estimates, and Emission Scenarios, Earth's Future, 8, e2020EF001520, https://doi.org/10.1029/2020EF001520, 2020.
Forster, P., Storelvmo, T., Armour, K., Collins, W., Dufresne, J.-L., Frame, D., Lunt, D. J., Mauritsen, T., Palmer, M. D., Watanabe, M., Wild, M., and Zhang, H.: The Earth's Energy Budget, Climate Feedbacks, and Climate Sensitivity, in: Climate Change 2021: The Physical Science Basis. Contribution of Working Group I to the Sixth Assessment Report of the Intergovernmental Panel on Climate Change, edited by: Masson-Delmotte, V., Zhai, P., Pirani, A., Connors, S. L., Péan, C., Berger, S., Caud, N., Chen, Y., Goldfarb, L., Gomis, M. I., Huang, M., Leitzell, K., Lonnoy, E., Matthews, J. B. R., Maycock, T. K., Waterfield, T., Yelekçi, O., Yu, R., and Zhou, B., Cambridge University Press, Cambridge, United Kingdom and New York, NY, USA, 923–1054, https://doi.org/10.1017/9781009157896.009, 2021.
Fricko, O., Havlik, P., Rogelj, J., Klimont, Z., Gusti, M., Johnson, N., Kolp, P., Strubegger, M., Valin, H., Amann, M., Ermolieva, T., Forsell, N., Herrero, M., Heyes, C., Kindermann, G., Krey, V., McCollum, D. L., Obersteiner, M., Pachauri, S., Rao, S., Schmid, E., Schoepp, W., and Riahi, K.: The marker quantification of the Shared Socioeconomic Pathway 2: A middle-of-the-road scenario for the 21st century, Global Environ. Chang., 42, 251–267, https://doi.org/10.1016/j.gloenvcha.2016.06.004, 2017.
Gliß, J., Mortier, A., Schulz, M., Andrews, E., Balkanski, Y., Bauer, S. E., Benedictow, A. M. K., Bian, H., Checa-Garcia, R., Chin, M., Ginoux, P., Griesfeller, J. J., Heckel, A., Kipling, Z., Kirkevåg, A., Kokkola, H., Laj, P., Le Sager, P., Lund, M. T., Lund Myhre, C., Matsui, H., Myhre, G., Neubauer, D., van Noije, T., North, P., Olivié, D. J. L., Rémy, S., Sogacheva, L., Takemura, T., Tsigaridis, K., and Tsyro, S. G.: AeroCom phase III multi-model evaluation of the aerosol life cycle and optical properties using ground- and space-based remote sensing as well as surface in situ observations, Atmos. Chem. Phys., 21, 87–128, https://doi.org/10.5194/acp-21-87-2021, 2021.
Gómez-Sanabria, A., Kiesewetter, G., Klimont, Z., Schoepp, W., and Haberl, H.: Potential for future reductions of global GHG and air pollutants from circular waste management systems, Nat. Commun., 13, 106, https://doi.org/10.1038/s41467-021-27624-7, 2022.
Gui, K., Che, H., Wang, Y., Xia, X., Holben, B. N., Goloub, P., Cuevas-Agulló, E., Yao, W., Zheng, Y., Zhao, H., Li, L., and Zhang, X.: A global-scale analysis of the MISR Level-3 aerosol optical depth (AOD) product: Comparison with multi-platform AOD data sources, Atmos. Pollut. Res., 12, 101238, https://doi.org/10.1016/j.apr.2021.101238, 2021.
Hegerl, G. C., Brönnimann, S., Cowan, T., Friedman, A. R., Hawkins, E., Iles, C., Müller, W., Schurer, A., and Undorf, S.: Causes of climate change over the historical record, Environ. Res. Lett. 14, 123006, https://doi.org/10.1088/1748-9326/ab4557, 2019.
Hoesly, R. M., Smith, S. J., Feng, L., Klimont, Z., Janssens-Maenhout, G., Pitkanen, T., Seibert, J. J., Vu, L., Andres, R. J., Bolt, R. M., Bond, T. C., Dawidowski, L., Kholod, N., Kurokawa, J.-I., Li, M., Liu, L., Lu, Z., Moura, M. C. P., O'Rourke, P. R., and Zhang, Q.: Historical (1750–2014) anthropogenic emissions of reactive gases and aerosols from the Community Emissions Data System (CEDS), Geosci. Model Dev., 11, 369–408, https://doi.org/10.5194/gmd-11-369-2018, 2018.
Holben, B. N., Eck, T. F., Slutsker, I., Tanré, D., Buis, J. P., Setzer, A., Vermote, E., Reagan, J. A., Kaufman, Y. J., Nakajima, T., Lavenu, F., Jankowiak, I., and Smirnov, A.: AERONET – A Federated Instrument Network and Data Archive for Aerosol Characterization, Remote Sens. Environ., 66, 1–16, https://doi.org/10.1016/S0034-4257(98)00031-5, 1998.
Kanaya, Y., Yamaji, K., Miyakawa, T., Taketani, F., Zhu, C., Choi, Y., Komazaki, Y., Ikeda, K., Kondo, Y., and Klimont, Z.: Rapid reduction in black carbon emissions from China: evidence from 2009–2019 observations on Fukue Island, Japan, Atmos. Chem. Phys., 20, 6339–6356, https://doi.org/10.5194/acp-20-6339-2020, 2020.
Klimont, Z., Smith, S. J., and Cofala, J.: The last decade of global anthropogenic sulfur dioxide: 2000–2011 emissions, Environ. Res. Lett., 8, 014003, https://doi.org/10.1088/1748-9326/8/1/014003, 2013.
Klimont, Z., Kupiainen, K., Heyes, C., Purohit, P., Cofala, J., Rafaj, P., Borken-Kleefeld, J., and Schöpp, W.: Global anthropogenic emissions of particulate matter including black carbon, Atmos. Chem. Phys., 17, 8681–8723, https://doi.org/10.5194/acp-17-8681-2017, 2017.
Kurokawa, J. and Ohara, T.: Long-term historical trends in air pollutant emissions in Asia: Regional Emission inventory in ASia (REAS) version 3, Atmos. Chem. Phys., 20, 12761–12793, https://doi.org/10.5194/acp-20-12761-2020, 2020.
Levy, R. C., Remer, L. A., Kleidman, R. G., Mattoo, S., Ichoku, C., Kahn, R., and Eck, T. F.: Global evaluation of the Collection 5 MODIS dark-target aerosol products over land, Atmos. Chem. Phys., 10, 10399–10420, https://doi.org/10.5194/acp-10-10399-2010, 2010.
Li, C., McLinden, C., Fioletov, V., Krotkov, N., Carn, S., Joiner, J., Streets, D., He, H., Ren, X., Li, Z., and Dickerson, R. R.: India Is Overtaking China as the World's Largest Emitter of Anthropogenic Sulfur Dioxide, Sci. Rep.-UK, 7, 14304, https://doi.org/10.1038/s41598-017-14639-8, 2017.
Lund, M. T., Myhre, G., Haslerud, A. S., Skeie, R. B., Griesfeller, J., Platt, S. M., Kumar, R., Myhre, C. L., and Schulz, M.: Concentrations and radiative forcing of anthropogenic aerosols from 1750 to 2014 simulated with the Oslo CTM3 and CEDS emission inventory, Geosci. Model Dev., 11, 4909–4931, https://doi.org/10.5194/gmd-11-4909-2018, 2018.
Lund, M. T., Myhre, G., and Samset, B. H.: Anthropogenic aerosol forcing under the Shared Socioeconomic Pathways, Atmos. Chem. Phys., 19, 13827–13839, https://doi.org/10.5194/acp-19-13827-2019, 2019.
Lund, M. T., Aamaas, B., Stjern, C. W., Klimont, Z., Berntsen, T. K., and Samset, B. H.: A continued role of short-lived climate forcers under the Shared Socioeconomic Pathways, Earth Syst. Dynam., 11, 977–993, https://doi.org/10.5194/esd-11-977-2020, 2020.
Lund, M. T., Myhre, G., Skeie, R. B., Samset, B. H., and Klimont, Z.: Data collection for “Implications of differences between recent anthropogenic aerosol emission inventories on diagnosed AOD and radiative forcing from 1990 to 2019”, figshare [data set], https://doi.org/10.6084/m9.figshare.20254764, 2023.
Marvel, K., Biasutti, M., and Bonfils, C.: Fingerprints of external forcings on Sahel rainfall: aerosols, greenhouse gases, and model-observation discrepancies, Environ. Res. Lett., 15, 084023, https://doi.org/10.1088/1748-9326/ab858e, 2020.
MOD08 MODIS Level 3 Atmosphere Products (MOD 08): Data Products Handbook Volume 2, https://modis.gsfc.nasa.gov/data/dataprod/dataproducts.php?MOD_NUMBER=08 (last access: 26 April 2018), 2018.
Mortier, A., Gliß, J., Schulz, M., Aas, W., Andrews, E., Bian, H., Chin, M., Ginoux, P., Hand, J., Holben, B., Zhang, H., Kipling, Z., Kirkevåg, A., Laj, P., Lurton, T., Myhre, G., Neubauer, D., Olivié, D., von Salzen, K., Skeie, R. B., Takemura, T., and Tilmes, S.: Evaluation of climate model aerosol trends with ground-based observations over the last 2 decades – an AeroCom and CMIP6 analysis, Atmos. Chem. Phys., 20, 13355–13378, https://doi.org/10.5194/acp-20-13355-2020, 2020.
Moseid, K. O., Schulz, M., Storelvmo, T., Julsrud, I. R., Olivié, D., Nabat, P., Wild, M., Cole, J. N. S., Takemura, T., Oshima, N., Bauer, S. E., and Gastineau, G.: Bias in CMIP6 models as compared to observed regional dimming and brightening, Atmos. Chem. Phys., 20, 16023–16040, https://doi.org/10.5194/acp-20-16023-2020, 2020.
Myhre, G., Samset, B. H., Schulz, M., Balkanski, Y., Bauer, S., Berntsen, T. K., Bian, H., Bellouin, N., Chin, M., Diehl, T., Easter, R. C., Feichter, J., Ghan, S. J., Hauglustaine, D., Iversen, T., Kinne, S., Kirkevåg, A., Lamarque, J.-F., Lin, G., Liu, X., Lund, M. T., Luo, G., Ma, X., van Noije, T., Penner, J. E., Rasch, P. J., Ruiz, A., Seland, Ø., Skeie, R. B., Stier, P., Takemura, T., Tsigaridis, K., Wang, P., Wang, Z., Xu, L., Yu, H., Yu, F., Yoon, J.-H., Zhang, K., Zhang, H., and Zhou, C.: Radiative forcing of the direct aerosol effect from AeroCom Phase II simulations, Atmos. Chem. Phys., 13, 1853–1877, https://doi.org/10.5194/acp-13-1853-2013, 2013.
Myhre, G., Aas, W., Cherian, R., Collins, W., Faluvegi, G., Flanner, M., Forster, P., Hodnebrog, Ø., Klimont, Z., Lund, M. T., Mülmenstädt, J., Lund Myhre, C., Olivié, D., Prather, M., Quaas, J., Samset, B. H., Schnell, J. L., Schulz, M., Shindell, D., Skeie, R. B., Takemura, T., and Tsyro, S.: Multi-model simulations of aerosol and ozone radiative forcing due to anthropogenic emission changes during the period 1990–2015, Atmos. Chem. Phys., 17, 2709–2720, https://doi.org/10.5194/acp-17-2709-2017, 2017.
O'Rourke, P. R., Smith, S. J., Mott, A., Ahsan, H., McDuffie, E. E., Crippa, M., Klimont, S., McDonald, B., Wang, Z., Nicholson, M. B., Feng, L., and Hoesly, R. M.: CEDS v-2021-02-05 Emission Data 1975–2019 (Version Feb-05-2021), Zenodo [data set], https://doi.org/10.5281/zenodo.4509372, 2021.
Paulot, F., Paynter, D., Ginoux, P., Naik, V., and Horowitz, L. W.: Changes in the aerosol direct radiative forcing from 2001 to 2015: observational constraints and regional mechanisms, Atmos. Chem. Phys., 18, 13265–13281, https://doi.org/10.5194/acp-18-13265-2018, 2018.
Persad, G. G., Samset, B. H., and Wilcox, L. J.: Comment: Aerosols must be included in climate risk assessments, Nature, 611, 662–664, 2022.
Platnick, S., Hubanks, P., Meyer, K., and King, M. D.: MODIS Atmosphere L3 Monthly Product (08_L3), NASA MODIS Adaptive Processing System, Goddard Space Flight Center [data set], https://modis.gsfc.nasa.gov/data/dataprod/mod08.php (last access: June 2023), 2015.
Quaas, J., Boucher, O., and Lohmann, U.: Constraining the total aerosol indirect effect in the LMDZ and ECHAM4 GCMs using MODIS satellite data, Atmos. Chem. Phys., 6, 947–955, https://doi.org/10.5194/acp-6-947-2006, 2006.
Quaas, J., Jia, H., Smith, C., Albright, A. L., Aas, W., Bellouin, N., Boucher, O., Doutriaux-Boucher, M., Forster, P. M., Grosvenor, D., Jenkins, S., Klimont, Z., Loeb, N. G., Ma, X., Naik, V., Paulot, F., Stier, P., Wild, M., Myhre, G., and Schulz, M.: Robust evidence for reversal of the trend in aerosol effective climate forcing, Atmos. Chem. Phys., 22, 12221–12239, https://doi.org/10.5194/acp-22-12221-2022, 2022.
Ramachandran, S., Rupakheti, M., and Cherian, R.: Insights into recent aerosol trends over Asia from observations and CMIP6 simulations, Sci. Total Environ., 807, 150756, https://doi.org/10.1016/j.scitotenv.2021.150756, 2022.
Randerson, J. T., van der Werf, G. R., Giglio, L., Collatz, G. J., and Kasibhatla, P. S.: Global Fire Emissions Database, Version 4.1 (GFEDv4), ORNL DAAC [data set], https://doi.org/10.3334/ORNLDAAC/1293, 2017.
Regayre, L. A., Pringle, K. J., Booth, B. B. B., Lee, L. A., Mann, G. W., Browse, J., Woodhouse, M. T., Rap, A., Reddington, C. L., and Carslaw, K. S.: Uncertainty in the magnitude of aerosol-cloud radiative forcing over recent decades, Geophys. Res. Lett., 41, 9040–9049, https://doi.org/10.1002/2014GL062029, 2014.
Samset, B. H., Sand, M., Smith, C. J., Bauer, S. E., Forster, P. M., Fuglestvedt, J. S., Osprey, S., and Schleussner, C.-F.: Climate Impacts From a Removal of Anthropogenic Aerosol Emissions, Geophys. Res. Lett., 45, 1020–1029, https://doi.org/10.1002/2017GL076079, 2018.
Samset, B. H., Lund, M. T., Bollasina, M., Myhre, G., and Wilcox, L.: Emerging Asian aerosol patterns, Nat. Geosci., 12, 582–584, https://doi.org/10.1038/s41561-019-0424-5, 2019.
SCPRC The State Council Issues Action Plan on Prevention and Control of Air Pollution Introducing Ten Measures to Improve Air Quality: https://english.mee.gov.cn/News_service/infocus/201309/t20130924_260707.shtm (last access: 22 January 2020), 2013.
SCPRC The State Council rolls out a three-year action plan for clean air: https://english.mee.gov.cn/News_service/news_release/201807/t20180713_446624.shtml (last access: 22 January 2020), 2018.
Sherman, J. P., Gupta, P., Levy, R. C., and Sherman, P. J.: An Evaluation of MODIS-Retrieved Aerosol Optical Depth over a Mountainous AERONET Site in the Southeastern US, Aerosol Air Qual. Res., 16, 3243–3255, https://doi.org/10.4209/aaqr.2015.09.0568, 2017.
Sillmann, J., Pozzoli, L., Vignati, E., Kloster, S., and Feichter, J.: Aerosol effect on climate extremes in Europe under different future scenarios, Geophys. Res. Lett., 40, 2290–2295, https://doi.org/10.1002/grl.50459, 2013.
Smith, S. J., McDuffie, E. E., and Charles, M.: Opinion: Coordinated development of emission inventories for climate forcers and air pollutants, Atmos. Chem. Phys., 22, 13201–13218, https://doi.org/10.5194/acp-22-13201-2022, 2022.
Stamnes, K., Tsay, S. C., Wiscombe, W., and Jayaweera, K.: Numerically stable algorithm for discrete-ordinate-method radiative transfer in multiple scattering and emitting layered media, Appl. Opt., 27, 2502–2509, https://doi.org/10.1364/AO.27.002502, 1988.
Su, W., Liang, L., Myhre, G., Thorsen, T. J., Loeb, N. G., Schuster, G. L., Ginoux, P., Paulot, F., Neubauer, D., Checa-Garcia, R., Matsui, H., Tsigaridis, K., Skeie, R. B., Takemura, T., Bauer, S. E., and Schulz, M.: Understanding Top-of-Atmosphere Flux Bias in the AeroCom Phase III Models: A Clear-Sky Perspective, J. Adv. Model. Earth Sy., 13, e2021MS002584, https://doi.org/10.1029/2021MS002584, 2021.
Søvde, O. A., Prather, M. J., Isaksen, I. S. A., Berntsen, T. K., Stordal, F., Zhu, X., Holmes, C. D., and Hsu, J.: The chemical transport model Oslo CTM3, Geosci. Model Dev., 5, 1441–1469, https://doi.org/10.5194/gmd-5-1441-2012, 2012.
Søvde, O. A., Prather, M. J., Isaksen, I. S. A., Berntsen, T. K., Stordal, F., Zhu, X., Holmes, C. D., and Hsu, J.: The OsloCTM3, GitHub [code], https://github.com/NordicESMhub/OsloCTM3 (last access: June 2023), 2023.
Szopa, S., Naik, V., Adhikary, B., Artaxo, P., Berntsen, T., Collins, W. D., Fuzzi, S., Gallardo, L., Kiendler Scharr, A., Klimont, Z., Liao, H., Unger, N., and Zanis, P.: Short-Lived Climate Forcers, in: Climate Change 2021: The Physical Science Basis. Contribution of Working Group I to the Sixth Assessment Report of the Intergovernmental Panel on Climate Change, edited by: Masson-Delmotte, V., Zhai, P., Pirani, A., Connors, S. L., Péan, C., Berger, S., Caud, N., Chen, Y., Goldfarb, L., Gomis, M. I., Huang, M., Leitzell, K., Lonnoy, E., Matthews, J. B. R., Maycock, T. K., Waterfield, T., Yelekçi, O., Yu, R., and Zhou, B., Cambridge University Press, Cambridge, United Kingdom and New York, NY, USA, 817–922, https://doi.org/10.1017/9781009157896.008, 2021.
Tong, D., Cheng, J., Liu, Y., Yu, S., Yan, L., Hong, C., Qin, Y., Zhao, H., Zheng, Y., Geng, G., Li, M., Liu, F., Zhang, Y., Zheng, B., Clarke, L., and Zhang, Q.: Dynamic projection of anthropogenic emissions in China: methodology and 2015–2050 emission pathways under a range of socio-economic, climate policy, and pollution control scenarios, Atmos. Chem. Phys., 20, 5729–5757, https://doi.org/10.5194/acp-20-5729-2020, 2020.
van Marle, M. J. E., Kloster, S., Magi, B. I., Marlon, J. R., Daniau, A.-L., Field, R. D., Arneth, A., Forrest, M., Hantson, S., Kehrwald, N. M., Knorr, W., Lasslop, G., Li, F., Mangeon, S., Yue, C., Kaiser, J. W., and van der Werf, G. R.: Historic global biomass burning emissions for CMIP6 (BB4CMIP) based on merging satellite observations with proxies and fire models (1750–2015), Geosci. Model Dev., 10, 3329–3357, https://doi.org/10.5194/gmd-10-3329-2017, 2017.
Vogel, A., Alessa, G., Scheele, R., Weber, L., Dubovik, O., North, P., and Fiedler, S.: Uncertainty in Aerosol Optical Depth From Modern Aerosol-Climate Models, Reanalyses, and Satellite Products, J. Geophys. Res.-Atmos., 127, e2021JD035483, https://doi.org/10.1029/2021JD035483, 2022.
Wang, C.-S., Wang, Z.-L., Lei, Y.-D., Zhang, H., Che, H.-Z., and Zhang, X.-Y.: Differences in East Asian summer monsoon responses to Asian aerosol forcing under different emission inventories, Advances in Climate Change Research, 13, 309–322, https://doi.org/10.1016/j.accre.2022.02.008, 2022.
Wang, Z., Lin, L., Xu, Y., Che, H., Zhang, X., Zhang, H., Dong, W., Wang, C., Gui, K., and Xie, B.: Incorrect Asian aerosols affecting the attribution and projection of regional climate change in CMIP6 models, NPJ Climate and Atmospheric Science, 4, 2, https://doi.org/10.1038/s41612-020-00159-2, 2021.
Wiedinmyer, C., Yokelson, R. J., and Gullett, B. K.: Global Emissions of Trace Gases, Particulate Matter, and Hazardous Air Pollutants from Open Burning of Domestic Waste, Environ. Sci. Technol., 48, 9523–9530, https://doi.org/10.1021/es502250z, 2014.
Womack, C. C., McDuffie, E. E., Edwards, P. M., Bares, R., de Gouw, J. A., Docherty, K. S., Dubé, W. P., Fibiger, D. L., Franchin, A., Gilman, J. B., Goldberger, L., Lee, B. H., Lin, J. C., Long, R., Middlebrook, A. M., Millet, D. B., Moravek, A., Murphy, J. G., Quinn, P. K., Riedel, T. P., Roberts, J. M., Thornton, J. A., Valin, L. C., Veres, P. R., Whitehill, A. R., Wild, R. J., Warneke, C., Yuan, B., Baasandorj, M., and Brown, S. S.: An Odd Oxygen Framework for Wintertime Ammonium Nitrate Aerosol Pollution in Urban Areas: NOx and VOC Control as Mitigation Strategies, Geophys. Res. Lett., 46, 4971–4979, https://doi.org/10.1029/2019GL082028, 2019.
Wu, C., Venevsky, S., Sitch, S., Mercado, L. M., Huntingford, C., and Staver, A. C.: Historical and future global burned area with changing climate and human demography, One Earth, 4, 517–530, https://doi.org/10.1016/j.oneear.2021.03.002, 2021.
Xia, W., Wang, Y., Chen, S., Huang, J., Wang, B., Zhang, G. J., Zhang, Y., Liu, X., Ma, J., Gong, P., Jiang, Y., Wu, M., Xue, J., Wei, L., and Zhang, T.: Double Trouble of Air Pollution by Anthropogenic Dust, Environ. Sci. Technol., 56, 761–769, https://doi.org/10.1021/acs.est.1c04779, 2022.
Yang, S., Yuan, B., Peng, Y., Huang, S., Chen, W., Hu, W., Pei, C., Zhou, J., Parrish, D. D., Wang, W., He, X., Cheng, C., Li, X.-B., Yang, X., Song, Y., Wang, H., Qi, J., Wang, B., Wang, C., Wang, C., Wang, Z., Li, T., Zheng, E., Wang, S., Wu, C., Cai, M., Ye, C., Song, W., Cheng, P., Chen, D., Wang, X., Zhang, Z., Wang, X., Zheng, J., and Shao, M.: The formation and mitigation of nitrate pollution: comparison between urban and suburban environments, Atmos. Chem. Phys., 22, 4539–4556, https://doi.org/10.5194/acp-22-4539-2022, 2022.
Zhai, S., Jacob, D. J., Wang, X., Liu, Z., Wen, T., Shah, V., Li, K., Moch, J. M., Bates, K. H., Song, S., Shen, L., Zhang, Y., Luo, G., Yu, F., Sun, Y., Wang, L., Qi, M., Tao, J., Gui, K., Xu, H., Zhang, Q., Zhao, T., Wang, Y., Lee, H. C., Choi, H., and Liao, H.: Control of particulate nitrate air pollution in China, Nat. Geosci., 14, 389–395, https://doi.org/10.1038/s41561-021-00726-z, 2021.
Zheng, B., Tong, D., Li, M., Liu, F., Hong, C., Geng, G., Li, H., Li, X., Peng, L., Qi, J., Yan, L., Zhang, Y., Zhao, H., Zheng, Y., He, K., and Zhang, Q.: Trends in China's anthropogenic emissions since 2010 as the consequence of clean air actions, Atmos. Chem. Phys., 18, 14095–14111, https://doi.org/10.5194/acp-18-14095-2018, 2018.