the Creative Commons Attribution 4.0 License.
the Creative Commons Attribution 4.0 License.
 | 15 Jun 2023
An intercomparison study of four different techniques for measuring the chemical composition of nanoparticles
Lucía Caudillo
Mihnea Surdu
Brandon Lopez
Mingyi Wang
Markus Thoma
Steffen Bräkling
Angela Buchholz
Mario Simon
Andrea C. Wagner
Tatjana Müller
Manuel Granzin
Martin Heinritzi
Antonio Amorim
David M. Bell
Zoé Brasseur
Lubna Dada
Jonathan Duplissy
Henning Finkenzeller
Xu-Cheng He
Houssni Lamkaddam
Naser G. A. Mahfouz
Vladimir Makhmutov
Hanna E. Manninen
Guillaume Marie
Ruby Marten
Roy L. Mauldin
Bernhard Mentler
Antti Onnela
Tuukka Petäjä
Joschka Pfeifer
Maxim Philippov
Ana A. Piedehierro
Birte Rörup
Wiebke Scholz
Jiali Shen
Dominik Stolzenburg
Christian Tauber
Ping Tian
António Tomé
Nsikanabasi Silas Umo
Dongyu S. Wang
Yonghong Wang
Stefan K. Weber
André Welti
Marcel Zauner-Wieczorek
Urs Baltensperger
Richard C. Flagan
Armin Hansel
Jasper Kirkby
Markku Kulmala
Katrianne Lehtipalo
Douglas R. Worsnop
Imad El Haddad
Neil M. Donahue
Alexander L. Vogel
Andreas Kürten
Joachim Curtius
Currently, the complete chemical characterization of nanoparticles (< 100 nm) represents an analytical challenge, since these particles are abundant in number but have negligible mass. Several methods for particle-phase characterization have been recently developed to better detect and infer more accurately the sources and fates of sub-100 nm particles, but a detailed comparison of different approaches is missing. Here we report on the chemical composition of secondary organic aerosol (SOA) nanoparticles from experimental studies of α-pinene ozonolysis at −50, −30, and −10 ∘C and intercompare the results measured by different techniques. The experiments were performed at the Cosmics Leaving OUtdoor Droplets (CLOUD) chamber at the European Organization for Nuclear Research (CERN). The chemical composition was measured simultaneously by four different techniques: (1) thermal desorption–differential mobility analyzer (TD–DMA) coupled to a NO chemical ionization–atmospheric-pressure-interface–time-of-flight (CI–APi–TOF) mass spectrometer, (2) filter inlet for gases and aerosols (FIGAERO) coupled to an I− high-resolution time-of-flight chemical ionization mass spectrometer (HRToF-CIMS), (3) extractive electrospray Na+ ionization time-of-flight mass spectrometer (EESI-TOF), and (4) offline analysis of filters (FILTER) using ultra-high-performance liquid chromatography (UHPLC) and heated electrospray ionization (HESI) coupled to an Orbitrap high-resolution mass spectrometer (HRMS). Intercomparison was performed by contrasting the observed chemical composition as a function of oxidation state and carbon number, by estimating the volatility and comparing the fraction of volatility classes, and by comparing the thermal desorption behavior (for the thermal desorption techniques: TD–DMA and FIGAERO) and performing positive matrix factorization (PMF) analysis for the thermograms. We found that the methods generally agree on the most important compounds that are found in the nanoparticles. However, they do see different parts of the organic spectrum. We suggest potential explanations for these differences: thermal decomposition, aging, sampling artifacts, etc. We applied PMF analysis and found insights of thermal decomposition in the TD–DMA and the FIGAERO.
- Article
(3632 KB) - Full-text XML
-
Supplement
(1834 KB) - BibTeX
- EndNote


So far there is no well-established instrument and technique to measure the complete chemical composition of ultrafine (< 100 nm) secondary organic aerosol (SOA) particles. However, several analytical techniques have recently been developed in order to better advance our understanding on their chemistry. Techniques that are capable of measuring sub-30 nm particles include the Volatile Aerosol Component Analyzer (VACA) (Curtius et al., 1998), thermal desorption–chemical ionization mass spectrometry (TDCIMS) (Voisin et al., 2003), the Nano Aerosol Mass Spectrometer (NAMS) (Wang et al., 2006), the aerosol time-of-flight mass spectrometer (Laitinen et al., 2009), the inlet for the size-resolved collection of aerosols (Phares and Collier, 2010), the Chemical Analyzer for Charged Ultrafine Particles (CAChUP) (Gonser and Held, 2013), electrostatic precipitation–electrospray ionization mass spectrometry (EP–ESI-MS) (He et al., 2015), droplet-assisted inlet ionization (DAII) (Horan et al., 2017), and online aerosol chemical characterization by the extractive electrospray ionization–ultra-high-resolution mass spectrometer (EESI-Orbitrap) (Lee et al., 2020). Single-particle analysis by mass spectrometry methods based on aerodynamics, light scattering, and laser desorption ionization are suitable for particles with larger sizes. These methods include, for example, the aerosol mass spectrometer (AMS) described in Jayne et al. (2000) and the suite of single-particle methods described in the review by Bzdek et al. (2012). The detection of particles with d < 100 nm using these techniques becomes difficult because the scattering efficiency decreases when the particle diameter becomes smaller.
Using the Cosmics Leaving OUtdoor Droplets (CLOUD) chamber at the European Organization for Nuclear Research (CERN), we simultaneously used four different techniques for measuring the chemical composition of ultrafine particles and intercompare the results:
-
thermal desorption–differential mobility analyzer (TD–DMA) coupled to a NO chemical ionization–atmospheric-pressure-interface–time-of-flight (CI–APi–TOF) mass spectrometer (Wagner et al., 2018),
-
filter inlet for gases and aerosols (FIGAERO) coupled to an I− high-resolution time-of-flight chemical ionization mass spectrometer (HRToF-CIMS) (Lopez-Hilfiker et al., 2014),
-
extractive electrospray Na+ ionization time-of-flight mass spectrometer (EESI-TOF) (Lopez-Hilfiker et al., 2019), and
-
offline analysis of filters (FILTER) using ultra-high-performance liquid chromatography (UHPLC) and heated electrospray ionization (HESI) coupled to an Orbitrap high-resolution mass spectrometer (HRMS) (Ungeheuer et al., 2021).
None of the techniques presented in this work represent the perfect instrument. In fact, a perfect instrument would be the one that is able to quantitatively measure all the hundreds of organic compounds that are present not only in the newly formed particles in the lab, but also in aerosol particles present in the ambient, i.e., with larger particles being present as well and at low mass concentration of the ultrafine particles. A perfect instrument should also be able to identify the molecular structures (including their isomeric and spatial configuration) at high time resolution and in real time. Such an ideal instrument does not exist, and at present, a combination of techniques is required for a more complete characterization of SOA (Hallquist et al., 2009).
In order to compare the techniques mentioned above and to gain insights into their limitations (due to decomposition during evaporation, different ionization techniques, etc.), we performed α-pinene ozonolysis experiments at −50, −30, and −10 ∘C. For the experiments at −50 and −30 ∘C TD–DMA, FIGAERO, and EESI-TOF were intercompared, while for the experiment at −10 ∘C FILTER, FIGAERO, and EESI-TOF were intercompared. We carried out the in-depth intercomparison by (a) comparing the observed composition as a function of oxidation state and carbon number; (b) estimating the volatility and comparing the fraction of ultralow-volatility (ULVOCs), extremely low-volatility (ELVOCs), low-volatility (LVOCs), semi-volatile (SVOCs), and intermediate-volatility (IVOCs) organic compounds; and (c) comparing the thermograms (for the thermal desorption techniques: TD–DMA and FIGAERO) and performing positive matrix factorization (PMF) analysis on the thermograms.
Because the four techniques provide chemical composition, and more specifically the carbon, hydrogen, and oxygen content (CHO), we determined the carbon oxidation state (OSc), which is a metric for the degree of the oxidation of organic species in the atmosphere (Kroll et al., 2011). It is calculated based on the ratios O : C and H : C and is useful to describe organic mixtures upon oxidation processes. In addition, we estimated the volatility (as introduced by Donahue et al., 2011, and modified by Stolzenburg et al., 2018) and determined the volatility classes to which the detected compounds belong. Regarding the thermal desorption methods (TD–DMA and FIGAERO) we investigated the thermal behavior of the detected species. Both instruments first collect particles, and subsequently the particles are evaporated in order to transfer their constituents to the gas phase. When a temperature ramp is applied, the species that are adsorbed on the surface gradually desorb (as represented on a thermogram). In order to evaluate whether the thermal desorption methods lead to significant decomposition during evaporation, we applied a method called positive matrix factorization (Paatero and Tapper, 1994; Buchholz et al., 2020), in which a data set matrix is expressed in terms of the sum of factor matrices and a residual matrix. Thermal decomposition of FIGAERO particle-phase data has been reported previously. D'Ambro et al. (2019) observed that some of the major components of IEPOX (isoprene-derived epoxydiol) in SOA such as C5H10O3 and C5H12O4 are likely artifacts of thermal decomposition. Lopez-Hilfiker et al. (2015), Stark et al. (2017), and Wang and Hildebrandt Ruiz (2018) have addressed the importance of considering thermal decomposition for assessing the chemical composition and volatility properties of SOA in techniques in which the aerosol is heated before or during the analysis. In this study, we evaluate thermal decomposition of TD–DMA samples for the first time and intercompare the results with FIGAERO.
Lastly, we present an overview of the advantages and disadvantages for the different methods. All methods presented here agreed on the most dominant compounds that are found in the nanoparticles. Nevertheless, they do see different parts of the organic spectrum. Therefore, the techniques are complementary. The four techniques described in this work are feasible for measuring sub-100 nm SOA particles and represent an important analytical development.
2.1 Experimental approach
2.1.1 The CLOUD chamber experiment
We conducted experiments in the CLOUD chamber at CERN to study pure biogenic new particle formation (NPF) without the presence of nitrogen oxides (NOx). The CLOUD chamber is a stainless-steel cylinder with a volume of 26.1 m3 and has been extensively described by Kirkby et al. (2011) and Duplissy et al. (2016). To create the particles, NPF was induced by continuously adding α-pinene and ozone into the chamber. The monoterpene concentration was regulated by an evaporation source, in which dry nitrogen (N2) passes through an evaporator containing liquid α-pinene at a precisely controlled temperature. Ozone was produced by exposing cryogenic O2 to UV light and was introduced directly into the chamber via a separate line. The relative humidity was adjusted with a temperature-controlled Nafion humidifier using ultrapure Millipore water. All the precursor gases were homogenously mixed in the chamber by two magnetically driven Teflon fans placed at the top and at the bottom of the chamber. The temperature was kept constant by an insulated thermal housing, which surrounds the chamber. The α-pinene mixing ratio was measured by a proton transfer reaction time-of-flight (PTR-TOF) mass spectrometer (Graus et al., 2010; Breitenlechner et al., 2017), whereas ozone was measured by a TEI 49C ozone analyzer (Thermo Environmental Instruments). The experiments relevant for this work were performed at −50, −30, and −10 ∘C. The α-pinene mixing ratio ranged between 1 and 8 ppbv, and ozone was approximately 100 ppbv.
Table 1 presents the most important features for the instruments used in this work. We categorize the techniques according to certain criteria: continuous- or discontinuous-operation mode, evaporation method, phase measured, ionization technique, reagent ion, target substances, occurrence of significant thermal decomposition, and whether the technique allows size-resolved analysis of aerosol particles to be performed.
Table 1Instruments for measuring particle-phase chemical composition used in the CLOUD chamber experiments; n/a: not applicable.
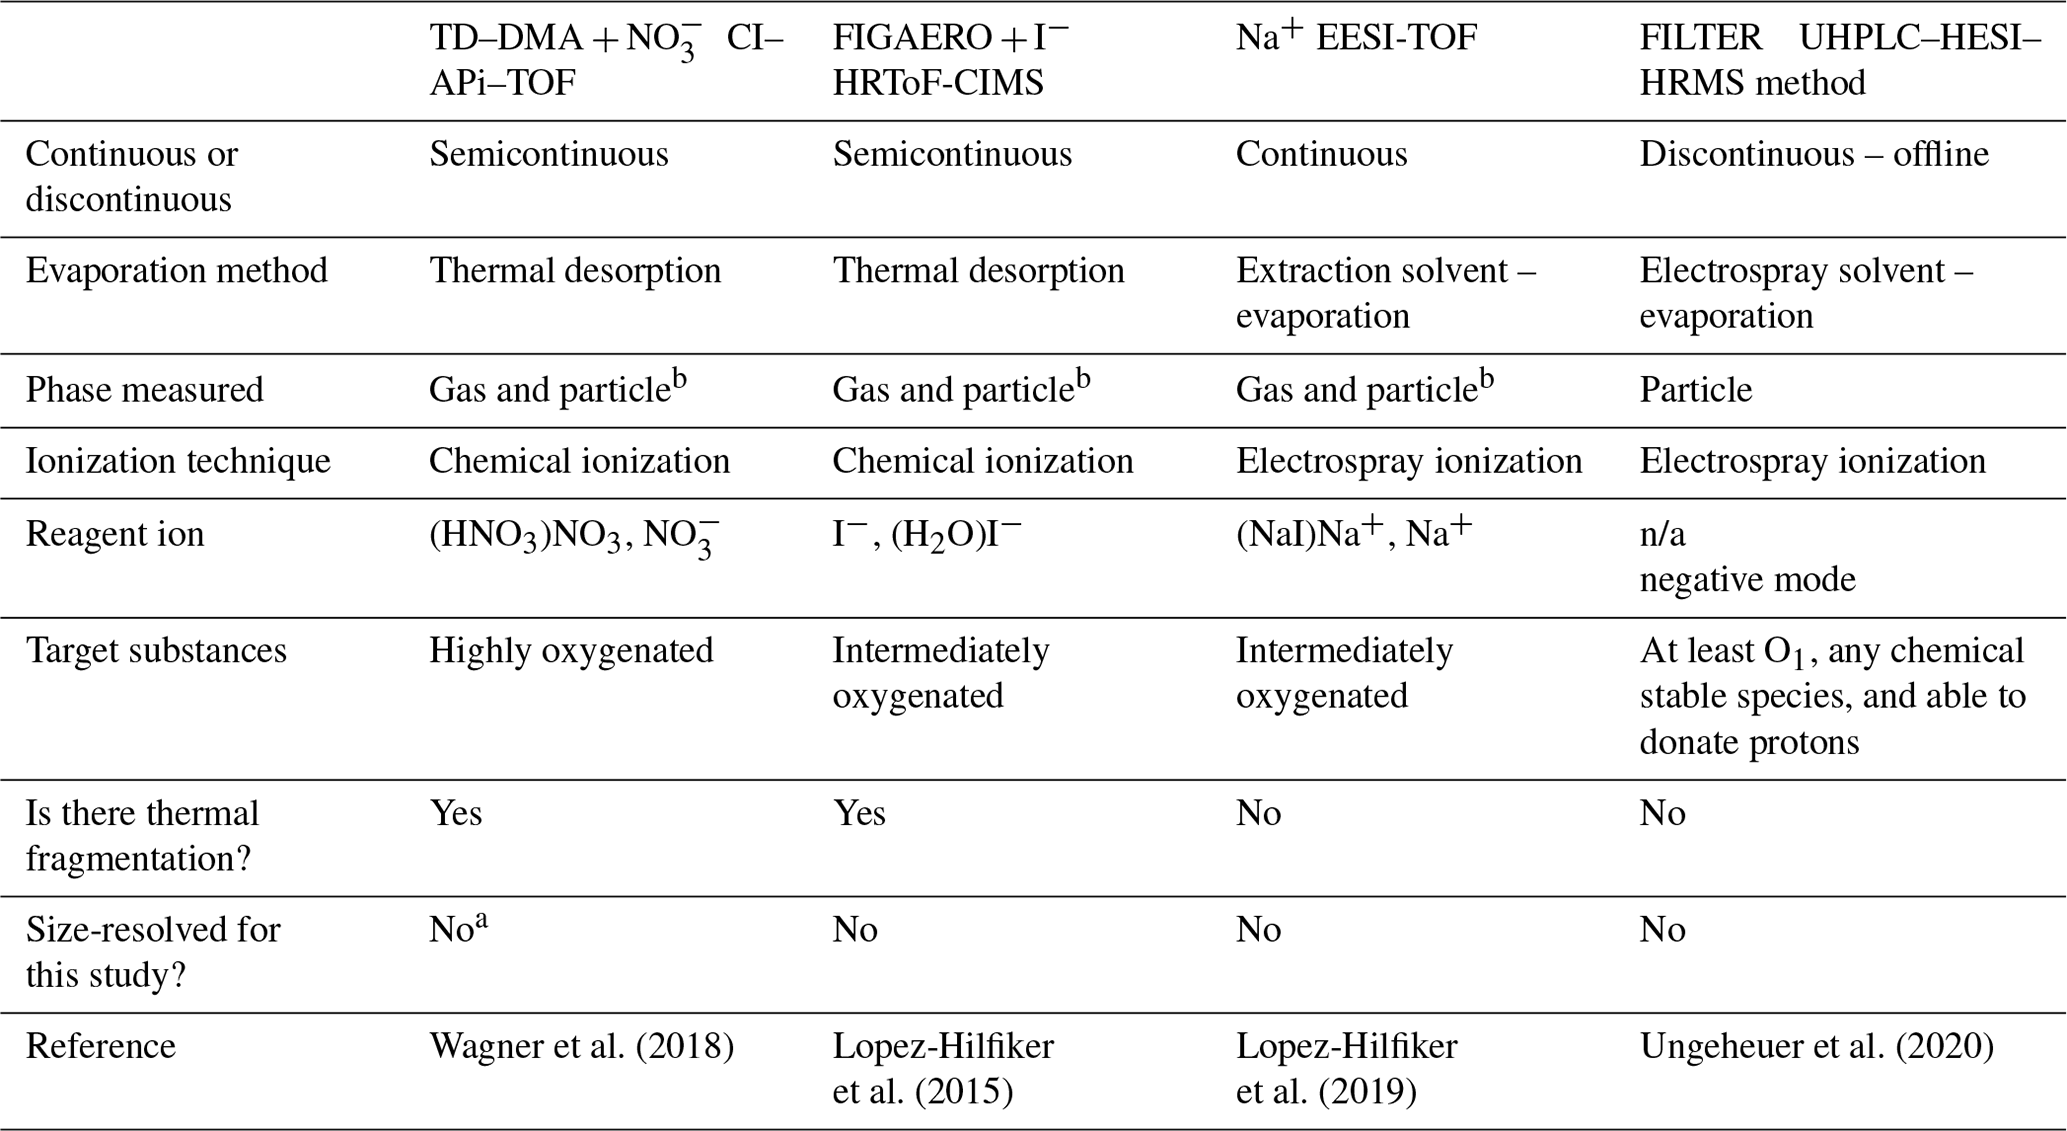
a TD–DMA can take both size-resolved and non-size-resolved measurements. For this work, non-size-resolved measurements were chosen in order to maximize the mass collected and to intercompare with the particle-phase instruments. b In this work, only the particle-phase measurements are reported. c Gas and particle phases can be measured by using the dual EESI-TOF configuration.
2.1.2 Thermal desorption–differential mobility analyzer (TD–DMA) coupled to a NO chemical ionization–atmospheric-pressure-interface–time-of-flight (CI–APi–TOF) mass spectrometer
The TD–DMA coupled to a NO CI–APi–TOF analyzes the chemical composition of nanoparticles in a semicontinuous mode of operation. The design and characterization have been reported by Wagner et al. (2018). This method allows gas- and particle-phase measurements using the same ionization technique. Individual results of gas- and particle-phase comparison of the same chemical system as in this study were reported in Caudillo et al. (2021). While the gas-phase measurement is taking place with the CI–APi–TOF mass spectrometer, the TD–DMA samples particles from the chamber. The TD–DMA can perform size-resolved and non-size-resolved measurements. In any case, the particles are first charged by an X-Ray source and then transferred to the differential mobility analyzer (DMA) unit. When a size-resolved measurement is desired, a specific voltage is applied to the central electrode inside the DMA unit. Subsequently, a sheath flow will carry only particles with specific electrical mobility and will conduct them through the DMA. In contrast, during a non-size-resolved measurement, no voltage to the central electrode and no sheath flow are applied, and a fraction of the particles charged by the X-ray source will pass through the DMA unit. For the experiments reported in the present study, we performed non-size-resolved measurements in order to maximize the mass collected and to be comparable to the other methods that do not perform size selection.
The particle collection takes place by electrostatic precipitation on a platinum–rhodium (90:10) filament placed inside the central electrode. After a certain collection time (∼ 3 h for the experiment at −30 ∘C and ∼ 5 h for the experiment at −50 ∘C), an electric current is applied to the filament, which causes its direct heating. We estimate based on the filament resistance that the temperature gradually increased up to approximately 600 ∘C in a period of ∼ 1 min (details of the heating curve are discussed in Sect. 3.2).
The vapors that evaporate from the heated particles are carried by an N2 flow to the nitrate CI–APi–TOF for chemical composition analysis. For chemical ionization of the vapors, nitrate reagent ions (HNO3)n NO with n=0–2 are created by a corona discharge (Kürten et al., 2011; Kürten et al., 2014). Some of the vapor molecules are ionized and subsequently detected by the APi-TOF mass spectrometer. A second heating cycle of the particle-collecting filament is performed afterwards (without particle collection) in order to estimate the instrumental background due to the heating of the inlet line; this enables a more accurate determination of particle constituents. The particle constituents are estimated by subtracting the second heating from the first heating. Besides the particle and background estimations, a second heating up to ∼ 600 ∘C ensures that the filament is clean and avoids memory effects for the next measurement. With the nitrate ionization technique, sulfuric acid (Jokinen et al., 2012), iodic acid (He et al., 2021), methane sulfonic acid (Shen et al., 2022), and highly oxygenated molecules (Kirkby et al., 2016; Simon et al., 2020) can be detected.
2.1.3 Filter inlet for gases and aerosols (FIGAERO) coupled to an I− high-resolution time-of-flight chemical ionization mass spectrometer (HRToF-CIMS)
FIGAERO coupled to an I− HRToF-CIMS was first described by Lopez-Hilfiker et al. (2014) and optimized for CLOUD operation conditions by Wang et al. (2020). FIGAERO uses a multi-port to measure in alternation both the gas and particle phases following the same general procedure as the TD–DMA–CI–APi–TOF. While the gas phase is analyzed, particle collection takes place on a polytetrafluoroethylene (PTFE) filter, and after a certain collection time (in this study 15 min), the filter is automatically moved into the ion–molecule reactor and exposed to a pure N2 gas flow. The N2 flow is gradually heated to evaporate the particles by thermal desorption using a temperature-programmed heating curve. For the measurements reported in this study, the temperature was slowly ramped from room temperature up to 150 ∘C in approximately 15 min (an example of the heating curve is discussed in Sect. 3.2). When the heating cycle ends a new collection starts, and the process repeats. Thus, the 15 min collection period is followed by a 15 min desorption period, which implies two collections per hour (resulting in a resolution of 30 min). The detection technique is based on iodide–molecule adduct ionization. Iodine ions I−, I, and (H2O)I− are generated from a solution of methyl iodide (CH3I) and a Po-210 ion source (Lee et al., 2014). With this soft-ionization technique, the FIGAERO–HRToF-CIMS can detect intermediately oxygenated organic molecules (Wang et al., 2020; Stolzenburg et al., 2018; Lopez-Hilfiker et al., 2016), organosulfates, and inorganic acids such as sulfuric acid and nitric acid.
2.1.4 Extractive electrospray Na+ ionization time-of-flight mass spectrometer (EESI-TOF)
The extractive electrospray ionization time-of-flight mass spectrometer (Lopez-Hilfiker et al., 2019) is a technique used for online particle-phase measurements without batch collection. This technique aims to provide the chemical composition of organic particles in real time (1 s). It is also possible to measure the gas phase by using the dual configuration (Lee et al., 2022). In the beginning of the sampling process, the aerosol sample passes through the inlet line, where a carbon denuder is located to remove the gas-phase molecules. The particles then collide with electrospray droplets, and the soluble components are extracted and ionized. Then, solvent evaporation occurs in a heated stainless-steel capillary, leading to Coulomb fissioning and/or direct ion desorption. Finally, ions enter a time-of-flight mass spectrometer. The EESI-TOF here uses an electrospray solution of pure water doped with 100 ppm NaI and is running in the positive-ion mode. This enables the measurements of SOA species as adducts with Na+. With this ionization method, most organic compounds that are relevant for atmospheric SOA particles can be analyzed, such as intermediately oxygenated organic molecules with the exception of species that are not oxygenated and organosulfates (Lopez-Hilfiker et al., 2019).
2.1.5 Offline analysis of filters (FILTER) using ultra-high-performance liquid chromatography (UHPLC) and heated electrospray ionization (HESI) coupled to an Orbitrap high-resolution mass spectrometer (HRMS)
This procedure was optimized and described in detail by Ungeheuer et al. (2021). The method enhances the separation of organic compounds with high resolution and enables the determination of the accurate mass. The analysis consists mainly of four steps: sampling, extraction, separation, and detection.
First, the particles were collected from a flow of 5 L min−1 on a 47 mm diameter Emfab™ filter (Pall Life Science, USA) during approximately 17 h for the experiment at −10 ∘C (see Table 2 and Fig. S1). After sampling, the filter was stored at −18 ∘C to avoid possible losses by evaporation. The filter was cut into small pieces (approximately 3×3 mm) and extracted two times in 0.2 mL solution (mixture of 90 % water and 10 % methanol) for 20 min. After each extraction step, the extract was filtered through a syringe filter (PTFE with a pore size of 0.2 µm). For chromatographic separation a gradient of ultrapure water (eluent A, Milli-Q Reference A+, Merck Millipore) and methanol (eluent B, Optima LC/MS grade, Fisher Scientific) was applied. Both eluents were mixed with 0.1 % formic acid () for improved chromatographic performance. The injection volume was 5 µL, the flow rate was 400 µL min−1, and the temperature was 40 ∘C. The gradient started with 1 % eluent B (0–0.5 min), increased linearly to 99 % eluent B (0.5–14 min), stayed at 99 % eluent B (14–16 min), was backflushed in 1 min, and equilibrated in 3 min, resulting in a total run time of 20 min. Negative ionization mode was used for the detection, in which the molecular ions [M-H]− are produced by deprotonation. The ion source settings used for this purpose were −3.5 kV spray voltage, 40 psi sheath gas, 8 arbitrary units auxiliary gas, and 262.5 ∘C capillary temperature. The scan range in full MS was 50–750 , with a mass-resolving power of about 70 k at 200. For data-dependent MS2 (ddMS2) the resolution was 17.5 k. Fragments were produced in a higher-energy collisional dissociation (HCD) cell with stepped collision energies of 15, 30, and 45 eV.
Table 2Sample size conditions during the experiments performed at −30, −10, and −50 ∘C. For the purposes of this intercomparison study, the sampling times were aligned base on the TD–DMA and FILTER collection times. CPC2.5: particle number concentration in number per cubic centimeter measured by the counter particle condensation (CPC) with a cut-off diameter of 2.5 nm
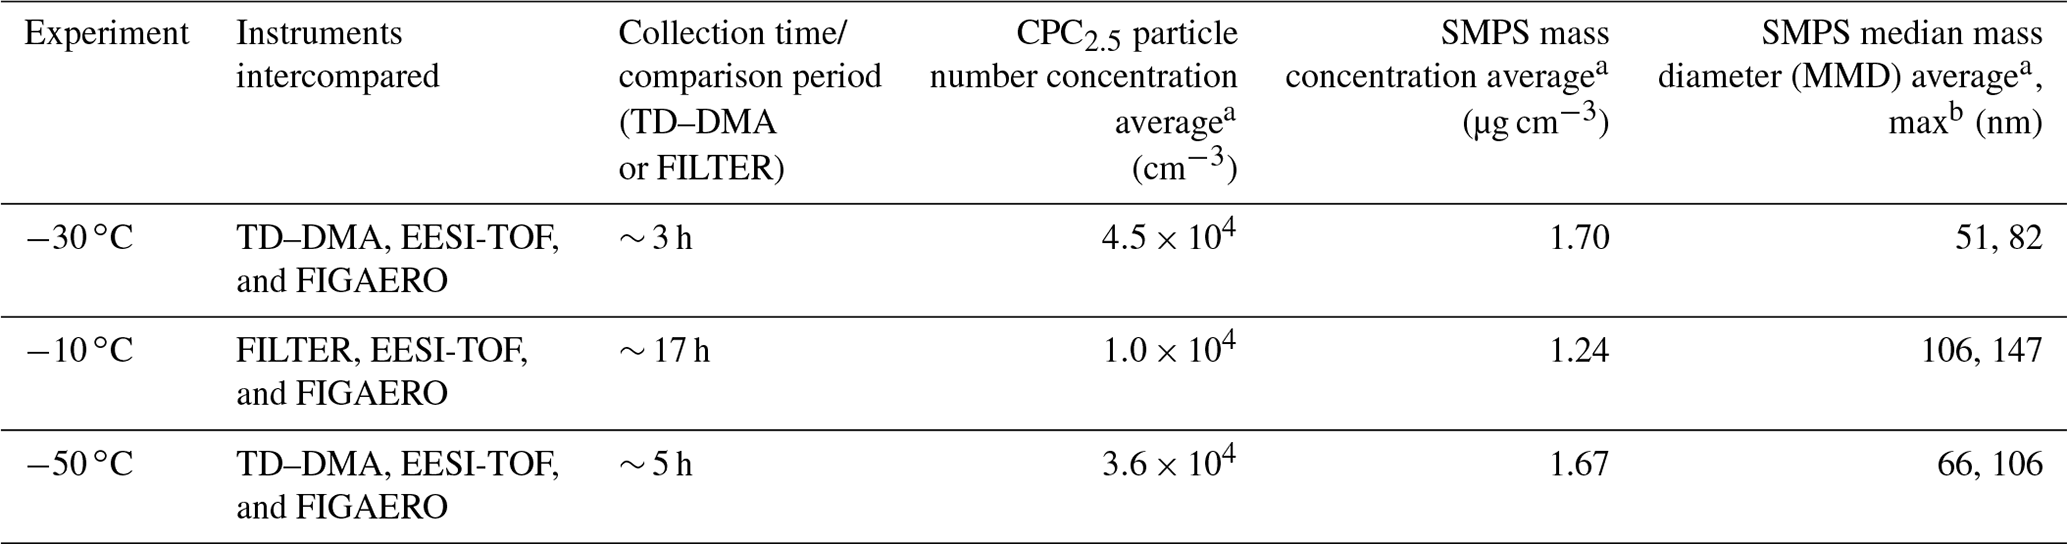
a Average during the sample collection period. b Maximum value during the sample collection period.
2.2 Data analysis
2.2.1 Data processing
TD–DMA, FIGAERO, and EESI-TOF data were processed using IGOR Pro 7 (WaveMetrics, Inc., USA) and Tofware (Version 3.1.2, Aerodyne Inc., USA). The data from the offline method were processed with Compound Discoverer 3.2 (Thermo Fisher Scientific). The postprocessing was done using MATLAB R2022a (MathWorks, Inc., USA).
TD–DMA data were corrected by the mass-dependent transmission efficiency in the mass classifier (Heinritzi et al., 2016) and normalized by the nitrate reagent ions. FIGAERO data were averaged to 1 min and normalized by the reagent ions. EESI-TOF signals were averaged to 10 s and normalized by the most abundant electrospray ion (NaINa+). In order to align the sampling times for the different techniques and perform a more direct particle-phase comparison, we selected as a reference the TD–DMA and FILTER collection times. Thus, for the comparison at −30 and −50 ∘C, EESI-TOF particle signals were averaged, and FIGAERO particle signals were integrated during the period in which the TD–DMA collected particles (∼ 3 and 5 h, respectively), while for the comparison at −10 ∘C, the EESI-average and FIGAERO-integration period corresponded to the time when the particles were collected with the FILTER for the offline analysis (∼ 17 h). Figure 1 provides an overview of a representative experiment at −30 ∘C. The overview of the experiments at −10 and −50 ∘C are shown in Fig. S1 in the Supplement. Table 2 summarizes the sampling conditions during the experiments reported in this study (for the purpose of the intercomparison), including the particle number concentration, mass concentration, and median mass diameter (MMD) calculated from the scanning mobility particle sizer (SMPS). The MMD indicates the particle size measured by the SMPS for which 50 % of the aerosol mass is contained in smaller particles, and 50 % is contained in larger particles. From Table 2 it can be seen that, for the experiments at −30 and −50 ∘C, MMDav < 100 nm, while for the experiment at −10 ∘C, MMDav ∼ 106 nm.
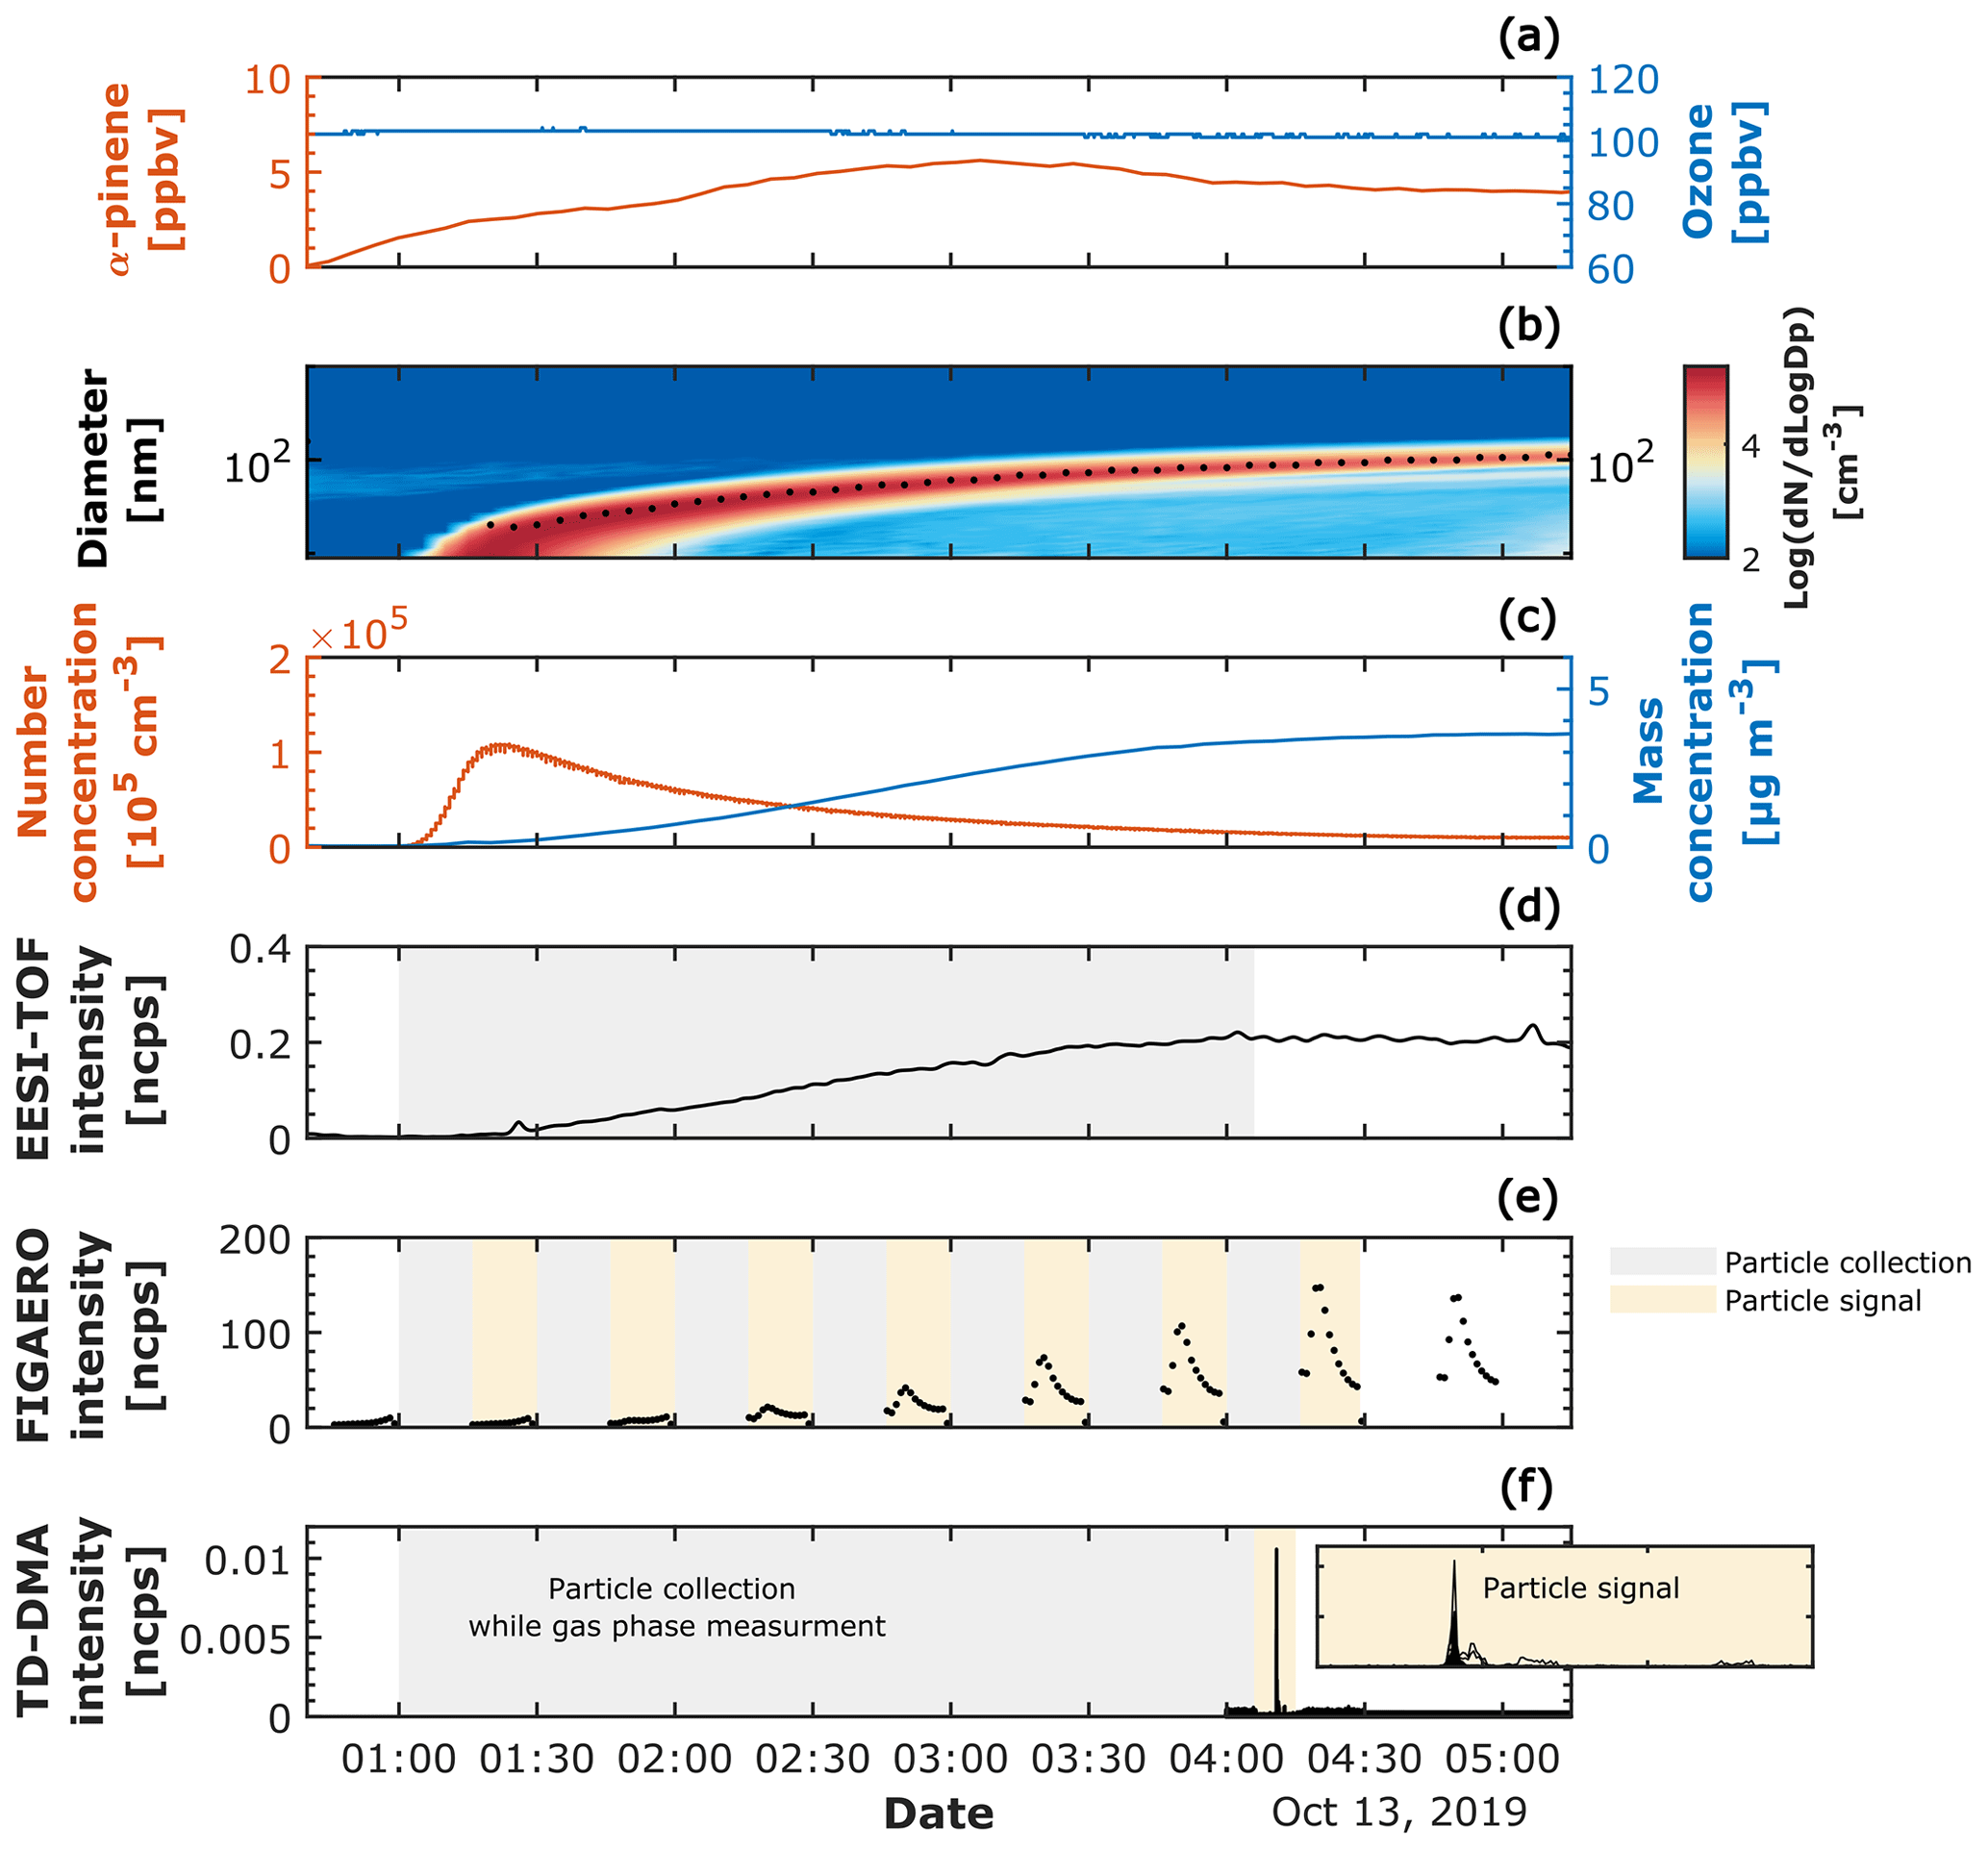
Figure 1Experimental overview of a representative biogenic new-particle-formation experiment (α-pinene ozonolysis at −30 ∘C and 20 % RH). (a) Mixing ratio in parts per billion by volume for the precursor gases, α-pinene and ozone. (b) Particle size distribution measured by the SMPS; the color scale represents the log 10 of the normalized particle concentration per cubic centimeter (cm−3). The median mass diameter (MMD) is shown with a dashed black line. (c) Particle number concentration in number per cubic centimeter measured by the CPC with a cut-off diameter of 2.5 nm and mass concentration in micrograms per cubic meter (obtained by integrating the normalized mass concentration from the SMPS). (d) Particle-phase signal measured continuously by the EESI-TOF; the gray shaded area refers to the period where the EESI-TOF was averaged for the intercomparison with TD–DMA and FIGAERO. (e) Particle phase measured by FIGAERO; the gray shaded areas refer to the particle collection period and the yellow shaded areas to the desorption period. FIGAERO measured in a semicontinuous mode, namely 15 min particle collections followed by 15 min desorption periods. In order to intercompare with EESI-TOF and TD–DMA, FIGAERO signals were integrated during the period where the TD–DMA collected particles (∼ 3 h); seven FIGAERO particle samples were integrated during the 3 h comparison period. (f) Particle phase measured by the TD–DMA; the TD–DMA collection period was approximately 3 h, while the desorption period lasted around 1 min, followed by a second heating for estimating the background.
2.2.2 PMF analysis
One of the main questions we want to answer in this work is whether the thermal desorption methods (TD–DMA and FIGAERO) experience significant decomposition during the desorption process. To answer this question, we utilized PMF analysis. This method was originally described by Paatero and Tapper (1994) for analyzing time series of mass spectra from ambient observations, and it was implemented by Buchholz et al. (2020) with thermal desorption data for identifying different processes during particle evaporation. We therefore applied the same procedure as Buchholz et al. (2020) to the TD–DMA and FIGAERO thermal desorption profiles (for the α-pinene oxidation experiment at −30 ∘C and 20 % RH only). For the analysis, we separately processed 1 s TD–DMA and 1 s FIGAERO thermograms. Since the FIGAERO measures in a semicontinuous mode, we chose a representative thermogram. Both TD–DMA and FIGAERO data sets were background subtracted. For the TD–DMA background, we used the second heating cycle that is performed immediately after the first heating (described in Sect. 2.1.2). For the FIGAERO background, we used a period in which no significant particle load was present in the chamber (at the beginning of the experiment). We considered only the organic compounds and excluded the reagent ions for this analysis. We ran the PMF software using the CNerror scheme (based on the noise of each ion) and up to 10 different solutions. Four-factor TD–DMA and six-factor FIGAERO solutions (discussed later in Sect. 3.2.1) were chosen as the most interpretable results by (a) comparing the residuals and by looking at which solution captured the total signal and certain species the best (e.g., C8H12O4) and (b) by finding an equilibrium between good reconstructed signal and physically interpretable results. This means that for the solutions presented here, a higher number of factors likely improves the residuals; nevertheless, we chose the solution with the smallest number of factors that can still provide realistic information.
3.1 Chemical composition comparison
Figure 2 shows the OSC, calculated as OSC=2 × O : C − H : C (an approximation stated by Kroll et al., 2011), against the number of carbon atoms for α-pinene oxidation products in the particle phase at −30 ∘C and 20 % RH, as measured by three different techniques: TD–DMA, FIGAERO, and EESI-TOF. For all techniques, the highest intensities correspond to compounds with 10 carbon atoms (C10), for which the oxidation state varies between 0.5 and −1.5, depending on the measurement technique. Compounds with more than 10 carbon atoms were also detectable by the TD–DMA, FIGAERO, and EESI-TOF. The TD–DMA and FIGAERO detected compounds with fewer than five carbon atoms and OSC>0, which, in contrast, are not detected by the EESI-TOF (this feature is discussed in Sect. 3.2.1). In order to simplify the comparison, we calculated the fraction of species containing fewer than 10 carbon atoms (C<10), 10 carbon atoms (C10), and more than 10 carbon atoms (C>10), since this can provide insight into the detected fraction of monomers and dimers for each technique (Fig. 2d). Approximately 42 %, 32 %, and 23 % of the signals correspond to C<10; 47 %, 65 %, and 53 % to C10; and around 11 %, 3 %, and 24 % to C>10. These percentages were measured by the TD–DMA, FIGAERO, and EESI-TOF, respectively. Figure S2 in the Supplement displays the results for the experiments at −50 ∘C. In every case, C10 represents the highest fraction detected by all the techniques in this experiment. Nevertheless, we do see significant differences between the techniques for C<10, C10, and C>10.
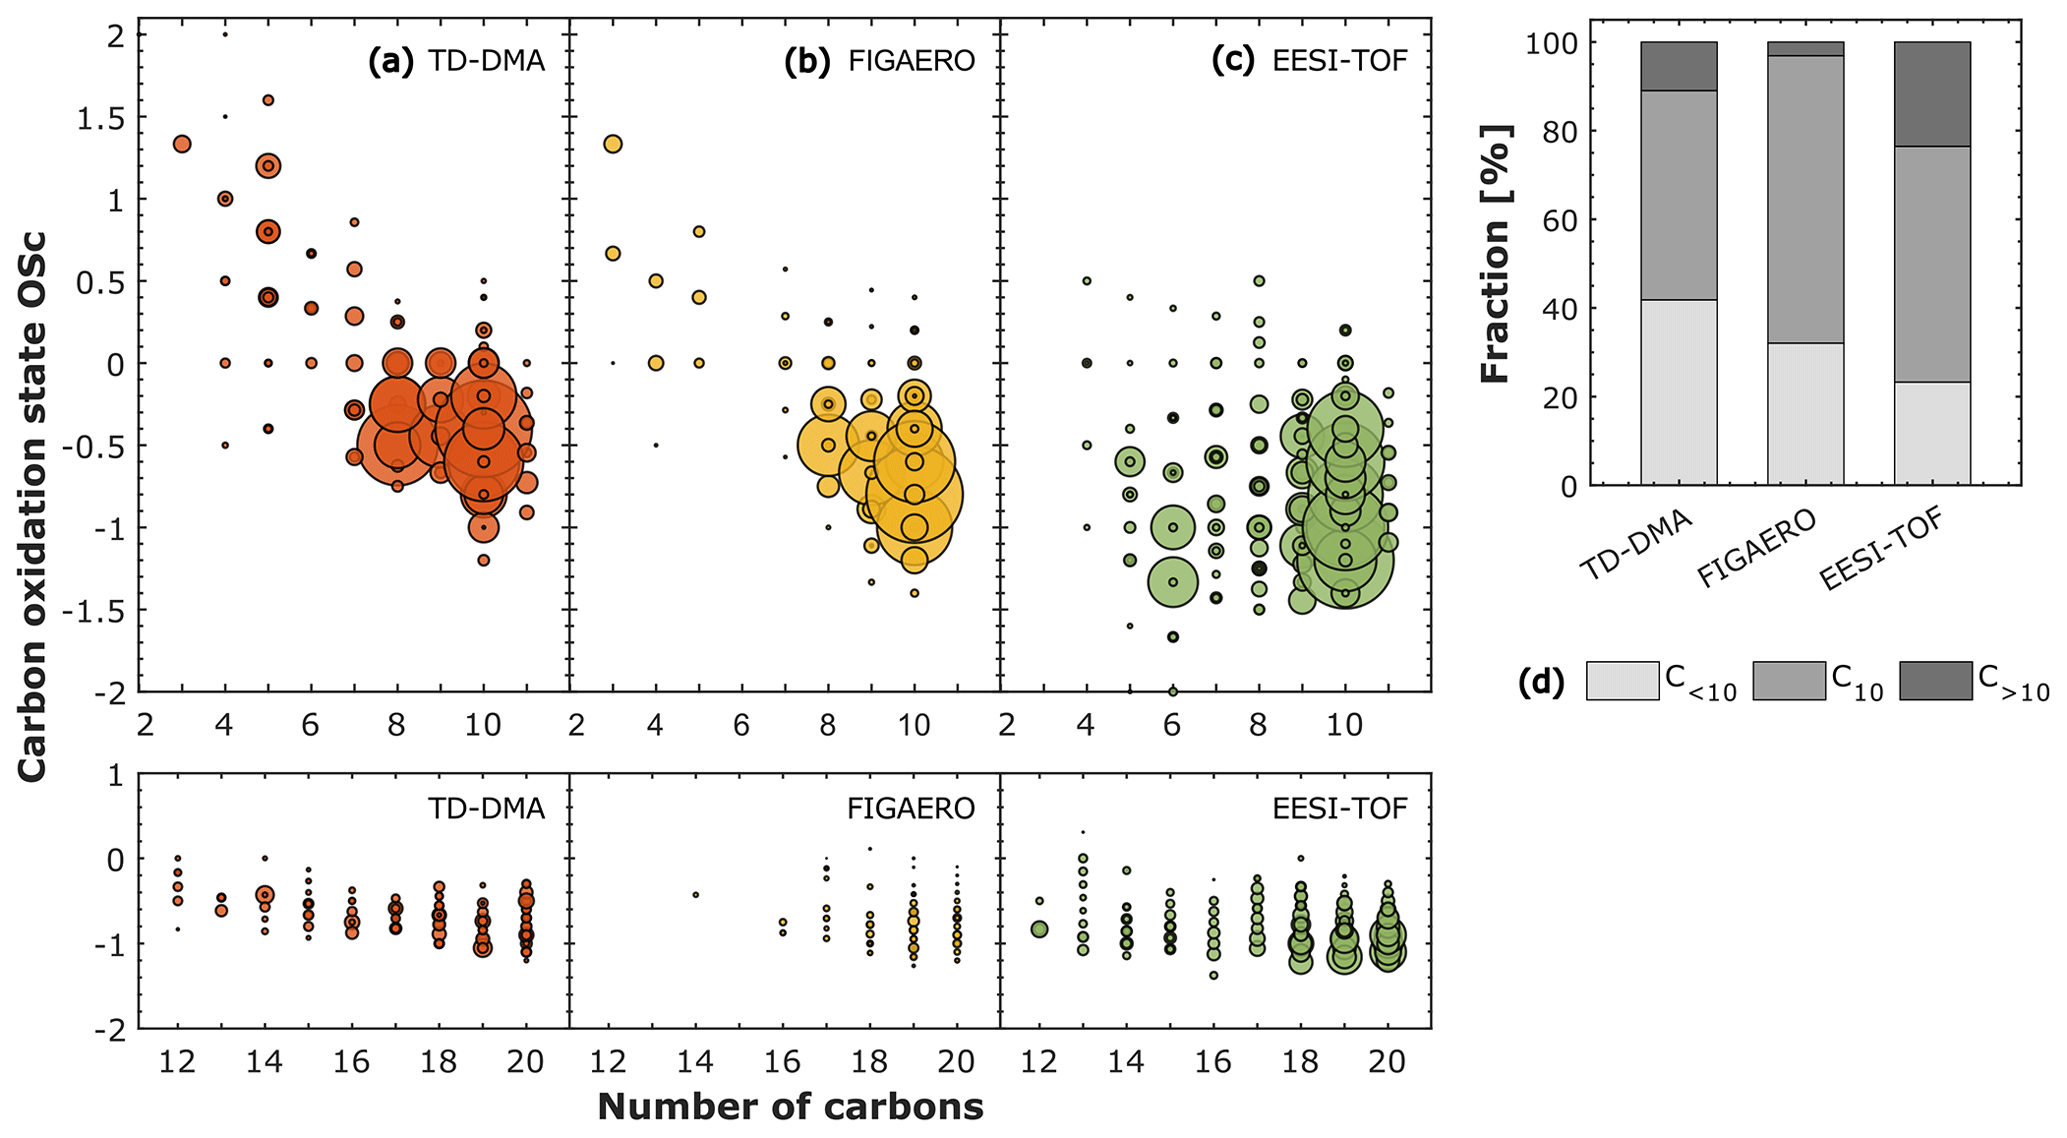
Figure 2Carbon oxidation state (OSc) against the number of carbon atoms for α-pinene oxidation products in the particle phase at −30 ∘C and 20 % RH measured by three different techniques: (a) thermal desorption–differential mobility analyzer (TD–DMA) coupled to a NO chemical ionization–atmospheric-pressure-interface–time-of-flight mass spectrometer, (b) filter inlet for gases and aerosols (FIGAERO) coupled to an I− high-resolution time-of-flight chemical ionization mass spectrometer, and (c) extractive electrospray Na+ ionization time-of-flight mass spectrometer (EESI-TOF). The level of α-pinene was between 1 and 6 ppbv, while the ozone level was ∼ 100 ppbv. The carbon oxidation state is calculated as follows: OSc = 2 × O : C − H : C. The marker sizes in (a), (b), and (c) represent the intensities normalized by the total signal in each system. (d) Fraction of species in the particle phase containing fewer than 10 carbon atoms (C < 10), 10 carbon atoms (C10), and more than 10 carbon atoms (C >10). The fraction was calculated by normalizing the intensities by the total signal in each system.
The chemical ionization utilized by the TD–DMA (nitrate, NO) is more sensitive towards highly oxygenated species, while the FIGAERO (iodide, I−) detects intermediately oxygenated species with higher sensitivity. In Figs. S3 and S4 in the Supplement, we present the results (number of oxygen atoms vs. number of carbon atoms) at −30 and −50 ∘C, respectively. From the figures (Figs. S3 and S4) we observe that more oxygenated species contribute more to the total signal in TD–DMA than in FIGAERO. This observation is consistent with the sensitivity that one would expect according to the chemical ionization. The electrospray ionization (Na+) for the EESI-TOF is usually more sensitive towards intermediately oxygenated species, even though in the results presented here, it seems to capture the whole spectrum very well.
Besides the reagent ion selectivity, several factors can explain the quantitative differences. For example, both the TD–DMA and FIGAERO detect a lower fraction of C>10 (11 % and 3 % compared to 24 % for the EESI-TOF). The TD–DMA and FIGAERO techniques are based on thermal desorption, which may cause decomposition of thermally unstable compounds during evaporation (as discussed in more detail in Sect. 3.2.1). On the other hand, the resulting fractions of C>10 can be influenced by the ionization method employed: chemical ionization and electrospray are soft-ionization techniques, for which one can expect little fragmentation. Thus, we presume that thermal decomposition during evaporation could be the most significant factor that explains these differences.
Figure 3 presents the results for the experiment conducted at −10 ∘C (α-pinene oxidation products at 80 % RH) for particles collected on a filter and analyzed by the UHPLC–HESI–HRMS (offline method; Fig. 3a). FIGAERO and EESI-TOF results are shown in Fig. 3b and c, respectively. Overall, fewer compounds are detected by UHPLC–HESI–HRMS than by FIGAERO and EESI-TOF. The highest intensities in Fig. 3a (FILTER) correspond to C8H12O4, C9H14O4, C10H16O3−6, C17H26O8, and C19H28O7. Ions with the same formulas are also detected by the FIGAERO and EESI-TOF, but the contribution to the total signal differs. The results at −10 ∘C (number of oxygen atoms vs. number of carbon atoms) are shown in Fig. S5 in the Supplement. By applying the UHPLC–HESI–HRMS method, it is possible to distinguish between compounds with identical chemical formulas (isomers). For the experiment reported here, two isomers for C8H12O4, C10H16O3, and C10H16O5, as well as three isomers for C10H16O4 and C10H16O6 were detected. The detection of these isomers is enabled by the chromatographic separation (their interaction with a reversed-phase column results in different retention times and therefore makes the separation feasible). However, complementary experiments are needed to investigate the molecular structure. Furthermore, Fig. 3d shows the contributions of the C<10, C10, and C>10 fractions to the total signal for the FILTER, FIGAERO, and EESI-TOF. At −10 ∘C, the fraction of compounds with more than 10 carbon atoms (C>10) has the smallest contribution to the total signal (14 %, 5 %, and 24 % for the FILTER, FIGAERO, and EESI-TOF, respectively). The fractions C<10 and C10 do not seem to have a clear tendency; they both contribute substantially to the total signal in each technique.
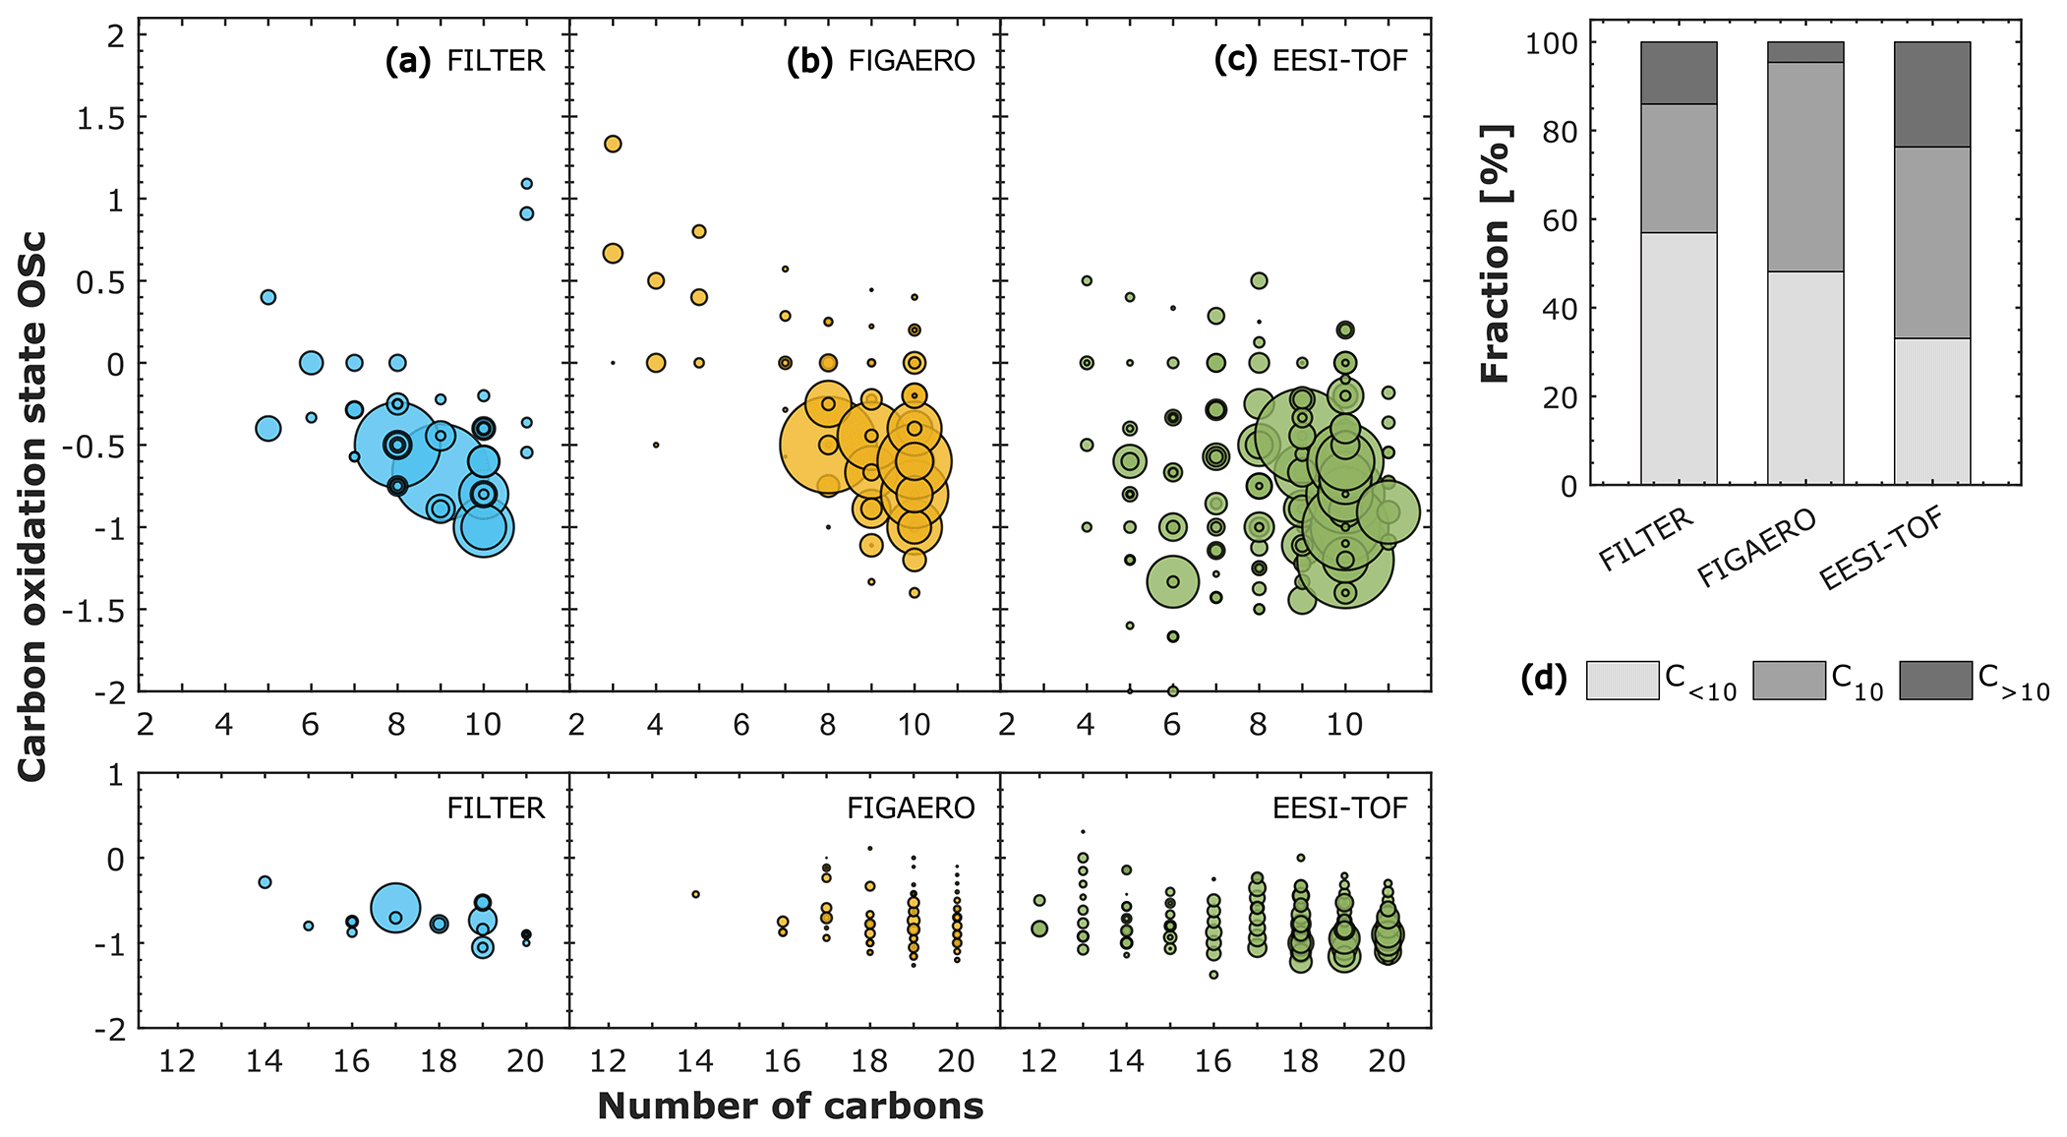
Figure 3Carbon oxidation state (OSc) against the number of carbon atoms for α-pinene oxidation products in the particle phase at −10 ∘C and 80 % RH measured by three different techniques: (a) offline analysis of filters (FILTER) using ultra-high-performance liquid chromatography (UHPLC) and heated electrospray ionization (HESI) coupled to an Orbitrap high-resolution mass spectrometer (HRMS), (b) filter inlet for gases and aerosols (FIGAERO) coupled to an I− high-resolution time-of-flight chemical ionization mass spectrometer, and (c) extractive electrospray Na+ ionization time-of-flight mass spectrometer (EESI-TOF). The level of α-pinene was between 1 and 3 ppbv, while the ozone level was ∼ 100 ppbv. The carbon oxidation state is calculated as follows: OSc = 2 × O : C − H : C. The symbol sizes in (a), (b), and (c) represent the intensities normalized by the total signal in each system. (d) Fraction of species in the particle phase containing fewer than 10 carbon atoms (C < 10), 10 carbon atoms (C10), and more than 10 carbon atoms (C > 10). The fraction was calculated by normalizing the intensities by the total signal in each system.
For the methods utilizing electrospray ionization (EESI-TOF and UHPLC–HESI–HRMS), the polarity plays an important role. The EESI-TOF ran in the positive mode, allowing the SOA species to be detected as adducts with Na+, while HESI utilized in the offline method ran in the negative mode, in which molecular ions are produced by deprotonation. Surdu et al. (2021) used an aerosol growth model based on the condensation of organic vapors and demonstrated that the chemical composition measured by the EESI-TOF (in the positive mode as in this study) is consistent with the expected condensed oxidation products with small differences. On the other hand, Ungeheuer et al. (2021), who utilized the UHPLC–HESI–HRMS method, reported that the detection of ester molecules was accomplished only in the positive-ionization mode (1000 compounds were detected in the positive mode, while only 16 were detected in the negative mode). Besides the polarity, several other factors can influence the electrospray ionization response, such as analyte chargeability and surface activity (Cech and Enke, 2001), and therefore impact the completeness of the chemical composition of aerosol particles.
Volatility classes
We estimated the volatilities of the detected particle-phase compounds and associated them with defined volatility classes. We used the parametrization introduced in Donahue et al. (2011) and modified by Stolzenburg et al. (2018). This approach has been also discussed in Simon et al. (2020) and Wang et al. (2020). The volatility was approximated from the number of carbon and oxygen atoms in the specific molecules, and it was first defined at 300 K. By using the Clausius–Clapeyron equation, the volatility was then shifted according to the corresponding experimental temperature. The evaporation enthalpy was approximated according to Donahue et al. (2011) and Epstein et al. (2009). Thereafter the volatility was associated with any of the following classes: ULVOCs, ELVOCs, LVOCs, SVOCs, and IVOCs.
Figures 4 and 5 show the contribution of each volatility class to the total particle signal for the corresponding experiment and for each technique. The results at −50 ∘C are reported in Fig. S6 in the Supplement. For the experiment at −30 ∘C (Fig. 4), LVOCs constitute the higher fraction for the TD–DMA, FIGAERO, and EESI-TOF. EESI-TOF detects the highest fraction of ULVOCs (∼ 12 % compared to 6 % and 2 % measured by TD–DMA and FIGAERO, respectively). An IVOC fraction (∼ 8 %) is only detected by the EESI-TOF. At −10 ∘C (Fig. 5), semi-volatile organic compounds (SVOCs) contribute the most to the total particle signal for the FILTER, FIGAERO, and EESI-TOF. Very small fractions of ULVOCs are also detected by all the techniques. The EESI-TOF detects a higher fraction of IVOCs (20 %) than FILTER and FIGAERO (2 % and 4 %), respectively. Taking into account the particle load (∼ 1–3 µg m−3) and size of the particles (diameter < 100 nm), it is possible that a significant fraction of IVOCs measured by the EESI-TOF results from measurement artifacts, as seen in previous studies using EESI (Surdu et al., 2021). Several reasons (or a combination of them) can explain this feature: (a) the Na+ ionization technique may be more sensitive to less oxygenated organic compounds than the I− or NO techniques, (b) some amount of the gas phase likely broke through the charcoal denuder (although its efficiency is >99 %) and reached the detector (Lee et al., 2021, reported that the EESI-TOF is more sensitive toward gas-phase analytes as compared to their particle-phase counterparts), and (c) some ion-induced fragmentation can possibly occur.
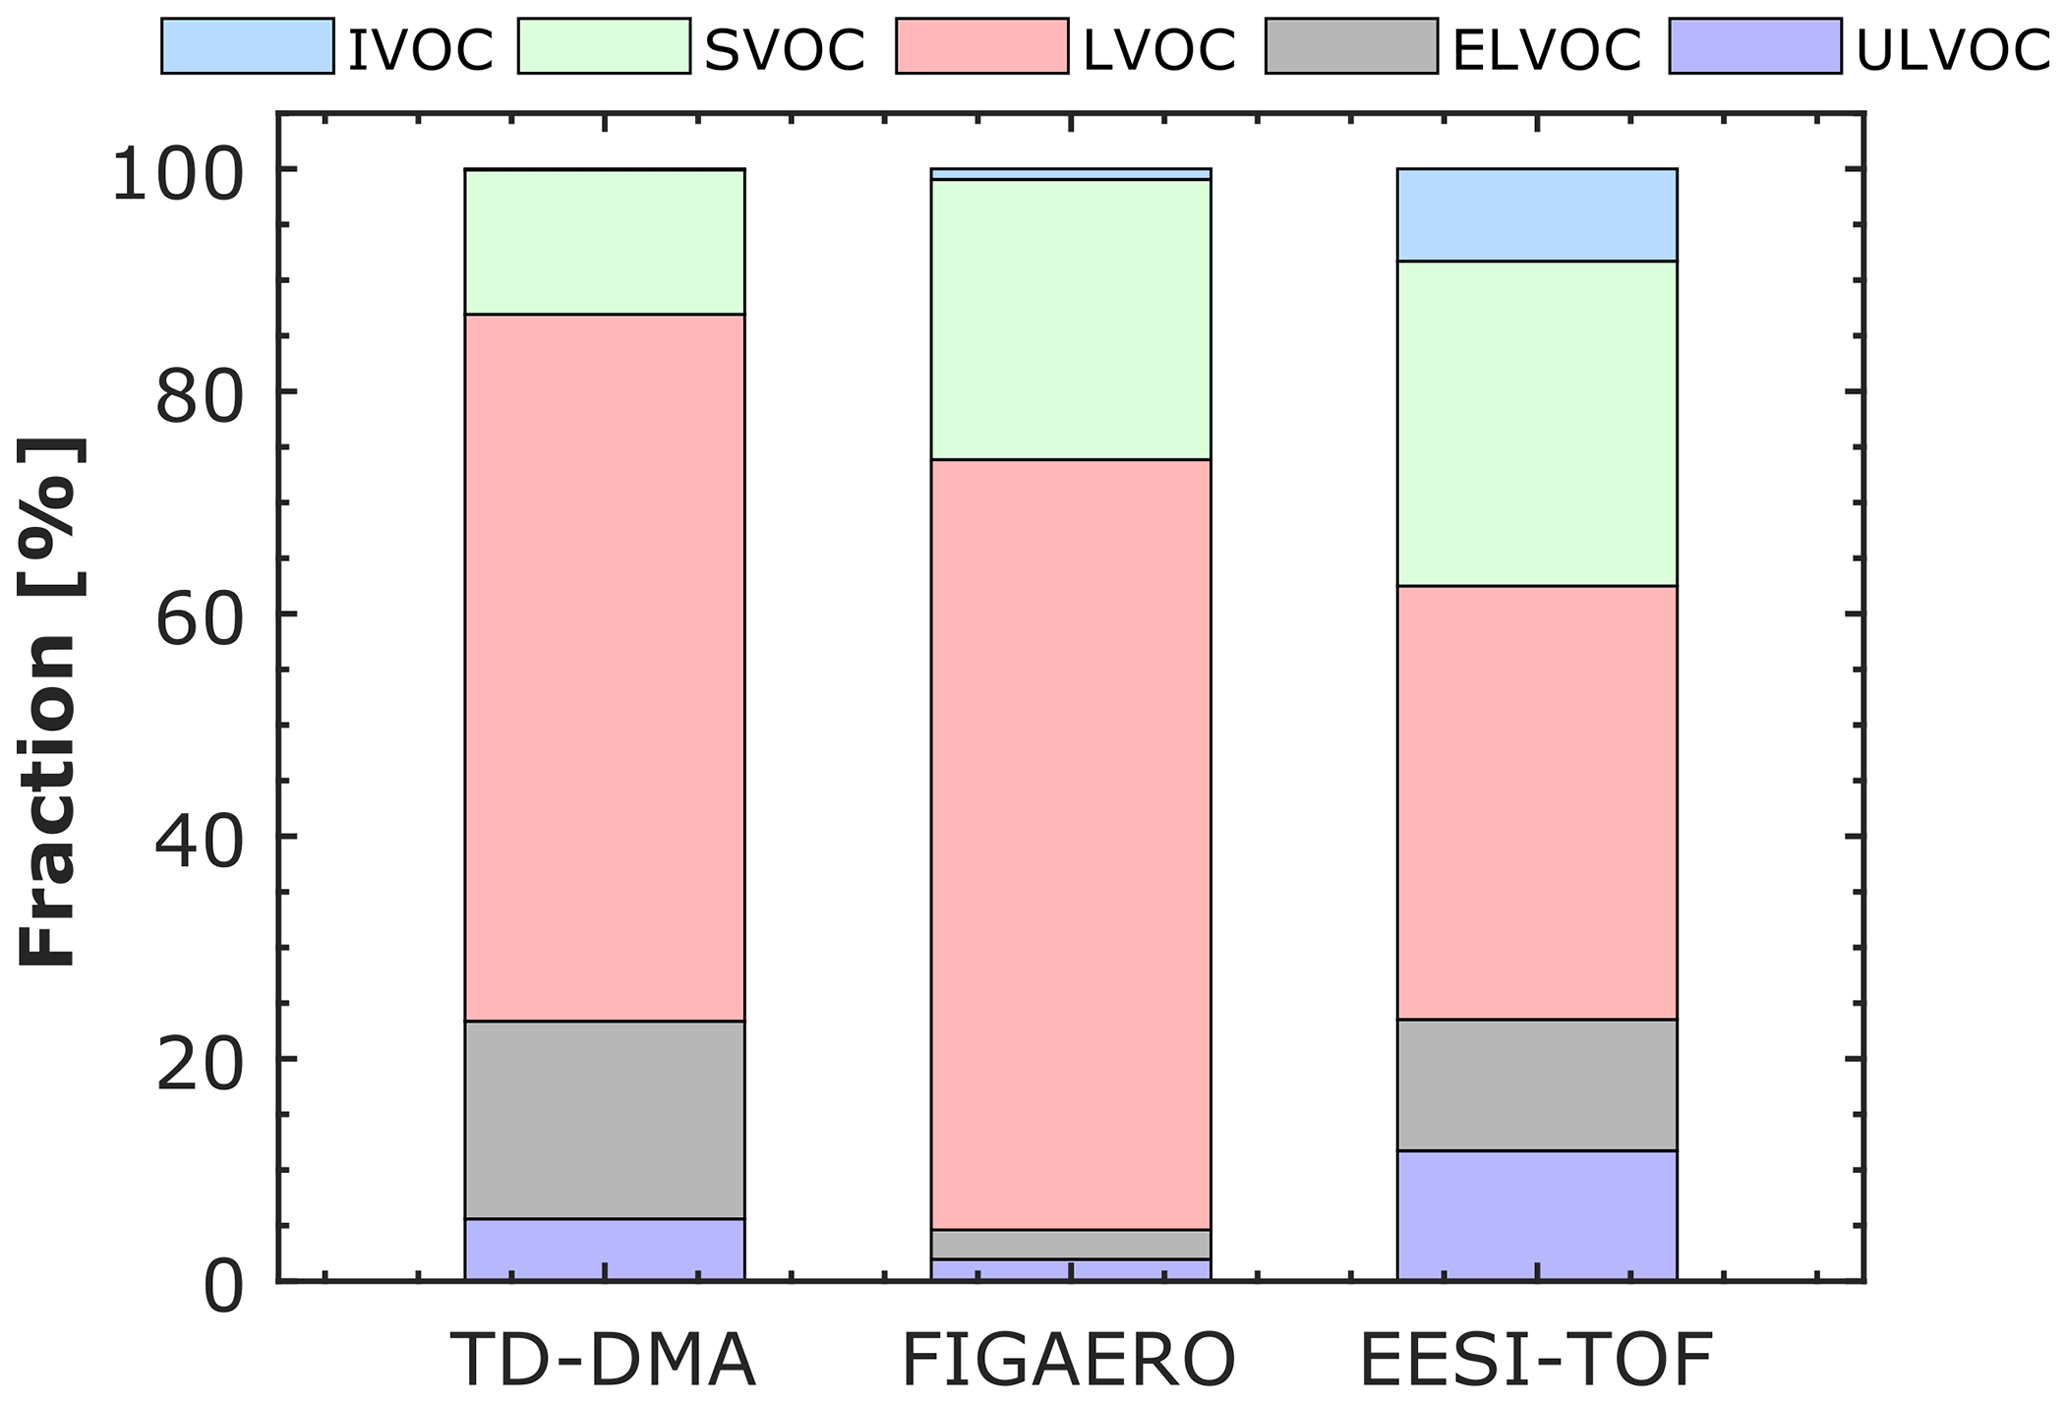
Figure 4Distribution of volatility classes for α-pinene oxidation products in the particle phase at −30 ∘C and 20 % RH measured by three different techniques: thermal desorption–differential mobility analyzer (TD–DMA) coupled to a NO chemical ionization–atmospheric-pressure-interface–time-of-flight mass spectrometer, filter inlet for gases and aerosols (FIGAERO) coupled to an I− high-resolution time-of-flight chemical ionization mass spectrometer, and extractive electrospray Na+ ionization time-of-flight mass spectrometer (EESI-TOF). The level of α-pinene was between 1 and 6 ppbv, while the ozone level was ∼ 100 ppbv. The volatility classes (ULVOC, ELVOC, LVOC, SVOC, IVOC) were defined as in Donahue et al. (2012) and in Schervish and Donahue (2020).
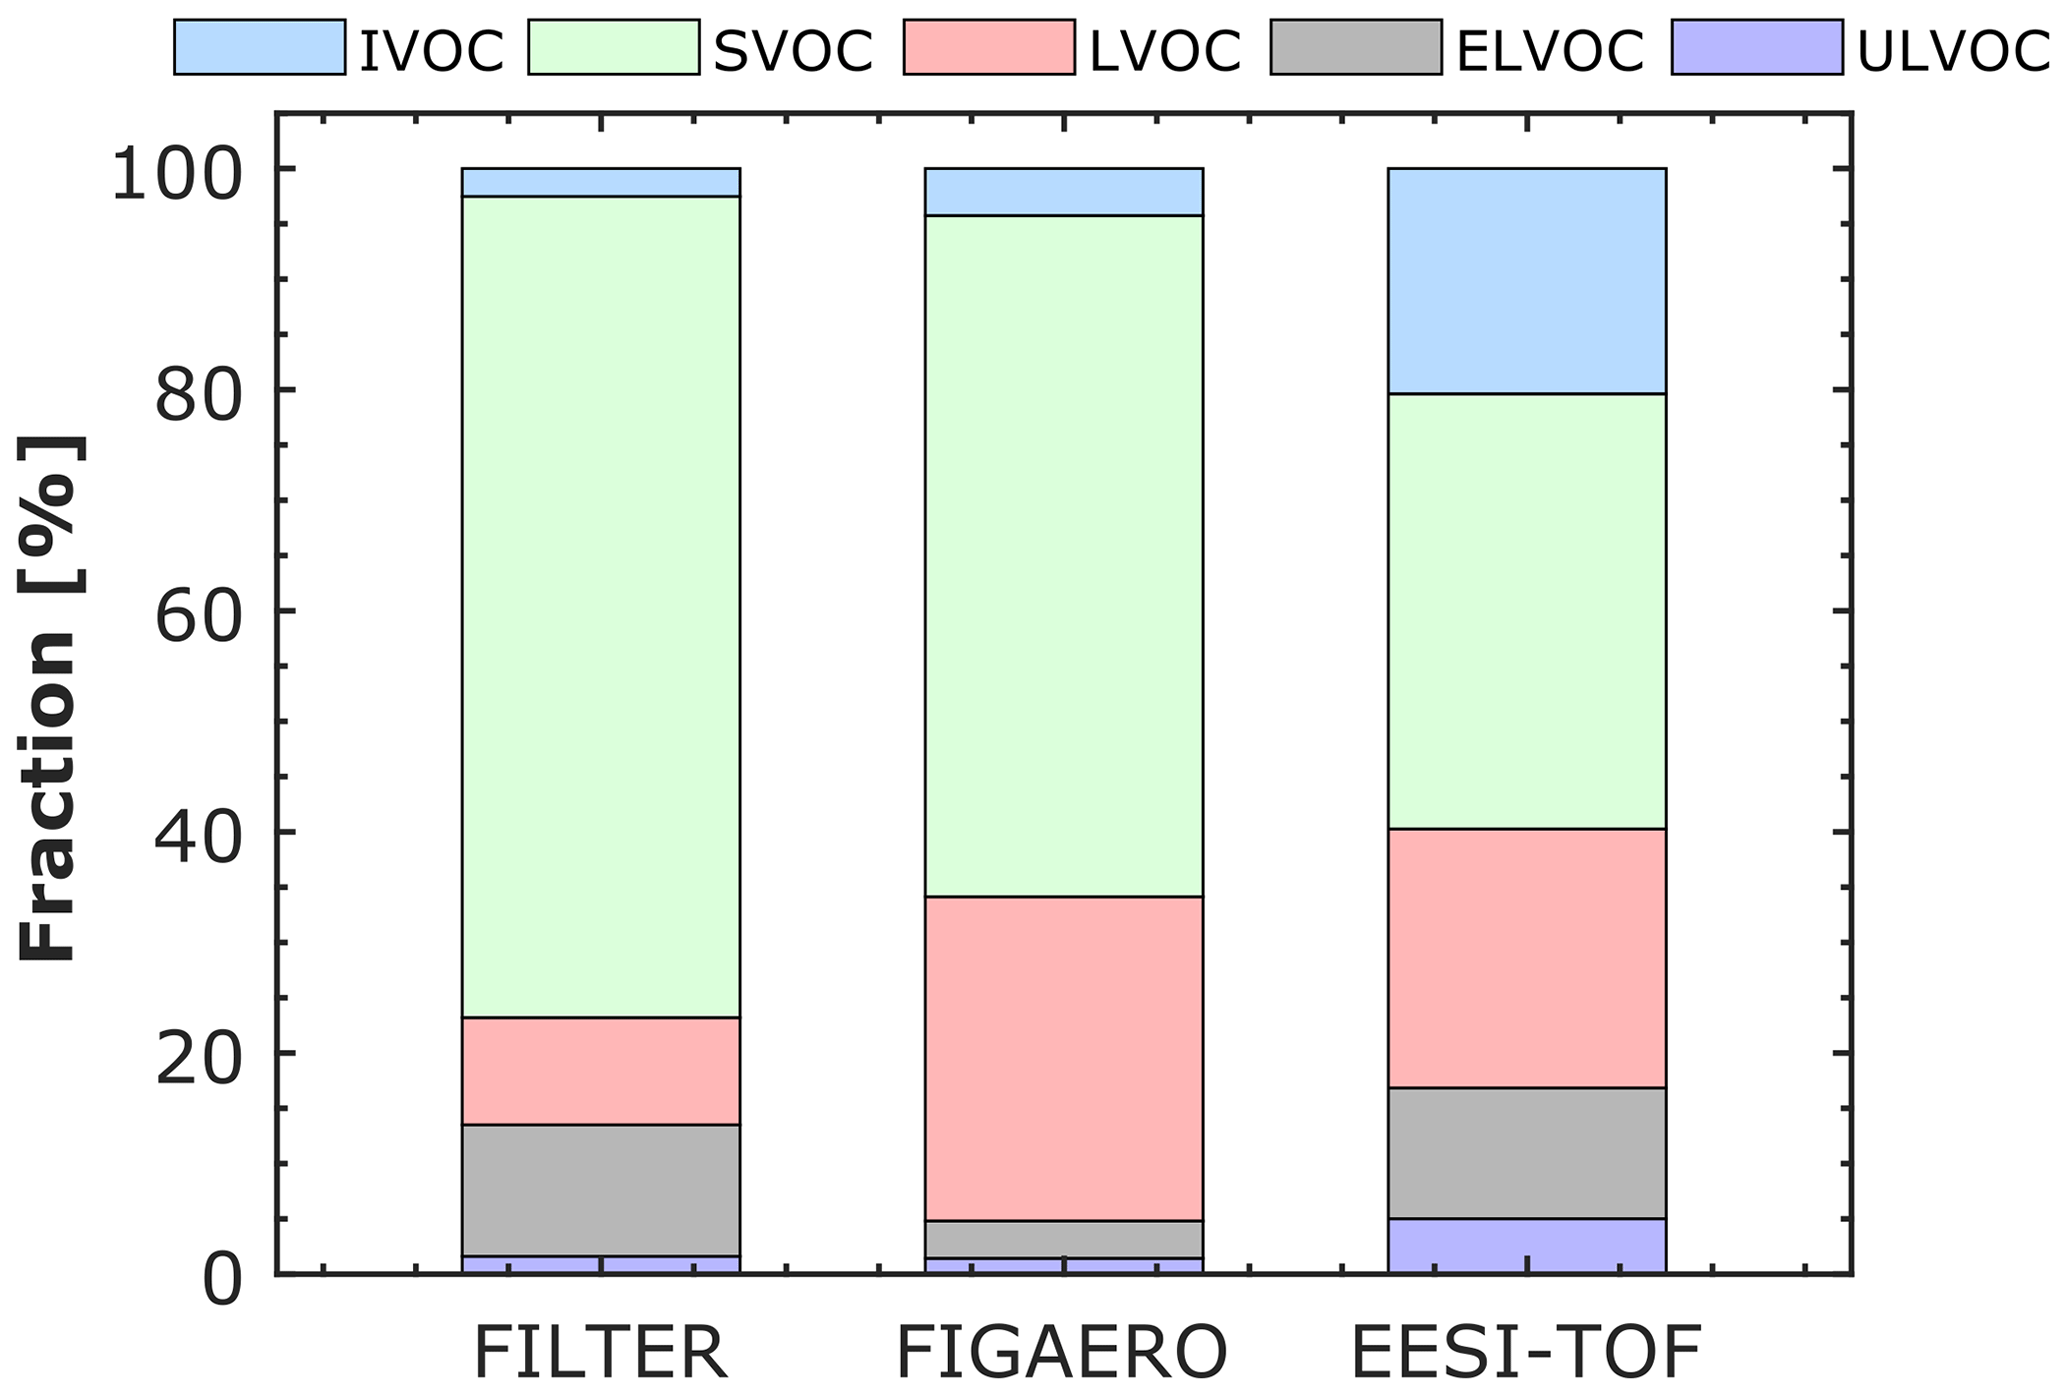
Figure 5Distribution of volatility classes for α-pinene oxidation products in the particle phase at −10 ∘C and 80 % RH measured by three different techniques: offline analysis of filters (FILTER) using ultra-high-performance liquid chromatography and heated electrospray ionization coupled to an Orbitrap high-resolution mass spectrometer, filter inlet for gases and aerosols (FIGAERO) coupled to an I− high-resolution time-of-flight chemical ionization mass spectrometer, and extractive electrospray Na+ ionization time-of-flight mass spectrometer (EESI-TOF). The level of α-pinene was between 1 and 3 ppbv, while the ozone level was ∼ 100 ppbv. The volatility classes (ULVOC, ELVOC, LVOC, SVOC, IVOC) were defined as in Donahue et al. (2012) and in Schervish and Donahue (2020).
Overall, we observed that the contribution of the lowest-volatility classes (ULVOC, ELVOC, and LVOC) increases as the temperature decrease. This observation reflects two opposing temperature effects, as discussed in Ye et al. (2019) based on FIGAERO results: autoxidation and thus the extent of oxidation are reduced at low temperatures, but any given compound is much less volatile at low temperatures because of the strong dependency between saturation concentration and temperature.
3.2 Thermal desorption methods: TD–DMA and FIGAERO
Figure 6 shows the thermograms obtained by FIGAERO and TD–DMA for three different species detected in the α-pinene ozonolysis experiment at −30 ∘C. Figure 5a shows that the C8H12O4 signal measured by both FIGAERO and TD–DMA is broad and exhibits a multimodal behavior; two maxima are observed at approximately 50–60 ∘C and at ∼ 120–150 ∘C. As described in Sect. 2, the FIGAERO temperature is slowly ramped up to 150 ∘C in approximately 15 min, while the TD–DMA temperature is increased up to 600 ∘C in approximately 1 min. From Fig. 6a it can be seen at ∼ 250 ∘C that the C8H12O4 signal measured by the TD–DMA reached background levels. This might suggest that FIGAERO temperatures higher than 150 ∘C are needed for completely evaporating this SOA component collected at −30 ∘C. In contrast, Fig. 6b and c show that the normalized intensity of C9H14O4 and C10H16O6 first increased, reached a maximum at around 40–60 ∘C, and gradually decreased (sharp peak). A similar trend is observed in both FIGAERO and TD–DMA.
Additionally, we display in Fig. 6 the second TD–DMA heating. A second heating is performed immediately after the first heating, without particle collection. This performance allows us to estimate the signal coming from the particles and the signal coming from the background due to the inlet line. From the background measurement, it can be seen that the particle constituents measured by the TD–DMA have been efficiently evaporated.
Hyttinen et al. (2022) reported the Tmax values of several particle-phase compounds measured by FIGAERO during α-pinene ozonolysis experiments. The reported values for C8H12O4, C9H14O4, and C10H16O6 are ∼ 80, ∼ 73, and ∼ 61 ∘C. These values are not far from the ones measured by both TD–DMA and FIGAERO during the experiment reported here, with the exception of the second maxima observed in C8H12O4.
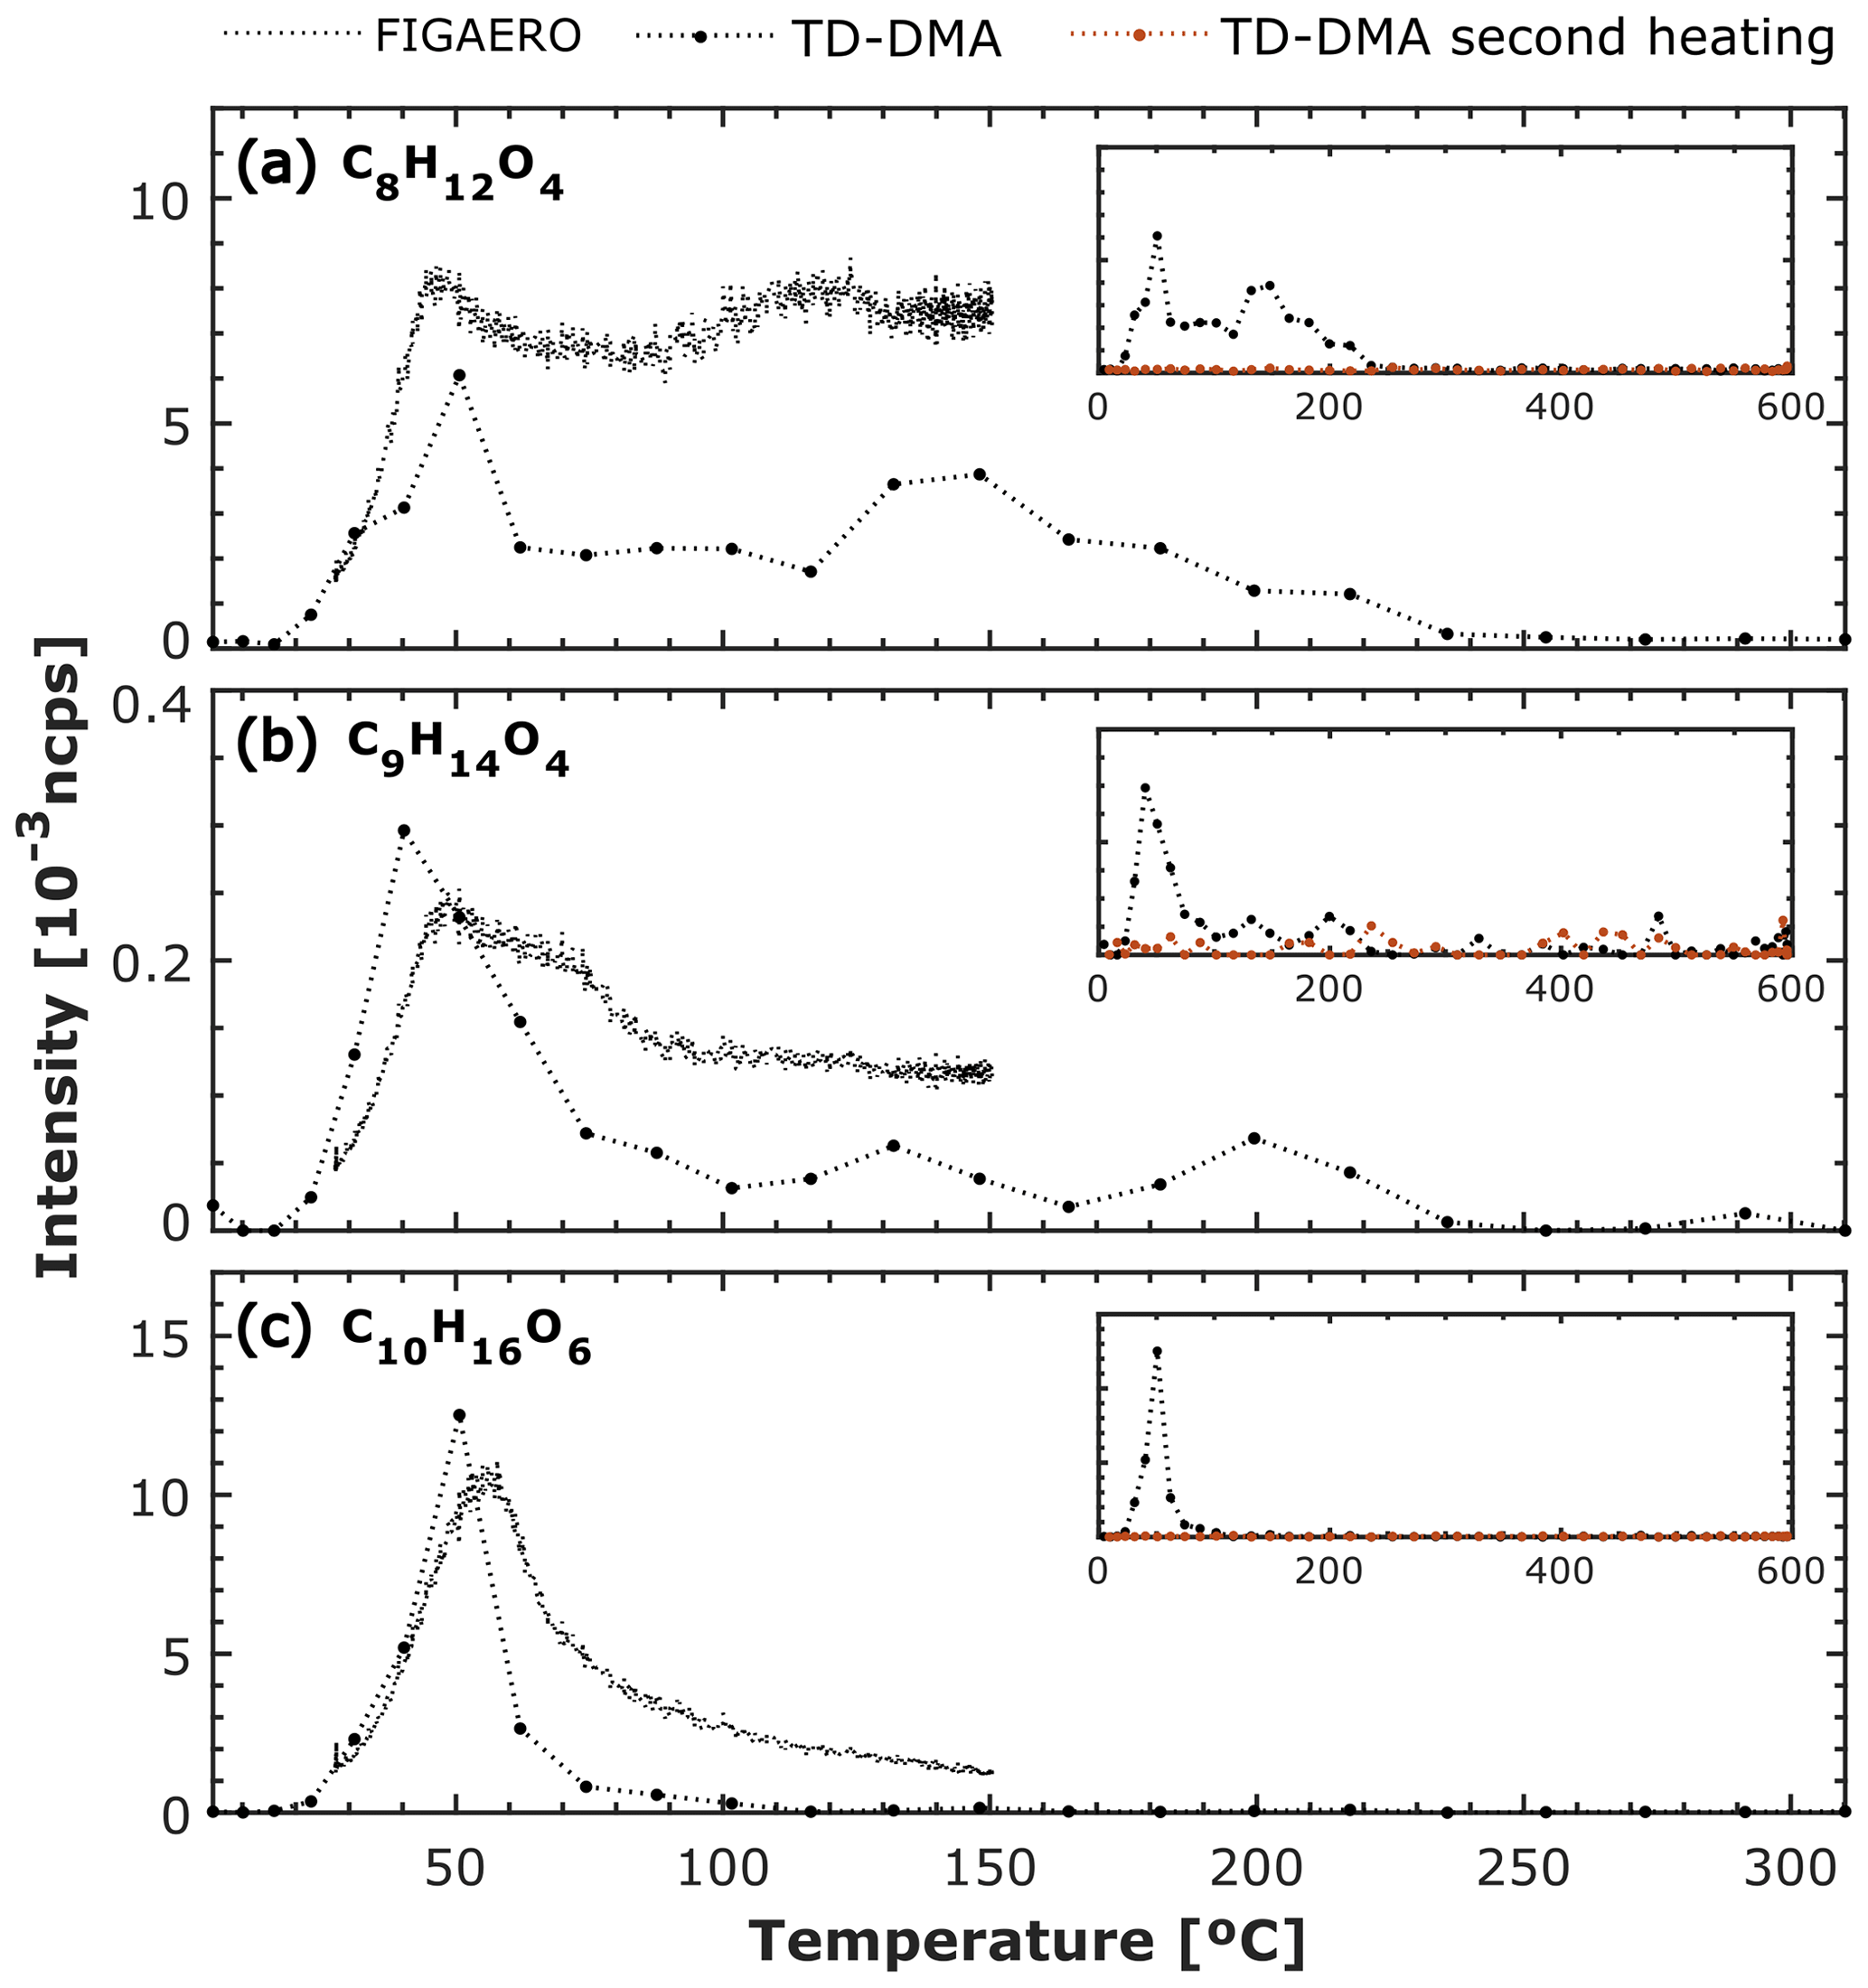
Figure 6FIGAERO and TD–DMA thermal desorption profiles for three different compounds detected in α-pinene ozonolysis experiment at −30 ∘C and 20 % RH. (a) C8H12O4, (b) C9H14O4, and (c) C10H16O6. FIGAERO and TD–DMA intensities are normalized by the reagent ions and expressed in normalized counts per second (ncps); FIGAERO signals have been divided by 1×10³ in (a) and (c) and by 5×10⁴ in (b). FIGAERO temperature is slowly ramped up to 150 ∘C in approximately 15 min, while TD–DMA temperature is increased up to 600 ∘C in approximately 1 min. The TD–DMA temperature is an estimate based on the resistance of the filament. For the TD–DMA two heating profiles are needed for determining the particle signal and the background due to the heating of the inlet line.
PMF results
The results of the PMF analysis of the TD–DMA data are shown in Fig. 7, which contains the factor mass spectra (Fig. 7a–d), the factor thermograms (Fig. 7e), and the contribution of each factor to the total signal (Fig. 7f). We found that four factors are the best choice to reconstruct the TD–DMA data and to provide the most interpretable results (the residuals are shown in Fig. S7 in the Supplement). We numbered the factors according to their peak desorption temperatures (Fig. 7e). F1TD–DMA, which desorbs at the very first stages of the heating cycle, includes organic compounds with molecular masses between 150 and 250 Da (Mav=211.6 Da), with a carbon, hydrogen, and oxygen average content (CHOac) of 9.2, 14.6, and 5.4, respectively. F1TD–DMA contains mainly compounds in the monomer region (see Fig. S8 in the Supplement). F2TD–DMA desorbs right after F1TD–DMA. The mass average (Mav) is 230.7 Da, and the CHOac is 10.0, 16.1, and 5.9. Compounds in the monomer region also contribute to this factor (see Fig. S8 in the Supplement). F3TD–DMA shows a clear contribution of both monomers and dimers for the time when the time series shows a broadened peak. CHOac is 10.8, 16.7, and 5.5, and Mav=234.5 Da. Lastly, F4TD–DMA is dominated (∼ 60 % of the signal intensity) by a high signal with molecular mass of 172.18 Da, which corresponds to C8H12O4. This is reflected by lower values of CHOac and Mav compared to the other factors (CHOac=8.6, 12.8, and 4.5; Mav=188.2 Da). By looking closer into F4TD–DMA (Fig. 7d), we observe that some compounds with mass < 200 Da also contribute to this factor. By integrating each factor thermogram (Fig. 7e), we calculated that F1TD–DMA and F2TD–DMA contribute to ∼ 70 % of the total signal, while F3TD–DMA and F4TD–DMA make up ∼ 30 % of the total signal, as shown in Fig. 7f.
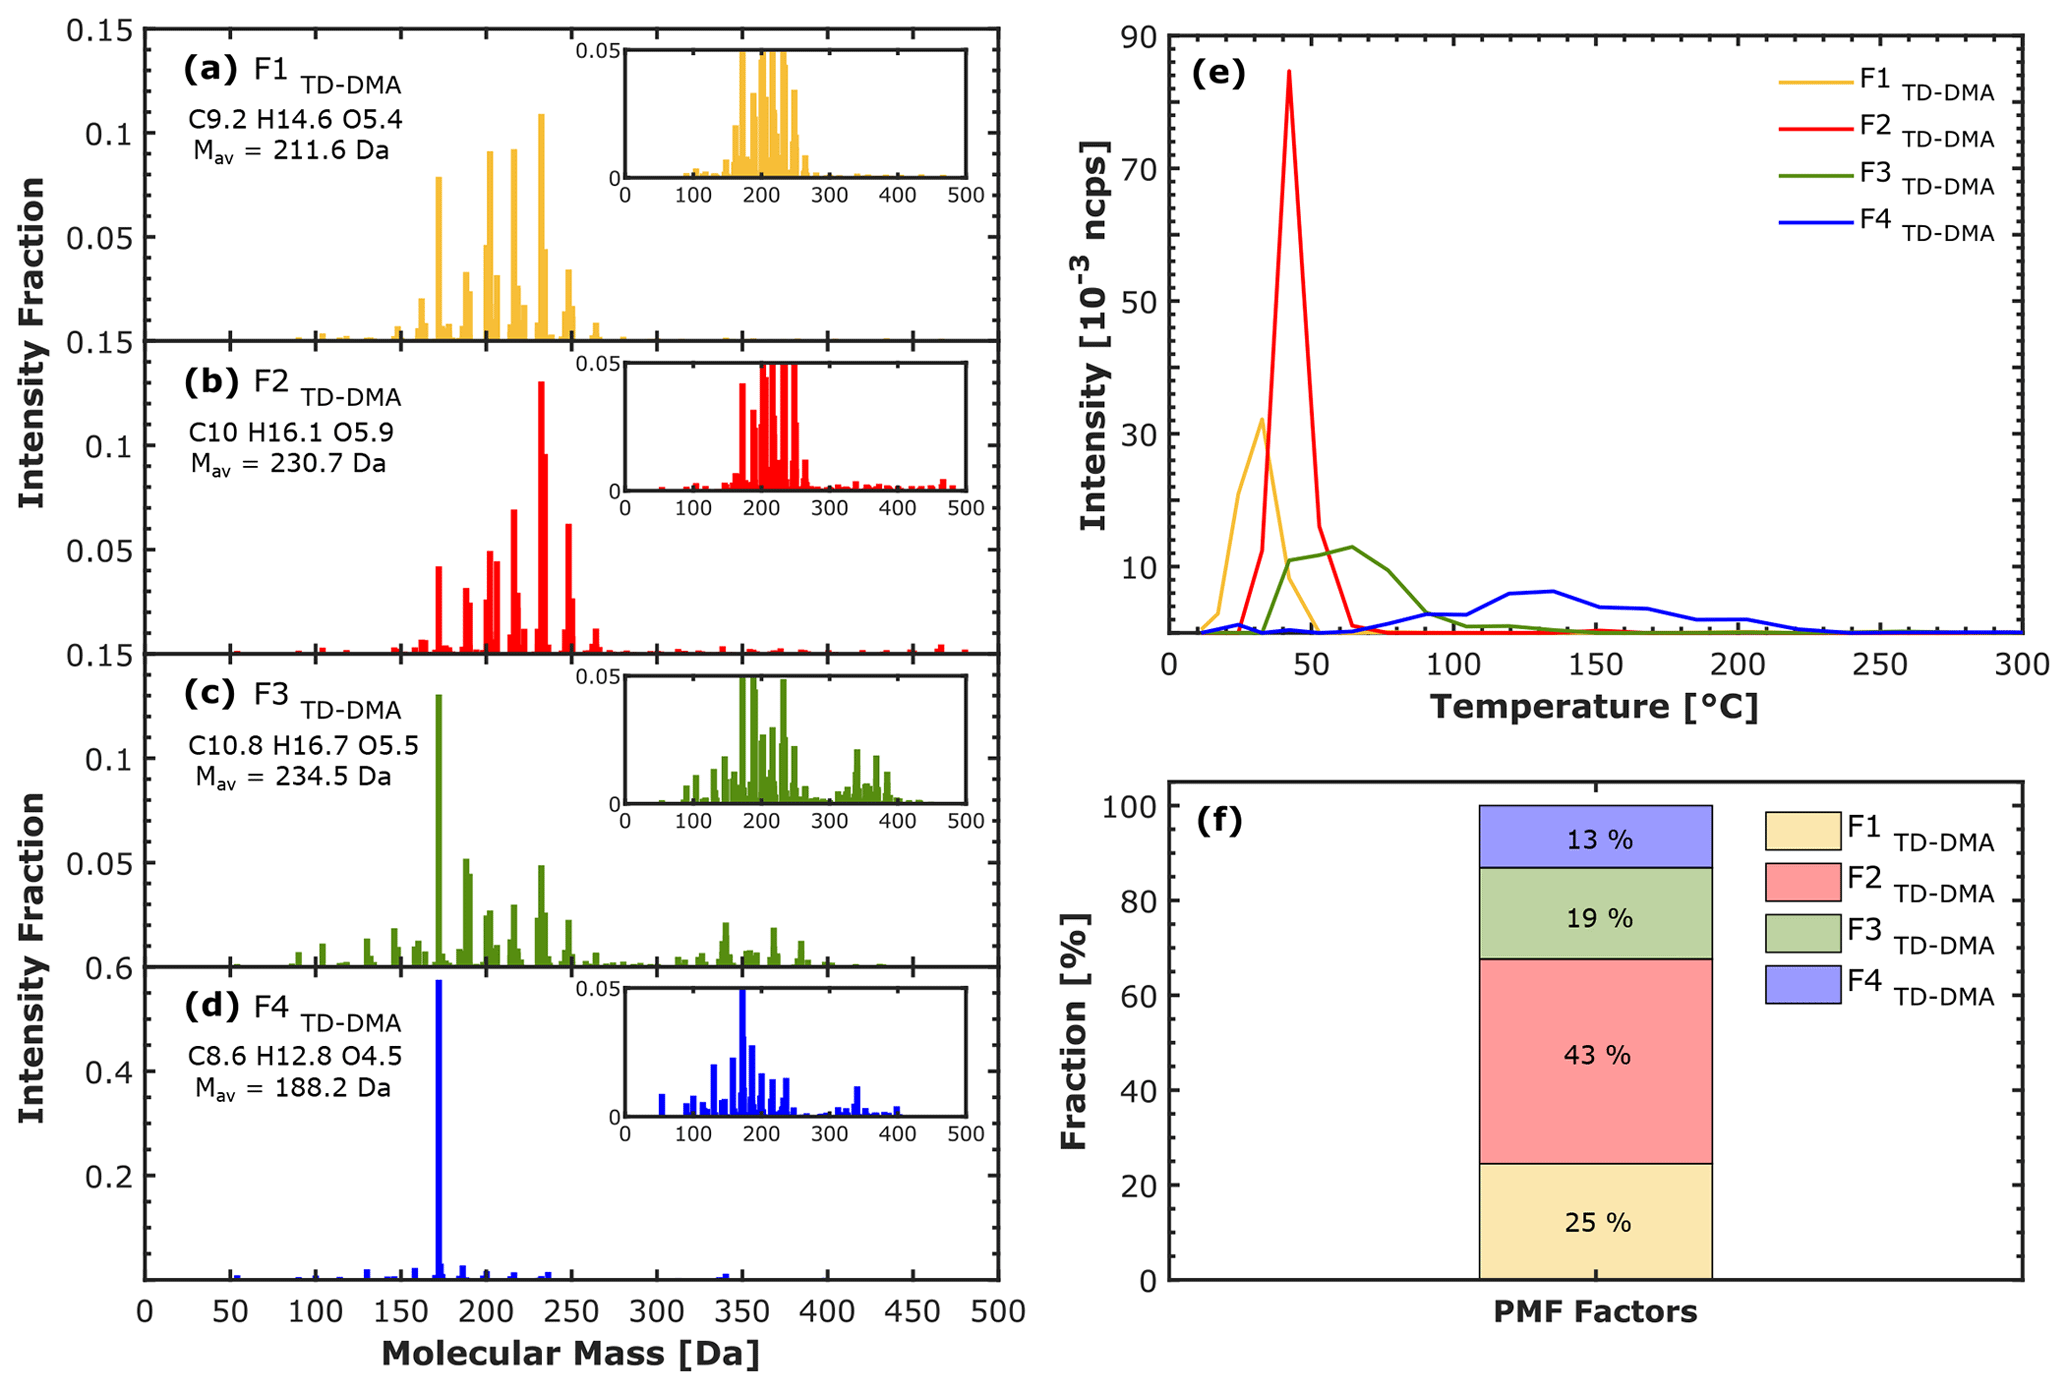
Figure 7PMF-suggested solution of the particle phase detected by the TD–DMA in the α-pinene ozonolysis experiment at −30 ∘C and 20 % RH. (a–d) Factor mass spectra, (e) factor thermograms, and (f) factor fraction. Each factor mass spectrum is normalized and colored according to the order of appearance in the thermogram: F1TD–DMA (yellow), F2TD–DMA (red), F3TD–DMA (green), and F4TD–DMA (blue). The thermogram (e) is expressed as a function of the temperature, which is an estimation based on the filament resistance. The particle-phase signal has been background-corrected.
For the purpose of comparison, we present in Fig. 8 the results from applying PMF to the FIGAERO thermal desorption data for a solution with six factors. Figure 8a–f contain the factor mass spectra, Fig. 8g contains the factor thermograms, and Fig. 8h shows the contribution of each factor to the total particle signal (the residuals and the factors expressed in terms of their oxygen content and mass are shown in Figs. S9 and S10 in the Supplement, respectively). F1FIGAERO, F2FIGAERO, and F3FIGAERO (Fig. 8a–c) show a distinct contribution from monomers and similar mass spectra but display different thermal profiles (in Fig. 8g). Specifically, F2FIGAERO and F3FIGAERO exhibit well-defined thermal profiles (∼ 15 ∘C difference in Tmax). However, F1FIGAERO shows a broader profile with no distinct maximum. We suspect that F1FIGAERO can be related to some of the following causes to some extent: (a) limited resolution of the chosen PMF solution at T< 50 ∘C, likely related to the presence of two neighboring factors that were not resolved completely; (b) interference from volatile material already evaporating at the beginning of the thermogram; and (c) adsorption of gaseous compounds. Reason (b) could be related to the procedure initiating the desorption, where the filter is flushed with N2 at ambient temperature before starting the heating ramp, which would likely affect the most volatile material. F4FIGAERO and F5FIGAERO (Fig. 8d and e) show a contribution from both monomers and dimers, with a very similar CHOac and Mav. However, they show different thermogram behavior (∼ 20 ∘C difference for Tmax; Fig. 8g). F6FIGAERO shows mainly contributions from compounds with low mass (< 200 Da) and desorbs mainly at the very end of the heating curve. The contribution of each factor to the total signal is shown in Fig. 8h.
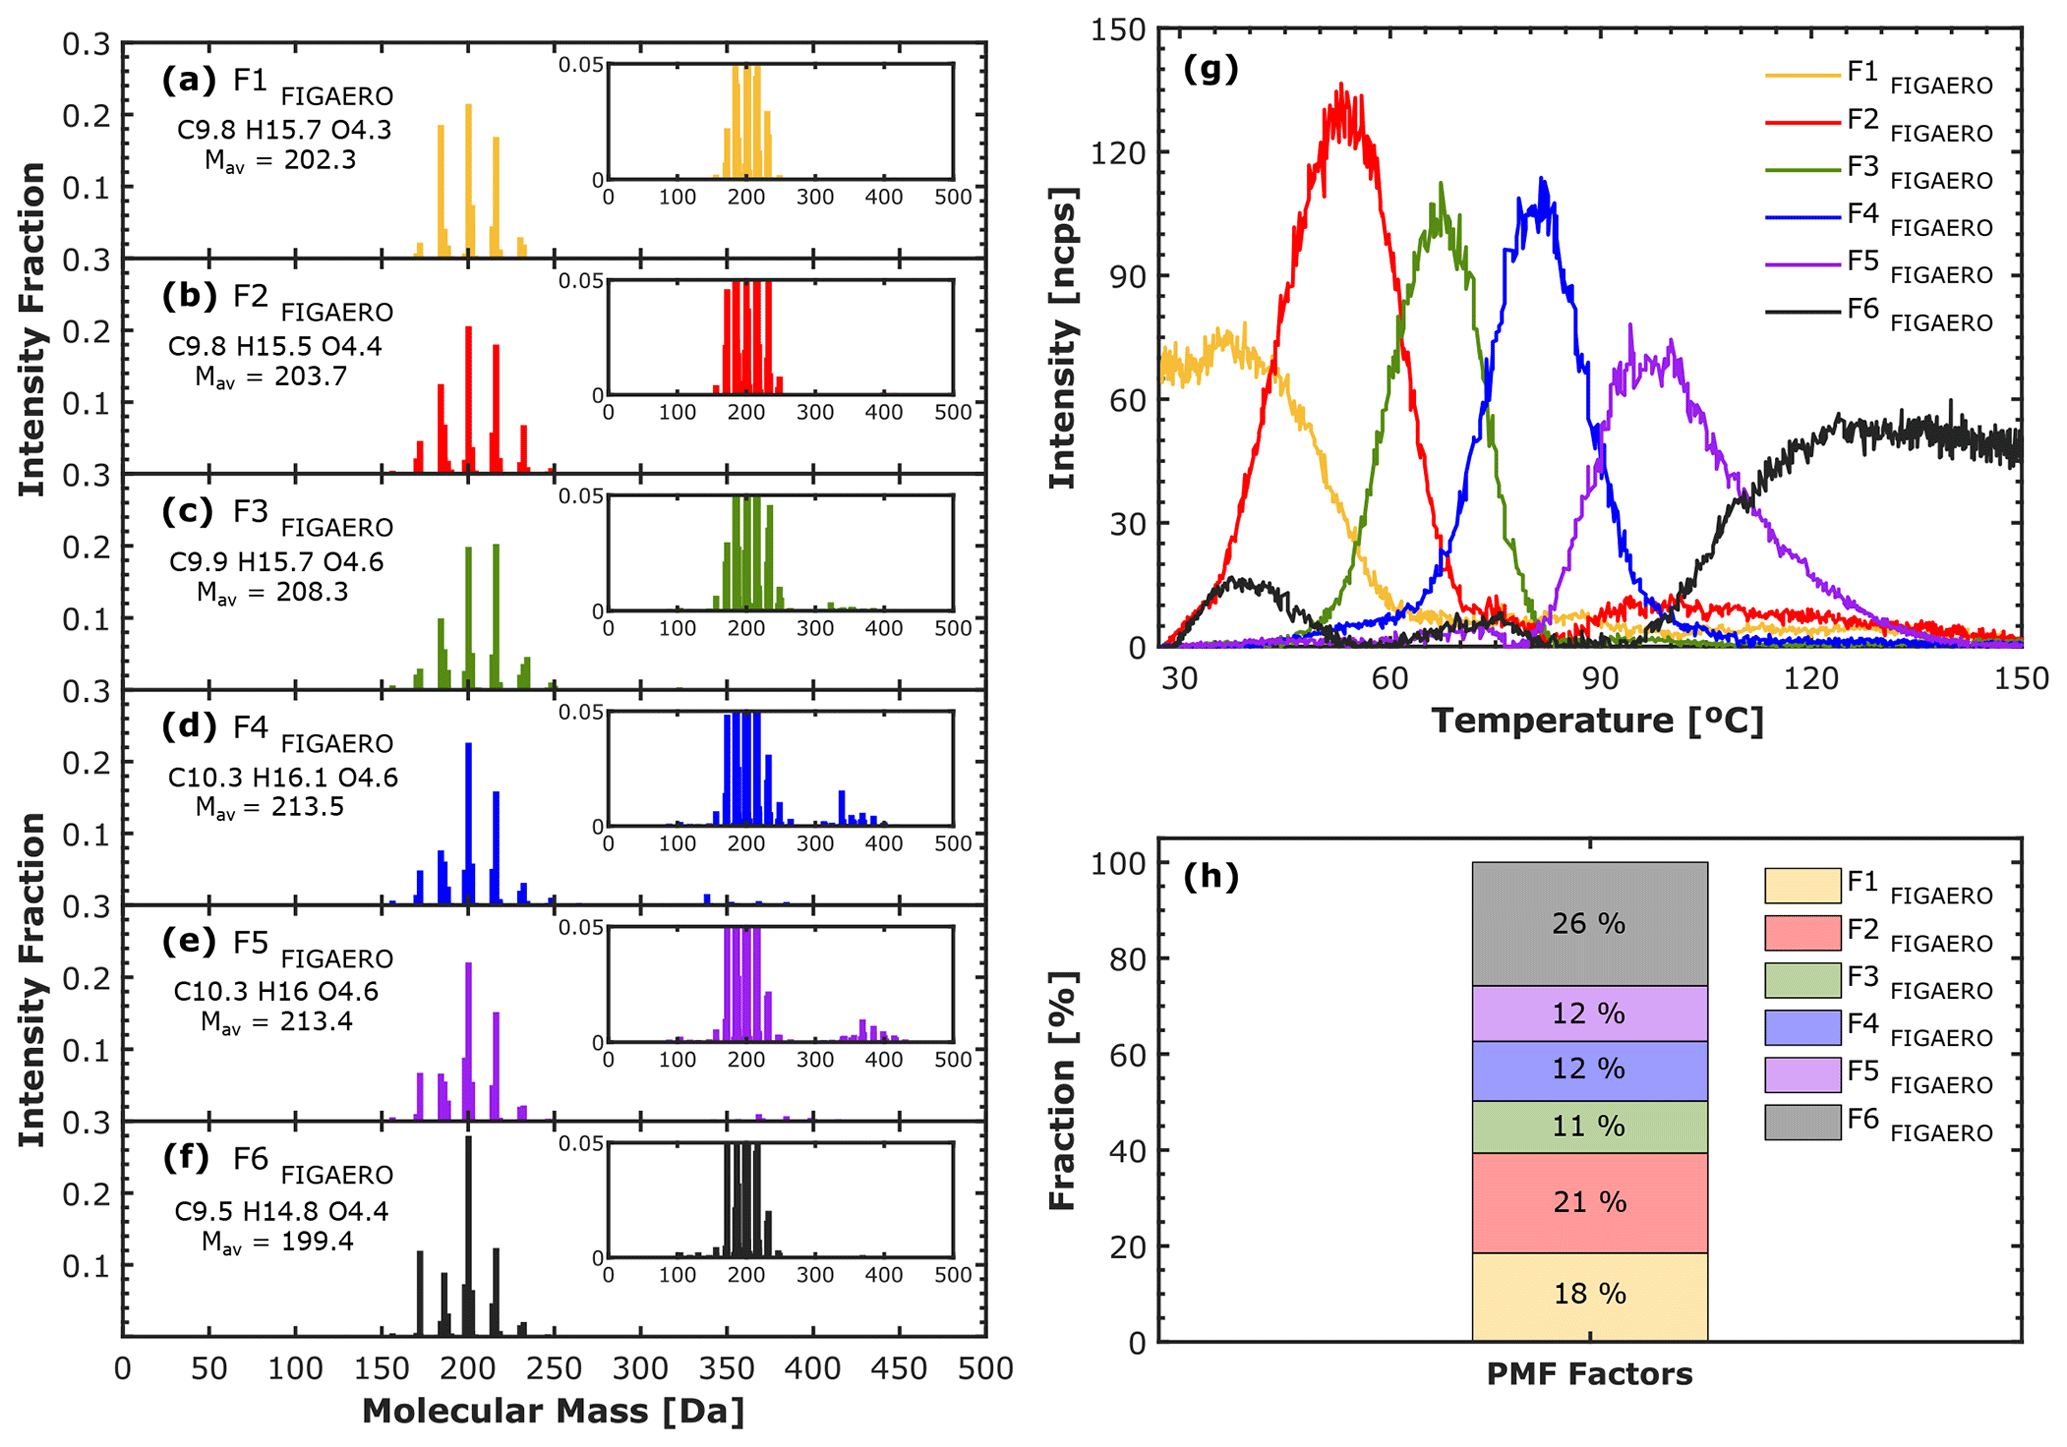
Figure 8PMF-suggested solution of the particle phase detected by FIGAERO in α-pinene ozonolysis experiment at −30 ∘C and 20 % RH. (a–e) Factor mass spectra, (g) factor thermograms, and (h) factor fraction. Each factor mass spectrum is normalized and colored according to the order of appearance in the thermogram: F1FIGAERO (yellow), F2FIGAERO (red), F3FIGAERO (green), F4FIGAERO (blue), F5FIGAERO (purple), and F6FIGAERO (black). The thermogram is expressed as a function of the temperature which causes the desorption. The particle-phase signal has been background-corrected.
As mentioned previously, we observed some factors with similar CHOac and Mav but different thermal behavior, possibly due to the presence of isomers. Molecules with the same composition but different structure and functional groups may exhibit different volatilities. In fact, functionality is one of the driving factors that determines volatility (Pankow and Asher, 2008; Wang et al., 2020). The mass spectrometry techniques reported here are not able to determine the molecular structure. We further note that the factors F4TD–DMA and F6FIGAERO desorb mainly at the very last stage of the heating curves, although they both have a clear contribution of compounds with mass < 200 Da and one of the lowest oxygen contents of all factors (i.e., the lowest degree of oxidation). We suspect that F4TD–DMA (Fig. 7d) and F6FIGAERO (Fig. 8g) are comprised primarily of products of thermal decomposition; the heat applied to desorb the particles instead cleaves certain chemical bonds in (larger) molecules before these could desorb. Small compounds are generally expected to desorb before the transmitted thermal energy (i.e., the desorption temperature) is high enough to cause such decomposition. However, F4TD–DMA and F6FIGAERO thermal profiles also exhibit a small peak at lower temperatures (observed more clearly in Fig. 8g at ∼ 40–50 ∘C), which is likely direct desorption. This may suggest that the low-temperature peak stems from monomers desorbing directly, while the broad high-temperature peak represents decomposing dimers/oligomers, which are then detected at the composition of the corresponding monomers. Previous studies applying PMF analysis to FIGAERO thermal desorption data also observed the presence of one or more factors dominated by thermal decomposition products for α-pinene- and sesquiterpene-derived SOA (Buchholz et al., 2020; Li et al., 2021). Those studies concluded that thermal decomposition was the main volatilization process at desorption temperatures above 100 ∘C, with differences between the observed SOA types.
By applying PMF analysis to thermal desorption data we observed that often, several factors are needed to explain the behavior of a single ion. One example is shown in the thermal profile of C8H12O4 for both FIGAERO and TD–DMA (in the Supplement Fig. S11). Particularly, F4 TD–DMA and F6FIGAERO explain the C8H12O4 signal at higher temperatures. This is consistent with previous observations. Lopez-Hilfiker et al. (2015) reported a significant contribution of thermal decomposition to the detection of C8H12O4 in the α-pinene ozonolysis system and stated that small acids present in higher-than-expected concentrations in SOA are likely entirely due to thermal decomposition. In our previous work (Caudillo et al., 2021), we presented individual results of the gas and particle phases of the same chemical system as in this study using the same ionization and detention scheme. We found that C8H12O4 contributed ∼ 10 times more to the particle than to the gas phase.
Furthermore, in the present study, the presence of the other PMF factors suggests that either there are at least three isomers with distinguishable volatility, or there are different thermal decomposition processes occurring at different desorption temperatures which all form C8H12O4 as a stable product. There are some studies that suggest possible decomposition pathways. For example, Hyttinen et al. (2022) investigated the two possible thermal decomposition reactions (dehydration and decarboxylation) proposed by Yang et al. (2021) and explored which reactants provide C8H12O4 as a product. They reported two isomers of C8H12O4 formed from C9H12O6 decarboxylation and one isomer formed from C8H14O5 dehydration. Certainly, the mechanisms that explain our observation remain uncertain and need to be further investigated.
3.3 Discussion of advantages and disadvantages of methods for measuring sub-100 nm SOA
Table 3 summarizes some advantages and disadvantages that should be considered when applying the methods presented here to the measurement of laboratory-generated sub-100 nm diameter SOA. When measuring particle chemical composition, the time needed for collecting enough particles (mass) should be carefully considered. This fact becomes a challenge when analyzing nanoparticles, since the small particles do not contribute significantly to the overall SOA mass. In that regard, EESI-TOF and FIGAERO provide a faster response (every 1 s and 30 min, respectively) than the other two methods and allow near-real-time monitoring. This is especially convenient when the chemical composition changes continuously (i.e., in complex environments or during oxidative-flow reactor or chamber experiments). In fact, the EESI-TOF's total particle signal exhibited a good correlation with the mass concentration calculated from the scanning mobility particle sizer (SMPS) measurements (r2>0.94; Fig. S12 in the Supplement). Despite the fact that there is a size dependence on EESI-TOF sensitivity, EESI-TOF sensitivity decreases as the size of the particles increases (Lee et al., 2021). The particle collection periods for TD–DMA and FILTER (offline analysis) were much longer and depended on the particle load and limit of detection. Besides the low time resolution, a main disadvantage of longer collection times is that aerosol aging may occur. This can potentially change the chemical composition and therefore lead to inaccurate aerosol speciation. Several studies have reported positive and negative artifacts caused by adsorption of gases on the collection surfaces, longer sampling periods, and volatilization of organic species either during collection or during storage (Turpin et al., 1994; Subramanian et al., 2004; Kristensen et al., 2016).
Table 3Advantages and drawbacks of four different techniques for measuring the chemical composition of nanoparticles.
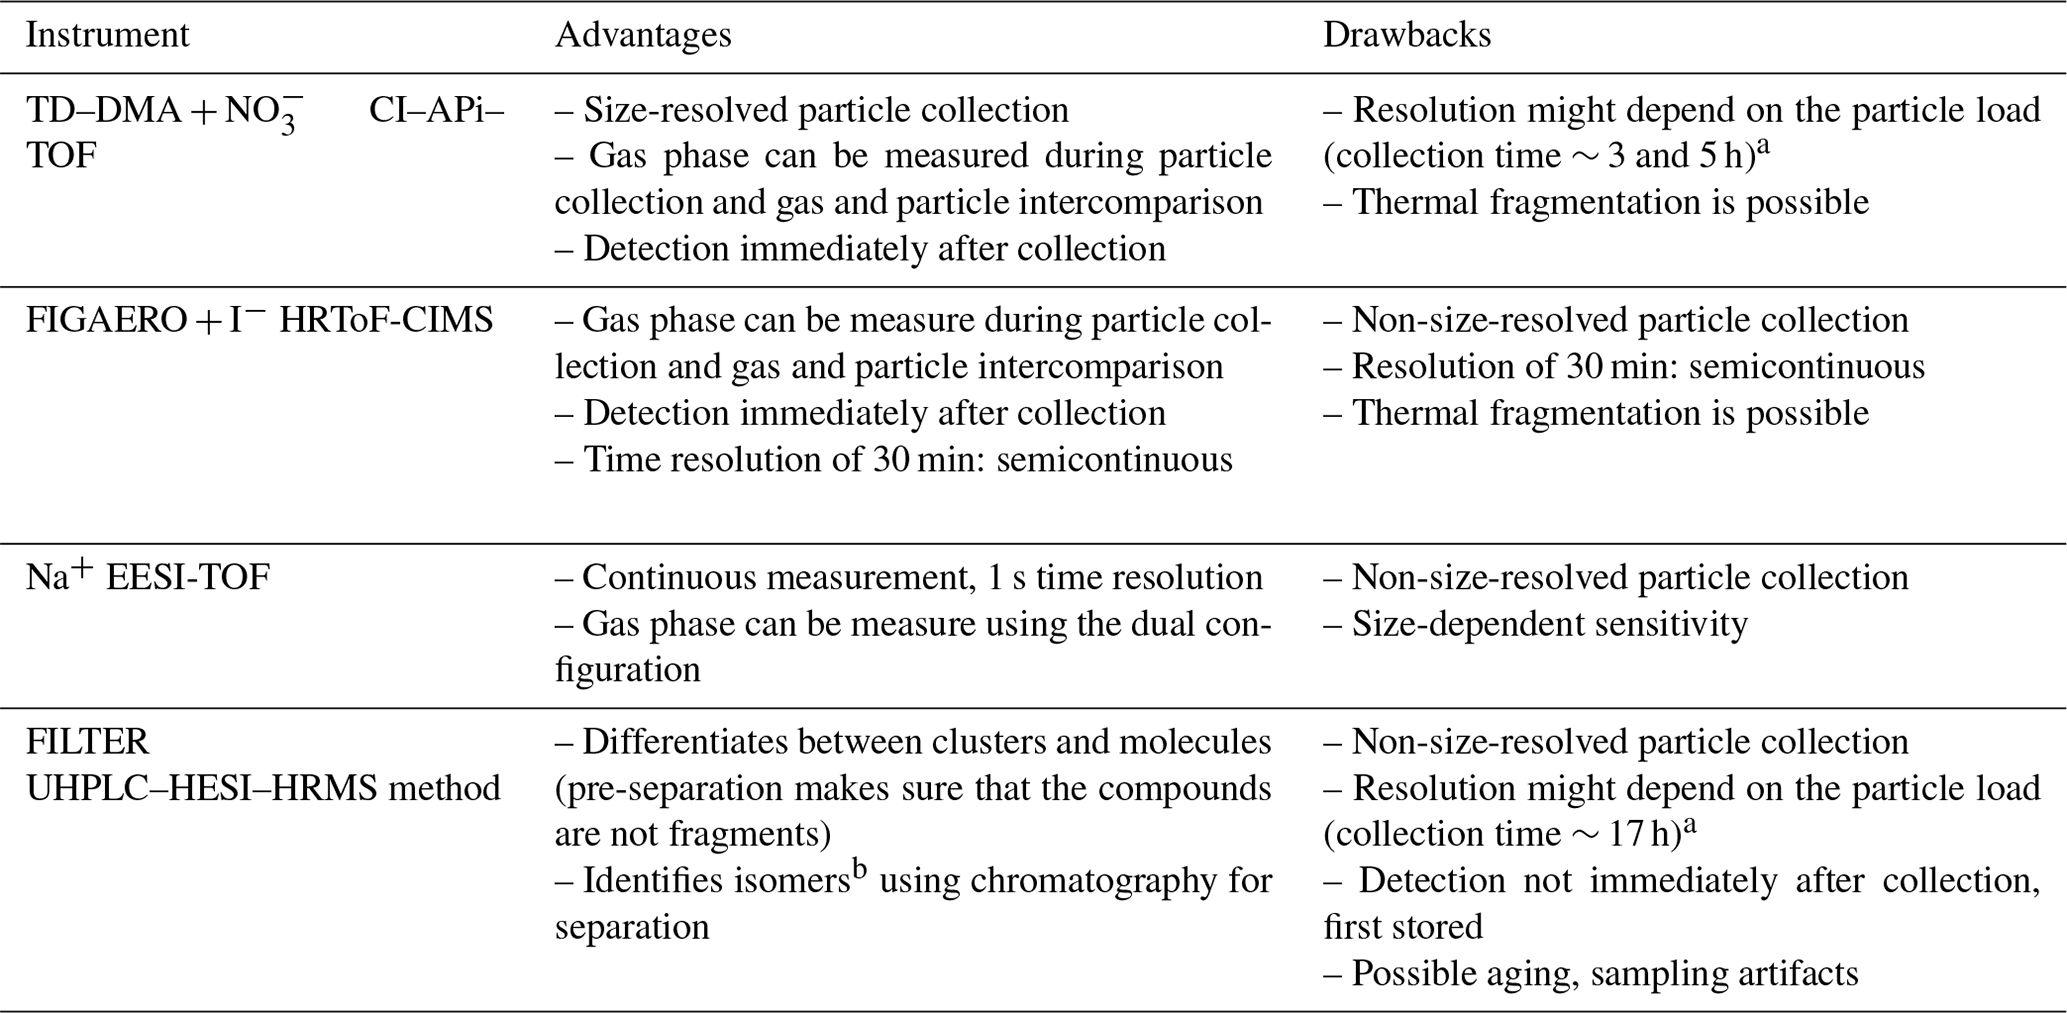
a Collection period for the experiments reported here for TD–DMA and FILTER. b An assumption about the structure can be expressed by doing complementary experiments.
The mass spectrometers coupled to TD–DMA and FIGAERO (nitrate CI–APi–TOF and iodide HRToF-CIMS, respectively) can perform gas-phase measurements while the particle collection takes places. EESI-TOF in the dual configuration can measure both the particle and gas phases quasi-simultaneously. This allows for a direct comparison between the gas and particle phases. Nevertheless, these mass spectrometry techniques can only identify chemical formulas, but with some limitations. Thus, it is not possible, for example, to provide structural information or identification of isomers. In contrast, the UHPLC–HESI–HRMS offline method has the advantage of being able to distinguish between clusters, molecules, and isomers based on the chromatographic separation. Furthermore, the fragmentation pattern (via MS2 experiments) can provide hints to interpret the functional groups and can be used for unambiguous compound identification. Hence, UHPLC–HRMS can provide robust analytical insight of the stable compounds.
The thermal desorption methods (TD–DMA and FIGAERO) exhibit significant thermal decomposition of compounds with desorption temperatures above 100 ∘C. For the EESI this seems to be less of an issue in general, but in some specific studies thermal decomposition was found to be relevant (Bell et al., 2022). PMF analysis of the thermal desorption data from the TD–DMA and FIGAERO could separate the contribution of products from thermal decomposition from those directly desorbing. However, even with this method, it is not possible to obtain information about the original compounds decomposing and their true volatility. The observed decomposition temperature can be used as an upper limit for volatility (i.e., their true volatility is lower than that associated with the apparent desorption temperature).
For the FILTER method, the compounds collected on the filter have to be extracted into a liquid phase for the UHPLC separation. The choice of solvents for this extraction will determine which fraction of organic compounds will be analyzed. The water–methanol mixture used in this study will extract polar, hydrophilic compounds similar to the water-soluble organic carbon category. Note that the exposure to water (or other solvents) may lead to chemical reactions, e.g., hydrolysis of (hydro)peroxides. The selective extraction and potential aqueous-phase chemistry may explain the smaller number of compounds detected with the FILTER method. However, for the compounds that do get analyzed, a much deeper understanding can be achieved (e.g., separation of isomers).
The ionization technique also plays a role in the final detection. If the ionization technique is not soft enough, this can result in fragmentation and affects the final response in the detection. In principle, the ionization techniques utilized by the instruments reported here are soft, meaning that no significant fragmentation occurs during the detection. Nevertheless, the ionization efficiency is different between the techniques. For example, with the nitrate reagent ion, highly oxygenated species can be better detected, while the ionization techniques used for FIGAERO and EESI-TOF (I− and Na+, respectively) are more sensitive to intermediately oxygenated organic compounds. The UHPLC–HESI–HRMS can be operated in both polarity modes, however, and can therefore detect species that are able to either donate protons (in the negative mode) or form clusters with protons or sodium (in the positive mode).
The complete characterization of species in the particle phase in terms of chemical formula and structure represents an analytical challenge. In this sense, the full identification of organic compounds is only possible by combining different techniques.
In this study, we present an overview of four different methods for measuring the chemical composition of ultrafine particles, and we describe their capabilities to detect organic compounds. Specifically, we reported the particle-phase composition from α-pinene ozonolysis at −50, −30, and −10 ∘C. In all the cases, the highest portion of detected compounds correspond to species with 10 and fewer than 10 carbon atoms (C10, C<10). The EESI-TOF generally detected a higher fraction (compared to the other techniques: TD–DMA, FIGAERO, and FILTERS) of compounds with more than 10 carbon atoms (C>10). In terms of volatility classes, EESI-TOF detected a higher fraction of ULVOCs in all the experiments reported here, especially for those at lower temperatures (−50 and −30 ∘C). We presume that several factors can explain these differences, i.e., thermal decomposition of large compounds (for the thermal desorption methods), for which we applied positive matrix factorization on the thermal profiles and suggested a four-factor solution for TD–DMA and a six-factor solution for the FIGAERO. Specifically, we suspect that F4TD–DMA and F6FIGAERO might be related to thermal decomposition to some extent. The PMF factors dominated by direct desorption can be interpreted as volatility classes, characterized by their Tmax values (the peak in the respective temperature desorption profiles). Nevertheless, further calibration experiments are needed to determine the relation between Tmax and saturation concentration. With the offline method, UHPLC–HESI–HRMS, we were able to verify the presence of isomers (two isomers for C8H12O4, C10H16O3, and C10H16O5 and three isomers for C10H16O4 and C10H16O6), which represents an important advantage over the online methods reported here.
While the methods generally agree on the most important compounds that are found in the nanoparticles, they all have their strengths and shortcomings. A major limit of these methods is that the measurements of the chemical compounds are not quantitative, and only rough estimates of the exact contributions of a compound to the overall chemical composition can be made. However, knowing the limitations of each method and using combinations of the available methods can provide deeper insights into the chemical composition and volatility of nanoparticles.
Data related to this article are available upon reasonable request to the corresponding authors.
The supplement related to this article is available online at: https://doi.org/10.5194/acp-23-6613-2023-supplement.
LC, MS, BL, MW, SB, TM, MG, ZB, LD, JD, HF, XCH, HL, NGAM, VM, HEM, GM, RM, RLM, BM, AO, TP, JP, MP, AAP, BR, WS, JS, PT, AT, NSU, DSW, SKW, ACW, WY, MZW, UB, JK, MK, KL, IEH, NMD, AK, and JC prepared the CLOUD facility and measurement instruments. LC, MS, BL, MW, SB, TM, MG, AA, DMB, LD, JD, HF, XCH, HL, NGAM, VM, GM, RLM, BM, JS, CT, AT, NSU, DSW, SKW, MZW, and JK collected the data. LC, MS, BL, MW, MT, SB, AB, SKW, and JC analyzed the data. LC, MS, BL, MW, MT, AB, MSim, ACW, MH, DMB, LD, TP, DS, RCF, AH, MK, KL, DW, IEH, NMD, ALV, AK, and JC contributed to the scientific discussion and interpretation of the results. LC, AB, UB, RCF, and JC contributed to the writing of the manuscript.
The contact author has declared that none of the authors has any competing interests.
Publisher’s note: Copernicus Publications remains neutral with regard to jurisdictional claims in published maps and institutional affiliations.
We thank CERN for providing the CLOUD facility to perform the experiments and the CLOUD community for supporting this study. We especially would like to thank Katja Ivanova, Timo Keber, Frank Malkemper, Robert Sitals, Hanna Elina Manninen, Antti Onnela, and Robert Kristic for their contributions to the experiment.
This research has been supported by the Horizon 2020 research and innovation program (CLOUD-MOTION, grant no. 764991, and PSI-FELLOW-II-3i, grant no. 701647); the Bundesministerium für Bildung, Wissenschaft, Forschung und Technologie (CLOUD-16, grant no. 01LK1601A); the Deutsche Forschungsgemeinschaft (grant no. 410009325); the National Science Foundation (grant nos. AGS-1801280, AGS-1801574, AGS-1801897, AGS-1602086, and AGS-18801329); the Schweizerischer Nationalfonds zur Förderung der Wissenschaftlichen Forschung (grant nos. 200020_172602 and 20FI20_172622); CERN (grant no. CERN/FIS-COM/0028/2019); the Academy of Finland (grant nos. 325656, 316114, 314798, 325647, 341349, and 337549); the European Research Council, HORIZON EUROPE (ATM-GTP, grant no. 742206); and the Prince Albert II of Monaco Foundation (grant no. 2859).
This paper was edited by John Liggio and reviewed by three anonymous referees.
Bell, D. M., Wu, C., Bertrand, A., Graham, E., Schoonbaert, J., Giannoukos, S., Baltensperger, U., Prevot, A. S. H., Riipinen, I., El Haddad, I., and Mohr, C.: Particle-phase processing of α-pinene NO3 secondary organic aerosol in the dark, Atmos. Chem. Phys., 22, 13167–13182, https://doi.org/10.5194/acp-22-13167-2022, 2022.
Breitenlechner, M., Fischer, L., Hainer, M., Heinritzi, M., Curtius, J., and Hansel, A.: PTR3: An Instrument for Studying the Lifecycle of Reactive Organic Carbon in the Atmosphere, Anal. Chem., 89, 5824–5831, https://doi.org/10.1021/acs.analchem.6b05110, 2017.
Buchholz, A., Ylisirniö, A., Huang, W., Mohr, C., Canagaratna, M., Worsnop, D. R., Schobesberger, S., and Virtanen, A.: Deconvolution of FIGAERO–CIMS thermal desorption profiles using positive matrix factorisation to identify chemical and physical processes during particle evaporation, Atmos. Chem. Phys., 20, 7693–7716, https://doi.org/10.5194/acp-20-7693-2020, 2020.
Bzdek, B. R., Pennington, M. R., and Johnston, M. V.: Single particle chemical analysis of ambient ultrafine aerosol: A review, J. Aerosol Sci., 52, 109–120, https://doi.org/10.1016/j.jaerosci.2012.05.001, 2012.
Caudillo, L., Rörup, B., Heinritzi, M., Marie, G., Simon, M., Wagner, A. C., Müller, T., Granzin, M., Amorim, A., Ataei, F., Baalbaki, R., Bertozzi, B., Brasseur, Z., Chiu, R., Chu, B., Dada, L., Duplissy, J., Finkenzeller, H., Gonzalez Carracedo, L., He, X. C., Hofbauer, V., Kong, W., Lamkaddam, H., Lee, C. P., Lopez, B., Mahfouz, N. G. A., Makhmutov, V., Manninen, H. E., Marten, R., Massabò, D., Mauldin, R. L., Mentler, B., Molteni, U., Onnela, A., Pfeifer, J., Philippov, M., Piedehierro, A. A., Schervish, M., Scholz, W., Schulze, B., Shen, J., Stolzenburg, D., Stozhkov, Y., Surdu, M., Tauber, C., Tham, Y. J., Tian, P., Tomé, A., Vogt, S., Wang, M., Wang, D. S., Weber, S. K., Welti, A., Yonghong, W., Yusheng, W., Zauner-Wieczorek, M., Baltensperger, U., El Haddad, I., Flagan, R. C., Hansel, A., Höhler, K., Kirkby, J., Kulmala, M., Lehtipalo, K., Möhler, O., Saathoff, H., Volkamer, R., Winkler, P. M., Donahue, N. M., Kürten, A., and Curtius, J.: Chemical composition of nanoparticles from α-pinene nucleation and the influence of isoprene and relative humidity at low temperature, Atmos. Chem. Phys., 21, 17099–17114, https://doi.org/10.5194/acp-21-17099-2021, 2021.
Cech, N. B. and Enke, C. G.: Practical implications of some recent studies in electrospray ionization fundamentals, Mass Spectrom. Rev., 20, 362–387, https://doi.org/10.1002/mas.10008, 2001.
Curtius, J., Sierau, B., Arnold, F., Baumann, R., Busen, R., Schulte, P., and Schumann, U.: First direct sulfuric acid detection in the exhaust plume of a jet aircraft in flight, Geophys. Res. Lett., 25, 923–926, https://doi.org/10.1029/98GL00512, 1998.
D'Ambro, E. L., Schobesberger, S., Gaston, C. J., Lopez-Hilfiker, F. D., Lee, B. H., Liu, J., Zelenyuk, A., Bell, D., Cappa, C. D., Helgestad, T., Li, Z., Guenther, A., Wang, J., Wise, M., Caylor, R., Surratt, J. D., Riedel, T., Hyttinen, N., Salo, V. T., Hasan, G., Kurtén, T., Shilling, J. E., and Thornton, J. A.: Chamber-based insights into the factors controlling epoxydiol (IEPOX) secondary organic aerosol (SOA) yield, composition, and volatility, Atmos. Chem. Phys., 19, 11253–11265, https://doi.org/10.5194/acp-19-11253-2019, 2019.
Donahue, N. M., Epstein, S. A., Pandis, S. N., and Robinson, A. L.: A two-dimensional volatility basis set: 1. organic-aerosol mixing thermodynamics, Atmos. Chem. Phys., 11, 3303–3318, https://doi.org/10.5194/acp-11-3303-2011, 2011.
Duplissy, J., Merikanto, J., Franchin, A., Tsagkogeorgas, G., Kangasluoma, J., Wimmer, D., Vuollekoski, H., Schobesberger, S., Lehtipalo, K., Flagan, R. C., Brus, D., Donahue, N. M., Vehkamäki, H., Almeida, J., Amorim, A., Barmet, P., Bianchi, F., Breitenlechner, M., Dunne, E. M., Guida, R., Henschel, H., Junninen, H., Kirkby, J., Kürten, A., Kupc, A., Määttänen, A., Makhmutov, V., Mathot, S., Nieminen, T., Onnela, A., Praplan, A. P., Riccobono, F., Rondo, L., Steiner, G., Tome, A., Walther, H., Baltensperger, U., Carslaw, K. S., Dommen, J., Hansel, A., Petäjä, T., Sipilä, M., Stratmann, F., Vrtala, A., Wagner, P. E., Worsnop, D. R., Curtius, J., and Kulmala, M.: Effect of ions on sulfuric acid-water binary particle formation: 2. Experimental data and comparison with QC-normalized classical nucleation theory, J. Geophys. Res.-Atmos., 121, 1752–1775, https://doi.org/10.1002/2015JD023539, 2016.
Epstein, S. A., Riipinen, I., and Donahue, N. M.: A semiempirical correlation between enthalpy of vaporization and saturation concentration for organic aerosol, Environ. Sci. Technol., 44, 743–748, 2009.
Gonser, S. G. and Held, A.: A chemical analyzer for charged ultrafine particles, Atmos. Meas. Tech., 6, 2339–2348, https://doi.org/10.5194/amt-6-2339-2013, 2013.
Graus, M., Müller, M., and Hansel, A.: High resolution PTR-TOF: Quantification and formula confirmation of VOC in real time, J. Am. Soc. Mass Sp., 21, 1037–1044, https://doi.org/10.1016/j.jasms.2010.02.006, 2010.
Hallquist, M., Wenger, J. C., Baltensperger, U., Rudich, Y., Simpson, D., Claeys, M., Dommen, J., Donahue, N. M., George, C., Goldstein, A. H., Hamilton, J. F., Herrmann, H., Hoffmann, T., Iinuma, Y., Jang, M., Jenkin, M. E., Jimenez, J. L., Kiendler-Scharr, A., Maenhaut, W., McFiggans, G., Mentel, T. F., Monod, A., Prévôt, A. S. H., Seinfeld, J. H., Surratt, J. D., Szmigielski, R., and Wildt, J.: The formation, properties and impact of secondary organic aerosol: current and emerging issues, Atmos. Chem. Phys., 9, 5155–5236, https://doi.org/10.5194/acp-9-5155-2009, 2009.
He, S., Li, L., Duan, H., Naqwi, A., and Hogan, C. J.: Aerosol Analysis via Electrostatic Precipitation-Electrospray Ionization Mass Spectrometry, Anal. Chem., 87, 6752–6760, https://doi.org/10.1021/acs.analchem.5b01183, 2015.
He, X.-C., Tham, Y. J., Dada, L., Wang, M., Finkenzeller, H., Stolzenburg, D., Iyer, S., Simon, M., Kürten, A., Shen, J., Rörup, B., Rissanen, M., Schobesberger, S., Baalbaki, R., Wang, D. S., Koenig, T. K., Jokinen, T., Sarnela, N., Beck, L. J., Almeida, J., Amanatidis, S., Amorim, A., Ataei, F., Baccarini, A., Bertozzi, B., Bianchi, F., Brilke, S., Caudillo, L., Chen, D., Chiu, R., Chu, B., Dias, A., Ding, A., Dommen, J., Duplissy, J., El Haddad, I., Gonzalez Carracedo, L., Granzin, M., Hansel, A., Heinritzi, M., Hofbauer, V., Junninen, H., Kangasluoma, J., Kemppainen, D., Kim, C., Kong, W., Krechmer, J. E., Kvashin, A., Laitinen, T., Lamkaddam, H., Lee, C. P., Lehtipalo, K., Leiminger, M., Li, Z., Makhmutov, V., Manninen, H. E., Marie, G., Marten, R., Mathot, S., Mauldin, R. L., Mentler, B., Möhler, O., Müller, T., Nie, W., Onnela, A., Petäjä, T., Pfeifer, J., Philippov, M., Ranjithkumar, A., Saiz-Lopez, A., Salma, I., Scholz, W., Schuchmann, S., Schulze, B., Steiner, G., Stozhkov, Y., Tauber, C., Tomé, A., Thakur, R. C., Väisänen, O., Vazquez-Pufleau, M., Wagner, A. C., Wang, Y., Weber, S. K., Winkler, P. M., Wu, Y., Xiao, M., Yan, C., Ye, Q., Ylisirniö, A., Zauner-Wieczorek, M., Zha, Q., Zhou, P., Flagan, R. C., Curtius, J., Baltensperger, U., Kulmala, M., Kerminen, V.-M., Kurtén, T., Donahue, N. M., Volkamer, R., Kirkby, J., Worsnop, D. R., and Sipilä, M.: Role of iodine oxoacids in atmospheric aerosol nucleation, Science, 371, 589–595, https://doi.org/10.1126/science.abe0298, 2021.
Heinritzi, M., Simon, M., Steiner, G., Wagner, A. C., Kürten, A., Hansel, A., and Curtius, J.: Characterization of the mass-dependent transmission efficiency of a CIMS, Atmos. Meas. Tech., 9, 1449–1460, https://doi.org/10.5194/amt-9-1449-2016, 2016.
Horan, A. J., Apsokardu, M. J., and Johnston, M. V.: Droplet Assisted Inlet Ionization for Online Analysis of Airborne Nanoparticles, Anal. Chem., 89, 1059–1062, https://doi.org/10.1021/acs.analchem.6b04718, 2017.
Hyttinen, N., Pullinen, I., Nissinen, A., Schobesberger, S., Virtanen, A., and Yli-Juuti, T.: Comparison of saturation vapor pressures of α-pinene + O3 oxidation products derived from COSMO-RS computations and thermal desorption experiments, Atmos. Chem. Phys., 22, 1195–1208, https://doi.org/10.5194/acp-22-1195-2022, 2022.
Jayne, J. T., Leard, D. C., Zhang, X., Davidovits, P., Smith, K. A., Kolb, C. E., and Worsnop, D. R.: Development of an Aerosol Mass Spectrometer for Size and Composition Analysis of Submicron Particles, Aerosol Sci. Technol., 33, 49–70, https://doi.org/10.1080/027868200410840, 2000.
Jokinen, T., Sipilä, M., Junninen, H., Ehn, M., Lönn, G., Hakala, J., Petäjä, T., Mauldin Iii, R. L., Kulmala, M., and Worsnop, D. R.: Atmospheric sulphuric acid and neutral cluster measurements using CI-APi-TOF, Atmos. Chem. Phys., 12, 4117–4125, https://doi.org/10.5194/acp-12-4117-2012, 2012.
Kirkby, J., Curtius, J., Almeida, J., Dunne, E., Duplissy, J., Ehrhart, S., Franchin, A., Gagné, S., Ickes, L., Kürten, A., Kupc, A., Metzger, A., Riccobono, F., Rondo, L., Schobesberger, S., Tsagkogeorgas, G., Wimmer, D., Amorim, A., Bianchi, F., Breitenlechner, M., David, A., Dommen, J., Downard, A., Ehn, M., Flagan, R. C., Haider, S., Hansel, A., Hauser, D., Jud, W., Junninen, H., Kreissl, F., Kvashin, A., Laaksonen, A., Lehtipalo, K., Lima, J., Lovejoy, E. R., Makhmutov, V., Mathot, S., Mikkilä, J., Minginette, P., Mogo, S., Nieminen, T., Onnela, A., Pereira, P., Petäjä, T., Schnitzhofer, R., Seinfeld, J. H., Sipilä, M., Stozhkov, Y., Stratmann, F., Tomé, A., Vanhanen, J., Viisanen, Y., Vrtala, A., Wagner, P. E., Walther, H., Weingartner, E., Wex, H., Winkler, P. M., Carslaw, K. S., Worsnop, D. R., Baltensperger, U., and Kulmala, M.: Role of sulphuric acid, ammonia and galactic cosmic rays in atmospheric aerosol nucleation, Nature, 476, 429–433, https://doi.org/10.1038/nature10343, 2011.
Kirkby, J., Duplissy, J., Sengupta, K., Frege, C., Gordon, H., Williamson, C., Heinritzi, M., Simon, M., Yan, C., Almeida, J., Tröstl, J., Nieminen, T., Ortega, I. K., Wagner, R., Adamov, A., Amorim, A., Bernhammer, A.-K., Bianchi, F., Breitenlechner, M., Brilke, S., Chen, X., Craven, J., Dias, A., Ehrhart, S., Flagan, R. C., Franchin, A., Fuchs, C., Guida, R., Hakala, J., Hoyle, C. R., Jokinen, T., Junninen, H., Kangasluoma, J., Kim, J., Krapf, M., Kürten, A., Laaksonen, A., Lehtipalo, K., Makhmutov, V., Mathot, S., Molteni, U., Onnela, A., Peräkylä, O., Piel, F., Petäjä, T., Praplan, A. P., Pringle, K., Rap, A., Richards, N. A. D., Riipinen, I., Rissanen, M. P., Rondo, L., Sarnela, N., Schobesberger, S., Scott, C. E., Seinfeld, J. H., Sipilä, M., Steiner, G., Stozhkov, Y., Stratmann, F., Tomé, A., Virtanen, A., Vogel, A. L., Wagner, A. C., Wagner, P. E., Weingartner, E., Wimmer, D., Winkler, P. M., Ye, P., Zhang, X., Hansel, A., Dommen, J., Donahue, N. M., Worsnop, D. R., Baltensperger, U., Kulmala, M., Carslaw, K. S., and Curtius, J.: Ion-induced nucleation of pure biogenic particles, Nature, 533, 521–526, https://doi.org/10.1038/nature17953, 2016.
Kristensen, K., Bilde, M., Aalto, P. P., Petäjä, T., and Glasius, M.: Denuder/filter sampling of organic acids and organosulfates at urban and boreal forest sites: Gas/particle distribution and possible sampling artifacts, Atmos. Environ., 130, 36–53, https://doi.org/10.1016/j.atmosenv.2015.10.046, 2016.
Kroll, J. H., Donahue, N. M., Jimenez, J. L., Kessler, S. H., Canagaratna, M. R., Wilson, K. R., Altieri, K. E., Mazzoleni, L. R., Wozniak, A. S., Bluhm, H., Mysak, E. R., Smith, J. D., Kolb, C. E., and Worsnop, D. R.: Carbon oxidation state as a metric for describing the chemistry of atmospheric organic aerosol, Nat. Chem., 3, 133–139, https://doi.org/10.1038/nchem.948, 2011.
Kürten, A., Rondo, L., Ehrhart, S., and Curtius, J.: Performance of a corona ion source for measurement of sulfuric acid by chemical ionization mass spectrometry, Atmos. Meas. Tech., 4, 437–443, https://doi.org/10.5194/amt-4-437-2011, 2011.
Kürten, A., Jokinen, T., Simon, M., Sipilä, M., Sarnela, N., Junninen, H., Adamov, A., Almeida, J., Amorim, A., Bianchi, F., Breitenlechner, M., Dommen, J., Donahue, N. M., Duplissy, J., Ehrhart, S., Flagan, R. C., Franchin, A., Hakala, J., Hansel, A., Heinritzi, M., Hutterli, M., Kangasluoma, J., Kirkby, J., Laaksonen, A., Lehtipalo, K., Leiminger, M., Makhmutov, V., Mathot, S., Onnela, A., Petäjä, T., Praplan, A. P., Riccobono, F., Rissanen, M. P., Rondo, L., Schobesberger, S., Seinfeld, J. H., Steiner, G., Tomé, A., Tröstl, J., Winkler, P. M., Williamson, C., Wimmer, D., Ye, P., Baltensperger, U., Carslaw, K. S., Kulmala, M., Worsnop, D. R., and Curtius, J.: Neutral molecular cluster formation of sulfuric acid–dimethylamine observed in real time under atmospheric conditions, P. Natl. Acad. Sci. USA, 111, 15019–15024, https://doi.org/10.1073/pnas.1404853111, 2014.
Laitinen, T., Hartonen, K., Kulmala, M., and Riekkola, M. L.: Aerosol time-of-flight mass spectrometer for measuring ultrafine aerosol particles, Boreal Environ. Res., 14, 539–549, 2009.
Lee, B. H., Lopez-Hilfiker, F. D., Mohr, C., Kurtén, T., Worsnop, D. R., and Thornton, J. A.: An Iodide-Adduct High-Resolution Time-of-Flight Chemical-Ionization Mass Spectrometer: Application to Atmospheric Inorganic and Organic Compounds, Environ. Sci. Technol., 48, 6309–6317, https://doi.org/10.1021/es500362a, 2014.
Lee, C. P., Riva, M., Wang, D., Tomaz, S., Li, D., Perrier, S., Slowik, J. G., Bourgain, F., Schmale, J., Prevot, A. S. H., Baltensperger, U., George, C., and El Haddad, I.: Online Aerosol Chemical Characterization by Extractive Electrospray Ionization–Ultrahigh-Resolution Mass Spectrometry (EESI-Orbitrap), Environ. Sci. Technol., 54, 3871–3880, https://doi.org/10.1021/acs.est.9b07090, 2020.
Lee, C. P., Surdu, M., Bell, D. M., Lamkaddam, H., Wang, M., Ataei, F., Hofbauer, V., Lopez, B., Donahue, N. M., Dommen, J., Prevot, A. S. H., Slowik, J. G., Wang, D., Baltensperger, U., and El Haddad, I.: Effects of aerosol size and coating thickness on the molecular detection using extractive electrospray ionization, Atmos. Meas. Tech., 14, 5913–5923, https://doi.org/10.5194/amt-14-5913-2021, 2021.
Lee, C. P., Surdu, M., Bell, D. M., Dommen, J., Xiao, M., Zhou, X., Baccarini, A., Giannoukos, S., Wehrle, G., Schneider, P. A., Prevot, A. S. H., Slowik, J. G., Lamkaddam, H., Wang, D., Baltensperger, U., and El Haddad, I.: High-frequency gaseous and particulate chemical characterization using extractive electrospray ionization mass spectrometry (Dual-Phase-EESI-TOF), Atmos. Meas. Tech., 15, 3747–3760, https://doi.org/10.5194/amt-15-3747-2022, 2022.
Li, Z., Buchholz, A., Ylisirniö, A., Barreira, L., Hao, L., Schobesberger, S., Yli-Juuti, T., and Virtanen, A.: Evolution of volatility and composition in sesquiterpene-mixed and α-pinene secondary organic aerosol particles during isothermal evaporation, Atmos. Chem. Phys., 21, 18283–18302, https://doi.org/10.5194/acp-21-18283-2021, 2021.
Lopez-Hilfiker, F. D., Mohr, C., Ehn, M., Rubach, F., Kleist, E., Wildt, J., Mentel, T. F., Lutz, A., Hallquist, M., Worsnop, D., and Thornton, J. A.: A novel method for online analysis of gas and particle composition: description and evaluation of a Filter Inlet for Gases and AEROsols (FIGAERO), Atmos. Meas. Tech., 7, 983–1001, https://doi.org/10.5194/amt-7-983-2014, 2014.
Lopez-Hilfiker, F. D., Mohr, C., Ehn, M., Rubach, F., Kleist, E., Wildt, J., Mentel, T. F., Carrasquillo, A. J., Daumit, K. E., Hunter, J. F., Kroll, J. H., Worsnop, D. R., and Thornton, J. A.: Phase partitioning and volatility of secondary organic aerosol components formed from α-pinene ozonolysis and OH oxidation: the importance of accretion products and other low volatility compounds, Atmos. Chem. Phys., 15, 7765–7776, https://doi.org/10.5194/acp-15-7765-2015, 2015.
Lopez-Hilfiker, F. D., Iyer, S., Mohr, C., Lee, B. H., D'Ambro, E. L., Kurtén, T., and Thornton, J. A.: Constraining the sensitivity of iodide adduct chemical ionization mass spectrometry to multifunctional organic molecules using the collision limit and thermodynamic stability of iodide ion adducts, Atmos. Meas. Tech., 9, 1505–1512, https://doi.org/10.5194/amt-9-1505-2016, 2016.
Lopez-Hilfiker, F. D., Pospisilova, V., Huang, W., Kalberer, M., Mohr, C., Stefenelli, G., Thornton, J. A., Baltensperger, U., Prevot, A. S. H., and Slowik, J. G.: An extractive electrospray ionization time-of-flight mass spectrometer (EESI-TOF) for online measurement of atmospheric aerosol particles, Atmos. Meas. Tech., 12, 4867–4886, https://doi.org/10.5194/amt-12-4867-2019, 2019.
Paatero, P. and Tapper, U.: Positive matrix factorization: A non-negative factor model with optimal utilization of error estimates of data values, Environmetrics, 5, 111–126, 1994.
Pankow, J. F. and Asher, W. E.: SIMPOL.1: a simple group contribution method for predicting vapor pressures and enthalpies of vaporization of multifunctional organic compounds, Atmos. Chem. Phys., 8, 2773–2796, https://doi.org/10.5194/acp-8-2773-2008, 2008.
Phares, D. J. and Collier, S.: Direct Collection of Aerosols by Electrostatic Classification for Size-Resolved Chemical Analysis, Aerosol Sci. Technol., 44, 173–181, https://doi.org/10.1080/02786820903482914, 2010.
Shen, J., Scholz, W., He, X.-C., Zhou, P., Marie, G., Wang, M., Marten, R., Surdu, M., Rörup, B., Baalbaki, R., Amorim, A., Ataei, F., Bell, D. M., Bertozzi, B., Brasseur, Z., Caudillo, L., Chen, D., Chu, B., Dada, L., Duplissy, J., Finkenzeller, H., Granzin, M., Guida, R., Heinritzi, M., Hofbauer, V., Iyer, S., Kemppainen, D., Kong, W., Krechmer, J. E., Kürten, A., Lamkaddam, H., Lee, C. P., Lopez, B., Mahfouz, N. G. A., Manninen, H. E., Massabò, D., Mauldin, R. L., Mentler, B., Müller, T., Pfeifer, J., Philippov, M., Piedehierro, A. A., Roldin, P., Schobesberger, S., Simon, M., Stolzenburg, D., Tham, Y. J., Tomé, A., Umo, N. S., Wang, D., Wang, Y., Weber, S. K., Welti, A., Wollesen de Jonge, R., Wu, Y., Zauner-Wieczorek, M., Zust, F., Baltensperger, U., Curtius, J., Flagan, R. C., Hansel, A., Möhler, O., Petäjä, T., Volkamer, R., Kulmala, M., Lehtipalo, K., Rissanen, M., Kirkby, J., El-Haddad, I., Bianchi, F., Sipilä, M., Donahue, N. M., and Worsnop, D. R.: High Gas-Phase Methanesulfonic Acid Production in the OH-Initiated Oxidation of Dimethyl Sulfide at Low Temperatures, Environ. Sci. Technol., 56, 13931–13944, https://doi.org/10.1021/acs.est.2c05154, 2022.
Simon, M., Dada, L., Heinritzi, M., Scholz, W., Stolzenburg, D., Fischer, L., Wagner, A. C., Kürten, A., Rörup, B., He, X.-C., Almeida, J., Baalbaki, R., Baccarini, A., Bauer, P. S., Beck, L., Bergen, A., Bianchi, F., Bräkling, S., Brilke, S., Caudillo, L., Chen, D., Chu, B., Dias, A., Draper, D. C., Duplissy, J., El-Haddad, I., Finkenzeller, H., Frege, C., Gonzalez-Carracedo, L., Gordon, H., Granzin, M., Hakala, J., Hofbauer, V., Hoyle, C. R., Kim, C., Kong, W., Lamkaddam, H., Lee, C. P., Lehtipalo, K., Leiminger, M., Mai, H., Manninen, H. E., Marie, G., Marten, R., Mentler, B., Molteni, U., Nichman, L., Nie, W., Ojdanic, A., Onnela, A., Partoll, E., Petäjä, T., Pfeifer, J., Philippov, M., Quéléver, L. L. J., Ranjithkumar, A., Rissanen, M. P., Schallhart, S., Schobesberger, S., Schuchmann, S., Shen, J., Sipilä, M., Steiner, G., Stozhkov, Y., Tauber, C., Tham, Y. J., Tomé, A. R., Vazquez-Pufleau, M., Vogel, A. L., Wagner, R., Wang, M., Wang, D. S., Wang, Y., Weber, S. K., Wu, Y., Xiao, M., Yan, C., Ye, P., Ye, Q., Zauner-Wieczorek, M., Zhou, X., Baltensperger, U., Dommen, J., Flagan, R. C., Hansel, A., Kulmala, M., Volkamer, R., Winkler, P. M., Worsnop, D. R., Donahue, N. M., Kirkby, J., and Curtius, J.: Molecular understanding of new-particle formation from α-pinene between −50 and +25 °C, Atmos. Chem. Phys., 20, 9183–9207, https://doi.org/10.5194/acp-20-9183-2020, 2020.
Stark, H., Yatavelli, R. L., Thompson, S. L., Kang, H., Krechmer, J. E., Kimmel, J. R., Palm, B. B., Hu, W., Hayes, P. L., and Day, D. A.: Impact of thermal decomposition on thermal desorption instruments: advantage of thermogram analysis for quantifying volatility distributions of organic species, Environ. Sci. Technol., 51, 8491–8500, 2017.
Stolzenburg, D., Fischer, L., Vogel, A. L., Heinritzi, M., Schervish, M., Simon, M., Wagner, A. C., Dada, L., Ahonen, L. R., Amorim, A., Baccarini, A., Bauer, P. S., Baumgartner, B., Bergen, A., Bianchi, F., Breitenlechner, M., Brilke, S., Buenrostro Mazon, S., Chen, D., Dias, A., Draper, D. C., Duplissy, J., El Haddad, I., Finkenzeller, H., Frege, C., Fuchs, C., Garmash, O., Gordon, H., He, X., Helm, J., Hofbauer, V., Hoyle, C. R., Kim, C., Kirkby, J., Kontkanen, J., Kürten, A., Lampilahti, J., Lawler, M., Lehtipalo, K., Leiminger, M., Mai, H., Mathot, S., Mentler, B., Molteni, U., Nie, W., Nieminen, T., Nowak, J. B., Ojdanic, A., Onnela, A., Passananti, M., Petäjä, T., Quéléver, L. L. J., Rissanen, M. P., Sarnela, N., Schallhart, S., Tauber, C., Tomé, A., Wagner, R., Wang, M., Weitz, L., Wimmer, D., Xiao, M., Yan, C., Ye, P., Zha, Q., Baltensperger, U., Curtius, J., Dommen, J., Flagan, R. C., Kulmala, M., Smith, J. N., Worsnop, D. R., Hansel, A., Donahue, N. M., and Winkler, P. M.: Rapid growth of organic aerosol nanoparticles over a wide tropospheric temperature range, P. Natl. Acad. Sci. USA, 115, 9122–9127, https://doi.org/10.1073/pnas.1807604115, 2018.
Subramanian, R., Khlystov, A. Y., Cabada, J. C., and Robinson, A. L.: Positive and Negative Artifacts in Particulate Organic Carbon Measurements with Denuded and Undenuded Sampler Configurations Special Issue of Aerosol Science and Technology on Findings from the Fine Particulate Matter Supersites Program, Aerosol Sci. Technol., 38, 27–48, https://doi.org/10.1080/02786820390229354, 2004.
Surdu, M., Pospisilova, V., Xiao, M., Wang, M., Mentler, B., Simon, M., Stolzenburg, D., Hoyle, C. R., Bell, D. M., Lee, C. P., Lamkaddam, H., Lopez-Hilfiker, F., Ahonen, L. R., Amorim, A., Baccarini, A., Chen, D., Dada, L., Duplissy, J., Finkenzeller, H., He, X.-C., Hofbauer, V., Kim, C., Kürten, A., Kvashnin, A., Lehtipalo, K., Makhmutov, V., Molteni, U., Nie, W., Onnela, A., Petäjä, T., Quéléver, L. L. J., Tauber, C., Tomé, A., Wagner, R., Yan, C., Prevot, A. S. H., Dommen, J., Donahue, N. M., Hansel, A., Curtius, J., Winkler, P. M., Kulmala, M., Volkamer, R., Flagan, R. C., Kirkby, J., Worsnop, D. R., Slowik, J. G., Wang, D. S., Baltensperger, U., and Haddad, I. E.: Molecular characterization of ultrafine particles using extractive electrospray time-of-flight mass spectrometry, Environ. Sci.-Atmos., 1, 434–448, https://doi.org/10.1039/D1EA00050K, 2021.
Turpin, B. J., Huntzicker, J. J., and Hering, S. V.: Investigation of organic aerosol sampling artifacts in the Los Angeles basin, Atmos. Chem. Phys., 28, 3061–3071, https://doi.org/10.1016/1352-2310(94)00133-6, 1994.
Ungeheuer, F., van Pinxteren, D., and Vogel, A. L.: Identification and source attribution of organic compounds in ultrafine particles near Frankfurt International Airport, Atmos. Chem. Phys., 21, 3763–3775, https://doi.org/10.5194/acp-21-3763-2021, 2021.
Voisin, D., Smith, J. N., Sakurai, H., McMurry, P. H., and Eisele, F. L.: Thermal Desorption Chemical Ionization Mass Spectrometer for Ultrafine Particle Chemical Composition, Aerosol Sci. Technol., 37, 471–475, https://doi.org/10.1080/02786820300959, 2003.
Wagner, A. C., Bergen, A., Brilke, S., Fuchs, C., Ernst, M., Hoker, J., Heinritzi, M., Simon, M., Bühner, B., Curtius, J., and Kürten, A.: Size-resolved online chemical analysis of nanoaerosol particles: a thermal desorption differential mobility analyzer coupled to a chemical ionization time-of-flight mass spectrometer, Atmos. Meas. Tech., 11, 5489–5506, https://doi.org/10.5194/amt-11-5489-2018, 2018.
Wang, D. S. and Hildebrandt Ruiz, L.: Chlorine-initiated oxidation of n-alkanes under high-NOx conditions: insights into secondary organic aerosol composition and volatility using a FIGAERO–CIMS, Atmos. Chem. Phys., 18, 15535–15553, https://doi.org/10.5194/acp-18-15535-2018, 2018.
Wang, M., Chen, D., Xiao, M., Ye, Q., Stolzenburg, D., Hofbauer, V., Ye, P., Vogel, A. L., Mauldin, R. L., Amorim, A., Baccarini, A., Baumgartner, B., Brilke, S., Dada, L., Dias, A., Duplissy, J., Finkenzeller, H., Garmash, O., He, X.-C., Hoyle, C. R., Kim, C., Kvashnin, A., Lehtipalo, K., Fischer, L., Molteni, U., Petäjä, T., Pospisilova, V., Quéléver, L. L. J., Rissanen, M., Simon, M., Tauber, C., Tomé, A., Wagner, A. C., Weitz, L., Volkamer, R., Winkler, P. M., Kirkby, J., Worsnop, D. R., Kulmala, M., Baltensperger, U., Dommen, J., El-Haddad, I., and Donahue, N. M.: Photo-oxidation of Aromatic Hydrocarbons Produces Low-Volatility Organic Compounds, Environ. Sci. Technol., 54, 7911–7921, https://doi.org/10.1021/acs.est.0c02100, 2020.
Wang, S., Zordan, C. A., and Johnston, M. V.: Chemical Characterization of Individual, Airborne Sub-10-nm Particles and Molecules, Anal. Chem., 78, 1750–1754, https://doi.org/10.1021/ac052243l, 2006.
Yang, L. H., Takeuchi, M., Chen, Y., and Ng, N. L.: Characterization of thermal decomposition of oxygenated organic compounds in FIGAERO-CIMS, Aerosol Sci. Technol., 55, 1321–1342, https://doi.org/10.1080/02786826.2021.1945529, 2021.
Ye, Q., Wang, M., Hofbauer, V., Stolzenburg, D., Chen, D., Schervish, M., Vogel, A. L., Mauldin, R. L., Baalbaki, R., Brilke, S., Dada, L., Dias, A., Duplissy, J., El Haddad, I., Finkenzeller, H., Fischer, L., He, X., Kim, C., Kürten, A., Lamkaddam, H., Lee, C. P., Lehtipalo, K., Leiminger, M., Manninen, H. E., Marten, R., Mentler, B., Partoll, E., Petäjä, T., Rissanen, M. P., Schobesberger, S., Schuchmann, S., Simon, M., Tham, Y. J., Vazquez-Pufleau, M., Wagner, A. C., Wang, Y., Wu, Y., Xiao, M., Baltensperger, U., Curtius, J., Flagan, R., Kirkby, j., Kulmala, M., Volkamer, R., Winkler, P. M., Worsnop, D. R., and Donahue, N. M.: Molecular Composition and Volatility of Nucleated Particles from α-Pinene Oxidation between −50 ∘C and +25 ∘ C, Environ. Sci. Technol., 53, 12357–12365, https://doi.org/10.1021/acs.est.9b03265, 2019.