the Creative Commons Attribution 4.0 License.
the Creative Commons Attribution 4.0 License.
 | 12 Jun 2023
Ambient carbonaceous aerosol levels in Cyprus and the role of pollution transport from the Middle East
Aliki Christodoulou
Iasonas Stavroulas
Mihalis Vrekoussis
Maximillien Desservettaz
Michael Pikridas
Elie Bimenyimana
Jonilda Kushta
Matic Ivančič
Martin Rigler
Philippe Goloub
Konstantina Oikonomou
Roland Sarda-Estève
Chrysanthos Savvides
Charbel Afif
Nikos Mihalopoulos
Stéphane Sauvage
Jean Sciare
The geographical origin and source apportionment of submicron carbonaceous aerosols (organic aerosols, OAs, and black carbon, BC) have been investigated here for the first time, deploying high time-resolution measurements at an urban background site of Nicosia, the capital city of Cyprus, in the eastern Mediterranean. This study covers a half-year period, encompassing both the cold and warm periods with continuous observations of the physical and chemical properties of PM1 performed with an Aerosol Chemical Speciation Monitor (ACSM), an aethalometer, accompanied by a suite of various ancillary offline and online measurements. Carbonaceous aerosols were dominant during both seasons (cold and warm periods), with a contribution of 57 % and 48 % to PM1, respectively, and exhibited recurrent intense nighttime peaks (> 20–30 µg m−3) during the cold period, associated with local domestic heating. The findings of this study show that high concentrations of sulfate (close to 3 µg m−3) were continuously recorded, standing among the highest ever reported for Europe and originating from the Middle East region.
Source apportionment of the OA and BC fractions was performed using the positive matrix factorization (PMF) approach and the combination of two models (aethalometer model and multilinear regression), respectively. Our study revealed elevated hydrocarbon-like organic aerosol (HOA) concentrations in Nicosia (among the highest reported for a European urban background site), originating from a mixture of local and regional fossil fuel combustion sources. Although air masses from the Middle East had a low occurrence and were observed mostly during the cold period, they were shown to strongly affect the mean concentrations levels of BC and OA in Nicosia during both seasons. Overall, the present study brings to our attention the need to further characterize primary and secondary carbonaceous aerosols in the Middle East, an undersampled region characterized by continuously increasing fossil fuel (oil and gas) emissions and extreme environmental conditions, which can contribute to photochemical ageing.
- Article
(5686 KB) - Full-text XML
-
Supplement
(5826 KB) - BibTeX
- EndNote


At the crossroads of three continents (Europe, Africa, Asia), the eastern Mediterranean and Middle East (EMME) region faces many challenges, such as rapid population growth – with its current 400 million inhabitants – as well as political and socio-economic instabilities. Environmental conditions in the region are exceptional, with the two largest deserts worldwide (Sahara and Arabian) being among the most water-scarce ecosystems on the planet (Terink et al., 2013). Climate change in this region is extraordinarily rapid; summer temperatures, in particular, are increasing by more than twice the global mean rate (Lelieveld et al., 2014), with significant impacts, especially in urban areas (Mouzourides et al., 2015). While aerosol mass loadings over the EMME are dominated by desert dust, concentrations of fine particles due to anthropogenic emissions are also high (Basart et al., 2009) and will likely increase with continued population growth (Pozzer et al., 2012), making anthropogenic pollution in the area a leading health risk and an important climate forcer (Osipov et al., 2022).
Based on modelling studies, it has also been concluded that the EMME is characterized by highly favourable conditions for photochemical smog and ozone (O3) formation, leading to air quality standards being drastically exceeded (Lelieveld et al., 2014; Zanis et al., 2014). These enhanced concentrations of fine particulates and ozone have major human health implications, contributing to premature mortality (Giannadaki et al., 2014; Lelieveld et al., 2015b), which may be further exacerbated by the effects of heatwaves occurring during summer within the EMME region (Zittis et al., 2022).
Although data from satellite observations of NO2 and SO2 have revealed strong air pollution trends in the Middle East since 2010 (Lelieveld et al., 2015a), many pollution sources are still missing in emission inventories (Mclinden et al., 2016). Thus, there is a current lack of a regional approach to characterize air pollution, with in situ observation being insufficient, unavailable, or of low quality (Kadygrov et al., 2015; Ricaud et al., 2018; Paris et al., 2021), limiting the possibility to reduce uncertainties in regional emission inventories and implement efficient abatement strategies.
Significant efforts have been put forward in recent years to characterize the atmospheric composition in situ over Cyprus, a central location of the EMME region (e.g. Kleanthous et al., 2014; Debevec et al., 2017, 2018; Pikridas et al., 2018; Baalbaki et al., 2021; Vrekoussis et al., 2022). In situ ground-based PM observations have clearly shown that contributions of dust to PM10 over Cyprus are among the highest for the entire Mediterranean basin (Querol et al., 2009; Pey et al., 2013; Kleanthous et al., 2014; Pikridas et al., 2018; Achilleos et al., 2020) during dust-storm events, leading to increased hospitalization, particularly attributed to cardiovascular-related diseases (Middleton et al., 2008; Tsangari et al., 2016) and short-term effects associated with daily mortality (Neophytou et al., 2013). These high levels of regional particulate matter are responsible for exceedances in PM10 EU limits in major Cypriot cities (Querol et al., 2009). Past studies on PM trends and sources highlighted the important contribution of local (urban) emissions to PM10 (Achilleos et al., 2014; Pikridas et al., 2018) but also showed a predominant regional pattern for PM2.5 with a major contribution of sulfur-rich sources (Achilleos et al., 2016). Based on 17 years of continuous observations of reactive gases in Cyprus, Vrekoussis et al. (2022) further confirmed the major contribution of long-range transport (incl. the Middle East) in the observed concentration levels of carbon monoxide (CO) and sulfur dioxide (SO2), two tracers of combustion sources.
Those studies have highlighted the unique location of Cyprus as a receptor site of major regional pollution hotspots, making the island one of the most polluted EU member states in terms of PM and O3 concentrations, the only one impacted by long-range transport of poorly regulated air pollutants originating from Middle Eastern countries. However, few studies are currently available to assess the contribution of regional anthropogenic emissions to PM levels in Cyprus. The filter-based chemical speciation study reported by Achilleos et al. (2016) is currently the most exhaustive one and was based on 24 h integrated (PM2.5 and PM10) filter samples collected every 3 d for a period of 1 year (2012) in four cities in Cyprus. This study concluded that Cypriot cities, like many others in Europe, are characterized by a major contribution of regional sulfate and local (urban) emissions from traffic and domestic heating biomass burning.
Herewith, a detailed description of submicron (< 1 µm, PM1) chemical composition and the further source apportionment of black carbon (BC) and organic aerosol (OA) is presented for the first time in Cyprus. State-of-the-art online instrumentation (e.g. Quadrupole Aerosol Chemical Speciation Monitor (Q-ACSM), aethalometer) was deployed to investigate the temporal variability of aerosol composition at a location representative of the urban background pollution in the capital city of Nicosia. Source apportionment of submicron organic aerosols was performed using the organic fragments of the ACSM and positive matrix factorization (PMF). The consistency of these results was assessed against the chemical analysis of parallel filter samples and online measurements of external tracers. This study was extended to a 6-month duration in order to cover the two main seasons of the semi-arid eastern Mediterranean climate (short, mild, and wet winter vs. long, hot, and dry summer), offering a comprehensive understanding of the daily and monthly variability of local and regional sources of carbonaceous aerosols. Cold and warm periods were compared to highlight the complexity of local (combustion) sources and the importance of regional ones. These results were further processed to apportion black carbon sources in Nicosia, with emphasis on local versus regional contribution.
2.1 Sampling site
Cyprus. Cyprus is the third largest island in the Mediterranean Sea, extending approximately 240 km long, from east to west, and 100 km wide. The closest countries and their distance from the capital city of Nicosia are, respectively, Turkey (110 km), Syria (250 km), Lebanon (250 km), Israel (300 km), Egypt (400 km), Jordan (430 km), and Greece (900 km from the Greek mainland) (Fig. 1a).
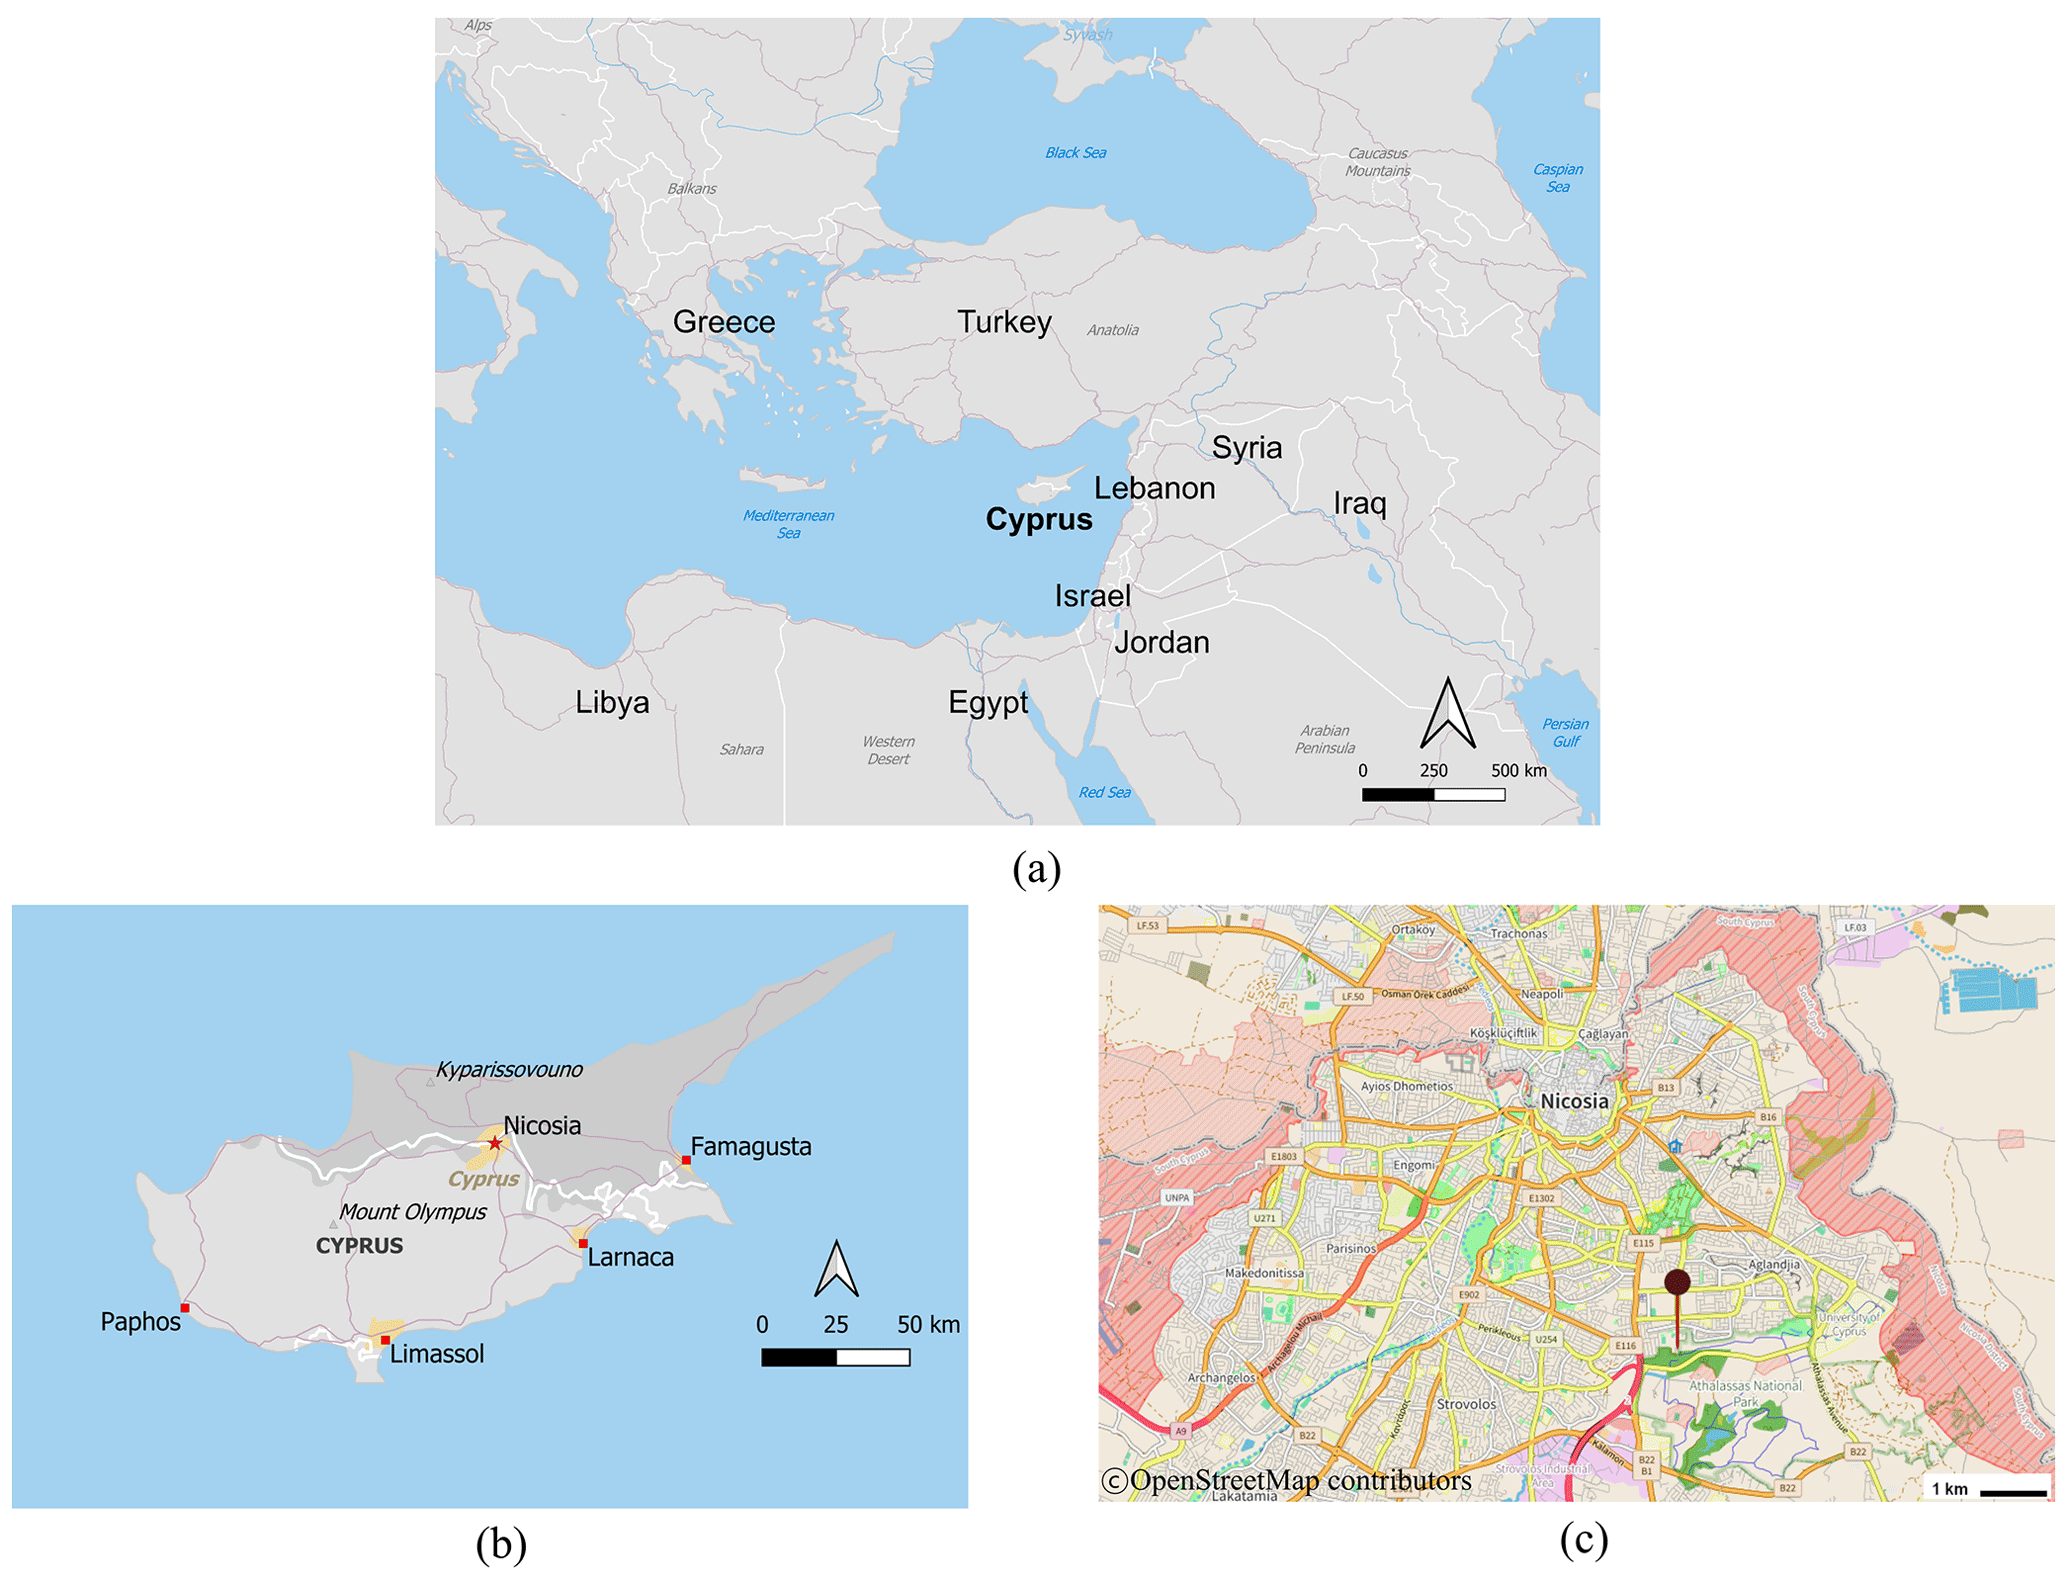
Figure 1(a) Geographic location of the island of Cyprus and its closest northern African and Middle Eastern neighbouring countries. (b) Location of the main cities of the Republic of Cyprus. Maps (a) and (b) were created by QGIS software v.3.26.3 utilizing the Natural Earth data (https://qgis.org, last access: 5 March 2023). (c) Satellite view of the Nicosia agglomeration (grey area). The buffer zone dividing the island and the city is marked with red stripes; the location of the measurement site (CAO-NIC; The Cyprus Institute, Athalassa campus) is noted in red (© OpenStreetMap contributors 2022. Distributed under the Open Data Commons Open Database License (ODbL) v1.0).
The population of Cyprus (approximately 1 million inhabitants) is rather small compared to its neighbouring countries and the rapidly growing (overall 400 million) population of the region (Lelieveld et al., 2013). The main urban areas of the island, shown in Fig. 1b, are those of Nicosia (ca. 245 000 inhabitants), Limassol (ca. 150 000 inhabitants), Larnaca (ca. 50 000 inhabitants), and Paphos (ca. 35 000 inhabitants). Cyprus has a Mediterranean and semi-arid climate with two main seasons: a mild cold season (from December to March) and a hot warm season lasting about 8 months (from April to November). Rain occurs mainly in the cold season, with the warm one being extremely dry (i.e. almost no rain between May and September) (Michaelides et al., 2018).
Nicosia. Nicosia is the largest city on the island and the south-easternmost of the European Union Member States' capitals. Nicosia is currently partitioned into two, with a buffer zone in between under the control of the United Nations, the southern part being the capital of the Republic of Cyprus. The northern part of Nicosia (and the northern part of the island) is not controlled by the government of the republic of Cyprus (Resolution 550, UN Security Council, 1984) (Fig. 1c). Geographically, Nicosia is located in the centre of the island, within the Mesaoria plain, 150 m a.s.l. (above sea level), which is delimited on its northern and southern edges by two mountain ranges: the Kyrenia Range culminating at 1024 m a.s.l., and the Troodos Mountains culminating at 1952 m a.s.l., respectively. This topography channels winds within a more or less west–east corridor (Supplement Fig. S5), feeding the city of Nicosia with long-range transported air masses from Europe, Africa, or the Middle East.
Measurements were performed at the Cyprus Atmospheric Observatory's Nicosia station (CAO-NIC), located at the Cyprus Institute premises (Athalassa Campus; 174 m a.s.l.; 35.14∘ N, 33.38∘ E; Fig. 1c). The measurement site is considered an urban background site, located within a low population density residential area with no significant local pollution hotspots in its vicinity (i.e. no dense road traffic, industry, commercial centres, restaurants, etc.) and next to the Athalassa Forest Park.
The period and duration of measurements presented here (7 December 2018–31 May 2019) were chosen to (i) capture weather conditions, atmospheric dynamics, and long-range patterns of the two main seasons; (ii) investigate the contribution of domestic heating emissions in winter; and (iii) assess the potential increasing contribution of photochemically produced secondary aerosols during the start of the dry and warm season. Local time (LT) in Cyprus is given as Eastern European Time (EET) (UTC+02:00 in winter and UTC+03:00 during the summer).
2.2 Online aerosol instrumentation
Online aerosol instrumentation has been operated following the standard operating procedures defined by the European Research Infrastructure on Aerosols, Clouds, and Trace Gases, ACTRIS (https://www.actris.eu, last access: 5 June 2023), and COST COLOSSAL (Chemical On-Line cOmpoSition and Source Apportionment of fine aerosoL; CA16109, 2021).
Non-refractory submicron (NR-PM1) aerosol chemical composition, i.e. organics, sulfate, nitrate, ammonium, and chloride, was continuously monitored using a Quadrupole ACSM (Aerosol Chemical Speciation Monitor; Aerodyne Research Inc.) at a 30 min time resolution (Ng et al. 2011). The instrument, along with a scanning mobility particle sizer (SMPS, described below), sampled through a sharp cut cyclone operated at 4 L min−1 (SCC 1.197, BGI Inc., USA) and was equipped with a PM1 aerodynamic lens, yielding an aerosol cut-off diameter of approximately 1.3 µm. Data were retrieved using ACSM local v.1.6.0.3, implemented within Igor Pro (v. 6.37, WaveMetrics Inc., USA). The ACSM is designed and built around similar technology to the aerosol mass spectrometer (Jayne et al., 2000), where an aerodynamic particle focusing lens is combined with particle flash vaporization in high vacuum on the surface of a standard tungsten vaporizer heated at 600 ∘C, followed by electron impact ionization, separation, and final detection of the resulting ions using a quadrupole mass spectrometer. Mass concentrations are corrected for incomplete detection due to particle bounce using the chemical composition-dependent collection efficiency (CDCE) (Middlebrook et al., 2012). The determined parameters, response factor (RF), and relative ionization efficiency (RIE) are reported in Table S2 in the Supplement.
Black carbon (BC) measurements were conducted using a 7-wavelength aethalometer (AE-33 Magee Scientific, US) at a 1 min time resolution. The aethalometer sampled ambient aerosol through a PM2.5 aerosol inlet (SCC 1.829, BGI Inc., USA) at a flow rate of 5 L min−1 after passing through a Nafion dryer. The instrument internally corrected the filter loading effect in real time, while a fixed value (C0= 1.39) was applied to compensate for the multi-scattering effect (Drinovec et al., 2015). BC was apportioned to source-specific components, namely BCff related to fossil fuel combustion and BCwb related to wood burning, by applying the “aethalometer model” (Sandradewi et al., 2008) on the 470–950 nm wavelength pair. The instrument's default values for fossil fuel combustion and wood-burning aerosol absorption Ångström exponent, AAEff=1 and AAEwb=2, respectively, were selected after performing a sensitivity analysis on the AAE values (Supplement Sect. S3).
2.3 Ancillary measurements
SMPS. Particle number size distributions were monitored using a scanning mobility particle sizer (SMPS) consisting of an electrostatic classifier (model 3080, TSI Inc., USA) coupled with a condensation particle counter (CPC; model 3070, TSI Inc. USA) operating at a 5 min time resolution and at a 1 L min−1 sample flow rate, measuring particles with a diameter ranging from 9 to 700 nm. Ambient aerosols were drawn through a Nafion dryer and placed upstream, keeping sample relative humidity (RH) below 30 %. Volume concentrations of assumed spherical particles derived by the SMPS were converted into mass concentrations using a variable density calculated by the methodology described in Bougiatioti et al. (2014). The respective mass fractions time series of chemical species were calculated based on the ACSM measurements. A density value of 1.77 g cm−3 was used for ammonium sulfate and 1.35 g cm−3 for organics (Florou et al., 2017; Lee et al., 2010), the two dominant compounds of PM1 in Nicosia as detailed further below.
Filter sampling. Co-located 24 h PM2.5 samples were collected on quartz fibre filters (Tissuquartz, 47 mm diameter, Pall), using a low volume sampler (Leckel SEQ47/50) operating at a flow rate of 2.3 m3 h−1. The filter samples were analysed for (i) organic and elemental carbon (OC and EC) using an OC EC lab instrument (Sunset Laboratory Inc., OR, USA), implementing the EUSAAR II protocol (Cavalli and Putaud, 2008); (ii) carbohydrates, including levoglucosan, mannosan, and galactosan, using an Ion Chromatography Pulsed Amperometric Detection method (Thermo – Model ICS-3000); and (iii) anions (Cl−, NO, SO, MSA, Oxalate) and cations (K+, Na+, NH, Mg2+, Ca2+), using ion chromatography (Thermo – Model ICS-5000).
Proton-transfer reaction – mass spectrometry (PTR-MS). Air was sampled through a 20 m long, o.d. ( i.d.) sheathed Teflon line that ran from the roof of the building to the instrument. A Teflon filter (0.2 µm diameter porosity) was installed at the inlet to prevent large aerosol particles and insects from entering the sampling line. The resulting residence time of air in the line was estimated to be approximately 0.5 min. The temporal resolution of volatile organic compounds (VOCs) measured by the PTR-MS (IONICON Analytik, Austria) was approximately 2 min (the time required to measure 55 different ions at 2 s per ion). The basic operation principles of the PTR-MS instrument have been described in detail by Lindinger et al. (1998). Briefly, a stable flow of air and high concentrations of H3O+ ions are continuously sampled into a drift tube held at 2.2 mbar pressure. There, compounds with a proton affinity greater than water, including a large selection of oxygenated volatile organic compounds (OVOCs), undergo efficient proton-transfer reactions with the H3O+ ions to produce protonated organic product ions, which can be detected by a mass spectrometer.
Meteorological parameters. Standard meteorological parameters (temperature, relative humidity, wind speed, and direction) were obtained from the meteorological station of the Cyprus Department of Meteorology, installed 10 m above ground, located at the Athalassa Forest Park (164 m a.s.l.) lying approximately 1.3 km east of the CAO-NIC station. Wind speed and direction data were further used in this study for component-specific non-parametric wind regression analysis (NWR) performed using the ZeFir toolbox (Petit et al., 2017), developed within the Igor Pro software (WaveMetrics Inc.). A co-located automatic CIMEL CE370 micro-lidar was operated continuously to retrieve the planetary boundary layer height (PBLH) and better assess the influence of atmospheric dynamics on in situ ground-based observations.
Air masses back trajectory analysis. Air mass back trajectories of 5 d arriving at 1000 m altitude above the sampling site were computed every 6 h, using the Hybrid Single-Particle Lagrangian Integrated Trajectory model (HYPLIT4; Stein et al., 2015) using the Global Data Assimilation System (GDAS 1) meteorological data fields (with 1∘ spatial resolution). Back trajectories were coupled to measured concentrations, assessing origins and source contributions to specific chemical components by applying the potential source contribution function (PSCF) technique as implemented in the ZeFir toolbox described above.
2.4 Source apportionment analysis
Positive matrix factorization (PMF) is an advanced multivariate factor analysis tool that attempts to identify the contributing factors, or sources, of atmospheric pollutants at a sampling site. For this study, source apportionment was performed on the organic mass spectra dataset collected by the ACSM. The PMF method (Paatero and Tapper, 1994), using the multilinear engine (ME-2) model developed by Paatero (1999), was implemented using the SoFi (Source Finder) toolkit (SoFi 6D; Canonaco et al., 2013). PMF allows the decomposition of the OA mass spectra matrix X into two matrices, G and F, and a remaining residual matrix, E:
where X is the input dataset matrix (measured quantity), F is the resulting source profile matrix, G is the source contribution matrix (temporal variability of each source), and E represents the model residual matrix. Based on a number of criteria, the optimal solution is selected, aiming at being physically meaningful, which can be supported by external indicators (ancillary measurements), and trying to minimize values in the residual matrix, E. Model input data and error matrices (in µg m−3) were exported using the ACSM software. Data points with a signal-to-noise (S N) ratio smaller than 0.2 were removed. Points with S N between 0.2 and 2 were down weighted by increasing their estimated error values (Ulbrich et al., 2009; Paatero and Hopke, 2003). (mass-to-charge ratio) values ranging from 10 to 120 were used in the analysis. CO2-related variables were excluded from the PMF and finally reinserted into the solution.
Source apportionment of OA was performed following the general steps described by Crippa et al. (2014) and the recently updated harmonized standard operating procedures for seasonal OA PMF (Chen et al., 2022). As a first step, unconstrained PMF analyses were performed with a number of factors ranging from 2 to 8 in order to identify the most relevant number of factors and potential sources. If primary organic aerosol factor profiles such as hydrocarbon-like OA (HOA) or biomass-burning-like OA (BBOA) were found, then the corresponding site-specific primary OA (POA) mass spectra (see discussion below) or spectra found in the literature (e.g. Ng et al., 2011; Crippa et al., 2014) were set as constrains in the PMF, using the “a value” approach (Paatero and Hopke, 2009; Canonaco et al., 2013). A sensitivity analysis was then performed with different a values to assess the level of constrain introduced in each factor with (i) a constrained HOA using, as an anchor, the HOA spectrum found in Ng et al. (2011), with the a values ranging between 0.05 and 2.0; (ii) a constrained BBOA factor with the a values from 0.2 to 0.5 from Ng et al. (2011); and (iii) a constrained cooking OA (COA) factor from Crippa et al. (2014), with a values from 0.2 to 0.5. Once this sensitivity analysis was completed, the evaluation of the PMF results showed that the BBOA factor could not account for the entire 60 mass fragment, the fragment which was distributed within 2 factors. Additionally, the correlation of BBOA with BCwb was shown to be unsatisfactory (Sect. S1). On the other hand, given the BBOA factor's sensitivity to the type of solid fuel used, different biomass-burning factor profiles have been reported in various regions around the world (Xu et al., 2020; Trubetskaya et al., 2021). Consequently, a site-specific BBOA factor profile (BBOAcy) was selected. The BBOAcy spectrum was calculated as an average of 20 PMF runs from the initial unconstrained PMF for the cold period, validated by its time series correlation to BCwb. Since aged OA (i.e. oxygen-like OA, OOA) factors show more variability between measurement sites in terms of their mass spectra, no constraint was introduced for these factors (Canonaco et al., 2015).
In this study, the BBOA factor – a major contributor of OA during winter – could not be properly resolved when performing the PMF analysis on the entire period dataset. A seasonal approach was followed instead, separating the OA dataset into two periods that were then used to describe both the two periods (cold and warm, respectively). The criteria used to delineate those two periods are presented and discussed in Sect. 3.2.
One factor was consequentially constrained with the resulting BBOAcy spectrum (with an a value in the 0–0.5 range, using steps of 0.02), obtaining the optimal solution using an a value equal to 0.46. A widely referred to standard mass spectrum (Sun et al., 2016; Duan et al., 2020) derived from Ng et al. (2011) was used to constrain the HOA factor, with an a value of 0.2, thus obtaining the best correlation with BCff, a tracer for traffic-related emissions. A detailed description of the OA source apportionment analysis can be found in Sect. S1.
3.1 Online aerosol data quality check
A chemical mass closure exercise for PM1 was performed at a temporal resolution of 1 h to check the quality of the online aerosol measurements. Chemically reconstructed PM1 was calculated as the sum of the mass concentration of all non-refractory species measured by the ACSM (OA, NO, SO, NH, Cl−) plus the BC concentrations measured by the Aethalometer AE-33 (Putaud et al., 2004). The contribution of other chemical constituents to submicron aerosols, such as sea salt and dust (measured by co-located filter sampling), was found to be low and therefore neglected here. A scatter plot of the ACSM + AE-33 measurements vs. the SMPS-derived PM1 concentrations is shown in Fig. S4a. The results indicate a very good correlation (R2=0.88, N=1823) and a slope of 1.2 (Fig. S4a). This 20 % discrepancy lies within the uncertainty of the online instruments. It could be attributed to the cut-off size of the SMPS at 700 nm, which is slightly lower compared to the ACSM. In addition, ACSM individual chemical species were compared with co-located offline analyses performed on daily PM2.5 filters. As shown in Fig. S4b–e, very good agreement was obtained between online and offline measurements, with R2 ≥ 0.80 (N= 165–175) for all species. The discrepancy between ACSM and filter measurements for nitrate (slope of 1.3) could be attributed to the volatilization of HNO3 from the filter surface due to the presence of semi-volatile ammonium nitrate. The obtained slopes for ammonium and sulfate below 1:1 (0.81 and 0.85, respectively) are consistent with the fact that fine (NH4)2SO4 aerosols, mainly originating from secondary processes and long-range transport (Sciare et al., 2010; Freutel et al., 2013), can be found at a large size mode possibly exceeding 1 µm, consequently not being sampled by the ACSM.
The study investigated the aerosol ion balance using both online and offline inorganic measurements. The ratio of the measured concentration of NH and the estimated concentration of NH, as calculated in Jiang et al. (2019), was used for this purpose. The results showed a slope of 0.80 for online measurements and 0.96 for offline measurements. These findings, suggest that the atmospheric aerosol observed during the study period was predominantly neutral, taking into account the uncertainties of ammonium concentrations reported in Q-ACSM intercomparison studies (Crenn et al., 2015), as well as the species' relatively high detection limit (Ng et al., 2011).
An interesting result obtained from the comparison of OA (ACSM) with OC (from filters) is an OM-to-OC (organic matter to organic carbon) ratio of 1.42 which is at the lower end of ratios reported for urban environments, which usually exhibit typical values of 1.6±0.2 (Petit et al., 2015; Theodosi et al., 2011; Brown et al., 2013). Without neglecting the fact that two different size fractions were compared (PM1 for the ACSM and PM2.5 for the filter sampling), this low ratio probably points to long-chain hydrocarbon OAs that often are related to primary combustion (poorly oxidized) OAs (Aiken et al., 2008). As such, this ratio could represent an independent means of verification of the consistency of our source apportionment between primary and secondary OA (SOA).
Finally, black carbon concentrations derived from light absorption measurements (Aethalometer AE-33) were compared against filter-based EC measurements (see Fig. S4f). Data from the two techniques correlate very well (R2= 0.83), with a BC EC ratio of 1.67 being similar to studies in other urban areas (Rigler et al., 2020; Liu et al., 2022), highlighting the existence of a BC absorption enhancement (Eabs) attributable to a lensing effect induced by other chemical species, among which secondary OAs may play an important role (Zhang et al., 2018).
3.2 Meteorological conditions
Delineation of cold vs. warm seasons. The ACSM organic mass at 60 is characteristic of the fragmentation of levoglucosan, a product of cellulose pyrolysis and well-established biomass-burning marker (Alfarra et al., 2007). Its respective contribution to total OA (f60) was used in this study as an indicator of biomass burning for domestic heating to delineate cold vs. warm seasons, comparing with the 0.3 % threshold proposed by Cubison et al. (2011) for air masses influenced by biomass burning. Except for a single small peak in early May, corresponding to open fires for the celebration of the Greek Orthodox Easter, the last instance when f60 was above the threshold was recorded during the first week of April (Fig. 2). From then onwards, daily air temperature started rising constantly, from about 15 ∘C at the beginning of April up to 30 ∘C at the end of May. These two features dictated the division of the dataset into two periods: a cold period of 4 months (7 December 2018–8 April 2019), with an average temperature of 12±4 ∘C, and a warm period of 2 months (9 April–31 May 2019), with an average temperature of 20±7 ∘C.
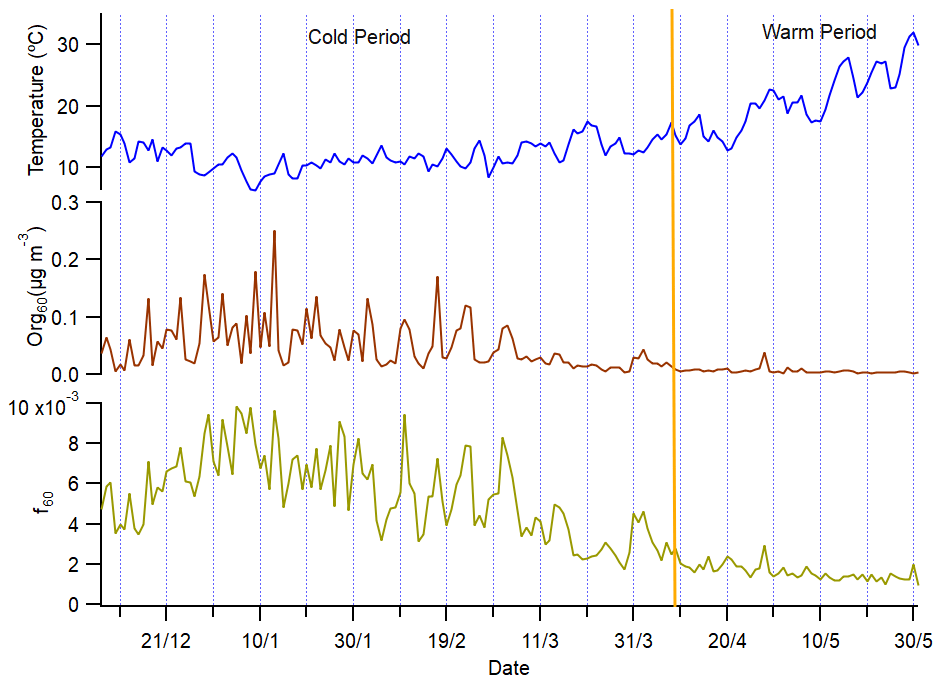
Figure 2Time series of air temperature (blue), 60 organic concentration (org60, brown), and f60 fragment (green) for the cold and warm periods. The vertical line is used to delineate the measurements within the two seasons.
Wind sectors. During these two periods, a distinct pattern in the wind sectors and the air masses arriving at the sampling site was observed. As seen in Fig. S5, the dominant wind direction for the cold period was the NW–SW [225–315∘] sector, encompassing 48 % of the total wind directions, while the NE–SE [45–135∘] sector covered 26 %. During the warm period, the weight of this proportion is shifting even more towards the NW–SW [225–315 ∘] sector, having a 62 % of total air masses while only 17 % are arriving from the NE–SE [45–135∘] sector.
Air mass origin. A cluster analysis was performed (Fig. S6a, b) for both periods in order to better assess the main upwind regions responsible for long-range transported air pollution over Cyprus and their change relative to the period of the year. The number of clusters used in each season was determined by considering the percentage change in total spatial variance (TSV) as a function of the number of clusters of merged trajectories (Fig. S6c, d) and the mean trajectory paths of each cluster (Fig. S6e, f). The first large drops observed in TSV from the two-to-three and the three-to-four cluster transition could not represent all the recorded trajectories and especially the ones describing air masses arriving in Nicosia from the east. The next remarkable decrease in TSV was recorded when moving to seven clusters. Thus, for both periods, seven clusters were chosen to better represent all air masses arriving in Nicosia.
A significant part of most of the calculated mean trajectory path representing clusters arriving in Cyprus was found to be related to the wider western sector, with many of them passing over Turkey before reaching Cyprus. Interestingly, this analysis showed one cluster (Cluster 1) arriving from the Middle East (close to Lebanon and Syria) and another four (Cluster 1, 2, 5, 6) passing over the western part of Turkey for the cold period. For the warm period, the only clusters arriving from the Middle East were the ones related to Turkey (Clusters 1, 5, 6). Plotting all individual 72 h back trajectories (Fig. S6e, f) showed that a clear portion (almost 25 % of the calculated trajectories) are being influenced by the Middle East, especially for the cold period (Fig. S6e).
3.3 Chemical composition of PM1
Seasonal perspective of PM1. The time series of PM1 chemical composition derived from the ACSM (OA, SO, NH, NO, Cl−) and the aethalometer (BCff, BCwb) are depicted for the entire measuring period in Fig. 3. Averaged data (6 h averaging period) are shown here for clarity. Furthermore, the relative average contribution of each chemical constituent to total PM1 concentrations is depicted in the respective inner pie charts for both periods.
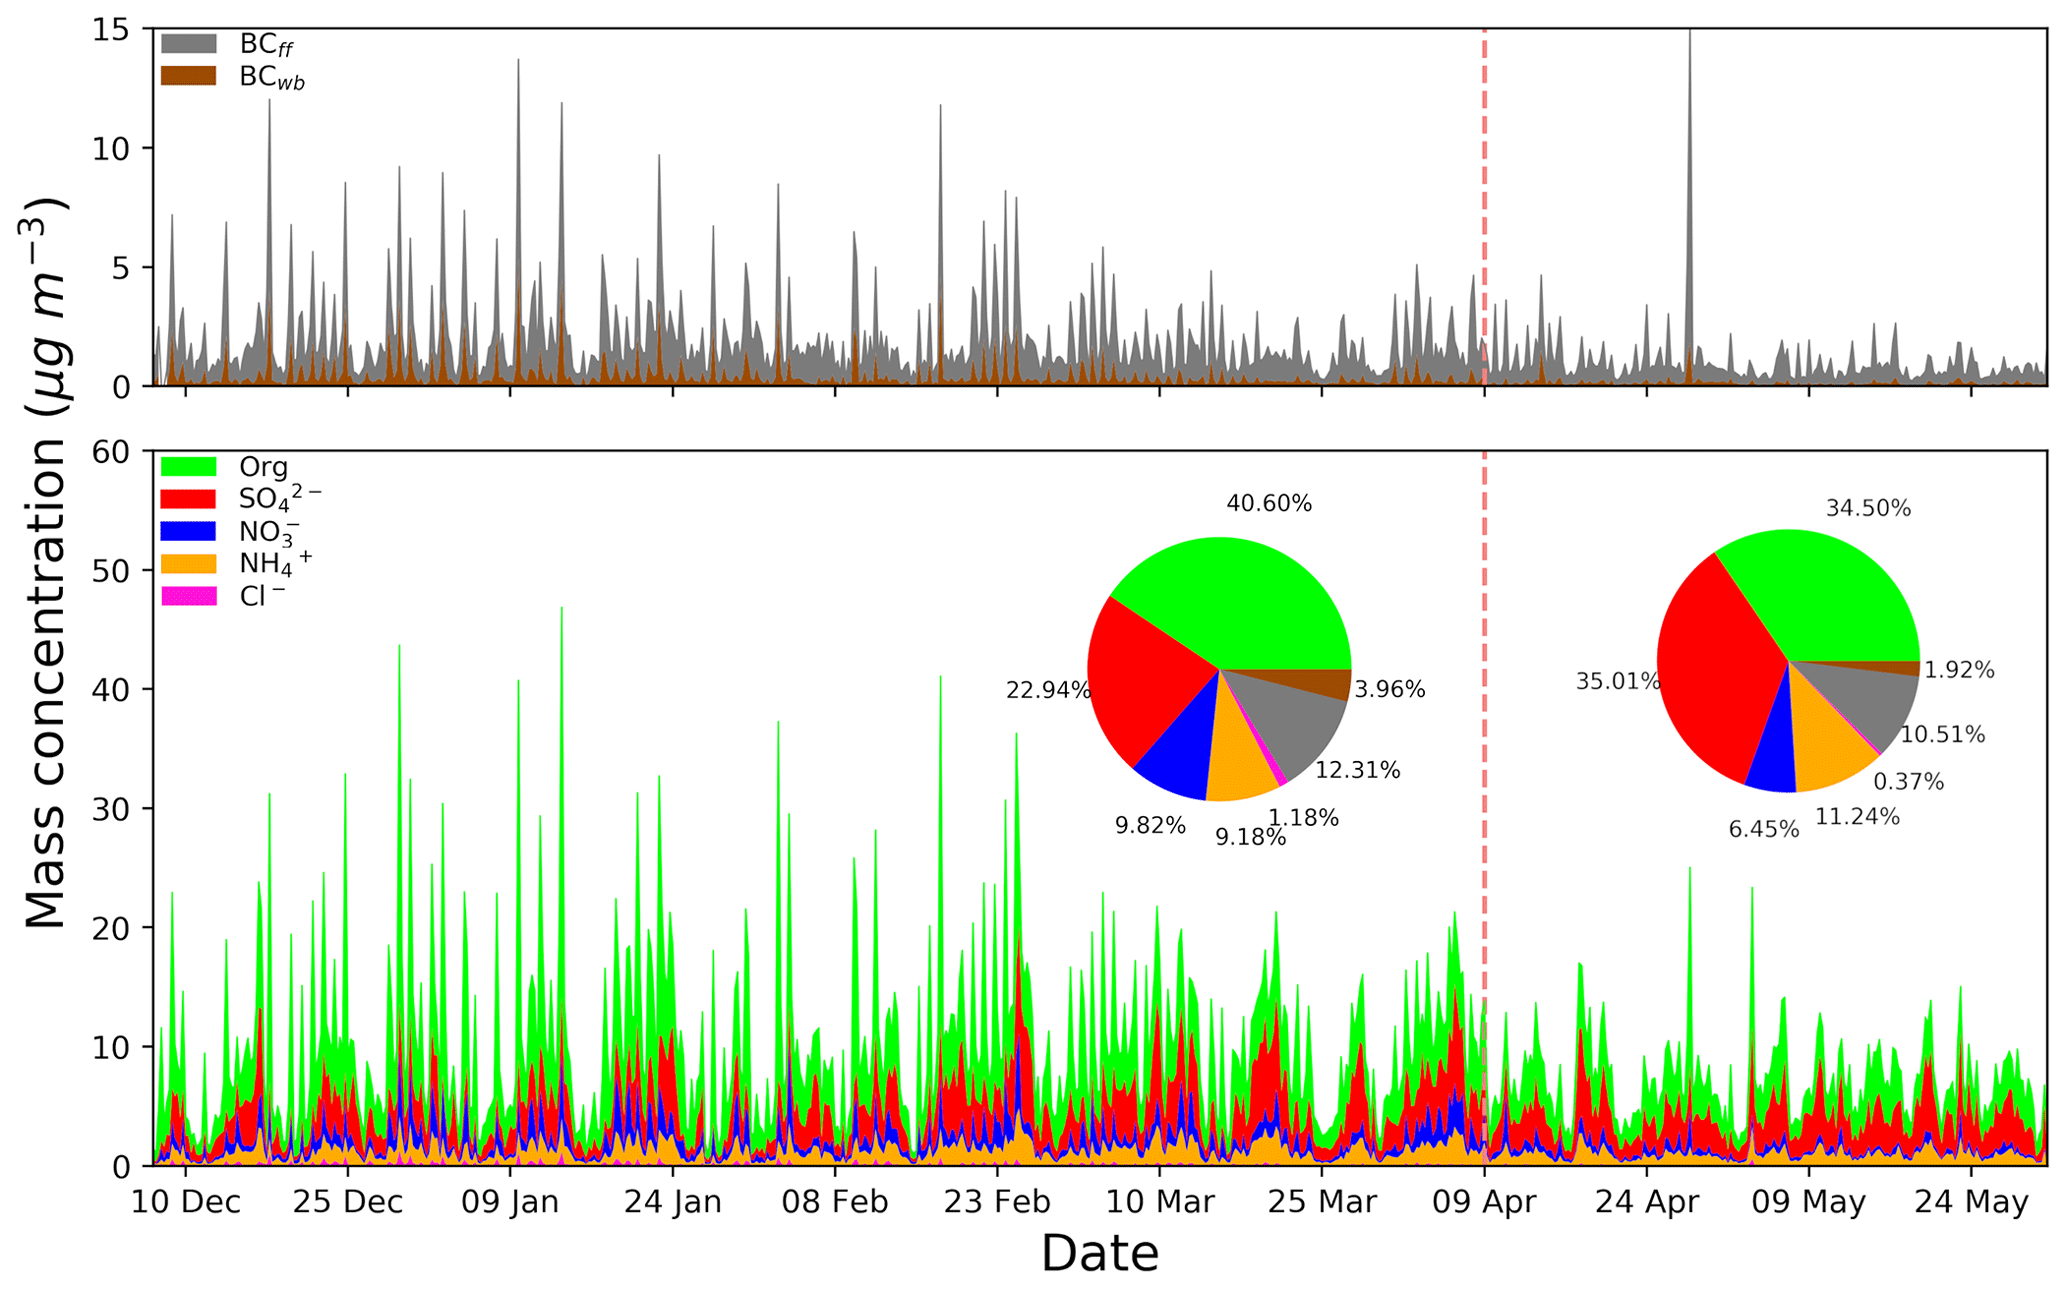
Figure 3Stacked area plots of the chemical composition time series for PM1 in Nicosia derived from 6 h averages of ACSM and AE-33 measurements. The vertical dashed red line separates the cold from the warm season. The average relative contribution of each species is shown in the respective pie charts (inner panels) for each season.
Although intense and short-duration peaks are observed for carbonaceous aerosols (OA, BCff, BCwb), background NR-PM1 concentration levels (between peak values) remain well below 10 µg m−3 for the 6 h average in both seasons. In other words, no PM1 pollution episodes (with, for example, concentrations above 10 µg m−3) lasting for consecutive days were observed. Such lack of intense and persistent PM1 pollution episodes differs from what is reported in central and northern Europe, where stagnant (anticyclonic) conditions occur together with continental (polluted) air masses, mainly in winter and springtime (e.g. Petit et al., 2015). This suggests that the relatively low emissions from Cyprus (compared to the neighbouring countries) and its remote marine location (i.e. far from densely populated areas) may prevent the build-up of high PM1 pollution events over Nicosia. On the other hand, clear differences can be observed between both periods, with significantly higher PM1 concentrations during the cold period, associated with repeated, intense peaks of OA and BC – not observed during the warm season – and suggesting local combustion emissions. The highest PM1 concentrations were observed between 28 December 2018 and 13 January 2019 (Fig. 3) and were associated with low temperatures and Christmas holidays, both likely to promote domestic heating use. During the warm period, the higher contribution of sulfate, and lower contribution of OA, are clearly noticeable. The contribution of nitrate during the warm period, most probably in the form of semi-volatile NH4NO3, remains marginal, possibly due to non-favourable thermodynamic conditions preventing its formation and accumulation.
PM1 chemical composition. For the cold period, the average calculated mass concentration of PM1 (calculated as the sum of chemical components measured by AE-33 and ACSM) was 12.35±9.77 µg m−3, with 10.34±7.92 µg m−3 being the average concentration of the non-refractory species (Table 1). OA constitutes the larger fraction of PM1 mass, with an average concentration of 5.03±5.48 µg m−3 (41 %), followed by sulfate (23 %), black carbon (16 %), nitrate (10 %), ammonium (9 %), and chloride (1 %). These concentrations and the overall distribution of chemical components in NR-PM1 are similar to those measured by ACSM in other European cities (Bressi et al., 2021). Concentrations appear to decline during the warm period, with an average calculated PM1 concentration of 8.18±4.65 µg m−3, including 7.18±3.81 µg m−3 from the non-refractory components. The dominant species during the warm period were sulfate and OA, each representing 35 % of PM1, followed by black carbon (12 %), ammonium (11 %), and nitrate (6 %). During that period, chloride concentrations were negligible, contributing less than 1 % (Table 1).
Table 1Species mean, standard deviation, median concentrations, and respective contribution to PM1 during cold and warm periods in Nicosia.
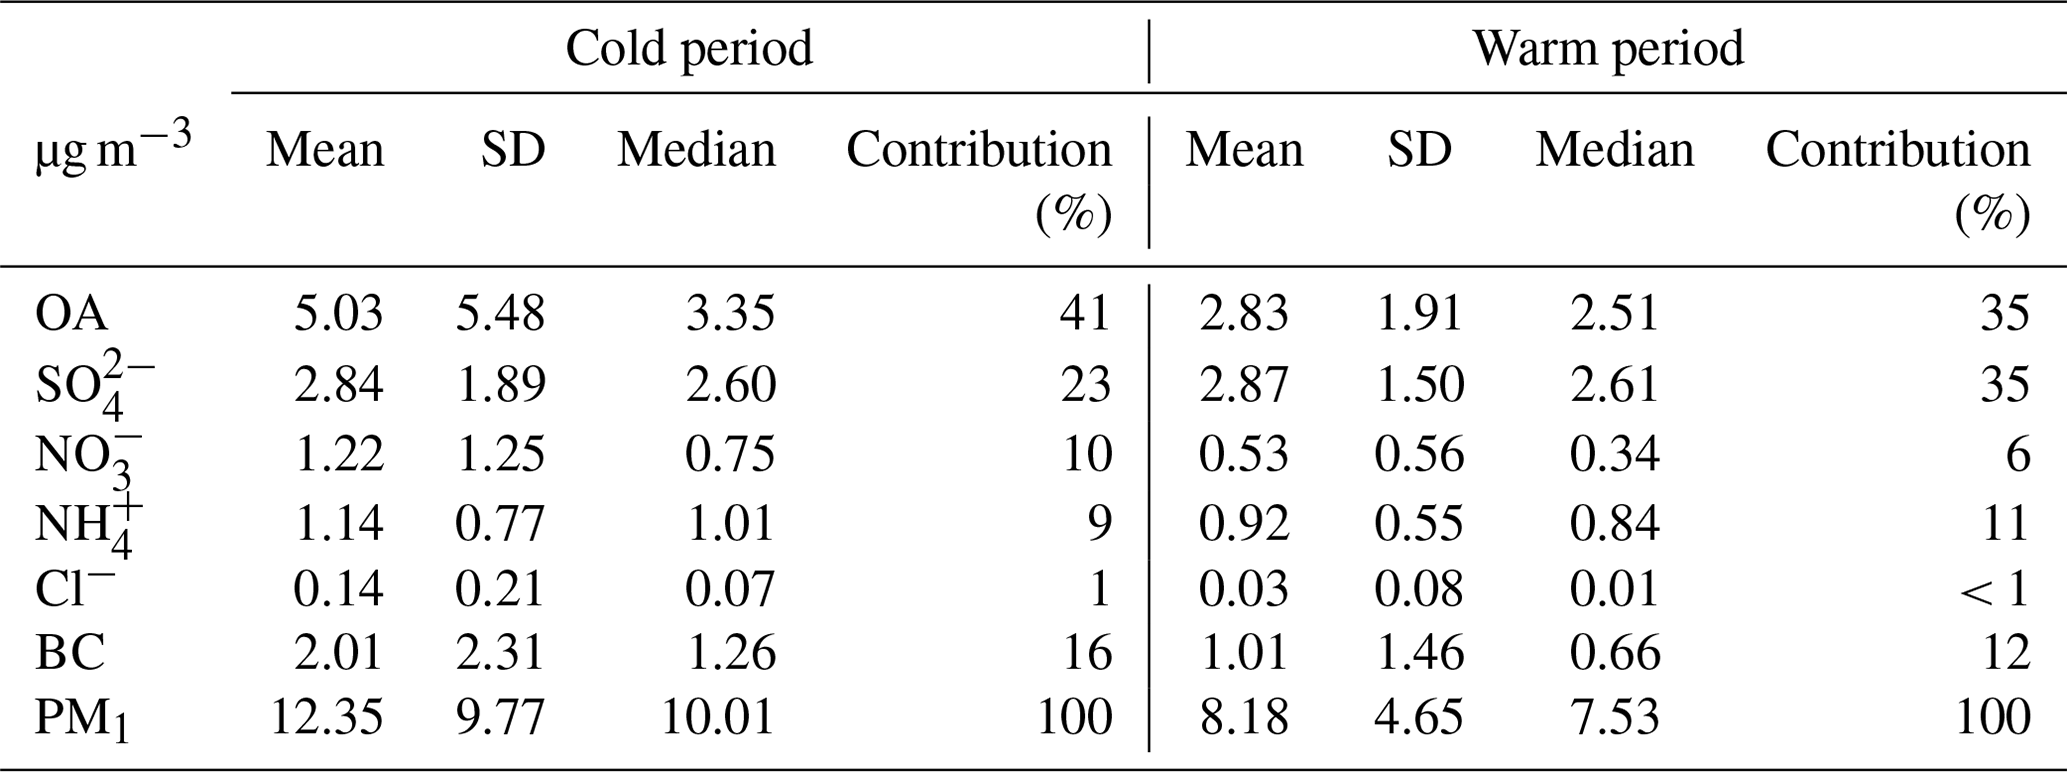
Table 2Comparison of concentration, and percentage contribution to PM1, between the main submicron chemical species derived by ACSM.
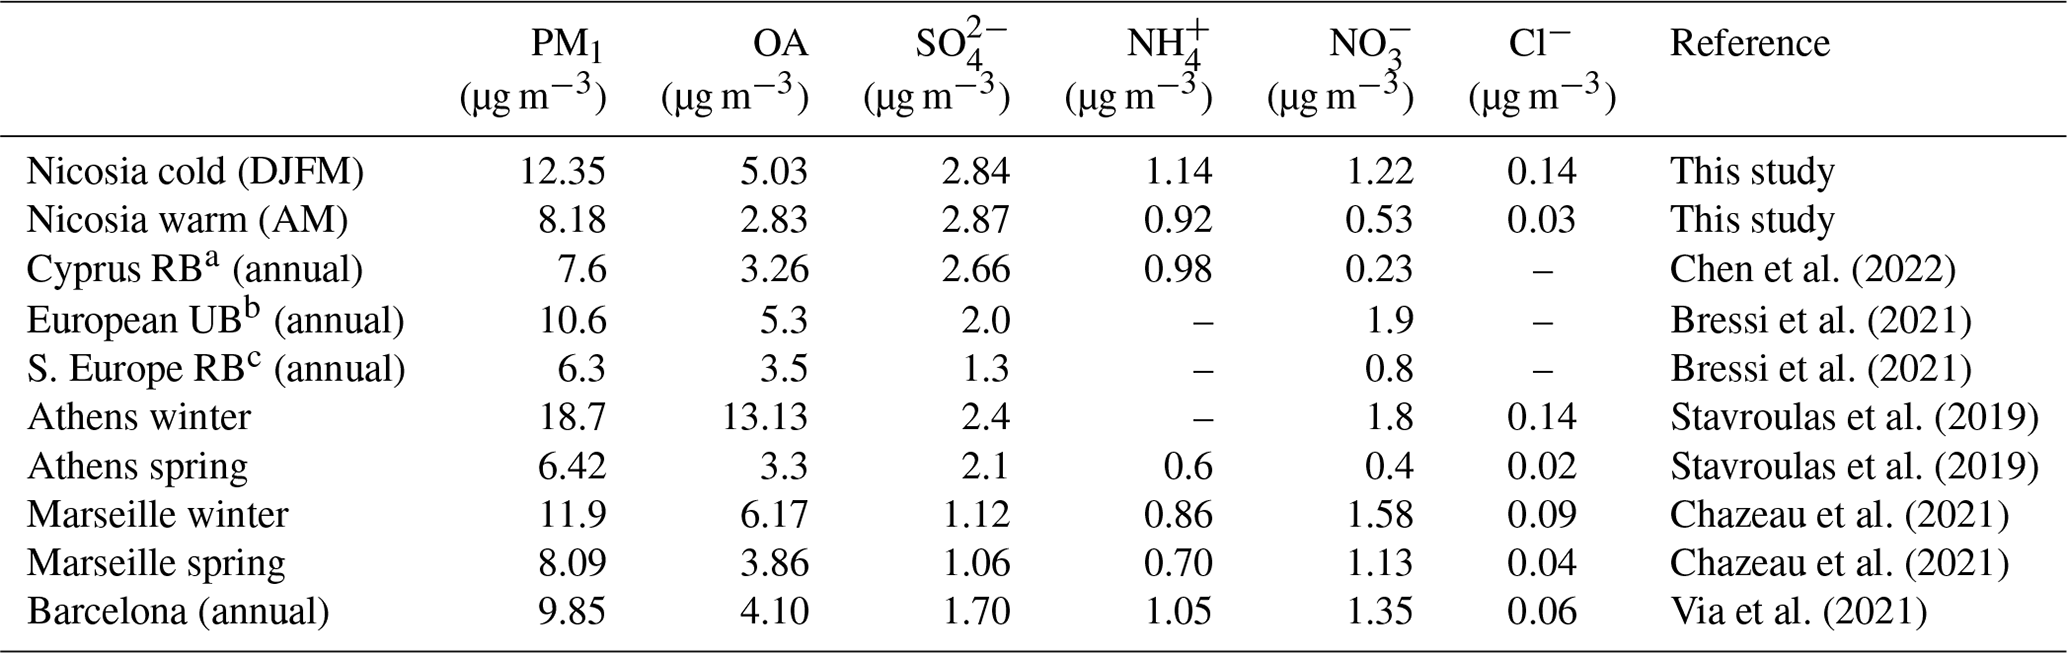
a Cyprus regional background. b European urban background, which is Barcelona (Spain), London (UK), Prague (Czech Republic), Tartu (Estonia), and Zurich (Switzerland). c Southern European regional background, which is Ersa (Corsica, France) and Finokalia (Crete, Greece).
Interestingly, sulfate concentrations recorded in Nicosia are higher compared to what is commonly observed in other European countries and Mediterranean cities (Table 2) and likely reflect a regional pattern of sulfur-rich emissions compared to Europe, where SO2 emissions have strongly decreased during the last decades (Smith et al., 2011; Chin et al., 2014) thanks to the implementation of specific abatement measures on reducing sulfur emissions (EU, 2016) and United Nation Gothenburg (1999) protocol). More specifically, the importance of sulfur emissions in Turkey (2455 Gg; EEA, 2021), which were 50 % higher compared to the total SOx emissions of the EU 28 in 2019, together with the fact that half of the air masses reaching Cyprus are passing over Turkey (see Fig. S6), are key contributors to the high concentrations of sulfate in our study.
Shipping emissions appear to have a relatively minor impact on the concentration of sulfate. To more accurately determine the contribution of shipping emissions to SO, SO2, and total PM2.5, a supplementary analysis was conducted using the WRF-Chem (Weather Research and Forecasting model coupled to Chemistry) model, which simulates both physical and chemical processes occurring in the atmosphere. This model has been extensively evaluated in several studies for the eastern Mediterranean (Kushta et al., 2018) and Europe (Berger et al., 2016; Tuccella et al., 2012). Following the set-up used in Giannakis et al. (2019) and driven by the EDGAR v.5 anthropogenic emission inventories (Crippa et al., 2018), two year-long simulations were performed – firstly including all sectoral emissions in the model (baseline simulation S0) and a second simulation where shipping emissions have been omitted (scenario simulation, S1) – to identify the impact of shipping on gaseous and aerosol sulfur-related species concentrations (SO2 and SO and total PM2.5 over the central and eastern Mediterranean. Figure S7a–f describe the contribution of shipping in absolute terms (Fig. S7a, c, e) and as a percentage (Fig. S7b, d, f) for the SO, SO2, and total PM2.5 calculated for each species.
According to these results, the highest impact of shipping on near-ground modelled concentrations of the three species (SO, SO2, and PM2.5) was estimated along the central Mediterranean region (yellow grids, west of the Balkans and Greece), as well as a small section south of Greece. The Levantine basin, where Cyprus is located, experiences significantly lower influence under the no-shipping emissions sensitivity test. More specifically, over the east Mediterranean, SO concentrations represent a relative change of only about 6 %–8 % when including shipping emissions.
The main difference between the cold and warm periods lies in the decrease in the concentration of carbonaceous aerosols (OA, BC) and NO by almost a factor of two. Several phenomena can explain this significant seasonal variation: the absence of a domestic heating source (mainly biomass burning as explained in Fig. 2); the absence of Middle East air masses during the warm period (see discussion later on); the increase in the planetary boundary layer height (PBLH) above Nicosia (Fig. S8), enhancing vertical dilution of local emissions during the warm period and therefore lowering ground-based concentrations; and less favourable thermodynamic conditions, with warmer and dryer air, also preventing the condensation of semi-volatile species (e.g. ammonium nitrate). Sulfate concentrations do not exhibit a similar seasonal pattern and therefore seem to be less affected by the above factors. On the contrary, the increase in photochemistry enhances the formation of sulfate aerosols, and the decrease in precipitation enhances aerosol lifetime, strengthening the impact of long-range transport.
3.4 Diurnal variability of PM1 chemical constituents
Figure 4 shows the diurnal variability of the PM1 species derived from the ACSM and AE-33 for both the cold (Fig. 4a) and warm (Fig. 4b) periods. The diurnal variability of the apportioned BC related to fossil fuel combustion (BCff) and wood burning (BCwb) is also depicted here.
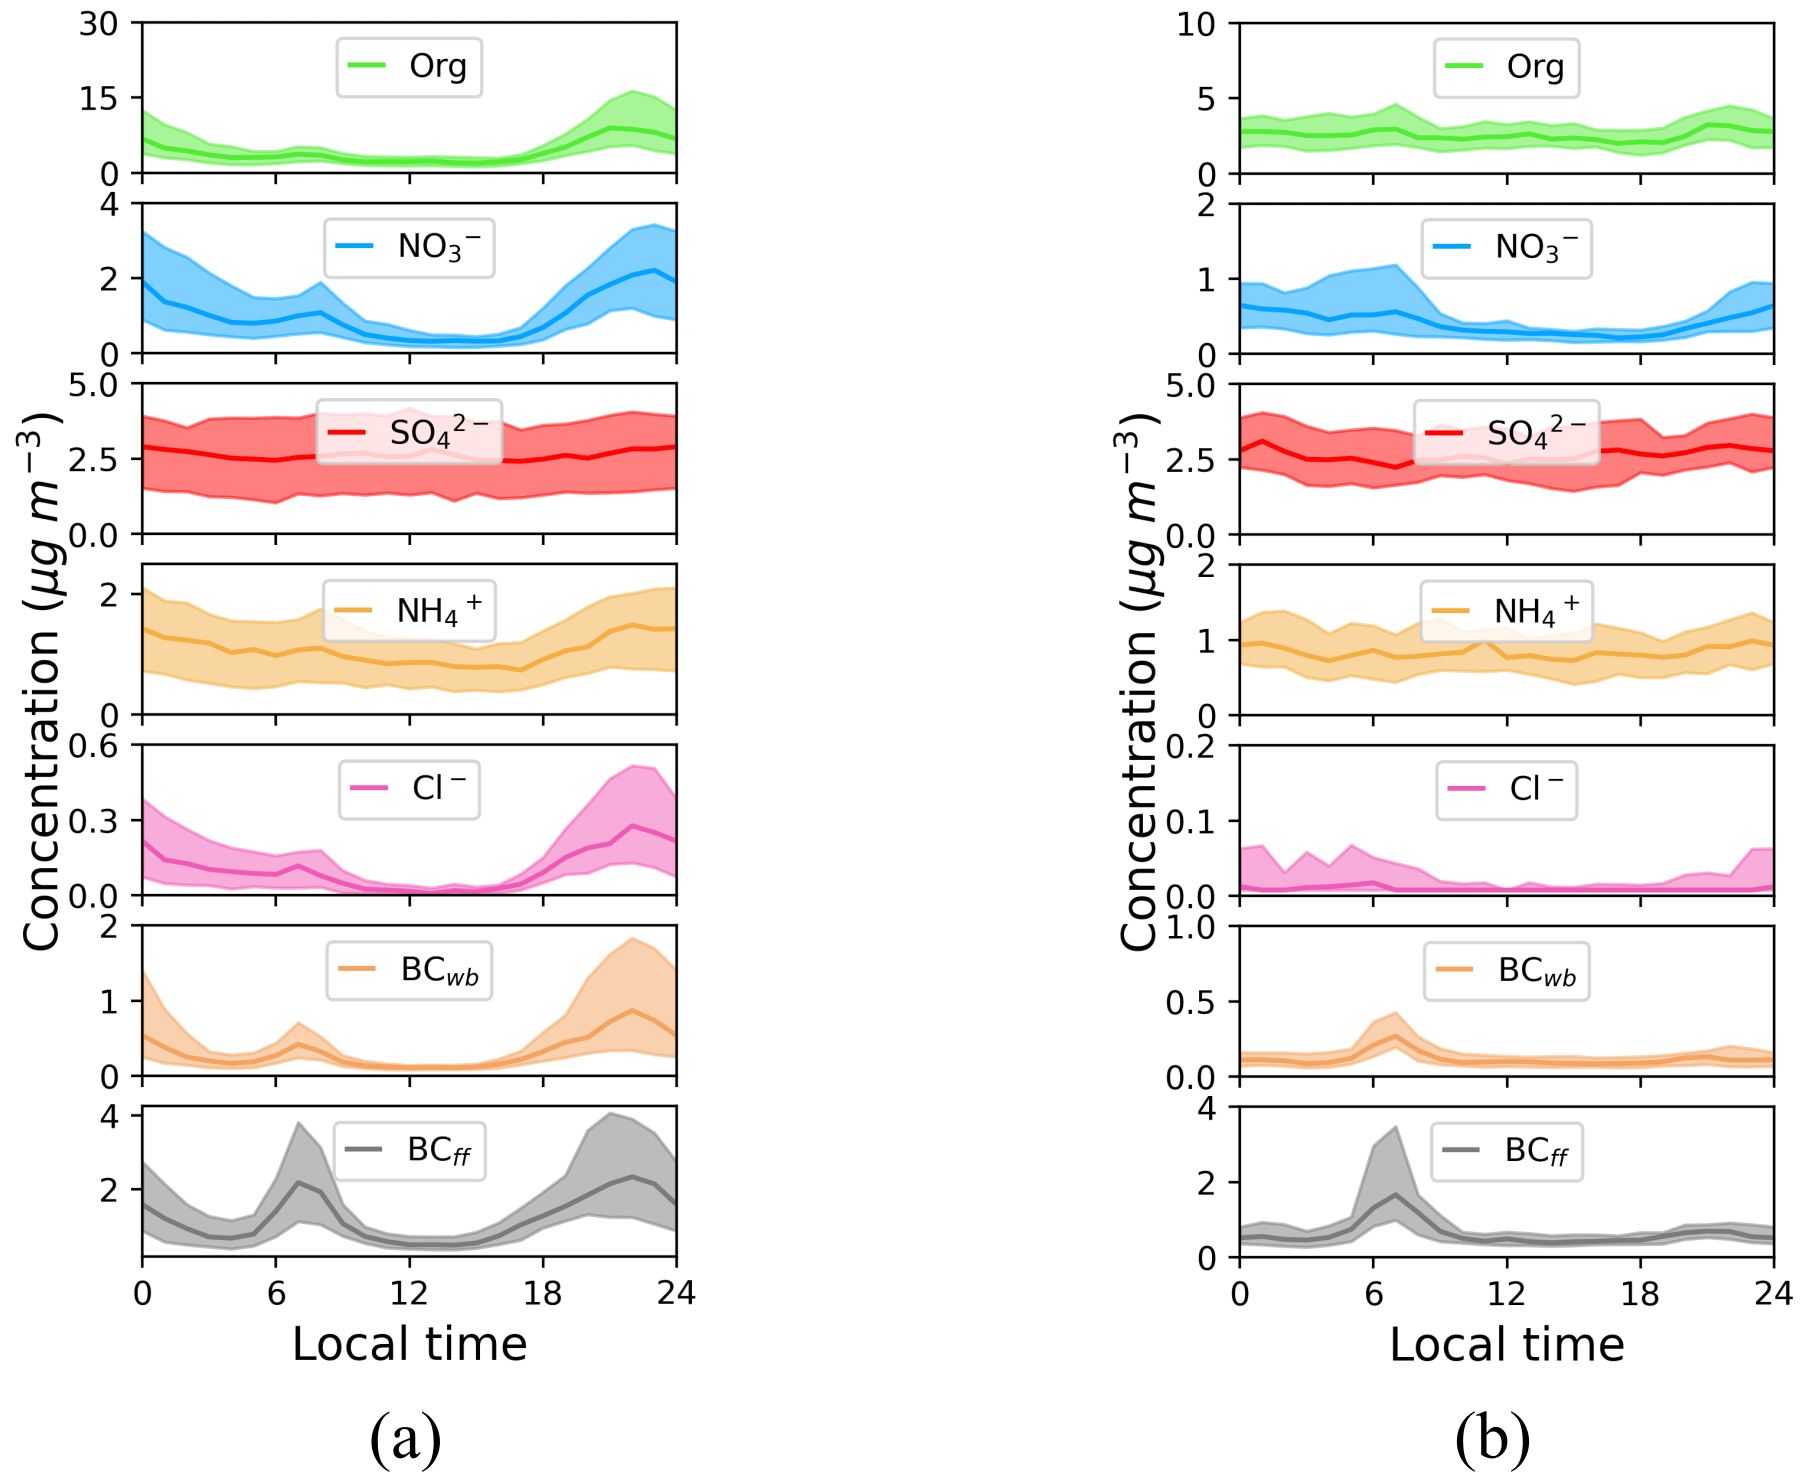
Figure 4Median diurnal trends of the main submicron chemical constituents (OA, SO, NO, NH, Cl−, and BC) during the (a) cold and (b) warm periods. The shaded area represents the 25th and 75th percentiles of the diurnals.
Organic aerosols. Organic aerosols dominate the cold period PM1 concentration levels, exhibiting a nighttime maximum above 12 µg m−3 and a second smaller maximum at 4 µg m−3, coinciding with local traffic rush hour (06:00–09:00 LT). Elevated OA concentrations in the cold period during the night (max at 22:00 LT) are a common, well-documented feature in many urban environments across Europe and the Mediterranean (e.g. Florou et al., 2017; Stavroulas et al., 2019; Chazeau et al., 2021). They can be attributed to higher emissions from domestic heating, evening traffic peak and cooking activities. The strong correlation between OA and BCwb (R2= 0.81, N= 2934; Fig. S9) suggests that residential wood burning is an important contributor to this nighttime peak. Interestingly, this peak is not significantly amplified by a lower PBLH during the nighttime, which seems to remain relatively stable with no significant diurnal variability during the cold period (Fig. S8). It is also worth noting that background OA concentrations observed both at the end of the night and middle of the day, when local emissions are minimal, remain relatively high at around 3 µg m−3. The diurnal variability of OA is much less pronounced during the warm period, suggesting a more important contribution of regional sources to OAs compared to the strong dynamic of local emissions. The assumption of a more important contribution from regional OAs during the warm period is further supported by a mean OA concentration of 2.83 µg m−3 (Table 2) that is close to the averaged OA concentrations of 3.26 µg m−3 reported for a 2-year period of continuous observations with Q-ACSM (2015–2016) at the rural background site of the Cyprus Atmospheric Observatory at Agia Marina Xyliatou (CAO-AMX), at a distance roughly 40 km from Nicosia (Chen et al., 2022). During the warm period, a small OA peak remains visible in the morning, with a similar amplitude to the cold season, likely to be related to traffic emissions. A second peak can be observed at 21:00 LT (not observed in BC), potentially originating from cooking activities. Heavy oil combustion from shipping could possibly contribute to OA. Further to the poor contribution of shipping emission on OAs, a model study of sources of organic aerosols in Europe using the Comprehensive Air Quality Model with Extensions (CAMx; Jiang et al., 2019) showed that the contribution of “other anthropogenic sources” (gathering shipping, industry, and energy production) on OAs (POA + SOA) was, typically, on the order of 10 % during summer and winter in the eastern Mediterranean region close to Cyprus. Based on a simple receptor model, PM2.5 source apportionment performed in Nicosia, Achilleos et al. (2016) showed that the contribution from shipping is approximately 8 % to PM2.5. Most of the transported mass is attributed to SO, with a minor contribution from carbonaceous aerosols. In conclusion, shipping emissions are likely to play a minor role in OA concentrations.
Black carbon. During the cold season, BC follows a bimodal diurnal pattern, which can be further apportioned by focusing on its source-specific components BCff and BCwb. The fossil fuel component exhibits two maxima, one in the early morning, coinciding with traffic rush hour, and one in the late afternoon, most probably related to both traffic and an increase in energy demand due to domestic heating (see discussion later on). On the other hand, BCwb diurnal variability is dominated by a nighttime maximum (20:00–01:00 LT), peaking 1 h after BCff and linked to wintertime residential wood-burning emissions, contributing up to 33 % of total BC. During the warm season, the BC diurnal pattern is characterized by the absence of a nighttime maximum, while still exhibiting a significant peak in the morning, dominated by BCff. The very low contribution of biomass-related combustion particles during the warm period, as previously noted from 60 in Fig. 2, is further supported here, with BCwb exhibiting a nearly flat diurnal variability with close-to-zero mass concentrations. The contribution of shipping in the Mediterranean on black carbon (BC) concentrations was investigated from model estimates by Marmer et al. (2009), based on the three most commonly used ship emissions inventories: (1) EDGAR FT by Olivier et al. (2005), (2) Eyring et al. (2005), and (3) EMEP by Vestreng et al. (2007). Results showed that shipping emissions were contributing to typically 15 %–25 % of BC in the E. Mediterranean, far from the shipping routes (which is the case for Cyprus). A similar result was found from a more detailed (positive matrix factorization) PM2.5 source apportionment analysis performed in Nicosia in 2018, with heavy oil combustion contributing 7 % to PM2.5 (Bimenyimana et al., 2023 under review) and the relevant factor containing less than 0.1 µg m−3 of EC.
Secondary inorganic aerosols. During the cold season, non-refractory nitrate and chloride detected by the Q-ACSM are mostly present in the form of semi-volatile NH4NO3 and NH4Cl (Guo et al., 2017; Theodosi et al., 2018). They show a nighttime maximum (Fig. 4a), reflecting the presence of gas precursors (NH3, HNO3, HCl) and the more favourable thermodynamic conditions with lower temperatures, higher relative humidity, and a condensation sink due to high PM concentrations of combustion aerosols (traffic, domestic heating). Additionally, there is a smaller morning NO peak, most probably linked to traffic (Foret et al., 2022). This is not observed for chloride, suggesting that HCl may not be as abundant in the morning compared to the evening. The less favourable thermodynamic conditions during the warm period lead to very small concentrations of semi-volatile NO3− and Cl− (Fig. 4b). As expected, sulfate does not show a pronounced diurnal pattern, irrespective of the period, pointing to regionally processed aerosols (Fig. 4a, b).
3.5 OA source apportionment
3.5.1 OA source apportionment during the cold period
For the cold period, the optimal PMF result has been found using a 5-factor solution following the approach detailed in Sect. 2.4. The identification of OA sources related to these 5 factors was then performed following the typical combination of information from (i) OA mass spectra (Fig. 5a), (ii) the correlation of each factor with source-specific tracers (see Fig. 5b), (iii) their diurnal variability (Fig. 6a), and (iv) their daily (weekdays vs. weekend) pattern (also Fig. 6b). The five factors were then assigned to the following sources: a primary BBOA (biomass-burning organic aerosol), two primary HOAs (hydrocarbon-like organic aerosols; HOA-1 and HOA-2), and two secondary OA sources, namely low-volatile MO-OOA (more-oxidized oxygenated organic aerosol) and semi-volatile LO-OOA (less-oxidized oxygenated organic aerosol). This source apportionment is presented and justified below for each factor.
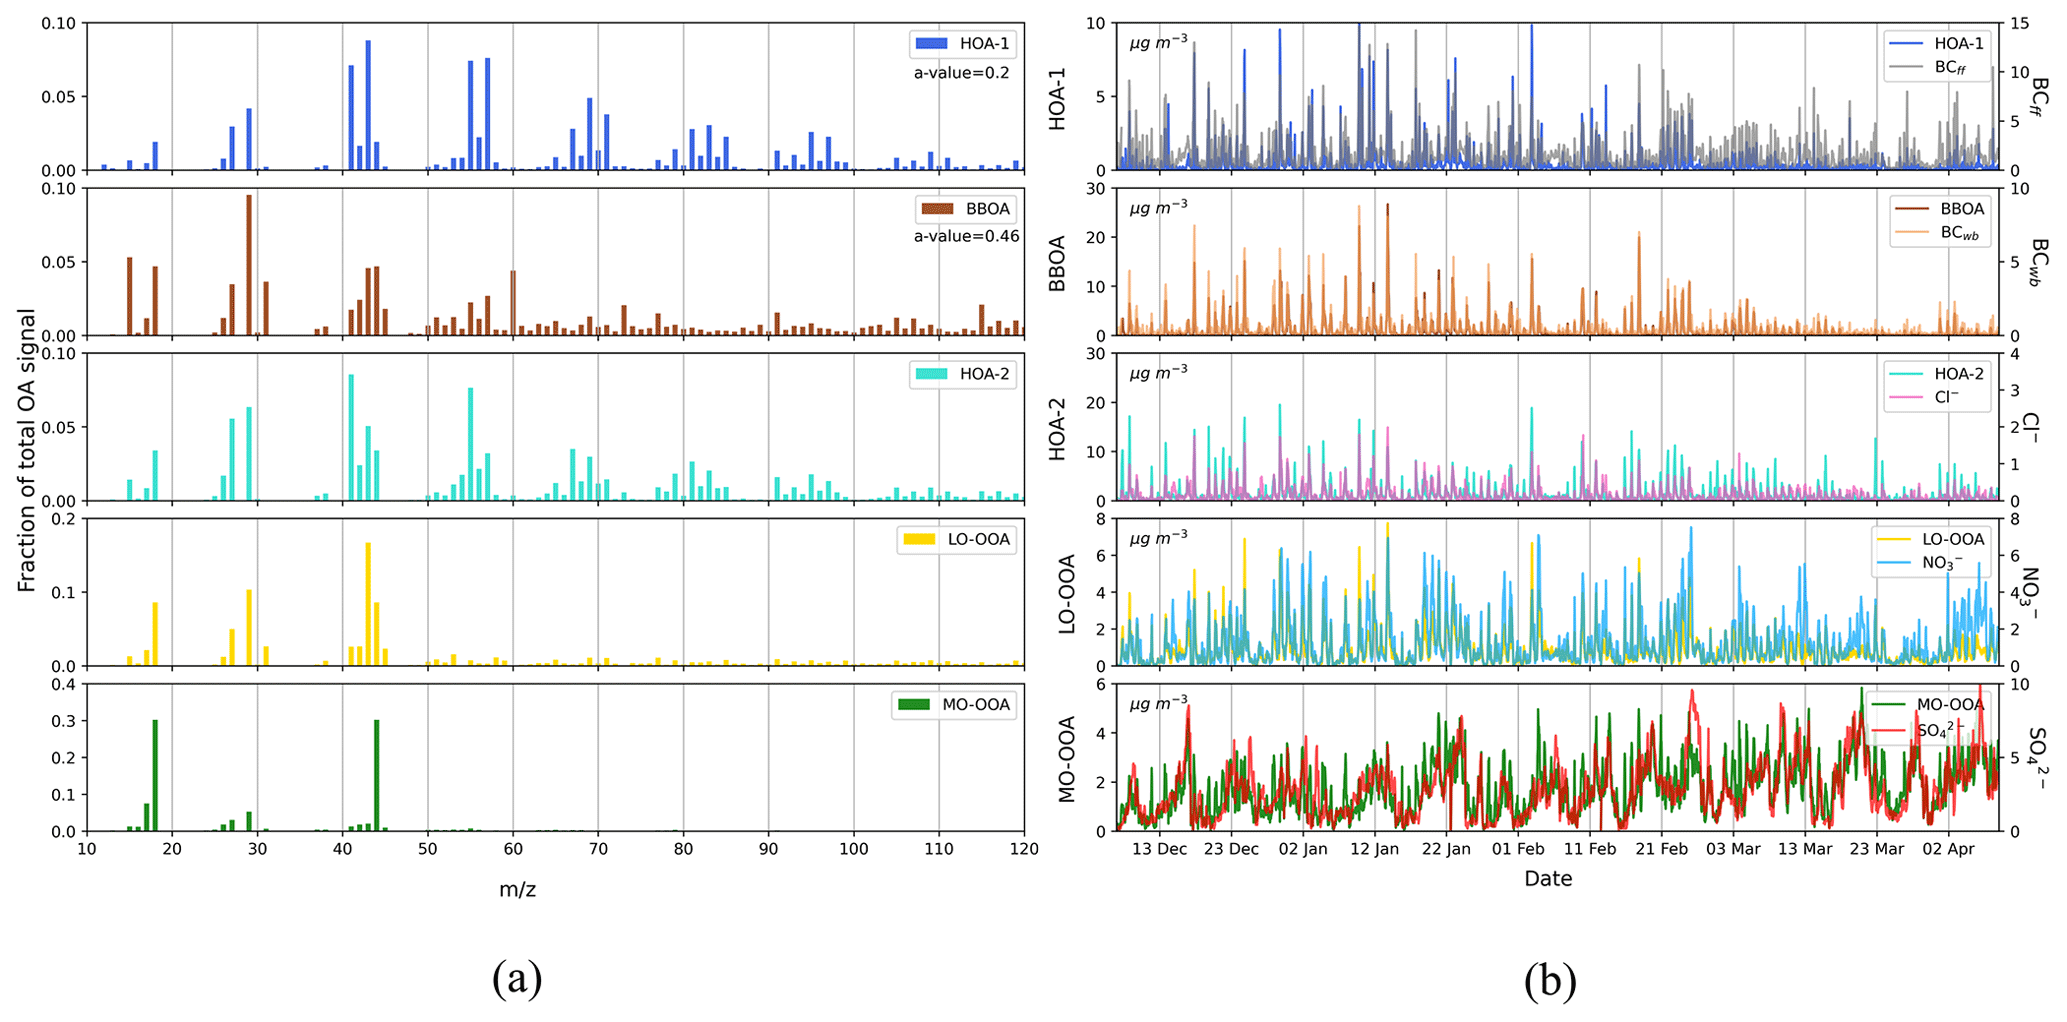
Figure 5Mass spectra of the PMF (a) and time series of the five OA factors resolved along with corresponding tracer compounds (b) for the cold period.
HOA-1 (hydrocarbon-like OA type 1). The mass spectrum of HOA-1 (Fig. 5a) is consistent with a fossil fuel (traffic) combustion source that can be identified by the prevailing contributions of the ion series representing CnH2n−1 ( 27, 41, 55, 69, 83, 97, typical fragments of cycloalkanes or unsaturated hydrocarbon chains) and CnH2n+1 ( 29, 43, 57, 71, 85, 99, typical fragments of alkane chains). Hence, this factor mass spectrum is well correlated to eight selected HOA factors related to vehicular traffic found in the literature (Fig. S10a) and relevant to European and Mediterranean environments. The traffic-related origin of the HOA-1 factor can be further confirmed by the good correlation with BCff (R2= 0.65, N= 2934; Fig. S11a), benzene (R2= 0.72, N= 1165; Fig. S11b). The diurnal variability of HOA-1 shows a bimodal cycle with a sharp maximum during the morning rush hour, with an amplitude similar to BCff (Fig. 6a) and a broader maximum in the evening, possibly encompassing emissions from traffic and diesel-fired residential heating systems. In the weekly cycle, as depicted in Fig. 6b, the morning peak decreases on Saturday. It is nearly absent on Sunday mornings, aligned with the de-escalation of traffic emissions usually observed during weekend mornings.
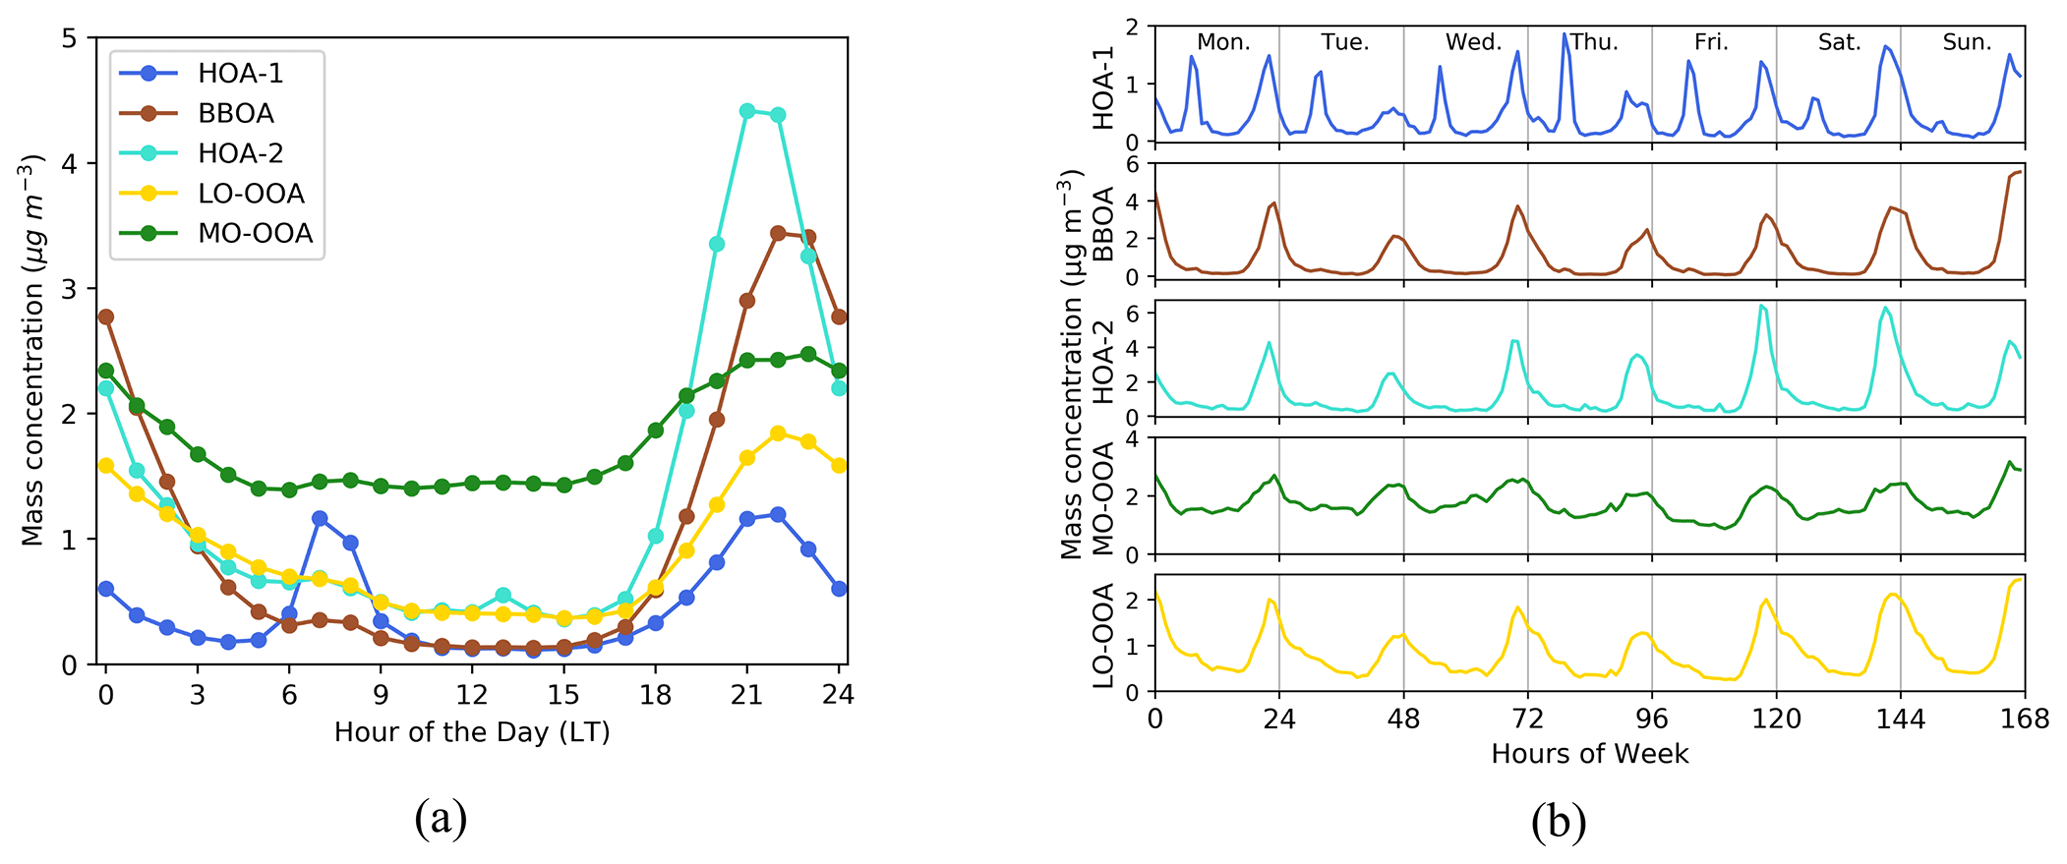
Figure 6Diurnal variability (a) and weekly cycles (b) of the five OA factors averaged over the cold period.
BBOA (biomass-burning OA). The mass spectrum of the site-specific BBOA factor (reported as BBOAcy in Sect. 2.4) exhibits characteristic peaks at 29, 60, and 73 (Fig. 5a), which are indicative of biomass burning (Crippa et al., 2014). The mass spectrum is quite similar to other BBOA spectra found in the Mediterranean and Europe (Fig. S10c), with a key difference here being the rather low contribution of a signal at 43. The biomass-burning-related origin of the factor is further confirmed by the strong correlation with BCwb (R2= 0.81, N= 2934; Fig. S11c), benzene (R2=0.61, N= 1162; Fig. S11d), and levoglucosan (R2=0.94, N= 125; Fig. S11e), a typical tracer of biomass burning (Fourtziou et al., 2017). The BBOA diurnal pattern exhibits an expected well-marked nighttime maximum around 22:00 LT, consistent with residential wood-burning activities. This nighttime maximum is observed throughout the week (Fig. 6a), confirming the important role of wood burning for heating in the city. Interestingly, the higher concentrations of BBOA as well as BCwb (Fig. 6b) were observed on Sunday evenings, pointing to the recreational use of fireplaces and leading to enhanced residential wood-burning emissions during the weekend, a feature also reported at other sites in Europe and the US (Bressi et al., 2016; Rattanavaraha et al., 2017; Zhang et al., 2019).
HOA-2 (hydrocarbon-like OA type 2). The mass spectrum obtained for this factor (Fig. 5a) is similar to the HOA-1 factor, with high signals for the ion series CnH and CnH. The main differences between these two factors occur in the relative contribution of 41 compared to 43 and the relative contribution of 55 compared to 57, which are both much higher for HOA-2 than for HOA-1. Furthermore, the contribution of signal to 44 is more significant in HOA-2, which can imply a mix of various sources and/or a possibly higher degree of atmospheric processing. Other discrepancies with HOA-1 concern its diurnal variability, with an intense maximum at night (Fig. 6a), and its average concentration levels, which are almost 3 times higher than HOA-1.
Influence of cooking activities. The HOA-2 diurnal profile has a small peak at 13:00 LT and a significantly higher one at 21:00 LT, effectively coinciding with typical meal times in Cyprus, as well as those reported in the literature for Greece (Siouti et al., 2021), therefore indicating the influence of cooking activities to this factor. When plotting f55 vs. f57 (Mohr et al., 2012) and colouring the data points by the corresponding time of day, a distinct pattern appears with data of higher f55 over f57 being clustered to the top left of the triangle, close to the fitted lines representing cooking (Fig. S12) and coinciding with midday and evening hours. The nighttime maxima pattern is consistent throughout the week, with the higher concentrations being recorded on Friday and Saturday evenings (Fig. 6b), in line with an expected food service sector activity increase as part of Nicosia inhabitants' leisure on the weekend. The mass spectrum of HOA-2, even though left unconstrained, is highly correlated to COA found in other studies (Fig. S10b) in both Mediterranean and continental European urban environments. Additionally, the non-negligible signal at 60 points to the widely spread habit of meat charbroiling (Kaltsonoudis et al., 2017).
Influence of power plant emissions. A closer look at the diurnal variability of the HOA-2 factor shows a certain persistence of this factor throughout the day, even when cooking activities are more or less absent (Fig. 6a). Such a pattern could imply the influence of other combustion sources, not necessarily of local origin. The influence of other combustion sources would also help to explain why HOA-2 average concentrations are roughly 3 times higher than OA related to traffic (HOA-1), as it is very unlikely that cooking activities can contribute solely to the observed HOA-2 concentrations. A possible contributing source could be related to the energy production sector on the island, which relies exclusively on heavy fuel oil. In a recent study, Vrekoussis et al. (2022), utilizing satellite observations, have identified that power plants located to the north (Teknecik power plant, PP4, 362MW), north-east (Kalecik power plant, PP5, 153 MW), and south-east (Dhekelia power station, PP3, 460 MW) of Nicosia at 22, 60, and 38 km, respectively, are significantly contributing to columnar NO2 concentrations over the island. The importance of these emission hotspots, along with their location on the island, during both the cold and warm periods is illustrated in Fig. S13 and shows, particularly for the northern power plants (PP4, PP5), emissions as high as the traffic-related NO2 over Nicosia. Interestingly, in a source apportioning study on VOCs performed at the Cyprus Atmospheric Observatory – Agia Marina Xyliatou (CAO-AMX), a rural remote site 32 km south-west of Nicosia, Debevec et al. (2017) have resolved a factor related to industrial activity and/or power generation, exhibiting a connection with winds arriving from the wider eastern sector.
In order to assess the possible influence of Cypriot power plant emissions, the coupling of wind velocity and wind direction with the HOA-2 time series was performed through NWR analysis (Fig. S14b). This analysis highlights the association of stagnant conditions (low wind speed and low dispersion) with high HOA-2 concentrations (i.e. nighttime peaks), pointing to a more local origin for this OA source. On the other hand, different features appear when wind velocities are higher, showing emissions originating from the NW and the ENE sectors, i.e. downwind of power plants PP4 and PP5, although long-range transport influence cannot be ruled out. This is illustrated by the NWR of sulfate (Fig. S14f), which shows a dominant E sector likely to originate from regional emissions. Given the positioning of the sampling site, close to the edge of Nicosia's urban fabric, with the Athalassa park lying to the east, such an observation can suggest the transport of plumes from the operating powerplants, namely PP5 and PP3 to the city. Interestingly, a similar yet even clearer image stands for SO2 concentrations – only half of which are considered to be of urban origin (Vrekoussis et al., 2022) – measured at a suburban background site (NicRes) and a traffic site (NicTra) in the city (Fig. S14g–h), with elevated SO2 concentrations being related to eastern winds of higher velocity, further corroborating that power generation related polluted plumes, travelling through the Mesaoria plain arriving at Nicosia, can contribute to the HOA-2 factor.
Other combustion sources. Interestingly, chloride shows a good correlation with HOA-2 (R2= 0.61, N= 2945; see Figs. S11f, 5b). Chloride detected by the ACSM is in the form of NH4Cl (a secondary highly volatile species). The source of this chloride is still widely debated and may originate from industrial activity or municipal (plastic-containing) waste burning (Gunthe et al., 2021). Another possible explanation of the good agreement between HOA-2 and chloride would be the use of Cl-rich coal as a means for outdoor cooking in Nicosia and could therefore reflect the influence of cooking activities that comprise a fraction of the HOA-2 factor.
Less-oxidized oxygenated OA (LO-OOA). With an elevated contribution of 44, the mass spectrum of this factor is consistent with a secondary OOA source. A higher 43 and a lower 44 (Fig. 5a) compared to MO-OOA implies a less oxygenated (less processed) component (Mohr et al., 2012). Finally, the time series of this factor is quite similar to NO, with an overall good correlation value (R2= 0.67, N= 2943; Fig. S11h), highlighting its semi-volatile character. This is further corroborated by the very good correlation of LO-OOA with chloride (R2= 0.73, N= 2943; Fig S11i), another semi-volatile compound measured by the Q-ACSM. The diurnal variation of LO-OOA displays 1.5 times higher concentrations during the night compared to daytime (maximum of 1.84±0.31 µg m−3 at 22:00 LT; Fig. 6a), a pattern that is much more pronounced than the variability observed for MO-OOA. This feature highlights that the presence of LO-OOA is not exclusively controlled by photochemical processes. Instead, changes in thermodynamic equilibrium (due to lower temperature, T, and increased RH), favouring the condensation of gas phase semi-volatile material on the one hand and intense nighttime chemistry (gas phase or heterogenous) on the other hand, are among the processes that may account for the rapid nighttime formation of LO-OOA. Atmospheric processing of biomass-burning OA during periods of low photochemical activity (such as in winter or at night), also known as “dark” ageing, has been reported recently (Kodros et al., 2020; Jorga et al., 2021) and could have contributed to the observed nighttime formation of LO-OOA. Notably, the weekly cycle of LO-OOA, and its nighttime maxima, appears to have the same pattern and intensity as those observed for BBOA (e.g. low peaks on Tuesday and Thursday, maximum on Sunday) (Fig. 6b). On the other hand, the factor is correlated with both BBOA (R2= 0.81; Fig. S11k) and BCwb (R2=0.66; Fig. S11j). This observation could indicate a biomass-burning contribution to LO-OOA through fast oxidation of primary emissions, supported by several studies showing biomass burning linked to OOA sources at night (Stavroulas et al., 2019; Kodros et al., 2020; Chen et al., 2021).
More-oxidized oxygenated OA (MO-OOA). The MO-OOA factor typically accounts for secondary organic aerosol formed in the atmosphere from gas-to-particle conversion processes of VOCs and their products, as well as atmospheric ageing of primary OA (Petit et al., 2015; Stavroulas et al., 2019). Numerous VOC sources can contribute to OOA but lose their mass spectrum fingerprint owing to extended oxidation due to photochemical ageing, which leads to enhanced signal at the 44 fragment (CO), a dominant tracer for OOA (Ng et al., 2011). The predominance of 44 and the near absence of 43 in the mass spectrum of the resolved MO-OOA factor (Fig. 5a) points to highly oxidized and/or aged secondary OA (i.e. originating from long-range transport). This is further supported by the relatively good agreement (R2= 0.55, N= 2943; Fig. S11l) between concentrations of MO-OOA and sulfate (Fig. 5b), a species of regional origin (Sciare et al., 2003). Nevertheless, the diurnal variability of MO-OOA does not closely follow sulfate, showing a small increase of 20 %–30 % every evening (Fig. 6a, b), which furthermore cannot be explained by atmospheric dynamics (see the negligible PBLH diurnal variability for the cold period shown in Fig. S8). Alternatively, this would suggest that a fraction of MO-OOA is produced locally through nighttime oxidation mechanisms, as previously observed for LO-OOA. Similar nighttime increases of high oxygenated OA factors, related to local sources, have been reported in both northern European urban sites (Zhang et al., 2019; Lin et al., 2022) and the eastern Mediterranean urban environment (Athens, Greece), where a link to oxidized primary residential wood burning emissions as a potential driver of the low volatility OOA factor diurnal variability was also suggested (Stavroulas et al., 2019).
3.5.2 OA source apportionment during the warm period
For the warm period, the optimal PMF solution was obtained using a 4-factor solution (HOA-1, HOA-2, MO-OOA, LO-OOA). As expected, the BBOA factor could not be resolved, as previously highlighted by the low concentrations at 60 reported during this period (Fig. 2). Again, the identification of OA sources related to the four OA factors was performed following the typical combination of information from (i) OA mass spectra (Fig. 7a), (ii) the correlation of each factor with external source-specific tracers (Figs. 7b and S15), (iii) their diurnal variability (Fig. 8a), and (iv) their daily (weekdays vs. weekend) pattern (also Fig. 8b). The mass spectra profiles for the 4-factor PMF solution during the warm period (Fig. 7a) were quite similar to the ones from the cold period (Fig. 5a).
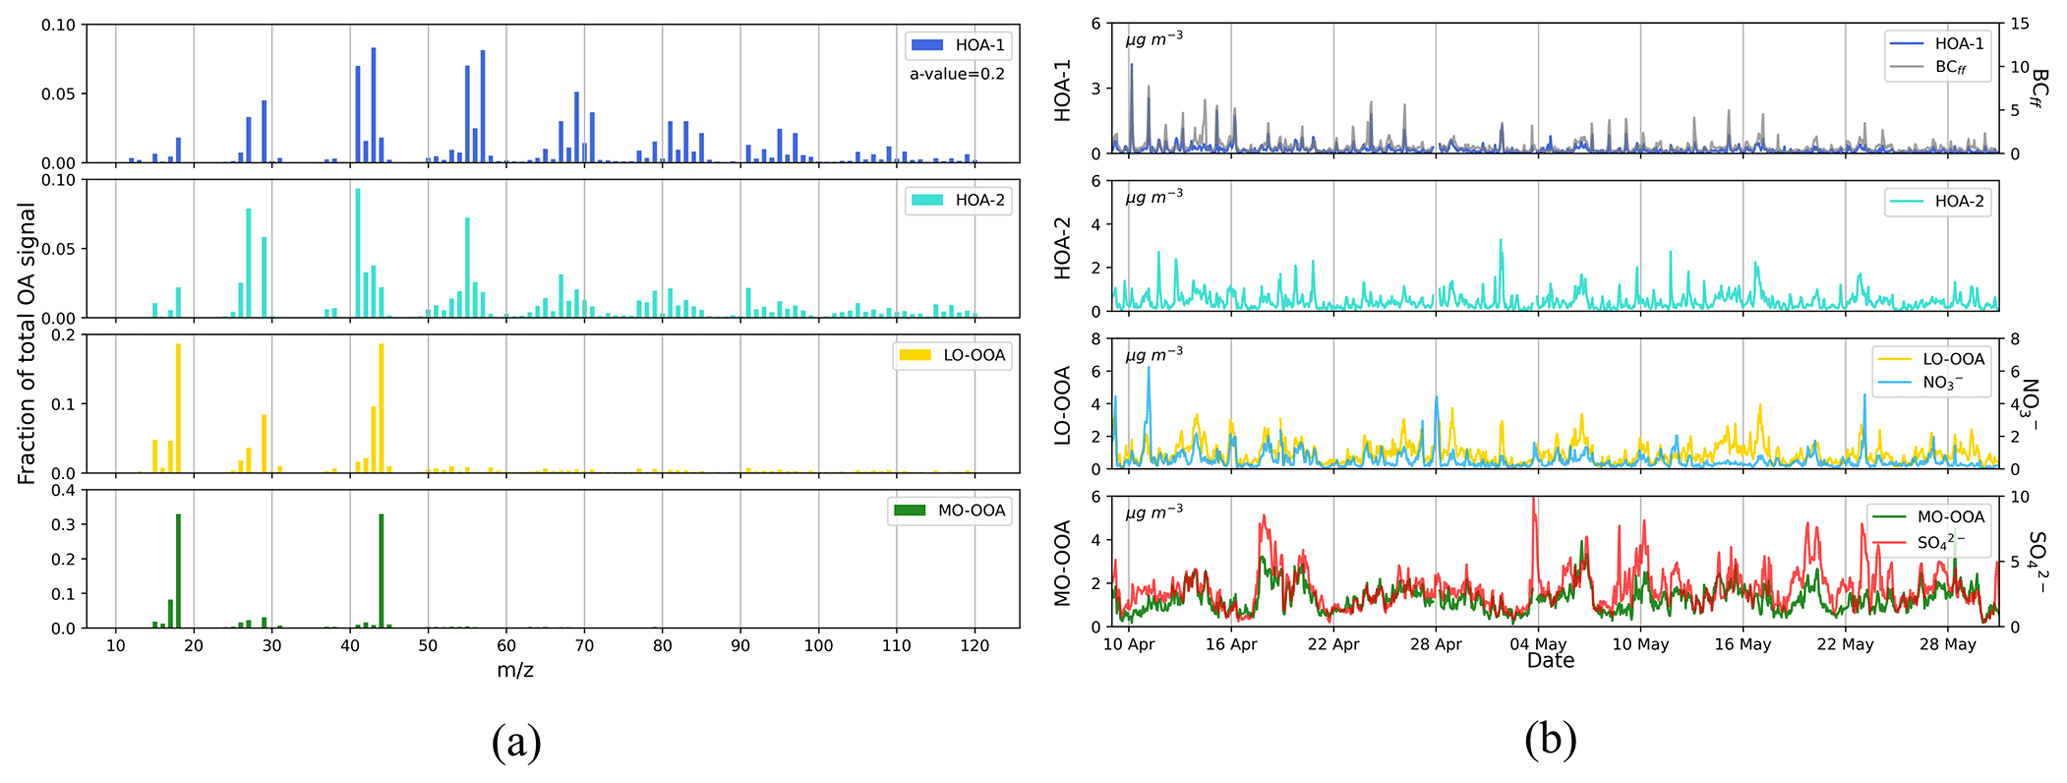
Figure 7Mass spectra of the PMF (a) and the time series of the four OA factors resolved along with corresponding tracer compounds (b) for the warm period.
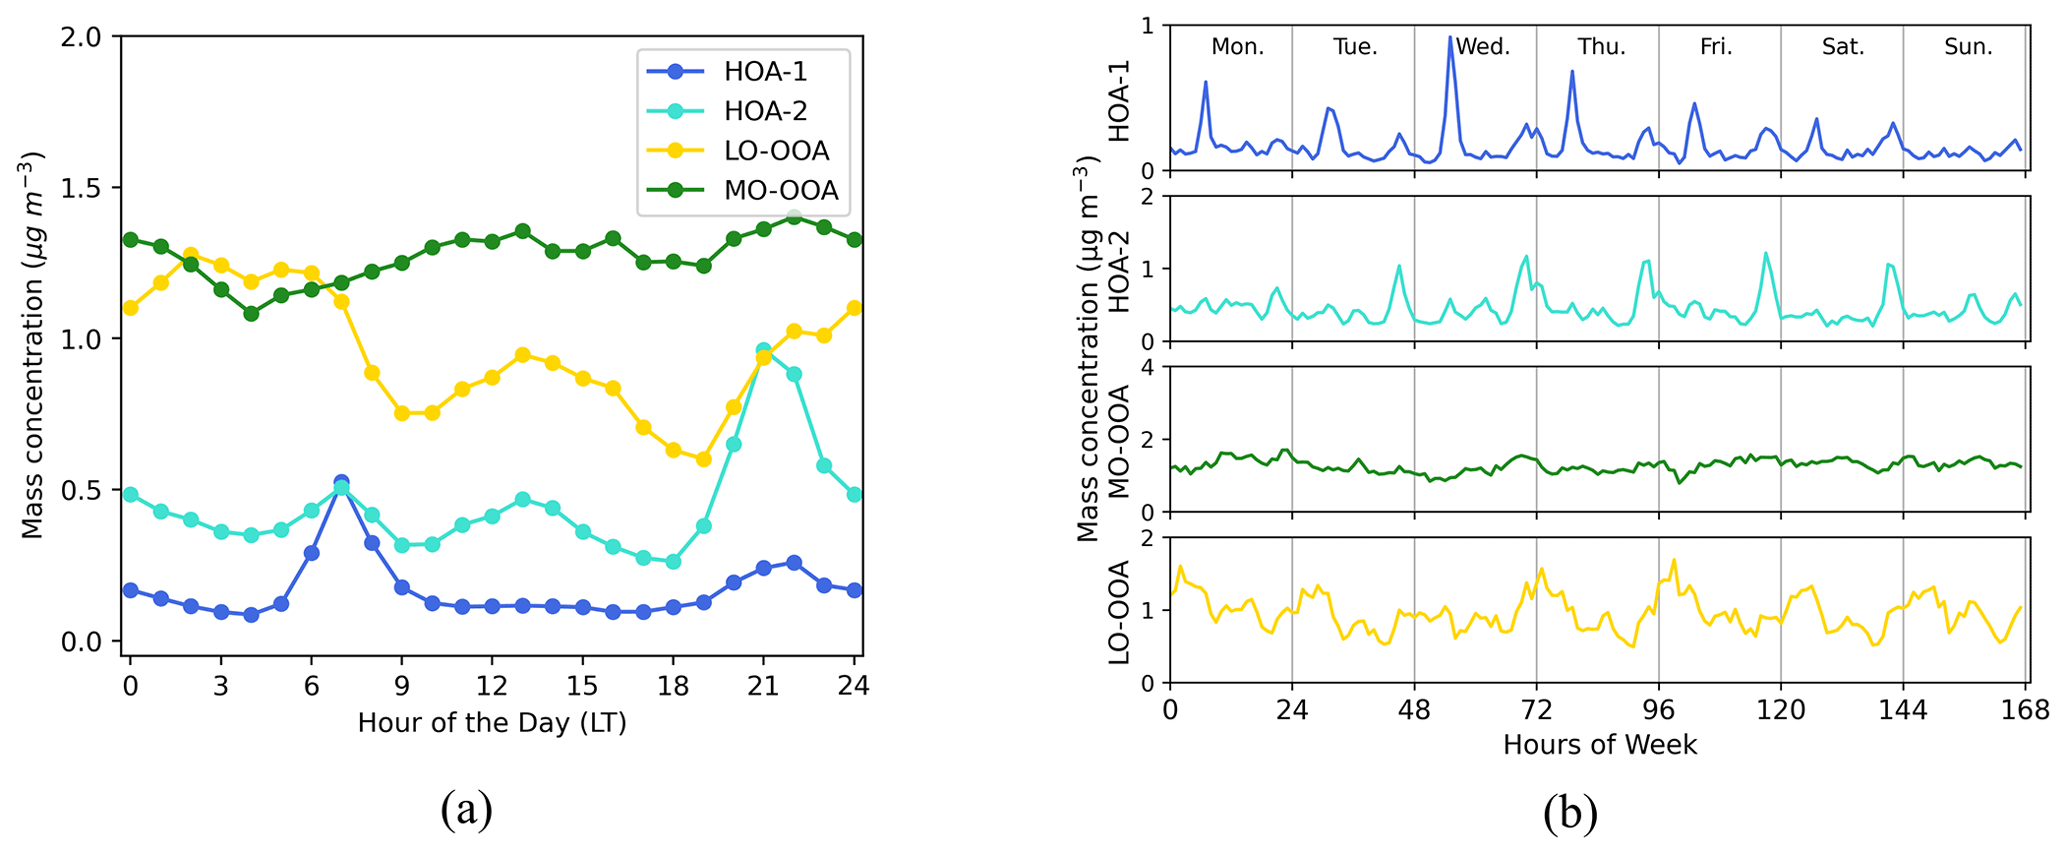
Figure 8Diurnal variability (a) and weekly cycles (b) of the four OA factors resolved during the warm period.
HOA-1. For the warm period, an a value of 0.2 was selected for constraining the HOA-1 factor, again using the Ng et al. (2011) HOA profile as a reference. The resolved factor profile is nearly identical to the one obtained for the cold season (R2= 0.99; Fig. S10a). It is also very well correlated to traffic-related HOA factor profiles found in other Mediterranean (Kostenidou et al., 2015; Gilardoni et al., 2016; Florou et al., 2017; Stavroulas et al., 2019) and European cities (Lanz et al., 2010; Crippa et al., 2014), as depicted in detail in Fig. S10a. The HOA-1 time series follows the same pattern as the corresponding traffic-related HOA-1 factor reported for the cold period, showing a good correlation with BCff (R2= 0.62, N= 1259; Fig. S15a). Its diurnal variability exhibits a bimodal pattern, with a typical sharp maximum in the morning (07:00 LT) and a smaller peak during the evening (Fig. 8a). On a weekly basis, this diurnal variability tends to be less pronounced on Saturdays and nearly absent on Sundays (Fig. 8b), reflecting reduced commuting during the weekend.
HOA-2. The HOA-2 factor still shows elevated concentrations during the warm period, close to 3 times higher than HOA-1 (Table S3). The profile remains quite unchanged between the cold and warm periods (R2= 0.92; Fig. S10b), pointing to similar sources. No correlation was observed with chloride, which may be expected due to unfavourable thermodynamic conditions hindering NH4Cl formation as well as the lack of significant chloride sources during this period. A nighttime maximum of HOA-2 is still observed when investigating the factor's diurnal variability (Fig. 8a). Furthermore, a somewhat broader, compared to the cold period, maximum in the middle of the day (Fig. 8a) can also be observed. When going through the weekly variability, this midday maximum is particularly well defined on Sundays (Fig. 8b), while the evening peaks of Sundays and Mondays are the lowest. The above observations remain consistent with the cold period assessment that HOA-2 is on the one hand linked to cooking activities. For households, activities are expected at noon and in the evenings, while for restaurants, activity peaks on Sunday at noon and is lower on Sunday evening and Monday, reflecting the fact that such businesses remain closed on the first day of the week (Fig. 8b). On the other hand, the overall offset of HOA-2 observed against the HOA-1 diurnal profile persists, suggesting somewhat permanent background HOA-2 concentrations that cannot be explained by cooking activities alone. A contribution to this source by continuous emissions from power plants (see space-based (SP5-TROPOMI) vertical columns of NO2 during the warm period in Fig. S13d) should be sought. In addition, the HOA-2 NWR plot for the warm period reveals an even more significant enhancement of concentrations when moderate winds blow from the E–SE (Fig. S16b), a trend also observed for SO2 during the same period (Fig. S16e, f).
The above observations remain consistent with our assessment for the cold period: the HOA-2 factor consists of a mixed OA source that contains cooking activities (inc. coal combustion) and emissions from the powerplants located on the eastern part of the island. Indeed, the HOA-2 midday maximum can be linked to an increase in electricity demand at that time of day during the warm period due to an increase in air conditioning usage (Cyprus' NECP 2021–2030, 2019).
LO-OOA. The LO-OOA factor profile exhibits some differences from the one resolved for the cold period (R2= 0.66), as illustrated in the correlation matrix, in comparison to selected factor profiles found in the literature (Fig. S10d), while being very similar to those obtained in Athens and Piraeus during summer (Bougiatioti et al., 2014; Stavroulas et al., 2021). The LO-OOA time series shows a low agreement with NO (R2= 0.31, N= 1259; Fig. S15c), poorer than the observed correlation during the cold period (Fig. S11h). The diurnal pattern of the factor (Fig. 8a) shows maximum concentrations persisting throughout the night and early morning, while a secondary maximum during the midday can be observed. But overall, the diurnal pattern of LO-OOA is rather flat compared to the cold period, suggesting that local production may not be so important at that time compared to a less variable regional background. Interestingly, a midday hump similar to the one observed for HOA-2 is present, suggesting a common origin.
MO-OOA. The factor profile of MO-OOA resolved during the warm period is strikingly identical to the profile found in the cold period (their R2 is almost 1; Fig. S10e), while being excellently correlated to other highly oxygenated OA factors resolved in both the urban and regional background in the eastern Mediterranean (Bougiatioti et al., 2014; Stavroulas et al., 2019, 2021), as well as in continental Europe (Crippa et al., 2014). The winter nighttime peaks are not observed anymore (Fig. 8a), with the factor's diurnal pattern exhibiting much less variability, highlighting its dominant regional character. The time series of MO-OOA correlates well to SO (R2= 0.53, N= 1259; Fig. S15b), confirming this regional and highly processed origin. The concentration levels of MO-OOA during the warm period are lower than in the cold (Table S3). However, its relative contribution to total OA during the warm period remains similar (45 %).
3.6 Spatial and seasonal variability of OA sources
3.6.1 Seasonal variability of OA sources
Primary OA. The mass concentration of the three primary OA factors (HOA-1, HOA-2, BBOA) represents as much as 40 % of total organic aerosols during the cold period (Fig. 9), with POA contribution significantly decreasing in the warm period (22 % to total OA) due to the absence of the significant residential wood burning source, which during the cold period accounted for 12 % of total OA. The important contribution of primary sources in Nicosia has also been highlighted earlier by the rather low OA OC ratio of 1.42 (Sect. 3.1). In a recent publication covering several European sites, Chen et al. (2022) reported that in urban sites solid fuel combustion-related OA components were 21.4 % of total OA during winter months, higher than what is found for BBOA in Nicosia, owing to the rather milder winters in the city.
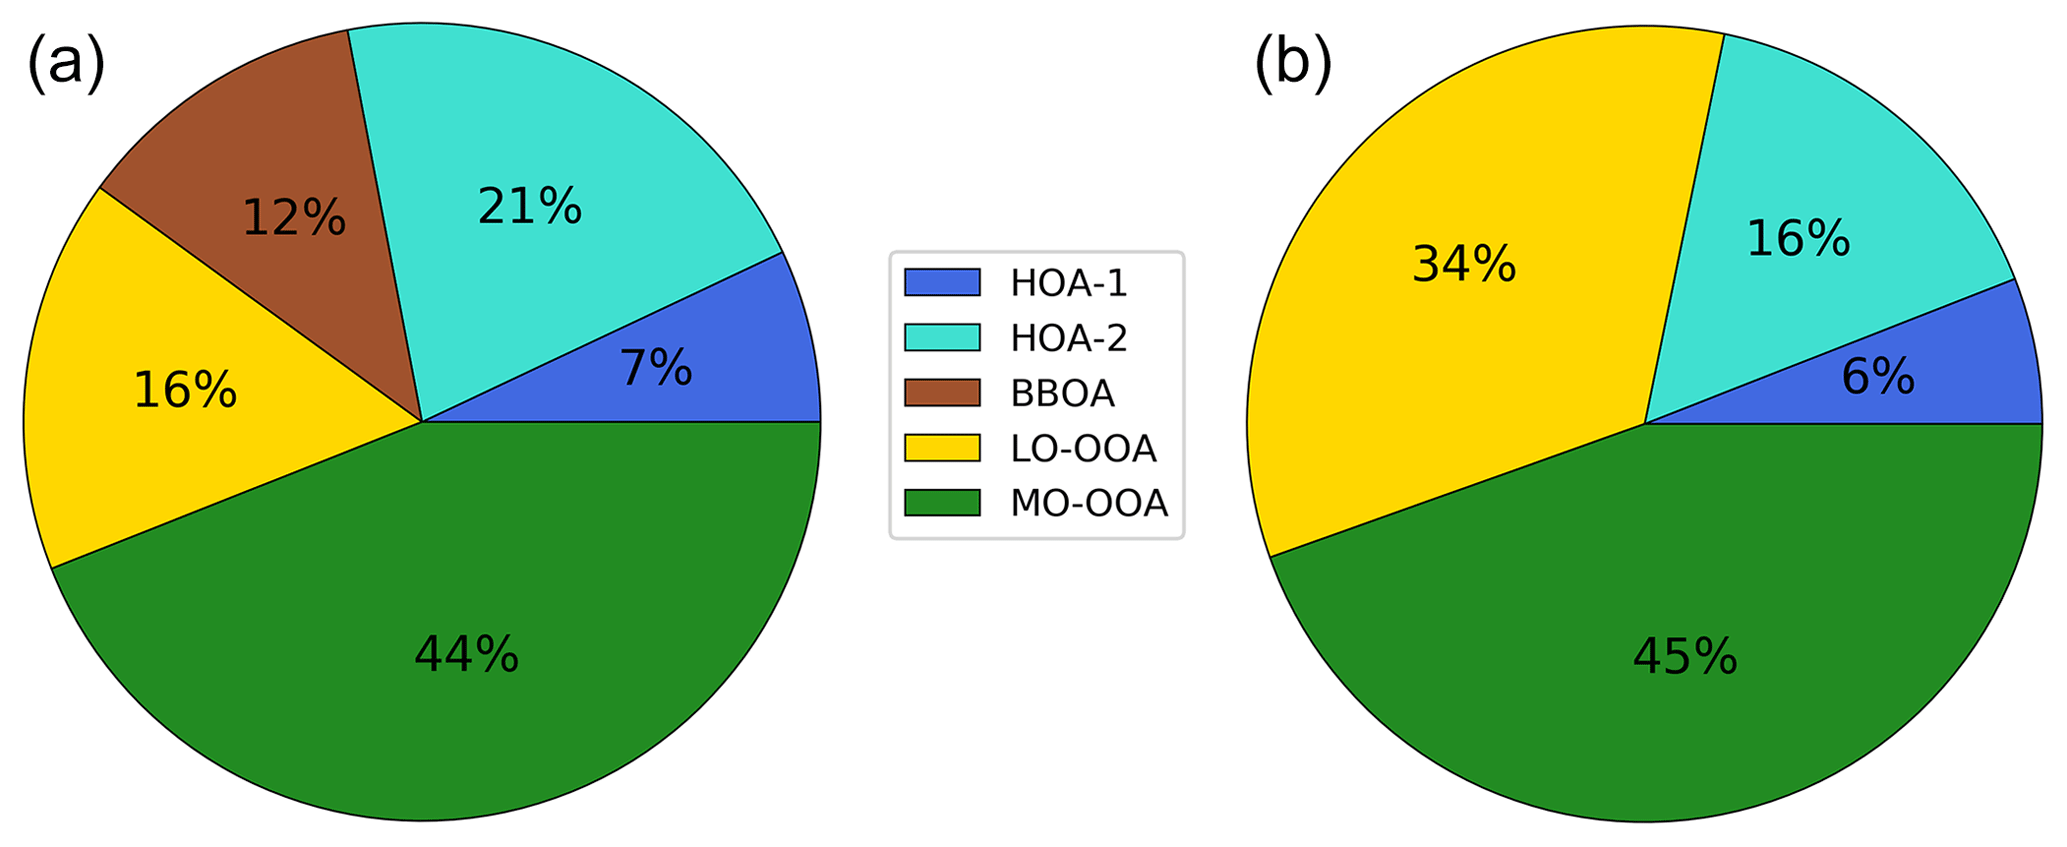
Figure 9Relative contribution of PMF-resolved OA sources to total OA for the cold period (a) and the warm period (b), respectively.
The traffic-related primary factor in Nicosia (HOA-1) was found to be rather stable in terms of contribution to total OA across this study's two seasons, averaging 7 % and 6 %, respectively, for the cold and warm periods and being lower than the figure reported in other European urban sites (12.7 %, Chen et al., 2022). On the other hand, the HOA-2 factor represents ca. of the total HOA in Nicosia, with little variation from winter (72 %) to summer (66 %) to total HOA (Fig. 9). Comparing it with COA in urban locations resolved by Chen et al. (2022), during both winter (14.4 % compared to 21 % in the cold season in Nicosia) and spring (15 % versus 16 % in Nicosia during the warm season), the higher values reported in Nicosia further support the assumption that the HOA-2 represents a mixed combustion source.
Secondary OA. A higher degree of oxidation is observed for the LO-OOA factor during the warm period, given the much higher signal contribution at 44 than the respective cold period factor. This discrepancy, reported in several studies (Huang et al., 2019; Duan et al., 2020), is explained by higher photochemistry during the warm period, which promotes the oxidation of OA, resulting in a LO-OOA profile with a higher 44 fraction. This result is also consistent with a less-oxidized LO-OOA formed during the cold period from nighttime chemistry. The range of LO-OOA concentration levels is different between cold and warm periods (0.05–7.74 and 0.05–4.00 µg m−3, respectively), while the mean concentrations for both periods are similar (0.86 and 0.95 µg m−3 for cold and warm periods, respectively). The contribution of LO-OOA relative to total OA is double during the warm period compared to the cold, reflecting both the absence of the biomass-burning source as well as the prevailing conditions favouring atmospheric processing of primary OA and SOA precursors. During the cold period, LO-OOA intense peaks suggest an influence from local emissions, while during the warm period, the less variable LO-OOA diurnal variability highlights the influence of more intense photochemical processing at medium-to-large geographical scale. MO-OOA is found to be the major contributor to total OA for both the cold (44 %) and warm (45 %) periods, higher in both cases than the average MO-OOA contributions reported for other European urban sites (Chen et al., 2022), underlining the importance of highly processed secondary OA over Nicosia (Fig. 9).
3.6.2 Geographic origin of OA sources
The geographic origin of OA sources (local vs. regional) is further assessed here using both non-parametric wind regression (NWR) analyses as well as the regional scale coupling concentrations to air mass back trajectories through PSCF.
Cold period. During this period, primary OA factors, especially HOA-1 and BBOA, have an expected strong local component that is characterized by high concentrations at low wind speeds (hourly average 1.4 m s−1) when winds are originating from the WSW sector (Fig. S14a, c), pointing to the busy highway connecting Nicosia to the other major cities in the island, while integrating the highly populated residential areas of the Strovolos and Lakatamia municipalities (Fig. 1c). As discussed earlier, the HOA-2 factor, apart from its local influence (also in the WSW sector), exhibits significant concentrations related to higher wind speeds from the NW and the ENE sectors that could originate from power plants but also possibly from long-range transport. Interestingly, a small local contribution from the city, still within the WSW sector, can also be observed for both LO-OOA and MO-OOA, consistent with the peaks observed that could originate from local nighttime chemistry. Still, high concentrations of MO-OOA (and, to a lesser extent LO-OOA) are observed with high wind speeds and eastern directions (Fig. S14e, d). Although the contribution of the power plant PP5 located in the east sector (Fig. S13c) cannot be excluded, PSCF analysis points out that the hotspots of MO-OOA can be traced in neighbouring countries (e.g. Syria, Lebanon, and south Turkey) in the Middle East (Fig. 10a). These areas also represent hotspots of SO according to PSCF analysis (Fig. S17a).
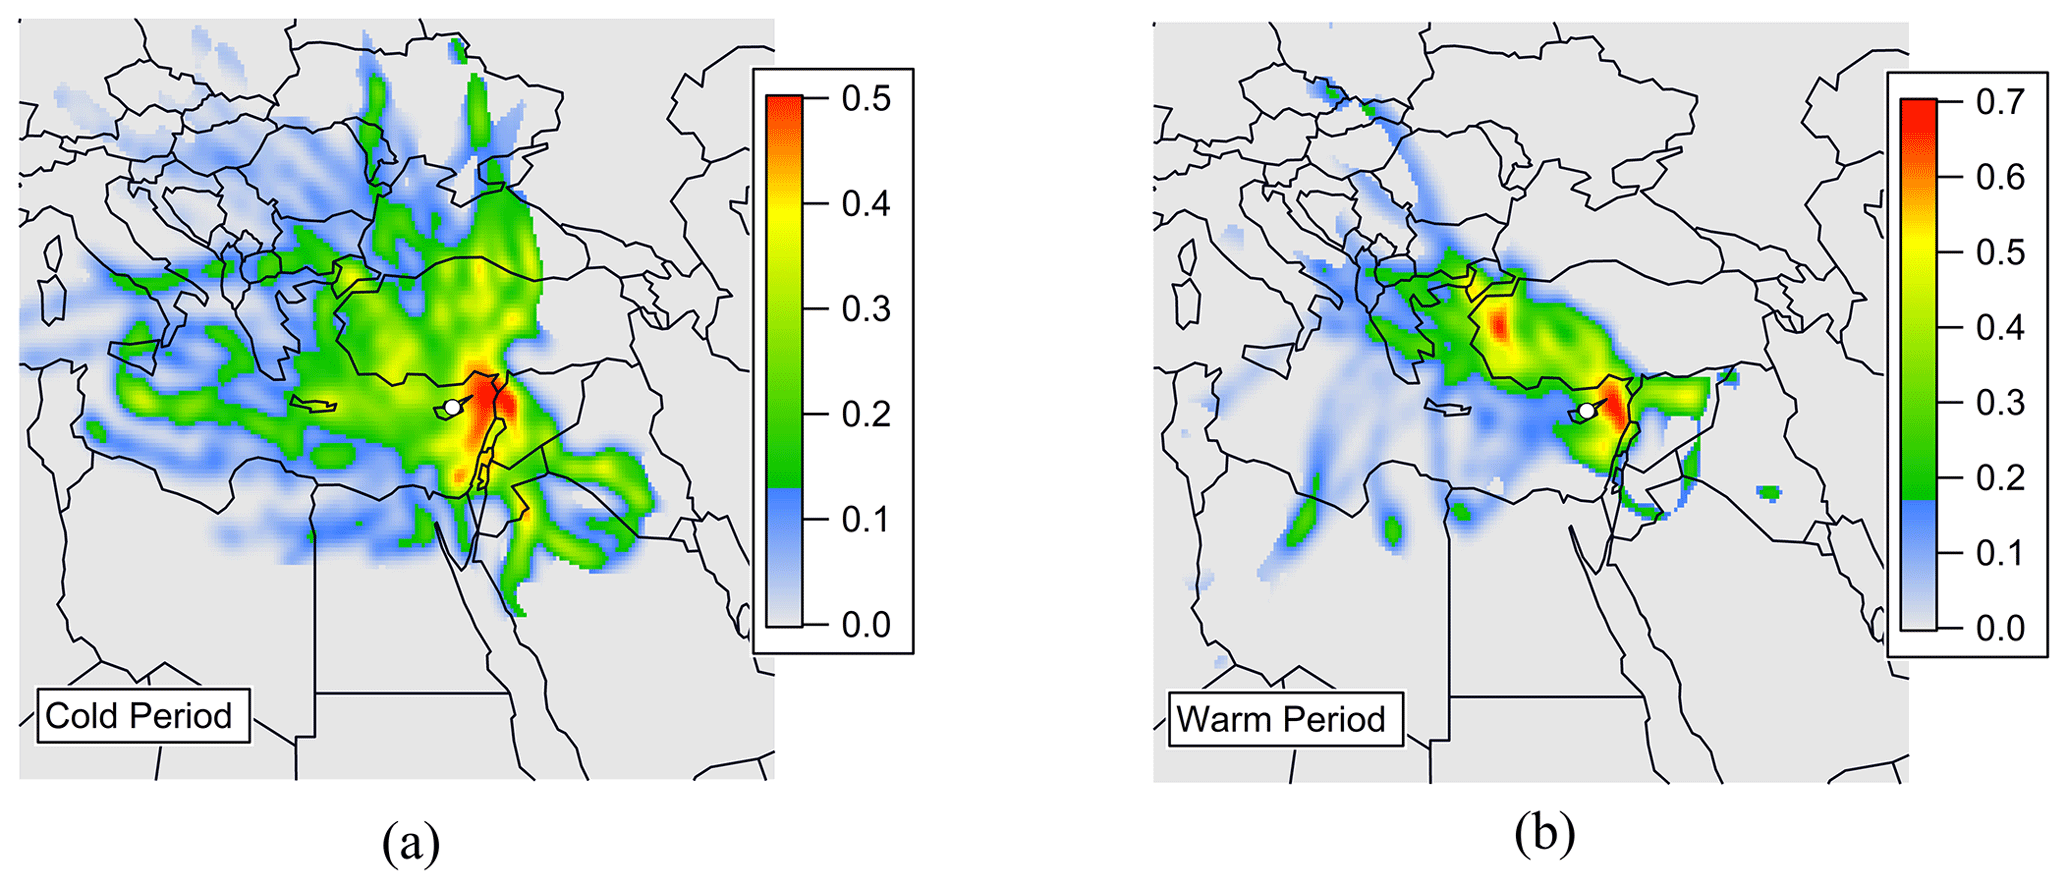
Figure 10PSCF plots for MO-OOA during the cold (a) and warm (b) periods. The colour scale represents the probability of air parcels arriving at the receptor site (white dot) for measured concentrations higher than the 75th percentile.
Warm period. Given the generally higher wind speeds recorded, in comparison to the cold season (average of 1.93 m s−1 vs. 1.36 m s−1 in the cold period), all OA factors show elevated concentrations coupled with higher wind speeds. The most striking result is the major influence of the ESE sector for all OA sources. However, this sector is upwind of Nicosia and, therefore, poorly influenced by local city emissions. As noted previously, for the cold period, long-range transported OA from the Middle East is expected to be the main driver to explain the influence of the ESE sector, at least for LO-OOA and MO-OOA (Fig. S16c, d). This is again confirmed by the PSCF results reported in Fig. 10b for the warm period. The HOA-1 factor still shows maxima for low wind speeds (< 5 km h−1) characteristic of local emissions and the SWS direction but also exhibits a significant contribution related to the ESE sector. Although the influence of the power plant PP5 on HOA-2 is expected, the contribution of this source cannot be excluded for HOA-1 as well. On the other hand, quantification of the Middle Eastern contribution to the HOA-2 factor remains to be assessed, since the current dataset cannot provide sufficient information on separating the contribution of power plants on the island versus more regional Middle East emissions (Fig. S16b). Although this hypothesis needs further investigation, the presence of HOA-2 in the Middle East would be consistent with recent findings, highlighting the importance of OC emissions from diesel generators used in Lebanon as a means of complementary power generation (Fadel et al., 2022).
In conclusion, based on the relative contribution of OA factors (Fig. 9) and the NWR analysis (Figs. S14, S16), it can be reasonably assumed that a significant amount of measured OA in Nicosia originates from long-range transport, with the Middle East being the major source region, during both cold and warm periods. This is the first time that such a high contribution of OA from the Middle East is highlighted over Cyprus. Assuming that biomass combustion and biogenic emissions of OA in the desert regions of the Middle East are relatively limited, these results suggest that most of the primary and secondary OA originating from the Middle East could be of fossil fuel origin, which is consistent with the previously reported extensive use of oil in this region.
3.7 Spatial and seasonal variability of BC sources
The above conclusion on the influence of primary and secondary OA sources from the Middle East region, and its strong fossil fuel origin, motivates a careful examination of the geographic origin and sources of BC concentrations recorded in Nicosia.
Baseline (i.e. lowest) BCff concentrations are typically observed in the middle of the night and in the middle of the day, when local emissions are at their minimum (See Fig. 4). As such, these background concentrations can be considered as a first qualitative indicator of background BCff concentrations of regional origin. Interestingly, these baseline BCff concentrations appear to be in phase with those of sulfate (Fig. 11), as well as the MO-OOA factor derived from the OA PMF analysis. This observation points to the possible use of MO-OOA as a tracer for regional BCff. Hence, it brings further evidence of the importance of regional emissions on carbonaceous aerosol concentrations in Nicosia.
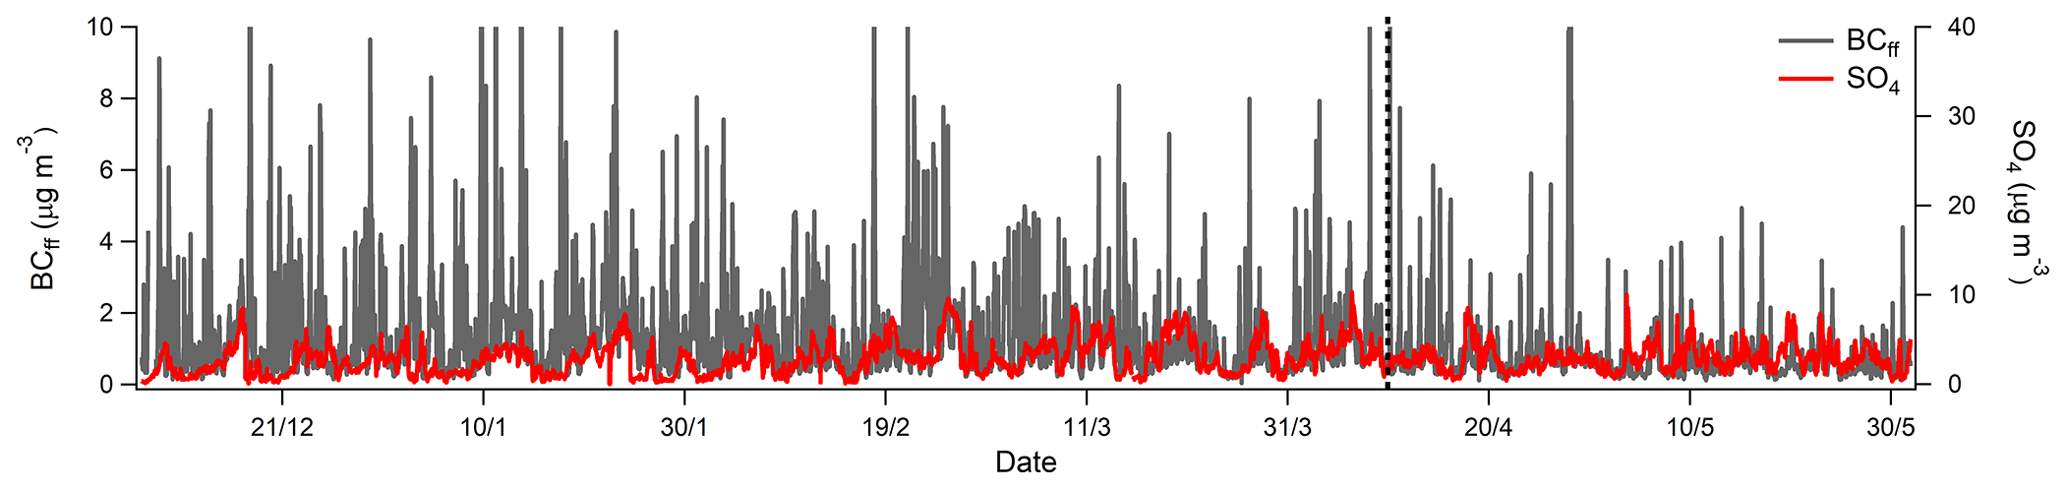
Figure 11Temporal variability of BCff and SO concentrations during the entire measuring period.
The assumption that transported regional pollution can affect BCff concentrations in Nicosia can be further supported by investigating the BCff NWR polar plots for both the cold and warm seasons (Fig. S18a, b). Elevated concentrations related to local emissions were observed for calm conditions with low wind speeds (< 5 km h−1) in the SW sector, as previously observed for HOA-1. Interestingly, BCff NWR plots show a distinct contribution at higher wind speeds (∼ 15 km h−1), and the NE–SE (Middle East) sector during both the cold and warm periods, with estimated concentrations of roughly 1.5 µg m−3, further supports the major role of the Middle East in the observed BC concentration levels in Nicosia (Fig. S18a, b).
BC source apportionment. In order to better assess the relative contributions of the multiple primary OA sources (HOA-1, HOA-2) and to quantify the contribution of long-range transport from the Middle East to BCff, a multilinear regression (MLR) model was tentatively performed using the principle of co-emission of BCff and organic species by the different sources (Chirico et al., 2010; Laborde et al., 2013). This approach, used recently by Poulain et al. (2021), assumes that at any given time (t), BCff mass concentration is the sum of BC from traffic (traced by HOA-1), from a mixed combustion source (traced by HOA-2), and from long-range transport (traced by MO-OOA), as follows:
with:
where a, b, and c are coefficients derived from the multi-linear regression model.
The above approach assumes that primary HOA-1 and HOA-2 can trace BCtraffic and BCmix combustion, respectively. This is expected for traffic with a typical HOA-1 BCtraffic ratio with little variations. For HOA-2, this assumption is valid for the fraction assumed to originate from power plant emissions and for some but not necessarily all of the cooking activities (e.g. when using charcoal combustion). As such, the uncertainties of this approach are expected to be higher for HOA-2 compared to HOA-1. The use of MO-OOA to trace the regional source of BC would probably lead to even higher uncertainties because MO-OOA is also sensitive to atmospheric photochemical processes and does integrate multiple sources. Nevertheless, this latter assumption is believed to be acceptable, given the good agreement reported above between baseline concentrations of BCff and MO-OOA (Fig. S19) and the above conclusions that carbonaceous aerosols originating from the Middle East are expected to be dominated by fossil fuel combustion. Note that MO-OOA was preferred here to LO-OOA to trace regional emissions due to the latter's somewhat more local character.
Combing Eqs. (2)–(5) provides the multilinear regression model with the free regression parameters a, b, and c, which are fitted to the time-resolved BCff mass concentration, measured by the aethalometer, and PMF results for the ACSM data:
Previous studies have shown that MLR models have enhanced explanatory power when primary emissions dominate (Laborde et al., 2013). To reduce this potential bias, the MLR model was applied distinctly for the two seasons separately.
During the cold period, a very good correlation between measured and modelled BCff was obtained (R2= 0.70, N= 2942), with the modelled BCff explaining 84 % of the measured one (Fig. S20a). The regression coefficients a (HOA-1), b (HOA-2), and c (MO-OOA) were found to be 1.11±0.03, 0.15±0.01, and 0.41±0.01, respectively. Regarding the warm period, it was not possible to obtain a positive value for b (HOA-2). A correlation between long-range transported HOA-2 and MO-OOA is, among others, a reason that can be proposed to explain why it has not been possible to extract a BCmix source factor here. Therefore, BCff was only apportioned using HOA-1 and MO-OOA. A good correlation between measured and modelled BCff was obtained (R2= 0.62, N= 1251), with the modelled BCff explaining 83 % of observations (Fig. S20b). The regression coefficients a (HOA-1) and c (MO-OOA) were found to be 3.05±0.07 and 0.19±0.01, respectively.
The combination of the aethalometer model (apportioning BCff and BCwb) and the MLR model (apportioning BCtraffic, BCmix source, and BCregional) was performed to obtain an integrated picture of BC sources in Nicosia for both periods (see Fig. 12).
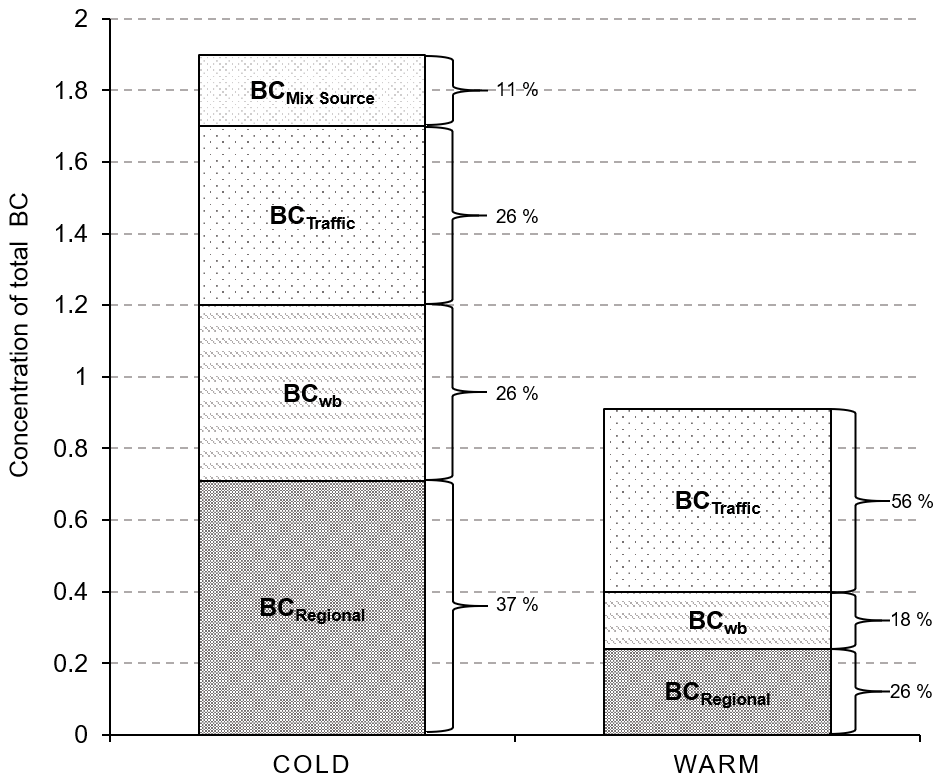
Spatial and seasonal variability of BC sources. During the cold period, BC was found to originate from four different sources, denoting the complexity of combustion sources of different origins in Nicosia. BCregional is the dominant source of BC (37 %), while traffic, wood burning, and mixed sources are estimated to contribute to 26 %, 26 %, and 11 % of BC, respectively. From the perspective of BCff sources, long-range transport, traced by MO-OOA, remains the largest source of BCff during the cold period, contributing 63 %, while BCff from local emissions constrained with HOA-1 and HOA-2 represents 24 % and 13 %, respectively (Fig. S21). In other words, more than half of BCff in Nicosia was found to be regional and probably originated from the Middle East during the cold period. This high contribution of regional BCff is quite unexpected for a medium-sized European city like Nicosia, where local traffic is likely to be the main contributor to BCff.
Nevertheless, extra caution should be taken here. The obtained contribution of 63 % for regional BCff should be seen as an upper limit, since a fraction of MO-OOA was shown to be of local origin during the cold period. During the warm period, the picture remains similar, with traffic and wood burning representing two-thirds of BC (56 % and 18 %). Here, regional BC contributed 26 % to total BC. From the perspective of BCff sources during the warm period, the long-range transport contributed 41 %, while BCff from local emissions constrained with HOA-1 represents 59 % (Fig S21). Although the two models (aethalometer and MLR) are associated with non-negligible uncertainties, the BC source apportionment obtained shows that local emissions cannot be considered only for BC, with a significant contribution of Middle East fossil fuel emissions demonstrated.
Near-real-time chemical composition of submicron aerosols and source apportionment of carbonaceous aerosols was performed for the first time in Nicosia, a medium-sized European capital city (ca. 250 000 inhabitants) in Cyprus, located in the eastern Mediterranean and surrounded by Middle East countries, with a fast-growing population and increasing emissions of air pollutants. Continuous observations were performed at an urban background site for approximately 6 months (between 7 December 2018 and 31 May 2019) in order to obtain a large and representative dataset capturing specific features – related to both the cold and warm periods – such as domestic heating and regional transport. Measurements of the major fractions of PM1 were carried out with a Q-ACSM and an aethalometer, complemented by a comprehensive suite of co-located instruments (e.g. filter sampling, SMPS) to assess the quality of the acquired data further.
Unlike many European cities, no clear PM1 pollution episodes of several consecutive days could be observed over Nicosia. However, very intense peaks (above 40 µg m−3, 1 h averages) were recorded systematically every evening during the cold period. Carbonaceous aerosols (BC and OA) were identified as the main components of these peaks and were mostly attributed to local emissions from heating, with little contribution from local meteorology (PBLH did not show significant diurnal variability during the cold period). Furthermore, a significant portion of PM1 was found to be related to long-range transported aerosol, while the influence of shipping emissions was estimated to be rather low (less than 8 %).
Source apportionment of OA has been used to derive a local biomass-burning OA (BBOAcy) mass spectrum in order to apportion the contribution of domestic wood burning properly. A total of five OA sources were identified during the cold period, among which four are typically reported within urban environments (HOA-1, BBOA, LO-OOA, MO-OOA). An additional one (HOA-2) was assigned as a mixture of several combustion sources, such as cooking, as well as a significant contribution from power plants located in the northern part of the island. These power plants, in addition, represent major island-based hotspots of NOx, as evidenced by satellite observations. Interestingly, a similar HOA-2 source was identified at our regional background site (40 km distance from Nicosia; Chen et al., 2022), pointing to a possible influence from these power plants to an extended part of the island. The impact of this specific source brings the OA contribution of primary sources up to 40 % over Nicosia during the cold period. Few additional features were noticed for the other OA sources with (1) a typical traffic-related (HOA-1) source observed during both seasons; (2) a biomass-burning source (BBOA) related to domestic heating, enhanced at night during the cold season and accounting for 12 % of the total OA; (3) a less-oxidized secondary (LO-OOA) source of a semi-volatile character, influenced by local nighttime chemistry, that was more oxidized (i.e. of a less local character) during the warm period; and (4) a secondary (MO-OOA) source mostly of regional origin but also influenced by nighttime chemistry during the cold period.
The geographic origin of each OA source was assessed for both seasons. Except for MO-OOA, which systematically shows a strong regional component, HOA-1, HOA-2, and LO-OOA exhibit a clear local origin during both seasons and a more pronounced influence from the eastern wind sector during the warm period. The prevalence of this sector is systematically observed for MO-OOA, highlighting the major role of Middle East emissions in contributing to almost half of OA concentrations in Nicosia during both cold and warm seasons.
To further elucidate the influence of this complex mixture of OA sources on BC levels, source apportionment of BC was performed by combining (i) the aethalometer model to separate BC into its fossil fuel (BCff) and wood burning components (BCwb) and (ii) a multi-linear regression model to apportion the contribution to BCff from traffic (constrained by HOA-1), mixed combustion sources from cooking and power plants (constrained by HOA-2), and long-range transport from the Middle East (constrained by MO-OOA). Although several assumptions and uncertainties are associated with this approach, it has shown to provide an interesting tool for reconstructing the BC concentrations derived experimentally. Such BC apportionment performed for both cold and warm seasons solidified the conclusions reached through the OA source apportionment, with almost half of BCff being of regional origin, with the Middle East playing an important role. This result is quite unexpected given that local traffic emissions are usually considered the dominant contributor to BCff in urban background environments. These conclusions have numerous implications related to PM regulation and the efficiency of local abatement strategies (in particular regarding traffic emissions), health (combustion aerosols being considered as particularly adverse for human health), and climate (major influence of light-absorbing aerosols from the Middle East fossil fuel emissions).
More accurate OA and BC source apportionment with (i) more co-located high-resolution measurements of specific trace metal and organic tracers, (ii) better-resolved OA mass spectra (e.g. from HR-ToF-AMS), (iii) the use of various source-specific mass spectra fingerprints (e.g. from cooking or power plants), and (iv) multi-site measurements (incl. both urban and regional background) will enable a more accurate estimation of local vs. regional fossil fuel emissions in Cyprus, while better constraining the current regional efforts on air quality modelling and forecasting.
All data used in this study can be accessed here: https://doi.org/10.5281/Zenodo.7802065 (Christodoulou, 2023). More details on the analyses are available upon request to the contact author, Aliki Christodoulou (a.christodoulou@cyi.ac.cy).
The supplement related to this article is available online at: https://doi.org/10.5194/acp-23-6431-2023-supplement.
AC, IS, MP, PG, KO, EB, JK, RSE, MI, and MR contributed to the acquisition of measurements. AC and IS contributed to the processing of the data. AC, IS, and JS wrote the paper. MV, NM, MD, SS, and MP contributed to the scientific review and improvement of the paper. All authors have read and agreed to the published version of the paper.
At the time of the research, Matic Ivančič and Martin Rigler were employed by the manufacturer of the aethalometer. The authors have no other conflicts of interest to declare.
Publisher’s note: Copernicus Publications remains neutral with regard to jurisdictional claims in published maps and institutional affiliations.
This paper contains modified Copernicus Sentinel data processed at IUP Bremen. The authors thank Andreas Richter for providing the TROPOMI/S5P level 1 and 2 products.
This study has been supported by the European Union's Horizon 2020 research and innovation programme under grant agreement no. 615 856612 (EMME-CARE) and by the Norwegian Financial Mechanism and the Republic of Cyprus under the ACCEPT project (CY-LOCALDEV-0008) in the framework of the programming period 2014–2021.
This paper was edited by Yves Balkanski and reviewed by two anonymous referees.
Achilleos, S., Evans, J. S., Yiallouros, P. K., Kleanthous, S., Schwartz, J., and Koutrakis, P.: PM10 concentration levels at an urban and background site in Cyprus: The impact of urban sources and dust storms, J. Air Waste Manage., 64, 1352–1360, https://doi.org/10.1080/10962247.2014.923061, 2014.
Achilleos, S., Wolfson, J. M., Ferguson, S. T., Kang, C. M., Hadjimitsis, D. G., Hadjicharalambous, M., Achilleos, C., Christodoulou, A., Nisanzti, A., Papoutsa, C., Themistocleous, K., Athanasatos, S., Perdikou, S., and Koutrakis, P.: Spatial variability of fine and coarse particle composition and sources in Cyprus, Atmos. Res., 169, 255–270, https://doi.org/10.1016/j.atmosres.2015.10.005, 2016.
Achilleos, S., Mouzourides, P., Kalivitis, N., Katra, I., Kloog, I., Kouis, P., Middleton, N., Mihalopoulos, N., Neophytou, M., Panayiotou, A., Papatheodorou, S., Savvides, C., Tymvios, F., Vasiliadou, E., Yiallouros, P., and Koutrakis, P.: Spatio-temporal variability of desert dust storms in Eastern Mediterranean (Crete, Cyprus, Israel) between 2006 and 2017 using a uniform methodology, Sci. Total Environ., 714, 136693, https://doi.org/10.1016/j.scitotenv.2020.136693, 2020.
Aiken, A. C., Decarlo, P. F., Kroll, J. H., Worsnop, D. R., Huffman, J. A., Docherty, K. S., Ulbrich, I. M., Mohr, C., Kimmel, J. R., Sueper, D., Sun, Y., Zhang, Q., Trimborn, A., Northway, M., Ziemann, P. J., Canagaratna, M. R., Onasch, T. B., Alfarra, M. R., Prevot, A. S. H., Dommen, J., Duplissy, J., Metzger, A., Baltensperger, U., and Jimenez, J. L.: O C and OM OC ratios of primary, secondary, and ambient organic aerosols with high-resolution time-of-flight aerosol mass spectrometry, Environ. Sci. Technol., 42, 4478–4485, https://doi.org/10.1021/es703009q, 2008.
Alfarra, M. R., Prevot, A. S. H., Szidat, S., Sandradewi, J., Weimer, S., Lanz, V. A., Schreiber, D., Mohr, M., and Baltensperger, U.: Identification of the mass spectral signature of organic aerosols from wood burning emissions, Environ. Sci. Technol., 41, 5770–5777, https://doi.org/10.1021/es062289b, 2007.
Baalbaki, R., Pikridas, M., Jokinen, T., Laurila, T., Dada, L., Bezantakos, S., Ahonen, L., Neitola, K., Maisser, A., Bimenyimana, E., Christodoulou, A., Unga, F., Savvides, C., Lehtipalo, K., Kangasluoma, J., Biskos, G., Petäjää, T., Kerminen, V.-M., Sciare, J., and Kulmala, M.: Towards understanding the characteristics of new particle formation in the Eastern Mediterranean, Atmos. Chem. Phys., 21, 9223–9251, https://doi.org/10.5194/acp-21-9223-2021, 2021.
Basart, S., Pérez, C., Cuevas, E., Baldasano, J. M., and Gobbi, G. P.: Aerosol characterization in Northern Africa, Northeastern Atlantic, Mediterranean Basin and Middle East from direct-sun AERONET observations, Atmos. Chem. Phys., 9, 8265–8282, https://doi.org/10.5194/acp-9-8265-2009, 2009.
Berger, A., Barbet, C., Leriche, M., Deguillaume, L., Mari, C., Bègue, N., Tulet, P., Gazen, D., Escobar, J., Berger, A., Barbet, C., Leriche, M., Deguillaume, L., and Mari, C.: Evaluation of Meso-NH and WRF/CHEM simulated gas and aerosol chemistry over Europe based on hourly observations, Atmos. Res., 176, 43–63, https://doi.org/10.1016/j.atmosres.2016.02.006, 2016.
Bimenyimana, E., Pikridas, M., Oikonomou, K., Iakovides, M., Christodoulou, A., Sciare, J., and Mihalopoulos, N.: Fine aerosol sources at an urban background site in the eastern Mediterranean (Nicosia; Cyprus): Insights from offline versus online source apportionment comparison for carbonaceous aerosols, Sci. Total Environ., 164741, https://doi.org/10.1016/j.scitotenv.2023.164741, in press, 2023.
Bougiatioti, A., Stavroulas, I., Kostenidou, E., Zarmpas, P., Theodosi, C., Kouvarakis, G., Canonaco, F., Prévôt, A. S. H., Nenes, A., Pandis, S. N., and Mihalopoulos, N.: Processing of biomass-burning aerosol in the eastern Mediterranean during summertime, Atmos. Chem. Phys., 14, 4793–4807, https://doi.org/10.5194/acp-14-4793-2014, 2014.
Bressi, M., Cavalli, F., Belis, C. A., Putaud, J.-P., Fröhlich, R., Martins dos Santos, S., Petralia, E., Prévôt, A. S. H., Berico, M., Malaguti, A., and Canonaco, F.: Variations in the chemical composition of the submicron aerosol and in the sources of the organic fraction at a regional background site of the Po Valley (Italy), Atmos. Chem. Phys., 16, 12875–12896, https://doi.org/10.5194/acp-16-12875-2016, 2016.
Bressi, M., Cavalli, F., Putaud, J. P., Fröhlich, R., Petit, J. E., Aas, W., Äijälä, M., Alastuey, A., Allan, J. D., Aurela, M., Berico, M., Bougiatioti, A., Bukowiecki, N., Canonaco, F., Crenn, V., Dusanter, S., Ehn, M., Elsasser, M., Flentje, H., Graf, P., Green, D. C., Heikkinen, L., Hermann, H., Holzinger, R., Hueglin, C., Keernik, H., Kiendler-Scharr, A., Kubelová, L., Lunder, C., Maasikmets, M., Makeš, O., Malaguti, A., Mihalopoulos, N., Nicolas, J. B., O'Dowd, C., Ovadnevaite, J., Petralia, E., Poulain, L., Priestman, M., Riffault, V., Ripoll, A., Schlag, P., Schwarz, J., Sciare, J., Slowik, J., Sosedova, Y., Stavroulas, I., Teinemaa, E., Via, M., Vodička, P., Williams, P. I., Wiedensohler, A., Young, D. E., Zhang, S., Favez, O., Minguillón, M. C., and Prevot, A. S. H.: A European aerosol phenomenology – 7: High-time resolution chemical characteristics of submicron particulate matter across Europe, Atmos. Environ. X, 10, 100108, https://doi.org/10.1016/j.aeaoa.2021.100108, 2021.
Brown, S. G., Lee, T., Roberts, P. T., and Collett, J. L.: Variations in the OM OC ratio of urban organic aerosol next to a major roadway, J. Air Waste Manage., 63, 1422–1433, https://doi.org/10.1080/10962247.2013.826602, 2013.
Canonaco, F., Crippa, M., Slowik, J. G., Baltensperger, U., and Prévôt, A. S. H.: SoFi, an IGOR-based interface for the efficient use of the generalized multilinear engine (ME-2) for the source apportionment: ME-2 application to aerosol mass spectrometer data, Atmos. Meas. Tech., 6, 3649–3661, https://doi.org/10.5194/amt-6-3649-2013, 2013.
Canonaco, F., Slowik, J. G., Baltensperger, U., and Prévôt, A. S. H.: Seasonal differences in oxygenated organic aerosol composition: implications for emissions sources and factor analysis, Atmos. Chem. Phys., 15, 6993–7002, https://doi.org/10.5194/acp-15-6993-2015, 2015.
Cavalli, F. and Putaud, J. P.: Toward a standardized thermal-optical protocol for measuring atmospheric organic and elemental carbon: The eusaar protocol, ACS, Div. Environ. Chem. – Prepr. Ext. Abstr., 48, 443–446, 2008.
Chazeau, B., Temime-Roussel, B., Gille, G., Mesbah, B., D'Anna, B., Wortham, H., and Marchand, N.: Measurement report: Fourteen months of real-time characterisation of the submicronic aerosol and its atmospheric dynamics at the Marseille–Longchamp supersite, Atmos. Chem. Phys., 21, 7293–7319, https://doi.org/10.5194/acp-21-7293-2021, 2021.
Chen, G., Sosedova, Y., Canonaco, F., Fröhlich, R., Tobler, A., Vlachou, A., Daellenbach, K. R., Bozzetti, C., Hueglin, C., Graf, P., Baltensperger, U., Slowik, J. G., El Haddad, I., and Prévôt, A. S. H.: Time-dependent source apportionment of submicron organic aerosol for a rural site in an alpine valley using a rolling positive matrix factorisation (PMF) window, Atmos. Chem. Phys., 21, 15081–15101, https://doi.org/10.5194/acp-21-15081-2021, 2021.
Chen, G., Canonaco, F., Tobler, A., Aas, W., Alastuey, A., Allan, J., Atabakhsh, S., Aurela, M., Baltensperger, U., Bougiatioti, A., De Brito, J. F., Ceburnis, D., Chazeau, B., Chebaicheb, H., Daellenbach, K. R., Ehn, M., El Haddad, I., Eleftheriadis, K., Favez, O., Flentje, H., Font, A., Fossum, K., Freney, E., Gini, M., Green, D. C., Heikkinen, L., Herrmann, H., Kalogridis, A. C., Keernik, H., Lhotka, R., Lin, C., Lunder, C., Maasikmets, M., Manousakas, M. I., Marchand, N., Marin, C., Marmureanu, L., Mihalopoulos, N., Moènik, G., Nêcki, J., O'Dowd, C., Ovadnevaite, J., Peter, T., Petit, J. E., Pikridas, M., Matthew Platt, S., Pokorná, P., Poulain, L., Priestman, M., Riffault, V., Rinaldi, M., Różański, K., Schwarz, J., Sciare, J., Simon, L., Skiba, A., Slowik, J. G., Sosedova, Y., Stavroulas, I., Styszko, K., Teinemaa, E., Timonen, H., Tremper, A., Vasilescu, J., Via, M., Vodièka, P., Wiedensohler, A., Zografou, O., Cruz Minguillón, M., and Prévôt, A. S. H.: European aerosol phenomenology – 8: Harmonised source apportionment of organic aerosol using 22 Year-long ACSM/AMS datasets, Environ. Int., 166, 107325, https://doi.org/10.1016/j.envint.2022.107325, 2022.
Chin, M., Diehl, T., Tan, Q., Prospero, J. M., Kahn, R. A., Remer, L. A., Yu, H., Sayer, A. M., Bian, H., Geogdzhayev, I. V., Holben, B. N., Howell, S. G., Huebert, B. J., Hsu, N. C., Kim, D., Kucsera, T. L., Levy, R. C., Mishchenko, M. I., Pan, X., Quinn, P. K., Schuster, G. L., Streets, D. G., Strode, S. A., Torres, O., and Zhao, X.-P.: Multi-decadal aerosol variations from 1980 to 2009: a perspective from observations and a global model, Atmos. Chem. Phys., 14, 3657–3690, https://doi.org/10.5194/acp-14-3657-2014, 2014.
Chirico, R., DeCarlo, P. F., Heringa, M. F., Tritscher, T., Richter, R., Prévôt, A. S. H., Dommen, J., Weingartner, E., Wehrle, G., Gysel, M., Laborde, M., and Baltensperger, U.: Impact of aftertreatment devices on primary emissions and secondary organic aerosol formation potential from in-use diesel vehicles: results from smog chamber experiments, Atmos. Chem. Phys., 10, 11545–11563, https://doi.org/10.5194/acp-10-11545-2010, 2010.
Christodoulou, A.: Ambient carbonaceous aerosol levels in Cyprus and the role of pollution transport from the Middle East, Zenodo [data set], https://doi.org/10.5281/zenodo.7802065, 2023.
Crenn, V., Sciare, J., Croteau, P. L., Verlhac, S., Fröhlich, R., Belis, C. A., Aas, W., Äijälä, M., Alastuey, A., Artiñano, B., Baisnée, D., Bonnaire, N., Bressi, M., Canagaratna, M., Canonaco, F., Carbone, C., Cavalli, F., Coz, E., Cubison, M. J., Esser-Gietl, J. K., Green, D. C., Gros, V., Heikkinen, L., Herrmann, H., Lunder, C., Minguillón, M. C., Močnik, G., O'Dowd, C. D., Ovadnevaite, J., Petit, J.-E., Petralia, E., Poulain, L., Priestman, M., Riffault, V., Ripoll, A., Sarda-Estève, R., Slowik, J. G., Setyan, A., Wiedensohler, A., Baltensperger, U., Prévôt, A. S. H., Jayne, J. T., and Favez, O.: ACTRIS ACSM intercomparison – Part 1: Reproducibility of concentration and fragment results from 13 individual Quadrupole Aerosol Chemical Speciation Monitors (Q-ACSM) and consistency with co-located instruments, Atmos. Meas. Tech., 8, 5063–5087, https://doi.org/10.5194/amt-8-5063-2015, 2015.
Crippa, M., Canonaco, F., Lanz, V. A., Äijälä, M., Allan, J. D., Carbone, S., Capes, G., Ceburnis, D., Dall'Osto, M., Day, D. A., DeCarlo, P. F., Ehn, M., Eriksson, A., Freney, E., Hildebrandt Ruiz, L., Hillamo, R., Jimenez, J. L., Junninen, H., Kiendler-Scharr, A., Kortelainen, A.-M., Kulmala, M., Laaksonen, A., Mensah, A. A., Mohr, C., Nemitz, E., O'Dowd, C., Ovadnevaite, J., Pandis, S. N., Petäjä, T., Poulain, L., Saarikoski, S., Sellegri, K., Swietlicki, E., Tiitta, P., Worsnop, D. R., Baltensperger, U., and Prévôt, A. S. H.: Organic aerosol components derived from 25 AMS data sets across Europe using a consistent ME-2 based source apportionment approach, Atmos. Chem. Phys., 14, 6159–6176, https://doi.org/10.5194/acp-14-6159-2014, 2014.
Crippa, M., Guizzardi, D., Muntean, M., Schaaf, E., Dentener, F., Van Aardenne, J. A., Monni, S., Doering, U., Olivier, J. G. J., Pagliari, V., and Janssens-Maenhout, G.: Gridded emissions of air pollutants for the period 1970–2012 within EDGAR v4.3.2, Earth Syst. Sci. Data, 10, 1987–2013, https://doi.org/10.5194/essd-10-1987-2018, 2018. Cubison, M. J., Ortega, A. M., Hayes, P. L., Farmer, D. K., Day, D., Lechner, M. J., Brune, W. H., Apel, E., Diskin, G. S., Fisher, J. A., Fuelberg, H. E., Hecobian, A., Knapp, D. J., Mikoviny, T., Riemer, D., Sachse, G. W., Sessions, W., Weber, R. J., Weinheimer, A. J., Wisthaler, A., and Jimenez, J. L.: Effects of aging on organic aerosol from open biomass burning smoke in aircraft and laboratory studies, Atmos. Chem. Phys., 11, 12049–12064, https://doi.org/10.5194/acp-11-12049-2011, 2011.
Cyprus' NECP 2021–2030: Cyprus' Integrated national energy and climate plan for the period 2021–2030, https://meci.gov.cy/en/useful-information/strategic-planning/cyprus-integrated-national-energy-and-climate-plan-for-the-period (last access: 7 June 2023), 2019.
Debevec, C., Sauvage, S., Gros, V., Sciare, J., Pikridas, M., Stavroulas, I., Salameh, T., Leonardis, T., Gaudion, V., Depelchin, L., Fronval, I., Sarda-Esteve, R., Baisnée, D., Bonsang, B., Savvides, C., Vrekoussis, M., and Locoge, N.: Origin and variability in volatile organic compounds observed at an Eastern Mediterranean background site (Cyprus), Atmos. Chem. Phys., 17, 11355–11388, https://doi.org/10.5194/acp-17-11355-2017, 2017.
Debevec, C., Sauvage, S., Gros, V., Sellegri, K., Sciare, J., Pikridas, M., Stavroulas, I., Leonardis, T., Gaudion, V., Depelchin, L., Fronval, I., Sarda-Esteve, R., Baisnée, D., Bonsang, B., Savvides, C., Vrekoussis, M., and Locoge, N.: Driving parameters of biogenic volatile organic compounds and consequences on new particle formation observed at an eastern Mediterranean background site, Atmos. Chem. Phys., 18, 14297–14325, https://doi.org/10.5194/acp-18-14297-2018, 2018.
Drinovec, L., Močnik, G., Zotter, P., Prévôt, A. S. H., Ruckstuhl, C., Coz, E., Rupakheti, M., Sciare, J., Müller, T., Wiedensohler, A., and Hansen, A. D. A.: The ”dual-spot” Aethalometer: an improved measurement of aerosol black carbon with real-time loading compensation, Atmos. Meas. Tech., 8, 1965–1979, https://doi.org/10.5194/amt-8-1965-2015, 2015.
Duan, J., Huang, R.-J., Li, Y., Chen, Q., Zheng, Y., Chen, Y., Lin, C., Ni, H., Wang, M., Ovadnevaite, J., Ceburnis, D., Chen, C., Worsnop, D. R., Hoffmann, T., O'Dowd, C., and Cao, J.: Summertime and wintertime atmospheric processes of secondary aerosol in Beijing, Atmos. Chem. Phys., 20, 3793–3807, https://doi.org/10.5194/acp-20-3793-2020, 2020.
EEA – European Environmental Agency: Air quality in Europe 2021, Report No. 15/2021, https://www.eea.europa.eu/publications/air-quality-in-europe-2021 (last access: 7 June 2023), 2021.
EU: Directive (EU) 2016/2284 of the European Parliament and of the Council of 14 December 2016 on the reduction of national emissions of certain atmospheric pollutants, amending Directive 2003/35/EC and repealing Directive 2001/81/EC, http://data.europa.eu/eli/dir/2016/2284/oj (last access: 7 June 2023), 2016.
Eyring, V., Köhler, H. W., Van Aardenne, J., and Lauer, A.: Emissions from international shipping: 1. The last 50 years, J. Geophys. Res.-Atmos., 110, 171–182, https://doi.org/10.1029/2004JD005619, 2005.
Fadel, M., Ledoux, F., Seigneur, M., Oikonomou, K., Sciare, J., Courcot, D., and Afif, C.: Chemical profiles of PM2.5 emitted from various anthropogenic sources of the Eastern Mediterranean: Cooking, wood burning, and diesel generators, Environ. Res., 211, 113032, https://doi.org/10.1016/j.envres.2022.113032, 2022.
Florou, K., Papanastasiou, D. K., Pikridas, M., Kaltsonoudis, C., Louvaris, E., Gkatzelis, G. I., Patoulias, D., Mihalopoulos, N., and Pandis, S. N.: The contribution of wood burning and other pollution sources to wintertime organic aerosol levels in two Greek cities, Atmos. Chem. Phys., 17, 3145–3163, https://doi.org/10.5194/acp-17-3145-2017, 2017.
Foret, G., Michoud, V., Kotthaus, S., Petit, J.-E., Baudic, A., Siour, G., Kim, Y., Doussin, J.-F., Dupont, J.-C., Formenti, P., Gaimoz, C., Ghersi, V., Gratien, A., Gros, V., Jaffrezo, J.-L., Haeffelin, M., Kreitz, M., Ravetta, F., Sartelet, K., Simon, L., Té, Y., Uzu, G., Zhang, S., Favez, O., and Beekmann, M.: The December 2016 extreme weather and particulate matter pollution episode in the Paris region (France), Atmos. Environ., 291, 119386, https://doi.org/10.1016/j.atmosenv.2022.119386, 2022.
Fourtziou, L., Liakakou, E., Stavroulas, I., Theodosi, C., Zarmpas, P., Psiloglou, B., Sciare, J., Maggos, T., Bairachtari, K., Bougiatioti, A., Gerasopoulos, E., Sarda-Estève, R., Bonnaire, N., and Mihalopoulos, N.: Multi-tracer approach to characterize domestic wood burning in Athens (Greece) during wintertime, Atmos. Environ., 148, 89–101, https://doi.org/10.1016/j.atmosenv.2016.10.011, 2017.
Freutel, F., Schneider, J., Drewnick, F., von der Weiden-Reinmüller, S.-L., Crippa, M., Prévôt, A. S. H., Baltensperger, U., Poulain, L., Wiedensohler, A., Sciare, J., Sarda-Estève, R., Burkhart, J. F., Eckhardt, S., Stohl, A., Gros, V., Colomb, A., Michoud, V., Doussin, J. F., Borbon, A., Haeffelin, M., Morille, Y., Beekmann, M., and Borrmann, S.: Aerosol particle measurements at three stationary sites in the megacity of Paris during summer 2009: meteorology and air mass origin dominate aerosol particle composition and size distribution, Atmos. Chem. Phys., 13, 933–959, https://doi.org/10.5194/acp-13-933-2013, 2013.
Giannadaki, D., Pozzer, A., and Lelieveld, J.: Modeled global effects of airborne desert dust on air quality and premature mortality, Atmos. Chem. Phys., 14, 957–968, https://doi.org/10.5194/acp-14-957-2014, 2014.
Giannakis, E., Kushta, J., Bruggeman, A., and Lelieveld, J.: Costs and benefits of agricultural ammonia emission abatement options for compliance with European air quality regulations, Environ. Sci. Eur., 31, 1–13, https://doi.org/10.1186/s12302-019-0275-0, 2019.
Gilardoni, S., Massoli, P., Paglione, M., Giulianelli, L., Carbone, C., Rinaldi, M., Decesari, S., Sandrini, S., Costabile, F., Gobbi, G. P., Pietrogrande, M. C., Visentin, M., Scotto, F., Fuzzi, S., and Facchini, M. C.: Direct observation of aqueous secondary organic aerosol from biomass-burning emissions, P. Natl. Acad. Sci. USA, 113, 10013–10018, https://doi.org/10.1073/pnas.1602212113, 2016.
Gunthe, S. S., Liu, P., Panda, U., Raj, S. S., Sharma, A., Darbyshire, E., Reyes-Villegas, E., Allan, J., Chen, Y., Wang, X., Song, S., Pöhlker, M. L., Shi, L., Wang, Y., Kommula, S. M., Liu, T., Ravikrishna, R., McFiggans, G., Mickley, L. J., Martin, S. T., Pöschl, U., Andreae, M. O., and Coe, H.: Enhanced aerosol particle growth sustained by high continental chlorine emission in India, Nat. Geosci., 14, 77–84, https://doi.org/10.1038/s41561-020-00677-x, 2021.
Guo, H., Liu, J., Froyd, K. D., Roberts, J. M., Veres, P. R., Hayes, P. L., Jimenez, J. L., Nenes, A., and Weber, R. J.: Fine particle pH and gas–particle phase partitioning of inorganic species in Pasadena, California, during the 2010 CalNex campaign, Atmos. Chem. Phys., 17, 5703–5719, https://doi.org/10.5194/acp-17-5703-2017, 2017.
Huang, R.-J., Wang, Y., Cao, J., Lin, C., Duan, J., Chen, Q., Li, Y., Gu, Y., Yan, J., Xu, W., Fröhlich, R., Canonaco, F., Bozzetti, C., Ovadnevaite, J., Ceburnis, D., Canagaratna, M. R., Jayne, J., Worsnop, D. R., El-Haddad, I., Prévôt, A. S. H., and O'Dowd, C. D.: Primary emissions versus secondary formation of fine particulate matter in the most polluted city (Shijiazhuang) in North China, Atmos. Chem. Phys., 19, 2283–2298, https://doi.org/10.5194/acp-19-2283-2019, 2019.
Jayne, J. T., Leard, D. C., Zhang, X., Davidovits, P., Smith, K. A., Kolb, C. E., and Worsnop, D. R.: Development of an aerosol mass spectrometer for size and composition analysis of submicron particles, Aerosol Sci. Tech., 33, 49–70, https://doi.org/10.1080/027868200410840, 2000.
Jiang, J., Aksoyoglu, S., El-Haddad, I., Ciarelli, G., Denier van der Gon, H. A. C., Canonaco, F., Gilardoni, S., Paglione, M., Minguillón, M. C., Favez, O., Zhang, Y., Marchand, N., Hao, L., Virtanen, A., Florou, K., O'Dowd, C., Ovadnevaite, J., Baltensperger, U., and Prévôt, A. S. H.: Sources of organic aerosols in Europe: a modeling study using CAMx with modified volatility basis set scheme, Atmos. Chem. Phys., 19, 15247–15270, https://doi.org/10.5194/acp-19-15247-2019, 2019.
Jorga, S. D., Florou, K., Kaltsonoudis, C., Kodros, J. K., Vasilakopoulou, C., Cirtog, M., Fouqueau, A., Picquet-Varrault, B., Nenes, A., and Pandis, S. N.: Nighttime chemistry of biomass burning emissions in urban areas: A dual mobile chamber study, Atmos. Chem. Phys., 21, 15337–15349, https://doi.org/10.5194/acp-21-15337-2021, 2021.
Kadygrov, N., Broquet, G., Chevallier, F., Rivier, L., Gerbig, C., and Ciais, P.: On the potential of the ICOS atmospheric CO2 measurement network for estimating the biogenic CO2 budget of Europe, Atmos. Chem. Phys., 15, 12765–12787, https://doi.org/10.5194/acp-15-12765-2015, 2015.
Kaltsonoudis, C., Kostenidou, E., Louvaris, E., Psichoudaki, M., Tsiligiannis, E., Florou, K., Liangou, A., and Pandis, S. N.: Characterization of fresh and aged organic aerosol emissions from meat charbroiling, Atmos. Chem. Phys., 17, 7143–7155, https://doi.org/10.5194/acp-17-7143-2017, 2017.
Kleanthous, S., Vrekoussis, M., Mihalopoulos, N., Kalabokas, P., and Lelieveld, J.: On the temporal and spatial variation of ozone in Cyprus, Sci. Total Environ., 476–477, 677–687, https://doi.org/10.1016/j.scitotenv.2013.12.101, 2014.
Kodros, J. K., Papanastasiou, D. K., Paglione, M., Masiol, M., Squizzato, S., Florou, K., Skyllakou, K., Kaltsonoudis, C., Nenes, A., and Pandis, S. N.: Rapid dark aging of biomass burning as an overlooked source of oxidized organic aerosol, P. Natl. Acad. Sci. USA, 117, 33028–33033, https://doi.org/10.1073/PNAS.2010365117, 2020.
Kostenidou, E., Florou, K., Kaltsonoudis, C., Tsiflikiotou, M., Vratolis, S., Eleftheriadis, K., and Pandis, S. N.: Sources and chemical characterization of organic aerosol during the summer in the eastern Mediterranean, Atmos. Chem. Phys., 15, 11355–11371, https://doi.org/10.5194/acp-15-11355-2015, 2015.
Kushta, J., Georgiou, G. K., Proestos, Y., Christoudias, T., and Lelieveld, J.: Modelling study of the atmospheric composition over Cyprus, Atmos. Pollut. Res., 9, 257–269, https://doi.org/10.1016/j.apr.2017.09.007, 2018.
Laborde, M., Crippa, M., Tritscher, T., Jurányi, Z., Decarlo, P. F., Temime-Roussel, B., Marchand, N., Eckhardt, S., Stohl, A., Baltensperger, U., Prévôt, A. S. H., Weingartner, E., and Gysel, M.: Black carbon physical properties and mixing state in the European megacity Paris, Atmos. Chem. Phys., 13, 5831–5856, https://doi.org/10.5194/acp-13-5831-2013, 2013.
Lanz, V. A., Prévôt, A. S. H., Alfarra, M. R., Weimer, S., Mohr, C., DeCarlo, P. F., Gianini, M. F. D., Hueglin, C., Schneider, J., Favez, O., D'Anna, B., George, C., and Baltensperger, U.: Characterization of aerosol chemical composition with aerosol mass spectrometry in Central Europe: an overview, Atmos. Chem. Phys., 10, 10453–10471, https://doi.org/10.5194/acp-10-10453-2010, 2010.
Lee, B. H., Kostenidou, E., Hildebrandt, L., Riipinen, I., Engelhart, G. J., Mohr, C., DeCarlo, P. F., Mihalopoulos, N., Prevot, A. S. H., Baltensperger, U., and Pandis, S. N.: Measurement of the ambient organic aerosol volatility distribution: application during the Finokalia Aerosol Measurement Experiment (FAME-2008), Atmos. Chem. Phys., 10, 12149–12160, https://doi.org/10.5194/acp-10-12149-2010, 2010.
Lelieveld, J., Barlas, C., Giannadaki, D., and Pozzer, A.: Model calculated global, regional and megacity premature mortality due to air pollution, Atmos. Chem. Phys., 13, 7023–7037, https://doi.org/10.5194/acp-13-7023-2013, 2013.
Lelieveld, J., Hadjinicolaou, P., Kostopoulou, E., Giannakopoulos, C., Pozzer, A., Tanarhte, M., and Tyrlis, E.: Model projected heat extremes and air pollution in the eastern Mediterranean and Middle East in the twenty-first century, Reg. Environ. Chang., 14, 1937–1949, https://doi.org/10.1007/s10113-013-0444-4, 2014.
Lelieveld, J., Beirle, S., Hörmann, C., Stenchikov, G., and Wagner, T.: Abrupt recent trend changes in atmospheric nitrogen dioxide over the Middle East, Sci. Adv., 1, 1–6, https://doi.org/10.1126/sciadv.1500498, 2015a.
Lelieveld, J., Evans, J. S., Fnais, M., Giannadaki, D., and Pozzer, A.: The contribution of outdoor air pollution sources to premature mortality on a global scale, Nature, 525, 367–371, https://doi.org/10.1038/nature15371, 2015b.
Lin, C., Ceburnis, D., O'Dowd, C., and Ovadnevaite, J.: Seasonality of Aerosol Sources Calls for Distinct Air Quality Mitigation Strategies, Toxics, 10, 121, https://doi.org/10.3390/toxics10030121, 2022.
Lindinger, W., Hansel, A., and Jordan, A.: Proton-transfer-reaction mass spectrometry (PTR-MS): On-line monitoring of volatile organic compounds at pptv levels, Chem. Soc. Rev., 27, 347–354, https://doi.org/10.1039/a827347z, 1998.
Liu, X., Zheng, M., Liu, Y., Jin, Y., Liu, J., Zhang, B., Yang, X., Wu, Y., Zhang, T., Xiang, Y., Liu, B., and Yan, C.: Intercomparison of equivalent black carbon (eBC) and elemental carbon (EC) concentrations with three-year continuous measurement in Beijing, China, Environ. Res., 209, 112791, https://doi.org/10.1016/j.envres.2022.112791, 2022.
Marmer, E., Dentener, F., Aardenne, J. v., Cavalli, F., Vignati, E., Velchev, K., Hjorth, J., Boersma, F., Vinken, G., Mihalopoulos, N., and Raes, F.: What can we learn about ship emission inventories from measurements of air pollutants over the Mediterranean Sea?, Atmos. Chem. Phys., 9, 6815–6831, https://doi.org/10.5194/acp-9-6815-2009, 2009.
McLinden, C. A., Fioletov, V., Shephard, M. W., Krotkov, N., Li, C., Martin, R. V., Moran, M. D., and Joiner, J.: Space-based detection of missing sulfur dioxide sources of global air pollution, Nat. Geosci., 9, 496–500, https://doi.org/10.1038/ngeo2724, 2016.
Michaelides, S., Karacostas, T., Sánchez, J. L., Retalis, A., Pytharoulis, I., Homar, V., Romero, R., Zanis, P., Giannakopoulos, C., Bühl, J., Ansmann, A., Merino, A., Melcón, P., Lagouvardos, K., Kotroni, V., Bruggeman, A., López-Moreno, J. I., Berthet, C., Katragkou, E., Tymvios, F., Hadjimitsis, D. G., Mamouri, R. E., and Nisantzi, A.: Reviews and perspectives of high impact atmospheric processes in the Mediterranean, Atmos. Res., 208, 4–44, https://doi.org/10.1016/j.atmosres.2017.11.022, 2018.
Middlebrook, A. M., Bahreini, R., Jimenez, J. L., and Canagaratna, M. R.: Evaluation of composition-dependent collection efficiencies for the Aerodyne aerosol mass spectrometer using field data, Aerosol Sci. Tech., 46, 258–271, https://doi.org/10.1080/02786826.2011.620041, 2012.
Middleton, N., Yiallouros, P., Kleanthous, S., Kolokotroni, O., Schwartz, J., Dockery, D. W., Demokritou, P., and Koutrakis, P.: A 10-year time-series analysis of respiratory and cardiovascular morbidity in Nicosia, Cyprus: The effect of short-term changes in air pollution and dust storms, Environ. Health-Glob., 7, 1–16, https://doi.org/10.1186/1476-069X-7-39, 2008.
Mohr, C., DeCarlo, P. F., Heringa, M. F., Chirico, R., Slowik, J. G., Richter, R., Reche, C., Alastuey, A., Querol, X., Seco, R., Peñuelas, J., Jiménez, J. L., Crippa, M., Zimmermann, R., Baltensperger, U., and Prévôt, A. S. H.: Identification and quantification of organic aerosol from cooking and other sources in Barcelona using aerosol mass spectrometer data, Atmos. Chem. Phys., 12, 1649–1665, https://doi.org/10.5194/acp-12-1649-2012, 2012.
Mouzourides, P., Kumar, P., and Neophytou, M. K. A.: Assessment of long-term measurements of particulate matter and gaseous pollutants in South-East Mediterranean, Atmos. Environ., 107, 148–165, https://doi.org/10.1016/j.atmosenv.2015.02.031, 2015.
Neophytou, A. M., Yiallouros, P., Coull, B. A., Kleanthous, S., Pavlou, P., Pashiardis, S., Dockery, D. W., Koutrakis, P., and Laden, F.: Particulate matter concentrations during desert dust outbreaks and daily mortality in Nicosia, Cyprus, J. Expo. Sci. Env. Epid., 23, 275–280, https://doi.org/10.1038/jes.2013.10, 2013.
Ng, N. L., Canagaratna, M. R., Jimenez, J. L., Zhang, Q., Ulbrich, I. M., and Worsnop, D. R.: Real-time methods for estimating organic component mass concentrations from aerosol mass spectrometer data, Environ. Sci. Technol., 45, 910–916, https://doi.org/10.1021/es102951k, 2011.
Olivier, J. G. J., Van Aardenne, J. A., Dentener, F. J., Pagliari, V., Ganzeveld, L. N., and Peters, J. A. H. W.: Recent trends in global greenhouse gas emissions:regional trends 1970–2000 and spatial distributionof key sources in 2000, Environ. Sci., 2, 81–99, https://doi.org/10.1080/15693430500400345, 2005.
Osipov, S., Chowdhury, S., Crowley, J. N., Tadic, I., Drewnick, F., Borrmann, S., Eger, P., Fachinger, F., Fischer, H., Predybaylo, E., Fnais, M., Harder, H., Pikridas, M., Vouterakos, P., Pozzer, A., Sciare, J., Ukhov, A., Stenchikov, G. L., Williams, J., and Lelieveld, J.: Severe atmospheric pollution in the Middle East is attributable to anthropogenic sources, Commun. Earth Environ., 3, 1–10, https://doi.org/10.1038/s43247-022-00514-6, 2022.
Paatero, P.: The Multilinear Engine – A Table-Driven, Least Squares Program for Solving Multilinear Problems, Including the n-Way Parallel Factor Analysis Model, J. Comput. Graph. Stat., 8, 854–888, https://doi.org/10.1080/10618600.1999.10474853, 1999.
Paatero, P. and Hopke, P. K.: Discarding or downweighting high-noise variables in factor analytic models, Anal. Chim. Acta, 490, 277–289, https://doi.org/10.1016/S0003-2670(02)01643-4, 2003.
Paatero, P. and Hopke, P. K.: Rotational tools for factor analytic models, J. Chemometr., 23, 91–100, https://doi.org/10.1002/cem.1197, 2009.
Paris, J.-D., Riandet, A., Bourtsoukidis, E., Delmotte, M., Berchet, A., Williams, J., Ernle, L., Tadic, I., Harder, H., and Lelieveld, J.: Shipborne measurements of methane and carbon dioxide in the Middle East and Mediterranean areas and the contribution from oil and gas emissions, Atmos. Chem. Phys., 21, 12443–12462, https://doi.org/10.5194/acp-21-12443-2021, 2021.
Petit, J.-E., Favez, O., Sciare, J., Crenn, V., Sarda-Estève, R., Bonnaire, N., Močnik, G., Dupont, J.-C., Haeffelin, M., and Leoz-Garziandia, E.: Two years of near real-time chemical composition of submicron aerosols in the region of Paris using an Aerosol Chemical Speciation Monitor (ACSM) and a multi-wavelength Aethalometer, Atmos. Chem. Phys., 15, 2985–3005, https://doi.org/10.5194/acp-15-2985-2015, 2015.
Petit, J. E., Favez, O., Albinet, A., and Canonaco, F.: A user-friendly tool for comprehensive evaluation of the geographical origins of atmospheric pollution: Wind and trajectory analyses, Environ. Modell. Softw., 88, 183–187, https://doi.org/10.1016/j.envsoft.2016.11.022, 2017.
Pey, J., Querol, X., Alastuey, A., Forastiere, F., and Stafoggia, M.: African dust outbreaks over the Mediterranean Basin during 2001–2011: PM10 concentrations, phenomenology and trends, and its relation with synoptic and mesoscale meteorology, Atmos. Chem. Phys., 13, 1395–1410, https://doi.org/10.5194/acp-13-1395-2013, 2013.
Pikridas, M., Vrekoussis, M., Sciare, J., Kleanthous, S., Vasiliadou, E., Kizas, C., Savvides, C., and Mihalopoulos, N.: Spatial and temporal (short and long-term) variability of submicron, fine and sub-10 µm particulate matter (PM1, PM2.5, PM10) in Cyprus, Atmos. Environ., 191, 79–93, https://doi.org/10.1016/j.atmosenv.2018.07.048, 2018.
Poulain, L., Fahlbusch, B., Spindler, G., Müller, K., van Pinxteren, D., Wu, Z., Iinuma, Y., Birmili, W., Wiedensohler, A., and Herrmann, H.: Source apportionment and impact of long-range transport on carbonaceous aerosol particles in central Germany during HCCT-2010, Atmos. Chem. Phys., 21, 3667–3684, https://doi.org/10.5194/acp-21-3667-2021, 2021.
Pozzer, A., Zimmermann, P., Doering, U. M., van Aardenne, J., Tost, H., Dentener, F., Janssens-Maenhout, G., and Lelieveld, J.: Effects of business-as-usual anthropogenic emissions on air quality, Atmos. Chem. Phys., 12, 6915–6937, https://doi.org/10.5194/acp-12-6915-2012, 2012.
Putaud, J. P., Raes, F., Van Dingenen, R., Brüggemann, E., Facchini, M. C., Decesari, S., Fuzzi, S., Gehrig, R., Hüglin, C., Laj, P., Lorbeer, G., Maenhaut, W., Mihalopoulos, N., Müller, K., Querol, X., Rodriguez, S., Schneider, J., Spindler, G., Ten Brink, H., Tørseth, K., and Wiedensohler, A.: A European aerosol phenomenology - 2: Chemical characteristics of particulate matter at kerbside, urban, rural and background sites in Europe, Atmos. Environ., 38, 2579–2595, https://doi.org/10.1016/j.atmosenv.2004.01.041, 2004.
Querol, X., Pey, J., Pandolfi, M., Alastuey, A., Cusack, M., Pérez, N., Moreno, T., Viana, M., Mihalopoulos, N., Kallos, G., and Kleanthous, S.: African dust contributions to mean ambient PM10 mass-levels across the Mediterranean Basin, Atmos. Environ., 43, 4266–4277, https://doi.org/10.1016/j.atmosenv.2009.06.013, 2009.
Rattanavaraha, W., Canagaratna, M. R., Budisulistiorini, S. H., Croteau, P. L., Baumann, K., Canonaco, F., Prevot, A. S. H., Edgerton, E. S., Zhang, Z., Jayne, J. T., Worsnop, D. R., Gold, A., Shaw, S. L., and Surratt, J. D.: Source apportionment of submicron organic aerosol collected from Atlanta, Georgia, during 2014–2015 using the aerosol chemical speciation monitor (ACSM), Atmos. Environ., 167, 389–402, https://doi.org/10.1016/j.atmosenv.2017.07.055, 2017.
Ricaud, P., Zbinden, R., Catoire, V., Brocchi, V., Dulac, F., Hamonou, E., Canonici, J. C., El Amraoui, L., Massart, S., Piguet, B., Dayan, U., Nabat, P., Sciare, J., Ramonet, M., Delmotte, M., Di Sarra, A., Sferlazzo, D., Di Iorio, T., Piacentino, S., Cristofanelli, P., Mihalopoulos, N., Kouvarakis, G., Pikridas, M., Savvides, C., Mamouri, R. E., Nisantzi, A., Hadjimitsis, D., Attié, J. L., Ferré, H., Kangah, Y., Jaidan, N., Guth, J., Jacquet, P., Chevrier, S., Robert, C., Bourdon, A., Bourdinot, J. F., Etienne, J. C., Krysztofiak, G., and Theron, P.: The GLAM airborne campaign across the Mediterranean Basin, B. Am. Meteorol. Soc., 99, 361–380, https://doi.org/10.1175/BAMS-D-16-0226.1, 2018.
Rigler, M., Drinovec, L., Lavrič, G., Vlachou, A., Prévôt, A. S. H., Jaffrezo, J. L., Stavroulas, I., Sciare, J., Burger, J., Kranjc, I., Turšič, J., Hansen, A. D. A., and Močnik, G.: The new instrument using a TC–BC (total carbon–black carbon) method for the online measurement of carbonaceous aerosols, Atmos. Meas. Tech., 13, 4333–4351, https://doi.org/10.5194/amt-13-4333-2020, 2020.
Sandradewi, J., Prévôt, A. S. H., Szidat, S., Perron, N., Alfarra, M. R., Lanz, V. A., Weingartner, E., and Baltensperger, U. R. S.: Using aerosol light abosrption measurements for the quantitative determination of wood burning and traffic emission contribution to particulate matter, Environ. Sci. Technol., 42, 3316–3323, https://doi.org/10.1021/es702253m, 2008.
Sciare, J., Bardouki, H., Moulin, C., and Mihalopoulos, N.: Aerosol sources and their contribution to the chemical composition of aerosols in the Eastern Mediterranean Sea during summertime, Atmos. Chem. Phys., 3, 291–302, https://doi.org/10.5194/acp-3-291-2003, 2003.
Sciare, J., d'Argouges, O., Zhang, Q. J., Sarda-Estève, R., Gaimoz, C., Gros, V., Beekmann, M., and Sanchez, O.: Comparison between simulated and observed chemical composition of fine aerosols in Paris (France) during springtime: contribution of regional versus continental emissions, Atmos. Chem. Phys., 10, 11987–12004, https://doi.org/10.5194/acp-10-11987-2010, 2010.
Siouti, E., Skyllakou, K., Kioutsioukis, I., Ciarelli, G., and Pandis, S. N.: Simulation of the cooking organic aerosol concentration variability in an urban area, Atmos. Environ., 265, 118710, https://doi.org/10.1016/j.atmosenv.2021.118710, 2021.
Smith, S. J., van Aardenne, J., Klimont, Z., Andres, R. J., Volke, A., and Delgado Arias, S.: Anthropogenic sulfur dioxide emissions: 1850–2005, Atmos. Chem. Phys., 11, 1101–1116, https://doi.org/10.5194/acp-11-1101-2011, 2011.
Stavroulas, I., Bougiatioti, A., Grivas, G., Paraskevopoulou, D., Tsagkaraki, M., Zarmpas, P., Liakakou, E., Gerasopoulos, E., and Mihalopoulos, N.: Sources and processes that control the submicron organic aerosol composition in an urban Mediterranean environment (Athens): a high temporal-resolution chemical composition measurement study, Atmos. Chem. Phys., 19, 901–919, https://doi.org/10.5194/acp-19-901-2019, 2019.
Stavroulas, I., Grivas, G., Liakakou, E., Kalkavouras, P., Bougiatioti, A., Kaskaoutis, D. G., Lianou, M., Papoutsidaki, K., Tsagkaraki, M., Zarmpas, P., Gerasopoulos, E., and Mihalopoulos, N.: Online chemical characterization and sources of submicron aerosol in the major mediterranean port city of piraeus, greece, Atmosphere-Basel, 12, 1–28, https://doi.org/10.3390/atmos12121686, 2021.
Stein, A. F., Draxler, R. R., Rolph, G. D., Stunder, B. J. B., Cohen, M. D., and Ngan, F.: Noaa's hysplit atmospheric transport and dispersion modeling system, B. Am. Meteorol. Soc., 96, 2059–2077, https://doi.org/10.1175/BAMS-D-14-00110.1, 2015.
Sun, C., Lee, B. P., Huang, D., Jie Li, Y., Schurman, M. I., Louie, P. K. K., Luk, C., and Chan, C. K.: Continuous measurements at the urban roadside in an Asian megacity by Aerosol Chemical Speciation Monitor (ACSM): particulate matter characteristics during fall and winter seasons in Hong Kong, Atmos. Chem. Phys., 16, 1713–1728, https://doi.org/10.5194/acp-16-1713-2016, 2016.
Terink, W., Immerzeel, W. W., and Droogers, P.: Climate change projections of precipitation and reference evapotranspiration for the Middle East and Northern Africa until 2050, Int. J. Climatol., 33, 3055–3072, https://doi.org/10.1002/joc.3650, 2013.
Theodosi, C., Grivas, G., Zarmpas, P., Chaloulakou, A., and Mihalopoulos, N.: Mass and chemical composition of size-segregated aerosols (PM1, PM2.5, PM10) over Athens, Greece: local versus regional sources, Atmos. Chem. Phys., 11, 11895–11911, https://doi.org/10.5194/acp-11-11895-2011, 2011.
Theodosi, C., Tsagkaraki, M., Zarmpas, P., Grivas, G., Liakakou, E., Paraskevopoulou, D., Lianou, M., Gerasopoulos, E., and Mihalopoulos, N.: Multi-year chemical composition of the fine-aerosol fraction in Athens, Greece, with emphasis on the contribution of residential heating in wintertime, Atmos. Chem. Phys., 18, 14371–14391, https://doi.org/10.5194/acp-18-14371-2018, 2018.
Trubetskaya, A., Lin, C., Ovadnevaite, J., Ceburnis, D., O'Dowd, C., Leahy, J. J., Monaghan, R. F. D., Johnson, R., Layden, P., and Smith, W.: Study of Emissions from Domestic Solid-Fuel Stove Combustion in Ireland, Energy and Fuels, 35, 4966–4978, https://doi.org/10.1021/acs.energyfuels.0c04148, 2021.
Tsangari, H., Paschalidou, A. K., Kassomenos, A. P., Vardoulakis, S., Heaviside, C., Georgiou, K. E., and Yamasaki, E. N.: Extreme weather and air pollution effects on cardiovascular and respiratory hospital admissions in Cyprus, Sci. Total Environ., 542, 247–253, https://doi.org/10.1016/j.scitotenv.2015.10.106, 2016.
Tuccella, P., Curci, G., Visconti, G., Bessagnet, B., Menut, L., and Park, R. J.: Modeling of gas and aerosol with WRF/Chem over Europe: Evaluation and sensitivity study, J. Geophys. Res.-Atmos., 117, D03303, https://doi.org/10.1029/2011JD016302, 2012.
Ulbrich, I. M., Canagaratna, M. R., Zhang, Q., Worsnop, D. R., and Jimenez, J. L.: Interpretation of organic components from Positive Matrix Factorization of aerosol mass spectrometric data, Atmos. Chem. Phys., 9, 2891–2918, https://doi.org/10.5194/acp-9-2891-2009, 2009.
UN Security Council: Resolution 550, (last access: 4 June 2023), 1984.
Vestreng, V., Myhre, G., Fagerli, H., Reis, S., and Tarrasón, L.: Twenty-five years of continuous sulphur dioxide emission reduction in Europe. Atmos. Chem. Phys., 7, 3663–3681, https://doi.org/10.5194/acp-7-3663-2007, 2007.
Via, M., Minguillón, M. C., Reche, C., Querol, X., and Alastuey, A.: Increase in secondary organic aerosol in an urban environment, Atmos. Chem. Phys., 21, 8323–8339. https://doi.org/10.5194/acp-21-8323-2021, 2021.
Vrekoussis, M., Pikridas, M., Rousogenous, C., Christodoulou, A., Desservettaz, M., Sciare, J., Richter, A., Bougoudis, I., Savvides, C., and Papadopoulos, C.: Local and regional air pollution characteristics in Cyprus: A long-term trace gases observations analysis, Sci. Total Environ., 845, 157315, https://doi.org/10.1016/j.scitotenv.2022.157315, 2022.
Xu, W., He, Y., Qiu, Y., Chen, C., Xie, C., Lei, L., Li, Z., Sun, J., Li, J., Fu, P., Wang, Z., Worsnop, D. R., and Sun, Y.: Mass spectral characterization of primary emissions and implications in source apportionment of organic aerosol, Atmos. Meas. Tech., 13, 3205–3219, https://doi.org/10.5194/amt-13-3205-2020, 2020.
Zanis, P., Hadjinicolaou, P., Pozzer, A., Tyrlis, E., Dafka, S., Mihalopoulos, N., and Lelieveld, J.: Summertime free-tropospheric ozone pool over the eastern Mediterranean/Middle East, Atmos. Chem. Phys., 14, 115–132, https://doi.org/10.5194/acp-14-115-2014, 2014.
Zhang, Y., Favez, O., Canonaco, F., Liu, D., Moènik, G., Amodeo, T., Sciare, J., Prévôt, A. S. H., Gros, V., and Albinet, A.: Evidence of major secondary organic aerosol contribution to lensing effect black carbon absorption enhancement, npj Clim. Atmos. Sci., 1, 47, https://doi.org/10.1038/s41612-018-0056-2, 2018.
Zhang, Y., Favez, O., Petit, J.-E., Canonaco, F., Truong, F., Bonnaire, N., Crenn, V., Amodeo, T., Prévôt, A. S. H., Sciare, J., Gros, V., and Albinet, A.: Six-year source apportionment of submicron organic aerosols from near-continuous highly time-resolved measurements at SIRTA (Paris area, France), Atmos. Chem. Phys., 19, 14755–14776, https://doi.org/10.5194/acp-19-14755-2019, 2019.
Zittis, G., Almazroui, M., Alpert, P., Ciais, P., Cramer, W., Dahdal, Y., Fnais, M., Francis, D., Hadjinicolaou, P., Howari, F., Jrrar, A., Kaskaoutis, D. G., Kulmala, M., Lazoglou, G., Mihalopoulos, N., Lin, X., Rudich, Y., Sciare, J., Stenchikov, G., Xoplaki, E., and Lelieveld, J.: Climate Change and Weather Extremes in the Eastern Mediterranean and Middle East, Rev. Geophys., 60, e2021RG000762, https://doi.org/10.1029/2021rg000762, 2022.