the Creative Commons Attribution 4.0 License.
the Creative Commons Attribution 4.0 License.
 | 16 Jan 2023
Arctic tropospheric ozone: assessment of current knowledge and model performance
Cynthia H. Whaley
Kathy S. Law
Jens Liengaard Hjorth
Henrik Skov
Stephen R. Arnold
Joakim Langner
Jakob Boyd Pernov
Garance Bergeron
Ilann Bourgeois
Jesper H. Christensen
Rong-You Chien
Makoto Deushi
Xinyi Dong
Peter Effertz
Gregory Faluvegi
Mark Flanner
Joshua S. Fu
Michael Gauss
Greg Huey
Rigel Kivi
Louis Marelle
Tatsuo Onishi
Naga Oshima
Irina Petropavlovskikh
Jeff Peischl
David A. Plummer
Luca Pozzoli
Jean-Christophe Raut
Tom Ryerson
Ragnhild Skeie
Sverre Solberg
Manu A. Thomas
Chelsea Thompson
Kostas Tsigaridis
Svetlana Tsyro
Steven T. Turnock
Knut von Salzen
David W. Tarasick
As the third most important greenhouse gas (GHG) after carbon dioxide (CO2) and methane (CH4), tropospheric ozone (O3) is also an air pollutant causing damage to human health and ecosystems. This study brings together recent research on observations and modeling of tropospheric O3 in the Arctic, a rapidly warming and sensitive environment. At different locations in the Arctic, the observed surface O3 seasonal cycles are quite different. Coastal Arctic locations, for example, have a minimum in the springtime due to O3 depletion events resulting from surface bromine chemistry. In contrast, other Arctic locations have a maximum in the spring. The 12 state-of-the-art models used in this study lack the surface halogen chemistry needed to simulate coastal Arctic surface O3 depletion in the springtime; however, the multi-model median (MMM) has accurate seasonal cycles at non-coastal Arctic locations. There is a large amount of variability among models, which has been previously reported, and we show that there continues to be no convergence among models or improved accuracy in simulating tropospheric O3 and its precursor species. The MMM underestimates Arctic surface O3 by 5 % to 15 % depending on the location. The vertical distribution of tropospheric O3 is studied from recent ozonesonde measurements and the models. The models are highly variable, simulating free-tropospheric O3 within a range of ±50 % depending on the model and the altitude. The MMM performs best, within ±8 % for most locations and seasons. However, nearly all models overestimate O3 near the tropopause (∼300 hPa or ∼8 km), likely due to ongoing issues with underestimating the altitude of the tropopause and excessive downward transport of stratospheric O3 at high latitudes. For example, the MMM is biased high by about 20 % at Eureka. Observed and simulated O3 precursors (CO, NOx, and reservoir PAN) are evaluated throughout the troposphere. Models underestimate wintertime CO everywhere, likely due to a combination of underestimating CO emissions and possibly overestimating OH. Throughout the vertical profile (compared to aircraft measurements), the MMM underestimates both CO and NOx but overestimates PAN. Perhaps as a result of competing deficiencies, the MMM O3 matches the observed O3 reasonably well. Our findings suggest that despite model updates over the last decade, model results are as highly variable as ever and have not increased in accuracy for representing Arctic tropospheric O3.
- Article
(4344 KB) - Full-text XML
-
Supplement
(2592 KB) - BibTeX
- EndNote


Tropospheric ozone (O3) is the third most important greenhouse gas (GHG) after CO2 and methane (IPCC, 2021), and it is an air pollutant causing damage to human health (World Health Organization (WHO), 2021). It also causes damage to vegetation following dry deposition to the surface (U.S. EPA, 2013). However, our knowledge about the sources and sinks of tropospheric O3 is still uncertain (AMAP, 2015, 2022; Gaudel et al., 2018), in particular in regions where fewer observations exist and where our understanding of key processes is still evolving. The Arctic is one such region where few long-term measurements of O3 exist and measurements of compounds that are important for producing and destroying O3 in the atmosphere are scarce at the surface and even more so in the free troposphere. Progress has been made recently in terms of our understanding of certain processes, and a picture is emerging about the distribution of Arctic tropospheric O3 as well as seasonal cycles and trends at different locations (e.g., Young et al., 2018; Tarasick et al., 2019b). In particular, the connection between surface O3 depletion episodes and halogens is now well-established (e.g., Simpson et al., 2007; Abbatt et al., 2012).
However, the role of natural cycles in the Arctic O3 budget relative to O3 produced from anthropogenic emissions and how that relationship is changing in response to rapid warming in the Arctic are still uncertain. Arctic warming and associated development in the Arctic are also driving changes in local anthropogenic emissions, which could already be leading to changes in the relative contributions of O3 produced due to long-range transport of midlatitude anthropogenic emissions and O3 produced from within or near Arctic anthropogenic emissions. Increases in emissions, such as from shipping (Gong et al., 2018) or boreal fires, can affect Arctic air quality (Schmale et al., 2018).
Ozone radiative forcing resulting from changes in tropospheric O3 in the Arctic is highly sensitive to altitude. The sensitivity of the Arctic O3 vertical profile and resultant forcing from particular anthropogenic emission sources and regions vary substantially with altitude (Rap et al., 2015). Arctic surface O3 may be most sensitive to European or local sources (Sand et al., 2015; AMAP, 2015, 2022), whereas emissions from North American and Asian sources are more important in the middle and upper troposphere (Monks et al., 2015; Wespes et al., 2012). Therefore, a combination of varied source sensitivities in the vertical profile and the increased efficacy of longwave O3 forcing with altitude in the troposphere leads to a complex picture in terms of drivers of climate forcing by Arctic O3. The presence of temperature inversions in the Arctic lower troposphere may result in negative local forcing (Rap et al., 2015; Flanner et al., 2018), in particular for local sources such as shipping (Marelle et al., 2018). Hence, to improve the quantification of O3 radiative effects in the Arctic there is a need first to assess model performance in terms of seasonal cycles and vertical distributions. The annual mean vertical distributions of O3 and CO were examined in AMAP (2022) and Whaley et al. (2022) compared to the Tropospheric Emission Spectrometer (TES) and Measurement of Pollution in the Troposphere (MOPITT) satellite retrievals. Those studies showed good agreement between models and satellite measurements for O3 in the free troposphere, where it is a strong GHG.
This paper assesses the current state of knowledge about the dynamics of Arctic tropospheric O3 and the ability of a suite of current chemistry–transport and chemistry–climate models to simulate seasonal cycles of O3 and selected precursors. We first review our current understanding of sources and sinks of Arctic tropospheric O3 in Sect. 2. We summarize the models used in this study in Sect. 3 and the recent findings from satellite observations in Sect. 4. We then examine the extent to which our understanding of Arctic tropospheric O3 can explain observed seasonal cycles at different surface sites in the Arctic and assess the ability of models to simulate observed distributions (Sect. 5). We also examine vertical distributions of O3 and its precursors and the extent to which models are able to capture observed seasonal variations (Sect. 6). Finally, conclusions are presented in Sect. 7. Trends in Arctic tropospheric O3 over the last 20–30 years and possible changes in seasonal cycles will be presented in a follow-on study and compared to results from a subset of these models.
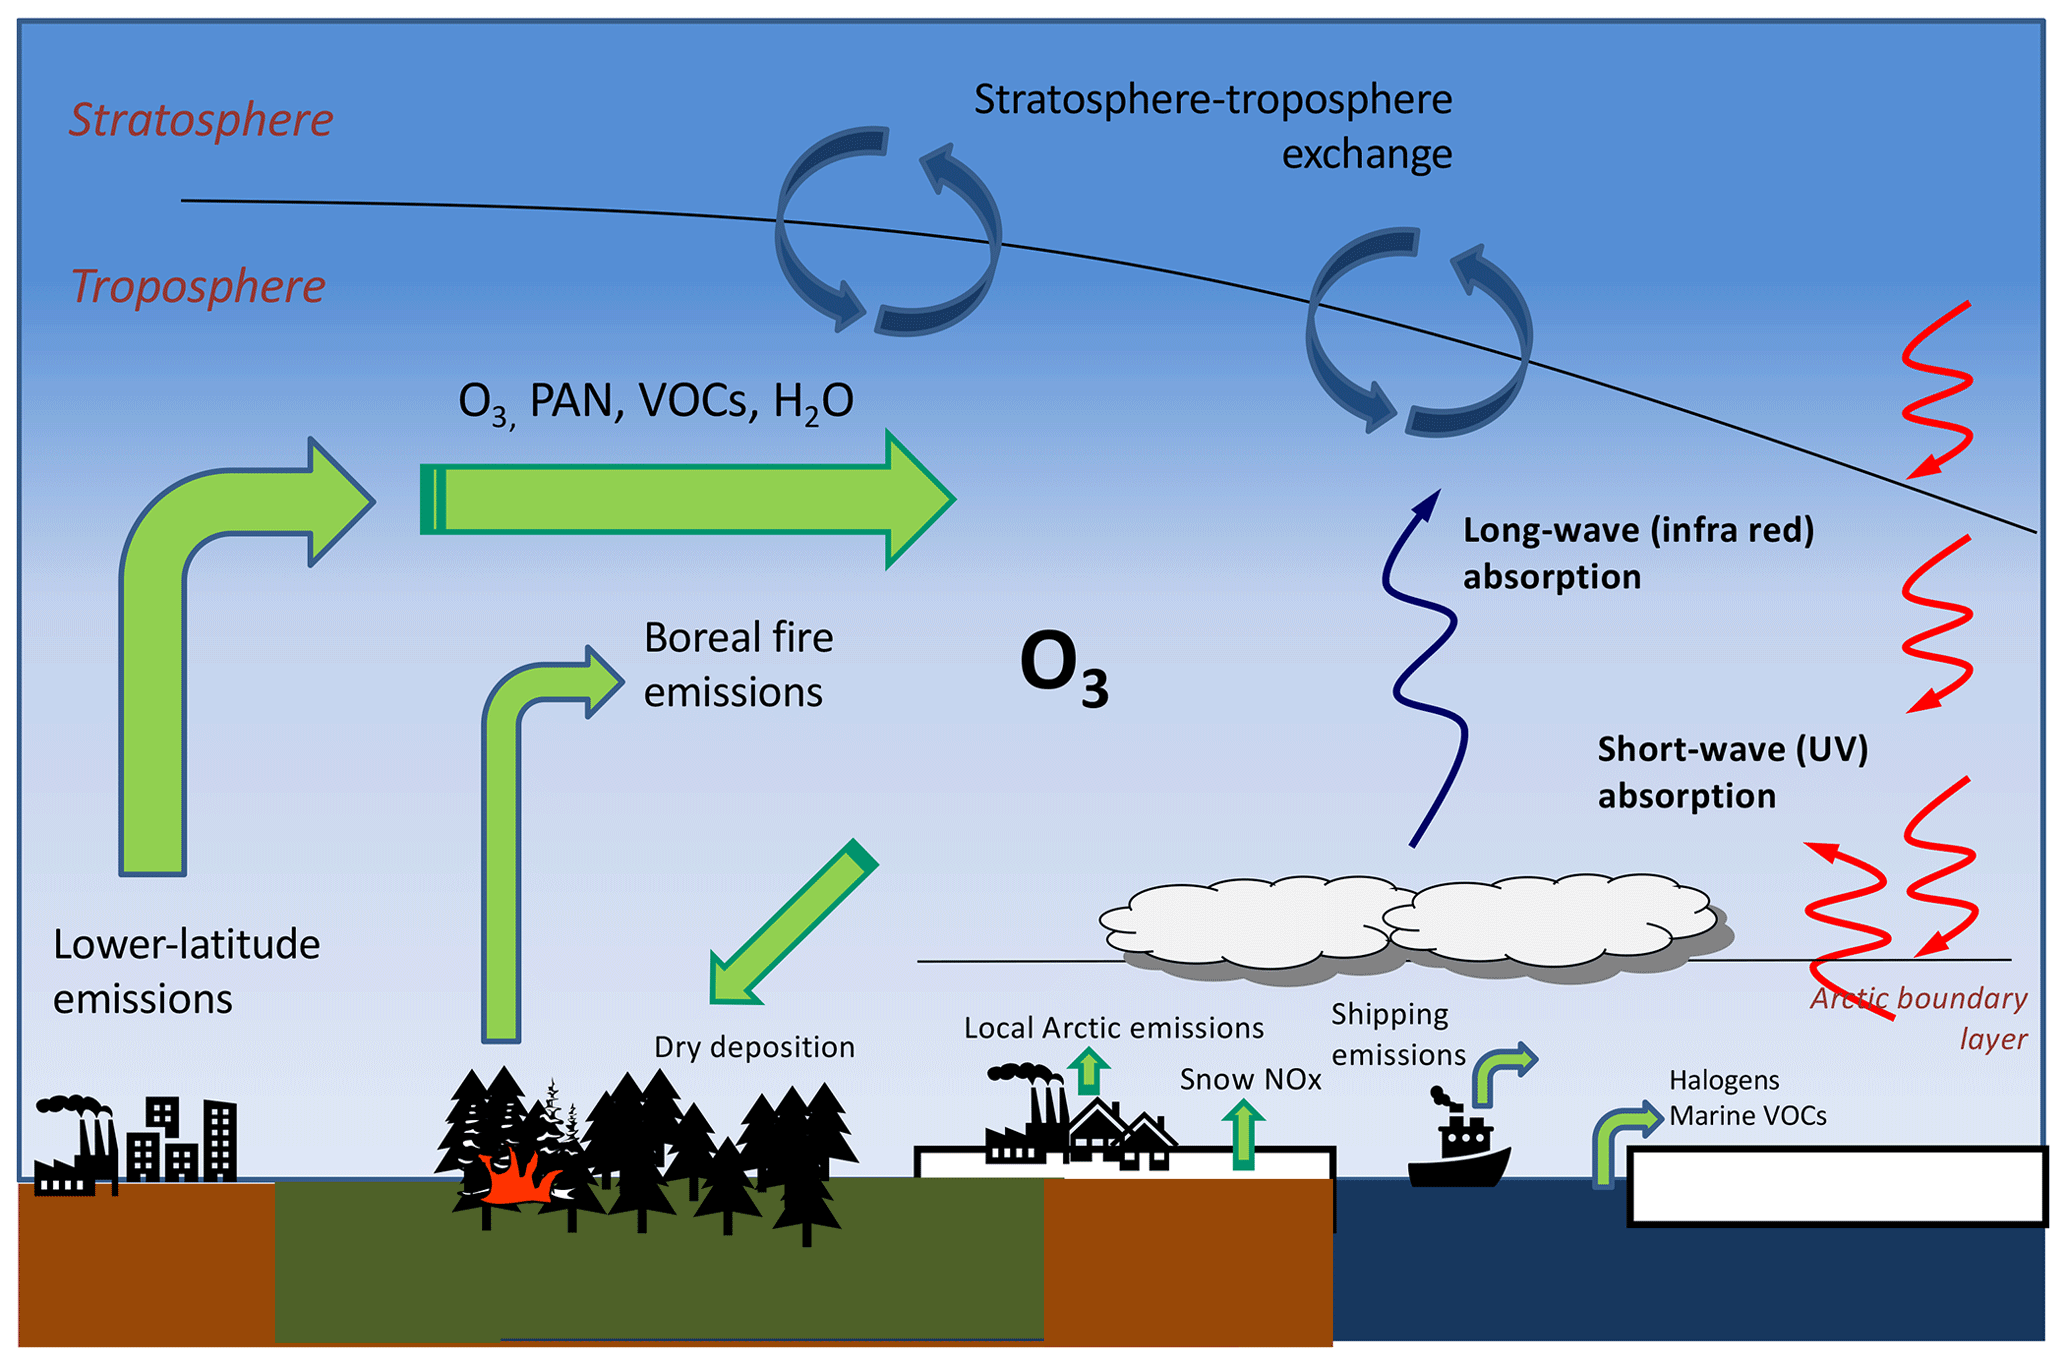
This section reviews tropospheric O3 sources and sinks that are particularly relevant to the Arctic region, and many of these processes are shown in the schematic in Fig. 1.
2.1 Ozone sources
Tropospheric O3 is a secondary air pollutant, which is not directly emitted but produced from the photochemical reactions of anthropogenic and natural precursor emissions of volatile organic compounds (VOCs), CO, and CH4 in the presence of NOx. Besides significant anthropogenic sources of these O3 precursors, there are also important natural sources for these species, such as boreal fires, lightning, vegetation, and transport of O3 from the stratosphere (Fig. 1), which show marked seasonal and interannual variations. Away from the surface and in remote environments the tropospheric O3 lifetime is around 20 d or more (Young et al., 2013), which facilitates the long-range transport of O3 in the troposphere. Production of O3 from lower-latitude emission sources and its subsequent transport to the Arctic constitute a substantial source of Arctic tropospheric O3 (Hirdman et al., 2010), where the dry Arctic conditions and stably stratified atmosphere further prolong the O3 lifetime. In addition, the stratosphere–troposphere exchange of O3 makes a substantial contribution to the Arctic O3 budget. The weak in situ O3 formation in the Arctic relative to lower latitudes increases the relative importance of this exchange.
Downward transport of O3 from the stratosphere is an important source of O3 in the Arctic troposphere and may be key in driving seasonality in Arctic tropospheric O3 (Shapiro et al., 1987; Hess and Zbinden, 2013; Ancellet et al., 2016). Based on modeling, Liang et al. (2009) show that in spring (March and April), most of the O3 in the Arctic upper troposphere originates from stratospheric injection (78 %) and that 20 %–25 % of surface O3 originates from direct injection of O3 or the injection of NOy and secondary O3 formation. Analysis of observations by Tarasick et al. (2019a) is consistent with this picture. Global model simulations conducted as part of the Coupled Model Intercomparison Project Phase 6 suggest an increase in near-surface O3 over the Arctic during the 21st century, driven by increased stratospheric O3 import into the troposphere, particularly in winter (Zanis et al., 2022). In contrast, during summer, in situ production in the Arctic contributes a significant fraction, with a model study estimating a contribution of more than 50 % of O3 in the Arctic boundary layer and 30 %–40 % in the free troposphere for the month of July (Walker et al., 2012). Methane (CH4) is a key precursor for tropospheric O3 via its oxidation in the presence of sufficient NOx. Increases in anthropogenic CH4 emissions are estimated to be responsible for 44 ± 12 % of the global tropospheric ozone radiative forcing from the pre-industrial era to present day (Stevenson et al., 2013). Fiore et al. (2008) estimated that anthropogenic CH4 emissions contribute 15 % to the annual average total global O3 burden (including natural and anthropogenic sources). Based on parameterized source–receptor sensitivities for a range of CMIP6 SSP scenarios, Turnock et al. (2019) illustrated the significant contribution of CH4 to future O3 concentration reductions at high latitudes under future conditions with lower NOx concentrations. Using a similar approach based on parameterized responses to O3 precursor emission perturbations, it was found that CH4 accounts for approximately 40 % of the Arctic O3 response to precursor emission perturbations (AMAP, 2015). Thawing permafrost and release from organic deposits in shallow Arctic Ocean waters in a warmer climate represent a new source of methane (Isaksen et al., 2014).
Import of O3 and its precursors from lower latitudes associated with episodes of long-range transport of anthropogenic or biomass burning pollution leads to enhancements in Arctic tropospheric O3 (Wespes et al., 2012; Monks et al., 2015; Ancellet et al., 2016). Whilst very low levels of NOx within the Arctic, away from local sources, often limit local O3 production, the release of NOx from thermal decomposition of peroxy-acetyl nitrate (PAN) (an important NOx reservoir) imported from lower latitudes can lead to in situ production of O3, particularly in the warmer Arctic summer lower troposphere (Wespes et al., 2012; Walker et al., 2012; Arnold et al., 2015). Investigation of long-range transport of O3 precursors has shown efficient export of PAN from East Asia to the North Pacific, with relative contributions to long-range O3 transport of 35 % in spring and 25 % in summer (Jiang et al., 2016). Ship observations over the Arctic Ocean and Bering Sea also identified events of long-range pollution transport with enhancements in O3 (Kanaya et al., 2019).
Recently, there has been progress in improving knowledge of local O3 precursor sources. Surface O3 in summer is influenced by shipping NOx emissions along the northern Norwegian coast (Marelle et al., 2016; Marelle et al., 2018) and the Northwest Passage (Aliabadi et al., 2015). Additionally, Tuccella et al. (2017) showed that background O3 is influenced by emissions downwind of oil and gas extraction platforms in the southern Norwegian Sea. Natural sources of Arctic tropospheric O3 precursors include lightning NOx, emissions of NOx and reactive VOCs from the snowpack (Honrath et al., 1999; Guimbaud et al., 2002; Hornbrook et al., 2016; Pernov et al., 2021), natural emissions of VOCs from high-latitude vegetation (Holst et al., 2010; Ghirardo et al., 2020), and the sea surface microlayer (Mungall et al., 2017). Evidence from both observations and models suggests that boreal fires are also an important source of O3 precursors and NOx reservoir species like PAN in spring and summer, with impacts on Arctic O3 (Thomas et al., 2013; Arnold et al., 2015; Viatte et al., 2015; Ancellet et al., 2016).
2.2 Ozone sinks
Photochemical loss of O3 is mainly via photolysis in the presence of water vapor or direct reaction of O3 with hydroperoxyl (HO2) or hydroxyl radicals (OH). Photochemical destruction involving HO2 may be particularly important in the Arctic where water vapor abundances are low (Arnold et al., 2015). Where local emission sources give rise to high NOx concentrations in urban regions or regions of shipping activity, O3 loss via titration with NO can be dominant (Thorp et al., 2021; Raut et al., 2022). Dry deposition of O3 and its precursors to ice and ocean surfaces is slower than to vegetated terrestrial surfaces (Fig. 1). Van Dam et al. (2016) reported O3 dry deposition velocities that were 5 times higher over Arctic snow-free tundra in the summer months at Toolik Lake (northern Alaska) compared to the snow-covered ground. Dry deposition, combined with possible chemical loss (e.g., involving biogenic volatile organic compounds, BVOCs) producing lower O3 concentrations during stable (lower light) night conditions may explain the different diurnal cycle observed at this tundra site compared to Arctic coastal locations. Interestingly, gradient studies at the NOAA Barrow Observatory near Utqiaġvik and at Zeppelin showed a positive gradient with height during O3 depletion events (ODEs) and atmospheric mercury depletion events (AMDEs), suggesting that O3 was removed at the surface due to fast photochemical reactions at or close to snow surfaces initiated by the release of halogen species (Skov et al., 2006; Solberg et al., 1996; Berg et al., 2003; Eneroth et al., 2007). During ODEs at Arctic sites in the Canadian archipelago (Alert, Resolute, and Eureka), vertical profiles show that ozone is typically uniformly depleted in the boundary layer, whereas a positive gradient is observed above the boundary layer (Tarasick and Bottenheim, 2002).
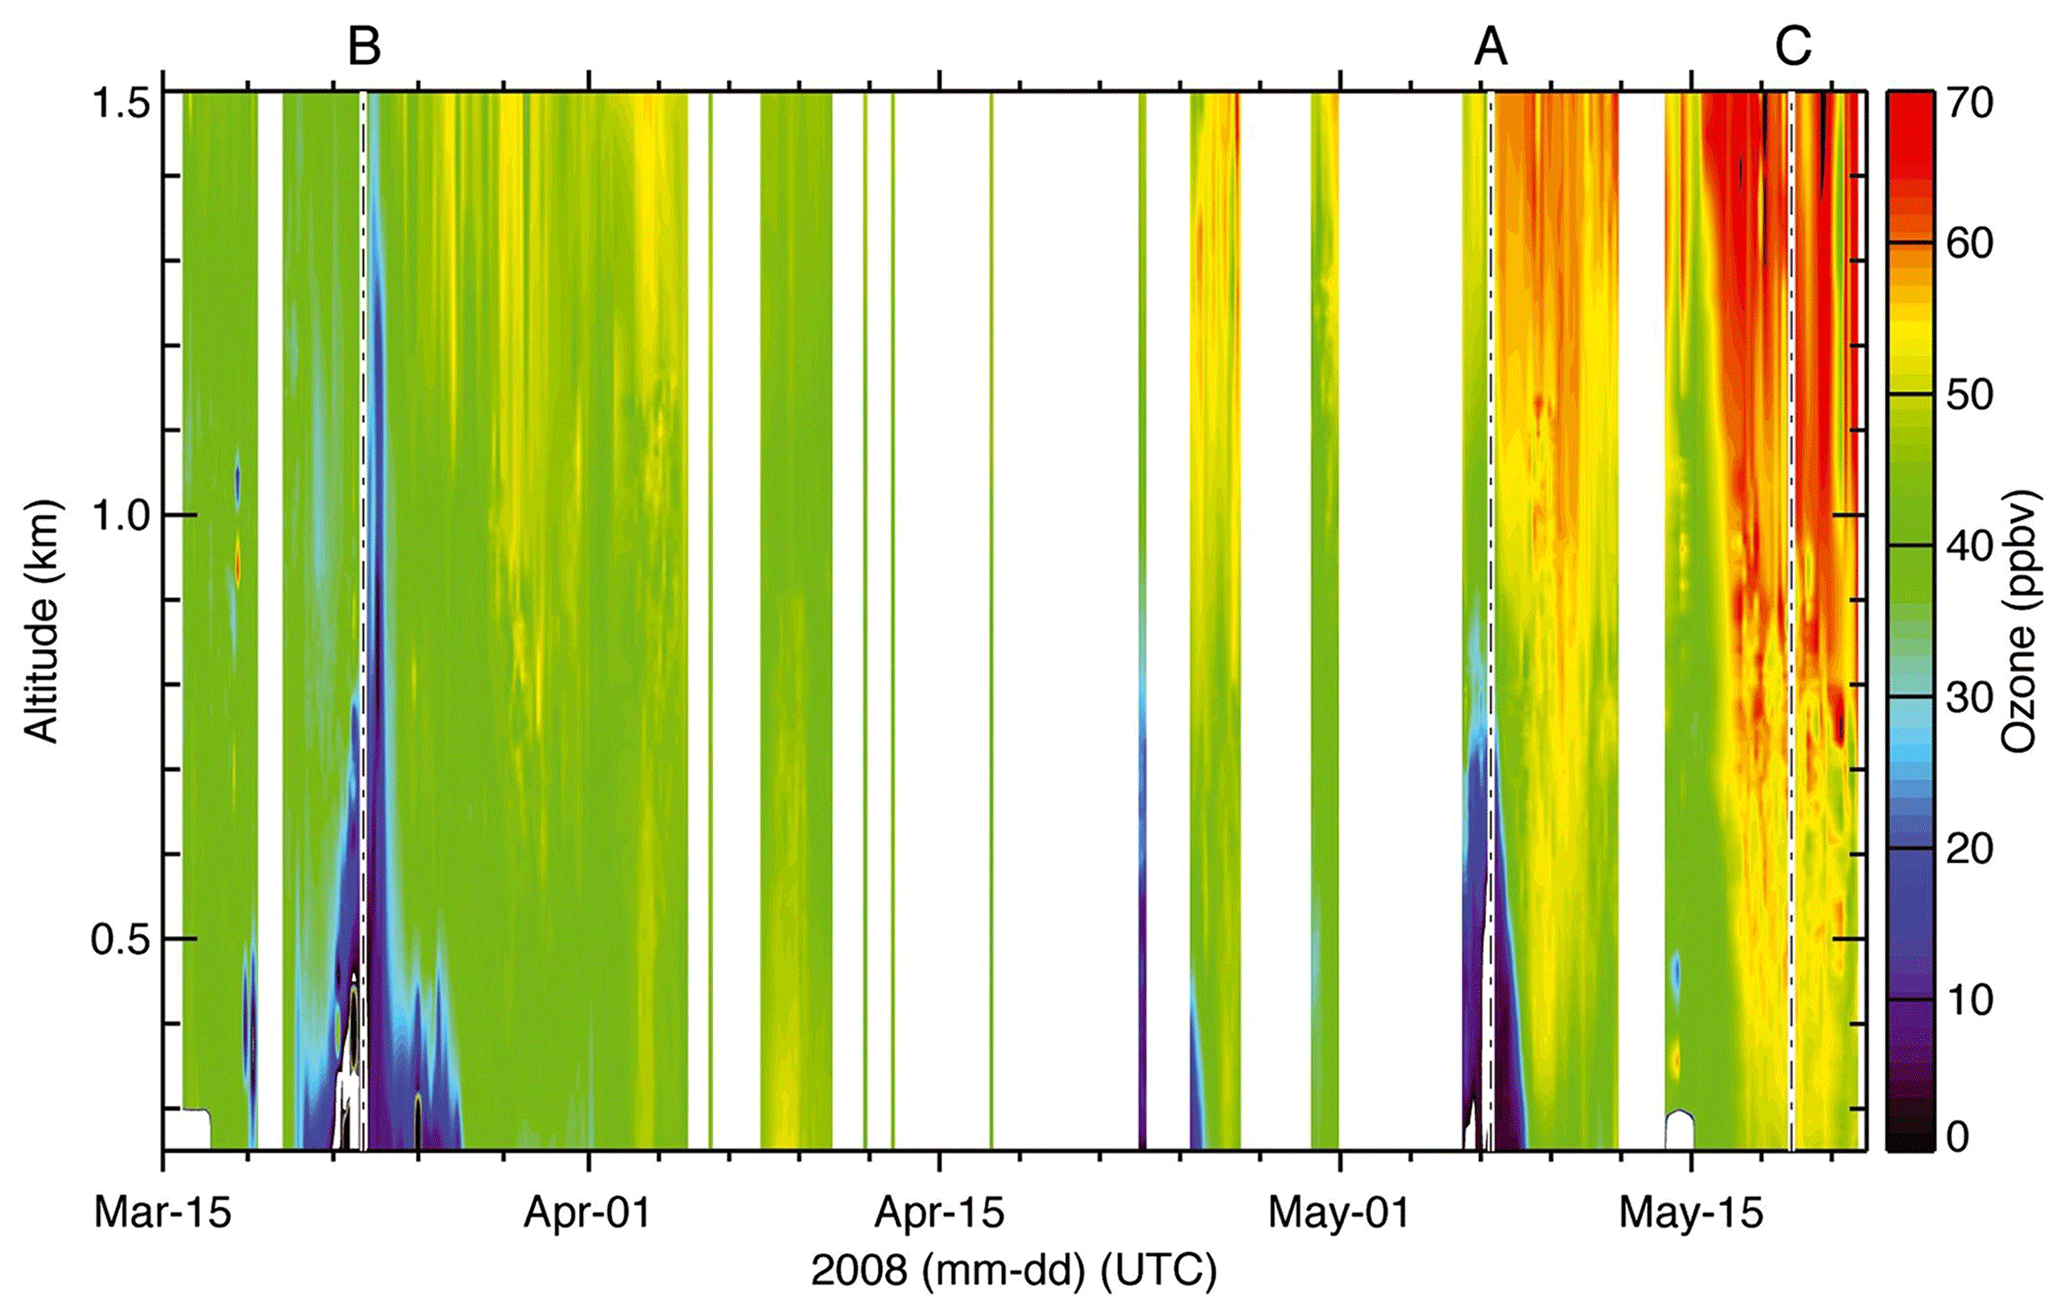
Figure 2Ozone lidar measurements from Eureka in the spring of 2008 showing effects of large-scale meteorology including low O3 in the lower troposphere when air masses originate from the north over the Arctic Ocean and enhanced O3 during downward transport into the Arctic boundary layer when the airflow was from the south over mountains. From Fig. 3 in Seabrook and Whiteway (2016).
During Arctic spring, photochemical cycling of halogens in so-called “bromine explosion” events leads to rapid depletion of surface O3 to low or near-zero concentrations (Barrie et al., 1988; Skov et al., 2004; Helmig et al., 2007; Simpson et al., 2007). These phenomena are observed at Arctic coastal locations and in the Arctic Ocean (Bottenheim et al., 2009; Jacobi et al., 2010) in March–April and attributed to bromine (halogen) sources linked to Arctic sea ice, coupled with stable surface temperature inversions (e.g., Fig. 1; Hermann et al., 2019). Some model studies were able to explain major depletion events in simulations by introducing the wind-induced release of bromine from the snowpack and have shown that both blowing snow and the snowpack are important sources of bromine during the spring (e.g., Yang et al., 2010; Toyota et al., 2011; Yang et al., 2020; Huang et al., 2020; Swanson et al., 2022). Figure 2 shows the vertical extent of low O3 episodes observed by lidar at Eureka in northern Canada. On 7 May, low O3 concentrations were observed, and back trajectories showed that air masses came in from the ice-covered Arctic Ocean and had been in contact with the surface multiple times during the previous 6 d, whereas the concentrations were high on 9 May, when air came down from the mountains located to the south (Seabrook and Whiteway, 2016). Peterson et al. (2018) showed that active halogen chemistry and related O3 depletion can also occur up to 200 km inland over snow-covered tundra in Alaska. Simpson et al. (2018) reported high levels of bromine oxide (BrO) at Utqiaġvik occurring earlier in February in air masses originating from the Arctic Ocean polar night. Their findings suggest a dark wintertime source of reactive bromine (halogens) that could feed halogen photochemistry at lower latitudes as the sun returns. This dark mechanism was also observed over sea ice in Antarctica by Nerentorp Mastromonaco et al. (2016).
In addition, whilst earlier studies proposed indirect evidence that O3 and gaseous elemental mercury (Hg0) are removed by reaction with Br atoms (e.g., Skov et al., 2004; Skov et al., 2020; Dastoor et al., 2008), Wang et al. (2019) showed, for the first time, a direct connection between O3 and Hg0 with atomic bromine (Br) during O3 and Hg0 depletion episodes at Utqiaġvik on the northern coast of Alaska (see Fig. 3) where O3 and Hg0 are removed in competing reactions with Br. Here, the ratio anti-correlates with O3 concentrations, and box modeling confirms that O3 is removed by Br.
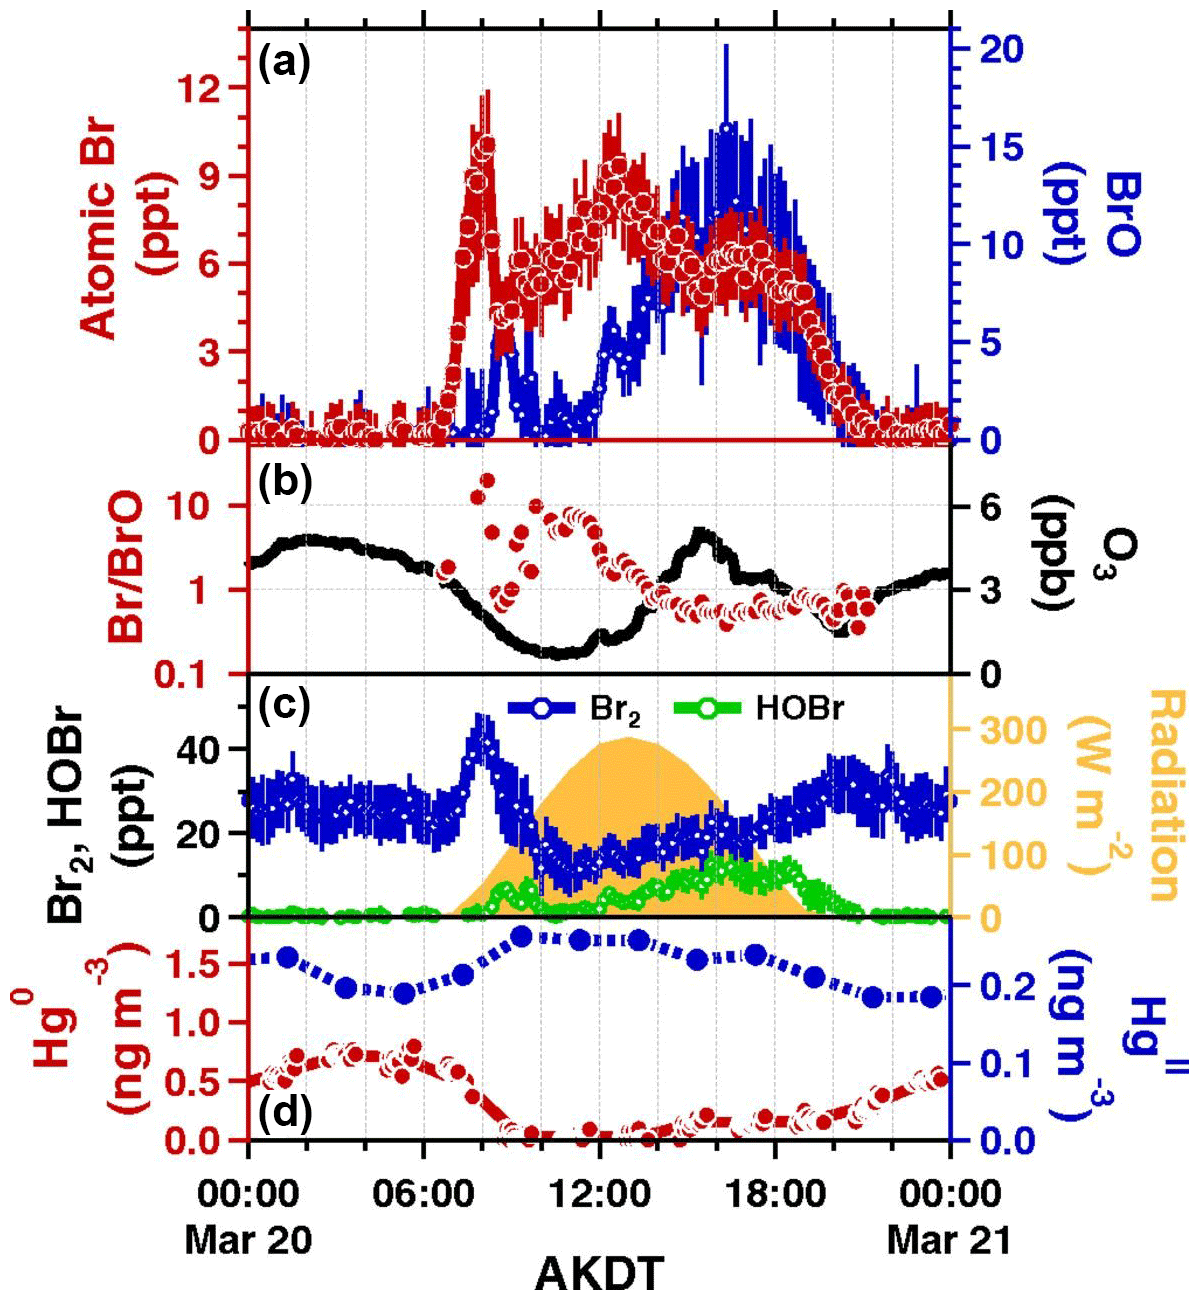
Figure 3Time series at Utqiaġvik on 20 March 2012 of measured (a) atomic bromine (Br) and bromine monoxide (BrO), (b) ratios, and O3. Error bars represent propagated measurement uncertainties. From Fig. 2 in Wang et al. (2019)(EPS figure provided for the report).
This result is significant since the main source of halogens in the Arctic is the release from refreezing sea ice, blowing snow over sea ice, heterogeneous reactions of aerosol particles, and snowpack recycling (Petersen et al., 2016; Peterson et al., 2017, Wang et al., 2017; Yang et al., 2020). Burd et al. (2017) found a strong relationship between the end of the reactive bromine season and snowmelt timing. In the future, continued decreases in Arctic sea ice extent or the relative distributions of multi-year and seasonal sea ice cover (Peterson et al., 2019), coupled with increases in the length of the snow-free season over land, could influence the magnitude and seasonality of O3 sinks via changes in halogen fluxes or dry deposition fluxes to tundra and ocean rather than snow and ice surfaces.
It has also recently been shown that substantial O3 depletion can occur due to reactions with iodine (Benavent et al., 2022). That study, which was based on ship measurements during the MOSAiC expedition in March to October 2020, found that iodine contributed more to O3 loss than bromine, thus highlighting how the dynamics of high Arctic O3 depletion are still not fully elucidated.
To evaluate our process understanding of controls on the Arctic tropospheric O3 budget and distribution, we evaluate a subset of the same model simulations that were used in AMAP (2022) and by Whaley et al. (2022). A total of 12 atmospheric models participated in this study: seven chemical transport models (DEHM, EMEP MSC-W, GEOS-Chem, MATCH, MATCH-SALSA, OsloCTM, WRF-Chem) and five chemistry–climate models (CESM, CMAM, GISS-E2.1, MRI-ESM2, and UKESM1), with simulations of the years 2014–2015 for comparisons to observations. All models used the same set of anthropogenic emissions called ECLIPSEv6b (AMAP 2022), though they had different sources for fire, biogenic emissions, and meteorology (see Table S1 in the Supplement). The years 2014–2015 were chosen for model validation as it was the most recent time period that the ECLIPSE v6b historical emissions were available when the model simulations were being set up. All participating models prescribe CH4 concentrations based on box model results, which are, in turn, based on the ECLIPSEv6b anthropogenic CH4 emissions and various assumptions on natural CH4 emissions (Olivié et al., 2021; Prather et al., 2012). Models then allow CH4 to take part in photochemical processes. The participating models have varying degrees of spatial resolution and chemical complexity; air-quality-focused models, such as DEHM, EMEP MSC-W, GEOS-Chem, MATCH, and WRF-Chem, have detailed HOx–NOx–hydrocarbon O3 chemistry, with speciated VOCs and secondary aerosol formation, and they tend to run at higher resolution. The Earth system models GISS-E2.1, MRI-ESM2, and UKESM1 also contain this level of tropospheric chemistry, though they run globally at coarser resolution, whereas climate-focused models like CMAM run at a coarse resolution and have simplified tropospheric chemistry in order to be able to run for long periods. For example, CMAM's tropospheric chemistry consists only of CH4–NOx–O3 chemistry, with no VOCs.
As mentioned above, Arctic tropospheric O3 is heavily influenced by imports from the stratosphere. The models vary, too, in their representation of the stratosphere. Only a subset of participating models has a fully simulated stratosphere. CMAM, MRI-ESM2, GISS-E2.1, OsloCTM, and UKESM1 contain relatively complete stratospheric O3 chemistry (NOx, NOx, Clx, Brx chemistry that controls stratospheric O3). Other models have a simplified stratosphere, such as GEOS-Chem which has a linearized stratospheric chemistry scheme (LINOZ; McLinden et al., 2000) and WRF-Chem which specifies stratospheric concentrations from climatologies. Finally, several models have no stratosphere or stratospheric chemistry at all (e.g., DEHM and EMEP MSC-W). Most atmospheric models, including all of the models in this study, do not yet contain Arctic tropospheric bromine chemistry and thus cannot simulate the surface-level bromine-driven O3 depletion events that occur during spring. However, there are research versions of some models which are starting to contain this chemistry (e.g., Parrella et al., 2012; Falk and Sinnhuber, 2018; Badia et al., 2021)
These same 12 model simulations were also evaluated against a different set of measurements in AMAP (2022) and Whaley et al. (2022). Those studies focused on many SLCF species over the Northern Hemisphere and generally reported model biases for the annual mean concentrations. They found that all models overestimated surface O3 concentrations at midlatitudes but that there were both overestimation and underestimation in the Arctic. Particularly, models overestimated surface O3 in the western Arctic (e.g., Alaska), particularly in the summertime, but were better able to simulate the surface O3 seasonal cycle in the eastern Arctic (e.g., northern Europe). They also found that model biases were small throughout the free troposphere when compared to remote measurements from the TES satellite instrument.
In the next sections, these models are compared with observations of O3 (at measurement sites located in Fig. 4) and its precursors either individually or as the multi-model median (MMM) – whereby the median of all 12 atmospheric models at the measurement locations is shown unless otherwise noted. The model output was selected from the model grid box that contains the latitude and longitude of the observation location without any spatial interpolation.

Figure 4Map of the surface (red) and ozonesonde (blue) sites cited in the present study, with coordinates and elevation. Eureka and Alert are both surface and sounding sites. Utqiaġvik was formerly called Barrow. The Arctic Circle at 66.55∘ N is also shown in the figure for reference.
Despite the potential limitations of some satellite data products at high latitudes, several studies have exploited satellite observations to investigate tropospheric O3 and precursor distributions as well as trends relevant to the Arctic. Pommier et al. (2012) presented Infrared Atmospheric Sounding Interferometer (IASI) retrievals of 0–8 and 0-12 km sub-column O3 for the Arctic in spring and summer 2008. These showed widespread enhancements in the springtime (March–April) tropospheric O3 column compared with summer (June–July), particularly over northeastern Siberia, northern Canada, and the Arctic Ocean. Generally, good agreement with in situ aircraft profiles was demonstrated, but low thermal contrast between the Arctic surface and boundary layer was found to produce bias in IASI retrievals compared with aircraft measurements in the Arctic lower troposphere. Wespes et al. (2012) showed that IASI was able to detect enhancements in midlatitude-sourced O3 enhancements during summer at the edge of the Arctic, but also showed a lack of sensitivity over snow and ice surfaces, potentially resulting in missing some O3 enhancements. Sodemann et al. (2011) analyzed the cross-polar transport of a large pollution plume originating from Asia during the summer of 2008 using IASI CO retrievals. IASI was able to detect features and structures of the plume consistent with in situ aircraft data.
Satellite observations are also useful in evaluating the sources and export of O3 precursors from midlatitude source regions and their subsequent transport to the Arctic. Tropospheric NO2 columns measured from the Ozone Monitoring Instrument (OMI) have been used to detect enhancements and trends in NOx emissions due to gas flaring in high-latitude (up to 67∘ N) areas of Russia and North America (Li et al., 2016). Assessment of a suite of chemical transport models using OMI tropospheric NO2 columns for summer 2008 showed a potential overestimate in NO2 over biomass burning regions in eastern Siberia, with lower biases over European and North American source regions and underestimates over China (Emmons et al., 2015). A comparison of regional model-simulated tropospheric NO2 columns with observations from OMI suggests potential underestimates in anthropogenic NO2 emissions over high-latitude Siberia and the Russian Arctic (Thorp et al., 2021). Monks et al. (2015) exploited limited profile information from MOPITT CO retrievals to evaluate relationships between CO seasonal cycles in the lower and upper troposphere over the Arctic and midlatitude source regions. Atmospheric Infrared Sounder (AIRS) CO retrievals from 2007 to 2018 have been used to characterize atmospheric circulation patterns coincident with pollution enhancements during Arctic spring (Thomas et al., 2021), and IASI CO column measurements have been used to analyze transport pathways for Asian anthropogenic pollution to the Arctic (Ikeda et al., 2021). Osman et al. (2016) constructed three-dimensional ( km) gridded climatologies of CO via a domain-filling trajectory mapping technique based on MOZAIC-IAGOS in situ measurements of commercial aircraft flights. These climatologies agreed well using forward and backward trajectories (<10 % difference for most cases) and against vertical measurements from MOZAIC-IAGOS not included in the climatologies. These climatologies were compared with CO retrievals from MOPITT; small biases were found in the lower troposphere, while differences of ∼20 % were found between 500 and 300 hPa, which declined throughout the study (2001-2012). Interannual variability in PAN retrieved by TES over eastern Siberia for April 2006–2008 was documented by Zhu et al. (2015), and it was shown to be largely controlled by boreal fire emissions at this time of year. More recently, PAN data from the TES instrument were used to help characterize Asian influence on exported PAN and downwind O3 production (Jiang et al., 2016). A temperature-dependent high bias in TES PAN was found at cold temperatures over high latitudes.
In both Chapter 7 of the 2022 AMAP SLCF report (AMAP, 2022) and Whaley et al. (2022), data from satellite instruments, TES, the Atmosphere Chemistry Experiment (ACE) Fourier Transform Spectrometer (FTS) (ACE-FTS), and MOPITT are used to evaluate modeled O3, CH4, and CO in the Northern Hemisphere. They showed that model biases for CH4 were small, though they tended to be negative in the Arctic due to a lack of north–south gradient in the prescribed global distribution. Model biases were also negative for free-tropospheric O3; however, it was by approximately the same amount that TES O3 retrievals have been shown to be biased high by Verstraeten et al. (2013). The ACE-FTS comparison for O3 showed good agreement but had higher model biases around 300–100 hPa in Whaley et al. (2022) and AMAP (2022). The MOPITT CO comparisons in AMAP (2022) showed that all models' CO values are biased low over land in the midlatitudes but biased high over the oceans at lower latitudes. Monks et al. (2015) discussed the fact that models had high biases in the outflow from Asia and low biases north of there due to lack of transport. The Quennehen et al. (2016) study also suggested that summertime CO transport out of Asia is zonal. This could explain some of the underestimations in the Arctic CO in the mid-troposphere.
In the high Arctic (>70∘ N), there is very little diurnal variation in surface O3 because the local and regional photochemistry is of limited importance most of the time and due to the 24 h daylight during Arctic spring, summer, and autumn as well as the polar night during winter. The lack of diurnal cycle is also because there is inefficient O3 deposition to the ice, snow, and water surfaces in the Arctic and a sparsity of vegetation. Therefore, with less deposition and limited photochemical production, there is a very limited diurnal cycle. For high Arctic sites, the seasonal dynamics of O3 can be explained mostly by long-range transport, particularly in the winter and springtime, and intrusion from aloft (Hirdman et al., 2010); see Figs. 1 and 5a. Moving southwards to the Polar Circle a clearer diurnal pattern is evident caused by the seasonal behavior of vertical mixing, deposition, transport, and local chemistry (Andersson et al., 2017; Aas et al., 2021; AMAP 2022) like the stations on the Scandinavian peninsula and Denali, central Alaska.
5.1 Surface ozone
Seasonal differences in the Arctic are important because of differences between the local meteorological conditions, as well as atmospheric transport, in the warm and the cold seasons and seasonal variations in O3 sources and sinks. Surface O3 at remote midlatitude sites with limited influence from local and regional anthropogenic O3 precursor emissions has been found to frequently exhibit a characteristic seasonal cycle with peak values during spring and a minimum in the summer, while sites with high exposure to O3 from anthropogenic precursors have summertime O3 maxima (Monks, 2000; Parrish et al., 2013, 2019; Gaudel et al., 2018). The spring maxima have been explained by stratospheric intrusions as well as enhanced photochemical formation during this period of the year. The summer minima, e.g., observed at the Mace Head site (Derwent et al., 1998, 2013, 2020), which is strongly influenced by marine air, appear to be explained by photochemical destruction in the absence of anthropogenic precursors. Seasonal cycles at Arctic stations have been discussed in the literature, and it is evident that the halogen chemistry discussed above, which is most frequently observed at high Arctic coastal stations, leads to a significant reduction during the springtime (e.g., Oltman and Komhyr, 1986; Tarasick et al., 1995; Monks et al., 2015, Helmig et al., 2007). Anderson et al. (2017) found that monthly mean observed near-surface O3 concentrations at background sites in Sweden from 1990 to 2013 had a maxima in spring, with the most northerly stations experiencing their maximum in April and the southerly (non-Arctic) ones in May.
In order to get an overview of the annual O3 cycles at different types of Arctic surface measurement sites, we have calculated the monthly medians and interquartile range for the period 2003–2019 for a series of sites. A map of the stations as well as their coordinates and elevation can be seen in Fig. 4. Figure 5 illustrates the range of seasonal cycle behavior observed in the Arctic at different measurement sites and shows different seasonal cycles depending on location.

Figure 5Seasonal behavior of surface O3 at selected Arctic stations that are representative of sites in the (a) coastal high Arctic, (b) near the Arctic Circle, and (c) at high elevation. Monthly medians are calculated for the period 2003 to 2018. Data were not available from 2003 to 2006 for Villum or 2004 and 2013–2015 for Alert. Data from Tiksi were available for the period 2013–2018, and at Karasjok the measurements stopped in 2010. The error bars show upper (75 %) and lower (25 %) quartiles.
5.1.1 High Arctic sites
Figure 5a shows that the seasonalities in O3 at Villum, Barrow (Utqiaġvik), Alert, Tiksi, and Eureka are similar: they have a local minimum in spring due to the occurrence of ODEs, a slight increase or recovery in June, and a second minimum in July due to surface removal and photochemical degradation of O3. These stations are located at high-latitude coastal sites close to sea level. During winter, O3 reaches a maximum; due to an absence of photochemical degradation of O3, vertical mixing is suppressed during polar night since the Arctic boundary layer is often highly stratified, thus hampering removal by dry deposition (Esau and Sorokina, 2016).
5.1.2 Sites near the Arctic Circle
The characteristic seasonal variations of surface O3 measured at stations close to the Arctic Circle are shown in Fig. 5b. The stations are Karasjok and Tustervatn in Norway (Aas et al., 2021), Esrange in Sweden, Pallas in Finland, and Denali in Alaska (note that regular O3 monitoring at Karasjok ended in February 2010). The sites in Fig. 5b, which are not influenced by ODEs, exhibit a yearly cycle that is more similar to lower-latitude European stations at remote locations. Here, surface O3 exhibits a late spring maximum which is attributed to photochemical production and transport of O3 from the stratosphere (Monks, 2000). The largest differences between the stations are mainly found during the summer months, most likely due to differences in the influence of local sources on photochemical O3 production (e.g., shipping; Marelle et al., 2016) and differences in the distance to pollution sources (Anderson et al., 2017).
5.1.3 Inland, high-elevation sites
Summit (located in the free troposphere on the Greenland Ice Sheet) is much less affected by bromine chemistry originating from sea ice or other low-altitude processes than the coastal high Arctic sites (Huang et al., 2017). Consequently, the seasonal variation is different with a clear maximum in May and a minimum in September; the higher concentrations compared to other surface stations can be explained by the high sensitivity to stratospheric O3-enriched air (Monks et al., 2015) at this high-elevation (3211 m a.s.l.) site. Short episodes of depletion have been reported (Brooks et al., 2011), but they do not appear to substantially affect the monthly mean values as shown in Fig. 5c.
Zeppelin, although it is a high Arctic site, is located on a mountain ridge at 474 m a.s.l. and thus experiences free-tropospheric air masses more often compared to sea level sites. For this reason, it is less influenced by ODEs and consequently does not have an O3 minimum in spring like the other high Arctic coastal stations (Fig. 5c). That said, ODEs have been reported there by Solberg et al (1996), Lehrer et al. (1997), Berg et al. (2003), Eneroth et al. (2007), and Steffen et al (2008), for example. ODEs have also been observed at the foot of the mountain, at the coastal station Gruvebadet, Ny-Ålesund (40 m a.s.l.), by Ianniello et al. (2021).
We also note that surface O3 can be influenced by local anthropogenic emissions such as shipping (e.g., Marelle et al., 2016; Aliabadi et al., 2015; Eckhardt et al., 2013) or oil field emissions (McNamara et al., 2019). McNamara et al. (2019) discussed potentially important interactions between local anthropogenic NOx emissions from the Barrow (Utqiaġvik) settlement or the Prudhoe Bay oil extraction facilities in northern Alaska and snowpack (chlorine) chemistry leading to elevated concentrations of nitrogen-containing compounds (e.g., N2O5, HO2NO2), with implications for Arctic tropospheric O3. Therefore, while none of the Arctic sites currently exhibit summertime surface maxima due to photochemical production, as often observed in polluted locations further south, this may change in the future with increasing local anthropogenic emissions (e.g., Granier et al., 2006; Law et al., 2014; Marelle et al., 2018).
He et al. (2016) measured O3 and black carbon on a ship cruise to the Arctic Ocean (31.1 to 87.7∘ N and 9.3–90∘ E to 168.4∘ W) from June to September 2012. Comparing the observed O3 concentrations to those measured at Barrow (Utqiaġvik) showed no statistically significant differences; the authors suggest that coastal stations between July and September may be representative of the entire Arctic, but this hypothesis requires further investigation. Indeed, our results show significant differences in the O3 seasonal cycles at different Arctic locations depending on whether they were coastal, inland, or high-elevation.
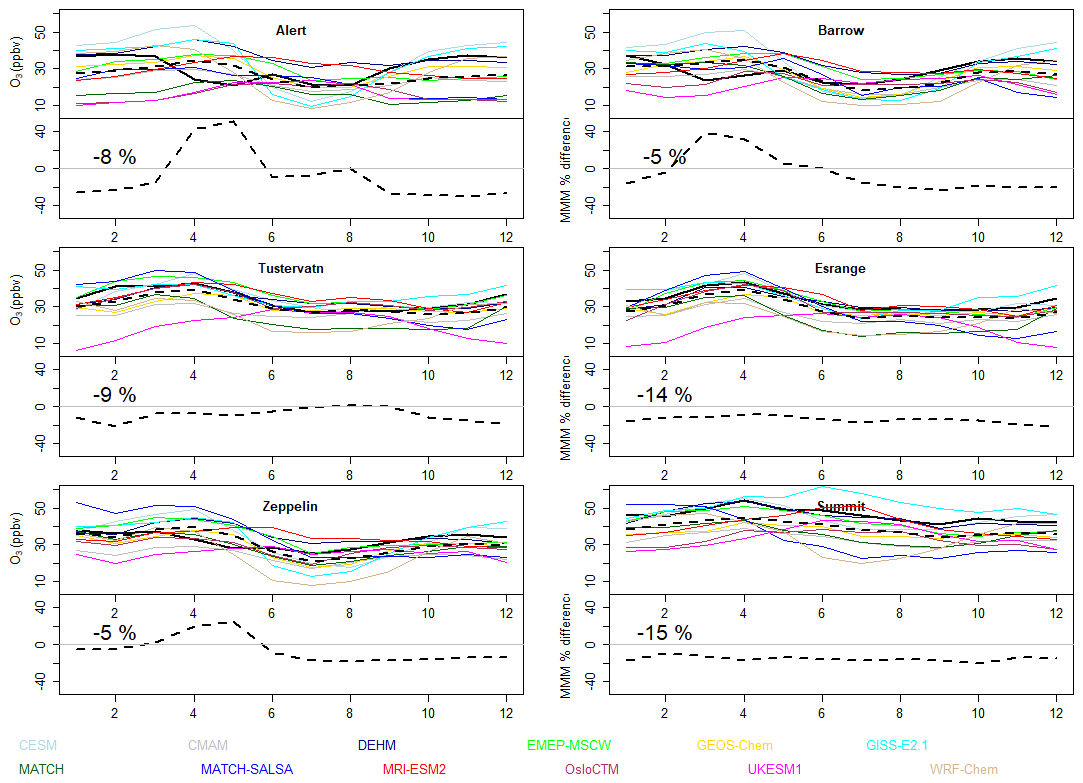
Figure 6Arctic surface O3 by month; seasonal cycle model comparisons. Top row: coastal high Arctic sites; middle row: sites near the Arctic Circle; bottom row: high-elevation sites. The solid black line is the observed O3 monthly means, and the dashed black line is the multi-model median. Bottom row: sub-panels show the MMM percent difference [(MMM − measurements)/measurements × 100]. Note that model results are from the 2014–2015 mean. When available, the same years are used for the observations. However, Alert did not have data for 2014–2015, so its most recent years were used: 2010–2013. Summit had 2014 but only 1 month in 2015, so its 2013–2015 data were used.
5.2 Surface O3 model evaluation
It has been found that halogen chemistry, stable boundary layers, and dry deposition explained differences between measured and modeled O3 concentrations, as demonstrated by Kanaya et al. (2019), who performed measurements of CO and O3 during several ship cruises in the Bering Sea and the Arctic Ocean in September (2012 to 2017). None of the models in our study contain surface halogen chemistry, but they also display highly variable agreement in their surface O3 seasonal cycles. Figure 6 shows the seasonal cycle from the models and observations averaged for 2014–2015 at several Arctic observation locations. Since the models do not contain surface-level bromine chemistry, at locations like Alert and Barrow (Utqiaġvik), they do not capture the springtime minimum in O3. Some models (e.g., UKESM1) greatly underestimate wintertime O3. This may be related to deficiencies in boundary layer mixing or an overly shallow boundary layer depth, resulting in the overly active titration of O3 by NO near NOx emission sources and subsequent underestimation of Arctic surface O3. However, other model deficiencies could also play a role, including dry deposition and NOx lifetime. Indeed, Barten et al. (2021) found that overestimation of oceanic O3 deposition can explain some differences between modeled and measured surface O3 in the high Arctic. Some models in Fig. 6 do not agree on the timing of the springtime peak, with CMAM, DEHM, and GISS-E2.1 peaking in April and EMEP MSC-W and MRI-ESM2 peaking in May–June. The same groupings of models display different O3 behavior at the end of the year (October–December), with CMAM, DEHM, and GISS-E2.1 all correctly simulating an increase in O3 and EMEP-MSC-W and MRI-ESM2 having a decrease. All models agree better with observations and each other on summertime surface O3 abundance at all locations and on the full seasonal cycle at Summit, the high-elevation background location. The large range of modeled surface O3 is similar to previous model studies (Shindell et al., 2008; Monks et al., 2015; Gaudel et al., 2018). Despite the large range in model performance, the overall average negative O3 bias and the seasonality in model bias at Barrow (Utqiaġvik) and Summit are consistent with these previous studies. The comparisons highlight little change in the skill of models in simulating Arctic surface O3 over the past decade.
These particular model simulations have been evaluated in Whaley et al. (2022), who grouped all western Arctic (defined as lat N, and long ) and eastern Arctic (lat N, long ) O3 measurements together and showed the range in modeled and measured seasonal cycles for those two regions. That analysis included additional locations at lower latitudes, and thus their results emphasized that some models overestimated summertime O3 in the western Arctic. Otherwise, the results from that study are consistent with what we report here.
5.3 Ozone precursors
NOx monitors have been used at several Arctic sites, but in a study at Zeppelin, it was shown that most of the NOx was in the form of the reservoir species PAN (Beine et al., 1997; Beine and Krognes, 2000). We evaluate and discuss PAN in Sect. 6.3 from aircraft measurements. There are only limited sources for NOx in the Arctic and the lifetime of NOx is on the order of a day. Whaley et al. (2022) evaluated surface NOx volume mixing ratios and found that these models underestimated surface NO2 by −59 % at low Arctic latitudes that were mostly around 60∘ N.
The dominant source for NOx is long-range transport of dominantly PAN (Beine and Krognes; 2000) and particulate-bound HNO3, followed by reactivation in the Arctic by thermal decomposition and photoreduction processes, respectively. Kramer et al. (2015) determined at Summit from July 2008 to July 2010 that PAN accounted for 295 ppt and NOx for 88 ppt. In a more recent study, Huang et al. (2017) found in the period July 2008–June 2010 that PAN and NOx were maximum in spring at about 250 ppt and 25 ppt, respectively, and in summer 75 and 20 ppt, respectively. Beine and Krognes (2000) measured PAN at Zeppelin Mountain between 1994 and 1996. They found that 3-month seasonal mean values were lowest in summer at 89.4 ppt and highest in spring at 222.6 ppt. HNO3 in the gas phase is in general very low (Wespes et al., 2012). Particulate-bound nitrate – potentially a significant source of NOx in the atmosphere and snowpack – is close to the detection limit in summer and up to 124.7 ng N m−3 in winter at Villum (Nguyen et al., 2013).
In general, non-methane VOC (NMVOC) concentrations in the Arctic are low, and thus their photo-oxidation has only a limited impact on O3. There is a long-term measurement study by Gautrois et al. (2003): studies that focus on long-range transport (Stohl, 2006; Harrigan et al., 2011), snowpack emissions (Boudries et al., 2002; Dibb and Arsenault, 2002; Guimbaud et al., 2002; Barret et al., 2011; Gao et al., 2012), and shipborne measurements (Sjostedt et al., 2012 and Mungall et al., 2017). The Gautrois et al. (2003) study reported long-term VOC concentrations for Alert, NU; they found that yearly levels of ethane, propane, and toluene are 1.7, 0.6, and 26 pptv, respectively. For comparison, mixing ratios of ethane, propane, and toluene in China ranged from 3.7–17, 1.5–20.8, and 0.4–11.2 ppbv, respectively (Barletta et al., 2005).
Pernov et al. (2021) measured organic O3 precursors online with a proton-transfer-reaction time-of-flight mass spectrometer (PTR-ToF-MS) at Villum from April to October 2018. Sources were apportioned with positive matrix factorization. During the late spring, the Arctic haze factor was a source of oxygenated VOCs (OVOCs) arising from long-range transport of anthropogenic emissions, whilst during summer, OVOCs, namely organic acids, and dimethyl sulfide (DMS) originated from the marine cryosphere factor, with source regions in the Greenland Sea. During autumn, the biomass burning factor peaked in importance and was dominated by acetonitrile. The most abundant compound during the campaign was acetone, with a mean mixing ratio of 0.6 ppbv, as well as 0.027 ppbv for benzene and 0.046 ppbv for DMS. In the future, local NMVOC emissions might increase from both natural and anthropogenic sources due to retreating sea ice, with more biological activity, more industrial activity, and shipping affecting future levels of O3. The long-term VOC measurements at Zeppelin and Pallas (Platt et al., 2022; Hellén et al., 2015) provide valuable datasets for better understanding tropospheric O3 at those locations. However, in this study, models did not provide much VOC output and, when they did so, only as monthly means of a few species (e.g., ethane C2H6). Therefore, we did not evaluate modeled VOCs in this study other than CO.
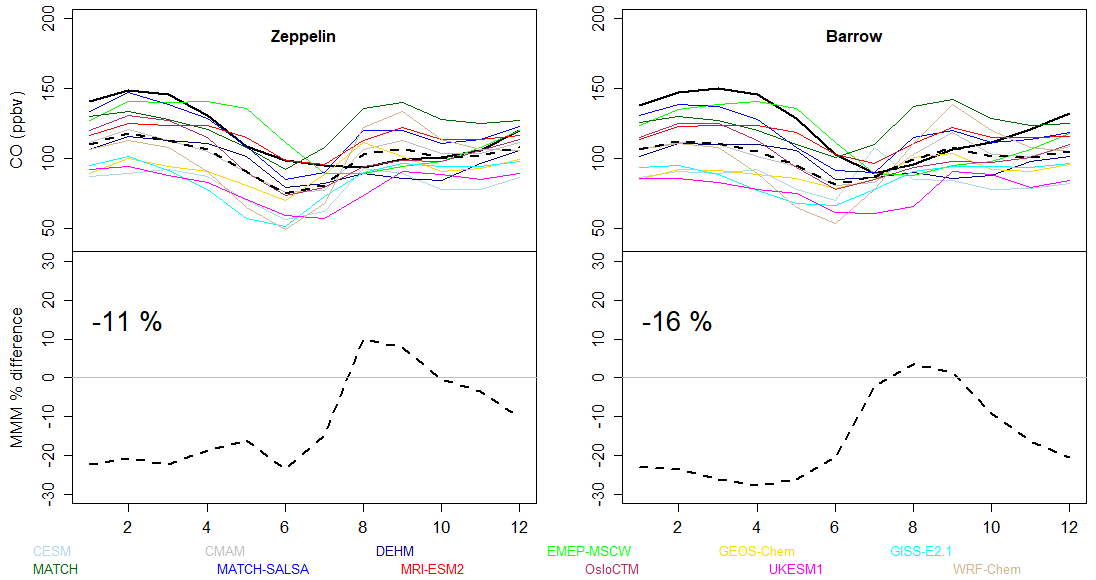
Figure 7Arctic surface CO by month; seasonal cycle model comparisons. The solid black line represents the observed CO monthly means, and the dashed black line is the multi-model median (MMM). Bottom panels show the MMM percent difference [(MMM − measurements)/measurements × 100]. Note that model results are from the 2014–2015 mean. When available, the same years are used for the observations. However, for Zeppelin observations are the mean of 2013–2014.
Figure 7 shows the observed and simulated seasonal cycle of CO at Zeppelin and Barrow (Utqiaġvik). Simulated CO ranges about 50 ppbv across models, and all models underestimate surface CO at these sites. The low model biases are dominated by the winter and spring months. The 2014–2015 annual multi-model median (MMM) bias is −11 % and −16 % at Zeppelin and Barrow (Utqiaġvik), respectively. Figure 7 shows that for the first 6 months of the year, the MMM is 20 %–30 % too low, but that in the summer, the MMM is much closer to observations. These CO results are very similar to those found in previous multi-model studies (Shindell et al., 2008; Monks et al., 2015; Whaley et al., 2022). Similar to O3, these results imply little change in the skill of models in simulating Arctic surface CO over the past decade. The modeled CO underestimations are well-reported in the literature and attributed to either a lack of CO from combustion sources in the emission inventories (e.g., Kasibhatla et al., 2002; Pétron et al., 2002; Jiang et al., 2015) or to errors in OH, which impact the lifetime of CO (e.g., Monks et al., 2015; Quennehen et al., 2016). Indeed, both may be at cause here, as the anthropogenic CO emissions from ECLIPSEv6b are lower than those in the CMIP6 emission inventory, neither of which have taken into account the reported discrepancies from top-down emissions studies (Kasibhatla et al., 2002; Pétron et al., 2002; Jiang et al., 2015, Miyazaki et al., 2020). Monks et al. (2015) showed that models with lower global mean OH concentrations produced smaller underestimates in Arctic surface CO and that models with larger underestimates in CO over midlatitude source regions also had larger underestimates in Arctic CO. Emmons et al. (2015) showed that the models with larger tropospheric OH also had higher photolysis rates of O3 to O(1D) and that there was also some relationship between higher photolysis rates and lower cloud cover fraction in some models. Previous multi-model results have also shown that variability in model water vapor abundance in the Arctic appeared to be the leading driver of model variability in OH, despite being much less important at lower latitudes (Monks et al., 2015). Evaluating OH and water vapor is unfortunately beyond the scope of our study.
The models of this study prescribed CH4 concentrations, including their increasing trend, and they were found to have a small bias of ∼2 % in Whaley et al. (2022) compared to surface and satellite measurements. Going forward, models are starting to simulate CH4 explicitly from emissions, and this will be important for simulating future changes in Arctic tropospheric chemistry.
Observations and models have both demonstrated extensive layering of pollution signatures in the Arctic troposphere vertical profile, associated with varying air mass origins with altitude (Zheng et al., 2021; Willis et al., 2019). Large-scale isentropic transport pathways result in air masses from warmer more southerly latitudes being imported into the Arctic upper troposphere, while emissions from cooler northerly latitudes enter the Arctic near the surface and in the lower troposphere (Stohl, 2006). The presence of the Arctic dome during winter essentially shuts off access to the Arctic surface to air mass import from southerly midlatitudes, while it facilitates efficient low-level transport of emissions from northern Eurasia and Russia to the Arctic surface, giving rise to the well-known Arctic haze (Shaw, 1995). In practice, this large-scale dynamical control on long-range transport to the Arctic gives rise to a well-characterized vertical dependence of source region sensitivities for O3 and precursors through the Arctic troposphere, where emissions from South and East Asia have the most influence in the Arctic upper troposphere, emissions from North America have the most influence in the Arctic mid-troposphere, and northern Eurasian and Russian emissions dominate at the surface (in addition to local influences) (Wespes et al., 2012; Monks et al., 2015). As mentioned in Sect. 1, this vertical layering and changes in the efficacy of O3 radiative forcing with altitude have implications for the sensitivity of Arctic tropospheric O3 forcing to regional emission perturbations.
Despite evidence for extensive vertical layering in the Arctic troposphere and the potential for highly varying source contributions with altitude, aside from a limited set of regular O3 sonde profiles, there is a severe lack of observations available on the vertical distribution of O3, and particularly its precursors, in the Arctic troposphere. There is an especially poor constraint on seasonal and interannual variability in O3 precursor profiles. In this section, we make use of available vertical profile measurements of O3 and its precursors to document our understanding of Arctic tropospheric O3 profiles and to evaluate model-simulated vertical profiles of O3 and precursors.
6.1 Ozonesondes
Ozone soundings provide a long-term record of Arctic O3 through the depth of the troposphere. Since 1966, weekly soundings have been available at Resolute, and since the 1980s regular soundings, typically once a week, have been available from six stations north of 60∘ N (Fig. 4, Table S2). All of these stations are located in the Canadian and European sectors, meaning that regular soundings are lacking in a large sector of the Arctic (e.g., Russia and Alaska). The measurements are conducted using the balloon-borne electrochemical concentration cell (ECC) ozonesondes, typically reaching an altitude of about 30 km. Random uncertainties in tropospheric measurements are about 5 %, and biases reported from field and laboratory comparisons to UV reference photometers are 1.0 ± 4.4 % in the lower troposphere and 5.3 ± 4.4 % in the upper troposphere (Tarasick et al., 2019b). Mean observed concentrations have a minimum close to the surface, gradually increase throughout the troposphere by about 50 %, and then increase sharply going into the upper troposphere and lower stratosphere (Figs. 8 and S1–2 in the Supplement). Observed seasonal cycles in the Arctic troposphere generally show a maximum in spring and summer and a minimum in fall and winter. For example, Christiansen et al. (2017) examined long-term ozonesonde records at nine Arctic stations reporting consistent seasonal cycles as a function of altitude between sites with later maxima in the mid-troposphere compared to the surface layers and upper troposphere.

Figure 8Comparison between observed (thick black line in the left panels) and AMAP models' (colored lines) O3 seasonal averages for 2014–2015 at Eureka, NV, Canada. These use monthly mean model output. In each right panel, the dotted black line is the MMM, and the dashed black line shows zero bias for reference. See Fig. S1 for the rest of the ozonesonde locations and a sample comparison done with 3-hourly model output (Fig. S2).
6.2 Model evaluation against ozonesondes
Figure 8 shows a comparison of the ozonesonde measurements at Eureka to the simulations from the 12 participating models for the annual and seasonal averages for the years 2014–2015. In the Supplement (Fig. S2), model–measurement comparisons at other Arctic locations are shown. Generally, the models are highly variable, ranging ±50 % of the measured O3 profiles for most seasons and locations. The MMM performs well and is within ±8 % throughout most of the troposphere. However, all models, except UKESM1, have a bulge with a high model bias around 300–400 hPa, which is at or near the tropopause, implying that most models simulate the tropopause height too low (having larger stratospheric O3 concentrations appearing too low in altitude). This results in a positive bias of about 20 % for the MMM around the tropopause. This feature in models was also reported in AMAP (2015), where model biases were particularly large at Ny-Ålesund and Summit. They associated those with differences in the transport of air masses from the stratosphere. This issue will have an impact on estimating the tropospheric O3 burden, which is a common climate diagnostic (Griffiths et al., 2021).
At Alert, there are both surface and ozonesonde measurements, and we find that the results in the lowest levels of the Alert ozonesonde comparisons (Fig. S1) are consistent with the model biases found in Fig. 8 in that both show the models underestimating winter and fall O3, overestimating spring, and matching observations well in the summer at this location.
Note that the models' monthly average O3 values were used in this comparison, which does not match the time of day and day of the week of the ozonesonde measurements. However, when a careful time matching to 3-hourly model output is carried out, the general features of the model biases remain the same (Fig. S2), likely because of the lack of a strong diurnal cycle in Arctic O3 and its relatively long lifetime in the free troposphere.
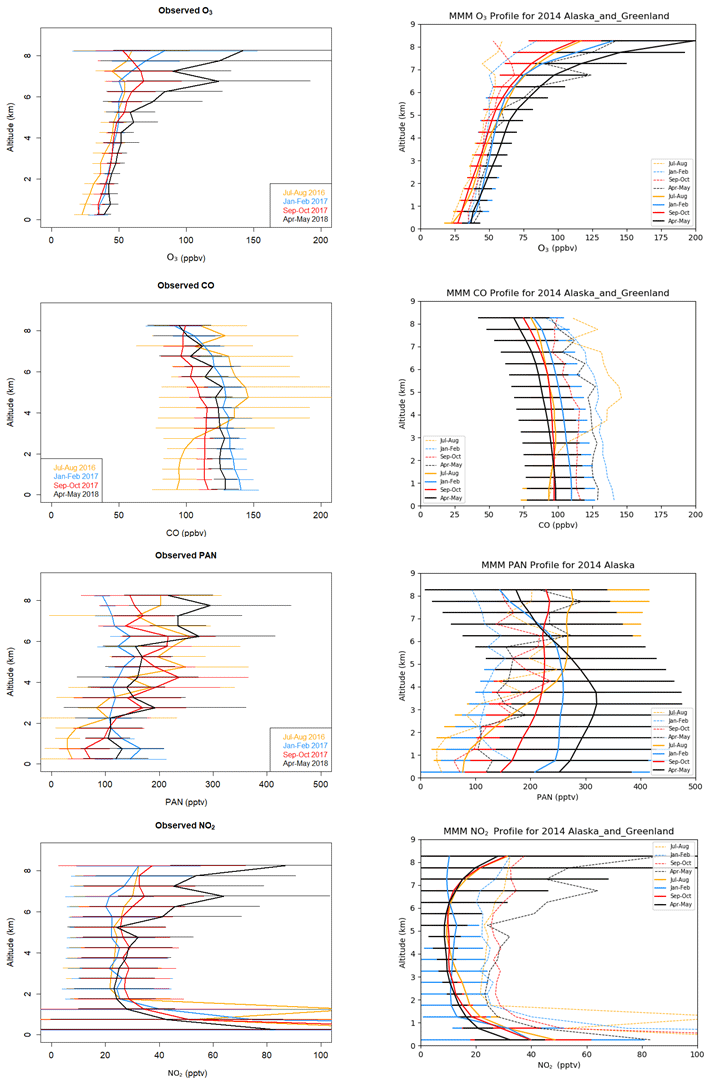
Figure 9Mean vertical profiles of O3, CO, PAN, and NO2 (left) measured in Alaska and Greenland from the NASA ATom missions during summer 2016, winter 2017, autumn 2017, and spring 2018 (horizontal lines indicate 1 standard deviation spread around mean values at each altitude). The (right) MMM for the years 2014–2015 (with the MMM standard deviation as horizontal lines). The observations appear as dashed lines in the right panels for ease of comparing to the MMM.
The results of this model evaluation of the Arctic O3 vertical profiles are consistent with Whaley et al. (2022), who compared the same model simulations to TES O3 retrievals throughout the troposphere at lower Arctic locations (∼60–70∘ N). They found models to be biased low (around −10 %), though the TES measurements have been shown to be biased high by about the same amount (+13 % bias in TES measurements reported in Verstraeten et al., 2013). They also saw a small positive shift in the model bias profile around 300 hPa. Finally, the Whaley et al. (2022) study included O3, NOx, CH4, and CO comparisons to the Atmosphere Chemistry Experiment (ACE) Fourier Transform Spectrometer (FTS) satellite instrument, and those results also independently implied that the modeled tropopause heights are too low.
6.3 Vertical distribution of O3 precursors
Intensive field measurement campaigns using aircraft provide the most detailed observational constraint on vertical profiles of tropospheric O3 precursors in the Arctic. While these datasets tend to provide excellent spatial and temporal resolution measurements on a wide range of species, they are episodic in nature and often cover only a period of a few days to several weeks, flying in specific regions of the Arctic and often targeting specific layers or plumes. For example, Ancellet et al. (2016) examined aircraft, lidar, and ozonesonde data over Canada and Greenland during the summer of 2008 POLARCAT campaigns (Law et al., 2014). This study showed clear latitudinal and longitudinal variations in the origins of sampled air masses based on back trajectories and O3 potential vorticity (PV) correlations. While downward transport of O3 was important over Greenland, air masses with higher O3 were attributed to North American boreal fires over Canada. Transport of polluted air masses from midlatitudes also contributed, for example from Asia north of 80∘ N.
The airborne NASA ATom (Atmospheric Tomography) mission (Wofsy et al., 2018; Thompson et al., 2022) has undertaken extensive surveying of the global troposphere. This includes repeated vertical profile measurements between 60 and 90∘ N providing useful insights into the variation of O3 (Bourgeois et al., 2020) and its precursors through the depth of the Arctic troposphere at different times of the year. Figure 9 shows these mean results and their standard deviation in the left-side panels, while the equivalent MMM results are in the right-side panels. The models' monthly mean results went into the MMM calculation, and the standard deviation from the models is shown.
The results show that near-surface NO2 is greatly enhanced during winter, associated with a longer NO2 lifetime and accumulation of pollution in the Arctic haze. The MMM simulates the surface NO2 increase and the seasonality of the NO2 profiles reasonably well. However, generally, the modeled NO2 is biased low in the tropospheric profile, having average values of about 15 pptv in the 2–6 km range, whereas the measurements are about 25 pptv on average. This underestimate is consistent with that found at the surface by Whaley et al. (2022). PAN is also enhanced at the surface in the winter and can thermally decompose in the spring and summer to release NOx. The MMM generally overestimates PAN (Fig. 9c–d) and does not simulate the same shape in vertical profiles. For example, models are not able to simulate the wintertime surface-level increase in PAN, and they have the inverse shape of the observed profile in April–May. The best agreement is in summertime PAN (July–August), when the MMM vertical profile better matches that of the observations. The underestimate of NOx and the lack of winter surface increases in PAN by the models may be a reason why the wintertime surface O3 concentrations in Sect. 5.2 and Fig. 5 were underestimated.
In line with ozonesonde data and previous airborne campaigns (AMAP, 2015), ATom profiles also demonstrate a springtime enhancement in O3 extending through the troposphere, with evidence of stratospheric influence in the upper troposphere and lower O3 in the summertime lower troposphere. The models capture that springtime O3 enhancement as well. Summer enhancements in O3 precursors, such as CO and PAN in the mid-troposphere, were also observed associated with the import of forest fire and anthropogenic emissions from lower latitudes, as also seen during POLARCAT in 2008. The models capture this feature for PAN, but less so for CO. Indeed, most models underestimate CO. The annual mean MMM bias for surface CO in the Northern Hemisphere has been reported to be −30 % (Whaley et al., 2022). Figure 9 shows that below the tropopause, modeled O3 is actually close to observed O3, despite the significant MMM biases for CO, NOx, and PAN. Around the tropopause, the aircraft data show the same issue that the ozonesonde data did – that models significantly overestimate O3 near the tropopause.
Recent research on Arctic tropospheric O3 has resulted in improvements to our understanding of this pollutant and GHG in the rapidly changing and sensitive Arctic environment. We have shown in this study that Arctic surface O3 seasonal cycles are different depending on whether sites are near the coast, inland, or at high elevation. Coastal sites have springtime minima due to halogen chemistry causing ODEs and show a maximum during the winter. The inland locations near the Arctic Circle have quite consistent seasonal cycles, with maxima in April and minima in August. While the high-elevation sites that are less influenced by halogen chemistry than coastal locations are more variable, Summit has a later maximum (May) and minimum (September); Zeppelin has an earlier maximum (March) and minimum (July).
Despite model development that has occurred since the 2015 AMAP assessment report on ozone (AMAP, 2015) to add processes, improve parameterizations, and increase resolution, among others, the resulting performance of the models remains more or less the same in terms of model variability and biases compared to measured O3 and O3 precursor species in the Arctic. Model results for CO would improve if CO emissions from combustion were increased, as suggested in the literature. It would also be useful to compare modeled OH and VOCs in the Arctic, but that was beyond the scope of this study. However, as Arctic O3 is limited by NOx availability, improvements to CO and VOCs may not have a large effect on O3. Improvements to modeled PAN and NOx are needed; however, sensitivity studies to determine the cause of the model biases will be required to improve model performance for those species. For surface O3 distributions in the Arctic, models simulate background levels reasonably well (e.g., at the high-elevation location of Summit), but surface bromine–halogen chemistry needs to be included to simulate springtime surface O3 properly in the Arctic. Except near the tropopause, models simulate O3 throughout the vertical profile well, with the MMM performing best at ±8 % depending on the location and altitude in the troposphere. Attention to improving the height of the modeled tropopause and/or the stratosphere–tropospheric exchange is still required since downward transport of high stratospheric O3 concentrations is causing model biases around 6 to 8 km (400 to 300 hPa) to be significantly large (>20 %).
While they are logistically challenging, additional O3 measurements in the Arctic, such as O3 deposition measurements, observations of stratospheric–tropospheric exchange, and O3 concentrations in the Siberian Arctic, together with long-term measurements of O3 precursors (such as those performed at Zeppelin and Pallas), would be particularly helpful to improve our understanding and modeling capabilities. This is particularly important as climate change alters the chemistry and dynamics of tropospheric O3 in the future.
The surface monitoring datasets are available online. WDCGG for CH4: https://gaw.kishou.go.jp/login/user (last access: 14 April 2022, Global Atmosphere Watch, 2022). EBAS for European (EMEP) and several Arctic locations: http://ebas.nilu.no/ (last access: 14 April 2022, Norwegian Institute for Air Research, 2022). NAPS: https://open.canada.ca/data/en/dataset/1b36a356-defd-4813-acea-47bc3abd859b (last access: 14 April 2022, Environment and Climate Change Canada, 2022). The ozonesonde data were obtained from the World Ozone and Ultraviolet Radiation Data Centre (WOUDC) at https://woudc.org and from the Network for Detection of Atmospheric Composition Change (NDACC) at https://www.ndacc.org (last access: 4 January 2023, NDACC, 2023). The model output files in NetCDF from the simulations used in this project can be found here: https://open.canada.ca/data/en/dataset/c9a333ea-b81c-4df3-9880-ea7c3daeb76f (last access: 4 January 2023, ECCC, 2023). Some of the model codes are available online at the following locations. CESM2: https://www.cesm.ucar.edu/models/cesm2/ (last access: 14 April 2022, UCAR, 2022). GEOS-Chem: http://wiki.seas.harvard.edu/geos-chem/index.php/GEOS-Chem_12{#}12.3.2 (last access: 14 April 2022, Harvard University, 2022). GISS-E2.1: https://www.giss.nasa.gov/tools/modelE/ (last access: 14 April 2022, NASA, 2022). Oslo CTM: https://github.com/NordicESMhub/OsloCTM3 (last access: 14 April 2022, Section for Meteorology and Oceanography, 2022). The other model codes may be available upon request.
The supplement related to this article is available online at: https://doi.org/10.5194/acp-23-637-2023-supplement.
CHW, KSL, JLH, HS, SRA, JL, and JBP wrote the paper and created Figs. 3–9. RYC, JF, and XD provided the GEOS-Chem model output. JF, ST, and DT edited and provided comments on the paper. JHC provided the DEHM model output. GF, UI, and KT provided the GISS-E2.1 model output. MG and ST provided the EMEP MSC-W model output. KSL, JCR, TO, and LM provided the WRF-Chem model output. MD and NO provided the MRI-ESM2 model output. DAP provided the CMAM model output. LP provided the CESM model output. RS provided the OsloCTM model output. MAT provided the MATCH-SALSA model output. SRA and STT provided the UKESM1 model output. DT provided the Canadian ozonesonde measurements, and RK provided Finnish ozonesonde measurements. MF and KvS provided the model strategy for this project. PE and IP provided the Summit and Barrow datasets, and SS provided the Karasjok and Tustervatn datasets. GB, GH, IB, TR, JP, and CT provided the ATom datasets.
At least one of the (co-)authors is a member of the editorial board of Atmospheric Chemistry and Physics. The peer-review process was guided by an independent editor, and the authors also have no other competing interests to declare.
Publisher's note: Copernicus Publications remains neutral with regard to jurisdictional claims in published maps and institutional affiliations.
We wish to acknowledge Siyuan Wang and Kerri A. Pratt for their figure originally published in PNAS, as well as Jeffrey Seabrook and James Whiteway for their figure originally published in the Journal of Geophysical Research. We thank the ATom team for the original aircraft measurements. The technicians and logistical support staff at the different stations are gratefully acknowledged for their work, particularly Doug Worthy for Alert data, Karin Sjöberg for the Esrange data, and Karri Saarnio for the Pallas data.
Makoto Deushi and Naga Oshima were supported by the Japan Society for the Promotion of Science KAKENHI (grant numbers: JP18H03363, JP18H05292, JP19K12312, JP20K04070 and JP21H03582), the Environment Research and Technology Development Fund (JPMEERF20202003 and JPMEERF20205001) of the Environmental Restoration and Conservation Agency of Japan, the Arctic Challenge for Sustainability II (ArCS II) under program grant number JPMXD1420318865, and a grant for the Global Environmental Research Coordination System from the Ministry of the Environment, Japan (MLIT1753 and MLIT2253). Joakim Langner and Manu A. Thomas were supported by the Swedish Environmental Protection Agency through contract NV-03174-20 and the Swedish Clean Air and Climate research program. Svetlana Tsyro and Michael Gauss have received support from the AMAP Secretariat and the EMEP Trust Fund. Ulas Im received support from the Aarhus University Interdisciplinary Centre for Climate Change (iClimate) OH fund (no. 2020-0162731), the FREYA project funded by the Nordic Council of Ministers (grant agreement nos. MST-227-00036 and MFVM-2019-13476), and the EVAM-SLCF funded by the Danish Environmental Agency (grant agreement no. MST-112-00298). Henrik Skov received funding from the Danish Ministry for Energy, Climate and Utilities (grant agreement no. 2018-3767), the Danish Environmental Agency (grant agreement no. MST-113-00140), and AMA. Kostas Tsigaridis and Gregory Faluvegi received support from the NASA Modeling, Analysis and Prediction Program (MAP). Steven T. Turnock received financial support from the Arctic Monitoring and Assessment Programme. Kathy S. Law, Jean-Christophe Raut, Louis Marelle, and Tatsuo Onishi (LATMOS) received support from the EU iCUPE (Integrating and Comprehensive Understanding on Polar Environments) project (grant agreement no. 689443) under the European Network for Observing our Changing Planet (ERA-Planet) and from access to IDRIS HPC resources (GENCI allocation A009017141) as well as the IPSL mesoscale computing center (CICLAD: Calcul Intensif pour le CLimat, l'Atmosphère et la Dynamique) for model simulations. Jesper Christensen (DEHM model) received support from the Danish Environmental Protection Agency and Danish Energy Agency (DANCEA funds for Environmental Support to the Arctic Region project: grant no. 2019-7975, grant no. MST-112- 00298, grant no. TAS 4005-0153). Stephen R. Arnold and Steven T. Turnock both received financial support from the Arctic Monitoring and Assessment Programme. Stephen R. Arnold also received support from the UK Natural Environment Research Council and Belmont Forum via the ACRoBEAR project (grant NE/T013672/1). Joshua Fu received funding from the Oak Ridge Leadership Computing Facility at the Oak Ridge National Laboratory, which is supported by the Office of Science of the U.S. Department of Energy under contract no. DE-AC05-00OR22725. The research by Irina Petropavlovskikh and Peter Effertz was supported by NOAA cooperative agreements NA17OAR4320101 and NA22OAR4320151.
This paper was edited by Radovan Krejci and reviewed by two anonymous referees.
Aas, W., Eckhardt, S., Fiebig, M., Platt, S. M., Solberg, S., Yttri, K. E., and Zwaaftink, C. G.: Monitoring of long-range transported air pollutants in Norway. Annual Report 2020 (Norwegian Environment Agency, M-2072/2021), (NILU report, 13/2021). Kjeller: NILU, 2021.
Abbatt, J. P. D., Thomas, J. L., Abrahamsson, K., Boxe, C., Granfors, A., Jones, A. E., King, M. D., Saiz-Lopez, A., Shepson, P. B., Sodeau, J., Toohey, D. W., Toubin, C., von Glasow, R., Wren, S. N., and Yang, X.: Halogen activation via interactions with environmental ice and snow in the polar lower troposphere and other regions, Atmos. Chem. Phys., 12, 6237–6271, https://doi.org/10.5194/acp-12-6237-2012, 2012.
Aliabadi, A. A., Staebler, R. M., and Sharma, S.: Air quality monitoring in communities of the Canadian Arctic during the high shipping season with a focus on local and marine pollution, Atmos. Chem. Phys., 15, 2651–2673, https://doi.org/10.5194/acp-15-2651-2015, 2015.
Aliabadi, A. A., Thomas, J. L., Herber, A. B., Staebler, R. M., Leaitch, W. R., Schulz, H., Law, K. S., Marelle, L., Burkart, J., Willis, M. D., Bozem, H., Hoor, P. M., Köllner, F., Schneider, J., Levasseur, M., and Abbatt, J. P. D.: Ship emissions measurement in the Arctic by plume intercepts of the Canadian Coast Guard icebreaker Amundsen from the Polar 6 aircraft platform, Atmos. Chem. Phys., 16, 7899–7916, https://doi.org/10.5194/acp-16-7899-2016, 2016.
AMAP: Arctic Monitoring and Assessment Programme, Assessment 2015: Black carbon and ozone as Arctic climate forcers, Technical report, AMAP, Oslo, Norway, vii C 116 pp., 2015.
AMAP: Arctic Monitoring and Assessment Programme, Assessment 2022: short-lived climate forcers, Technical report, AMAP, Oslo, Norway, https://www.amap.no/documents/doc/amap-assessment-2021-impacts-of-short-lived-climate-forcers-on-arctic-climate-air-quality-and-human-health/3614 (last access: 14 April 2022), in press, 2022.
Ancellet, G., Daskalakis, N., Raut, J. C., Tarasick, D., Hair, J., Quennehen, B., Ravetta, F., Schlager, H., Weinheimer, A. J., Thompson, A. M., Johnson, B., Thomas, J. L., and Law, K. S.: Analysis of the latitudinal variability of tropospheric ozone in the Arctic using the large number of aircraft and ozonesonde observations in early summer 2008, Atmos. Chem. Phys., 16, 13341–13358, https://doi.org/10.5194/acp-16-13341-2016, 2016.
Andersson, C., Alpfjord, H., Robertson, L., Karlsson, P. E., and Engardt, M.: Reanalysis of and attribution to near-surface ozone concentrations in Sweden during 1990–2013, Atmos. Chem. Phys., 17, 13869–13890, https://doi.org/10.5194/acp-17-13869-2017, 2017.
Arnold, S. R., Emmons, L. K., Monks, S. A., Law, K. S., Ridley, D. A., Turquety, S., Tilmes, S., Thomas, J. L., Bouarar, I., Flemming, J., Huijnen, V., Mao, J., Duncan, B. N., Steenrod, S., Yoshida, Y., Langner, J., and Long, Y.: Biomass burning influence on high-latitude tropospheric ozone and reactive nitrogen in summer 2008: a multi-model analysis based on POLMIP simulations, Atmos. Chem. Phys., 15, 6047–6068, https://doi.org/10.5194/acp-15-6047-2015, 2015.
Badia, A., Iglesias-Suarez, F., Fernandez, R. P., Cuevas, C. A., Kinnison, D. E., Lamarque, J.-F., Griffiths, P. T., Tarasick, D. W., Liu, J., and Saiz-Lopez, A.: The role of natural halogens in global tropospheric ozone chemistry and budget under different 21st century climate scenarios, J. Geophys. Res.-Atmos., 126, e2021JD034859. https://doi.org/10.1029/2021JD034859, 2021.
Bahramvash Shams, S., Walden, V. P., Petropavlovskikh, I., Tarasick, D., Kivi, R., Oltmans, S., Johnson, B., Cullis, P., Sterling, C. W., Thölix, L., and Errera, Q.: Variations in the vertical profile of ozone at four high-latitude Arctic sites from 2005 to 2017, Atmos. Chem. Phys., 19, 9733–9751, https://doi.org/10.5194/acp-19-9733-2019, 2019.
Barrie, L., Bottenheim, J., Schnell, R. Crutzen, P. J., and Rasmussen, R. A.: Ozone destruction and photochemical reactions at polar sunrise in the lower Arctic atmosphere, Nature, 334, 138–141, https://doi.org/10.1038/334138a0, 1988.
Barletta, B., Meinardi, S., Sherwood Rowland, F., Chan, C.-Y., Wang, X., Zou, S., Yin Chan, L., and Blake, D. R.: Volatile organic compounds in 43 Chinese cities, Atmos. Environ., 39, 5979–5990, https://doi.org/10.1016/j.atmosenv.2005.06.029, 2005.
Barten, J. G. M., Ganzeveld, L. N., Steeneveld, G.-J., and Krol, M. C.: Role of oceanic ozone deposition in explaining temporal variability in surface ozone at High Arctic sites, Atmos. Chem. Phys., 21, 10229–10248, https://doi.org/10.5194/acp-21-10229-2021, 2021.
Beine, H. J., Jaffe, D. a., Herring, J. a., Kelley, J. a., Krognes, T., and Stordal, F.: High-Latitude Springtime Photochemistry. Part I: NOx, PAN and Ozone Relationships, J. Atmos. Chem., 27, 127–153, https://doi.org/10.1023/A:1005869900567, 1997.
Beine, H. J. and Krognes, T.: The seasonal cycle of peroxyacetyl nitrate (PAN) in the European Arctic, Atmos. Environ., 34, 933–940, 2000.
Benavent, N., Mahajan, A.S., Li, Q., Cuevas, C. A., Schmale, J., Angot, H., Jokinen, T., Quéléver, L. L. J., Blechschmidt, A.-M., Zilker, B., Richter, A., Serna, J. A., Garcia-Nieto, D., Fernandez, R. P., Skov, H., Demitrascu, A., Pereira, P. S., Abrahamsson, L., Bucci, S., Duetsch, M., Stohl, A., Beck, I., Laurila, T., Blomquist, B., and Saiz-Lopez, A.: Substantial contribution of iodine to Arctic ozone destruction, Nat. Geosci., 15, 770–773, https://doi.org/10.1038/s41561-022-01018-w, 2022.
Berg, T., Sekkesaeter, S., Steinnes, E., Valdal, A. K., Wibetoe, G.: Springtime depletion of mercury in the European Arctic as observed at Svalbard, Sci. Total Environ., 304, 43–51, https://doi.org/10.1016/S0048-9697(02)00555-7, 2003.
Bottenheim, J. W., Netcheva, S., Morin, S., and Nghiem, S. V.: Ozone in the boundary layer air over the Arctic Ocean: measurements during the TARA transpolar drift 2006–2008, Atmos. Chem. Phys., 9, 4545–4557, https://doi.org/10.5194/acp-9-4545-2009, 2009.
Bourgeois, I., Peischl, J., Thompson, C. R., Aikin, K. C., Campos, T., Clark, H., Commane, R., Daube, B., Diskin, G. W., Elkins, J. W., Gao, R.-S., Gaudel, A., Hintsa, E. J., Johnson, B. J., Kivi, R., McKain, K., Moore, F. L., Parrish, D. D., Querel, R., Ray, E., Sánchez, R., Sweeney, C., Tarasick, D. W., Thompson, A. M., Thouret, V., Witte, J. C., Wofsy, S. C., and Ryerson, T. B.: Global-scale distribution of ozone in the remote troposphere from the ATom and HIPPO airborne field missions, Atmos. Chem. Phys., 20, 10611–10635, https://doi.org/10.5194/acp-20-10611-2020, 2020.
Brooks, S., Moore, C., Lew, D., Lefer, B., Huey, G., and Tanner, D.: Temperature and sunlight controls of mercury oxidation and deposition atop the Greenland ice sheet, Atmos. Chem. Phys., 11, 8295–8306, https://doi.org/10.5194/acp-11-8295-2011, 2011.
Burd, J. A., Peterson, P. K., Nghiem, S. V., Perovich, D. K., and Simpson, W. R.: Snowmelt onset hinders bromine monoxide heterogeneous recycling in the Arctic, J. Geophys. Res. Atmos., 122, 8297–8309, https://doi.org/10.1002/2017JD026906, 2017.
Christiansen, B., Jepsen, N., Kivi, R., Hansen, G., Larsen, N., and Korsholm, U. S.: Trends and annual cycles in soundings of Arctic tropospheric ozone, Atmos. Chem. Phys., 17, 9347–9364, https://doi.org/10.5194/acp-17-9347-2017, 2017.
Dastoor, A. P., Davignon, D., Theys, N., Van Roozendael, M., Steffen, A., and Ariya, P. A.: Modeling Dynamic Exchange of Gaseous Elemental Mercury at Polar Sunrise, Environ. Sci. Technol., 42, 5183–5188, 2008.
Emmons, L. K., Arnold, S. R., Monks, S. A., Huijnen, V., Tilmes, S., Law, K. S., Thomas, J. L., Raut, J.-C., Bouarar, I., Turquety, S., Long, Y., Duncan, B., Steenrod, S., Strode, S., Flemming, J., Mao, J., Langner, J., Thompson, A. M., Tarasick, D., Apel, E. C., Blake, D. R., Cohen, R. C., Dibb, J., Diskin, G. S., Fried, A., Hall, S. R., Huey, L. G., Weinheimer, A. J., Wisthaler, A., Mikoviny, T., Nowak, J., Peischl, J., Roberts, J. M., Ryerson, T., Warneke, C., and Helmig, D.: The POLARCAT Model Intercomparison Project (POLMIP): overview and evaluation with observations, Atmos. Chem. Phys., 15, 6721–6744, https://doi.org/10.5194/acp-15-6721-2015, 2015.
ECCC (Environment and Climate Change Canada) AMAP SLCF model datasets [data set], https://open.canada.ca/data/en/dataset/c9a333ea-b81c-4df3-9880-ea7c3daeb76f, last access: 4 January 2023.
Eckhardt, S., Hermansen, O., Grythe, H., Fiebig, M., Stebel, K., Cassiani, M., Baecklund, A., and Stohl, A.: The influence of cruise ship emissions on air pollution in Svalbard – a harbinger of a more polluted Arctic?, Atmos. Chem. Phys., 13, 8401–8409, https://doi.org/10.5194/acp-13-8401-2013, 2013.
Eneroth, K., Holmén, K., Berg, T., Schmidbauer, N., and Solberg, S.: Springtime depletion of tropospheric ozone, gaseous elemental mercury and non-methane hydrocarbons in the European Arctic, and its relation to atmospheric transport, Atmos. Environ., 41, 8511–8526, https://doi.org/10.1016/j.atmosenv.2007.07.008, 2007.
Environment and Climate Change Canada (ECCC): NAPS dataset, ECCC [data set], https://open.canada.ca/data/en/dataset/1b36a356-defd-4813-acea-47bc3abd859b, last access: 14 April 2022.
Esau, I. and Sorokina, S.: Climatology of the Arctic Planetary Boundary Layer, Chapter 1 in Atmospheric Turbulence, Meteorological Modeling, ISBN 978-1-60741-091-1, Eds: Peter R. Lang and Frank S. Lombargo, 2016.
Falk, S. and Sinnhuber, B.-M.: Polar boundary layer bromine explosion and ozone depletion events in the chemistry–climate model EMAC v2.52: implementation and evaluation of AirSnow algorithm, Geosci. Model Dev., 11, 1115–1131, https://doi.org/10.5194/gmd-11-1115-2018, 2018.
Fiore, A. M., West, J. J., Horowitz, L. W., Naik, V., and Schwarzkopf, M. D.: Characterizing the tropospheric ozone response to methane emission controls and the benefits to climate and air quality, J. Geophys. Res., 113, D08307, https://doi.org/10.1029/2007JD009162, 2008.
Flanner, M. G., Huang, X., Chen, X., and Krinner, G.: Climate Response to Negative Greenhouse Gas Radiative Forcing in Polar Winter, Geophys. Res. Lett., 45, 1997–2004, https://doi.org/10.1002/2017GL076668, 2018.
Gaudel, A., Cooper, O. R., Ancellet, G., Barret, B., Boynard, A., Burrows, J. P., Clerbaux, C., Coheur, P.-F., Cuesta, J., Cuevas, E., Doniki, S., Dufour, G., Ebojie, F., Foret, G., Garcia, O., Granados-Muñoz, M. J., Hannigan, J. W., Hase, F., Hassler, B., Huang, G., Hurtmans, D., Jaffe, D., Jones, N., Kalabokas, P., Kerridge, B., Kulawik, S., Latter, B., Leblanc, T., Le Flochmoën, E., Lin, W., Liu, J., Liu, X., Mahieu, E., McClure-Begley, A., Neu, J. L., Osman, M., Palm, M., Petetin, H., Petropavlovskikh, I., Querel, R., Rahpoe, N., Rozanov, A., Schultz, M. G., Schwab, J., Siddans, R., Smale, D., Steinbacher, M., Tanimoto, H., Tarasick, D. W., Thouret, V., Thompson, A. M., Trickl, T., Weatherhead, E., Wespes, C., Worden, H. M., Vigouroux, C., Xu, X., Zeng, G., and Ziemke, J.: Tropospheric Ozone Assessment Report: Present-day distribution and trends of tropospheric ozone relevant to climate and global atmospheric chemistry model evaluation. Elem. Sci. Anth., 6, 39, https://doi.org/10.1525/elementa.291, 2018.
Gautrois, M., Brauers, T., Koppmann, R., Rohrer, F., Stein, O., and Rudolph, J.: Seasonal variability and trends of volatile organic compounds in the lower polar troposphere, J. Geophys. Res., 108, 4393, https://doi.org/10.1029/2002JD002765, D13, 2003.
Ghirardo A, Lindstein F, Koch K, Buegger, F., Schloter, M., Albert, A., Michelsen, A., Barbro Winkler, J., Schnitzler, J.-P., and Rinnan, R.: Origin of volatile organic compound emissions from subarctic tundra under global warming, Glob Change Biol., 26, 1908–1925, https://doi.org/10.1111/gcb.14935, 2020.
Global Atmosphere Watch (GAW): WDCGG database for CH4 dataset, GAW [data set], https://gaw.kishou.go.jp/login/user, last access: 14 April 2022.
Gong, W., Beagley, S. R., Cousineau, S., Sassi, M., Munoz-Alpizar, R., Ménard, S., Racine, J., Zhang, J., Chen, J., Morrison, H., Sharma, S., Huang, L., Bellavance, P., Ly, J., Izdebski, P., Lyons, L., and Holt, R.: Assessing the impact of shipping emissions on air pollution in the Canadian Arctic and northern regions: current and future modelled scenarios, Atmos. Chem. Phys., 18, 16653–16687, https://doi.org/10.5194/acp-18-16653-2018, 2018.
Guimbaud, C., Grannas, A. M., Shepson, P. B., Fuentes, J. D., Boudries, H., Bottenheim, J. W., Dominé, F., Houdier, S., Perrier, S., Biesenthal, T. B., and Splawn, B. G.: Snowpack processing of acetaldehyde and acetone in the Arctic atmospheric boundary layer, Atmos. Environ., 36, 2743–2752, https://doi.org/10.1016/S1352-2310(02)00107-3, 2002.
Granier, C., Niemeier, U., Jungclaus, J. H., Emmons, L., Hess, P., Lamarque, J.-F., Walters, S., and Brasseur, G. P.: Ozone pollution from future ship traffic in the Arctic northern passages, Geophys. Res. Lett., 33, L13807, https://doi.org/10.1029/2006GL026180, 2006.
Griffiths, P. T., Murray, L. T., Zeng, G., Shin, Y. M., Abraham, N. L., Archibald, A. T., Deushi, M., Emmons, L. K., Galbally, I. E., Hassler, B., Horowitz, L. W., Keeble, J., Liu, J., Moeini, O., Naik, V., O'Connor, F. M., Oshima, N., Tarasick, D., Tilmes, S., Turnock, S. T., Wild, O., Young, P. J., and Zanis, P.: Tropospheric ozone in CMIP6 simulations, Atmos. Chem. Phys., 21, 4187–4218, https://doi.org/10.5194/acp-21-4187-2021, 2021.
Harrigan, D. L., Fuelberg, H. E., Simpson, I. J., Blake, D. R., Carmichael, G. R., and Diskin, G. S.: Anthropogenic emissions during Arctas-A: mean transport characteristics and regional case studies, Atmos. Chem. Phys., 11, 8677–8701, https://doi.org/10.5194/acp-11-8677-2011, 2011.
Harvard University: GEOS-Chem model code, Harvard University [code], http://wiki.seas.harvard.edu/geos-chem/index.php/GEOS-Chem_12#12.3.2, last access: 14 April 2022.
He, P., Bian, L., Zheng, X., Yu, J., Sun, C., Ye, P., and Xie, Z.: Observation of surface ozone in the marine boundary layer along a cruise through the Arctic Ocean: From offshore to remote, Atmos. Res., 169, 191–198, https://doi.org/10.1016/j.atmosres.2015.10.009, 2016.
Hellén, H., Kouznetsov, R., Anttila, P., Hakola, H.: Increasing influence of easterly air masses on NMHC concentrations at the Pallas-Sodankyla GAW station, Boreal Environ. Res., 20, 542–552, 2015.
Helmig, D., Oltmans, S. J., Carlson, D., Lamarque, J.-F., Jones, A., Labuschagne, C., Anlauf, K., and Hayden, K.: A review of surface ozone in the polar regions, Atmos. Environ., 41, 5138–5161, https://doi.org/10.1016/j.atmosenv.2006.09.053, 2007.
Helmig, D., Petrenko, V., Martinerie, P., Witrant, E., Röckmann, T., Zuiderweg, A., Holzinger, R., Hueber, J., Thompson, C., White, J. W. C., Sturges, W., Baker, A., Blunier, T., Etheridge, D., Rubino, M., and Tans, P.: Reconstruction of Northern Hemisphere 1950–2010 atmospheric non-methane hydrocarbons, Atmos. Chem. Phys., 14, 1463–1483, https://doi.org/10.5194/acp-14-1463-2014, 2014.
Herrmann, M., Cao, L., Sihler, H., Platt, U., and Gutheil, E.: On the contribution of chemical oscillations to ozone depletion events in the polar spring, Atmos. Chem. Phys., 19, 10161–10190, https://doi.org/10.5194/acp-19-10161-2019, 2019.
Hess, P. G. and Zbinden, R.: Stratospheric impact on tropospheric ozone variability and trends: 1990–2009, Atmos. Chem. Phys., 13, 649–674, https://doi.org/10.5194/acp-13-649-2013, 2013.
Hirdman, D., Sodemann, H., Eckhardt, S., Burkhart, J. F., Jefferson, A., Mefford, T., Quinn, P. K., Sharma, S., Ström, J., and Stohl, A.: Source identification of short-lived air pollutants in the Arctic using statistical analysis of measurement data and particle dispersion model output, Atmos. Chem. Phys., 10, 669–693, https://doi.org/10.5194/acp-10-669-2010, 2010.
Holst, T., Arneth, A., Hayward, S., Ekberg, A., Mastepanov, M., Jackowicz-Korczynski, M., Friborg, T., Crill, P. M., and Bäckstrand, K.: BVOC ecosystem flux measurements at a high latitude wetland site, Atmos. Chem. Phys., 10, 1617–1634, https://doi.org/10.5194/acp-10-1617-2010, 2010.
Honrath, R. E., Peterson, M. C., Guo, S., Dibb, J. E., Shepson, P. B., and Campbell, B.: Evidence of NOx production within or upon ice particles in the Greenland snowpack, Geophys. Res. Lett., 26, 695–698, https://doi.org/10.1029/1999GL900077, 1999.
Hornbrook, R. S., Hills, A. J., Riemer, D. D., Abdelhamid, A., Flocke, F. M., Hall, S. S., Huey, L. G., Knapp, D. J., Liao, J., Mauldin III, R. L., Montzka, D., D., Orlando, J. J., Shepson, P. B., Dive, B., Staibler, R. M., Tanner, D., J., Thompson, C. R., Turnipseed, A., Ullmann, K., Weinheimer, A. J., and Apel, E. C.: Arctic springtime observations of volatile organic compounds during the OASIS-2009 campaign, J. Geophys. Res.-Atmos., 121, 9789–9813, https://doi.org/10.1002/2015JD024360, 2016.
Huang, Y., Wu, S., Kramer, L. J., Helmig, D., and Honrath, R. E.: Surface ozone and its precursors at Summit, Greenland: comparison between observations and model simulations, Atmos. Chem. Phys., 17, 14661–14674, https://doi.org/10.5194/acp-17-14661-2017, 2017.
Huang, J., Jaeglé, L., Chen, Q., Alexander, B., Sherwen, T., Evans, M. J., Theys, N., and Choi, S.: Evaluating the impact of blowing-snow sea salt aerosol on springtime BrO and O3 in the Arctic, Atmos. Chem. Phys., 20, 7335–7358, https://doi.org/10.5194/acp-20-7335-2020, 2020.
Ianniello, A., Salzano, R., Salvatori, R., Esposito, G., Spataro, F., Montagnoli, M., Mabilia, R., and Pasini, A.: Nitrogen Oxides (NOx) in the Arctic Troposphere at Ny-Ålesund (Svalbard Islands): Effects of Anthropogenic Pollution Sources, Atmosphere, 12, 901, https://doi.org/10.3390/atmos12070901, 2021.
Ikeda, K., Tanimoto, H., Sugita, T., Akiyoshi, H., Clerbaux, C., and Coheur, P.-F.: Model and satellite analysis of transport of Asian anthropogenic pollution to the Arctic: Siberian and Pacific pathways and their meteorological controls, J. Geophys. Res.-Atmos., 126, e2020JD033459, https://doi.org/10.1029/2020JD033459, 2021.
IPCC: Climate Change 2021: The Physical Science Basis, Contribution of Working Group I to the Sixth Assessment Report of the Intergovernmental Panel on Climate Change, edited by: Masson-Delmotte, V., Zhai, P., Pirani, A., Connors, S. L., Péan, C., Berger, S., Caud, N., Chen, Y., Goldfarb, L., Gomis, M. I., Huang, M., Leitzell, K., Lonnoy, E., Matthews, J. B. R., Maycock, T. K., Waterfield, T., Yelekçi, O., Yu, R., and Zhou, B., Tech. rep., Cambridge University Press, https://www.ipcc.ch/report/ar6/wg1/{#}FullReport (last access: 14 April 2022), 2021.
Isaksen, I. S. A., Berntsen, T. K., Dalsoren, S. B., Eleftheratos, K., Orsolini, Y., Rognerud, B., Stordal, F., Sovde, O. A., Zerefos, C., and Holmes, C. D.: Atmospheric Ozone and Methane in a Changing Climate, Atmosphere, 518–535, 2014.
Jacobi, H.-W., Morin, S., and Bottenheim, J. W.: Observation of widespread depletion of ozone in the springtime boundary layer of the central Arctic linked to mesoscale synoptic conditions, J. Geophys. Res, 115, D17302, https://doi.org/10.1029/2010JD013940, 2010.
Kanaya, Y., Miyazaki, K., Taketani, F., Miyakawa, T., Takashima, H., Komazaki, Y., Pan, X., Kato, S., Sudo, K., Sekiya, T., Inoue, J., Sato, K., and Oshima, K.: Ozone and carbon monoxide observations over open oceans on R/V Mirai from 67∘ S to 75∘ N during 2012 to 2017: testing global chemical reanalysis in terms of Arctic processes, low ozone levels at low latitudes, and pollution transport, Atmos. Chem. Phys., 19, 7233–7254, https://doi.org/10.5194/acp-19-7233-2019, 2019.
Kramer, L. J., Helmig, D., Burkhart, J. F., Stohl, A., Oltmans, S., and Honrath, R. E.: Seasonal variability of atmospheric nitrogen oxides and non-methane hydrocarbons at the GEOSummit station, Greenland, Atmos. Chem. Phys., 15, 6827–6849, https://doi.org/10.5194/acp-15-6827-2015, 2015.
Jiang, Z., Jones, D. B. A., Worden, J., Worden, H. M., Henze, D. K., and Wang, Y. X.: Regional data assimilation of multi-spectral MOPITT observations of CO over North America, Atmos. Chem. Phys., 15, 6801–6814, https://doi.org/10.5194/acp-15-6801-2015, 2015.
Jiang, Z., Worden, J. R., Payne, V. H., Zhu, L., Fischer, E., Walker, T., and Jones, D. B. A.: Ozone export from East Asia: The role of PAN, J. Geophys. Res.-Atmos., 121, 6555–6563, https://doi.org/10.1002/2016JD024952, 2016.
Kasibhatla, P., Arellano, A., Logan, J. A., Palmer, P. I., and Novelli, P.: Top-down estimate of a large source of atmospheric carbon monoxide associated with fuel combustion in Asia, Geophys. Res. Lett., 29, 1900, https://doi.org/10.1029/2002GL015581, 2002.
Klimont, Z., Kupiainen, K., Heyes, C., Purohit, P., Cofala, J., Rafaj, P., Borken-Kleefeld, J., and Schöpp, W.: Global anthropogenic emissions of particulate matter including black carbon, Atmos. Chem. Phys., 17, 8681–8723, https://doi.org/10.5194/acp-17-8681-2017, 2017.
Law, K. S., Roiger, A., Thomas, J., L., Marelle, L., Raut, J.-C., Dalsoren, S., Fuglestvedt, J., Tuccella, P., Weinzierl, B., and Schlager, H.: Local Arctic air pollution: Sources and impacts, Ambio, 46, 453–463, https://doi.org/10.1007/s13280-017-0962-2, 2017.
Lawrence, C. and Mao, H.: Anthropogenic and Natural Factors Affecting Trends in Atmospheric Methane in Barrow, Alaska, Atmosphere, 10, 187, https://doi.org/10.3390/atmos10040187, 2019.
Lehrer, E., Wagenbach, D., and Platt, U.: Aerosol chemical composition during tropospheric ozone depletion at Ny Ålesund/Svalbard, Tellus B, 49, 486–495, https://doi.org/10.3402/tellusb.v49i5.15987, 1997.
Li, C., Hsu, N., Sayer, A., Krotkov, N., Fu, J., Lamsal, L. N., Lee, J., and Tsay, S.-C.: Satellite observation of pollutant emissions from gas flaring activities near the Arctic, Atmos. Environ., 133, 1–11, https://doi.org/10.1016/j.atmosenv.2016.03.019, 2016.
Liang, Q., Douglass, A. R., Duncan, B. N., Stolarski, R. S., and Witte, J. C.: The governing processes and timescales of stratosphere-to-troposphere transport and its contribution to ozone in the Arctic troposphere, Atmos. Chem. Phys., 9, 3011–3025, https://doi.org/10.5194/acp-9-3011-2009, 2009.
Lorenzen-Schmidt, H., Wessel, S., Unold, W., Solberg, S., Gernandt, H., Stordal, F., and Platt, U.: Ozone measurements in the European Arctic during the ARCTOC 1995 campaign, Tellus B, 50, 416–429, 1998.
Mackie, A. R., Palmer, P.I., Barlow, J. M., Finch, D. P., Novelli, P., and Jaeglé, L.: Reduced Arctic air pollution due to decreasing European and North American emissions, J. Geophys. Res.-Atmos., 121, 8692–8700, https://doi.org/10.1002/2016JD024923, 2016.
Marelle, L., Thomas, J. L., Raut, J.-C., Law, K. S., Jalkanen, J.-P., Johansson, L., Roiger, A., Schlager, H., Kim, J., Reiter, A., and Weinzierl, B.: Air quality and radiative impacts of Arctic shipping emissions in the summertime in northern Norway: from the local to the regional scale, Atmos. Chem. Phys., 16, 2359–2379, https://doi.org/10.5194/acp-16-2359-2016, 2016.
Marelle, L., Raut, J.-C., Law, K., and Duclaux, O.: Current and future arctic aerosols and ozone from remote emissions and emerging local sources—Modeled source contributions and radiative effects, J. Geophys. Res.-Atmos., 123, 12942–12963. https://doi.org/10.1029/2018JD028863, 2018.
Marelle, L., Thomas, J. L., Ahmed, S., Tuite, K., Stutz, J., Dommergue, A., Simpson, W. R., Frey, M. M., and Baladima, F.: Implementation and impacts of surface and blowing snow sources of Arctic bromine activation within WRF-Chem 4.1.1, J. Adv. Model. Earth Sy., 13, e2020MS002391, https://doi.org/10.1029/2020MS002391, 2021.
McNamara, S. M., Raso, A. R. W., Wang, S. Y., Thanekar, S., Boone, E. J., Kolesar, K. R., Peterson, P. K., Simpson, W. R., Fuentes, J. D., Shepson, P. B., and Pratt, K. A.: Springtime Nitrogen Oxide-Influenced Chlorine Chemistry in the Coastal Arctic, Environ. Sci. Technol., 53, 8057–8067, 2019.
Monks, P.: A review of the observations and origins of the spring ozone maximum, Atmos. Environ., 34, 3545–3561, 2000.
Monks, S. A., Arnold, S. R., Emmons, L. K., Law, K. S., Turquety, S., Duncan, B. N., Flemming, J., Huijnen, V., Tilmes, S., Langner, J., Mao, J., Long, Y., Thomas, J. L., Steenrod, S. D., Raut, J. C., Wilson, C., Chipperfield, M. P., Diskin, G. S., Weinheimer, A., Schlager, H., and Ancellet, G.: Multi-model study of chemical and physical controls on transport of anthropogenic and biomass burning pollution to the Arctic, Atmos. Chem. Phys., 15, 3575–3603, https://doi.org/10.5194/acp-15-3575-2015, 2015.
Mungall, E., Abbatt, J., Wentzell, J., Lee, A., Thomas, J., Blais, M., Gosselin, M., Miller, L., Papakyriakou, T., Willis, M., and Liggio, J.: Microlayer source of oxygenated volatile organic compounds in the summertime marine Arctic boundary layer. P. Natl. Acad. Sci. USA, 114, 201620571, https://doi.org/10.1073/pnas.1620571114, 2017.
Miyazaki, K., Bowman, K. W., Yumimoto, K., Walker, T., and Sudo, K.: Evaluation of a multi-model, multi-constituent assimilation framework for tropospheric chemical reanalysis, Atmos. Chem. Phys., 20, 931–967, https://doi.org/10.5194/acp-20-931-2020, 2020.
NASA: GISS-E2.1 model code, NASA [code], https://www.giss.nasa.gov/tools/modelE/ last access: 14 April 2022.
NDACC (Network for Detection of Atmospheric Composition Change) sonde data, [data set], https://ndacc.larc.nasa.gov/, last access: 4 January 2023.
Nerentorp Mastromonaco, M., Gardfeldt, K., Jourdain, B., Abrahamsson, K., Granfors, A., Ahnoff, M., Dommergue, A., Méjean, G., and Jacobi, H.-W.: Antarctic winter mercury and ozone depletion events over sea ice, Atmos. Environ., 129, 125–132, https://doi.org/10.1016/j.atmosenv.2016.01.023, 2016.
Norwegian Institute for Air Research (NILU): EBAS database, http://ebas.nilu.no/, last access: 14 April 2022.
Olivié, D., Höglund-Isaksson, L., Klimont, Z., and von Salzen, K.: Boxmodel for calculation of global atmospheric methane concentration, Zenodo, https://doi.org/10.5281/zenodo.5293940, 2021.
Oltmans, S. J. and Komhyr, W. D.: Surface ozone distributions and variations from 1973–1984: Measurements at the NOAA Geophysical Monitoring for Climatic Change Baseline Observatories, J. Geophys. Res., 91, 5229–5236, https://doi.org/10.1029/JD091iD04p05229, 1986.
Osman, M. K., Tarasick, D. W., Liu, J., Moeini, O., Thouret, V., Fioletov, V. E., Parrington, M., and Nédélec, P.: Carbon monoxide climatology derived from the trajectory mapping of global MOZAIC-IAGOS data, Atmos. Chem. Phys., 16, 10263–10282, https://doi.org/10.5194/acp-16-10263-2016, 2016.
Parrella, J. P., Jacob, D. J., Liang, Q., Zhang, Y., Mickley, L. J., Miller, B., Evans, M. J., Yang, X., Pyle, J. A., Theys, N., and Van Roozendael, M.: Tropospheric bromine chemistry: implications for present and pre-industrial ozone and mercury, Atmos. Chem. Phys., 12, 6723–6740, https://doi.org/10.5194/acp-12-6723-2012, 2012.
Pernov, J. B., Bossi, R., Lebourgeois, T., Nøjgaard, J. K., Holzinger, R., Hjorth, J. L., and Skov, H.: Atmospheric VOC measurements at a High Arctic site: characteristics and source apportionment, Atmos. Chem. Phys., 21, 2895–2916, https://doi.org/10.5194/acp-21-2895-2021, 2021.
Peterson, P. K., Pratt, K. A., Simpson, W. R., Nghiem, S. V., Pérez Pérez, L. X., Boone, E. J., Pöhler, D., Zielcke, J., General, S., Shepson, P. B., Frieß, U., Platt, U., and Stirm, B. H.: The role of open lead interactions in atmospheric ozone variability between Arctic coastal and inland sites, Elem. Sci. Anth., 4, 000109, https://doi.org/10.12952/journal.elementa.000109, 2016.
Peterson, P. K., Pöhler, D., Sihler, H., Zielcke, J., General, S., Frieß, U., Platt, U., Simpson, W. R., Nghiem, S. V., Shepson, P. B., Stirm, B. H., Dhaniyala, S., Wagner, T., Caulton, D. R., Fuentes, J. D., and Pratt, K. A.: Observations of bromine monoxide transport in the Arctic sustained on aerosol particles, Atmos. Chem. Phys., 17, 7567–7579, https://doi.org/10.5194/acp-17-7567-2017, 2017.
Peterson, P. K., Pöhler, D., Zielcke, J., General, S., Frieß, U., Platt, U., Simpson, W. R., Nghiem, S. V., Shepson, P. B., Stirm, B. H., and Pratt, K. A.: Springtime Bromine Activation over Coastal and Inland Arctic Snowpacks ACS, Earth Space Chem., 2, 1075–1086, https://doi.org/10.1021/acsearthspacechem.8b00083, 2018.
Peterson, P. K., Hartwig, M., May, N. W., Schwartz, E., Rigor, I., Ermold, W., Steele, M., Morison, J. H., Nghiem, S. V., and Pratt, K. A..: Snowpack measurements suggest role for multi-year sea ice regions in Arctic atmospheric bromine and chlorine chemistry, Elem Sci. Anth., 7, 14, https://doi.org/10.1525/elementa.352, 2019.
Pétron, G., Granier, C., Khattatov, B., Lamarque, J.-F., Yudin, V., Muller, J.-F., and Gille, J.: Inverse modeling of carbon monoxide surface emissions using Climate Monitoring and Diagnostics Laboratory network observations, J. Geophys. Res.-Atmos., 107, D24, https://doi.org/10.1029/2001JD001305, 2002.
Pittman, J. V., Pan, L. L., Wei, J. C., Irion, F. W., Liu, X., Maddy, E., S., Barnet, C., D., Chance, K., and Gao, R.-S.: Evaluation of AIRS, IASI, and OMI ozone profile retrievals in the extratropical tropopause region using in situ aircraft measurements, J. Geophys. Res., 114, D24109, https://doi.org/10.1029/2009JD012493, 2009.
Platt, S. M., Hov, Ø., Berg, T., Breivik, K., Eckhardt, S., Eleftheriadis, K., Evangeliou, N., Fiebig, M., Fisher, R., Hansen, G., Hansson, H.-C., Heintzenberg, J., Hermansen, O., Heslin-Rees, D., Holmén, K., Hudson, S., Kallenborn, R., Krejci, R., Krognes, T., Larssen, S., Lowry, D., Lund Myhre, C., Lunder, C., Nisbet, E., Nizzetto, P. B., Park, K.-T., Pedersen, C. A., Aspmo Pfaffhuber, K., Röckmann, T., Schmidbauer, N., Solberg, S., Stohl, A., Ström, J., Svendby, T., Tunved, P., Tørnkvist, K., van der Veen, C., Vratolis, S., Yoon, Y. J., Yttri, K. E., Zieger, P., Aas, W., and Tørseth, K.: Atmospheric composition in the European Arctic and 30 years of the Zeppelin Observatory, Ny-Ålesund, Atmos. Chem. Phys., 22, 3321–3369, https://doi.org/10.5194/acp-22-3321-2022, 2022.
Pommier, M., Clerbaux, C., Law, K. S., Ancellet, G., Bernath, P., Coheur, P.-F., Hadji-Lazaro, J., Hurtmans, D., Nédélec, P., Paris, J.-D., Ravetta, F., Ryerson, T. B., Schlager, H., and Weinheimer, A. J.: Analysis of IASI tropospheric O3 data over the Arctic during POLARCAT campaigns in 2008, Atmos. Chem. Phys., 12, 7371–7389, https://doi.org/10.5194/acp-12-7371-2012, 2012.
Pope, R. J., Richards, N. A. D., Chipperfield, M. P., Moore, D. P., Monks, S. A., Arnold, S. R., Glatthor, N., Kiefer, M., Breider, T. J., Harrison, J. J., Remedios, J. J., Warneke, C., Roberts, J. M., Diskin, G. S., Huey, L. G., Wisthaler, A., Apel, E. C., Bernath, P. F., and Feng, W.: Intercomparison and evaluation of satellite peroxyacetyl nitrate observations in the upper troposphere–lower stratosphere, Atmos. Chem. Phys., 16, 13541–13559, https://doi.org/10.5194/acp-16-13541-2016, 2016.
Prather, M. J., Holmes, C. D., and Hsu, J.: Reactive greenhouse gas scenarios: Systematic exploration of uncertainties and the role of atmospheric chemistry, Geophys. Res. Lett., 39, L09803, https://doi.org/10.1029/2012GL051440, 2012.
Salmi, T., Määttä, A., Anttila, P., Ruoho-Airola, T., and Amnell, T.: Detecting trends of annual values of atmospheric pollutants by the Mann-Kendall test and Sen's slope estimates – the Excel template application Makesens, Finnish Meteorological Institute, Helsinki, Finland, ISBN: 9516975631, 9789516975637, 2002.
Rap, A., Richards, N. A. D., Forster, P. M., Monks, S. A., Arnold, S. R., and Chipperfield, M. P.: Satellite constraint on the tropospheric ozone radiative effect, Geophys. Res. Lett., 42, 5074–5081, https://doi.org/10.1002/2015GL064037, 2015.
Raut, J.-C., Law, K. S., Onishi, T., Daskalakis, N., and Marelle, L.: Impact of shipping emissions on air pollution and pollutant deposition over the Barents Sea, Environ. Pollut., 298, 118832, https://doi.org/10.1016/j.envpol.2022.118832, 2022.
Sand, M., Berntsen, T. K., von Salzen, K., Flanner, M. G., Langner, J., and Victor, D. G.: Response of arctic temperature to changes in emissions of short-lived climate forcers, Nat. Clim. Change, 6, 286–289, https://doi.org/10.1038/nclimate2880, 2015.
Seabrook, J. and Whiteway, J.: Influence of mountains on Arctic tropospheric ozone, J. Geophys. Res.-Atmos., 121, 1935–1942, https://doi.org/10.1002/2015JD024114, 2016.
Section for Meteorology and Oceanography (MetOs): OsloCTM model code, Github [code], https://github.com/NordicESMhub/OsloCTM3, last access: 14 April 2022.
Sharma, S., Barrie, L. A., Magnusson, E., Brattstrom, G., Leaitch, W. R., Steffen, A., and Landsberger, S.: A Factor and Trends Analysis of Multidecadal Lower Tropospheric Observations of Arctic Aerosol Composition, Black Carbon, Ozone, and Mercury at Alert, Canada, J. Geophys. Res.-Atmos., 124, 14133–14161, 2019.
Shapiro, M. A., Hampel, T., and Krueger, A. J.: The Arctic tropopause fold, Mon. Wea. Rev., 115, 444–454, https://doi.org/10.1175/1520-0493, 1987.
Shaw, G. E.: The Arctic Haze Phenomenon, B. Am. Meteor. Soc., 76, 2403–2414, 1995.
Shindell, D.: Local and remote contributions to Arctic warming, Geophys. Res. Lett., 34, L14704, https://doi.org/10.1029/2007GL030221, 2007.
Shindell, D. T., Chin, M., Dentener, F., Doherty, R. M., Faluvegi, G., Fiore, A. M., Hess, P., Koch, D. M., MacKenzie, I. A., Sanderson, M. G., Schultz, M. G., Schulz, M., Stevenson, D. S., Teich, H., Textor, C., Wild, O., Bergmann, D. J., Bey, I., Bian, H., Cuvelier, C., Duncan, B. N., Folberth, G., Horowitz, L. W., Jonson, J., Kaminski, J. W., Marmer, E., Park, R., Pringle, K. J., Schroeder, S., Szopa, S., Takemura, T., Zeng, G., Keating, T. J., and Zuber, A.: A multi-model assessment of pollution transport to the Arctic, Atmos. Chem. Phys., 8, 5353–5372, https://doi.org/10.5194/acp-8-5353-2008, 2008.
Simpson, W. R., von Glasow, R., Riedel, K., Anderson, P., Ariya, P., Bottenheim, J., Burrows, J., Carpenter, L. J., Frieß, U., Goodsite, M. E., Heard, D., Hutterli, M., Jacobi, H.-W., Kaleschke, L., Neff, B., Plane, J., Platt, U., Richter, A., Roscoe, H., Sander, R., Shepson, P., Sodeau, J., Steffen, A., Wagner, T., and Wolff, E.: Halogens and their role in polar boundary-layer ozone depletion, Atmos. Chem. Phys., 7, 4375–4418, https://doi.org/10.5194/acp-7-4375-2007, 2007.
Simpson, W. R., Frieß, U., Thomas, J. L., Lampel, J., and Platt, U.: Polar nighttime chemistry produces intense reactive bromine events. Geophysical Research Letters, 45, 9987–9994. https://doi.org/10.1029/2018GL079444, 2018.
Skov, H., Christensen, J., Goodsite, M. E., Heidam, N. Z., Jensen, B., Wåhlin, P., and Geernaert, G.: The fate of elemental mercury in Arctic during atmospheric mercury depletion episodes and the load of atmospheric mercury to Arctic, Environ. Sci. Technol., 38, 2373–2382, 2004.
Skov, H., Brooks, S., Goodsite, M. E., Lindberg, S. E., Meyers, T. P., Landis, M. S., Larsen, M. R. B., Jensen, B., McConville, G., and Christensen, J.: Measuring reactive gaseous mercury flux by relaxed eddy accumulation, Atmos. Environ, 40, 5452–5463, 2006.
Skov, H., Hjorth, J., Nordstrøm, C., Jensen, B., Christoffersen, C., Bech Poulsen, M., Baldtzer Liisberg, J., Beddows, D., Dall'Osto, M., and Christensen, J. H.: Variability in gaseous elemental mercury at Villum Research Station, Station Nord, in North Greenland from 1999 to 2017, Atmos. Chem. Phys., 20, 13253–13265, https://doi.org/10.5194/acp-20-13253-2020, 2020.
Sodemann, H., Pommier, M., Arnold, S. R., Monks, S. A., Stebel, K., Burkhart, J. F., Hair, J. W., Diskin, G. S., Clerbaux, C., Coheur, P.-F., Hurtmans, D., Schlager, H., Blechschmidt, A.-M., Kristjánsson, J. E., and Stohl, A.: Episodes of cross-polar transport in the Arctic troposphere during July 2008 as seen from models, satellite, and aircraft observations, Atmos. Chem. Phys., 11, 3631–3651, https://doi.org/10.5194/acp-11-3631-2011, 2011.
Solberg, S., Schmidbauer, N., Semb, A., Stordal, F., and Hov, Ø.: Boundary-layer ozone depletion as seen in the Norwegian Arctic in spring, J. Atmos. Chem., 23, 301-332, https://doi.org/10.1007/BF00055158, 1996.
Steffen, A., Douglas, T., Amyot, M., Ariya, P., Aspmo, K., Berg, T., Bottenheim, J., Brooks, S., Cobbett, F., Dastoor, A., Dommergue, A., Ebinghaus, R., Ferrari, C., Gardfeldt, K., Goodsite, M. E., Lean, D., Poulain, A. J., Scherz, C., Skov, H., Sommar, J., and Temme, C.: A synthesis of atmospheric mercury depletion event chemistry in the atmosphere and snow, Atmos. Chem. Phys., 8, 1445–1482, https://doi.org/10.5194/acp-8-1445-2008, 2008.
Stevenson, D. S., Young, P. J., Naik, V., Lamarque, J.-F., Shindell, D. T., Voulgarakis, A., Skeie, R. B., Dalsoren, S. B., Myhre, G., Berntsen, T. K., Folberth, G. A., Rumbold, S. T., Collins, W. J., MacKenzie, I. A., Doherty, R. M., Zeng, G., van Noije, T. P. C., Strunk, A., Bergmann, D., Cameron-Smith, P., Plummer, D. A., Strode, S. A., Horowitz, L., Lee, Y. H., Szopa, S., Sudo, K., Nagashima, T., Josse, B., Cionni, I., Righi, M., Eyring, V., Conley, A., Bowman, K. W., Wild, O., and Archibald, A.: Tropospheric ozone changes, radiative forcing and attribution to emissions in the Atmospheric Chemistry and Climate Model Intercomparison Project (ACCMIP), Atmos. Chem. Phys., 13, 3063–3085, https://doi.org/10.5194/acp-13-3063-2013, 2013.
Stohl, A.: Characteristics of atmospheric transport into the Arctic troposphere, J. Geophys. Res., 111, D11306, https://doi.org/10.1029/2005JD006888, 2006.
Swanson, W. F., Holmes, C. D., Simpson, W. R., Confer, K., Marelle, L., Thomas, J. L., Jaeglé, L., Alexander, B., Zhai, S., Chen, Q., Wang, X., and Sherwen, T.: Comparison of model and ground observations finds snowpack and blowing snow aerosols both contribute to Arctic tropospheric reactive bromine, Atmos. Chem. Phys., 22, 14467–14488, https://doi.org/10.5194/acp-22-14467-2022, 2022.
Tarasick, D. W. and Bottenheim, J. W.: Surface ozone depletion episodes in the Arctic and Antarctic from historical ozonesonde records, Atmos. Chem. Phys., 2, 197–205, https://doi.org/10.5194/acp-2-197-2002, 2002.
Tarasick, D. W., Wardle, D. I., Kerr, J. B., Bellfleur, J. J., and Davies, J.: Tropospheric ozone trends over Canada: 1980-1993, Geophys. Res. Lett., 22, 4, 409–412, 1995.
Tarasick, D. W., Carey-Smith, T. K., Hocking, W. K., Moeini, O., He, H., Liu, J., Osman, M., Thompson, A. M., Johnson, B., Oltmans, S. J., and Merrill, J. T.: Quantifying stratosphere-troposphere transport of ozone using balloon-borne ozonesondes, radar windprofilers and trajectory models, Atmos. Environ., 198, 496–509, https://doi.org/10.1016/j.atmosenv.2018.10.040, 2019a.
Tarasick, D., Galbally, I. E., Cooper, O. R., Schultz, M. G., Ancellet, G., Leblanc, T., Wallington, T. J., Ziemke, J., Liu, X., Steinbacher, M., Staehelin, J., Vigouroux, C., Hannigan, J.W., García, O., Foret, G., Zanis, P., Weatherhead, E., Petropavlovskikh, I., Worden, H., Osman, M., Liu, J., Chang, K.-L., Gaudel, A., Lin, M., Granados-Muñoz, M., Thompson, A. M., Oltmans, S. J., Cuesta, J., Dufour, G., Thouret, V., Hassler, B., Trickl, T., and Neu, J. L.: Tropospheric Ozone Assessment Report: Tropospheric ozone from 1877 to 2016, observed levels, trends and uncertainties, Elem. Sci. Anth., 7, 39, https://doi.org/10.1525/elementa.376, 2019b.
Thomas, J. L., Raut, J.-C., Law, K. S., Marelle, L., Ancellet, G., Ravetta, F., Fast, J. D., Pfister, G., Emmons, L. K., Diskin, G. S., Weinheimer, A., Roiger, A., and Schlager, H.: Pollution transport from North America to Greenland during summer 2008, Atmos. Chem. Phys., 13, 3825–3848, https://doi.org/10.5194/acp-13-3825-2013, 2013.
Thomas, M. A., Devasthale, A., and Nygård, T.: Influence of springtime atmospheric circulation types on the distribution of air pollutants in the Arctic, Atmos. Chem. Phys., 21, 16593–16608, https://doi.org/10.5194/acp-21-16593-2021, 2021.
Thompson, C. R., Wofsy, S. C., Prather, M. J., Newman, P. A., Hanisco, T. F., Ryerson, T. B., Fahey, D. W., Apel, E. C., Brock, C. A., Brune, W. H., Froyd, K., Katich, J. M., Nicely, J. M., Peischl, J., Ray, E., Veres, P. R., Wang, S., Allen, H. M., Asher, E., Bian, H., Blake, D., Bourgeois, I., Budney, J., Bui, T., P., Butler, A., Campuzano-Jost, P., Chang, C., Chin, M., Commane, R., Correa, G., Crounse, J. D., Daube, B., Dibb, J. E., DiGangi, J. P., Diskin, G. S., Dollner, M., Elkins, J. W., Fiore, A. M., Flynn, C. M., Guo, H., Hall, S. R., Hannun, R. A., Hills, A., Hintsa, E. J., Hodzic, A., Hornbrook, R. S., Huey, L. G., Jimenez, J. L., Keeling, R. F., Kim, M. J., Kupc, A., Lacey, F., Lait, L. R., Lamarque, J.-F., Liu, J., McKain, K., Meinardi, S., Miller, D. O., Montzka, S. A., Moore, F. L., Morgan, E. J., Murphy, D. M., Murray, L. T., Nault, B. A., Neuman, J. A., Nguyen, L., Gonzalez, Y., Rollins, A., Rosenlof, K., Sargent, M., Schill, G., Schwarz, J. P., St. Clair, J. M., Steenrod, S. D., Stephens, B. B., Strahan, S. E., Strode, S. A., Sweeney, C., Thames, A. B., Ullmann, K., Wagner, N., Weber, N., Weinzierl, B., Wennberg, P. O., Williamson, C. J., Wolfe, G. M., and Zeng, L.: The NASA Atmospheric Tomography (ATom) Mission: Imaging the Chemistry of the Global Atmosphere, Am. Meteorol. Soc., 103, 3, 761–790, https://doi.org/10.1175/BAMS-D-20-0315.1, 2022.
Thorp, T., Arnold, S. R., Pope, R. J., Spracklen, D. V., Conibear, L., Knote, C., Arshinov, M., Belan, B., Asmi, E., Laurila, T., Skorokhod, A. I., Nieminen, T., and Petäjä, T.: Late-spring and summertime tropospheric ozone and NO2 in western Siberia and the Russian Arctic: regional model evaluation and sensitivities, Atmos. Chem. Phys., 21, 4677–4697, https://doi.org/10.5194/acp-21-4677-2021, 2021.
Toyota, K., McConnell, J. C., Lupu, A., Neary, L., McLinden, C. A., Richter, A., Kwok, R., Semeniuk, K., Kaminski, J. W., Gong, S.-L., Jarosz, J., Chipperfield, M. P., and Sioris, C. E.: Analysis of reactive bromine production and ozone depletion in the Arctic boundary layer using 3-D simulations with GEM-AQ: inference from synoptic-scale patterns, Atmos. Chem. Phys., 11, 3949–3979, https://doi.org/10.5194/acp-11-3949-2011, 2011.
Tuccella, P., Thomas, J. L., Law, K. S., Raut, J.-C., Marelle, L., Roiger, A., Weinzierl, B., Denier van der Gon, H. A. C., Schlager, H., Onishi, T.: Air pollution impacts due to petroleum extraction in the Norwegian Sea during the ACCESS aircraft campaign, Elementa, 5, 25, https://doi.org/10.1525/elementa.124, 2017.
Turnock, S. T., Wild, O., Sellar, A., and O'Connor, F. M.: 300 years of tropospheric ozone changes using CMIP6 scenarios with a parameterised approach, Atmos. Environ., 213, 686–698, https://doi.org/10.1016/j.atmosenv.2019.07.001, 2019.
UCAR: CESM2 model code, UCAR [code], https://www.cesm.ucar.edu/models/cesm2/, last access: 14 April 2022.
U.S. EPA: (Environmental Protection Agency): Integrated Science Assessment for Ozone and Related Photochemical Oxidants. EPA/600/R-10/076F, Office of Research and Development, Research Triangle Park, NC (February), 2013.
Van Dam, B., Helmig, D., Doskey, P. V., and Oltmans, S. J.: Summertime surface O3 behavior and deposition to tundra in the Alaskan Arctic, J. Geophys. Res. Atmos., 121, 8055–8066, https://doi.org/10.1002/2015JD023914, 2016.
Verstraeten, W. W., Boersma, K. F., Zörner, J., Allaart, M. A. F., Bowman, K. W., and Worden, J. R.: Validation of six years of TES tropospheric ozone retrievals with ozonesonde measurements: implications for spatial patterns and temporal stability in the bias, Atmos. Meas. Tech., 6, 1413–1423, https://doi.org/10.5194/amt-6-1413-2013, 2013.
Viatte, C., Strong, K., Hannigan, J., Nussbaumer, E., Emmons, L. K., Conway, S., Paton-Walsh, C., Hartley, J., Benmergui, J., and Lin, J.: Identifying fire plumes in the Arctic with tropospheric FTIR measurements and transport models, Atmos. Chem. Phys., 15, 2227–2246, https://doi.org/10.5194/acp-15-2227-2015, 2015.
Walker, T. W., Jones, D. B. A., Parrington, M. Henze, D. K., Murray, L. T., Bottenheim, J. W., Anlauf, K., Worden, J. R., Bowman, K. W., Shim, C., Singh, K., Kopacz, M., Tarasick, D. W., Davies, J., von der Gathen, P., Thompson, A. M., and Carouge, C. C.: Impacts of midlatitude precursor emissions and local photochemistry on ozone abundances in the Arctic, J. Geophys. Res., 117, D01305, https://doi.org/10.1029/2011JD016370, 2012.
Wang, S. and Pratt, K. A.: Molecular halogens above the Arctic snowpack: Emissions, diurnal variations, and recycling mechanisms, J. Geophys. Res.-Atmos., 122, 11991–12007. https://doi.org/10.1002/2017JD027175, 2017.
Wang, S. Y., McNamara, S. M., Moore, C. W., Obrist, D., Steffen, A., Shepson, P. B., Staebler, R. M., Raso, A. R. W., and Pratt, K. A.: Direct detection of atmospheric atomic bromine leading to mercury and ozone depletion, P. Natl. Acad. Sci. USA, 116, 14479–14484, 2019.
Wespes, C., Emmons, L., Edwards, D. P., Hannigan, J., Hurtmans, D., Saunois, M., Coheur, P.-F., Clerbaux, C., Coffey, M. T., Batchelor, R. L., Lindenmaier, R., Strong, K., Weinheimer, A. J., Nowak, J. B., Ryerson, T. B., Crounse, J. D., and Wennberg, P. O.: Analysis of ozone and nitric acid in spring and summer Arctic pollution using aircraft, ground-based, satellite observations and MOZART-4 model: source attribution and partitioning, Atmos. Chem. Phys., 12, 237–259, https://doi.org/10.5194/acp-12-237-2012, 2012.
Whaley, C. H., Mahmood, R., von Salzen, K., Winter, B., Eckhardt, S., Arnold, S., Beagley, S., Becagli, S., Chien, R.-Y., Christensen, J., Damani, S. M., Dong, X., Eleftheriadis, K., Evangeliou, N., Faluvegi, G., Flanner, M., Fu, J. S., Gauss, M., Giardi, F., Gong, W., Hjorth, J. L., Huang, L., Im, U., Kanaya, Y., Krishnan, S., Klimont, Z., Kühn, T., Langner, J., Law, K. S., Marelle, L., Massling, A., Olivié, D., Onishi, T., Oshima, N., Peng, Y., Plummer, D. A., Popovicheva, O., Pozzoli, L., Raut, J.-C., Sand, M., Saunders, L. N., Schmale, J., Sharma, S., Skeie, R. B., Skov, H., Taketani, F., Thomas, M. A., Traversi, R., Tsigaridis, K., Tsyro, S., Turnock, S., Vitale, V., Walker, K. A., Wang, M., Watson-Parris, D., and Weiss-Gibbons, T.: Model evaluation of short-lived climate forcers for the Arctic Monitoring and Assessment Programme: a multi-species, multi-model study, Atmos. Chem. Phys., 22, 5775–5828, https://doi.org/10.5194/acp-22-5775-2022, 2022.
World Health Organization (WHO): Regional Office for Europe: Review of evidence on health aspects of air pollution: REVIHAAP project: technical report, World Health Organization, Regional Office for Europe, https://apps.who.int/iris/handle/10665/341712 (last access: 13 January 2023), 2021.
Willis, M. D., Bozem, H., Kunkel, D., Lee, A. K. Y., Schulz, H., Burkart, J., Aliabadi, A. A., Herber, A. B., Leaitch, W. R., and Abbatt, J. P. D.: Aircraft-based measurements of High Arctic springtime aerosol show evidence for vertically varying sources, transport and composition, Atmos. Chem. Phys., 19, 57–76, https://doi.org/10.5194/acp-19-57-2019, 2019.
Wofsy, S. C., Afshar, S., Allen, H. M., Apel, E. C., Asher, E. C., Barletta, B., Bent, J., Bian, H., Biggs, B. C., Blake, D. R., Blake, N., Bourgeois, I., Brock, C. A., Brune, W. H., Budney, J. W., Bui, T. P., Butler, A., Campuzano-Jost, P., Chang, C. S., Chin, M., Commane, R., Correa, G., Crounse, J. D., Cullis, P. D., Daube, B. C., Day, D. A., Dean-Day, J. M., Dibb, J. E., DiGangi, J. P., Diskin, G. S., Dollner, M., Elkins, J. W., Erdesz, F., Fiore, A. M., Flynn, C. M., Froyd, K. D., Gesler, D.W., Hall, S. R., Hanisco, T. F., Hannun, R. A., Hills, A. J., Hintsa, E. J., Hoffman, A., Hornbrook, R. S., Huey, L. G., Hughes, S., Jimenez, J. L., Johnson, B. J., Katich, J. M., Keeling, R. F., Kim, M. J., Kupc, A., Lait, L. R., Lamarque, J.-F., Liu, J., McKain, K., Mclaughlin, R. J., Meinardi, S., Miller, D. O., Montzka, S. A., Moore, F. L., Morgan, E. J., Murphy, D. M., Murray, L. T., Nault, B. A., Neuman, J. A., Newman, P. A., Nicely, J. M., Pan, X., Paplawsky, W., Peischl, J., Prather, M. J., Price, D. J., Ray, E. A., Reeves, J. M., Richardson, M., Rollins, A. W., Rosenlof, K. H., Ryerson, T. B., Scheuer, E., Schill, G. P., Schroder, J., C., Schwarz, J. P., St.Clair, J., M., Steenrod, S. D., Stephens, B. B., Strode, S. A., Sweeney, C., Tanner, D., Teng, A. P., Thames, A. B., Thompson, C. R., Ullmann, K., Veres, P. R., Vieznor, N., Wagner, N. L., Watt, A., Weber, R., Weinzierl, B., Wennberg, P. O., Williamson, C. J., Wilson, J. C., Wolfe, G. M., Woods, C. T., and Zeng, L., H..: ATom: Merged Atmospheric Chemistry, Trace Gases, and Aerosols, Ornl Daac, Oak Ridge, Tennessee, USA. https://doi.org/10.3334/ORNLDAAC/1581, 2018.
Yang, X., Pyle, J. A., Cox, R. A., Theys, N., and Van Roozendael, M.: Snow-sourced bromine and its implications for polar tropospheric ozone, Atmos. Chem. Phys., 10, 7763–7773, https://doi.org/10.5194/acp-10-7763-2010, 2010.
Yang, X., Blechschmidt, A.-M., Bognar, K., McClure-Begley, A., Morris, S., Petropavlovskikh, I., Richter, A., Skov, H., Strong, K., Tarasick, D. W., Uttal, T., Vestenius, M., and Zhao, X.: Pan-Arctic surface ozone: modelling vs. measurements, Atmos. Chem. Phys., 20, 15937–15967, https://doi.org/10.5194/acp-20-15937-2020, 2020.
Young, P. J., Naik, V., Fiore, A. M., Gaudel, A., Guo, J., Lin, M. Y., Neu, J. L., Parrish, D. D., Rieder, H. E., Schnell, J. L., Tilmes, S., Wild, O., Zhang, L., Ziemke, J. R., Brandt, J., Delcloo, A., Doherty, R. M., Geels, C., Hegglin, M. I., Hu, L., Im, U., Kumar, R., Luhar, A., Murray, L., Plummer, D., Rodriguez, J., Saiz-Lopez, A., Schultz, M. G., Woodhouse, M. T., and Zeng, G.: Tropospheric Ozone Assessment Report: Assessment of global-scale model performance for global and regional ozone distributions, variability, and trends, Elem. Sci Anth., 6, 10, https://doi.org/10.1525/elementa.265, 2018.
Zanis, P., Akritidis, D., Turnock, S., Naik, V., Szopa, S., Georgoulias, A. K., Bauer, S. E., Deushi, M., Horowitz, L. W., and Keeble, J.: Climate change penalty and benefit on surface ozone: a global perspective based on CMIP6 earth system models, Environ. Res. Lett., 17, 024014, https://doi.org/10.1088/1748-9326/ac4a34, 2022.
Zheng, C., Wu, Y., Ting, M., Orbe, C., Wang, X., and Tilmes, S.: Summertime transport pathways from different northern hemisphere regions into the Arctic. J. Geophys. Res.-Atmos., 126, e2020JD033811. https://doi. org/10.1029/2020JD033811, 2021.
Zhu, L., Fischer, E. V., Payne, V. H., Worden, J. R., and Jiang, Z.: TES observations of the interannual variability of PAN over Northern Eurasia and the relationship to springtime fires, Geophys. Res. Lett., 42, 7230–7237, https://doi.org/10.1002/2015GL065328, 2015.
- Abstract
- Introduction
- Arctic O3: sources and sinks
- AMAP models and simulations
- Arctic-wide tropospheric distributions from satellite data
- Arctic surface O3 and precursors: seasonal cycles
- Vertical distributions of O3 and precursors in the Arctic
- Conclusions
- Code and data availability
- Author contributions
- Competing interests
- Disclaimer
- Acknowledgements
- Financial support
- Review statement
- References
- Supplement