the Creative Commons Attribution 4.0 License.
the Creative Commons Attribution 4.0 License.
 | 07 Jun 2023
Background nitrogen dioxide (NO2) over the United States and its implications for satellite observations and trends: effects of nitrate photolysis, aircraft, and open fires
Daniel J. Jacob
Viral Shah
Sebastian D. Eastham
Thibaud M. Fritz
Loretta J. Mickley
Tianjia Liu
Yi Wang
Tropospheric nitrogen dioxide (NO2) measured from satellites has been widely used to track anthropogenic NOx emissions, but its retrieval and interpretation can be complicated by the free tropospheric NO2 background to which satellite measurements are particularly sensitive. Tropospheric NO2 vertical column densities (VCDs) from the spaceborne Ozone Monitoring Instrument (OMI) averaged over the contiguous US (CONUS) show no trend after 2009, despite sustained decreases in anthropogenic NOx emissions, implying an important and rising contribution from the free tropospheric background. Here, we use the GEOS-Chem chemical transport model applied to the simulation of OMI NO2 to better understand the sources and trends of background NO2 over CONUS. The previous model underestimate of the background is largely corrected by the consideration of aerosol nitrate photolysis, which increases the model NO2 VCDs by 13 % on an annual basis (25 % in spring) and also increases the air mass factor (AMF) to convert the tropospheric slant column densities (SCDs) inferred from the OMI spectra into VCDs by 7 % on an annual basis (11 % in spring). The increase in the AMF decreases the retrieved NO2 VCDs in the satellite observations, contributing to the improved agreement with the model. Accounting for the 2009–2017 increase in aircraft NOx emissions drives only a 1.4 % mean increase in NO2 VCDs over CONUS and a 2 % increase in the AMF, but the combination of decreasing surface NOx emissions and increasing aircraft emissions is expected to drive a 14 % increase in the AMF over the next decade that will be necessary to account for in the interpretation of satellite NO2 trends. Fire smoke identification with the National Oceanic and Atmospheric Administration (NOAA) Hazard Mapping System (HMS) indicates that wildfires contribute 1 %–8 % of OMI NO2 VCDs over the western US in June–September and that this contribution has been increasing since 2009, contributing to the flattening of OMI NO2 trends. Future analyses of NO2 trends from satellite data to infer trends in surface NOx emissions must critically consider the effects of a rising free tropospheric background due to increasing emissions from aircraft, fires, and possibly lightning.
- Article
(1350 KB) - Full-text XML
-
Supplement
(526 KB) - BibTeX
- EndNote


Nitrogen oxides (NO emitted by combustion, lightning, and soils affect oxidant chemistry, air quality, climate, and ecosystems. NOx cycles chemically to produce tropospheric ozone and is eventually oxidized to nitric acid (HNO3), which partitions into the particulate phase and is removed by deposition. Satellite observations of tropospheric NO2 vertical column densities (VCDs) have been used extensively to infer anthropogenic NOx emissions and their changes (Martin et al., 2003; Boersma et al., 2008; Russell et al., 2012; Duncan et al., 2016; Miyazaki et al., 2017; Cooper et al., 2020b; Wang et al., 2020). However, recent studies for North America suggest that the free tropospheric background NO2 (above ∼2 km altitude) could make a large and increasing contribution to the tropospheric NO2 VCDs measured from space (Silvern et al., 2019; Zhu et al., 2019; Qu et al., 2021; Y. Wang et al., 2021; Jiang et al., 2022). Here, we investigate the sources of this NO2 background over the US and the implications for the retrieval and interpretation of satellite observations.
Tropospheric NO2 has been measured from space by solar backscatter since 1995 with the Global Ozone Monitoring Experiment (GOME) instrument (Martin et al., 2002). Current instruments include the Ozone Monitoring Instrument (OMI; 2004–present) (Krotkov et al., 2016), the Ozone Mapping and Profiler Suite (OMPS; 2012–present) (Yang et al., 2014), the TROPOspheric Monitoring Instrument (TROPOMI; 2017–present) (van Geffen et al., 2020; Li et al., 2022), and the Geostationary Environment Monitoring Spectrometer (GEMS) over East Asia (2020–present) (Kim et al., 2020). Tropospheric NO2 is retrieved in three steps: (1) fit the measured backscattered solar spectrum in and around the NO2 absorption band (400–470 nm) to infer a slant column density (SCD) along the optical path; (2) subtract the stratospheric contribution from the SCD to obtain the tropospheric SCD; (3) convert the tropospheric SCD to a tropospheric vertical column density (VCD) by dividing by an air mass factor (AMF). The AMF accounts for the photon path between the Sun and the satellite instrument in relation to the vertical distribution of NO2. It is calculated by convolving altitude-dependent detection sensitivities (scattering weights) computed from a radiative transfer model with a local NO2 normalized vertical profile (shape factor) provided by an independent chemical transport model (CTM) (Palmer et al., 2001). The detection sensitivity typically increases by a factor of 5 from the surface to the upper troposphere because of atmospheric scattering (Martin et al., 2002; Boersma et al., 2016; Cooper et al., 2020a), so that the tropospheric VCD measurement can be most sensitive to free tropospheric NO2 – even under fairly polluted conditions (Travis et al., 2016). The CTM must then properly represent this free tropospheric NO2 background. Although cloud-slicing methods have been used to isolate the free tropospheric contribution in satellite NO2 retrievals, these products have large errors that limit their usefulness (Choi et al., 2014; Belmonte Rivas et al., 2015; Marais et al., 2018, 2021).
The importance of characterizing the free tropospheric NO2 background was brought to the fore by the use of OMI NO2 data to infer NOx emission trends in the contiguous United States (CONUS) (Jiang et al., 2018; Silvern et al., 2019; Qu et al., 2021; Y. Wang et al., 2021; He et al., 2022; Jiang et al., 2022). The OMI NO2 data over CONUS show a steady decrease from 2005 to 2009 (Russell et al., 2012; Duncan et al., 2013, 2016; Krotkov et al., 2016), consistent with the decreases in NOx emissions reported in the Environmental Protection Agency (EPA) National Emissions Inventory (NEI), but Jiang et al. (2018) found that the trend flattened after 2009 despite sustained decreases in NOx emissions according to the NEI and supported by NO2 surface data (Silvern et al., 2019). This flattening of the trend was attributed, by Silvern et al. (2019), to an increasing relative contribution to the OMI NO2 VCD from the free tropospheric background as the anthropogenic NOx emissions decrease. Further evidence for this large background contribution emerged from the COVID-19 economic shutdown in 2020 when the response of OMI observations to the decrease in NOx emissions in CONUS was much less than the response of surface NO2 observations (Qu et al., 2021). Silvern et al. (2019) pointed out that the post-2009 flattening was most evident for nonurban summer conditions, when background NO2 would be relatively large, whereas urban winter conditions showed continued decrease. Y. Wang et al. (2021) explained the flattening by an increase in lightning NOx emissions over the 2009–2019 period, compensating for the sustained decrease in anthropogenic NOx emissions because of the greater sensitivity of the satellite observations to the free troposphere. Previous studies with the GEOS-Chem CTM underestimated free tropospheric NO2 over CONUS relative to aircraft observations (Travis et al., 2016; Silvern et al., 2018), but Shah et al. (2023) found that this could reflect, in part, positive interferences in the aircraft NO2 measurements and, in part, a missing source of free tropospheric NOx from photolysis of aerosol nitrate.
Aircraft and wildfires could also contribute to the background NO2 trend, but this has not been studied so far. Aircraft emissions have increased at a rate of 3.3 % a−1 over the past decade (Lee et al., 2021). Aircraft emission inventories in the CTMs used for satellite retrievals tend to be outdated and do not account for this rapid growth (Boersma et al., 2018; Lamsal et al., 2021). Large NO2 enhancements have been detected by satellites at fire locations (Mebust et al., 2011; Griffin et al., 2021; Jin et al., 2021), but little is known about the more general contribution of fires to the tropospheric NO2 background. A recent study reported that 19 %–56 % of peroxyacetyl nitrate (PAN) detected in the free troposphere over the western US in summer 2018 by the Cross-track Infrared Sounder (CrIS) was associated with fire smoke (Juncosa Calahorrano et al., 2021). Wildfires have become increasingly frequent and intense in the US over the past 2 decades (Westerling, 2016; Jaffe et al., 2020) and the fire season has lengthened (Cattau et al., 2020), both of which would contribute to an increase in background NO2.
Here, we combine GEOS-Chem simulations and data analysis to better understand the sources and trends of the free tropospheric background NO2 (and more generally background NOx) in CONUS by (1) investigating the role of aerosol nitrate photolysis as a source of NOx (Shah et al., 2023), (2) quantifying the effect of increasing aircraft emissions with the Aviation Emissions Inventory Code (AEIC; Simone et al., 2013), and (3) quantifying wildfire influence with the NOAA Hazard Mapping System (HMS) smoke product (Rolph et al., 2009). Increasing NO2 in the model free troposphere increases the AMF and, thus, decreases the NO2 tropospheric VCDs retrieved from satellite. We will see that this significantly improves agreement between GEOS-Chem and OMI observations of NO2 in different seasons.
We use the GEOS-Chem global CTM version 13.1.2 (https://doi.org/10.5281/zenodo.5014891) driven by MERRA-2 meteorology (Gelaro et al., 2017) in a simulation of oxidant–aerosol chemistry over CONUS in 2009 and 2017. The simulation is at the native MERRA-2 resolution of over North America (10–70∘ N, 140–40∘ W), nested in a global simulation with boundary conditions updated every 3 h. GEOS-Chem 13.1.2 includes a detailed representation of chemistry with recent updates for NOx uptake by aerosols and clouds (Holmes et al., 2019), isoprene chemistry (Bates and Jacob, 2019), and halogen chemistry (X. Wang et al., 2021). Dry deposition follows a standard resistance-in-series scheme (Wesely, 1989), with HNO3 updates from Jaeglé et al. (2018). Wet deposition includes in-cloud rainout, below-cloud washout, and scavenging in convective updrafts (Liu et al., 2001). We use a faster washout rate for HNO3 described in Luo et al. (2019) and previously used in GEOS-Chem simulations over China (Zhai et al., 2021) and the remote oceans (Travis et al., 2020).
Table 1 gives the CONUS NOx emissions in the model for 2009 and 2017. Global anthropogenic emissions for individual years are from the Community Emissions Data System (CEDS) (McDuffie et al., 2020). This is superseded for the US by the EPA NEI2016 inventory for 2016 (https://www.epa.gov/air-emissions-modeling/2016v1-platform, last access: 26 May 2023), scaled to 2009 and 2017 using national emission totals (EPA, 2021). Soil NOx emissions are from Hudman et al. (2012) and updated by Y. Wang et al. (2021) to allow for increased soil NOx emissions under high-temperature conditions (30–40 ∘C) and using soil temperatures from MERRA-2 instead of air temperatures. We reduced the summertime soil NOx emissions in the midwestern US (38–50∘ N, 105–95∘ W) by 50 %, as suggested by a previous comparison with OMI NO2 observations (Vinken et al., 2014). Lightning NOx emissions are computed following Murray et al. (2012), with lightning flash density spatially constrained by Lightning Imaging Sensor/Optical Transient Detector (LIS/OTD) climatology, interannual variation driven by convective cloud height from MERRA-2, and vertical distribution following Ott et al. (2010). Monthly open-fire emissions are taken from the Global Fire Emissions Database version 4 with small fires (GFED4s) (van der Werf et al., 2017), with all releases at the surface. Interannual variations in GFED4s are driven by changes in fuel load, which is a function of meteorology and vegetation type, and burned area and active fire data derived from Moderate Resolution Imaging Spectroradiometer (MODIS) satellite observations. Not included in Table 1 is the source from the cross-tropopause transport of reactive nitrogen oxides produced in the stratosphere by the oxidation of N2O. This source is included in the model but is negligibly small (0.2 Tg N a−1 globally; Bey et al., 2001).
Table 1Contiguous US (CONUS) NOx emissions in 2009 and 2017 (Tg N a−1)a.
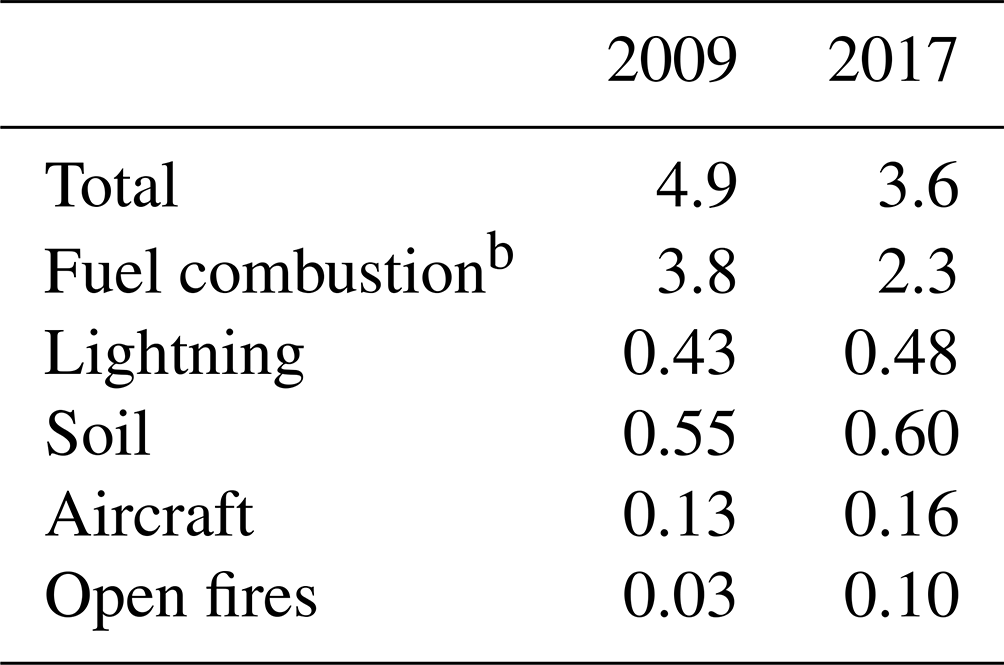
a As used in the GEOS-Chem simulations described in the text. b Excluding aircraft.
For aircraft emissions, we use an updated inventory for 2019 produced by the AEIC developed at the Massachusetts Institute of Technology (MIT) (Simone et al., 2013). It includes daily emissions during both landing and takeoff (LTO) and at cruise with a horizontal resolution of and a vertical resolution of 36 layers up to 100 hPa. A total of 81 % of these emissions are released above 5 km altitude, and 73 % of them are released above 8 km. AEIC2019 is scaled to individual years and for different continental regions using the kerosene consumption data provided by the International Energy Agency (IEA; https://www.iea.org/fuels-and-technologies/oil, last access: 26 May 2023). The NOx emission factor increased by 7 % from 2005 to 2019 due to an increase in combustor temperatures (Dedoussi, 2021; Lee et al., 2021). As shown in Fig. 1, aviation NOx emissions increased globally by 51 % from 2005 to 2019, largely driven by rapid growth in developing countries such as China, and by 17 % for CONUS. The dip in 2007–2009 is due to the economic recession (Bows-Larkin et al., 2016). AEIC2019 may underestimate aircraft emissions by 10 %–40 % because it does not consider military aircraft, which are estimated to account for 10 %–13 % of total emissions (Wilkerson et al., 2010), and because it assumes great circle routes, which could underestimate emissions by up to 28 % (Zhang et al., 2022). The effect of aircraft emissions on upper tropospheric NOx in GEOS-Chem may further be underestimated by 10 % due to nonlinear aircraft plume chemistry increasing the NOx lifetime (Fritz et al., 2020).
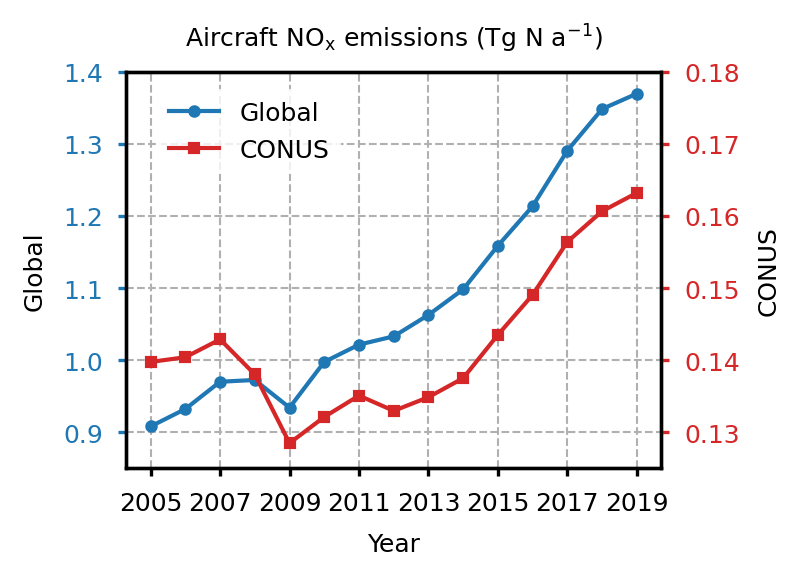
Figure 1Global and CONUS aircraft NOx emissions in the AEIC2019 inventory from 2005 to 2019 (Lee et al., 2021).
Table 1 shows a decrease from 2009 to 2017 in fuel combustion emissions (excluding aircraft) but an increase in all other NOx emissions. The increase in lightning and soil is consistent, although somewhat higher than the 6 % increase in these sources for 2009–2019 inferred by Y. Wang et al. (2021) from linear regression of the emission time series. Open-fire emissions have large interannual variability but are negligibly small in the model; we will use an observation-based analysis in Sect. 5 for an independent assessment of the contributions of these emissions to satellite NO2. Overall, we see (from Table 1) that CONUS NOx emissions in the model decreased by 27 % from 2009 to 2017, with the 36 % decrease in emissions from non-aircraft fuel combustion offset by increases in other emissions. Because these other emissions are more weighted to the free troposphere, they would play a disproportionate role in flattening the OMI NO2 trend as shown by Y. Wang et al. (2021). They would also effectively increase the AMF in the satellite retrievals, so that the flattening would be exaggerated in the observations if this AMF increase is not accounted for.
In our simulation, we also add the photolysis of particulate nitrate (pNOpreviously introduced in GEOS-Chem by Kasibhatla et al. (2018) and Shah et al. (2023) to correct model underestimates of tropospheric NOx. Gas-phase HNO3 can be recycled to NOx through photolysis or reaction with OH, but this process is slow with a lifetime of 15–30 d in the troposphere (Dulitz et al., 2018). pNO can also be photolyzed at UV wavelengths (>290 nm), and its absorption spectrum peaks around 302 nm (Gen et al., 2022). Previous studies have reported a photolysis rate of pNO that is 10–300 times faster than that of HNO3 (Ye et al., 2016, 2017; Reed et al., 2017), recycling NOx through two branches producing NO2 and nitrous acid (HONO), and HONO continues photolysis to produce NO and OH. This process has been found to be an important missing source of NOx over the remote oceans (Ye et al., 2016; Reed et al., 2017; Kasibhatla et al., 2018; Shah et al., 2023; Andersen et al., 2023). The enhancement factor (EF) of nitrate photolysis relative to HNO3 photolysis could be promoted by the coexistence of halides (Wingen et al., 2008; Richards et al., 2011; Zhang et al., 2020) and organic matter (Scharko et al., 2014; Wang et al., 2021), and it is further affected by aerosol pH (Scharko et al., 2014) and the nature of cations (Richards et al., 2015).
Shah et al. (2023) found that incorporating aerosol nitrate photolysis in GEOS-Chem largely corrected the model's underestimation of NOx over the oceans during the Atmospheric Tomography Mission (ATom) aircraft campaign. It had little effect over the eastern US in summer (Deep Convective Clouds and Chemistry Experiment, DC3, and Studies of Emissions and Atmospheric Composition, Clouds and Climate Coupling by Regional Surveys, SEAC4RS, aircraft campaigns) where the model overestimated free tropospheric NOx concentrations by a factor of 2. Here, we follow their approach to calculate the EF as a function of the molar concentrations of sea salt aerosol [SSA] and nitrate [pNO]:
The resulting EF values range from 10 in continental air with low SSA to 100 in marine air, and a 2:1 branching ratio for the HONO:NO2 branches is assumed. These values are within the range of EFs suggested by laboratory studies of nitrate photolysis and field studies over or near the continents (Ye et al., 2017; Romer et al., 2018; Andersen et al., 2023). The EF is close to 10 in most of the troposphere over the US (Shah et al., 2023).
Figure 2 shows the effect of pNO photolysis as described above on our simulated NO2 vertical profiles over CONUS. Our version of GEOS-Chem includes enhanced scavenging of HNO3 following Luo et al. (2019), and extensive evaluation of simulated pNO concentrations with vertical profiles from aircraft shows no significant bias (Luo et al., 2019, 2020). We find that the effect of photolysis on the pNO concentration is negligible in the boundary layer (BL) below 2 km altitude (Fig. S1 in the Supplement) because it releases both NOx and OH, and OH goes on to oxidize NOx to replenish the pNO pool. The effect on NO2 in the BL is also negligible because direct NOx emission dominates. Moreover, pNO photolysis has little effect on pNO in the free troposphere because of the fast oxidation of NOx back to HNO3. However, it increases NO2 concentrations in the free troposphere by about 25 % on an annual basis at all altitudes, with the stronger radiation in the upper troposphere (UT) compensating for the lower pNO concentrations. The largest increase in free tropospheric NO2 is in spring due to a combination of high pNO concentrations and strong radiation. The implications for the simulation of OMI observations will be discussed in Sect. 3.
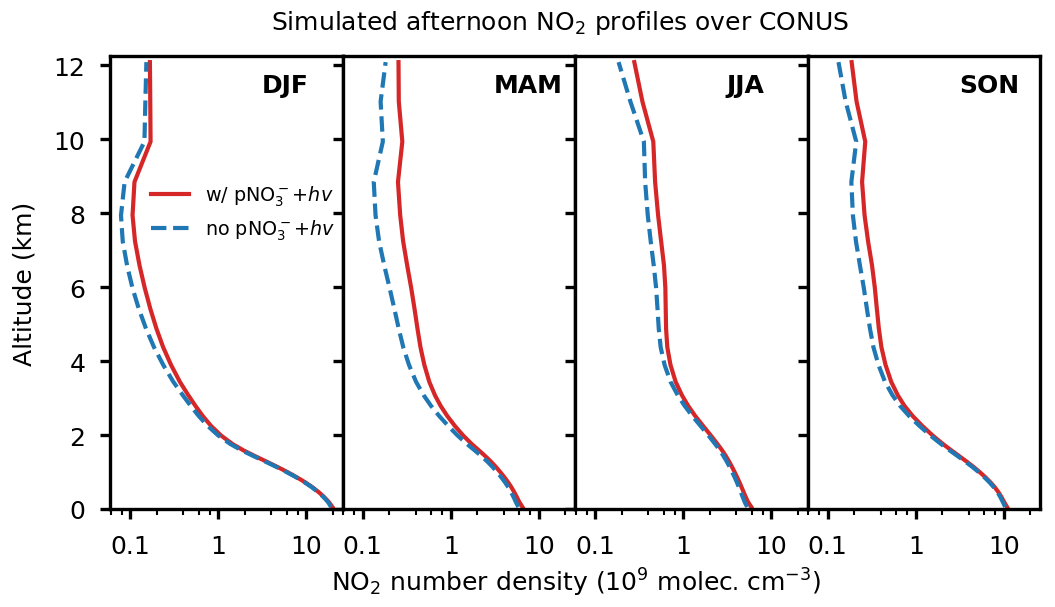
Figure 2Mean vertical profiles of NO2 number density simulated by GEOS-Chem over the contiguous US (CONUS) in 2017 at the OMI overpass time of 13:00–14:00 LT (local time) and in different seasons. Solid and dashed lines indicate the NO2 profiles with and without particulate nitrate photolysis (pNO), respectively. Note the log scale for the abscissa.
Figure 3 compares OMI-observed and GEOS-Chem-simulated tropospheric NO2 VCDs over CONUS in 2017. The OMI instrument onboard the Aura satellite provides daily global coverage at 13:30 LT (local time) with a 13×24 km2 nadir pixel resolution. Here, we use NO2 retrievals from version 4.0 of the NASA OMI NO2 level-2 product (OMNO2; https://disc.gsfc.nasa.gov/datasets/OMNO2_003/summary, last access: 26 May 2023) (Lamsal et al., 2021), filtered by removing pixels with cloud fraction >0.2, surface reflectivity >0.3, solar zenith angle >75∘, view zenith angle >65∘, and pixels affected by the so-called row anomaly (Dobber et al., 2008). For comparison to OMI, we sample GEOS-Chem along the OMI orbit tracks at 13:00–14:00 LT and for the successful scenes passing the above filters. The OMNO2 product uses vertical shape factors from the Global Modeling Initiative (GMI) CTM in its AMF calculation. To conduct a consistent comparison with GEOS-Chem, we recompute the AMFs and, hence, the OMI retrievals (now referred to as OMI-GC) using local GEOS-Chem NO2 shape factors sampled at 13:00–14:00 LT (Boersma et al., 2016; Cooper et al., 2020a).
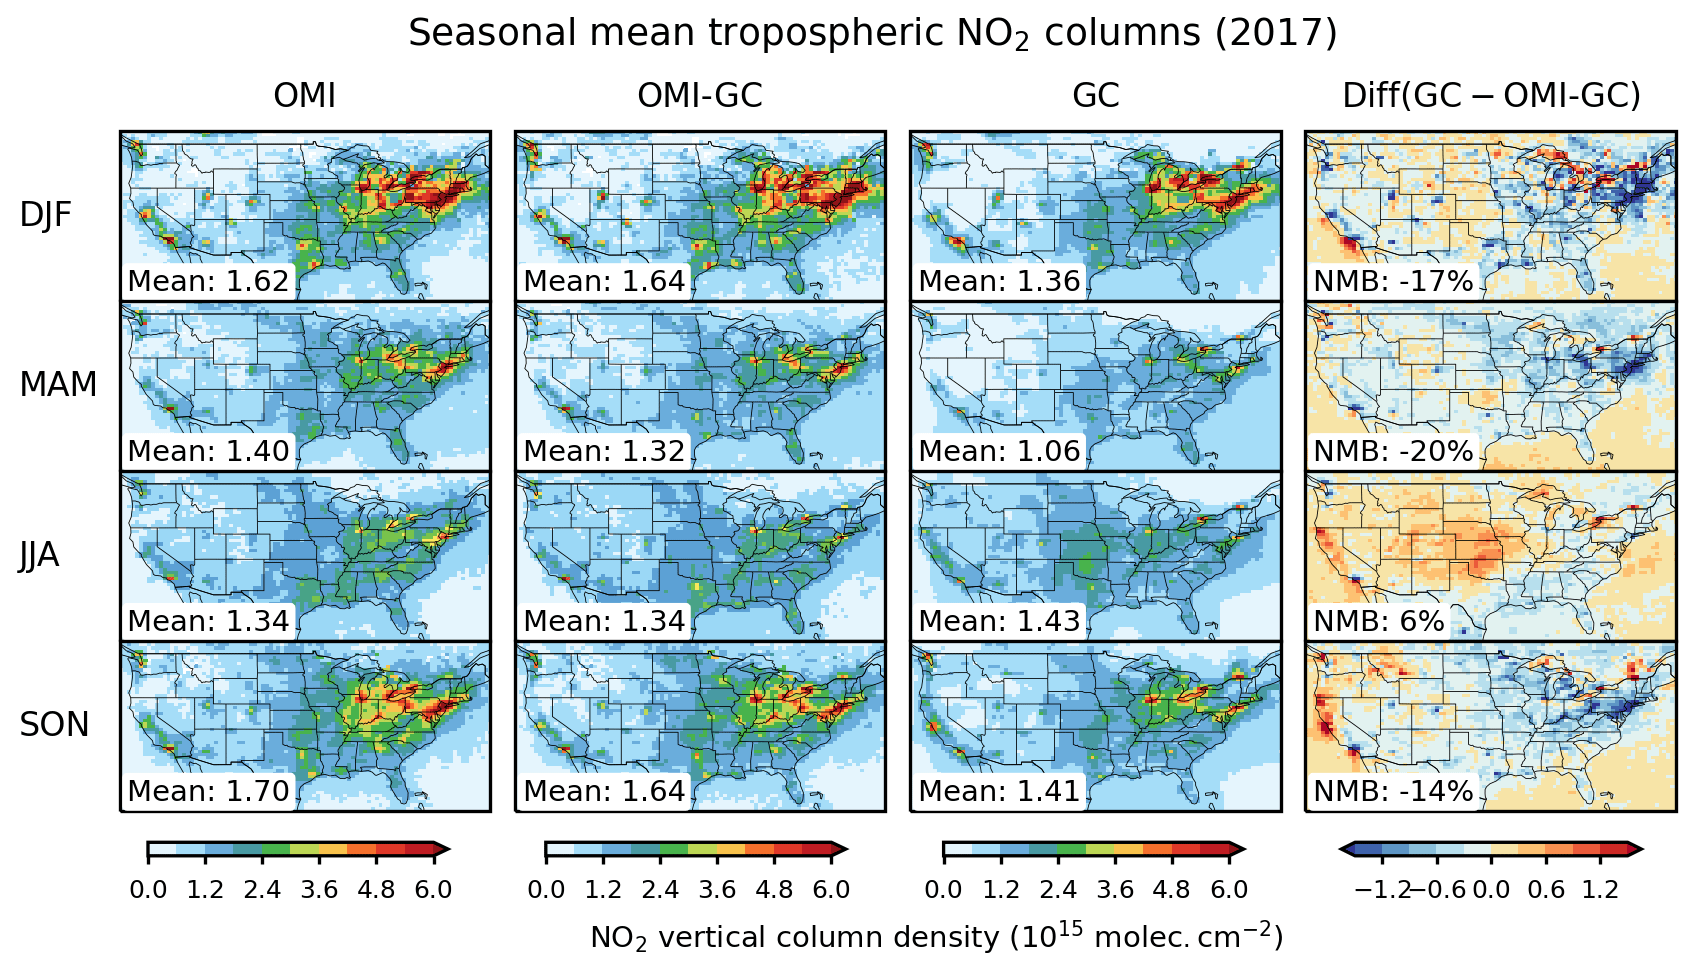
Figure 3Seasonal mean tropospheric NO2 vertical column densities (VCDs) over CONUS in 2017. From left to right are the OMNO2 OMI retrievals with AMFs computed using the GMI NO2 vertical profiles (OMI), the OMI retrievals with AMFs computed using the GEOS-Chem NO2 vertical profiles (OMI-GC), the GEOS-Chem simulation (GC) sampled along the OMI orbit tracks and for successful OMI retrievals, and the difference between GC and OMI-GC. Mean values over CONUS and the normalized mean bias (NMB) between GC and OMI-GC are given inset.
GEOS-Chem generally captures the observed spatial distribution and seasonal variation in tropospheric NO2 VCDs in CONUS. The normalized mean bias (NMB) is −17 % in winter, −20 % in spring, +6 % in summer, and −14 % in fall. In comparison, the NMB without nitrate photolysis is −24 % in winter, −43 % in spring, −14 % in summer, and −26 % in fall. Adding nitrate photolysis greatly improves the agreement, and its effect on NO2 VCDs and AMFs in 2017 is shown in Fig. 4. It increases simulated tropospheric NO2 VCDs by 13 % over CONUS, with the largest increase in spring (25 %). In Fig. 4b, we calculate the monthly AMFs by using scattering weights from OMNO2 v4 and GEOS-Chem NO2 shape factors with and without nitrate photolysis to determine the effect of nitrate photolysis on NO2 retrievals. The annual mean AMF increases by 7 % and the spring AMF increases by 11 % with nitrate photolysis because the shape factor is shifted to higher altitudes (Fig. 2). As a result, the NO2 VCDs retrieved using the GEOS-Chem NO2 shape factor (OMI-GC) with nitrate photolysis is 7 % lower than that retrieved using the shape factor without nitrate photolysis (Fig. 4a), and this further improves agreement with the model simulation. The annual mean AMF using the GEOS-Chem shape factor with nitrate photolysis is now 1.21, closer to the AMF calculated using the GMI shape factor (1.19). The GMI does not include nitrate photolysis but has slower NOx loss from N2O5 chemistry than GEOS-Chem (Shah et al., 2023). Better agreement is also found in year 2009 between simulated and retrieved tropospheric NO2 VCDs with the addition of nitrate photolysis (Fig. S2). The NMB improves from −8 % to 1 %, and the corresponding AMFs increases by 3 %. The nitrate photolysis effect is smaller in 2009 than in 2017, mostly because of larger surface anthropogenic emissions increasing NO2 in the BL relative to the free troposphere. Previous studies have found that GEOS-Chem could not reproduce the flattening of the NO2 trend over CONUS seen by OMI after 2009 (Silvern et al., 2019; Qu et al., 2021). Similarly, in our results (Fig. 5a), retrieved NO2 VCDs show a small change between 2009 and 2017, whereas modeled results from standard simulation without nitrate photolysis show a large decrease. The inclusion of nitrate photolysis significantly corrects this discrepancy, reducing the difference in modeled versus retrieved changes between 2009 and 2017 by 45 % (Fig. 5b).
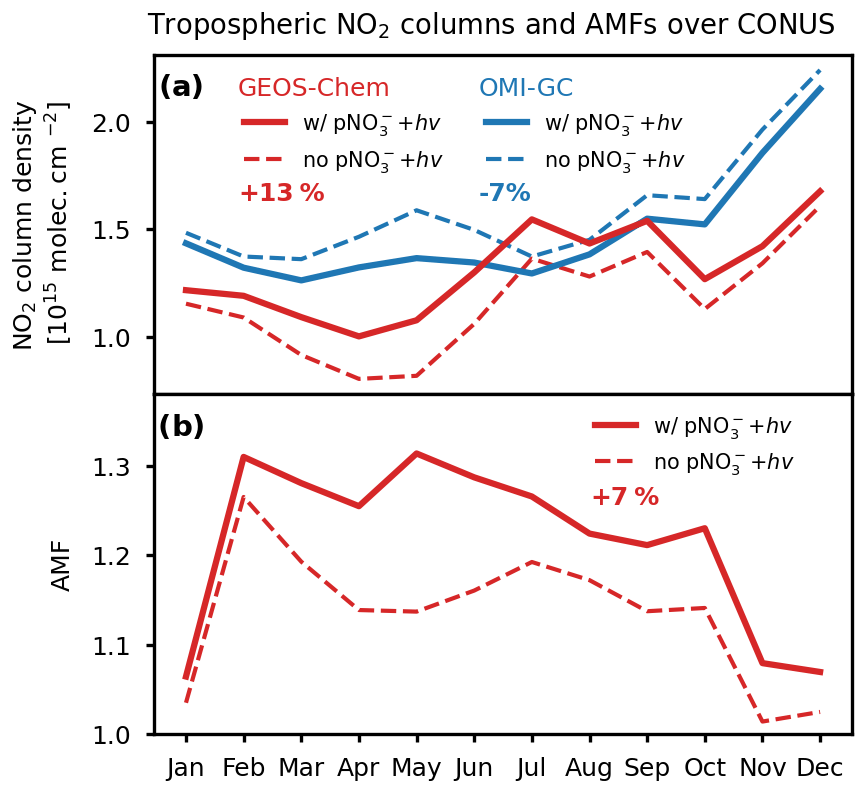
Figure 4Sensitivity to particulate nitrate photolysis of tropospheric NO2 vertical column densities (VCDs) simulated by GEOS-Chem and retrieved from OMI satellite observations over CONUS. Panel (a) shows 2017 monthly mean GEOS-Chem NO2 VCDs with and without nitrate photolysis as well as the OMI retrieval using GEOS-Chem shape factors (OMI-GC) with and without nitrate photolysis. Panel (b) shows the monthly mean air mass factor (AMF) for OMI tropospheric NO2 retrievals with and without nitrate photolysis. The inset numbers give annual mean percentage differences for the different quantities with versus without nitrate photolysis.
Overall, our GEOS-Chem simulation including pNO photolysis is consistent with the OMI observations within their 35 % estimated uncertainty (Lamsal et al., 2021), reflecting the combined and opposite effects of pNO photolysis on the simulated NO2 VCDs and on the satellite retrieval. Figure 3 still shows some regional discrepancies between GEOS-Chem and OMI. Low biases are found in urban areas that may reflect biases in model chemistry at a 50 km resolution as well as bias in the satellite NO2 retrievals (Laughner and Cohen, 2019; Laughner et al., 2019). There is a high bias in the central US during the summer, even before the inclusion of nitrate photolysis, partly due to the use of the updated soil NOx scheme of Y. Wang et al. (2021) in GEOS-Chem that increases emissions at high temperatures. On the west coast, high biases are found in fire-influenced areas, but that may be due to OMI retrievals being too low. Most current operational NO2 retrieval algorithms including OMNO2 v4 treat aerosols implicitly (Liu et al., 2020; Vasilkov et al., 2021), resulting in low retrieved NO2 in fire plumes (Griffin et al., 2021). Travis et al. (2016) previously found a 30 % GEOS-Chem overestimate of the NASA OMI NO2 v2.1 retrieval over the US Southeast in summer, which they attributed to the NEI2011 emissions being too high, but that model bias is largely corrected in our simulation due both to the downward revision of NOx emissions in NEI2016 and to 10 %–40 % higher OMI NO2 retrievals in version 4 of OMNO2 relative to previous versions (Lamsal et al., 2021).
We isolated the effect of the 2009–2017 increase in aircraft emissions (Fig. 1) on NO2 VCDs and AMFs over CONUS by conducting sensitivity simulations with the AEIC emission trends but with all other conditions fixed for 2017, including anthropogenic surface emissions. The increase in aircraft emissions since 2009 leads to a 1.4 % increase in the simulated annual mean tropospheric NO2 VCDs over CONUS, with 75 % of the increase above 6 km. The AMF increases by 1.7 % as the vertical distribution of NO2 shifts from the boundary layer to the upper troposphere. This influence from aircraft emissions is expected to increase in the future, as shown in Fig. 6 with a projection to 2032. In this projection, anthropogenic emissions over CONUS are assumed to continue to decrease at the current rate of 5.9 % a−1. Global aircraft emissions are 20 % lower in 2022 than in 2019 due to the pandemic. We assume that they return to 2019 levels in 2023 and increase at a rate of 3.6 % a−1 in the following decade (Airbus, 2022; Boeing, 2022). We calculate the resulting AMFs by applying scattering weights from OMNO2 v4 to the extrapolated NO2 vertical profiles and find an AMF increase of 20 % over the 2017–2032 period, including 80 % from the decrease in surface emissions and 20 % from the increase in aircraft emissions. Increasing aircraft emissions will likely play an increasing role in increasing the AMF in the future.
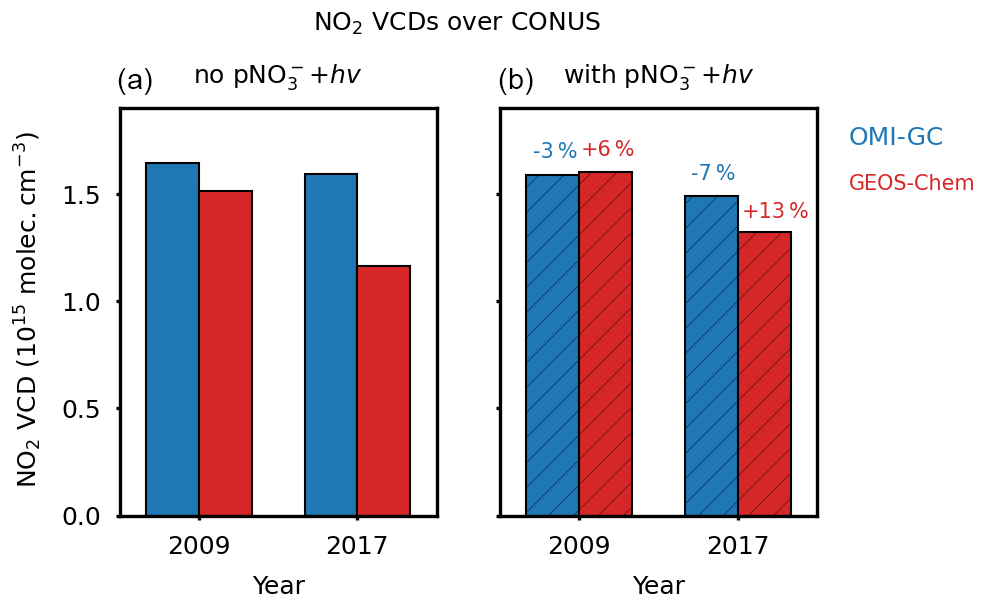
Figure 5Changes in NO2 vertical column densities (VCDs) over the contiguous United States (CONUS) between 2009 and 2017 as observed by OMI (OMI-GC) and simulated by GEOS-Chem. Values are annual means averaged spatially over CONUS. The OMI-GC retrievals use GEOS-Chem vertical shape factors and are, therefore, sensitive to the relative vertical distribution of NO2 simulated by GEOS-Chem. Panel (a) shows results for the standard GEOS-Chem simulation without particulate nitrate photolysis, and panel (b) shows results from the simulation with particulate nitrate photolysis. The percent changes resulting from the addition of particulate nitrate photolysis are indicated on top of each bar.
Open-fire emissions make a very small contribution to the mean CONUS NOx budget in GEOS-Chem (Table 1), but they could be of seasonal importance in the western US in June–September (Jaffe et al., 2020). The simulation of fire NOx in models such as GEOS-Chem is affected by uncertainties not only in emissions (Carter et al., 2020) but also in plume lofting and chemistry (Zhu et al., 2018; Palm et al., 2021; Peng et al., 2021). Interpreting fire NO2 observations by satellites is complicated by scattering and absorption from the smoke aerosols (Castellanos et al., 2015; Griffin et al., 2021) as well as plume lofting (Jin et al., 2021) and any differences in vertical distribution between NO2 and the smoke aerosols.
Here, we use the HMS product (Rolph et al., 2009) from NOAA to identify fire-impacted OMI retrievals and estimate from there the contribution of fire to NO2 VCDs as observed by OMI. The HMS provides daily daytime locations and extent of smoke plumes, as determined by human analysts using satellite imagery to delineate smoke-affected areas. The dataset has been widely used to identify such areas (Brey and Fischer, 2016; Fischer et al., 2018; Juncosa Calahorrano et al., 2021). We use the fire-season (June–September) HMS data from 2009 to 2020 (https://www.ospo.noaa.gov/Products/land/hms.html, last access: 26 May 2023) and grid it to a horizontal resolution of . For each grid cell, we define days associated with smoke plumes in the HMS data as fire-affected days and the remaining days as fire-free days. Fire-free days may still have some influence of aged fire emissions such as through PAN decomposition, so the distinction offered by the HMS data is for relatively fresh fire emissions over a few days. We thus infer the contribution of fresh fire emissions to the NO2 VCDs from the difference between the seasonal mean NO2 VCDs and the average NO2 VCDs for fire-free days. Previous studies have found that the implicit correction for aerosols in current NO2 retrieval algorithms as effective clouds could introduce low biases of up to 50 % in the retrieved NO2 VCD in areas of high aerosol loading, such as fire plumes (Lorente et al., 2017; Liu et al., 2020). Therefore, we also examine the effect of increasing tropospheric NO2 VCDs on fire-affected days by 50 %.
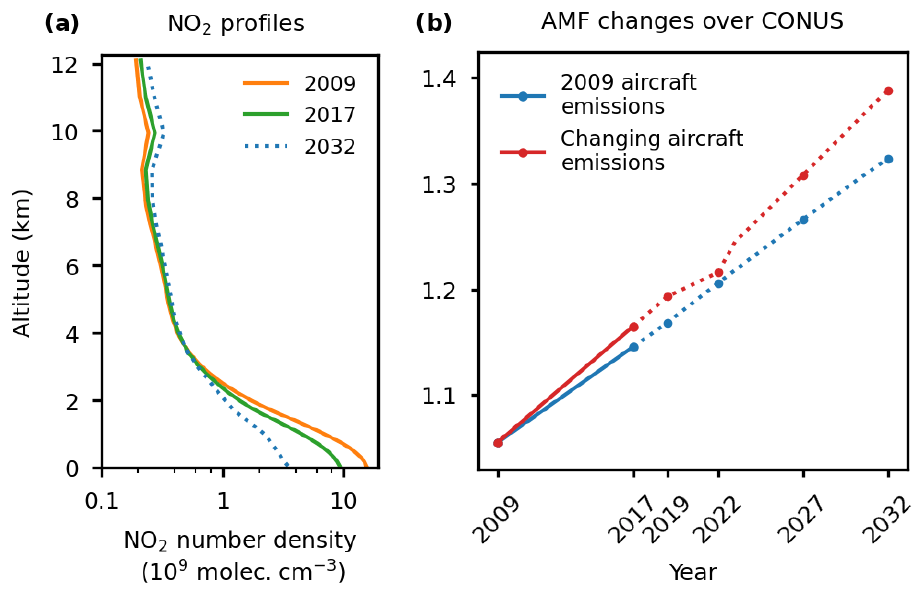
Figure 6Effect of changing surface anthropogenic and aircraft emissions on tropospheric NO2 vertical profiles and air mass factors (AMFs) for satellite retrievals over the 2009–2032 period. (a) Mean NO2 afternoon profiles over CONUS in 2009, 2017, and 2032 (projected), accounting for changes in surface and aircraft emissions. (b) AMFs for tropospheric NO2 retrievals over CONUS from 2009 to 2032, with the red line calculated using NO2 profiles with reduced anthropogenic surface emissions and increased aircraft emissions and the blue line calculated with reduced anthropogenic surface emissions only and fixed aircraft emissions for 2009. Solid lines are from GEOS-Chem simulations for 2009 and 2017, while dashed lines scale the 2009–2017 NO2 simulation differences to the projected changes in emissions beyond 2017.
Figure 7 shows the contribution of fresh fire emissions to the OMI observations over the western US (30–50∘ N, 130–114∘ W) and the rest of CONUS in June–September 2009–2020. The red envelope shows the effect of increasing tropospheric NO2 VCDs on fire-affected days by 50 % to account for aerosol-induced bias, and this defines the upper range of fire influence. We find that fires contribute 1 %–8 % (upper range 1 %–15 %) to the OMI NO2 VCDs over the western US in June–September of individual years, with a maximum contribution in 2020, which was a particularly high-fire year. The fire contribution in the rest of CONUS is negligible. In the absence of fires, we see (from Fig. 6) that OMI NO2 over the western US would have significantly decreased over the 2009–2020 period. Increasing fire activity over the past decade contributed to the flattening of the OMI trend. We see no such effect over the rest of CONUS, where open fires have negligible influence, and increasing lightning could be mostly responsible for the flattening of OMI NO2 there (Y. Wang et al., 2021).
OMI satellite observations of tropospheric NO2 vertical column densities (VCDs) over the contiguous US (CONUS) show a flattening trend after 2009 despite a continuous decrease in surface anthropogenic NOx emissions. This suggests a large and rising contribution from background NO2 in the free troposphere (above 2 km) to the tropospheric NO2 VCDs observed from space, but previous simulations with the GEOS-Chem chemical transport model have been unable to account for this background. Here, we used the GEOS-Chem chemical transport model including a new mechanism for particulate nitrate photolysis and the AEIC2019 inventory for aircraft emission trends, together with the NOAA HMS smoke product, to better understand the magnitude and trends of free tropospheric background NO2 and the implications for retrieval and interpretation of satellite data.
Inclusion of particulate nitrate photolysis as a secondary source of NOx in GEOS-Chem, following recent field and laboratory evidence, increases the annual mean tropospheric NO2 VCDs over CONUS by 13 %, with the maximum effect in spring (25 %). It also increases the air mass factor (AMF) for the satellite tropospheric NO2 retrieval by 7 % on an annual basis (11 % in spring) because of the increased contribution of the free troposphere to the tropospheric NO2 VCD. The combination of these two effects provides an improved fit of GEOS-Chem to the OMI satellite NO2 data, particularly in the spring when the model underestimate was the worst. The consideration of nitrate photolysis in 2009 and 2017 corrects 45 % of the discrepancy between GEOS-Chem and OMI NO2 changes over that period, because it increases the free tropospheric contribution to the NO2 VCDs while the surface anthropogenic emissions decline.
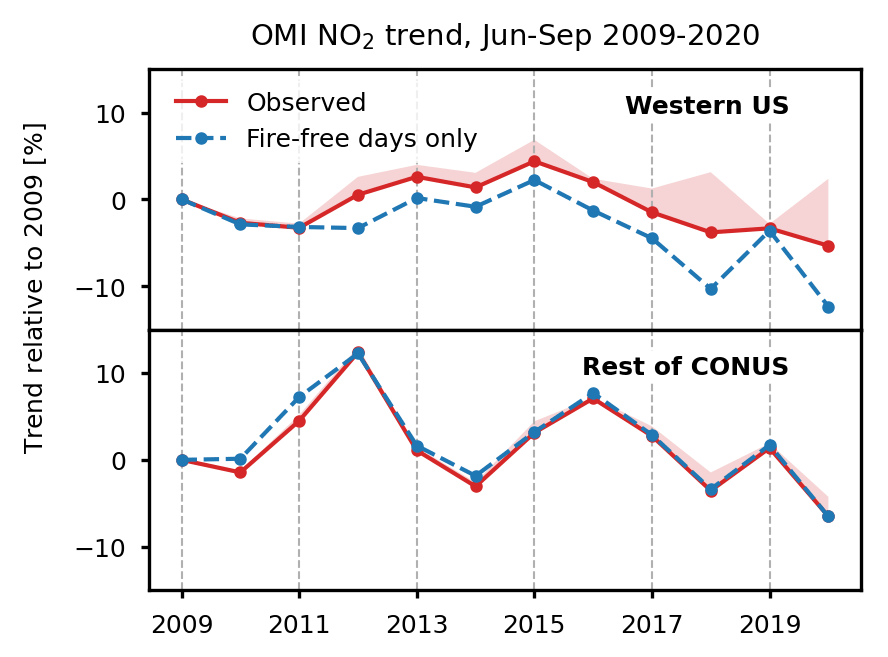
Figure 7Trends in OMI tropospheric NO2 VCDs over the western US and the rest of CONUS for June–September 2009–2020, examining the effects of fires. Trends are shown relative to 2009. The overall trend from the OMI observations (OMNO2 retrieval) is shown in red, and the trend for the subset of fire-free days is shown using a dashed line. Fire-free days are identified from the NOAA HMS product (see text). The red envelope shows the effect of a 50 % bias correction of the OMI NO2 retrieval on fire-affected days. The western US domain is defined as 30–50∘ N, 130–114∘ W.
Aircraft NOx emissions increased by 38 % globally from 2009 to 2017 and by 20 % over CONUS, but this has generally not been taken into account in the models used to derive vertical shape factors for satellite NO2 retrievals. The associated increase in the annual mean AMF is only 2 %, as aircraft emissions remain relatively low compared with lightning. Sustained increases in aircraft emissions in the future, combined with sustained decreases in surface anthropogenic emissions, are expected to increase the AMF by 14 % over the next decade with major implications for the interpretation of NO2 trends from satellite data.
The contribution of open fires to the free tropospheric NO2 background is difficult to diagnose in GEOS-Chem due to uncertainties in plume lofting and chemistry. Instead, we used the NOAA HMS to separate fire-free from fire-affected days in the OMI NO2 data during the June–September fire season in the western US. We find that fires contribute only 1 %–8 % of the seasonal OMI NO2 in that region for individual years but with an increasing trend over 2009–2017 that could offset the decrease in anthropogenic emissions and contribute to the flattening of the OMI NO2 tropospheric VCD trend during that period.
Our work demonstrates the importance of properly accounting for the free tropospheric background in interpreting NO2 observations from space. Better understanding is needed of the role of aerosol nitrate photolysis, which remains highly uncertain. Increasing contributions to the tropospheric NO2 VCD from free tropospheric sources including aircraft and fires, combined with decrease in surface anthropogenic emissions, will be critical to consider in future analyses of NO2 trends from satellite data.
The OMNO2 product is available at https://disc.gsfc.nasa.gov/datasets/OMNO2_003/summary (Krotkov et al., 2019). The HMS data can be downloaded from https://www.ospo.noaa.gov/Products/land/hms.html (HMS Science Team, 2003). The AEIC2019 inventory is now in the default GEOS-Chem version 13.4. All other model results are available upon request from the corresponding author.
The supplement related to this article is available online at: https://doi.org/10.5194/acp-23-6271-2023-supplement.
DJJ and RD designed the study. RD conducted model simulations and analyzed satellite and model data. VS contributed nitrate photolysis in GEOS-Chem and supported data analysis. SDE and FT provided the aircraft emission inventory and supporting guidance. JW and YW contributed the soil NOx emission scheme in GEOS-Chem. LJM and TL helped with interpretation and discussion related to the HMS product. RD and DJJ wrote the manuscript, and all authors contributed to the revision of the paper.
The contact author has declared that none of the authors has any competing interests.
Publisher’s note: Copernicus Publications remains neutral with regard to jurisdictional claims in published maps and institutional affiliations.
We acknowledge the Global Modeling and Assimilation Office (GMAO) at NASA Goddard Space Flight Center for providing the MERRA-2 data.
This research has been supported by the National Aeronautics and Space Administration (grant no. 80NSSC20K0930) and the U.S. Environmental Protection Agency (grant no. 84001401).
This paper was edited by Michel Van Roozendael and reviewed by three anonymous referees.
Airbus: Global Market Forecast 2022–2041, https://www.airbus.com/en/products-services/commercial-aircraft/market/global-market-forecast (last access: 26 May 2023), 2022.
Andersen, S. T., Carpenter, L. J., Reed, C., Lee, J. D., Chance, R., Sherwen, T., Vaughan, A. R., Stewart, J., Edwards, P. M., Bloss, W. J., Sommariva, R., Crilley, L. R., Nott, G. J., Neves, L., Read, K., Heard, D. E., Seakins, P. W., Whalley, L. K., Boustead, G. A., Fleming, L. T., Stone, D., and Fomba, K. W.: Extensive field evidence for the release of HONO from the photolysis of nitrate aerosols, Sci. Adv., 9, eadd6266, https://doi.org/10.1126/sciadv.add6266, 2023.
Bates, K. H. and Jacob, D. J.: A new model mechanism for atmospheric oxidation of isoprene: global effects on oxidants, nitrogen oxides, organic products, and secondary organic aerosol, Atmos. Chem. Phys., 19, 9613–9640, https://doi.org/10.5194/acp-19-9613-2019, 2019.
Belmonte Rivas, M., Veefkind, P., Eskes, H., and Levelt, P.: OMI tropospheric NO2 profiles from cloud slicing: constraints on surface emissions, convective transport and lightning NOx, Atmos. Chem. Phys., 15, 13519–13553, https://doi.org/10.5194/acp-15-13519-2015, 2015.
Boeing: Boeing Commercial Market Outlook 2022–2041, https://www.boeing.com/commercial/market/commercial-market-outlook/ (last access: 26 May 2023), 2022.
Boersma, K. F., Jacob, D. J., Bucsela, E. J., Perring, A. E., Dirksen, R., van der A, R. J., Yantosca, R. M., Park, R. J., Wenig, M. O., Bertram, T. H., and Cohen, R. C.: Validation of OMI tropospheric NO2 observations during INTEX-B and application to constrain NOx emissions over the eastern United States and Mexico, Atmos. Environ., 42, 4480–4497, https://doi.org/10.1016/j.atmosenv.2008.02.004, 2008.
Boersma, K. F., Vinken, G. C. M., and Eskes, H. J.: Representativeness errors in comparing chemistry transport and chemistry climate models with satellite UV–Vis tropospheric column retrievals, Geosci. Model Dev., 9, 875–898, https://doi.org/10.5194/gmd-9-875-2016, 2016.
Boersma, K. F., Eskes, H. J., Richter, A., De Smedt, I., Lorente, A., Beirle, S., van Geffen, J. H. G. M., Zara, M., Peters, E., Van Roozendael, M., Wagner, T., Maasakkers, J. D., van der A, R. J., Nightingale, J., De Rudder, A., Irie, H., Pinardi, G., Lambert, J.-C., and Compernolle, S. C.: Improving algorithms and uncertainty estimates for satellite NO2 retrievals: results from the quality assurance for the essential climate variables (QA4ECV) project, Atmos. Meas. Tech., 11, 6651–6678, https://doi.org/10.5194/amt-11-6651-2018, 2018.
Bows-Larkin, A., Mander, S. L., Traut, M. B., Anderson, K. L., and Wood, F. R.: Aviation and Climate Change–The Continuing Challenge, in: Encyclopedia of Aerospace Engineering, 1–11, 2016.
Brey, S. J. and Fischer, E. V.: Smoke in the City: How Often and Where Does Smoke Impact Summertime Ozone in the United States?, Environ. Sci. Technol., 50, 1288–1294, https://doi.org/10.1021/acs.est.5b05218, 2016.
Carter, T. S., Heald, C. L., Jimenez, J. L., Campuzano-Jost, P., Kondo, Y., Moteki, N., Schwarz, J. P., Wiedinmyer, C., Darmenov, A. S., da Silva, A. M., and Kaiser, J. W.: How emissions uncertainty influences the distribution and radiative impacts of smoke from fires in North America, Atmos. Chem. Phys., 20, 2073–2097, https://doi.org/10.5194/acp-20-2073-2020, 2020.
Castellanos, P., Boersma, K. F., Torres, O., and de Haan, J. F.: OMI tropospheric NO2 air mass factors over South America: effects of biomass burning aerosols, Atmos. Meas. Tech., 8, 3831–3849, https://doi.org/10.5194/amt-8-3831-2015, 2015.
Cattau, M. E., Wessman, C., Mahood, A., and Balch, J. K.: Anthropogenic and lightning-started fires are becoming larger and more frequent over a longer season length in the U.S.A, Global Ecol. Biogeogr., 29, 668–681, https://doi.org/10.1111/geb.13058, 2020.
Choi, S., Joiner, J., Choi, Y., Duncan, B. N., Vasilkov, A., Krotkov, N., and Bucsela, E.: First estimates of global free-tropospheric NO2 abundances derived using a cloud-slicing technique applied to satellite observations from the Aura Ozone Monitoring Instrument (OMI), Atmos. Chem. Phys., 14, 10565–10588, https://doi.org/10.5194/acp-14-10565-2014, 2014.
Cooper, M. J., Martin, R. V., Henze, D. K., and Jones, D. B. A.: Effects of a priori profile shape assumptions on comparisons between satellite NO2 https://doi.org/10.5194/acp-20-7231-2020, 2020a.
Cooper, M. J., Martin, R. V., McLinden, C. A., and Brook, J. R.: Inferring ground-level nitrogen dioxide concentrations at fine spatial resolution applied to the TROPOMI satellite instrument, Environ. Res. Lett., 15, 104013, https://doi.org/10.1088/1748-9326/aba3a5, 2020b.
Dedoussi, I. C.: Implications of future atmospheric composition in decision-making for sustainable aviation, Environ. Res. Lett., 16, 031002, https://doi.org/10.1088/1748-9326/abe74d, 2021.
Dobber, M., Voors, R., Dirksen, R., Kleipool, Q., and Levelt, P.: The High-Resolution Solar Reference Spectrum between 250 and 550 nm and its Application to Measurements with the Ozone Monitoring Instrument, Solar Phys., 249, 281–291, https://doi.org/10.1007/s11207-008-9187-7, 2008.
Dulitz, K., Amedro, D., Dillon, T. J., Pozzer, A., and Crowley, J. N.: Temperature-(208–318 K) and pressure-(18–696 Torr) dependent rate coefficients for the reaction between OH and HNO3, Atmos. Chem. Phys., 18, 2381–2394, https://doi.org/10.5194/acp-18-2381-2018, 2018.
Duncan, B. N., Yoshida, Y., de Foy, B., Lamsal, L. N., Streets, D. G., Lu, Z., Pickering, K. E., and Krotkov, N. A.: The observed response of Ozone Monitoring Instrument (OMI) NO2 columns to NOx emission controls on power plants in the United States: 2005–2011, Atmos. Environ., 81, 102–111, https://doi.org/10.1016/j.atmosenv.2013.08.068, 2013.
Duncan, B. N., Lamsal, L. N., Thompson, A. M., Yoshida, Y., Lu, Z., Streets, D. G., Hurwitz, M. M., and Pickering, K. E.: A space-based, high-resolution view of notable changes in urban NOx pollution around the world (2005–2014), J. Geophys. Res.-Atmos., 121, 976–996, https://doi.org/10.1002/2015JD024121, 2016.
EPA: Annual Average Emissions, Air Pollutant Emission Trends Data: https://www.epa.gov/air-emissions-inventories/air-pollutant-emissions-trends-data (last access: 26 May 2023), 2021.
Fischer, E. V., Zhu, L., Payne, V. H., Worden, J. R., Jiang, Z., Kulawik, S. S., Brey, S., Hecobian, A., Gombos, D., Cady-Pereira, K., and Flocke, F.: Using TES retrievals to investigate PAN in North American biomass burning plumes, Atmos. Chem. Phys., 18, 5639–5653, https://doi.org/10.5194/acp-18-5639-2018, 2018.
Gelaro, R., McCarty, W., Suarez, M. J., Todling, R., Molod, A., Takacs, L., Randles, C. A., Darmenov, A., Bosilovich, M. G., Reichle, R., Wargan, K., Coy, L., Cullather, R., Draper, C., Akella, S., Buchard, V., Conaty, A., da Silva, A. M., Gu, W., Kim, G. K., Koster, R., Lucchesi, R., Merkova, D., Nielsen, J. E., Partyka, G., Pawson, S., Putman, W., Rienecker, M., Schubert, S. D., Sienkiewicz, M., and Zhao, B.: The Modern-Era Retrospective Analysis for Research and Applications, Version 2 (MERRA-2), J. Climate, 30, 5419–5454, https://doi.org/10.1175/jcli-d-16-0758.1, 2017.
Gen, M., Liang, Z., Zhang, R., Go Mabato, B. R., and Chan, C. K.: Particulate nitrate photolysis in the atmosphere, Environ. Sci.-Atmos., 2, 111–127, https://doi.org/10.1039/D1EA00087J, 2022.
Griffin, D., McLinden, C. A., Dammers, E., Adams, C., Stockwell, C. E., Warneke, C., Bourgeois, I., Peischl, J., Ryerson, T. B., Zarzana, K. J., Rowe, J. P., Volkamer, R., Knote, C., Kille, N., Koenig, T. K., Lee, C. F., Rollins, D., Rickly, P. S., Chen, J., Fehr, L., Bourassa, A., Degenstein, D., Hayden, K., Mihele, C., Wren, S. N., Liggio, J., Akingunola, A., and Makar, P.: Biomass burning nitrogen dioxide emissions derived from space with TROPOMI: methodology and validation, Atmos. Meas. Tech., 14, 7929–7957, https://doi.org/10.5194/amt-14-7929-2021, 2021.
He, T.-L., Jones, D. B. A., Miyazaki, K., Huang, B., Liu, Y., Jiang, Z., White, E. C., Worden, H. M., and Worden, J. R.: Deep Learning to Evaluate US NOx Emissions Using Surface Ozone Predictions, J. Geophys. Res.-Atmos., 127, e2021JD035597, https://doi.org/10.1029/2021JD035597, 2022.
HMS Science Team: Hazard Mapping System Fire and Smoke Product, NOAA [data set], https://www.ospo.noaa.gov/Products/land/hms.html (last access: 26 May 2023), 2003.
Holmes, C. D., Bertram, T. H., Confer, K. L., Graham, K. A., Ronan, A. C., Wirks, C. K., and Shah, V.: The Role of Clouds in the Tropospheric NOx Cycle: A New Modeling Approach for Cloud Chemistry and Its Global Implications, Geophys. Res. Lett., 46, 4980–4990, https://doi.org/10.1029/2019GL081990, 2019.
Hudman, R. C., Moore, N. E., Mebust, A. K., Martin, R. V., Russell, A. R., Valin, L. C., and Cohen, R. C.: Steps towards a mechanistic model of global soil nitric oxide emissions: implementation and space based-constraints, Atmos. Chem. Phys., 12, 7779–7795, https://doi.org/10.5194/acp-12-7779-2012, 2012.
Jaeglé, L., Shah, V., Thornton, J. A., Lopez-Hilfiker, F. D., Lee, B. H., McDuffie, E. E., Fibiger, D., Brown, S. S., Veres, P., Sparks, T. L., Ebben, C. J., Wooldridge, P. J., Kenagy, H. S., Cohen, R. C., Weinheimer, A. J., Campos, T. L., Montzka, D. D., Digangi, J. P., Wolfe, G. M., Hanisco, T., Schroder, J. C., Campuzano-Jost, P., Day, D. A., Jimenez, J. L., Sullivan, A. P., Guo, H., and Weber, R. J.: Nitrogen Oxides Emissions, Chemistry, Deposition, and Export Over the Northeast United States During the WINTER Aircraft Campaign, J. Geophys. Res.-Atmos., 123, 12368–12393, https://doi.org/10.1029/2018JD029133, 2018.
Jaffe, D. A., O'Neill, S. M., Larkin, N. K., Holder, A. L., Peterson, D. L., Halofsky, J. E., and Rappold, A. G.: Wildfire and prescribed burning impacts on air quality in the United States, J. Air Waste Manage. Assoc., 70, 583–615, https://doi.org/10.1080/10962247.2020.1749731, 2020.
Jiang, Z., McDonald Brian, C., Worden, H., Worden John, R., Miyazaki, K., Qu, Z., Henze Daven, K., Jones Dylan, B. A., Arellano Avelino, F., Fischer Emily, V., Zhu, L., and Boersma, K. F.: Unexpected slowdown of US pollutant emission reduction in the past decade, P. Natl. Acad. Sci. USA, 115, 5099–5104, https://doi.org/10.1073/pnas.1801191115, 2018.
Jiang, Z., Zhu, R., Miyazaki, K., McDonald, B. C., Klimont, Z., Zheng, B., Boersma, K. F., Zhang, Q., Worden, H., Worden, J. R., Henze, D. K., Jones, D. B. A., Denier van der Gon, H. A. C., and Eskes, H.: Decadal Variabilities in Tropospheric Nitrogen Oxides Over United States, Europe, and China, J. Geophys. Res.-Atmos., 127, e2021JD035872, https://doi.org/10.1029/2021JD035872, 2022.
Jin, X., Zhu, Q., and Cohen, R. C.: Direct estimates of biomass burning NOx emissions and lifetimes using daily observations from TROPOMI, Atmos. Chem. Phys., 21, 15569–15587, https://doi.org/10.5194/acp-21-15569-2021, 2021.
Juncosa Calahorrano, J. F., Payne, V. H., Kulawik, S., Ford, B., Flocke, F., Campos, T., and Fischer, E. V.: Evolution of Acyl Peroxynitrates (PANs) in Wildfire Smoke Plumes Detected by the Cross-Track Infrared Sounder (CrIS) Over the Western U.S. During Summer 2018, Geophys. Res. Lett., 48, e2021GL093405, https://doi.org/10.1029/2021GL093405, 2021.
Kasibhatla, P., Sherwen, T., Evans, M. J., Carpenter, L. J., Reed, C., Alexander, B., Chen, Q., Sulprizio, M. P., Lee, J. D., Read, K. A., Bloss, W., Crilley, L. R., Keene, W. C., Pszenny, A. A. P., and Hodzic, A.: Global impact of nitrate photolysis in sea-salt aerosol on NOx, OH, and O3 in the marine boundary layer, Atmos. Chem. Phys., 18, 11185–11203, https://doi.org/10.5194/acp-18-11185-2018, 2018.
Kim, J., Jeong, U., Ahn, M.-H., Kim, J. H., Park, R. J., Lee, H., Song, C. H., Choi, Y.-S., Lee, K.-H., Yoo, J.-M., Jeong, M.-J., Park, S. K., Lee, K.-M., Song, C.-K., Kim, S.-W., Kim, Y. J., Kim, S.-W., Kim, M., Go, S., Liu, X., Chance, K., Chan Miller, C., Al-Saadi, J., Veihelmann, B., Bhartia, P. K., Torres, O., Abad, G. G., Haffner, D. P., Ko, D. H., Lee, S. H., Woo, J.-H., Chong, H., Park, S. S., Nicks, D., Choi, W. J., Moon, K.-J., Cho, A., Yoon, J., Kim, S.-k., Hong, H., Lee, K., Lee, H., Lee, S., Choi, M., Veefkind, P., Levelt, P. F., Edwards, D. P., Kang, M., Eo, M., Bak, J., Baek, K., Kwon, H.-A., Yang, J., Park, J., Han, K. M., Kim, B.-R., Shin, H.-W., Choi, H., Lee, E., Chong, J., Cha, Y., Koo, J.-H., Irie, H., Hayashida, S., Kasai, Y., Kanaya, Y., Liu, C., Lin, J., Crawford, J. H., Carmichael, G. R., Newchurch, M. J., Lefer, B. L., Herman, J. R., Swap, R. J., Lau, A. K. H., Kurosu, T. P., Jaross, G., Ahlers, B., Dobber, M., McElroy, C. T., and Choi, Y.: New Era of Air Quality Monitoring from Space: Geostationary Environment Monitoring Spectrometer (GEMS), B. Am. Meteorol. Soc., 101, 1–22, https://doi.org/10.1175/BAMS-D-18-0013.1, 2020.
Krotkov, N. A., McLinden, C. A., Li, C., Lamsal, L. N., Celarier, E. A., Marchenko, S. V., Swartz, W. H., Bucsela, E. J., Joiner, J., Duncan, B. N., Boersma, K. F., Veefkind, J. P., Levelt, P. F., Fioletov, V. E., Dickerson, R. R., He, H., Lu, Z., and Streets, D. G.: Aura OMI observations of regional SO2 and NO2 pollution changes from 2005 to 2015, Atmos. Chem. Phys., 16, 4605–4629, https://doi.org/10.5194/acp-16-4605-2016, 2016.
Krotkov, N. A., Lamsal, L. N., Marchenko, S. V., Bucsela, E. J., Swartz, W. H., Joiner J., and the OMI core team: OMI/Aura Nitrogen Dioxide (NO2) Total and Tropospheric Column 1-orbit L2 Swath 13×24 km V003, Greenbelt, MD, USA, Goddard Earth Sciences Data and Information Services Center (GES DISC) [data set], https://disc.gsfc.nasa.gov/datasets/OMNO2_003/summary (last access: 26 May 2023), 2019.
Lamsal, L. N., Krotkov, N. A., Vasilkov, A., Marchenko, S., Qin, W., Yang, E.-S., Fasnacht, Z., Joiner, J., Choi, S., Haffner, D., Swartz, W. H., Fisher, B., and Bucsela, E.: Ozone Monitoring Instrument (OMI) Aura nitrogen dioxide standard product version 4.0 with improved surface and cloud treatments, Atmos. Meas. Tech., 14, 455–479, https://doi.org/10.5194/amt-14-455-2021, 2021.
Laughner, J. L. and Cohen, R. C.: Direct observation of changing NOx lifetime in North American cities, Science, 366, 723–727, https://doi.org/10.1126/science.aax6832, 2019.
Laughner, J. L., Zhu, Q., and Cohen, R. C.: Evaluation of version 3.0B of the BEHR OMI NO2 product, Atmos. Meas. Tech., 12, 129–146, https://doi.org/10.5194/amt-12-129-2019, 2019.
Lee, D. S., Fahey, D. W., Skowron, A., Allen, M. R., Burkhardt, U., Chen, Q., Doherty, S. J., Freeman, S., Forster, P. M., Fuglestvedt, J., Gettelman, A., De León, R. R., Lim, L. L., Lund, M. T., Millar, R. J., Owen, B., Penner, J. E., Pitari, G., Prather, M. J., Sausen, R., and Wilcox, L. J.: The contribution of global aviation to anthropogenic climate forcing for 2000 to 2018, Atmos. Environ., 244, 117834, https://doi.org/10.1016/j.atmosenv.2020.117834, 2021.
Li, C., Xu, X., Liu, X., Wang, J., Sun, K., van Geffen, J., Zhu, Q., Ma, J., Jin, J., Qin, K., He, Q., Xie, P., Ren, B., and Cohen, R. C.: Direct Retrieval of NOx Vertical Columns from UV-Vis (390–495 nm) Spectral Radiances Using a Neural Network, J. Remote Sens., 2022, 9817134, https://doi.org/10.34133/2022/9817134, 2022.
Liu, H. Y., Jacob, D. J., Bey, I., and Yantosca, R. M.: Constraints from Pb-210 and Be-7 on wet deposition and transport in a global three-dimensional chemical tracer model driven by assimilated meteorological fields, J. Geophys. Res.-Atmos., 106, 12109–12128, https://doi.org/10.1029/2000jd900839, 2001.
Liu, M., Lin, J., Kong, H., Boersma, K. F., Eskes, H., Kanaya, Y., He, Q., Tian, X., Qin, K., Xie, P., Spurr, R., Ni, R., Yan, Y., Weng, H., and Wang, J.: A new TROPOMI product for tropospheric NO2 columns over East Asia with explicit aerosol corrections, Atmos. Meas. Tech., 13, 4247–4259, https://doi.org/10.5194/amt-13-4247-2020, 2020.
Lorente, A., Folkert Boersma, K., Yu, H., Dörner, S., Hilboll, A., Richter, A., Liu, M., Lamsal, L. N., Barkley, M., De Smedt, I., Van Roozendael, M., Wang, Y., Wagner, T., Beirle, S., Lin, J.-T., Krotkov, N., Stammes, P., Wang, P., Eskes, H. J., and Krol, M.: Structural uncertainty in air mass factor calculation for NO2 and HCHO satellite retrievals, Atmos. Meas. Tech., 10, 759–782, https://doi.org/10.5194/amt-10-759-2017, 2017.
Luo, G., Yu, F., and Schwab, J.: Revised treatment of wet scavenging processes dramatically improves GEOS-Chem 12.0.0 simulations of surface nitric acid, nitrate, and ammonium over the United States, Geosci. Model Dev., 12, 3439–3447, https://doi.org/10.5194/gmd-12-3439-2019, 2019.
Luo, G., Yu, F., and Moch, J. M.: Further improvement of wet process treatments in GEOS-Chem v12.6.0: impact on global distributions of aerosols and aerosol precursors, Geosci. Model Dev., 13, 2879-2903, 10.5194/gmd-13-2879-2020, 2020.
Marais, E. A., Jacob, D. J., Choi, S., Joiner, J., Belmonte-Rivas, M., Cohen, R. C., Beirle, S., Murray, L. T., Schiferl, L. D., Shah, V., and Jaeglé, L.: Nitrogen oxides in the global upper troposphere: interpreting cloud-sliced NO2 observations from the OMI satellite instrument, Atmos. Chem. Phys., 18, 17017–17027, https://doi.org/10.5194/acp-18-17017-2018, 2018.
Marais, E. A., Roberts, J. F., Ryan, R. G., Eskes, H., Boersma, K. F., Choi, S., Joiner, J., Abuhassan, N., Redondas, A., Grutter, M., Cede, A., Gomez, L., and Navarro-Comas, M.: New observations of NO2 in the upper troposphere from TROPOMI, Atmos. Meas. Tech., 14, 2389–2408, https://doi.org/10.5194/amt-14-2389-2021, 2021.
Martin, R. V., Chance, K., Jacob, D. J., Kurosu, T. P., Spurr, R. J. D., Bucsela, E., Gleason, J. F., Palmer, P. I., Bey, I., Fiore, A. M., Li, Q., Yantosca, R. M., and Koelemeijer, R. B. A.: An improved retrieval of tropospheric nitrogen dioxide from GOME, J. Geophys. Res.-Atmos., 107, ACH 9-1–ACH 9-21, https://doi.org/10.1029/2001JD001027, 2002.
Martin, R. V., Jacob, D. J., Chance, K., Kurosu, T. P., Palmer, P. I., and Evans, M. J.: Global inventory of nitrogen oxide emissions constrained by space-based observations of NO2 columns, J. Geophys. Res.-Atmos., 108, ACH 5-1–ACH 5-12, https://doi.org/10.1029/2003JD003453, 2003.
McDuffie, E. E., Smith, S. J., O'Rourke, P., Tibrewal, K., Venkataraman, C., Marais, E. A., Zheng, B., Crippa, M., Brauer, M., and Martin, R. V.: A global anthropogenic emission inventory of atmospheric pollutants from sector- and fuel-specific sources (1970–2017): an application of the Community Emissions Data System (CEDS), Earth Syst. Sci. Data, 12, 3413–3442, https://doi.org/10.5194/essd-12-3413-2020, 2020.
Mebust, A. K., Russell, A. R., Hudman, R. C., Valin, L. C., and Cohen, R. C.: Characterization of wildfire NOx emissions using MODIS fire radiative power and OMI tropospheric NO2 columns, Atmos. Chem. Phys., 11, 5839–5851, https://doi.org/10.5194/acp-11-5839-2011, 2011.
Miyazaki, K., Eskes, H., Sudo, K., Boersma, K. F., Bowman, K., and Kanaya, Y.: Decadal changes in global surface NOx emissions from multi-constituent satellite data assimilation, Atmos. Chem. Phys., 17, 807–837, https://doi.org/10.5194/acp-17-807-2017, 2017.
Murray, L. T., Jacob, D. J., Logan, J. A., Hudman, R. C., and Koshak, W. J.: Optimized regional and interannual variability of lightning in a global chemical transport model constrained by LIS/OTD satellite data, J. Geophys. Res.-Atmos., 117, D20307, https://doi.org/10.1029/2012JD017934, 2012.
Ott, L. E., Pickering, K. E., Stenchikov, G. L., Allen, D. J., DeCaria, A. J., Ridley, B., Lin, R. F., Lang, S., and Tao, W. K.: Production of lightning NOx and its vertical distribution calculated from three-dimensional cloud-scale chemical transport model simulations, J. Geophys. Res.-Atmos., 115, D04301, https://doi.org/10.1029/2009jd011880, 2010.
Palm, B. B., Peng, Q., Hall, S. R., Ullmann, K., Campos, T. L., Weinheimer, A., Montzka, D., Tyndall, G., Permar, W., Hu, L., Flocke, F., Fischer, E. V., and Thornton, J. A.: Spatially Resolved Photochemistry Impacts Emissions Estimates in Fresh Wildfire Plumes, Geophys. Res. Lett., 48, e2021GL095443, https://doi.org/10.1029/2021GL095443, 2021.
Palmer, P. I., Jacob, D. J., Chance, K., Martin, R. V., Spurr, R. J. D., Kurosu, T. P., Bey, I., Yantosca, R., Fiore, A., and Li, Q.: Air mass factor formulation for spectroscopic measurements from satellites: Application to formaldehyde retrievals from the Global Ozone Monitoring Experiment, J. Geophys. Res.-Atmos., 106, 14539–14550, https://doi.org/10.1029/2000JD900772, 2001.
Peng, Q. Y., Palm, B. B., Fredrickson, C. D., Lee, B. H., Hall, S. R., Ullmann, K., Campos, T., Weinheimer, A. J., Apel, E. C., Flocke, F., Permar, W., Hu, L., Garofalo, L. A., Pothier, M. A., Farmer, D. K., Ku, I. T., Sullivan, A. P., Collett, J. L., Fischer, E., and Thornton, J. A.: Observations and Modeling of NOx Photochemistry and Fate in Fresh Wildfire Plumes, ACS Earth Space Chem., 5, 2652–2667, https://doi.org/10.1021/acsearthspacechem.1c00086, 2021.
Qu, Z., Jacob, D. J., Silvern, R. F., Shah, V., Campbell, P. C., Valin, L. C., and Murray, L. T.: US COVID-19 Shutdown Demonstrates Importance of Background NO2 in Inferring NOx Emissions From Satellite NO2 Observations, Geophys. Res. Lett., 48, e2021GL092783, https://doi.org/10.1029/2021GL092783, 2021.
Reed, C., Evans, M. J., Crilley, L. R., Bloss, W. J., Sherwen, T., Read, K. A., Lee, J. D., and Carpenter, L. J.: Evidence for renoxification in the tropical marine boundary layer, Atmos. Chem. Phys., 17, 4081–4092, https://doi.org/10.5194/acp-17-4081-2017, 2017.
Richards, N. K., Wingen, L. M., Callahan, K. M., Nishino, N., Kleinman, M. T., Tobias, D. J., and Finlayson-Pitts, B. J.: Nitrate Ion Photolysis in Thin Water Films in the Presence of Bromide Ions, J. Phys. Chem. A, 115, 5810–5821, https://doi.org/10.1021/jp109560j, 2011.
Richards, N. K., Anderson, C., Anastasio, C., and Finlayson-Pitts, B. J.: The effect of cations on NO2 production from the photolysis of aqueous thin water films of nitrate salts, Phys. Chem. Chem. Phys., 17, 32211–32218, https://doi.org/10.1039/C5CP05325K, 2015.
Rolph, G. D., Draxler, R. R., Stein, A. F., Taylor, A., Ruminski, M. G., Kondragunta, S., Zeng, J., Huang, H.-C., Manikin, G., McQueen, J. T., and Davidson, P. M.: Description and Verification of the NOAA Smoke Forecasting System: The 2007 Fire Season, Weather Forecast., 24, 361–378, https://doi.org/10.1175/2008waf2222165.1, 2009.
Romer, P. S., Wooldridge, P. J., Crounse, J. D., Kim, M. J., Wennberg, P. O., Dibb, J. E., Scheuer, E., Blake, D. R., Meinardi, S., Brosius, A. L., Thames, A. B., Miller, D. O., Brune, W. H., Hall, S. R., Ryerson, T. B., and Cohen, R. C.: Constraints on Aerosol Nitrate Photolysis as a Potential Source of HONO and NOx, Environ. Sci. Technol., 52, 13738–13746, https://doi.org/10.1021/acs.est.8b03861, 2018.
Russell, A. R., Valin, L. C., and Cohen, R. C.: Trends in OMI NO2 observations over the United States: effects of emission control technology and the economic recession, Atmos. Chem. Phys., 12, 12197–12209, https://doi.org/10.5194/acp-12-12197-2012, 2012.
Scharko, N. K., Berke, A. E., and Raff, J. D.: Release of Nitrous Acid and Nitrogen Dioxide from Nitrate Photolysis in Acidic Aqueous Solutions, Environ. Sci. Technol., 48, 11991–12001, https://doi.org/10.1021/es503088x, 2014.
Shah, V., Jacob, D. J., Dang, R., Lamsal, L. N., Strode, S. A., Steenrod, S. D., Boersma, K. F., Eastham, S. D., Fritz, T. M., Thompson, C., Peischl, J., Bourgeois, I., Pollack, I. B., Nault, B. A., Cohen, R. C., Campuzano-Jost, P., Jimenez, J. L., Andersen, S. T., Carpenter, L. J., Sherwen, T., and Evans, M. J.: Nitrogen oxides in the free troposphere: implications for tropospheric oxidants and the interpretation of satellite NO2 measurements, Atmos. Chem. Phys., 23, 1227–1257, https://doi.org/10.5194/acp-23-1227-2023, 2023.
Silvern, R. F., Jacob, D. J., Travis, K. R., Sherwen, T., Evans, M. J., Cohen, R. C., Laughner, J. L., Hall, S. R., Ullmann, K., Crounse, J. D., Wennberg, P. O., Peischl, J., and Pollack, I. B.: Observed NO/NO2 Ratios in the Upper Troposphere Imply Errors in NO-NO2-O3 Cycling Kinetics or an Unaccounted NOx Reservoir, Geophys. Res. Lett., 45, 4466–4474, https://doi.org/10.1029/2018GL077728, 2018.
Silvern, R. F., Jacob, D. J., Mickley, L. J., Sulprizio, M. P., Travis, K. R., Marais, E. A., Cohen, R. C., Laughner, J. L., Choi, S., Joiner, J., and Lamsal, L. N.: Using satellite observations of tropospheric NO2 columns to infer long-term trends in US NOx emissions: the importance of accounting for the free tropospheric NO2 background, Atmos. Chem. Phys., 19, 8863–8878, https://doi.org/10.5194/acp-19-8863-2019, 2019.
Simone, N. W., Stettler, M. E. J., and Barrett, S. R. H.: Rapid estimation of global civil aviation emissions with uncertainty quantification, Transport Environ., 25, 33–41, https://doi.org/10.1016/j.trd.2013.07.001, 2013.
Travis, K. R., Jacob, D. J., Fisher, J. A., Kim, P. S., Marais, E. A., Zhu, L., Yu, K., Miller, C. C., Yantosca, R. M., Sulprizio, M. P., Thompson, A. M., Wennberg, P. O., Crounse, J. D., St. Clair, J. M., Cohen, R. C., Laughner, J. L., Dibb, J. E., Hall, S. R., Ullmann, K., Wolfe, G. M., Pollack, I. B., Peischl, J., Neuman, J. A., and Zhou, X.: Why do models overestimate surface ozone in the Southeast United States?, Atmos. Chem. Phys., 16, 13561–13577, https://doi.org/10.5194/acp-16-13561-2016, 2016.
Travis, K. R., Heald, C. L., Allen, H. M., Apel, E. C., Arnold, S. R., Blake, D. R., Brune, W. H., Chen, X., Commane, R., Crounse, J. D., Daube, B. C., Diskin, G. S., Elkins, J. W., Evans, M. J., Hall, S. R., Hintsa, E. J., Hornbrook, R. S., Kasibhatla, P. S., Kim, M. J., Luo, G., McKain, K., Millet, D. B., Moore, F. L., Peischl, J., Ryerson, T. B., Sherwen, T., Thames, A. B., Ullmann, K., Wang, X., Wennberg, P. O., Wolfe, G. M., and Yu, F.: Constraining remote oxidation capacity with ATom observations, Atmos. Chem. Phys., 20, 7753–7781, https://doi.org/10.5194/acp-20-7753-2020, 2020.
van der Werf, G. R., Randerson, J. T., Giglio, L., van Leeuwen, T. T., Chen, Y., Rogers, B. M., Mu, M., van Marle, M. J. E., Morton, D. C., Collatz, G. J., Yokelson, R. J., and Kasibhatla, P. S.: Global fire emissions estimates during 1997–2016, Earth Syst. Sci. Data, 9, 697–720, https://doi.org/10.5194/essd-9-697-2017, 2017.
van Geffen, J., Boersma, K. F., Eskes, H., Sneep, M., ter Linden, M., Zara, M., and Veefkind, J. P.: S5P TROPOMI NO2 slant column retrieval: method, stability, uncertainties and comparisons with OMI, Atmos. Meas. Tech., 13, 1315–1335, https://doi.org/10.5194/amt-13-1315-2020, 2020.
Vasilkov, A., Krotkov, N., Yang, E.-S., Lamsal, L., Joiner, J., Castellanos, P., Fasnacht, Z., and Spurr, R.: Explicit and consistent aerosol correction for visible wavelength satellite cloud and nitrogen dioxide retrievals based on optical properties from a global aerosol analysis, Atmos. Meas. Tech., 14, 2857–2871, https://doi.org/10.5194/amt-14-2857-2021, 2021.
Vinken, G. C. M., Boersma, K. F., Maasakkers, J. D., Adon, M., and Martin, R. V.: Worldwide biogenic soil NOx emissions inferred from OMI NO2 observations, Atmos. Chem. Phys., 14, 10363–10381, https://doi.org/10.5194/acp-14-10363-2014, 2014.
Wang, X., Dalton, E. Z., Payne, Z. C., Perrier, S., Riva, M., Raff, J. D., and George, C.: Superoxide and Nitrous Acid Production from Nitrate Photolysis Is Enhanced by Dissolved Aliphatic Organic Matter, Environ. Sci. Technol. Lett., 8, 53–58, https://doi.org/10.1021/acs.estlett.0c00806, 2021.
Wang, X., Jacob, D. J., Downs, W., Zhai, S., Zhu, L., Shah, V., Holmes, C. D., Sherwen, T., Alexander, B., Evans, M. J., Eastham, S. D., Neuman, J. A., Veres, P. R., Koenig, T. K., Volkamer, R., Huey, L. G., Bannan, T. J., Percival, C. J., Lee, B. H., and Thornton, J. A.: Global tropospheric halogen (Cl, Br, I) chemistry and its impact on oxidants, Atmos. Chem. Phys., 21, 13973–13996, https://doi.org/10.5194/acp-21-13973-2021, 2021.
Wang, Y., Wang, J., Xu, X., Henze, D. K., Qu, Z., and Yang, K.: Inverse modeling of SO2 and NOx emissions over China using multisensor satellite data – Part 1: Formulation and sensitivity analysis, Atmos. Chem. Phys., 20, 6631–6650, https://doi.org/10.5194/acp-20-6631-2020, 2020.
Wang, Y., Ge, C., Castro Garcia, L., Jenerette, G. D., Oikawa, P. Y., and Wang, J.: Improved modelling of soil NOx emissions in a high temperature agricultural region: role of background emissions on NO2 trend over the US, Environ. Res. Lett., 16, 084061, https://doi.org/10.1088/1748-9326/ac16a3, 2021.
Wesely, M. L.: Parameterization of surface resistances to gaseous dry deposition in regional-scale numerical-models, Atmos. Environ., 23, 1293–1304, https://doi.org/10.1016/0004-6981(89)90153-4, 1989.
Westerling, A. L.: Increasing western US forest wildfire activity: sensitivity to changes in the timing of spring, Philos. T. Roy. Soc. B, 371, 20150178, https://doi.org/10.1098/rstb.2015.0178, 2016.
Wilkerson, J. T., Jacobson, M. Z., Malwitz, A., Balasubramanian, S., Wayson, R., Fleming, G., Naiman, A. D., and Lele, S. K.: Analysis of emission data from global commercial aviation: 2004 and 2006, Atmos. Chem. Phys., 10, 6391–6408, https://doi.org/10.5194/acp-10-6391-2010, 2010.
Wingen, L. M., Moskun, A. C., Johnson, S. N., Thomas, J. L., Roeselová, M., Tobias, D. J., Kleinman, M. T., and Finlayson-Pitts, B. J.: Enhanced surface photochemistry in chloride–nitrate ion mixtures, Phys. Chem. Chem. Phys., 10, 5668–5677, https://doi.org/10.1039/B806613B, 2008.
Yang, K., Carn, S. A., Ge, C., Wang, J., and Dickerson, R. R.: Advancing measurements of tropospheric NO2 from space: New algorithm and first global results from OMPS, Geophys. Res. Lett., 41, 4777–4786, https://doi.org/10.1002/2014GL060136, 2014.
Ye, C., Zhou, X., Pu, D., Stutz, J., Festa, J., Spolaor, M., Tsai, C., Cantrell, C., Mauldin, R. L., Campos, T., Weinheimer, A., Hornbrook, R. S., Apel, E. C., Guenther, A., Kaser, L., Yuan, B., Karl, T., Haggerty, J., Hall, S., Ullmann, K., Smith, J. N., Ortega, J., and Knote, C.: Rapid cycling of reactive nitrogen in the marine boundary layer, Nature, 532, 489–491, https://doi.org/10.1038/nature17195, 2016.
Ye, C., Zhang, N., Gao, H., and Zhou, X.: Photolysis of Particulate Nitrate as a Source of HONO and NOx, Environ. Sci. Technol., 51, 6849–6856, https://doi.org/10.1021/acs.est.7b00387, 2017.
Zhai, S., Jacob, D. J., Wang, X., Liu, Z., Wen, T., Shah, V., Li, K., Moch, J. M., Bates, K. H., Song, S., Shen, L., Zhang, Y., Luo, G., Yu, F., Sun, Y., Wang, L., Qi, M., Tao, J., Gui, K., Xu, H., Zhang, Q., Zhao, T., Wang, Y., Lee, H. C., Choi, H., and Liao, H.: Control of particulate nitrate air pollution in China, Nat. Geosci., 14, 389–395, https://doi.org/10.1038/s41561-021-00726-z, 2021.
Zhang, J., Zhang, S., Zhang, X., Wang, J., Wu, Y., and Hao, J.: Developing a High-Resolution Emission Inventory of China's Aviation Sector Using Real-World Flight Trajectory Data, Environ. Sci. Technol., 56, 5743–5752, https://doi.org/10.1021/acs.est.1c08741, 2022.
Zhang, R., Gen, M., Huang, D., Li, Y., and Chan, C. K.: Enhanced Sulfate Production by Nitrate Photolysis in the Presence of Halide Ions in Atmospheric Particles, Environ. Sci. Technol., 54, 3831–3839, https://doi.org/10.1021/acs.est.9b06445, 2020.
Zhu, L., Val Martin, M., Gatti, L. V., Kahn, R., Hecobian, A., and Fischer, E. V.: Development and implementation of a new biomass burning emissions injection height scheme (BBEIH v1.0) for the GEOS-Chem model (v9-01-01), Geosci. Model Dev., 11, 4103–4116, https://doi.org/10.5194/gmd-11-4103-2018, 2018.
Zhu, Q., Laughner, J. L., and Cohen, R. C.: Lightning NO2 simulation over the contiguous US and its effects on satellite NO2 retrievals, Atmos. Chem. Phys., 19, 13067–13078, https://doi.org/10.5194/acp-19-13067-2019, 2019.
- Abstract
- Introduction
- GEOS-Chem model
- Effect of nitrate photolysis on the simulation of satellite NO2 observations
- Effect of aircraft emissions and future AMF projections
- Effect of open-fire emissions
- Conclusions
- Data availability
- Author contributions
- Competing interests
- Disclaimer
- Acknowledgements
- Financial support
- Review statement
- References
- Supplement