the Creative Commons Attribution 4.0 License.
the Creative Commons Attribution 4.0 License.
 | 30 May 2023
Measurement report: Hydrogen peroxide in the upper tropical troposphere over the Atlantic Ocean and western Africa during the CAFE-Africa aircraft campaign
Zaneta Hamryszczak
Dirk Dienhart
Bettina Brendel
Roland Rohloff
Daniel Marno
Monica Martinez
Hartwig Harder
Andrea Pozzer
Birger Bohn
Martin Zöger
Jos Lelieveld
Horst Fischer
This study focuses on the distribution of hydrogen peroxide (H2O2) in the upper tropical troposphere at altitudes between 8 and 15 km based on in situ observations during the Chemistry of the Atmosphere: Field Experiment in Africa (CAFE-Africa) campaign conducted in August–September 2018 over the tropical Atlantic Ocean and western Africa. The measured hydrogen peroxide mixing ratios in the upper troposphere show no clear trend in the latitudinal distribution with locally increased levels (up to 1 ppbv) within the Intertropical Convergence Zone (ITCZ), over the African coastal area, as well as during measurements performed in proximity to the tropical storm Florence (later developing into a hurricane). The observed H2O2 distribution suggests that mixing ratios in the upper troposphere seem to be far less dependent on latitude than assumed previously and the corresponding factors influencing the photochemical production and loss of H2O2. The observed levels of H2O2 in the upper troposphere indicate the influence of convective transport processes on the distribution of the species not only in the tropical but also in the subtropical regions. The measurements are compared to observation-based photostationary steady-state (PSS) calculations and numerical simulations by the global ECHAM/MESSy Atmospheric Chemistry (EMAC) model. North of the ITCZ, PSS calculations produce mostly lower H2O2 mixing ratios relative to the observations. The observed mixing ratios tend to exceed the PSS calculations by up to a factor of 2. With the exception of local events, the comparison between the calculated PSS values and the observations indicates enhanced H2O2 mixing ratios relative to the expectations based on PSS calculations in the north of the ITCZ. On the other hand, PSS calculations tend to overestimate the H2O2 mixing ratios in most of the sampled area in the south of the ITCZ by a factor of up to 3. The significant influence of convection in the ITCZ and the enhanced presence of clouds towards the Southern Hemisphere indicate contributions of atmospheric transport and cloud scavenging in the sampled region.
Simulations performed by the EMAC model also overestimate hydrogen peroxide levels particularly in the Southern Hemisphere, most likely due to underestimated cloud scavenging. EMAC simulations and PSS calculations both indicate a latitudinal gradient from the Equator towards the subtropics. In contrast, the measurements show no clear gradient with latitude in the mixing ratios of H2O2 in the upper troposphere with a slight decrease from the ITCZ towards the subtropics, indicating a relatively low dependency on the solar radiation intensity and the corresponding photolytic activity. The largest model deviations relative to the observations correspond with the underestimated hydrogen peroxide loss due to enhanced cloud presence, scavenging, and rainout in the ITCZ and towards the south.
- Article
(5676 KB) - Full-text XML
-
Supplement
(2075 KB) - BibTeX
- EndNote


The key role of hydrogen peroxide in the oxidative chemistry of the troposphere is well acknowledged (Lelieveld and Crutzen, 1990; Crutzen et al., 1999). On the one hand, H2O2 serves as a reservoir of HOx (OH + HO2 = HOx) species, which are the most prominent oxidants controlling the self-cleansing capacity of the atmosphere (Levy, 1971; Logan et al., 1981; Kleinman, 1991). On the other hand, hydrogen peroxide can oxidize SO2 and to a minor extent NO2 and convert them into H2SO4 and HNO3 in clouds, rain, and fog, leading to their acidification (Hoffmann and Edwards, 1975; Penkett et al., 1979; Robbin Martin and Damschen, 1981; Damschen and Martin, 1983; Calvert et al., 1985).
The most prominent pathway leading to H2O2 production is the self-reaction of HO2 radicals (Reaction R4). HO2 can be formed by many pathways. Under the upper troposphere conditions investigated in this work, HO2 is mainly formed via reaction of carbon monoxide by OH radicals, which can be formed initially in the photolysis of ozone and the subsequent reaction of O1D with water vapor (Reactions R1–R3). Moreover, OH can be recycled from HO2 in reactions with NO or O3. The budget of H2O2 is thus controlled by the steady-state concentration of the HO2 radicals and the main gas-phase loss processes photolysis and reaction with OH (Reactions R5–R6).
The global distribution of hydrogen peroxides is not only dependent on the chemical composition of the atmosphere but also on meteorological conditions. The amount of hydrogen peroxide is strongly dependent on the availability of water vapor and near-UV radiation (Jacob and Klockow, 1992; Perros, 1993; Slemr and Tremmel, 1994; Snow, 2003; Snow et al., 2007; Klippel et al., 2011). Towards the tropopause as well as towards the poles, the amount of water vapor generally decreases, resulting in a reduced primary production of HOx radicals. Additionally, with increasing altitudes near-UV radiation and therefore H2O2 photolysis increase leading to a pronounced production of OH via H2O2 photolysis in R5 (Jaeglé et al., 1997, 2000; Faloona et al., 2000, 2004; Lee et al., 2000). On the other hand, the availability of hydrogen peroxide precursors is diminished with increasing latitude, due to the decreasing inclination of solar radiation and reduced amount of water vapor towards the poles. Physical loss of hydrogen peroxide occurs through deposition processes promoted by its high solubility (Walcek, 1987; Chang et al., 2004; Nguyen et al., 2015). The aqueous uptake and subsequent removal of H2O2 strongly depends upon the uptake by aerosols and clouds (O'Sullivan et al., 1999). In effect, based on the availability of the H2O2 precursors (OH and hence HO2) and the corresponding photochemical reactions producing and removing H2O2 in the troposphere as well as on the discussed physical processes, the vertical distribution of H2O2 often follows an inverted C-shape with decreased mixing ratios within the boundary layer and the upper troposphere and a local maximum in the middle troposphere at altitudes between 2 and 5 km. Additionally, observations in the upper troposphere (UT) (> 8 km) indicate a decreasing trend approximately from the Equator towards the north and south (Daum et al., 1990; Heikes, 1992; O'Sullivan et al., 1996; Weinstein-Lloyd et al., 1998; Snow, 2003; Snow et al., 2007; Klippel et al., 2011).
In general, the global budget of hydrogen peroxide is significantly affected by anthropogenic as well as natural emissions of nitrogen oxides. In urban areas, the formation of hydrogen peroxide is diminished by the increased mixing ratios of NOx (NOx = NO2 + NO) derived from anthropogenic sources, as the self-reaction of HO2 to H2O2 is competing with the much faster reaction of HO2 with NO (Lee et al., 2000; Reeves and Penkett, 2003). In contrast, biomass burning events lead to significant injections of additional hydrogen peroxide through primary as well as secondary chemical production (Lee et al., 1997; Rinsland et al., 2007; Snow et al., 2007; Allen et al., 2022). Finally, convection processes are considered to increase the mixing ratios of hydrogen peroxide in the upper troposphere (Jaeglé et al., 1997, 2000; Klippel et al., 2011; Bozem et al., 2017). Especially within the Intertropical Convergence Zone (ITCZ), convective processes play a key role in the transport of a large suite of trace species to higher tropospheric layers. The ITCZ is a low-pressure region, which marks the meeting zone of air masses transported from both hemispheres and constitutes the ascending branch of the Hadley circulation (Waliser and Gautier, 1993). Due to the high sea surface temperatures, strong solar radiation, and increased air humidity, this band-like area near the Equator is mainly characterized by highly dynamic weather phenomena, namely, large convective cumulonimbus clouds penetrating deep into the upper troposphere (Hastenrath and Lamb, 1977; Waliser and Gautier, 1993). Thus, convective processes are expected to contribute to increased levels of hydrogen peroxide in the upper troposphere and promote elevated HOx levels via subsequent photochemical processes involving H2O2 degradation as well as HCHO production due to efficient HOx recycling via the reaction with NO produced by lightning during the convective episodes (Jaeglé et al., 1997, 2000; Nussbaumer et al., 2021; Tadic et al., 2021).
Numerous airborne measurements of hydrogen peroxide were performed over the past decades over the Atlantic Ocean and in proximity to the ITCZ. The majority of these studies focused on the troposphere in the Northern Hemisphere, providing an overview on the vertical and latitudinal distribution of hydrogen peroxide.
In September and October 1992, as part of NASA's Global Tropospheric Experiment (GTE) program, the Transport and Atmospheric Chemistry Near the Equatorial Atlantic (TRACE A) mission took place over the Atlantic Ocean. The mean observed mixing ratio of hydrogen peroxide was approximately 0.2 ppbv in the upper troposphere (8–12 km) (Prather and Jacob, 1997; O'Sullivan et al., 1999). During the Subsonic Assessment Ozone and Nitrogen Oxide Experiment (SONEX) campaign, which took place in autumn 1997 over the North Atlantic, mean values of 0.12 ppbv (median: 0.08 ppbv) specifically in the upper troposphere were observed (Snow et al., 2007). Allen et al. (2013) presented satellite-based global distribution data of H2O2 in the mid-to-upper troposphere obtained by the Atmospheric Chemistry Experiment (ACE) mission and reported mean levels of 0.10–0.28 ppbv in the upper tropical troposphere (> 8 km), symmetrically decreasing towards the poles. During the Atmospheric Tomography Mission (ATom) campaigns performed in August 2016 (ATom-1), February 2017 (ATom-2), October 2017 (ATom-3), and May 2018 (ATom-4), mean values ranging between 0.09 up to 0.14 ppbv were measured over the mid-Atlantic Ocean (20∘ S–20∘ N; Allen et al., 2022; Anonymous referee, 2022). Please note that the average values within the upper troposphere cited here are based on exclusively sampling the ATom data over the tropical Atlantic above 8 km of altitude and do not necessarily match the general results over the entire sampled tropospheric column, as presented in the cited work. Further, Hottmann et al. (2020) deduced mean (±1σ) and median hydrogen peroxide mixing ratios of 0.17 (±0.09) and 0.15 ppbv, respectively, during the Oxidation Mechanism Observation (OMO) mission in summer 2015, which took place over the Arabian Peninsula, the eastern Mediterranean, and northern Indian Ocean, covering the marine ITCZ region east of the African continent.
Numerous measurements have been performed in the marine tropical troposphere. In this study, we address the budget of hydrogen peroxide specifically in the upper tropical troposphere within the equatorial Atlantic region with a main focus on the ITCZ. Our objective was to study the distribution of trace gases and radicals over the central Atlantic and the possible impact of convection in the ITCZ on the abundance of H2O2 in the upper troposphere.
The distribution of hydrogen peroxide (H2O2) was measured in the free troposphere over the Atlantic Ocean during the Chemistry of the Atmosphere: Field Experiment in Africa (CAFE-Africa) campaign. The major objective of the mission was to investigate the large-scale distribution of trace gases, radicals, and aerosols in the tropical eastern Atlantic and along the western coast of Africa. In particular, the influence of biomass burning emissions and long-distance pollution transport on the atmosphere's oxidation capacity and the chemical processing of trace gases and aerosols in clean and polluted air masses were studied.
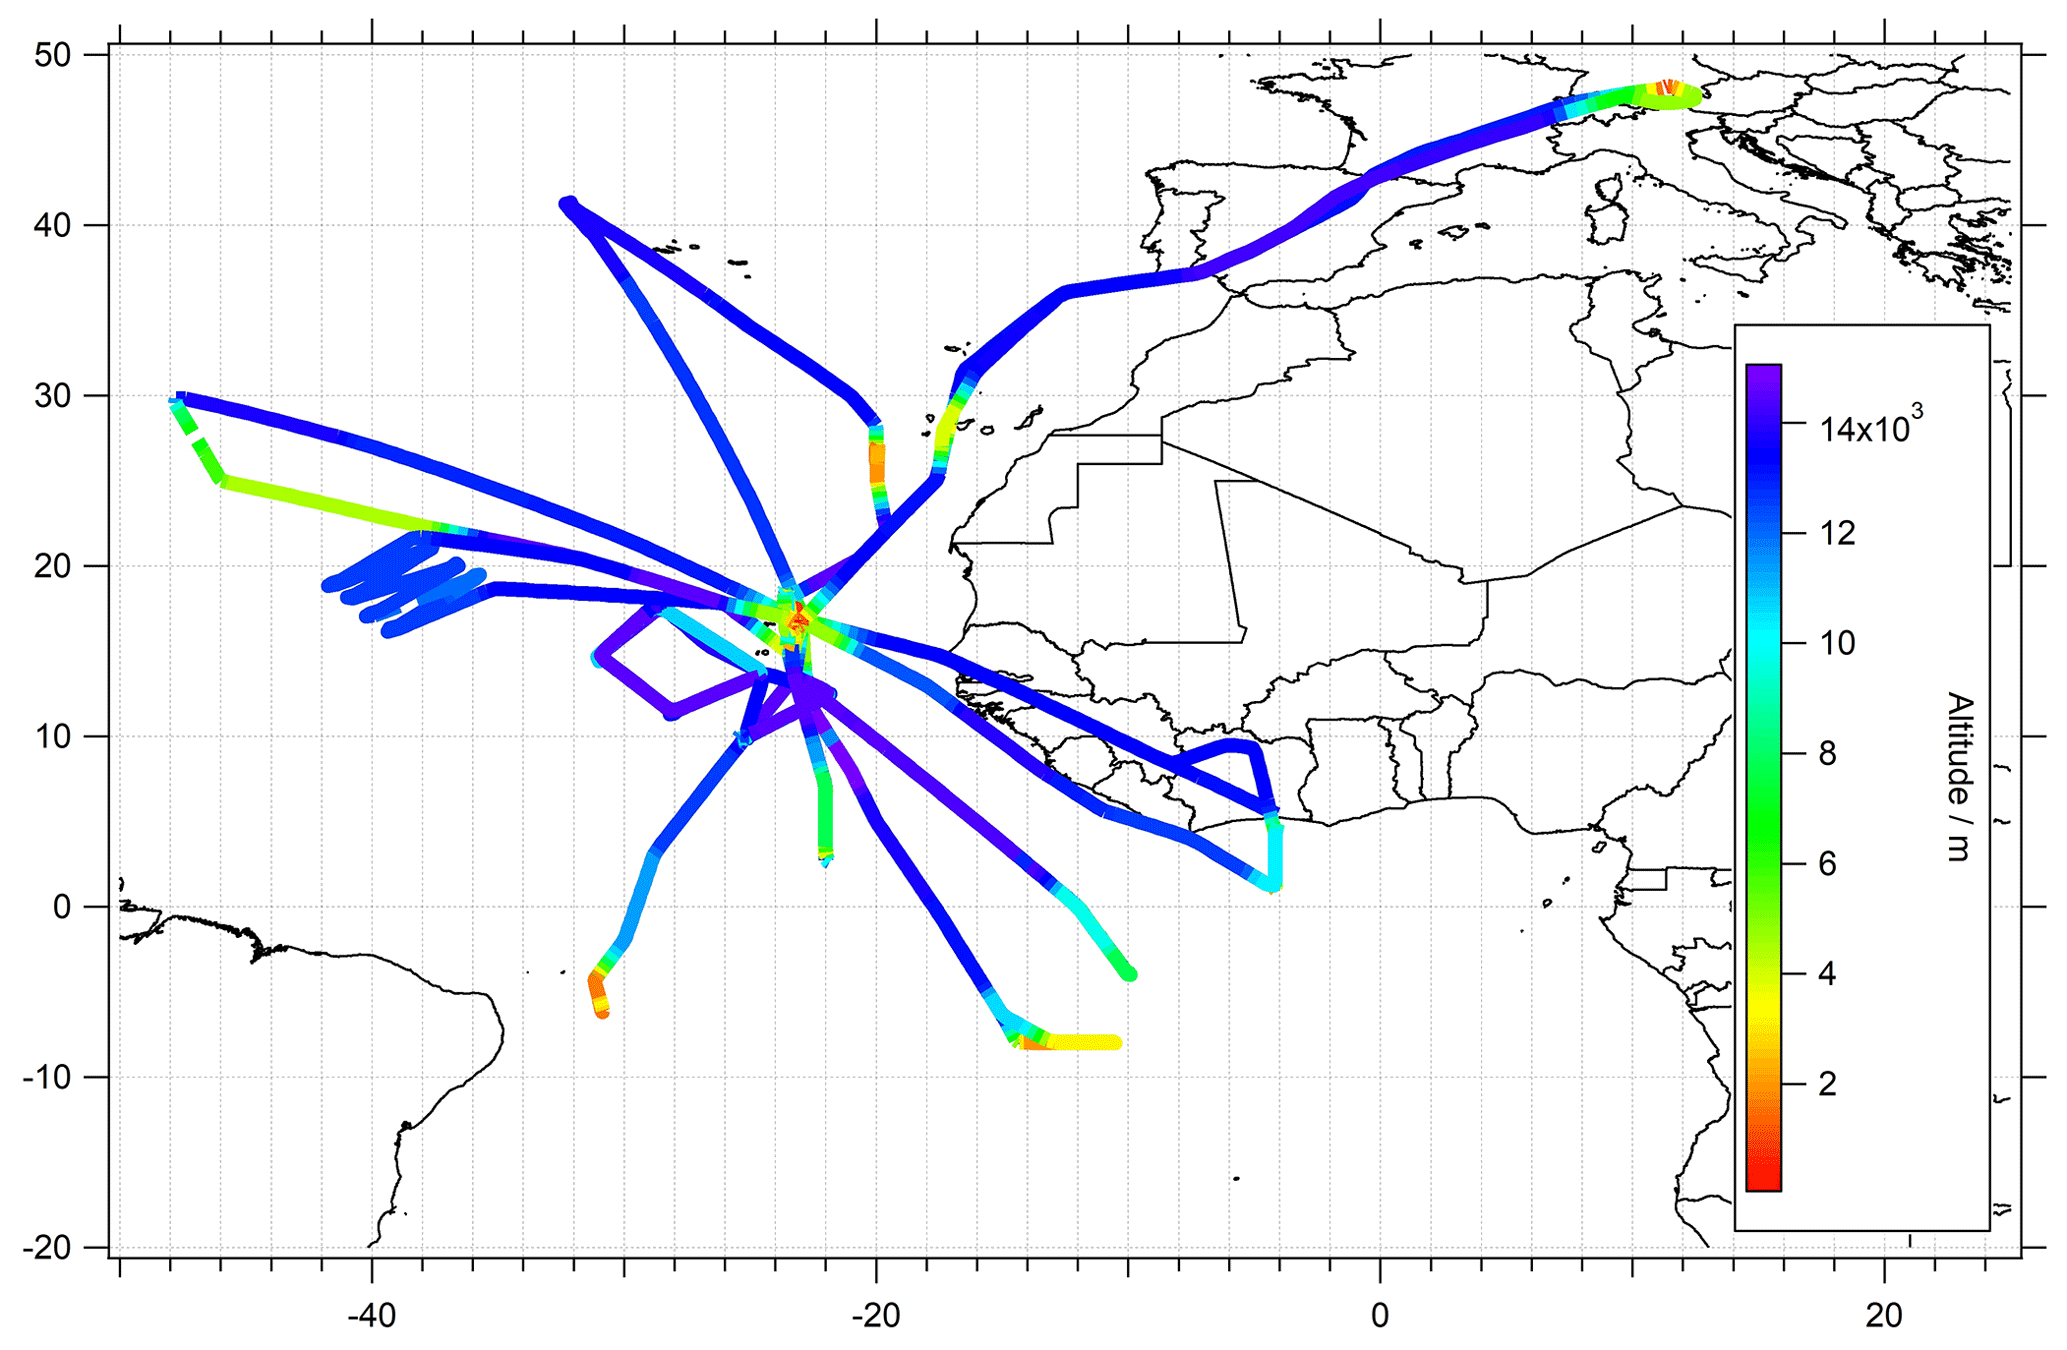
Figure 1Flight tracks and the sampled region during the CAFE-Africa campaign color-coded by the GPS flight altitude. The majority of flights were performed from the base of operations in Sal, Cabo Verde.
The campaign took place in August and September 2018 during the West African monsoon. During this period, 14 measurement flights were made over the Atlantic Ocean and the African coast with the High Altitude and LOng-range research aircraft (HALO), operating from the international airport on Sal, Cabo Verde (16.75∘ N, 22.95∘ W). The flights focused on the upper troposphere up to an altitude of 15 km with a few vertical profiles mostly in the Northern Hemisphere. The investigated area covered a latitudinal and longitudinal range of approximately 10∘ S–50∘ N and 50∘ W–15∘ E, respectively. The majority of vertical sampling was performed in close proximity to the base of operation and covered the altitudinal range between a few tens of meters above the surface, and the maximal flown altitude (15 km). In sum, 30 takeoff and landings with ascending and descending rates of 900–1100 and 450–650 m min−1, respectively were performed, giving an average descend/ascent rate of 775 m min−1 (with 1 point per 1550 m in vertical sampling at an instrument temporal resolution of 2 min). An overview of the corresponding flight dates and the objectives of the individual flights was presented by Tadic et al. (2021). The flight tracks color-coded by GPS flight altitudes are presented in Fig. 1.
Related to the location of the base of operations on Cabo Verde, the majority of the flights was performed in close proximity to the ITCZ, which allowed for the study of tropical trace gases and aerosol distributions in both hemispheres. During the campaign, the ITCZ roughly covered positions between approximately 5 and 15∘ N (Tadic et al., 2021). Information on the meteorological conditions with special emphasis on the total cloud coverage and convective precipitation located mostly within the ITCZ (5–20∘ N) is presented in the Supplement of this work (Figs. S1–S3).
3.1 Hydrogen peroxide measurements
Hydroperoxides were measured as the sum of organic hydroperoxides and hydrogen peroxide and were determined using a wet chemical system named the HYdrogen Peroxide and Higher Organic Peroxides monitor (HYPHOP; Klippel et al., 2011; Bozem et al., 2017; Hottmann et al., 2020; Hamryszczak et al., 2022) based on a previous design by Lazrus et al. (1985, 1986). The ambient air was sampled from the top of the aircraft fuselage via a trace gas inlet (TGI) with a in. perfluoroalkoxy (PFA) liner that left the cabin again through a second exhaust line. From this bypass, a in. PFA sampling line was connected to a Teflon-coated membrane pump (type MD 1C; Vacuubrand, Wertheim, Germany) and a pressure control unit, regulating the pump speed to a line pressure of 1000 hPa (constant pressure inlet, CPI). The CPI provides a constant inlet pressure covering external pressure variations between 1000 and 150 hPa. Following the CPI inlet, the ambient air passed through a stripping coil with a buffered sampling solution (potassium hydrogen phthalate / NaOH; pH 6; stripping efficiency of 1 for hydrogen peroxide and between 0.6 and 1 for organic peroxides; Lee et al., 2000). The hydroperoxide solution was sampled in two individual channels in response to addition of p-hydroxyphenyl acetic acid (POPHA) and horseradish peroxidase (HRP). The formed chemiluminescent 6,6′- dihydroxy-3,3′-biphenyldiacetic acid was detected via fluorescence spectroscopy using a Cd pen-ray lamp at 326 nm. The hydroperoxide-specific fluorescence (Guilbault et al., 1968) was detected at 400–420 nm using photomultiplier tubes for each channel separately.
Hydrogen peroxide mixing ratios are then calculated from the difference between the entirety of the measured peroxides (channel A) and the sum of organic ROOH hydroperoxides (channel B), where H2O2 is selectively destroyed by the addition of catalase. Further information on the mixing ratios of individual organic peroxides cannot be provided by the monitor, due to the characteristics of the measurement technique. Please note that, especially within the boundary layer and due to biomass burning, a variety of organic peroxides might contribute to the total measured signal of organic peroxide (Fels and Junkermann, 1994; Slemr and Tremmel, 1994; Valverde-Canossa et al., 2005; Hua et al., 2008; Dienhart et al., 2023).
Prior to ambient measurements, both channels are simultaneously calibrated using a liquid standard (0.98 µmol L−1) produced from serial dilution of a H2O2 stock solution. The H2O2 destruction efficiency in channel B corresponding to the added catalase was determined to be 0.95–0.98 based on liquid calibrations. In-flight background measurements were performed using purified zero air, generated by a cartridge with silica gel (type IAC-502; Infiltec, Speyer, Germany) and Hopcalite (type IAC-330; Infiltec, Speyer, Germany). Using a gas-phase calibration source (low-density polyethylene (LDPE) permeation devices), the H2O2 transmission efficiency through the inlet (±1σ) was determined regularly by measuring the difference between the addition of the standard before and after the CPI and was found to be 0.61 ± 0.06. Due to a positive ozone interference, the H2O2 data were further corrected by subtraction of 0.056 ppbv H2O2 100 ppbv O3 based on a scatter plot of hydrogen peroxide vs. ozone mixing ratios in the lower stratosphere, assuming that ambient H2O2 above the tropopause is essentially zero. The total measurement uncertainty (TMU) of the monitor was estimated as
by considering the instrument's precision (P), uncertainty of the standard (US), uncertainty of the H2O2 transmission efficiency (UTE), and the uncertainty of the ozone interference (UOI). The determined precision with 1σ confidence interval was determined from the reproducibility of the liquid calibrations performed during the campaign to be 1.3 % at 5.46 ppbv for hydrogen peroxide and 0.8 % at 5.64 ppbv for the organic hydroperoxides. The uncertainty of the standard was included in the instrument precision calculation. The uncertainty of the transmission efficiency was calculated to be 6 %. The total measurement uncertainty was determined to be 9 % for hydrogen peroxide and 41 % for the sum of organic hydroperoxides. The total measurement uncertainty of organic hydroperoxides is increased by 40 % due to the varying solubility of individual organic hydroperoxides in aqueous solution, which ranges between 60 % (e.g., methyl hydroperoxide) and 100 % (e.g., peroxyacetic acid). The instrumental time resolution was determined to be 122 s based on the calibration signal rise and fall time from 10 % to 90 % and 90 % to 10 %, respectively. The detection limit with a 2σ confidence was derived from the reproducibility of the in-flight background measurements as 15 pptv for hydrogen peroxide and 6 pptv for the sum of organic hydroperoxides, respectively. For the purposes of this study, hydrogen peroxide data were filtered for stratospheric influences by removing all data points with ozone mixing ratios higher than 100 ppbv.
3.2 Measurement of other relevant species
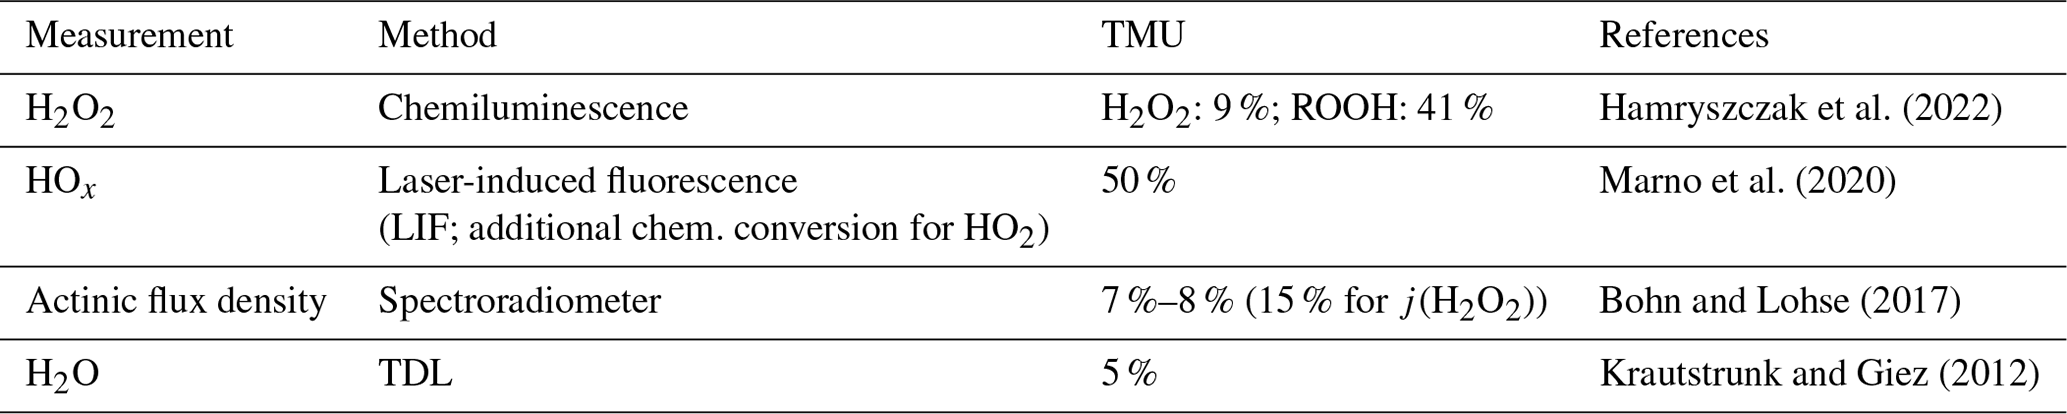
GPS altitude and coordinates, temperature, pressure, and wind speed were obtained using the BAsic HALO Measurement And Sensor System, BAHAMAS. Water vapor mixing ratios and the corresponding air humidity were measured with the Sophisticated Hygrometer for Atmospheric ResearCh (SHARC) based on a tunable diode laser (TDL) setup (Krautstrunk and Giez, 2012). HOx radicals were measured by laser-induced fluorescence with the HydrOxyl Radical measurement Unit based on fluorescence Spectroscopy (HORUS; Marno et al., 2020). Spectrally resolved upward and downward actinic flux density was obtained with two spectroradiometers (Bohn and Lohse, 2017). A brief overview of the campaign instrumentation, measurement methods, their TMU values, and the corresponding technical references are listed in Table 1.
Table 1Overview of observed species with corresponding measurement method, total measurement uncertainty (TMU), and references regarding the instrumentation.
3.3 ECHAM/MESSy Atmospheric Chemistry (EMAC)
For the purposes of this study, the in situ observations are compared to numerical simulations from the global chemistry and climate 3-D model EMAC (ECHAM/MESSy Atmospheric Chemistry; Jöckel et al., 2010). The model numerically simulates the chemistry and dynamics of the troposphere and stratosphere using a large variety of submodels describing chemical and meteorological processes and the influences arising from anthropogenic and natural emissions from continental and marine environments (Jöckel et al., 2006). The basis of the atmospheric model is the fifth generation of the European Centre HAMburg general circulation model (ECHAM5; Roeckner et al., 2003, 2006). The communication between the various submodels is achieved by the Modular Earth Submodel System (MESSy; Jöckel et al., 2005, 2010, 2016). Atmospheric chemistry is simulated by the Module for Efficiently Calculating the Chemistry of the Atmosphere (MECCA) submodel (Sander et al., 2005, 2011, 2019), using the Mainz Organic Mechanism (MOM) and photolysis rate calculations from a radiation transfer model (Sander et al., 2014, 2019). Primary emissions and dry deposition as well as aqueous-phase chemistry in clouds and cloud scavenging are simulated by the ONLEM, OFFLEM, TNUDGE, and DRYDEP submodels (Kerkweg et al., 2006a, b), as well as the scavenging of tracers submodel (SCAV; Tost et al., 2006). Anthropogenic emissions are based on the EDGARv4.3.2 inventory (European Joint Center, JRC; Crippa et al., 2018) and are distributed vertically according to Pozzer et al. (2009). Biomass burning emissions were simulated based on the Global Fire Assimilation System (GFAS; Kaiser et al., 2012). The model has a vertical resolution of 47 vertical levels up to 0.01 hPa, a horizontal resolution of T63 (i.e., approximately 1.8∘ × 1.8∘), and a time resolution of 6 min. The model was further weakly nudged towards the ECMWF ERA-Interim data (Tadic et al., 2021). This model setup has been extensively evaluated for different trace gases and aerosols (Pozzer et al., 2022). For comparison to observations, the simulation results were interpolated on the GPS flight tracks using the S4D submodel (Jöckel et al., 2010).
3.4 Simulations based on photostationary steady-state conditions
The hydrogen peroxide mixing ratios in the upper troposphere under the assumption of photostationary steady-state conditions were calculated based on measured precursors and photochemical loss processes of hydrogen peroxide (HO2, OH, j(H2O2)) and the rate coefficient data from Atkinson et al. (2004).
In the upper troposphere, the production rate P(H2O2) of hydrogen peroxide due to the self-reaction of HO2 can be calculated from Eq. (2). The photochemical loss rate of hydrogen peroxide, L(H2O2), can be derived from H2O2 photolysis and the reaction with OH as shown in Eq. (3). The equations are derived from the reaction pathways presented in Sect. 1 (Reactions R4–R6).
The calculations of the rate coefficients were based on the measured parameters along the flight tracks according to Atkinson et al., 2004 (Eqs. 4–5). Due to the water dependence of the hydrogen peroxide production rate coefficient, both expressions in Eq. (4) were further extended by the factor 1 + 1.4 × 10⁻²¹ cm3 [H2O] .
Neglecting deposition and transport processes impacting the hydrogen peroxide budget, the mixing ratio of H2O2 was calculated via Eq. (6).
3.5 Data processing details
For the purpose of the present study, we used measured H2O2, OH, HO2, water vapor, j(H2O2), temperature, and pressure and compared these with the concurrent spatially interpolated EMAC simulations. To synchronize the time resolution of the simulated data with the measurement output, we calculated a mean of the measurement data with a matching temporal resolution of 6 min (equivalent to model output).
Vertical profiles of all species under investigation were calculated as 1000 m bins (means and medians) over the entire sampled atmospheric column. Profile information is restricted to 30 takeoffs and landings at Sal, while other areas are not considered due to a lack of statistically significant data.
The spatially resolved data based on measurements, photostationary steady-state (PSS) model calculations, and EMAC simulations were binned into 1∘ × 1∘ subsets over the full extension of the flight tracks in the upper troposphere (≥ 8 km).
The latitudinal distribution of the species was examined using 2.5∘ bins over the upper tropospheric region. Please note that due to a reduced amount of data in the lower troposphere, the analysis of spatial and latitudinal distributions was restricted to measurements performed in the upper troposphere.
4.1 Observations of hydrogen peroxide during CAFE-Africa and previous airborne measurements
The observed mixing ratios of hydrogen peroxide during the CAFE-Africa campaign are presented as a latitude vs. longitude plot with mean mixing ratio values binned into a subset of 1∘ × 1∘ bins for the entirety of the upper troposphere (≥ 8 km) along the flight tracks (Fig. 2). The color scale represents the measured mixing ratio of H2O2.
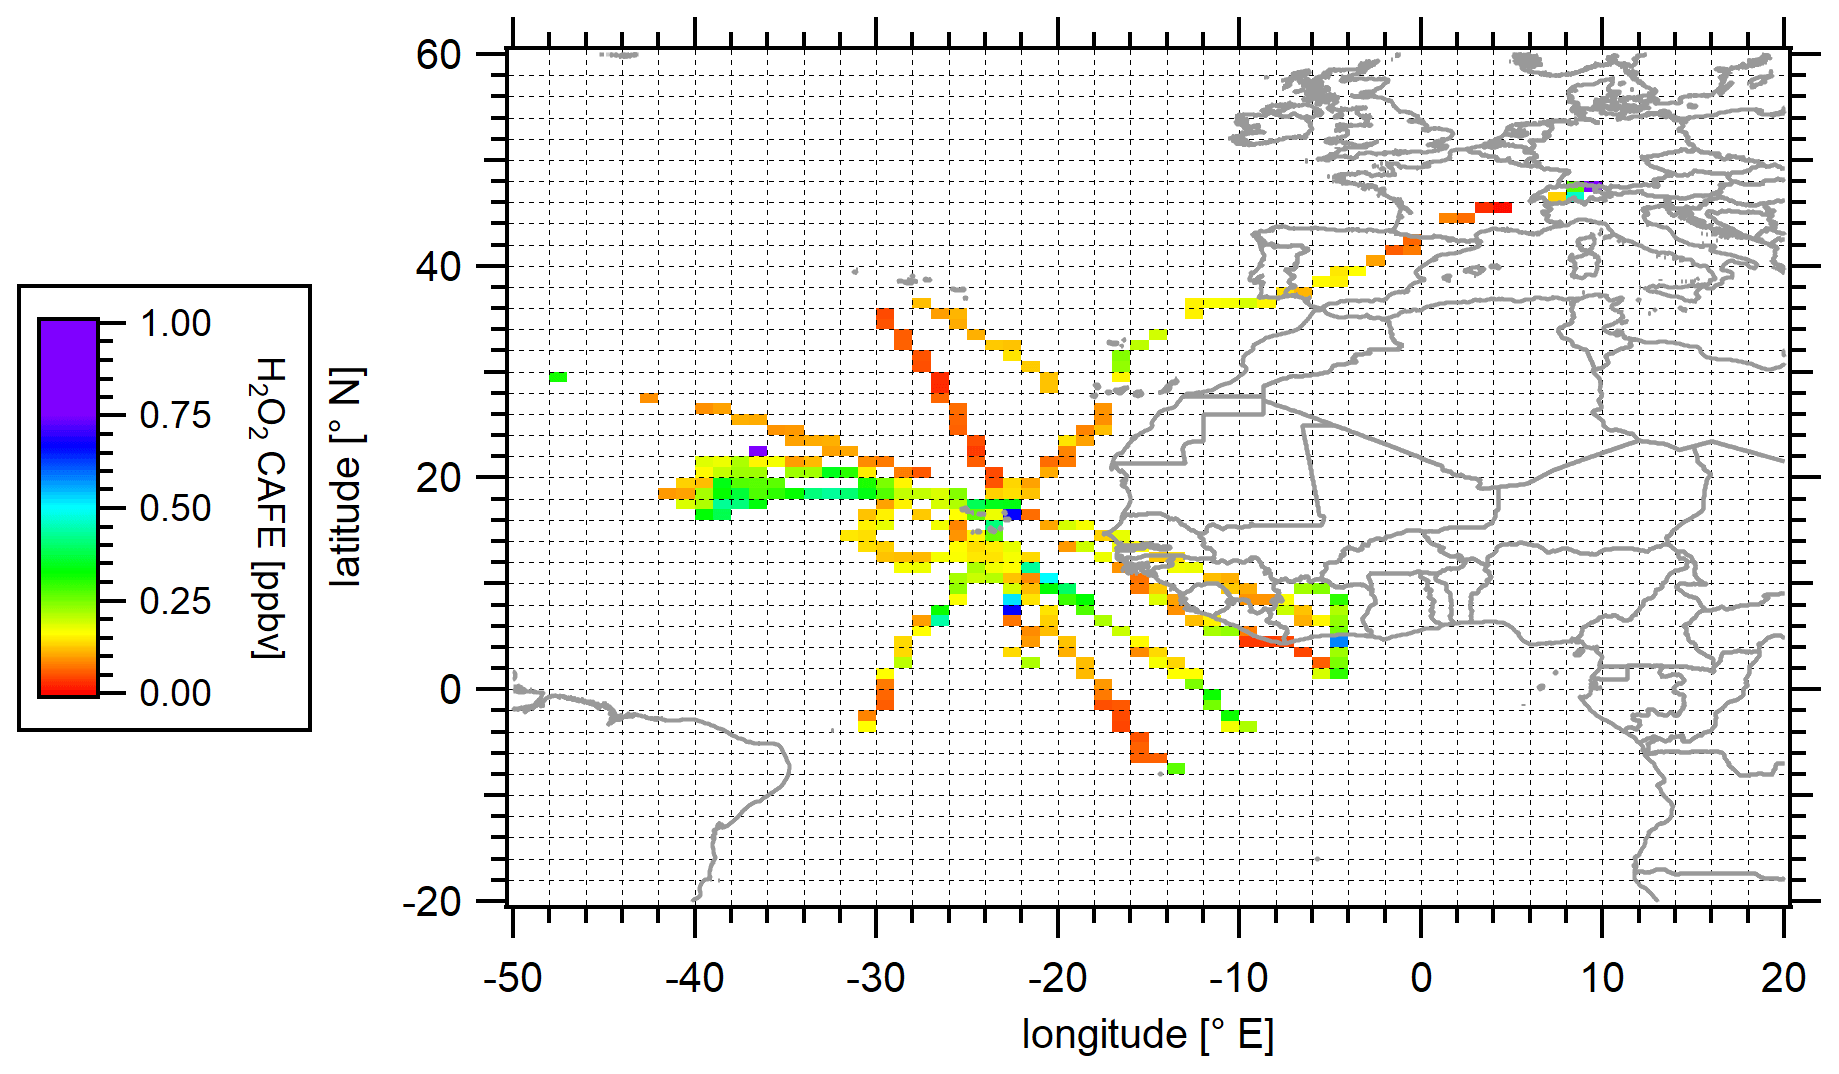
Figure 2Spatial distribution of measured hydrogen peroxide in the upper troposphere (≥ 8 km) during the CAFE-Africa campaign. Data were binned into 1∘ × 1∘ bins over the full extension of the flight tracks.
Table 2Comparison of hydrogen peroxide mean and median mixing ratios (ppbv) in the upper troposphere during CAFE-Africa with measurements from previous campaigns (TRACE A, SONEX, OMO, ATom-1, and ATom-3; O'Sullivan et al., 1999; Snow et al., 2007; Hottmann et al., 2020; Allen et al., 2022).
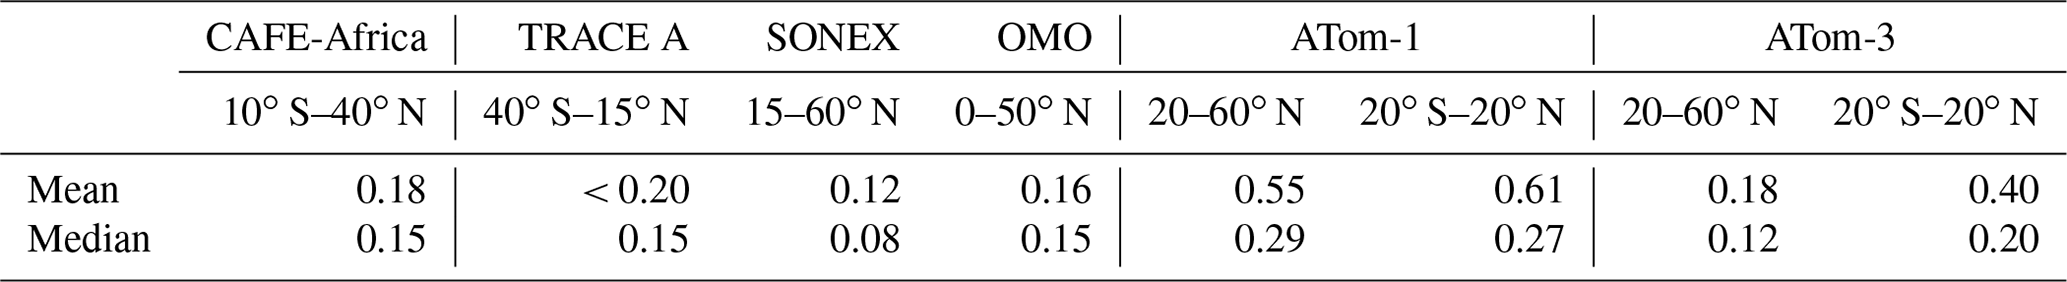
The mean (±1σ) and median mixing ratios based on all measured H2O2 mixing ratios during the campaign were 0.18 (±0.13) and 0.15 ppbv, respectively, with maximum hydrogen peroxide mixing ratios reaching 1.03 ppbv. Slightly higher H2O2 levels were observed in the ITCZ (approx. 5–20∘ N), where locally mixing ratios up to 0.67 ppbv over a 1∘ × 1∘ bin of merged data were observed. These maxima are most likely due to atmospheric transport of H2O2 into the upper troposphere. This is in accordance with previous reports about increased hydrogen peroxide mixing ratios due to biomass burning and convective activity, elevating the H2O2 mixing ratios in the upper troposphere (Lee et al., 1998; O'Sullivan et al., 1999; Allen et al., 2022). Locally enhanced H2O2 was further observed during the measurement flight in close proximity to the tropical storm Florence on 2 September 2018 (approx. 18∘ N, 38.5∘ W). Here, the mean mixing ratios were between 0.10 and 0.43 ppbv with a maximum of up to 0.94 ppbv. Based on the high convective activity during the tropical storm, as reported by Nussbaumer et al. (2021), the H2O2 mixing ratios were expected to rise due to the rapid transport of air masses from the marine boundary layer (MBL) into the UT. Table 2 gives an overview of the estimated mean and median hydrogen peroxide mixing ratios measured during CAFE-Africa in relation to previous airborne measurements performed at a comparable latitudinal range.
The mean and median values during CAFE-Africa are comparable to previously reported mixing ratios during TRACE A and OMO campaigns, which covered a comparable latitude and altitude range (Table 2). Enhanced mixing ratios for CAFE-Africa relative to observations during the SONEX campaign are most likely due to differences in the examined regional range, since the latter campaign focused on the north Atlantic. Mean and median values in the Northern Hemisphere (20–40∘ N; Table S1) during CAFE-Africa (0.14 ± 0.11 and 0.12 ppbv, respectively) are comparable to observations during SONEX. During the ATom campaigns, slightly higher mean values were observed, although median values are comparable. This could be due to differences in the sampled altitudes, since ATom measurements were generally restricted to altitudes below 12 km.
Based on the comparison with previous studies, the observed mixing ratios of hydrogen peroxide during CAFE-Africa fit well into the general range of recent studies over the equatorial and subtropical Atlantic. The observed H2O2 distribution confirms further that mixing ratios of hydrogen peroxide in the upper troposphere seem to be far less dependent on latitude than those at lower altitudes. The latitudinal distribution of H2O2 during CAFE-Africa displays a rather small symmetrical latitudinal decrease between the inner tropics and the subtropics.
4.2 Comparison of measured hydrogen peroxide with photostationary steady-state and EMAC calculations
In order to investigate the impact of deep convection in the ITCZ on the H2O2 budget in the upper troposphere, a comparison of the in situ data with the output of photostationary steady-state (achieved) calculations and EMAC simulations was performed. The complementary spatial distributions of the hydrogen peroxide levels were expressed as latitude versus longitude plots of mean mixing ratios aggregated over a spatial grid of 1∘ × 1∘ in the upper troposphere (≥ 8 km) (Fig. S4 in the Supplement).
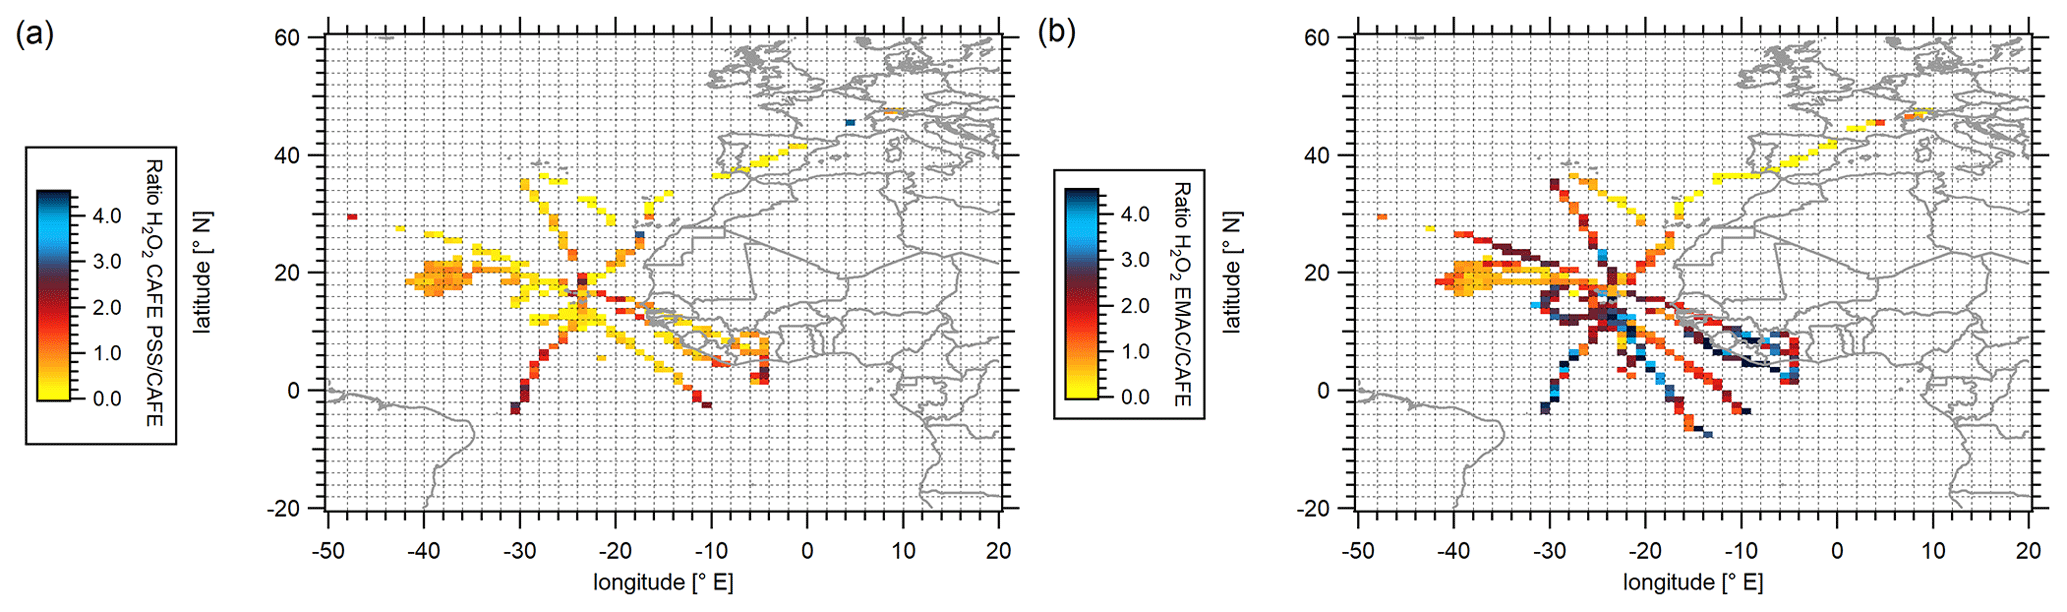
Figure 3Spatial distribution of H2O2 (PSS) H2O2 (measurements) ratios (a) and H2O2 (EMAC) H2O2 (measurements) ratios (b) in the upper troposphere (≥ 8 km) during the CAFE-Africa campaign. Data were binned into 1∘ × 1∘ bins over the full extension of the flight tracks.
The calculated PSS-H2O2 levels range between approximately 0.01 and 0.88 ppbv with mean (±1σ) and median mixing ratios of 0.14 (±0.16) and 0.07 ppbv, respectively, which is a factor of 1.3 lower than the observations. PSS-based H2O2 mixing ratios tend to be higher at the southernmost coastal area (2.5∘ S, 10.5∘ W), where the levels range between 0.40 and 0.88 ppbv, and in proximity to the tropical storm Florence at up to 0.40 ppbv (approx. 18∘ N, 38.5∘ W). Hydrogen peroxide mixing ratios simulated by EMAC vary between 0.10 and 0.75 ppbv. The mean (±1σ) and median simulated mixing ratios are 0.30 (±0.19) and 0.29 ppbv, respectively, with maximum mixing ratios up to 1.04 ppbv (3.5∘ S, 9.5∘ W; Fig. S4b), which is slightly higher than the observations. The spatial distributions of the point-by-point ratio between PSS calculations and EMAC simulations versus the observations in the upper troposphere above 8 km are presented in Fig. 3, which gives an overview of the local differences relative to the observations varying from low ratios (yellow) to high (deep blue) values. Please note that for resolution purposes the color scaling is restricted to ratios up to 4.5.
Generally, the H2O2 (EMAC) H2O2 (measurement) ratios indicate better agreement between the simulations and the measurements in the Northern Hemisphere (≥ 20∘ N; Fig. 3b). With decreasing latitude, the model tends to significantly overestimate hydrogen peroxide; H2O2 (EMAC) H2O2 (measurement) ratios are increasing from approximately 2 to 4 with decreasing latitude. Locally, most likely due to underestimated cloud scavenging as will be further discussed in this work, EMAC simulates highly elevated hydrogen peroxide with a factor of up to 14 higher than the measurements (4.5∘ N, 9.5∘ W).
Good agreement between the observation-based PSS calculations and the measurements was found in proximity to the tropical storm Florence. Here, the H2O2 (PSS) H2O2 (measurement) ratios agree between 0.83 and 1.04. Beyond the measurements taken here, the agreement with respect to the measured hydrogen peroxide levels is generally less satisfactory. Towards the southern subtropics as well as locally in the coastal area and at the base of operations in Sal (Cabo Verde), the ratios increase to 2.8, indicating an overestimation of the hydroperoxide levels relative to the observations, similar to the EMAC simulations. On the other hand, the PSS calculations tend to strongly underestimate hydrogen peroxide concentrations in the ITCZ (5–20∘ N) and in the northern part of the investigated region (≥ 20∘ N) by factors of up to 10 and 12, respectively. This indicates that, since the local photostationary steady-state conditions based on observed radical levels do not account for additional sources and sinks of the H2O2, the observed discrepancy between the observations and local PSS are most likely related to transport and cloud scavenging. The calculated difference between production (Eq. 2) and loss (Eq. 3) of hydrogen peroxide, (P–L)H2O2 based on the observations is expressed as a latitude vs. longitude plot with mean mixing ratios binned into a subset of 1∘ × 1∘ bins for the entirety of the upper troposphere (≥ 8 km) along the flight tracks (Fig. 4).
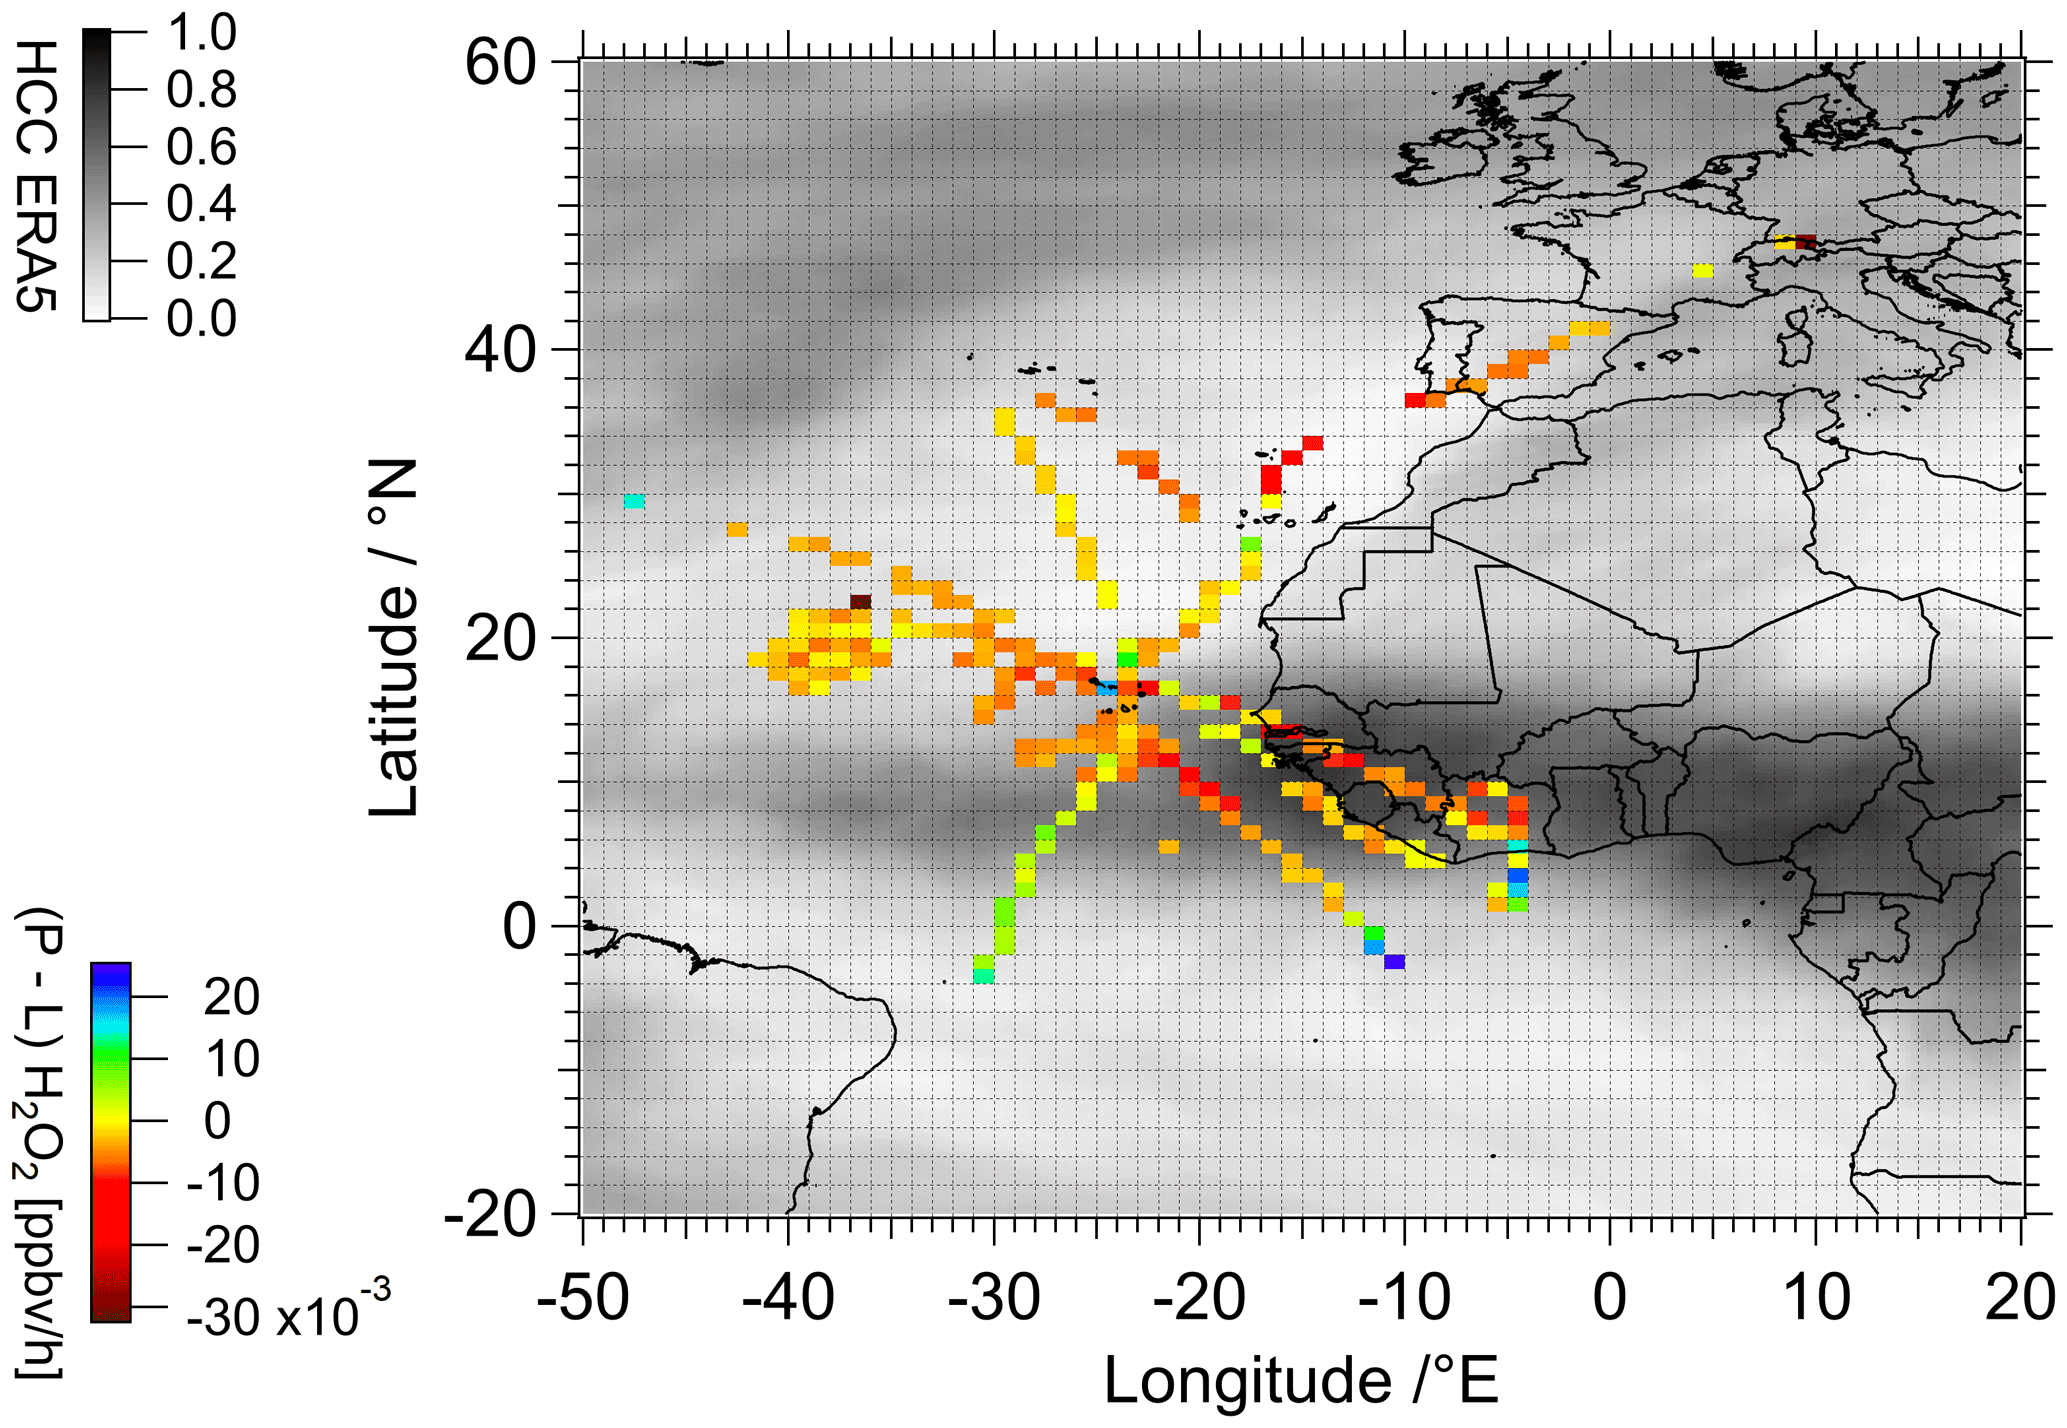
Figure 4Color-coded spatial resolution of calculated deviation from PSS based on the difference between the observed hydrogen peroxide photochemical production and loss. The calculated data were binned into 1∘ × 1∘ bins over the full extension of the flight tracks. Shaded background is the average high cloud coverage (HCC) (≥ 6 km) during the measurement period based on ERA5 reanalysis results (Hersbach et al., 2019).
Generally, the majority of the sampled region is dominated by loss, especially in the ITCZ (approx. 5–20∘ N) and towards the north, where an H2O2 deficit of up to approximately −0.01 ppbv h−1 was determined. H2O2 production-dominated regions of up to 0.03 ppbv h−1 are observed towards the south and in the coastal area. The difference between the photochemical production and loss paths is directly linked to the deviations from the photostationary steady state and thus to the additional sources and sinks of hydrogen peroxide on a local scale. These are associated with the local meteorological conditions and transport processes. Based on ERA5 reanalysis results, especially towards the south and in the coastal area, an enhanced presence of clouds at altitudes above 6 km (gray shading in Fig. 4) and convective precipitation were observed during the measurement period (Hersbach et al., 2019). At a mean (±1σ) horizontal wind speed of 14.3 (±7.3) m s−1 measured along the flight tracks and a species lifetime of 3–4 d, transport towards the subtropics impacts H2O2 levels and further justifies the difference between the local PSS calculations and the observations.
Based on the coincidence with the latitudinal range of the ITCZ, the enhanced loss in the H2O2 budget relative to the PSS in the upper troposphere is most likely due to convective injection of H2O2 from lower layers into the upper troposphere and the subsequent redistribution of the species towards the north and south. Below, we show that, based on the comparison with EMAC simulation output, convective transport is important for the budget of hydrogen peroxide in the upper troposphere not only in the ITCZ but also in the subtropics.
As discussed above, the comparison between observations and both PSS calculations and EMAC simulations indicate large deviations at the most southern latitudes that were visited by HALO. This is clearly demonstrated in Fig. 5, which shows observations, PSS calculations, and EMAC simulations of H2O2 as functions of latitude in the upper troposphere (above 8 km). The mean values of each dataset with 6 min time resolution are binned into subsets of 2.5∘ of latitude for the investigated region from 6∘ S to 40∘ N. The lines and the complementary shading represent mean values and the supplementary standard deviations. The area of the ITCZ between 5 and 20∘ N is highlighted by gray shading.
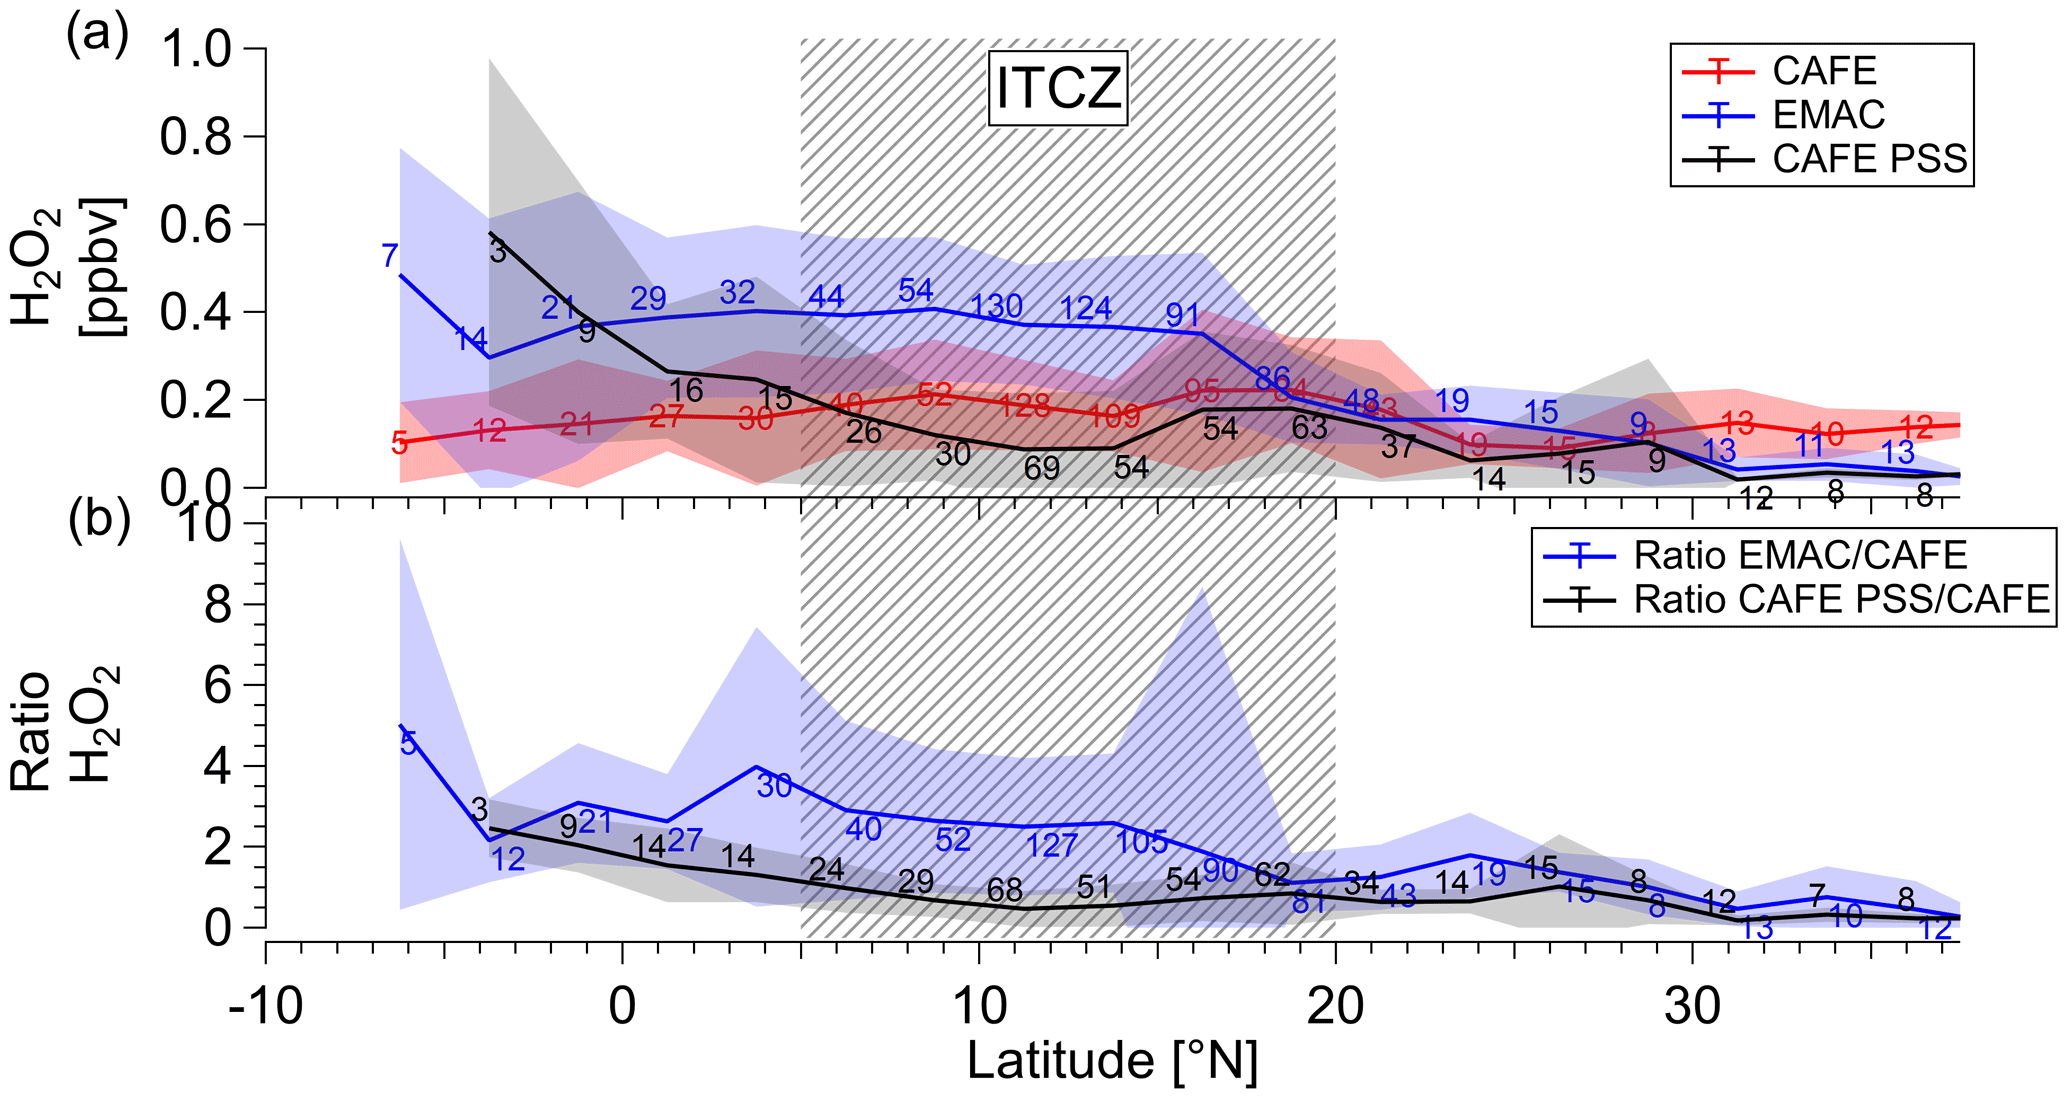
Figure 5Latitudinal dependence of hydrogen peroxide mixing ratios (mean ±1σ) compared to EMAC simulations and calculations based on PSS (red: CAFE-Africa; black: PSS CAFE-Africa; blue: EMAC; a) and calculated ratios between the simulations and the observations and PSS-modeled calculations, and the observations, respectively (b). The data with 6 min time resolution and mean values were binned for 2.5∘ of latitude for altitudes ≥ 8 km. The corresponding numbers indicate the total number of data points per bin. The shaded pattern marks the ITCZ region.
Contrary to the calculations based on local photostationary steady-state conditions and the simulations by EMAC, the observations show very little latitudinal variation with mean values of approximately 0.1–0.2 ppbv. A tendency towards slightly enhanced values is observed in the ITCZ, where the mixing ratios increase up to 0.22 ppbv. However, considering the standard deviation range (up to 0.19 ppbv), the rather flat distribution in the upper troposphere indicates nearly constant hydrogen peroxide levels throughout the whole investigated tropospheric region (see also Table S1).
Both the EMAC-simulated and PSS-calculated latitudinal hydrogen peroxide distributions display decreasing trends with increasing latitudes towards the north. The highest mean values of 0.49 (±0.29) ppbv for PSS and 0.583 (±0.40) ppbv for EMAC are found in the southernmost part of the sampled region. The elevated levels of H2O2 in the EMAC simulations starts already in the ITCZ, while the PSS calculations only increase south of 5∘ N.
Overall H2O2 mixing ratios from the PSS calculations show a decreasing tendency from the Equator towards the subtropics. At approximately 5∘ N, the PSS-based mixing ratios decrease from 0.09 to 0.25 ppbv and tend to be lower than the measured levels at the northern part of the domain by a factor of up to 5. In contrast, the mixing ratios of hydrogen peroxide simulated by EMAC remain elevated from 6∘ S to 15∘ N (0.30 to 0.35 ppbv), yielding H2O2 (EMAC) H2O2 (measurements) ratios of 2.2 to 2.5. Further north of 15∘ N, the H2O2 levels in EMAC decrease by almost half to 0.15 ppbv, resulting in H2O2 (EMAC) H2O2 (measurements) ratios between 1.1 and 1.2 and a rather good agreement between simulations and observations. An overview of numerical values for measured means (±1σ) as well as medians and PSS-calculated and EMAC-simulated hydrogen peroxide levels subdivided into three hemispheric regions – the Northern Hemisphere (20–40∘ N), ITCZ (5 < 20∘ N), and Southern Hemisphere (10∘ S < 5∘ N) – is given in Table S1 in the Supplement.
Please note that the steady-state calculations only account for photochemical production and loss of hydrogen peroxide. EMAC simulations additionally account for vertical and horizontal transport processes, as well as local losses due to cloud scavenging (Hamryszczak et al., 2022). Thus, deviations between local photostationary steady-state budget calculations and EMAC simulations can indicate the impact of convective processes in the ITCZ in the upper troposphere. This requires that the EMAC model correctly simulates precursors (HO2) and sinks (OH, H2O2 photolysis) of photochemical H2O2 formation.
A comparison between observations and EMAC simulations for the basic species reveals that while HO2 is adequately reproduced by EMAC the simulations tend to underestimate OH and the photolysis frequencies in particular, south of 15∘ N (Fig. S5b). At the same time, model results partly tend to overestimate HO2, indicating issues with HO2 OH partitioning. Since the production of OH in the UT depends to an extent on the reaction of HO2 with NO, these might be associated with the underestimation of NO by EMAC in the southern part of the domain, as shown by Tadic et al. (2021). Additionally, the measured H2O2 photolysis frequencies show minor discrepancies with those from the model (Fig. S5c). Due to the overestimated HO2 mixing ratios, EMAC simulates higher levels of H2O2. At the same time, the lower OH mixing ratios and the underestimated H2O2 photolysis frequencies might cause decreased loss rates, thus leading to underestimation of the H2O2 loss pathways. Therefore, overestimation of the photochemical source and underestimation of the photochemical H2O2 sinks by EMAC explain the differences between PSS calculations and simulations at southern latitudes; however, these observations do not explain the differences relative to the observations south of the ITCZ. Also, it is highly unlikely that a measurement error is responsible for the discrepancies, as this would have to be restricted to the most southerly latitudes.
Potential causes leading to the discrepancy between the measurement and the simulations might be an underestimation of cloud scavenging and removal of hydrogen peroxide by wet deposition processes within the ITCZ and also further south. A number of flights south of 15∘ N were performed in close proximity to the western shores of Africa and also even over land (Fig. 2), close to enhanced convective precipitation (Fig. S3). Based on the ERA5 reanalysis results on cloud coverage during the measurement period (Hersbach et al., 2019; Fig. S2), we hypothesize that the air masses sampled in this area were affected by cloud processing especially in the UT, causing the model discrepancies.
Since H2O2 in the upper atmosphere is influenced by convective transport from the lower troposphere as well as by losses to clouds and rainout, it is important that EMAC simulations and PSS calculations reproduce the levels of hydrogen peroxide in the middle troposphere and the boundary layer. In Fig. 6, averages of hydrogen peroxide mixing ratios based on in situ observations, PSS calculations, and EMAC simulations and the corresponding H2O2 (EMAC) H2O2 (measurements) and H2O2 (PSS) H2O2 (measurements) ratios are shown. The data are binned into subsets of 1 km of altitude with respect to the center of the bin width based on takeoff and landings in proximity to the base of operations in Sal, Cabo Verde. The lines and the shadings represent mean values and the 1σ standard deviations. Dashed lines represent median values.
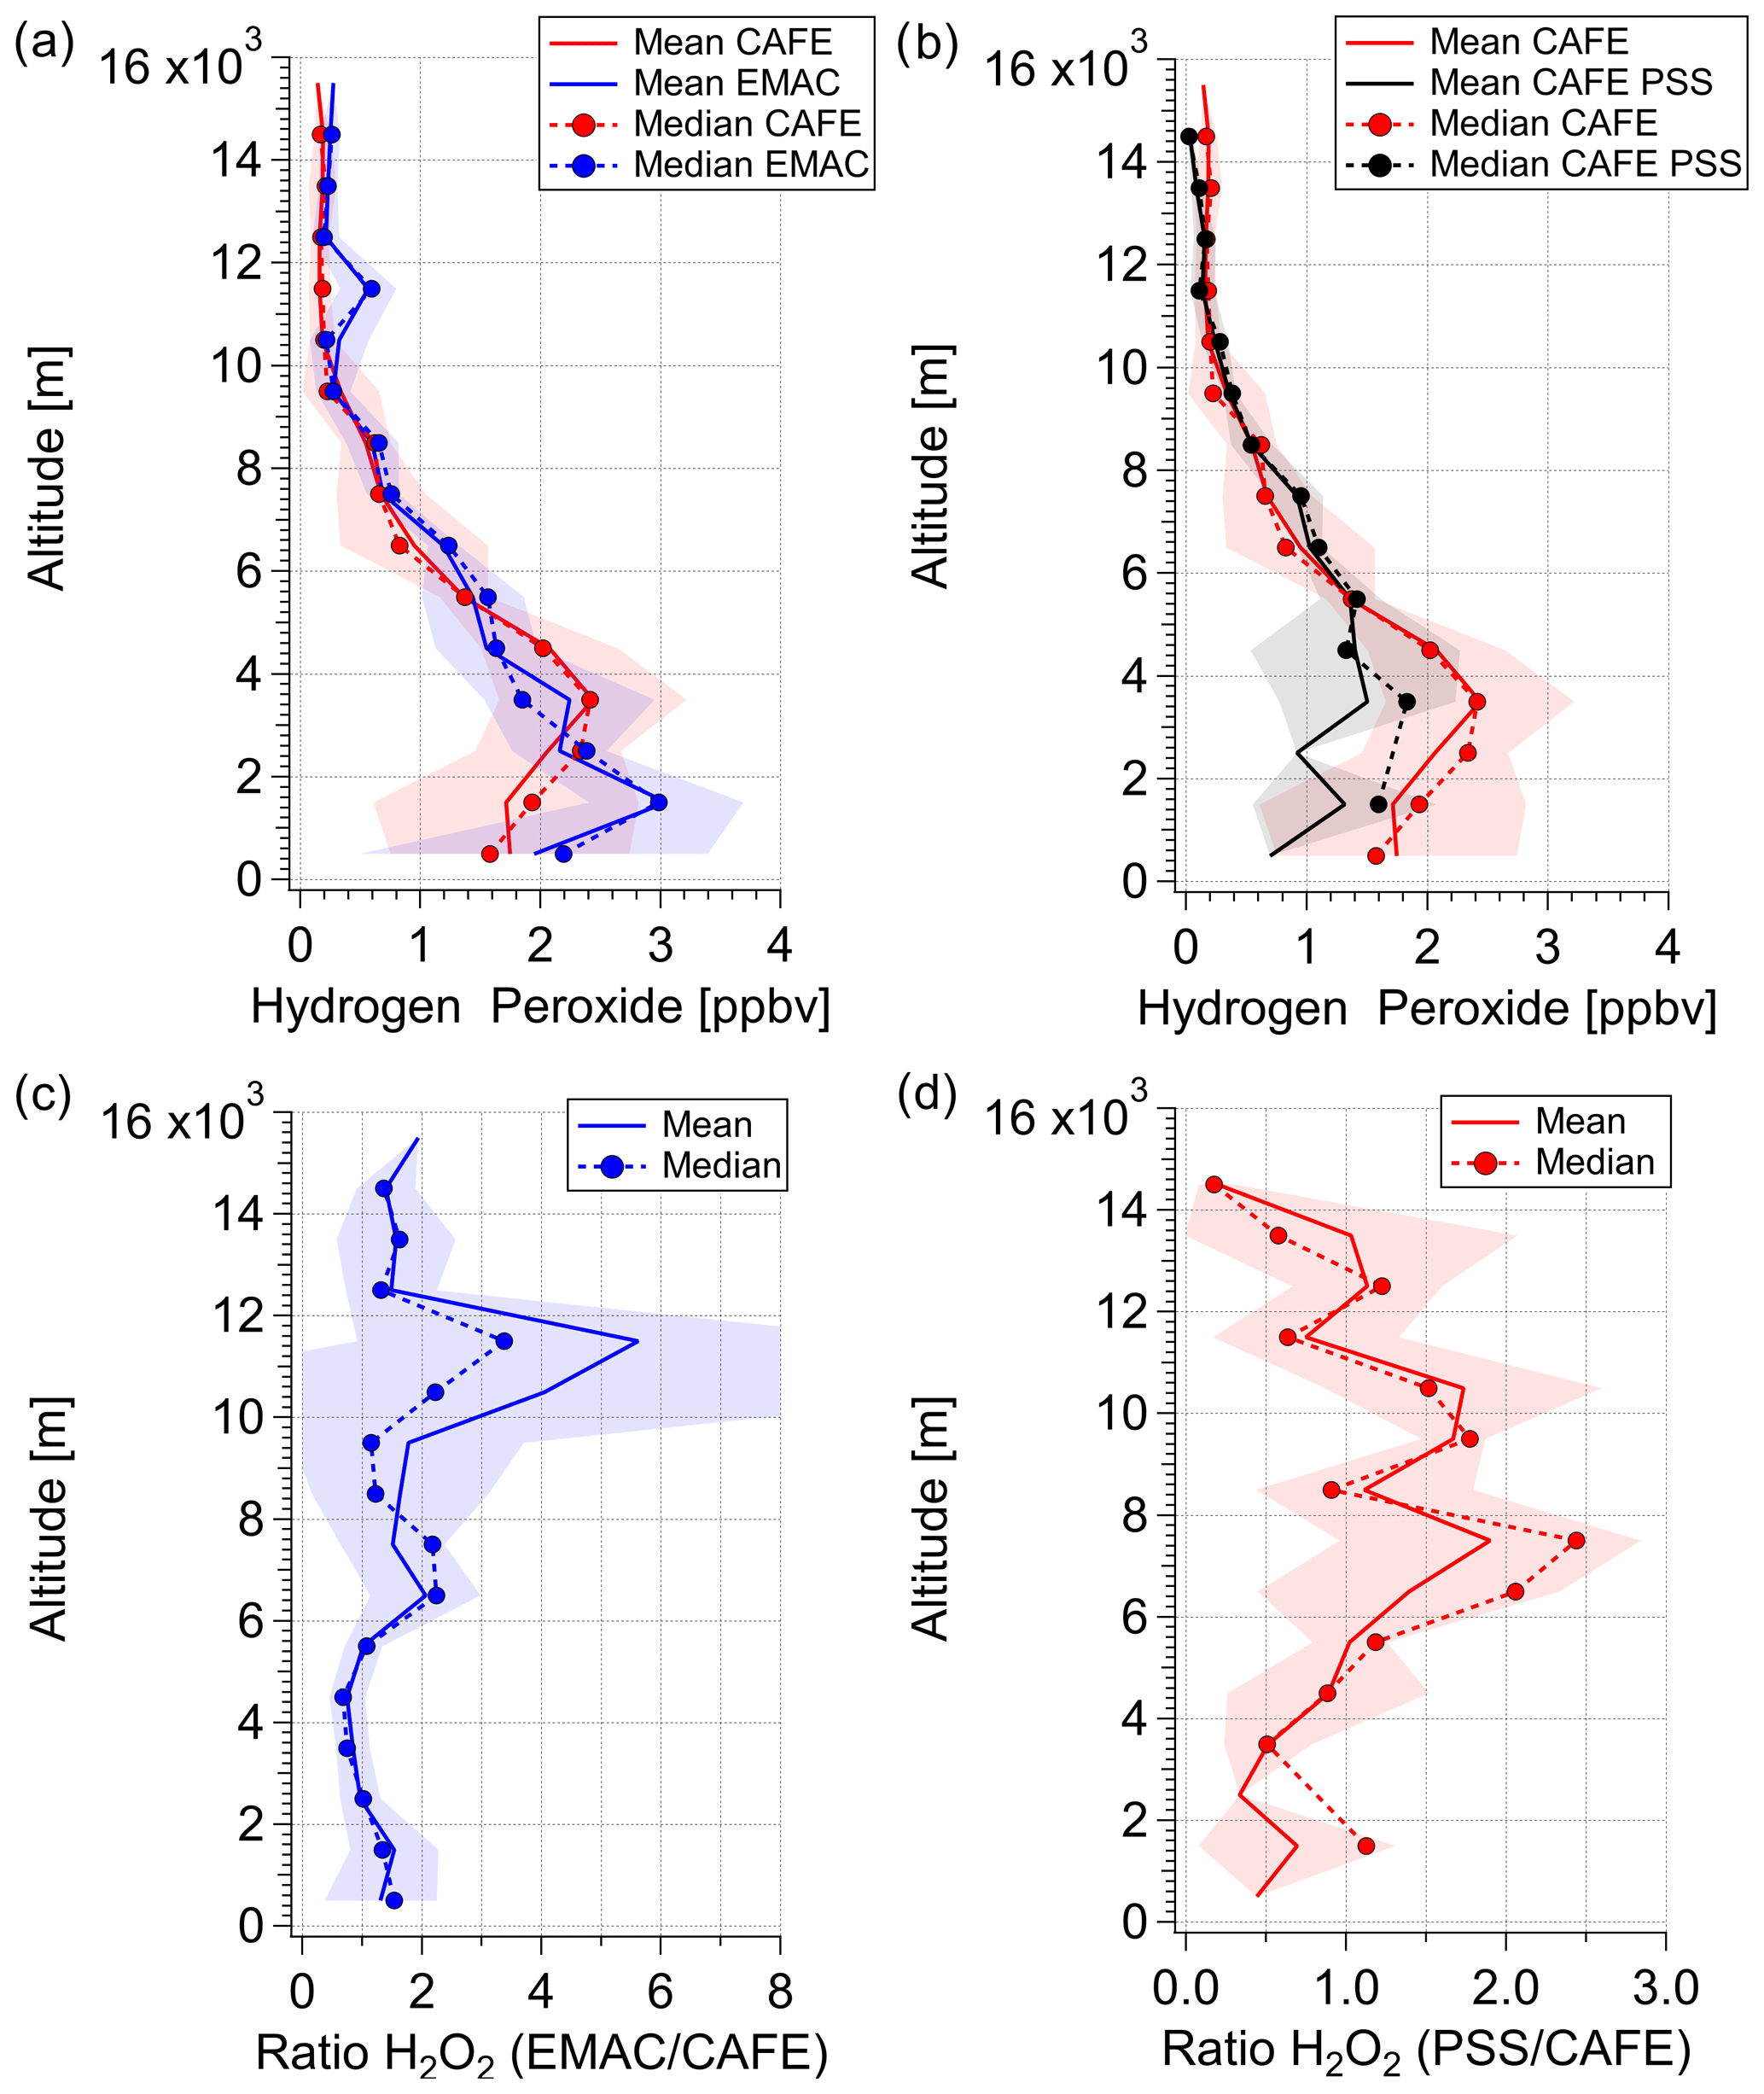
Figure 6Vertical profiles of observed (red), simulated (blue), and calculated based on the PSS assumption (black) hydrogen peroxide means and medians (a–b) and vertical profiles of mean and median H2O2 (EMAC) H2O2 (measurements) and H2O2 (PSS) H2O2 (measurements) ratios (c–d). Vertical profile estimations were calculated within 1 km means and medians over the atmospheric column based on the data obtained in the region in proximity to the base of operations in Sal, Cabo Verde (approx. 16∘35′–16∘51′ N; 22∘52′–23∘ W).
In general, the observed, PSS-calculated, and EMAC-simulated vertical profiles of hydrogen peroxide follow the expected trend throughout the troposphere (Fig. 6a–b). The lowest hydrogen peroxide mixing ratios of 0.141 ppbv were measured in the upper troposphere, where the availability of the H2O2 precursor HO2 is limited due to low water vapor concentrations. The highest mean values (±1σ) of 2.44 (±0.78) ppbv were measured directly above the boundary layer (2–5 km) in the free troposphere. Below 2 km, the levels of observed H2O2 decrease to 1.7 (±1.1) ppbv, reflecting the impact of deposition processes on H2O2 in the boundary layer in proximity to Cabo Verde. Based on the good agreement of the observed vertical distribution with the expected trend as well as logbook reports, the presence of clouds and their subsequent scavenging is assumed to have a minor impact on the local budget of the species.
A good agreement between the measured and EMAC-simulated datasets with a H2O2 (EMAC) H2O2 (measurement) ratio of approximately 1 was found in the lower troposphere (2–6 km; Fig. 6c). Model results tend to overestimate hydrogen peroxide in the boundary layer, which might be due to the model resolution (1.8∘ × 1.8∘) and the corresponding restrictions in resolving small-scale variations in hydrogen peroxide deposition processes in proximity to the base of operations on the island. The vertical profiles of the observations and the model show that the differences arise mainly in the upper troposphere, with increased ratios of simulated vs. measured H2O2 of up to a factor 5.6 at 12 km altitude, which might indicate convective outflow in the model. Vertical profiles of observed and simulated HO2, OH, and H2O2 photolysis rates are in excellent agreement (Fig. S6), indicating that the model accurately simulates photochemical processes throughout the troposphere, so the remaining differences for H2O2 are most likely caused by physical processes (e.g., deposition and transport).
The comparison of measured and PSS-calculated H2O2 vertical profiles indicates a missing source or an overestimated sink below altitudes of 5 km (Fig. 6b). Here, the PSS-calculated hydrogen peroxide levels fall short by about 1 ppbv at altitudes below 4 km, yielding H2O2 (PSS) H2O2 (measured) ratios smaller than unity at these altitudes (Fig. 6d). The absolute difference between the measured and calculated mixing ratios seems to be very prominent in and directly above the boundary layer (< 5 km) and can be associated with air masses affected by Saharan dust, which was often sampled during takeoff and landings at Sal. Heterogeneous loss of HO2 on desert dust particles, while modest, is expected to lower the production of H2O2 (de Reus et al., 2005). Thus, local mixing ratios of HO2 could be affected by heterogeneous loss, while PSS is not yet achieved (Fig. S7).
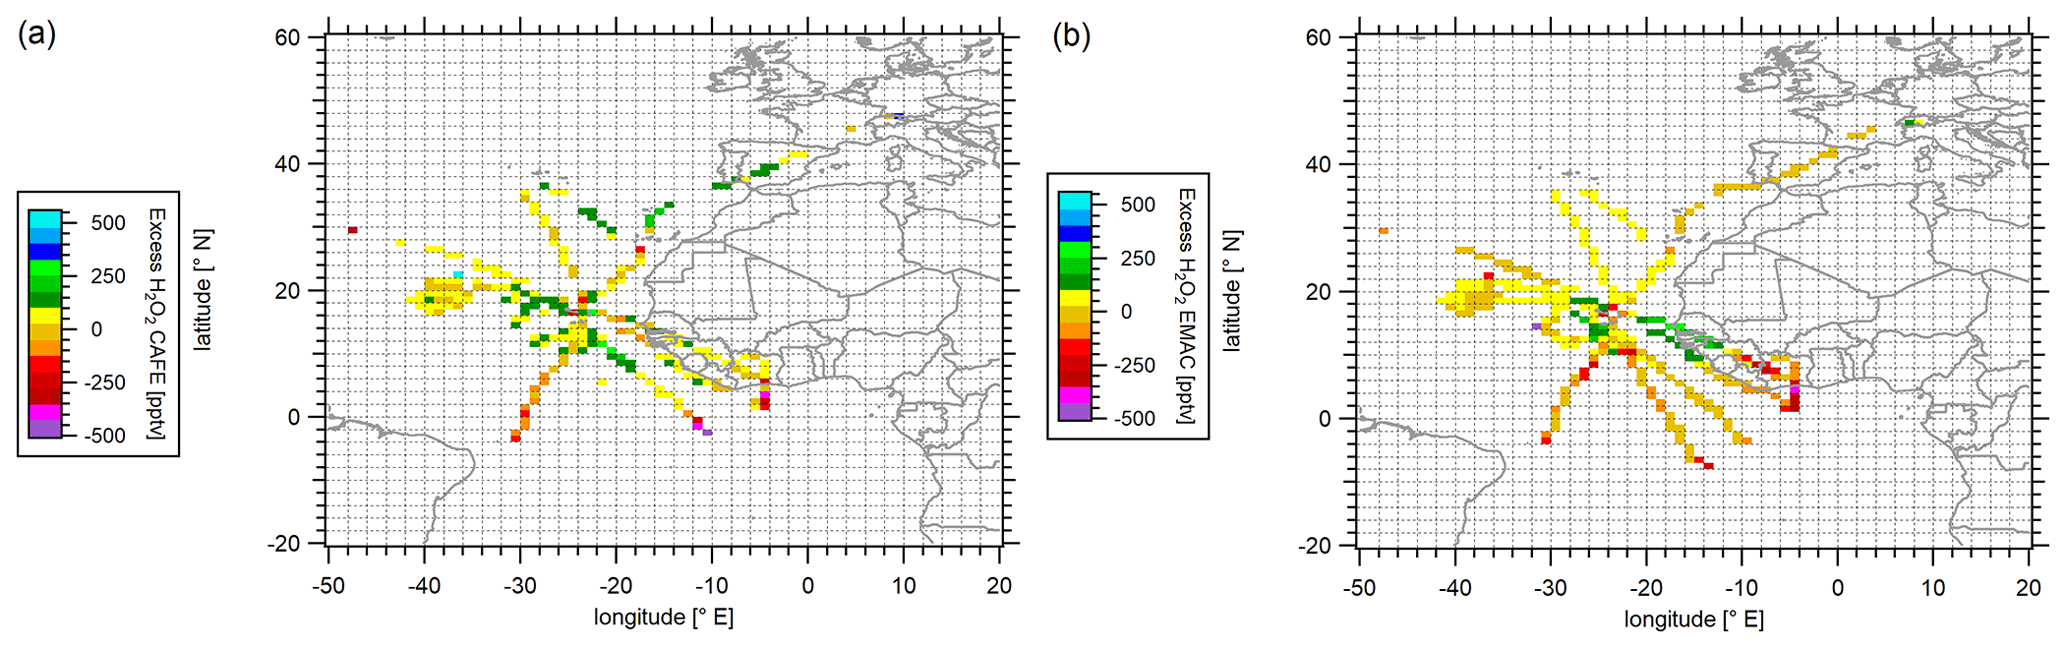
Figure 7Color-coded spatial resolution of calculated H2O2 excess based on the difference between the observations and PSS-based calculations (a) and EMAC simulations and calculations at steady state based on the EMAC data output (b). Data were binned into 1∘ × 1∘ bins over the full extension of the flight tracks.
In order to investigate the extent of the potential hydrogen peroxide injection into the upper troposphere, we calculate excess hydrogen peroxide mixing ratios as the difference between the observed and the corresponding H2O2 based on PSS. Analogously, potential excess of H2O2 using model-simulated data was determined. The spatial distribution of the calculated excess H2O2 mixing ratios in the upper troposphere is presented in Fig. 7 as latitude vs. longitude plots of mean hydrogen peroxide levels aggregated over a spatial 1∘ × 1∘ grid at altitudes above 8 km. The color scale represents the average excess mixing ratios determined for the species (in pptv).
The H2O2 observations exceed the calculated values based on PSS mostly in the range of 70 to 110 pptv with the exception of the values derived in the Southern Hemisphere. Highest deviations were derived in the ITCZ and reach up to 310 pptv at their maximum. The excess mixing ratios show a clear trend with the most impactful injection events in the ITCZ region (5–15∘ N), where convective transport is expected (Waliser and Gautier, 1993; Fontaine et al., 2011). From there, a subsequent redistribution of hydrogen peroxide towards the Northern Hemisphere and Southern Hemispheres occurs, which agrees well with the decreasing gradient towards the north and south. EMAC simulates exceeding H2O2 mixing ratios mostly in the range of 20 to 150 pptv, with maximum excess up to 240 pptv in the ITCZ (12.5∘ N, 25.5∘ W; Fig. 7b). EMAC reproduces the transport rates to a lower extent in the ITCZ, but local convective events such as those occurring within tropical storm Florence and above the African coast are not simulated by the model. In contrast, no significant excess of H2O2 was determined at 1.5∘ N, 4.5∘ W.
The calculated absolute difference between the measured and the PSS-calculated H2O2 in the upper troposphere displays an average excess of 44 (±120) pptv hydrogen peroxide over the entire region relative to the PSS-modeled conditions. In comparison, injections based on EMAC simulations show about 60 % lower values of 18 (±120) pptv. The mixing ratios of the H2O2 measurements below 4 km at Sal were in the range of 1.7–2.4 ppbv, which would contribute with up to 1.8 %–2.6 % of H2O2 in the outflow, assuming potential inflow below 4 km. A similar calculation based solely on EMAC data indicates a contribution of 0.6 %–0.8 % within the model (based on EMAC mixing ratios of 2.1–3.0 ppbv). Thus, although EMAC reproduces potential transport processes from the lower troposphere, the discrepancy in the transmission efficiencies indicates a smaller contribution to the simulated hydrogen peroxide levels. Consequently, the enhanced hydrogen peroxide mixing ratios cannot be justified exclusively by photochemical reactions within the upper troposphere. Additional injections from the lower troposphere via convective transport and the subsequent redistribution towards the subtropics have to be considered.
Hydrogen peroxide was measured during the CAFE-Africa campaign over the tropical Atlantic and western Africa in the upper troposphere (above 8 km). Generally, the measured levels of hydrogen peroxide in the upper troposphere fit well to the previously observed H2O2 at latitudes 10∘ S–40∘ N. At high altitudes, a minor symmetrical decrease from the ITCZ towards northern and southern latitudes was observed, which deviates from previously reported observations in the upper troposphere. According to previous reports, the H2O2 mixing ratios are expected to be elevated in the equatorial upper troposphere due to biomass burning and atmospheric transport. However, the H2O2 mixing ratios measured during the CAFE-Africa campaign show only very little latitudinal variation over the Atlantic with a shift of the maximum mixing ratios towards the ITCZ. The measured hydrogen peroxide mixing ratios show a rather uniform distribution with peak events in the ITCZ and over the African coast, indicating the influence of convective transport processes on the distribution of hydrogen peroxide in the upper troposphere.
Whilst the observations of hydrogen peroxide are in good general agreement with the range of previous observations performed in the upper troposphere, the measured H2O2 mixing ratios deviate from the PSS calculations based on OH and HO2 measurements and the simulations performed by EMAC. The local PSS calculations significantly underestimate the H2O2 mixing ratios in the north of the sampled region. There, the comparison of the H2O2 measurements with PSS calculations reveals a large impact of vertical transport within the ITCZ and the associated redistribution in the upper troposphere on the spatial distribution of hydrogen peroxide. Further, the enhanced presence of clouds in the ITCZ and towards the Southern Hemisphere indicates significant cloud scavenging in the sampled region, justifying the deviations to the local photostationary steady-state calculations, which only account for photochemical sources and sinks of H2O2. The EMAC simulations of H2O2, HO2, and OH agree with the observations in the lower tropospheric layers. An overestimation of model results compared with the observations of hydrogen peroxide mixing ratios due to inaccuracies in cloud scavenging was observed in the upper troposphere towards the Southern Hemisphere. Based on our calculations, the model simulates only partially the impacts of atmospheric transport on the H2O2 budget. In fact, the calculated excess hydrogen peroxide mixing ratios based on EMAC are lower compared to those based on the PSS calculations by approximately 60 %. The comparison between the EMAC- and PSS-calculated data versus measured hydrogen peroxide confirms that convective transport and consequent redistribution most likely by northerly and southerly winds towards the subtropics has a significant impact on H2O2. This redistribution alters the spatial distribution of H2O2 towards more uniform mixing ratios in the marine tropical upper troposphere than would be expected based exclusively on photochemical production and loss processes in the UT.
All CAFE-Africa datasets used in this study are stored at https://doi.org/10.5281/zenodo.7845890 (Hamryszczak et al., 2023).
The supplement related to this article is available online at: https://doi.org/10.5194/acp-23-5929-2023-supplement.
JL and HF planned the campaign; DD, BBr, RR, DM, MM, HH, and BBo performed the measurements; ZH and HF designed the study; ZH, DD, RR, BBo, and MZ processed and analyzed the data; AP developed the model code and performed the simulation; ZH wrote the manuscript draft with contributions of all co-authors.
At least one of the (co-)authors is a member of the editorial board of Atmospheric Chemistry and Physics. The authors have no other competing interests to declare.
Publisher’s note: Copernicus Publications remains neutral with regard to jurisdictional claims in published maps and institutional affiliations.
This article is part of the special issue “The Modular Earth Submodel System (MESSy) (ACP/GMD inter-journal SI)”. It is not associated with a conference.
The authors are very grateful to the CAFE-Africa team, Forschungszentrum Jülich, Karlsruhe Institute of Technology, and Deutsches Zentrum für Luft- und Raumfahrt (DLR) in Oberpfaffenhofen for their great support. Their work was essential for the project.
The article processing charges for this open-access publication were covered by the Max Planck Society.
This paper was edited by Gabriele Stiller and reviewed by two anonymous referees.
Allen, H. M., Crounse, J. D., Kim, M. J., Teng, A. P., Ray, E. A., McKain, K., Sweeney, C., and Wennberg, P. O.: H2O2 and CH3OOH (MHP) in the Remote Atmosphere: 1. Global Distribution and Regional Influences, J. Geophys. Res.-Atmos., 127, e2021JD035701, https://doi.org/10.1029/2021JD035701, 2022.
Allen, N. D. C., González Abad, G., Bernath, P. F., and Boone, C. D.: Satellite observations of the global distribution of hydrogen peroxide (H2O2) from ACE, J. Quant. Spectrosc. Ra., 115, 66–77, https://doi.org/10.1016/j.jqsrt.2012.09.008, 2013.
Anonymous referee: Referee comment 2, https://doi.org/10.5194/acp-2022-693-RC2, 2022.
Atkinson, R., Baulch, D. L., Cox, R. A., Crowley, J. N., Hampson, R. F., Hynes, R. G., Jenkin, M. E., Rossi, M. J., and Troe, J.: Evaluated kinetic and photochemical data for atmospheric chemistry: Volume I – gas phase reactions of Ox, HOx, NOx and SOx species, Atmos. Chem. Phys., 4, 1461–1738, https://doi.org/10.5194/acp-4-1461-2004, 2004.
Bohn, B. and Lohse, I.: Calibration and evaluation of CCD spectroradiometers for ground-based and airborne measurements of spectral actinic flux densities, Atmos. Meas. Tech., 10, 3151–3174, https://doi.org/10.5194/amt-10-3151-2017, 2017.
Bozem, H., Pozzer, A., Harder, H., Martinez, M., Williams, J., Lelieveld, J., and Fischer, H.: The influence of deep convection on HCHO and H2O2 in the upper troposphere over Europe, Atmos. Chem. Phys., 17, 11835–11848, https://doi.org/10.5194/acp-17-11835-2017, 2017.
Calvert, J. G., Lazrus, A., Kok, G. L., Heikes, B. G., Walega, J. G., Lind, J., and Cantrell, C. A.: Chemical mechanisms of acid generation in the troposphere, Nature, 317, 27–35, https://doi.org/10.1038/317027a0, 1985.
Chang, W., Lee, M., and Heikes, B. G.: One-dimensional photochemical study of H2O2CH3OOH, and HCHO in the marine boundary layer during Pacific Exploratory Mission in the Tropics (PEM-Tropics) B, J. Geophys. Res., 109, D06307, https://doi.org/10.1029/2003jd004256, 2004.
Crippa, M., Guizzardi, D., Muntean, M., Schaaf, E., Dentener, F., van Aardenne, J. A., Monni, S., Doering, U., Olivier, J. G. J., Pagliari, V., and Janssens-Maenhout, G.: Gridded emissions of air pollutants for the period 1970–2012 within EDGAR v4.3.2, Earth Syst. Sci. Data, 10, 1987–2013, https://doi.org/10.5194/essd-10-1987-2018, 2018.
Crutzen, P. J., Lawrence, M. G., and Pöschl, U.: On the background photochemistry of tropospheric ozone, Tellus B, 51, 123–146, https://doi.org/10.3402/tellusb.v51i1.16264, 1999.
Damschen, D. E. and Martin, L. R.: Aqueous aerosol oxidation of nitrous acid by O2, O3 AND H2O2, Atmos. Environ., 17, 2005–2011, https://doi.org/10.1016/0004-6981(83)90357-8, 1983.
Daum, P. H., Kleinman, L. I., Hills, A. J., Lazrus, A. L., Leslie, A. C. D., Busness, K., and Boatman, J.: Measurement and interpretation of concentrations of H2O2 and related species in the upper midwest during summer, J. Geophys. Res., 95, 9857–9871, https://doi.org/10.1029/JD095iD07p09857, 1990.
de Reus, M., Fischer, H., Sander, R., Gros, V., Kormann, R., Salisbury, G., Van Dingenen, R., Williams, J., Zöllner, M., and Lelieveld, J.: Observations and model calculations of trace gas scavenging in a dense Saharan dust plume during MINATROC, Atmos. Chem. Phys., 5, 1787–1803, https://doi.org/10.5194/acp-5-1787-2005, 2005.
Dienhart, D., Brendel, B., Crowley, J. N., Eger, P. G., Harder, H., Martinez, M., Pozzer, A., Rohloff, R., Schuladen, J., Tauer, S., Walter, D., Lelieveld, J., and Fischer, H.: Formaldehyde and hydroperoxide distribution around the Arabian Peninsula – evaluation of EMAC model results with ship-based measurements, Atmos. Chem. Phys., 23, 119–142, https://doi.org/10.5194/acp-23-119-2023, 2023.
Faloona, I., Tan, D., Brune, W. H., Jaeglé, L., Jacob, D. J., Kondo, Y., Koike, M., Chatfield, R., Pueschel, R., Ferry, G., Sachse, G., Vay, S., Anderson, B., Hannon, J., and Fuelberg, H.: Observations of HOx and its relationship with NOx in the upper troposphere during SONEX, J. Geophys. Res., 105, 3771–3783, https://doi.org/10.1029/1999JD900914, 2000.
Faloona, I. C., Tan, D., Lesher, R. L., Hazen, N. L., Frame, C. L., Simpas, J. B., Harder, H., Martinez, M., Di Carlo, P., Ren, X., and Brune, W. H.: A Laser-induced Fluorescence Instrument for Detecting Tropospheric OH and HO2 Characteristics and Calibration, J. Atmos. Chem., 47, 139–167, https://doi.org/10.1023/B:JOCH.0000021036.53185.0e, 2004.
Fels, M. and Junkermann, W.: The occurrence of organic peroxides in air at a mountain site, Geophys. Res. Lett., 21, 341–344, https://doi.org/10.1029/93GL01892, 1994.
Fontaine, B., Roucou, P., Gaetani, M., and Marteau, R.: Recent changes in precipitation, ITCZ convection and northern tropical circulation over North Africa (1979–2007), Int. J. Climatol., 31, 633–648, https://doi.org/10.1002/joc.2108, 2011.
Guilbault, G. G., Brignac, P. J., and Juneau, M.: New substrates for the fluorometric determination of oxidative enzymes, Anal. Chem., 40, 1256–1263, https://doi.org/10.1021/ac60264a027, 1968.
Hamryszczak, Z., Dienhart, D., Brendel, B., Rohloff, R., Marno, D., Martinez, M., Harder, H., Pozzer, A., Bohn, B., Zöger, M., Lelieveld, J., and Fischer, H.: Hydrogen peroxide in the upper tropical troposphere over the Atlantic Ocean and western Africa during the CAFE-Africa aircraft campaign (1.0), Zenodo [data set], https://doi.org/10.5281/zenodo.7845890, 2023.
Hamryszczak, Z. T., Pozzer, A., Obersteiner, F., Bohn, B., Steil, B., Lelieveld, J., and Fischer, H.: Distribution of hydrogen peroxide over Europe during the BLUESKY aircraft campaign, Atmos. Chem. Phys., 22, 9483–9497, https://doi.org/10.5194/acp-22-9483-2022, 2022.
Hastenrath, S. and Lamb, P.: Some Aspects of Circulation and Climate over the Eastern Equatorial Atlantic, Mon. Wea. Rev., 105, 1019–1023, https://doi.org/10.1175/1520-0493(1977)105<1019:SAOCAC>2.0.CO;2, 1977.
Heikes, B. G.: Formaldehyde and hydroperoxides at Mauna Loa Observatory, J. Geophys. Res., 97, 18001, https://doi.org/10.1029/92JD00268, 1992.
Hersbach, H., Bell, B., Berrisford, P., Biavati, G., Horányi, A., Muñoz Sabater, J., Nicolas, J., Peubey, C., Radu, R., Rozum, I., Schepers, D., Simmons, A., Soci, C., Dee, D., and Thépaut, J.-N.: ERA5 monthly averaged data on single levels from 1979 to present, Copernicus Climate Change Service (C3S) Climate Data Store (CDS) [data set], https://doi.org/10.24381/CDS.F17050D7, 2019.
Hoffmann, M. R. and Edwards, J. O.: Kinetics of the oxidation of sulfite by hydrogen peroxide in acidic solution, J. Phys. Chem., 79, 2096–2098, https://doi.org/10.1021/j100587a005, 1975.
Hottmann, B., Hafermann, S., Tomsche, L., Marno, D., Martinez, M., Harder, H., Pozzer, A., Neumaier, M., Zahn, A., Bohn, B., Stratmann, G., Ziereis, H., Lelieveld, J., and Fischer, H.: Impact of the South Asian monsoon outflow on atmospheric hydroperoxides in the upper troposphere, Atmos. Chem. Phys., 20, 12655–12673, https://doi.org/10.5194/acp-20-12655-2020, 2020.
Hua, W., Chen, Z. M., Jie, C. Y., Kondo, Y., Hofzumahaus, A., Takegawa, N., Chang, C. C., Lu, K. D., Miyazaki, Y., Kita, K., Wang, H. L., Zhang, Y. H., and Hu, M.: Atmospheric hydrogen peroxide and organic hydroperoxides during PRIDE-PRD'06, China: their concentration, formation mechanism and contribution to secondary aerosols, Atmos. Chem. Phys., 8, 6755–6773, https://doi.org/10.5194/acp-8-6755-2008, 2008.
Jacob, P. and Klockow, D.: Hydrogen peroxide measurements in the marine atmosphere, J. Atmos. Chem., 15, 353–360, https://doi.org/10.1007/BF00115404, 1992.
Jaeglé, L., Jacob, D. J., Wennberg, P. O., Spivakovsky, C. M., Hanisco, T. F., Lanzendorf, E. J., Hintsa, E. J., Fahey, D. W., Keim, E. R., Proffitt, M. H., Atlas, E. L., Flocke, F., Schauffler, S., McElroy, C. T., Midwinter, C., Pfister, L., and Wilson, J. C.: Observed OH and HO2 in the upper troposphere suggest a major source from convective injection of peroxides, Geophys. Res. Lett., 24, 3181–3184, https://doi.org/10.1029/97GL03004, 1997.
Jaeglé, L., Jacob, D. J., Brune, W. H., Faloona, I., Tan, D., Heikes, B. G., Kondo, Y., Sachse, G. W., Anderson, B., Gregory, G. L., Singh, H. B., Pueschel, R., Ferry, G., Blake, D. R., and Shetter, R. E.: Photochemistry of HOx in the upper troposphere at northern midlatitudes, J. Geophys. Res., 105, 3877–3892, https://doi.org/10.1029/1999JD901016, 2000.
Jöckel, P., Sander, R., Kerkweg, A., Tost, H., and Lelieveld, J.: Technical Note: The Modular Earth Submodel System (MESSy) – a new approach towards Earth System Modeling, Atmos. Chem. Phys., 5, 433–444, https://doi.org/10.5194/acp-5-433-2005, 2005.
Jöckel, P., Tost, H., Pozzer, A., Brühl, C., Buchholz, J., Ganzeveld, L., Hoor, P., Kerkweg, A., Lawrence, M. G., Sander, R., Steil, B., Stiller, G., Tanarhte, M., Taraborrelli, D., van Aardenne, J., and Lelieveld, J.: The atmospheric chemistry general circulation model ECHAM5/MESSy1: consistent simulation of ozone from the surface to the mesosphere, Atmos. Chem. Phys., 6, 5067–5104, https://doi.org/10.5194/acp-6-5067-2006, 2006.
Jöckel, P., Kerkweg, A., Pozzer, A., Sander, R., Tost, H., Riede, H., Baumgaertner, A., Gromov, S., and Kern, B.: Development cycle 2 of the Modular Earth Submodel System (MESSy2), Geosci. Model Dev., 3, 717–752, https://doi.org/10.5194/gmd-3-717-2010, 2010.
Jöckel, P., Tost, H., Pozzer, A., Kunze, M., Kirner, O., Brenninkmeijer, C. A. M., Brinkop, S., Cai, D. S., Dyroff, C., Eckstein, J., Frank, F., Garny, H., Gottschaldt, K.-D., Graf, P., Grewe, V., Kerkweg, A., Kern, B., Matthes, S., Mertens, M., Meul, S., Neumaier, M., Nützel, M., Oberländer-Hayn, S., Ruhnke, R., Runde, T., Sander, R., Scharffe, D., and Zahn, A.: Earth System Chemistry integrated Modelling (ESCiMo) with the Modular Earth Submodel System (MESSy) version 2.51, Geosci. Model Dev., 9, 1153–1200, https://doi.org/10.5194/gmd-9-1153-2016, 2016.
Kaiser, J. W., Heil, A., Andreae, M. O., Benedetti, A., Chubarova, N., Jones, L., Morcrette, J.-J., Razinger, M., Schultz, M. G., Suttie, M., and van der Werf, G. R.: Biomass burning emissions estimated with a global fire assimilation system based on observed fire radiative power, Biogeosciences, 9, 527–554, https://doi.org/10.5194/bg-9-527-2012, 2012.
Kerkweg, A., Buchholz, J., Ganzeveld, L., Pozzer, A., Tost, H., and Jöckel, P.: Technical Note: An implementation of the dry removal processes DRY DEPosition and SEDImentation in the Modular Earth Submodel System (MESSy), Atmos. Chem. Phys., 6, 4617–4632, https://doi.org/10.5194/acp-6-4617-2006, 2006a.
Kerkweg, A., Sander, R., Tost, H., and Jöckel, P.: Technical note: Implementation of prescribed (OFFLEM), calculated (ONLEM), and pseudo-emissions (TNUDGE) of chemical species in the Modular Earth Submodel System (MESSy), Atmos. Chem. Phys., 6, 3603–3609, https://doi.org/10.5194/acp-6-3603-2006, 2006b.
Kleinman, L. I.: Seasonal dependence of boundary layer peroxide concentration: The low and high NOx regimes, J. Geophys. Res., 96, 20721, https://doi.org/10.1029/91JD02040, 1991.
Klippel, T., Fischer, H., Bozem, H., Lawrence, M. G., Butler, T., Jöckel, P., Tost, H., Martinez, M., Harder, H., Regelin, E., Sander, R., Schiller, C. L., Stickler, A., and Lelieveld, J.: Distribution of hydrogen peroxide and formaldehyde over Central Europe during the HOOVER project, Atmos. Chem. Phys., 11, 4391–4410, https://doi.org/10.5194/acp-11-4391-2011, 2011.
Krautstrunk, M. and Giez, A.: The Transition From FALCON to HALO Era Airborne Atmospheric Research, in: Atmospheric physics: Background-methods-trends, edited by: Schumann, U., Springer-Verlag, Berlin, Heildelberg, 609–624, https://doi.org/10.1007/978-3-642-30183-4_37, 2012.
Lazrus, A. L., Kok, G. L., Gitlin, S. N., Lind, J. A., and McLaren, S. E.: Automated fluorimetric method for hydrogen peroxide in atmospheric precipitation, Anal. Chem., 57, 917–922, https://doi.org/10.1021/ac00281a031, 1985.
Lazrus, A. L., Kok, G. L., Lind, J. A., Gitlin, S. N., Heikes, B. G., and Shetter, R. E.: Automated fluorometric method for hydrogen peroxide in air, Anal. Chem., 58, 594–597, https://doi.org/10.1021/ac00294a024, 1986.
Lee, M., Heikes, B. G., Jacob, D. J., Sachse, G., and Anderson, B.: Hydrogen peroxide, organic hydroperoxide, and formaldehyde as primary pollutants from biomass burning, J. Geophys. Res., 102, 1301–1309, https://doi.org/10.1029/96jd01709, 1997.
Lee, M., Heikes, B. G., and Jacob, D. J.: Enhancements of hydroperoxides and formaldehyde in biomass burning impacted air and their effect on atmospheric oxidant cycles, J. Geophys. Res., 103, 13201–13212, https://doi.org/10.1029/98jd00578, 1998.
Lee, M., Heikes, B. G., and O'Sullivan, D. W.: Hydrogen peroxide and organic hydroperoxide in the troposphere: a review, Atmos. Environ., 34, 3475–3494, https://doi.org/10.1016/S1352-2310(99)00432-X, 2000.
Lelieveld, J. and Crutzen, P. J.: Influences of cloud photochemical processes on tropospheric ozone, Nature, 343, 227–233, https://doi.org/10.1038/343227a0, 1990.
Levy, H.: Normal atmosphere: large radical and formaldehyde concentrations predicted, Science, 173, 141–143, https://doi.org/10.1126/science.173.3992.141, 1971.
Logan, J. A., Prather, M. J., Wofsy, S. C., and McElroy, M. B.: Tropospheric chemistry: A global perspective, J. Geophys. Res., 86, 7210, https://doi.org/10.1029/JC086iC08p07210, 1981.
Marno, D., Ernest, C., Hens, K., Javed, U., Klimach, T., Martinez, M., Rudolf, M., Lelieveld, J., and Harder, H.: Calibration of an airborne HOx instrument using the All Pressure Altitude-based Calibrator for HOx Experimentation (APACHE), Atmos. Meas. Tech., 13, 2711–2731, https://doi.org/10.5194/amt-13-2711-2020, 2020.
Nguyen, T. B., Crounse, J. D., Teng, A. P., St Clair, J. M., Paulot, F., Wolfe, G. M., and Wennberg, P. O.: Rapid deposition of oxidized biogenic compounds to a temperate forest, P. Natl. Acad. Sci. USA, 112, 392–401, https://doi.org/10.1073/pnas.1418702112, 2015.
Nussbaumer, C. M., Tadic, I., Dienhart, D., Wang, N., Edtbauer, A., Ernle, L., Williams, J., Obersteiner, F., Gutiérrez-Álvarez, I., Harder, H., Lelieveld, J., and Fischer, H.: Measurement report: In situ observations of deep convection without lightning during the tropical cyclone Florence 2018, Atmos. Chem. Phys., 21, 7933–7945, https://doi.org/10.5194/acp-21-7933-2021, 2021.
O'Sullivan, D. W., Lee, M., Noone, B. C., and Heikes, B. G.: Henry's Law Constant Determinations for Hydrogen Peroxide, Methyl Hydroperoxide, Hydroxymethyl Hydroperoxide, Ethyl Hydroperoxide, and Peroxyacetic Acid, J. Phys. Chem., 100, 3241–3247, https://doi.org/10.1021/jp951168n, 1996.
O'Sullivan, D. W., Heikes, B. G., Lee, M., Chang, W., Gregory, G. L., Blake, D. R., and Sachse, G. W.: Distribution of hydrogen peroxide and methylhydroperoxide over the Pacific and South Atlantic Oceans, J. Geophys. Res., 104, 5635–5646, https://doi.org/10.1029/98JD01250, 1999.
Penkett, S. A., Jones, B. M. R., Brich, K. A., and Eggleton, A. E. J.: The importance of atmospheric ozone and hydrogen peroxide in oxidising sulphur dioxide in cloud and rainwater, Atmos. Environ., 13, 123–137, https://doi.org/10.1016/0004-6981(79)90251-8, 1979.
Perros, P. E.: Large-scale distribution of hydrogen peroxide from aircraft measurements during the TROPOZ II experiment, Atmos. Environ. A-Gen., 27, 1695–1708, https://doi.org/10.1016/0960-1686(93)90232-N, 1993.
Pozzer, A., Jöckel, P., and Van Aardenne, J.: The influence of the vertical distribution of emissions on tropospheric chemistry, Atmos. Chem. Phys., 9, 9417–9432, https://doi.org/10.5194/acp-9-9417-2009, 2009.
Pozzer, A., Reifenberg, S. F., Kumar, V., Franco, B., Kohl, M., Taraborrelli, D., Gromov, S., Ehrhart, S., Jöckel, P., Sander, R., Fall, V., Rosanka, S., Karydis, V., Akritidis, D., Emmerichs, T., Crippa, M., Guizzardi, D., Kaiser, J. W., Clarisse, L., Kiendler-Scharr, A., Tost, H., and Tsimpidi, A.: Simulation of organics in the atmosphere: evaluation of EMACv2.54 with the Mainz Organic Mechanism (MOM) coupled to the ORACLE (v1.0) submodel, Geosci. Model Dev., 15, 2673–2710, https://doi.org/10.5194/gmd-15-2673-2022, 2022.
Prather, M. J. and Jacob, D. J.: A persistent imbalance in HOx and NOx photochemistry of the upper troposphere driven by deep tropical convection, Geophys. Res. Lett., 24, 3189–3192, https://doi.org/10.1029/97GL03027, 1997.
Reeves, C. E. and Penkett, S. A.: Measurements of peroxides and what they tell us, Chem. Rev., 103, 5199–5218, https://doi.org/10.1021/cr0205053, 2003.
Rinsland, C. P., Coheur, P. F., Herbin, H., Clerbaux, C., Boone, C., Bernath, P., and Chiou, L. S.: Detection of elevated tropospheric hydrogen peroxide (H2O2) mixing ratios in atmospheric chemistry experiment (ACE) subtropical infrared solar occultation spectra, J. Quant. Spectrosc. Ra., 107, 340–348, https://doi.org/10.1016/j.jqsrt.2007.02.009, 2007.
Robbin Martin, L. and Damschen, D. E.: Aqueous oxidation of sulfur dioxide by hydrogen peroxide at low pH, Atmos. Environ., 15, 1615–1621, https://doi.org/10.1016/0004-6981(81)90146-3, 1981.
Roeckner, E., Bäuml, G., Bonaventura, L., Brokopf, R., Esch, M., Giorgetta, M., Hagemann, S., Kirchner, I., Kornblueh, L., Manzini, E., Rhodin, A., Schlese, U., Schulzweida, U., and Tompkins, A.: The atmospheric general circulation model ECHAM 5. PART I: Model description, Report, Max-Planck-Institut für Meteorologie, https://doi.org/10.17617/2.995269, 2003.
Roeckner, E., Brokopf, R., Esch, M., Giorgetta, M., Hagemann, S., Kornblueh, L., Manzini, E., Schlese, U., and Schulzweida, U.: Sensitivity of Simulated Climate to Horizontal and Vertical Resolution in the ECHAM5 Atmosphere Model, J. Climate, 19, 3771–3791, https://doi.org/10.1175/JCLI3824.1, 2006.
Sander, R., Kerkweg, A., Jöckel, P., and Lelieveld, J.: Technical note: The new comprehensive atmospheric chemistry module MECCA, Atmos. Chem. Phys., 5, 445–450, https://doi.org/10.5194/acp-5-445-2005, 2005.
Sander, R., Baumgaertner, A., Gromov, S., Harder, H., Jöckel, P., Kerkweg, A., Kubistin, D., Regelin, E., Riede, H., Sandu, A., Taraborrelli, D., Tost, H., and Xie, Z.-Q.: The atmospheric chemistry box model CAABA/MECCA-3.0, Geosci. Model Dev., 4, 373–380, https://doi.org/10.5194/gmd-4-373-2011, 2011.
Sander, R., Jöckel, P., Kirner, O., Kunert, A. T., Landgraf, J., and Pozzer, A.: The photolysis module JVAL-14, compatible with the MESSy standard, and the JVal PreProcessor (JVPP), Geosci. Model Dev., 7, 2653–2662, https://doi.org/10.5194/gmd-7-2653-2014, 2014.
Sander, R., Baumgaertner, A., Cabrera-Perez, D., Frank, F., Gromov, S., Grooß, J.-U., Harder, H., Huijnen, V., Jöckel, P., Karydis, V. A., Niemeyer, K. E., Pozzer, A., Riede, H., Schultz, M. G., Taraborrelli, D., and Tauer, S.: The community atmospheric chemistry box model CAABA/MECCA-4.0, Geosci. Model Dev., 12, 1365–1385, https://doi.org/10.5194/gmd-12-1365-2019, 2019.
Slemr, F. and Tremmel, H. G.: Hydroperoxides in the marine troposphere over the Atlantic Ocean, J. Atmos. Chem., 19, 371–404, https://doi.org/10.1007/BF00694493, 1994.
Snow, J. A.: Winter-spring evolution and variability of HOx reservoir species, hydrogen peroxide, and methyl hydroperoxide, in the northern middle to high latitudes, J. Geophys. Res., 108, 1890, https://doi.org/10.1029/2002JD002172, 2003.
Snow, J. A., Heikes, B. G., Shen, H., O'Sullivan, D. W., Fried, A., and Walega, J.: Hydrogen peroxide, methyl hydroperoxide, and formaldehyde over North America and the North Atlantic, J. Geophys. Res., 112, 8353, https://doi.org/10.1029/2006JD007746, 2007.
Tadic, I., Nussbaumer, C. M., Bohn, B., Harder, H., Marno, D., Martinez, M., Obersteiner, F., Parchatka, U., Pozzer, A., Rohloff, R., Zöger, M., Lelieveld, J., and Fischer, H.: Central role of nitric oxide in ozone production in the upper tropical troposphere over the Atlantic Ocean and western Africa, Atmos. Chem. Phys., 21, 8195–8211, https://doi.org/10.5194/acp-21-8195-2021, 2021.
Tost, H., Jöckel, P., Kerkweg, A., Sander, R., and Lelieveld, J.: Technical note: A new comprehensive SCAVenging submodel for global atmospheric chemistry modelling, Atmos. Chem. Phys., 6, 565–574, https://doi.org/10.5194/acp-6-565-2006, 2006.
Valverde-Canossa, J., Wieprecht, W., Acker, K., and Moortgat, G. K.: H2O2 and organic peroxide measurements in an orographic cloud: The FEBUKO experiment, Atmos. Environ., 39, 4279–4290, https://doi.org/10.1016/j.atmosenv.2005.02.040, 2005.
Walcek, C. J.: A theoretical estimate of O3 and H2O2 dry deposition over the northeast United States, Atmos. Environ., 21, 2649–2659, https://doi.org/10.1016/0004-6981(87)90196-x, 1987.
Waliser, D. E. and Gautier, C.: A Satellite-derived Climatology of the ITCZ, J. Climate, 6, 2162–2174, https://doi.org/10.1175/1520-0442(1993)006<2162:ASDCOT>2.0.CO;2, 1993.
Weinstein-Lloyd, J. B., Lee, J. H., Daum, P. H., Kleinman, L. I., Nunnermacker, L. J., Springston, S. R., and Newman, L.: Measurements of peroxides and related species during the 1995 summer intensive of the Southern Oxidants Study in Nashville, Tennessee, J. Geophys. Res., 103, 22361–22373, https://doi.org/10.1029/98JD01636, 1998.