the Creative Commons Attribution 4.0 License.
the Creative Commons Attribution 4.0 License.
 | 23 May 2023
Long-term variability in immersion-mode marine ice-nucleating particles from climate model simulations and observations
Aishwarya Raman
Thomas Hill
Paul J. DeMott
Balwinder Singh
Kai Zhang
Po-Lun Ma
Mingxuan Wu
Hailong Wang
Simon P. Alexander
Susannah M. Burrows
Ice-nucleating particles (INPs) in the Southern Ocean (SO) atmosphere have significant impacts on cloud radiative and microphysical properties. Yet, INP prediction skill in climate models remains poorly understood, in part because of the lack of long-term measurements. Here we show, for the first time, how model-simulated INP concentrations compare with year-round INP measurements during the Macquarie Island Cloud Radiation Experiment (MICRE) campaign from 2017–2018. We simulate immersion-mode INP concentrations using the Energy Exascale Earth System Model version 1 (E3SMv1) by combining simulated aerosols with recently developed deterministic INP parameterizations and the native classical nucleation theory (CNT) for mineral dust in E3SMv1. Because MICRE did not collect aerosol measurements of super-micron particles, which are more effective ice nucleators, we evaluate the model's aerosol fields at other high-latitude sites using long-term in situ observations of dust and sea spray aerosol. We find that the model underestimates dust and overestimates sea spray aerosol concentrations by 1 to 2 orders of magnitude for most of the high-latitude sites in the Southern Hemisphere. We next compare predicted INP concentrations with concentrations of INPs collected on filter samples (typically for 2 or 3 d) and processed offline using the Colorado State University ice spectrometer (IS) in immersion freezing mode. We find that when deterministic parameterizations for both dust and sea spray INPs are used, simulated INPs are within a factor of 10 of observed INPs more than 60 % of the time during summer. Our results also indicate that the E3SM's current treatment of mineral dust immersion freezing in the SO is impacted by compensating biases – an underprediction of dust amount was compensated by an overprediction of its effectiveness as INPs. We also perform idealized droplet freezing experiments to quantify the implications of the time-dependent behavior assumed by the E3SM's CNT-parameterization and compare with the ice spectrometer observations. We find that the E3SM CNT 10 s diagnostic used in this study is a reasonable approximation of the exact formulation of CNT, when applied to ice spectrometer measurements in low-INP conditions similar to Macquarie Island. However, the linearized 10 s diagnostic underestimates the exact formula by an order of magnitude or more in places with high-INP conditions like the Sahara. Overall, our findings suggest that it is important to correct the biases in E3SM's simulated dust life cycle and update E3SM's INP parameterizations. INP prediction errors of 2 to 3 orders of magnitude can have considerable impacts on the simulated cloud and radiative properties in global climate models. On comparing INP concentrations during MICRE against ship-based campaigns, Measurements of Aerosols, Radiation, and Clouds over the Southern Ocean (MARCUS) and Antarctic Circumnavigation Expedition (ACE), we find that INPs from the latter are significantly higher only in regions closer to Macquarie Island. This alludes to the fact that physical, chemical and biological processes affecting INP concentrations as stimulated by the island could be partly responsible for the high INP concentrations observed at Macquarie Island during the MICRE campaign. Therefore, improvements to both aerosol simulation and INP parameterizations are required to adequately simulate INPs and their cloud impacts in E3SM. It will be helpful to include a parallel measurement of the size-resolved aerosol composition and explore opportunities for long-term measurement platforms in future field campaigns studying INP sources in remote marine regions.
- Article
(9011 KB) - Full-text XML
-
Supplement
(8865 KB) - BibTeX
- EndNote


The Southern Ocean (SO) is a pristine remote marine environment with unique microphysical cloud properties (Gettelman et al., 2020; McCoy et al., 2015; Meskhidze and Nenes, 2006; Tan et al., 2016). Southern Ocean clouds contain supercooled liquid droplets in higher fractions than is observed almost anywhere across the globe (Hu et al., 2010). The co-existence of supercooled liquid droplets and ice (mixed-phase) in these clouds is inadequately simulated in global models (Komurcu et al., 2014), introducing uncertainty into simulations of shortwave radiative flux (Vergara-Temprado et al., 2018) and cloud–climate feedbacks (Tan and Storelvmo, 2016) in this region. The supercooled liquid state is metastable, but in the absence of a mechanism to initiate freezing, supercooled water can persist in clouds at temperatures between 0 ∘C and approximately C (Koop and Murray, 2016), the homogeneous freezing temperature of water.
In the presence of aerosol particles that can nucleate ice such as dust, bacteria and fungal spores, supercooled cloud droplets can freeze into ice at warmer temperatures than required for homogeneous ice nucleation (Vali et al., 2015; Vergara-Temprado et al., 2018; Kanji et al., 2017). The aerosol particles responsible for this process of heterogeneous ice formation are called ice-nucleating particles (INPs) (Vali et al., 2015). Following the initial (or primary) formation of ice, clouds contain a thermodynamically unstable mixture of ice and supercooled liquid water. In such clouds, secondary ice production (SIP) processes contribute to the rapid multiplication of cloud ice, resulting in rapid glaciation of regions of the cloud (Crawford et al., 2012; Field et al., 2017; Korolev and Leisner, 2020). Even in clouds where SIP is responsible for a large portion of ice production, however, the cloud evolution and state may be sensitive to INP concentrations (Crawford et al., 2012; Phillips et al., 2007; Hawker et al., 2021), although this sensitivity is reduced in certain cloud regimes (Sullivan et al., 2018; Mignani et al., 2019; Miltenberger et al., 2020; Sotiropoulou et al., 2020).
The cloud phase, lifetime and radiative properties of SO mixed-phase clouds are sensitive to INP concentrations (Vergara-Temprado et al., 2018; Vignon et al., 2021). Accurate representations of INPs are therefore critical for simulating ice formation in the mixed-phase clouds that affect the aerosol–cloud interactions, radiation budget and precipitation over the SO (McCluskey et al., 2017; McFarquhar et al., 2021; McCoy et al., 2015). Despite the importance of INPs in the representation of mixed-phase clouds, knowledge about their sources, transport and seasonal variability over the SO is still uncertain. In this study, we investigate the simulated and observed variability of SO INPs active in the immersion mode, noting that of all the modes of ice nucleation, the immersion mode is the most critical for freezing in mixed-phase clouds (Hande and Hoose, 2017).
The concentration of INPs active at a specific temperature can vary over a range of up to 4 orders of magnitude across observations collected at different times and locations (Kanji et al., 2017; Welti et al., 2018). However, recent field experiments have shown that, given adequate parameterizations of INP effectiveness for the major relevant classes of INPs, the ambient concentration of INPs in the atmosphere can be predicted from observed aerosol properties with reasonable accuracy (Cornwell et al., 2019; Knopf et al., 2021). In climate models, INPs can be similarly predicted on the basis of parameterizations that are dependent on temperature, humidity and simulated aerosol properties, i.e., the size-resolved concentration of the relevant aerosol species. Accurate representation of INPs in atmospheric models will depend on both the model's fidelity in simulating relevant aerosol properties and the realism of the model's INP parameterizations.
In the SO, INPs arise from a combination of local sea spray aerosol and dust from regional and long-range transport (Twohy et al., 2021). Laboratory experiments using realistic proxies for biologically influenced sea spray particles have clearly shown that these particles can act as INPs, although IN efficiency of dust (expressed in terms of ice active-site density ns) is ca. 2 orders of magnitude more than sea spray particles for a given aerosol surface area and for temperatures colder than 263 K (DeMott et al., 2016; McCluskey et al., 2018b). Experiments that isolate specific organic molecules or ocean biota have provided hints to potential sources of these INPs (e.g., Knopf et al., 2011). Despite its weak INP effectiveness, models and field experiments indicate that sea spray is the primary source of background INPs in boundary-layer air in remote marine regions such as the SO, where continental aerosols are scarce (Burrows et al., 2013; Wilson et al., 2015; Vergara-Temprado et al., 2017; McCluskey et al., 2018a, 2019).
In addition to sea spray produced from strong surface winds, natural windblown dusts are an important source of INPs to the SO. Dust particles, which are a major global source of INPs, are 3–4 orders of magnitude more efficient as immersion freezing INPs than marine aerosols (DeMott et al., 2015; Niemand et al., 2012; Boose et al., 2016; McCluskey et al., 2018c; Cornwell et al., 2019). Therefore, transported dust, even in small quantities, likely also affects INP number concentrations in the SO. The source regions of dust transported to the SO include South America, Australia, New Zealand and South Africa (Wagener et al., 2008; Struve et al., 2020; Neff and Bertler, 2015). In addition to long-range transport, local Antarctic dust is another source in the SO during the summer. Dry deposition is a major sink for desert dust aerosols because they are mainly emitted in dry regions with weak precipitation, and their mass distribution is dominated by larger sized particles (Bergametti et al., 2018). The ability of the numerical models to simulate aerosol burdens at high latitudes depends on emissions and transport as well as wet and dry deposition (Sand et al., 2017). A study by Wu et al. (2020) found that Energy Exascale Earth System Model version 1 (E3SMv1) produces higher dry deposition than the Community Earth System Model (CESM1) for similar dust emission fluxes. Biases in dry-deposition fluxes in E3SMv1 can affect predictive skill for aerosol and INP concentrations. Witek et al. (2016) evaluated sea spray emission functions using satellite observations and found large differences between various sea spray parameterizations. These discrepancies between the model aerosol concentrations and the observations in turn affect the predictability of INP concentrations.
A handful of previous studies have evaluated INP predictability in global models, using data from short-term field campaigns (Wilson et al., 2015; McCluskey et al., 2018a). Due to the complex nature of field deployments on research vessels, most field campaigns have measured INPs only for periods of a few weeks; long-term or year-round observations of INPs are rare, especially in the high-latitude oceans. However, given the episodic nature of dust transport to the remote SO, as well as the existence of seasonal cycles in high-latitude sea spray and dust concentrations (e.g., Ito and Kok, 2017; Liu et al., 2018a), long-term observations are required to understand whether there is a strong seasonality in SO INP sources. Without such observations, it is challenging to understand and constrain the aerosol sources and processes driving seasonal INP variations in climate models.
Large uncertainties in simulated INP concentrations can contribute to uncertainties in cloud radiative properties and related climate forcing, particularly in the SO (Vergara-Temprado et al., 2017; Yun and Penner, 2012; Tan and Storelvmo, 2016). Vergara-Temprado et al. (2018) simulated INP concentrations ranging over approximately 4 orders of magnitude in marine air between 40 and 70∘ S and examined the impacts of higher INP concentrations on low-level mixed-phase clouds in the cold sectors of extratropical cyclones, simulated at high resolution. Based on their simulations, they estimated that variations in INP concentration over the SO could modulate the radiative properties of similar clouds by as much as 24–60 W m−2. Vignon et al. (2021) showed that a new immersion freezing ice nucleation parameterization based on INP measurements from the Measurements of Aerosols, Radiation and Clouds over the Southern Ocean (MARCUS) campaign improved simulations of cloud radiative effects in the presence of supercooled liquid water near cloud top in the Weather Research and Forecasting (WRF) model. Few studies have systematically (co-located in space and time) evaluated the simulated INP concentrations from climate models in the SO. Such a comparison using long-term INP observations is critical for assessing the seasonality of different INP sources and their impacts on SO clouds and energy budget.
Macquarie Island Cloud Radiation Experiment (MICRE) (2017–2018) provides a unique opportunity to advance modeling efforts regarding INP variability in the Southern Ocean and understand the atmospheric processes controlling that variability, by providing year-round, near-daily INP observations at Macquarie Island (DeMott et al., 2018a). Macquarie Island is ideal for marine aerosol sampling due to its remote location. In this study, we use aerosols simulated by the E3SMv1 model in combination with INP parameterizations for dust and sea spray aerosol to simulate INP number concentrations. We compare these with MICRE near-surface INP measurements at different temperatures.
This study focuses on two primary objectives: (1) evaluate simulated INP predictions against measurements during MICRE and (2) assess the potential causes of model–observation differences during MICRE due to missing particle sources of INPs or other model processes.
2.1 Aerosol modeling
We use the aerosol fields simulated by the E3SMv1 Atmosphere Model (EAMv1) (Rasch et al., 2019) to simulate aerosol properties and the resulting INP concentrations. EAMv1 is the atmospheric component of the E3SMv1 model (Golaz et al., 2019). The land component in these simulations uses a prescribed vegetation seasonal cycle based on satellite phenology (Lawrence and Chase, 2007). The use of EAMv1 for simulating immersion-mode INP concentrations has been demonstrated in previous studies for high-latitude regions in the SO and the Arctic (McCluskey et al., 2019; Shi et al., 2022). We use EAMv1's low-resolution configuration, which has a horizontal resolution of ca. 110 km, with 72 vertical layers extending up to 0.1 hPa (approximately 64 km). The atmosphere layer nearest to the surface is 20 m thick, with a total of 15 layers between the surface and 850 hPa, supporting an improved representation of gradients within the atmospheric boundary layer. EAMv1 uses a spectral element method to solve the atmosphere's dynamic equations on a cubed-sphere grid (Dennis et al., 2012; Golaz et al., 2019). Turbulence and clouds are parameterized using the Cloud Layers Unified by Binormals (CLUBB) parameterization (Larson et al., 2002; Larson and Golaz, 2005; Bogenschutz et al., 2013; Golaz et al., 2002). The deep-convection parameterization is based on Zhang and McFarlane (1995) with improvements by Richter and Rasch (2008) and Neale et al. (2008). We nudge the horizontal winds towards the Modern Era Retrospective-Analysis for Research and Applications reanalysis (MERRA-2) (Gelaro et al., 2017) with a 6 h relaxation timescale following Ma et al. (2015) and Sun et al. (2019).
EAMv1 uses the four-mode version of the Modal Aerosol Module (MAM4) to represent aerosol life cycles and properties (Liu et al., 2016; Wang et al., 2020). Aerosol species represented in the baseline MAM4 version include sulfate, black carbon (BC), mineral dust, sea salt aerosol, primary organic aerosol (POA), secondary organic aerosol (SOA) and marine organic aerosol (MOA). In this study, we focus on two aerosol species relevant to INPs in the SO: (1) mineral dust and (2) sea spray, which includes both inorganic (sea salt) and organic constituents (MOA). MAM4 simulates aerosol mass mixing ratios and size distributions in four lognormal modes: the (1) Aitken, (2) accumulation, (3) coarse and (4) primary carbon modes. Aerosols are internally mixed within each mode and externally mixed between modes. Individual aerosol species are included in some or all of the four modes, depending on their typical size distributions and hygroscopicity. Once emitted, aerosol species undergo horizontal transport and vertical mixing, chemical and microphysical transformation processes (e.g., condensation, coagulation), dry deposition and wet scavenging.
Emission fluxes of natural dusts are calculated using the Dust Entrainment and Deposition (DEAD) model as a function of wind speed, friction velocity and surface erodibility (Zender et al., 2003; Mahowald et al., 2006). Anthropogenic dust emissions associated with activities such as agriculture and off-road vehicle activity are not represented. The size distribution of emitted dust particles is prescribed, with a mass fraction of 3.2 % in the accumulation mode [0.1 to 1 µm] and 96.8 % in the coarse mode [1 to 10 µm]. Comparison of E3SMv1 dust concentrations with CESM1 and CESM2 has shown that E3SMv1 underestimates the coarse-mode dust lifetime, which may be mainly due to increased dry deposition in the thinner bottom layer of the model (Wu et al., 2020). However, E3SMv1 emits more dust than CESM1 and CESM2 in the accumulation mode. As a result, dust optical depth (DOD) in E3SMv1 is higher than in CESM but lower than lidar satellite retrievals (Wu et al., 2020). As a consequence of the short dust lifetime, dust transport to the remote Arctic and SO is underestimated by the model.
Sea spray emission fluxes are simulated in the Aitken, accumulation and coarse modes as a function of near-surface wind speed and prescribed sea surface temperature, with a prescribed emission size distribution (Mårtensson et al., 2003; Monahan, 1986). MOA emissions, and the variations in these emissions associated with ocean biological activity, are simulated using the Organic Compounds from Ecosystems to Aerosols: Natural Films and Interfaces via Langmuir Molecular Surfactants (OCEANFILMS) parameterization (Burrows et al., 2022a). In the EAMv1 implementation of OCEANFILMS, the main impact of the simulated MOA is to elevate the total emitted sea spray particle number and mass in specific regions and seasons where the parameterization predicts increased organic fractions in accumulation-mode sea spray particles. In an early version of E3SM, the OCEANFILMS parameterization produced statistically significant regional effects at high latitudes in both hemispheres, including 20 %–50 % increases in cloud condensation nuclei concentrations (at a supersaturation of S=0.1 %) across most of the SO (Burrows et al., 2022a).
2.2 Calculating INP concentrations
In this study, we compare INP concentrations calculated by E3SM's default parameterizations with more recent parameterizations that have a stronger empirical basis; i.e., they are based on measurements of ambient (rather than laboratory-generated) particles and on a larger number of measurements.
Heterogeneous ice nucleation occurring in mixed-phase clouds is currently represented in EAMv1 for dust and BC aerosols using classical nucleation theory (CNT) (Hoose et al., 2010; Wang et al., 2014). EAMv1 does not include marine aerosols as INP sources in CNT. In this study, we calculate INP concentrations at measurement temperatures using the aerosols simulated by E3SM at the model's surface layer.
Because smaller dust particles may not be effective INPs, we adopt DeMott et al. (2015) (hereafter D15) to simulate the immersion-mode dust INPs for particles larger than 0.5 µm. For predicting sea spray INPs, we use a parameterization based on the surface active-site density of sea spray aerosol (SSA), which was developed using observations under clean conditions at a coastal site in Ireland (McCluskey et al., 2018c) (hereafter M18). For INP contributions from MOAs, we use the Wilson et al. (2015) parameterization (hereafter W15), which assumes that the INP number concentrations are directly proportional to the amount of organic carbon in the SSA. W15 was originally developed using droplet samples from the sea surface microlayer and the subsurface water in the Arctic and Atlantic oceans. We apply these parameterizations to the relevant aerosol fields simulated by the E3SMv1 model (see Sect. 2.1). The different empirical INP parameterizations used in this study and their limitations are summarized in Table S1 in the Supplement.
To compare with measured INPs, we modified the heterogeneous ice nucleation module in E3SMv1 to output additional diagnostic variables that use measurement temperatures instead of ambient temperatures to calculate the INP concentrations [m−3] at the surface (see Eq. 1). While the default immersion freezing parameterizations in E3SMv1 treat both dust and BC, we focus only on dust INPs here since the contribution of BC to immersion-mode ice nucleation in the SO atmosphere is negligible (Kanji et al., 2020).
In the E3SMv1 implementation of CNT, the change in cloud ice crystal number concentration due to immersion freezing on dust, Nimm,dust [m−3 s−1], during the model time step Δt, is calculated as
where Naer,dust [m−3] is the total (cloud-borne and interstitial) dust number concentration in accumulation and coarse modes (ice-borne aerosol is not tracked in the model), and Jimm,dust [s−1] is the heterogeneous nucleation rate for dust calculated as a function of modal radii of dust, raer, and model's ambient temperature, Tambient. Analogous relationships are implemented for each ice-nucleating species and freezing mode handled by the CNT scheme.
We calculate a diagnostic that uses the measurement temperature and an assumed measurement timescale:
A notable feature of Eq. (1) is that the freezing rate is non-linearly dependent on time. Therefore, the number of freezing events that occur during a particular time interval is sensitive to the model's discretization of time, i.e., to the length of the time step. All else being equal, a reduction in model time step would be expected to increase heterogeneous freezing. By implementing CNT in Community Atmospheric Model version 5 (CAM5) mode, Wang et al. (2014) showed that this time step dependence is small at timescales close to the E3SMv1 model time step (1800 s), for typical conditions. However, such a time step dependence of CNT in E3SMv1 is still unclear and requires future investigation.
Since observational timescales are much shorter – on the order of a few seconds – the values of calculated following Eq. (2) have a significant sensitivity to the assumed timescale. In this study, we use tmeasurement=10 s, following the approach used in other similar model evaluation exercises (for example, Wang et al., 2014). We also assume that all dust particles are equally likely to participate in ice nucleation, which is also an assumption used in Hoose et al. (2010) and Wang et al. (2014). Under these assumptions, we calculate and output at several measurement temperatures. The addition of these diagnostic outputs does not modify the simulation results.
2.3 INP observations
We use INP measurements from the MICRE campaign that was conducted between April 2016 and March 2018. This campaign was a joint effort by the Australian Antarctic Division (AAD), Bureau of Meteorology, the Commonwealth Scientific and Industrial Research Organization (CSIRO) and US Department of Energy Atmospheric Radiation Measurement (DOE-ARM) to address the current observation gaps that limit evaluation of cloud properties over the SO in climate models. Immersion-mode INP number concentrations were collected for the second year of MICRE adjacent to the cloud, precipitation, aerosol and radiation instruments (McFarquhar et al., 2021; Tansey et al., 2022).
Measurement samples were collected and averaged for a period of 2–3 d at the Macquarie Island location [54.49∘ S, 158.93∘ E] in the remote SO. All measurements were made at an altitude of ca. 4 m above mean sea level (a.m.s.l.), and the sampler was located inside the enclosure (DeMott et al., 2018a). Filters were processed using the Colorado State University ice spectrometer (McCluskey et al., 2018a) to obtain temperature spectra of immersion freezing INP concentrations from −28 to 0 ∘C (DeMott et al., 2018a). Particle samples collected on filters were immersed in purified water and shaken to create suspensions for immersion freezing measurements. In this standard technique, the tray was inserted into an aluminum block and cooled until the samples were frozen. Concentrations of INPs were calculated at different temperatures using the fraction of unfrozen wells per given temperature (Beall et al., 2017; Vali, 1971). Uncertainty ranges in measured INP concentrations were calculated using Poisson counting statistics (McCluskey et al., 2017).
MICRE produced the first dataset of long-term INP number concentrations over the SO (DeMott et al., 2018a). Long-term INP datasets like MICRE are a valuable resource for evaluating model estimates of seasonal and day-to-day variability in INP number concentrations over large, pristine marine environments (McFarquhar et al., 2021). Aerosol measurements from MICRE were limited. Number concentrations of sub-micron aerosols using condensation particle counter (CPC) and cloud condensation nuclei (CCN) were directly measured. However, since CPC and CCN counts are dominated by smaller, soluble particles that do not contribute significantly to INPs, we do not expect these instruments to provide an informative measure of the particles that drive INP concentrations.
2.4 Model experiment design
We ran E3SMv1 model simulations from October 2015 to October 2018 with horizontal winds nudged using the Modern-Era Retrospective Analysis-2 (MERRA-2) (Gelaro et al., 2017). Nudging was applied to the entire vertical domain. The model simulation period was chosen to correspond to the time period of the MICRE campaign and other aerosol evaluation datasets used in this study. The first 2 months of the simulation was treated as spin-up and excluded from our analysis. Control simulations (hereafter CTL) use default dry deposition in MAM4 as described in Zhang et al. (2001). Model fields in a cubed-sphere grid are remapped to the latitude and longitude domain and co-located spatially (nearest grid cell in the model to the Macquarie Island location) and temporally (taking the average of the same days used for INP calculations from observations) with measurements. The aerosol number and speciated mass concentrations are prognostically simulated at 30 min intervals, and the model fields are written as 6 h instantaneous outputs at a horizontal resolution of approximately 1. The cloud microphysics (Gettelman et al., 2015) in E3SMv1 uses freezing tendencies calculated for each model grid box on the basis of the simulated aerosol population and ambient state variables (temperature, pressure and specific humidity). However, measurements of INPs are typically performed across multiple temperatures and are reported as a function of the instrument temperature rather than the ambient temperature. In order to compare the model simulations of INPs from CNT against the in situ measurements, we added diagnostic variables in the model to simulate immersion-mode freezing rates and INP concentrations at measurement temperatures. These diagnostic variables are not passed to the cloud microphysics module and do not change the simulation.
2.5 Sensitivity experiments
2.5.1 Dry deposition
An additional sensitivity simulation is conducted where we revise the coefficients in the model's particle dry-deposition parameterization following Emerson et al. (2020) (hereafter EXP). The revised coefficients were shown by Emerson et al. (2020) to produce dry-deposition fluxes that showed better agreement with observed fluxes over several land use categories, with some of the largest changes occurring over the ocean. Emerson et al. (2020) showed that GEOS-Chem simulations of coarse-mode particles between 2 and 10 µm increased over the oceans using the new coefficients for dry deposition. While many processes contribute to the model bias in INP concentrations, we focus on the role of dry deposition in this study because it is the dominant removal mechanism for coarse-mode particles.
2.6 Comparison to in situ aerosol observations
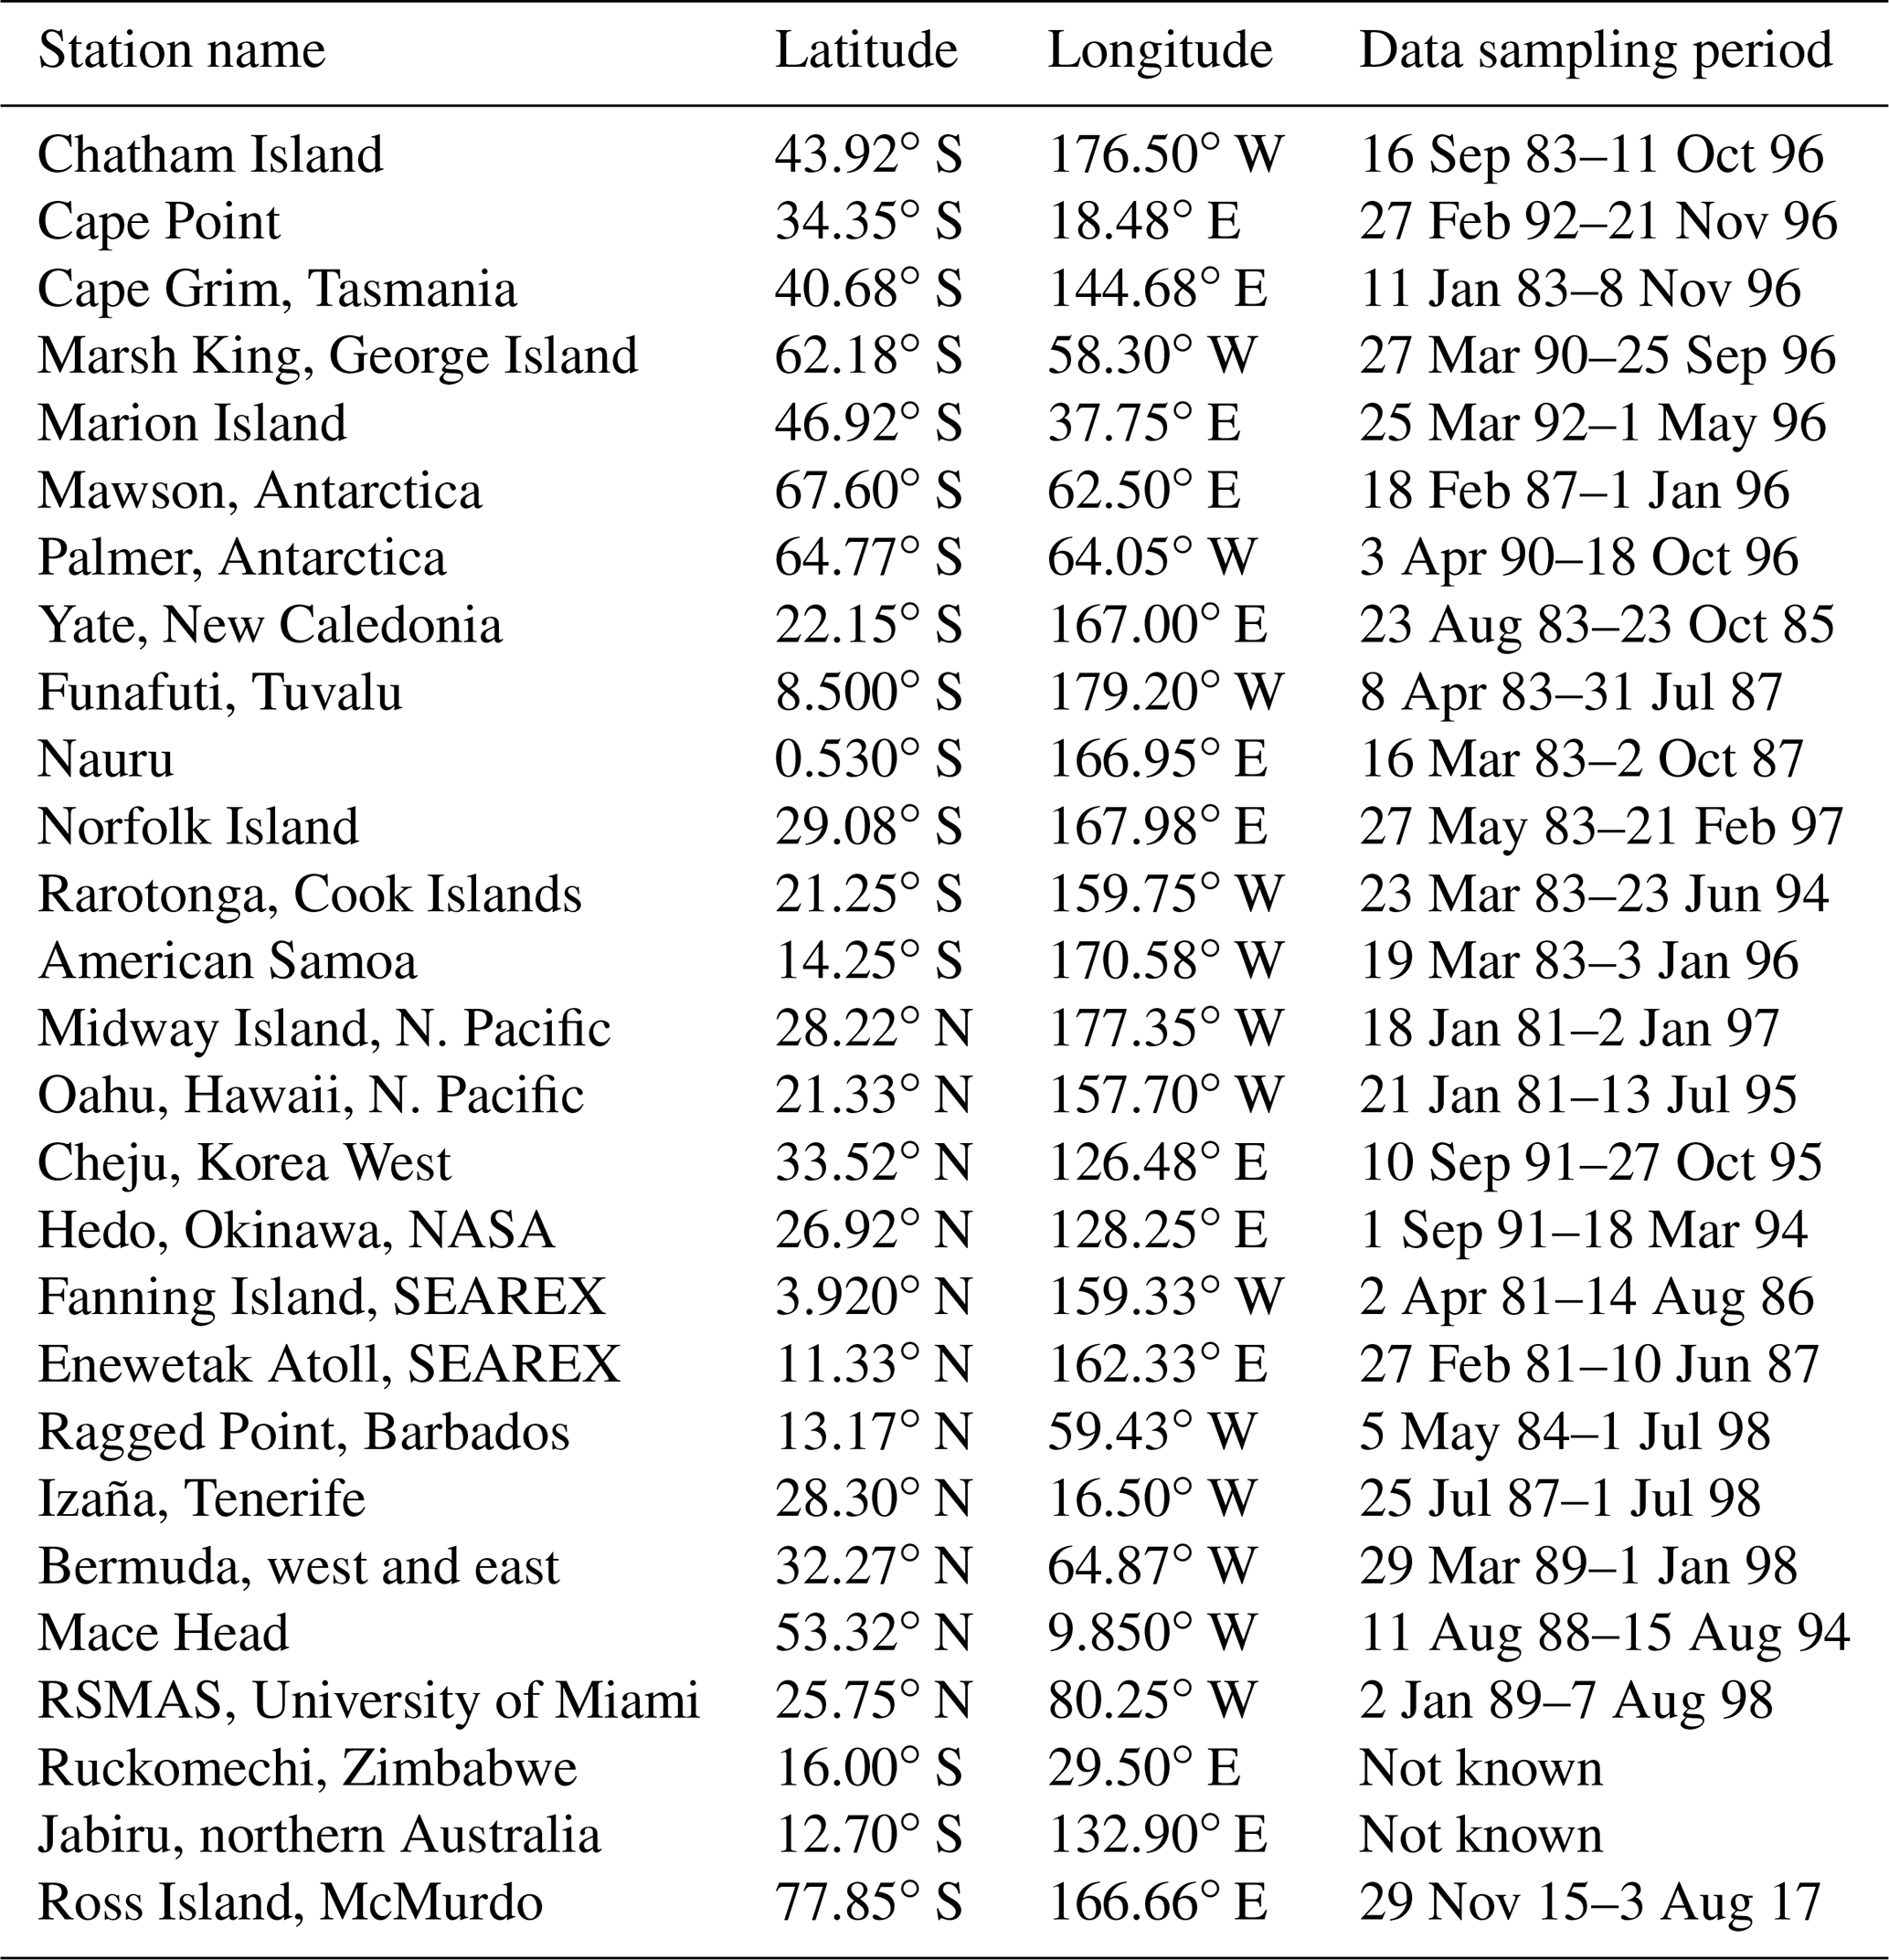
Very limited long-term measurements are available for evaluation of simulated aerosol concentrations in the SO. Because MICRE does not provide aerosol information, we compare modeled dust and sea salt concentrations with climatological measurements from University of Miami coastal stations. The sampling time period varies between the stations. We compare observed values with simulated values from the model grid cell closest to the measurement location. The geographic locations of stations used in this study are shown in Fig. 1, and their coordinates and measurement time periods are listed in Table 1. These measurements are not constrained by a upper cut-off radius (Spada et al., 2015).
In addition to the long-term climatological dataset from the University of Miami, we also evaluate the model results using year-long measurements of aerosol elemental composition from the DOE-ARM West Antarctic Radiation Experiment (AWARE). AWARE collected samples at McMurdo station, Antarctica (77.84∘ S, 166.68∘ E) located at the southern tip of Ross Island, from November 2015–December 2016. X-ray fluorescence was used to derive elemental composition of minerals, including Na, Mg, Al, Si, P, S, Cl, K, Ca, Ti, V, Cr, Mn, Fe, Co, Ni, Cu, Zn, Br, Rb, Sr, Zr, Ag, Pb and Ba (Liu et al., 2018a). We derive concentrations of MgCO3, Al2O3, SiO2, K2O, CaCO3, TiO2, Fe2O3, MnO and BaO from these elemental compositions to calculate dust mass concentrations following Usher et al. (2003).
To evaluate the vertical distribution of dust and sea salt aerosols, we use aerosol mass concentrations from aircraft measurements made during the Atmospheric Tomography Mission (ATom) mission using the Particle Analysis by Laser Mass Spectrometry (PALMS) instrument (Froyd et al., 2019). The PALMS instrument measures aerosol particles in the size range from ca. 100–5000 nm, and particles are classified into several composition types, including mineral dust and sea salt. While the entire time period for the ATom campaign does not overlap with MICRE, we use some flight tracks from ATom for February and October of 2017 that overlap with the MICRE campaign.
To assess the predictive skill of simulated INP concentrations in near-surface air, we use a set of standard skill scores outlined by the Monitoring Atmospheric Composition and Climate (MACC-II) project model evaluation methods (Cuevas et al., 2015; Eskes et al., 2015; Huijnen and Eskes, 2023). The modified normalized mean bias (MNMB), Pearson's correlation coefficient, fractional gross error (FGE), and percentage of data points within a factor of 2 (2×) and 10 (10×) from the observations are used to assess E3SMv1 INP concentrations. McCluskey et al. (2019) used MNMB and FGE to assess the model's ability to simulate INP concentrations observed in Mace Head and the SO. We define MNMB and FGE in Eqs. (3) and (4) respectively. In both these metrics, the differences between the observed and predicted INPs are normalized by the sum of observed and predicted INP concentrations. Both are symmetric; MNMB ranges from −2 to 2, and FGE ranges from 0 to 2. Because they are normalized, both these metrics avoid enormously high values in cases where model–observation differences go up to several orders of magnitude.
where INPO(T) is a set of observed INP concentrations at the measurement temperature T, INPP(T) is a set of predicted INP concentrations from the model for temperature T using different INP parameterizations and Ntot is the total number of model–observation pairs.
Table 1Location and data collection period of the ground stations used in this study for dust and sea salt concentrations.
3.1 Evaluation of E3SMv1 aerosol concentrations
Figure 2 compares measured and simulated dust concentrations at Cape Grim, Cape Point, Ruckomechi, Palmer station, Mawson station and McMurdo station in Ross Island. All in situ locations in Fig. 2 except McMurdo station compare the model with long-term climatological means from the University of Miami measurement network. At McMurdo station, we evaluate monthly means for 2015–2016 using the AWARE field campaign measurements. In the SH, E3SM CTL simulations underestimate dust concentrations by 1 to 2 orders of magnitude, especially at high-latitude stations such as McMurdo station, Palmer and Mawson, Antarctica. Substantial underestimation of dust in remote regions is a common problem across many climate models (Adebiyi and Kok, 2020; Huneeus et al., 2011; Wu et al., 2020) and may be caused by problems with model source terms, simulated transport, loss processes, dust size distribution or numerical issues (Schutgens et al., 2020). For additional context, we also show evaluation results from stations in the Northern Hemisphere (NH) in Figs. S1 and S2. The model overestimates dust in the NH for the in situ stations in University of Miami; Ragged Point, Barbados; Oahu; Izaña, Tenerife; Fanning Island; Bermuda East; Cheju (except August and September); and Midway Island.
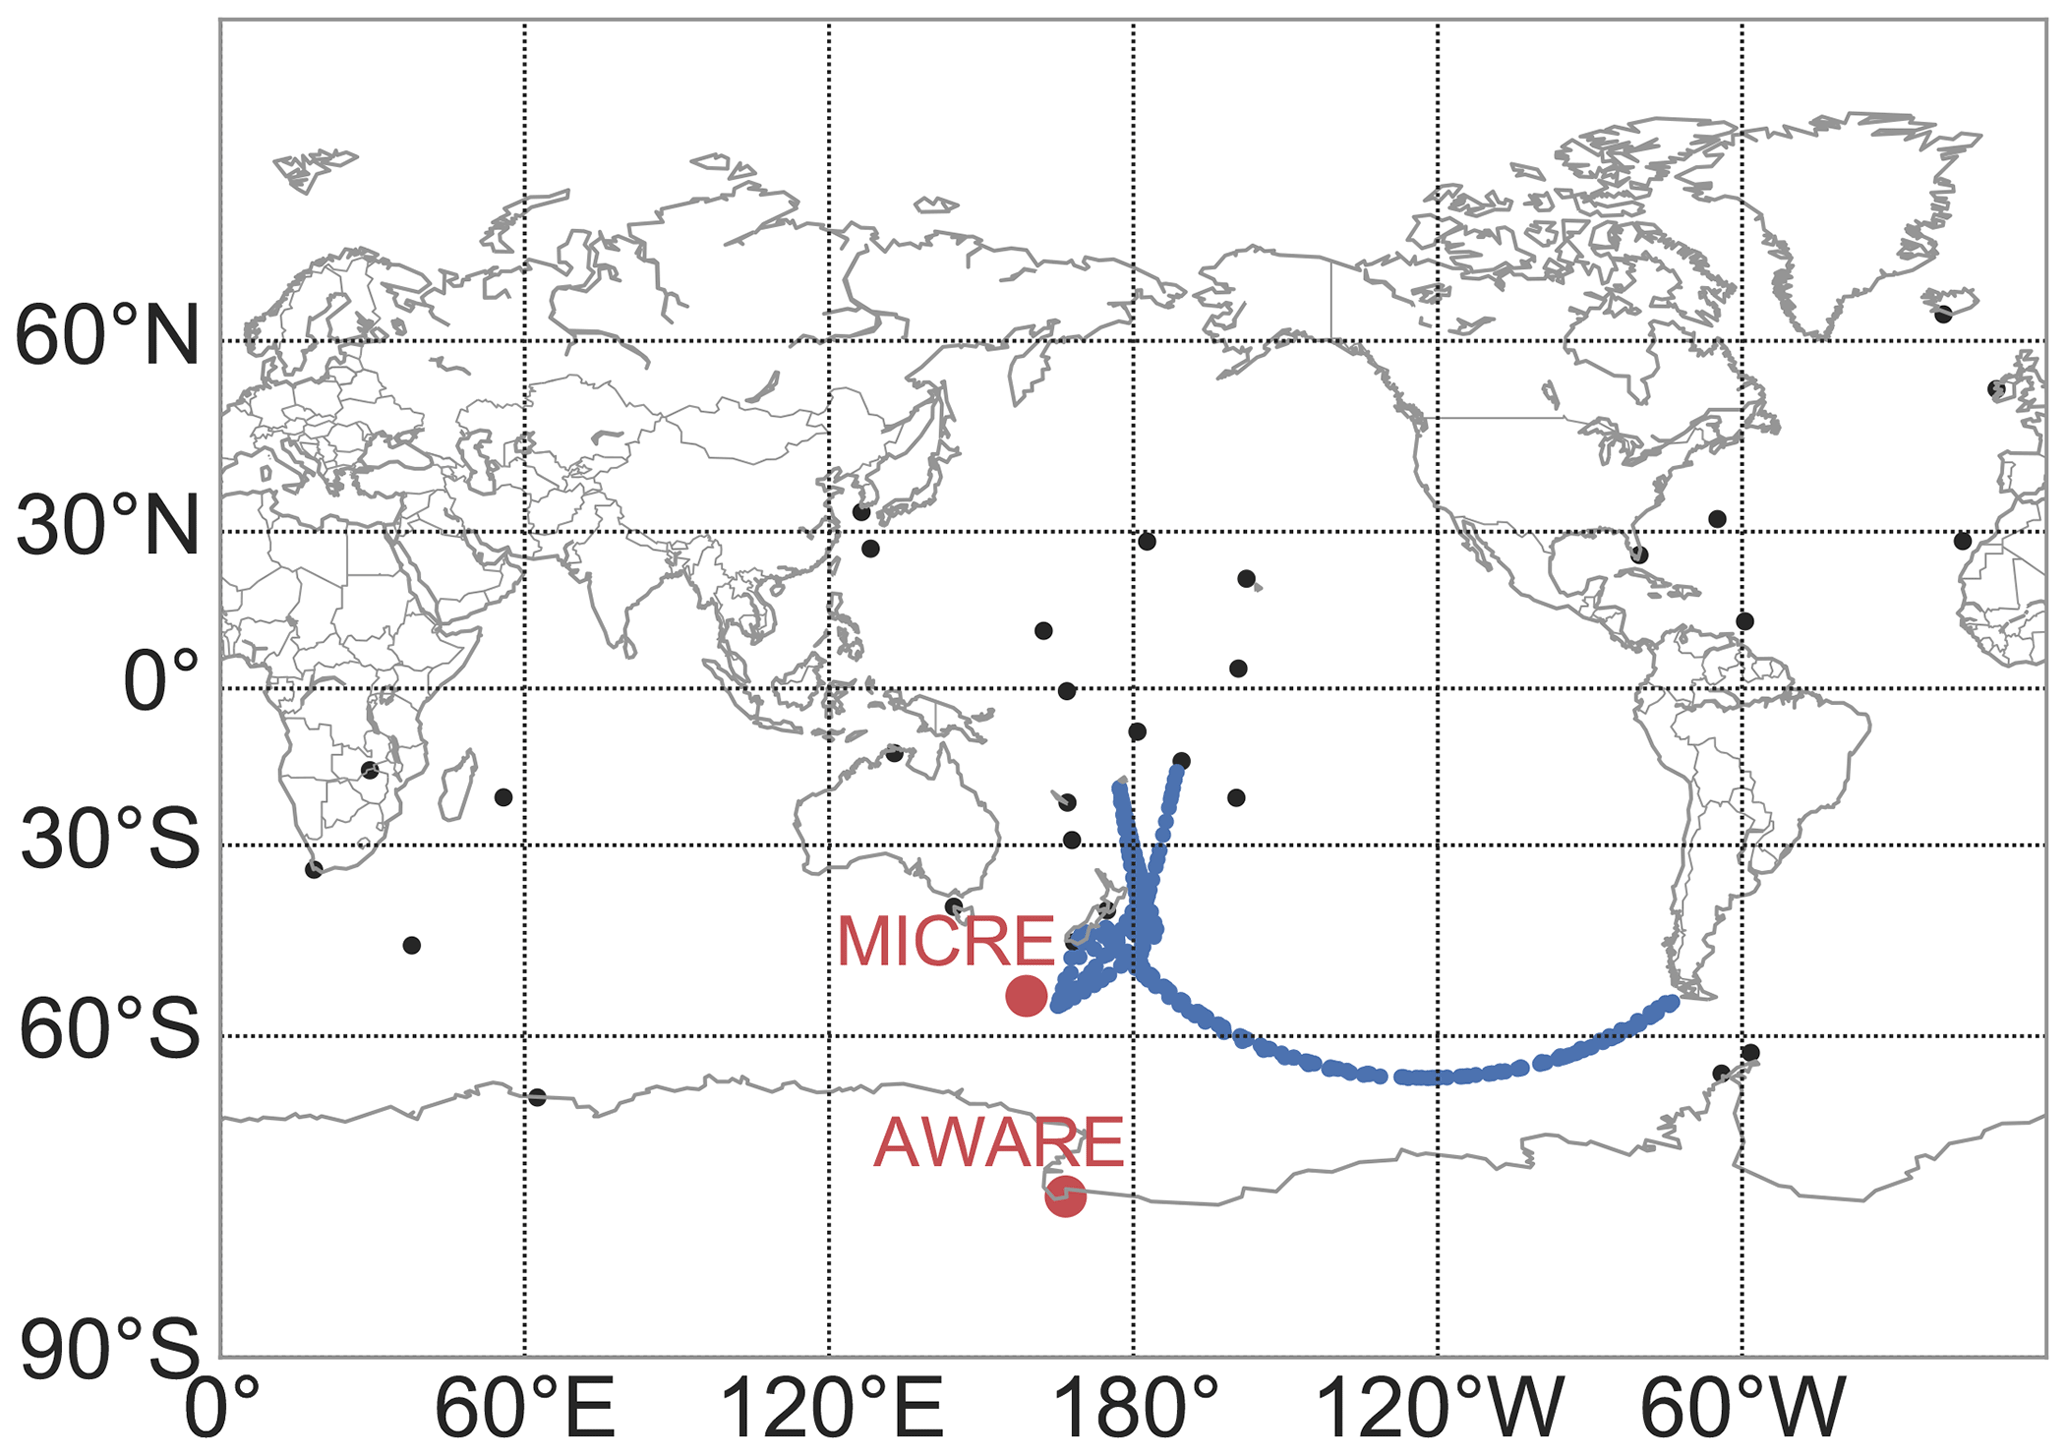
Figure 1The geographic locations of the ground observational stations used in this study for evaluating model aerosol concentrations. Descriptions of these stations can be found in Table 1. Also shown are the sampling locations for the MICRE and AWARE campaigns (red) and ATom flight tracks (blue).
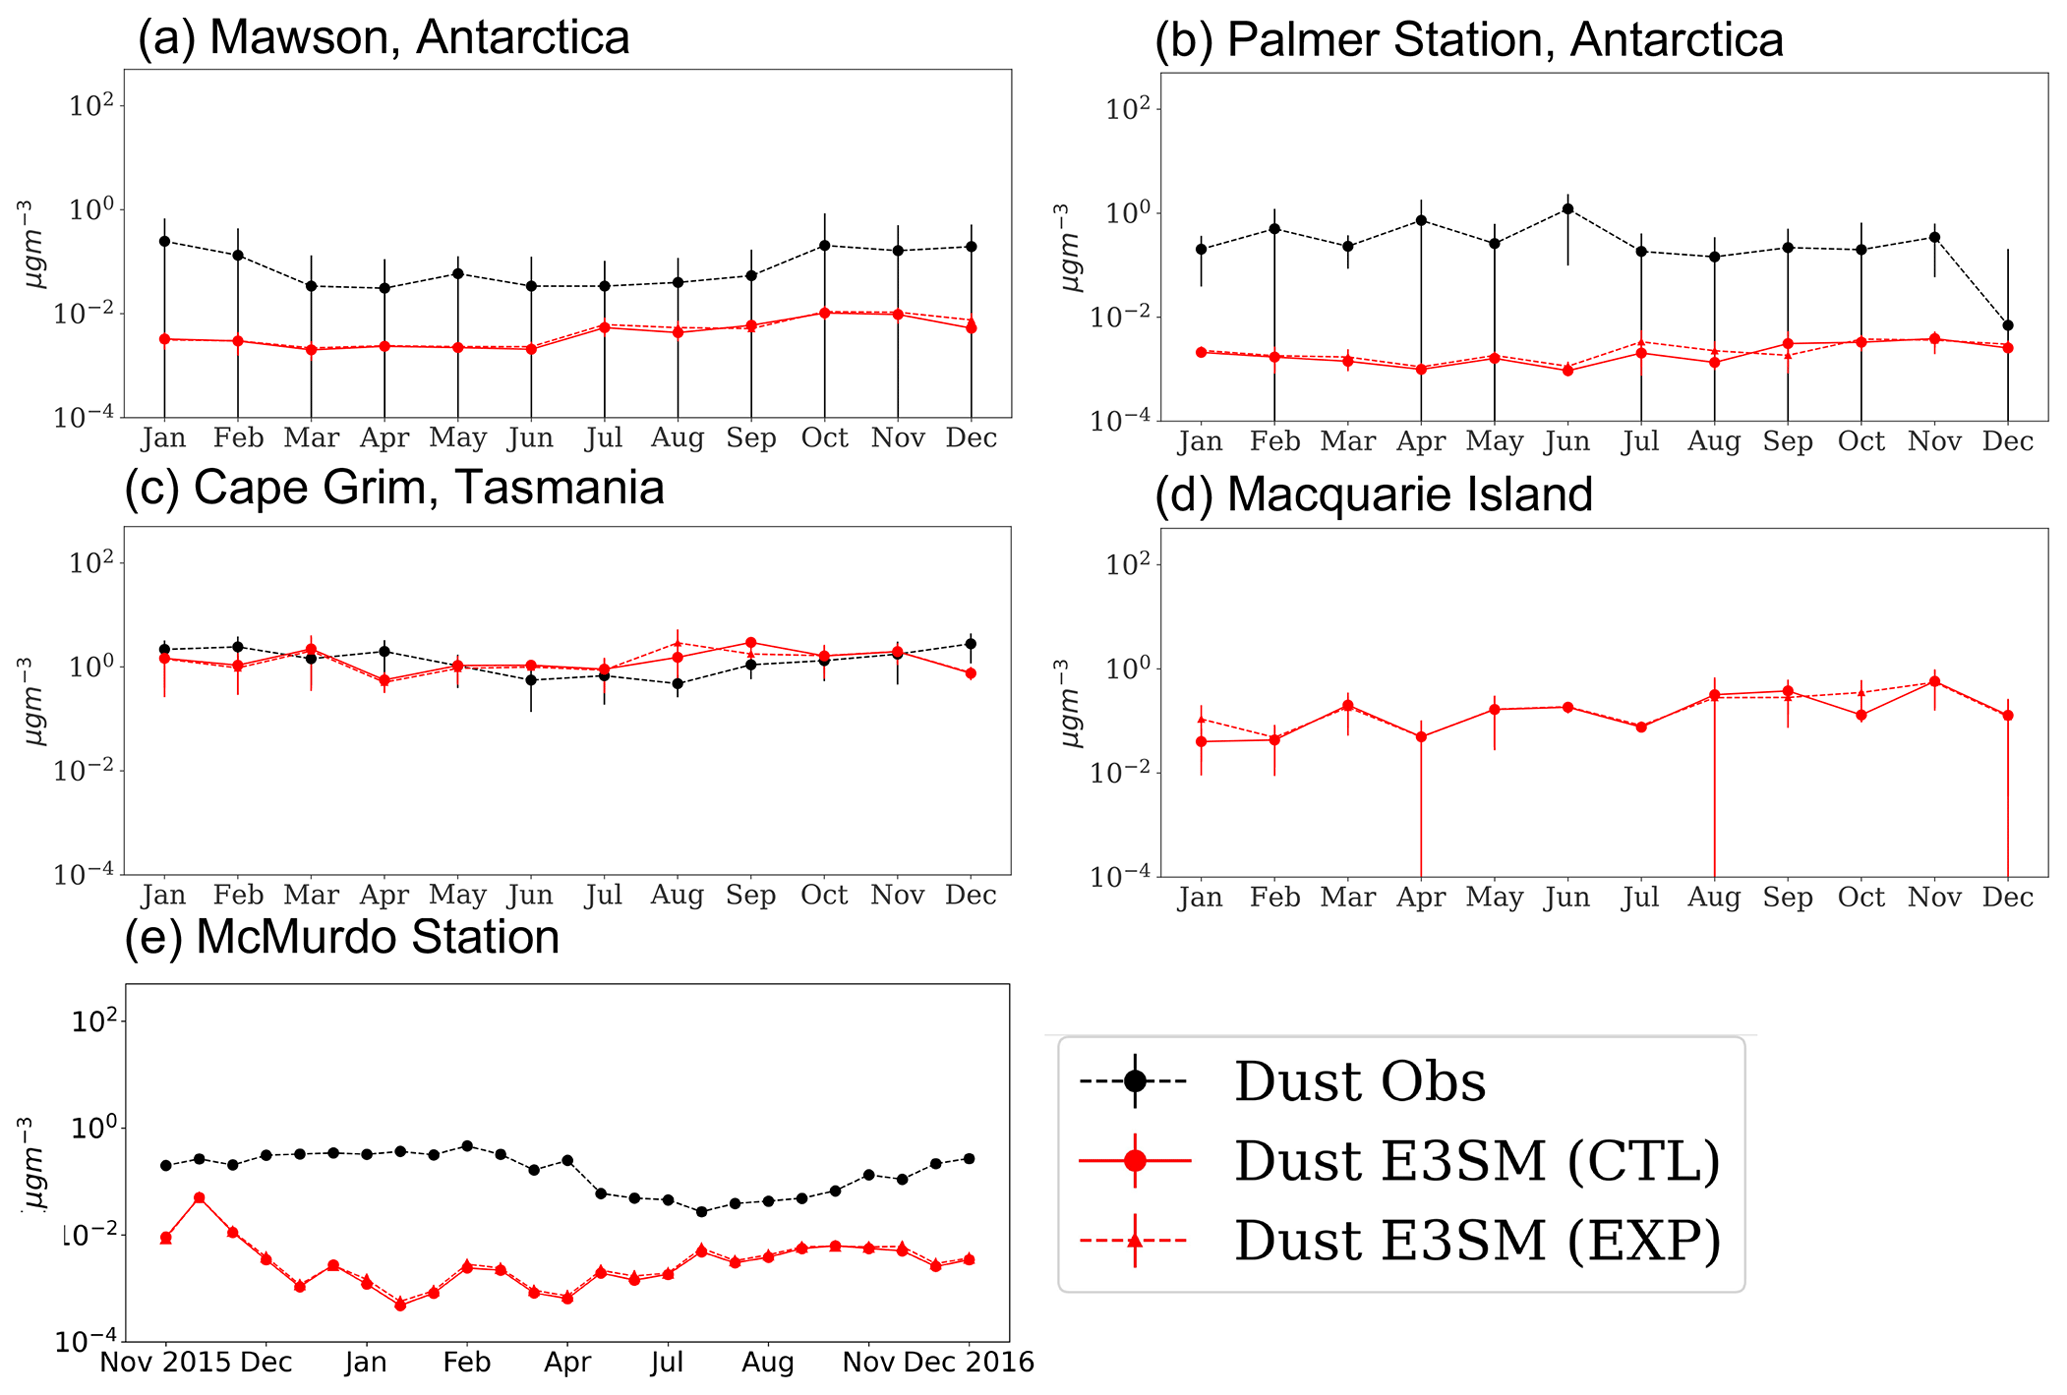
Figure 2Climatology of dust concentrations from ground stations in the Southern Hemisphere (SH) compared against E3SMv1 aerosol climatology. Ground stations and their locations are listed in Table 1. Model aerosol concentrations were derived from monthly average dust concentrations for the period 2016–2018. Error bars in the model represent standard deviation of dust aerosol mass concentrations for 2016–2018. Error bars in the observations for each ground station represent standard deviation of measurements for the period shown in Table 1. Both CTL and sensitivity simulations (EXP) are shown for comparison with observations. Also shown are the E3SM-simulated dust climatology at Macquarie Island and time series of dust concentrations from the AWARE field campaign with co-located E3SM model simulations.
Turning to sea salt, Fig. 3 shows a model overestimation by at least an order of magnitude at Mawson and McMurdo station in Antarctica, whereas it underestimates sea salt in Cape Grim and Palmer station. The model also underestimates sea salt climatology by 1–2 orders of magnitudes in the NH stations (Fig. S2).
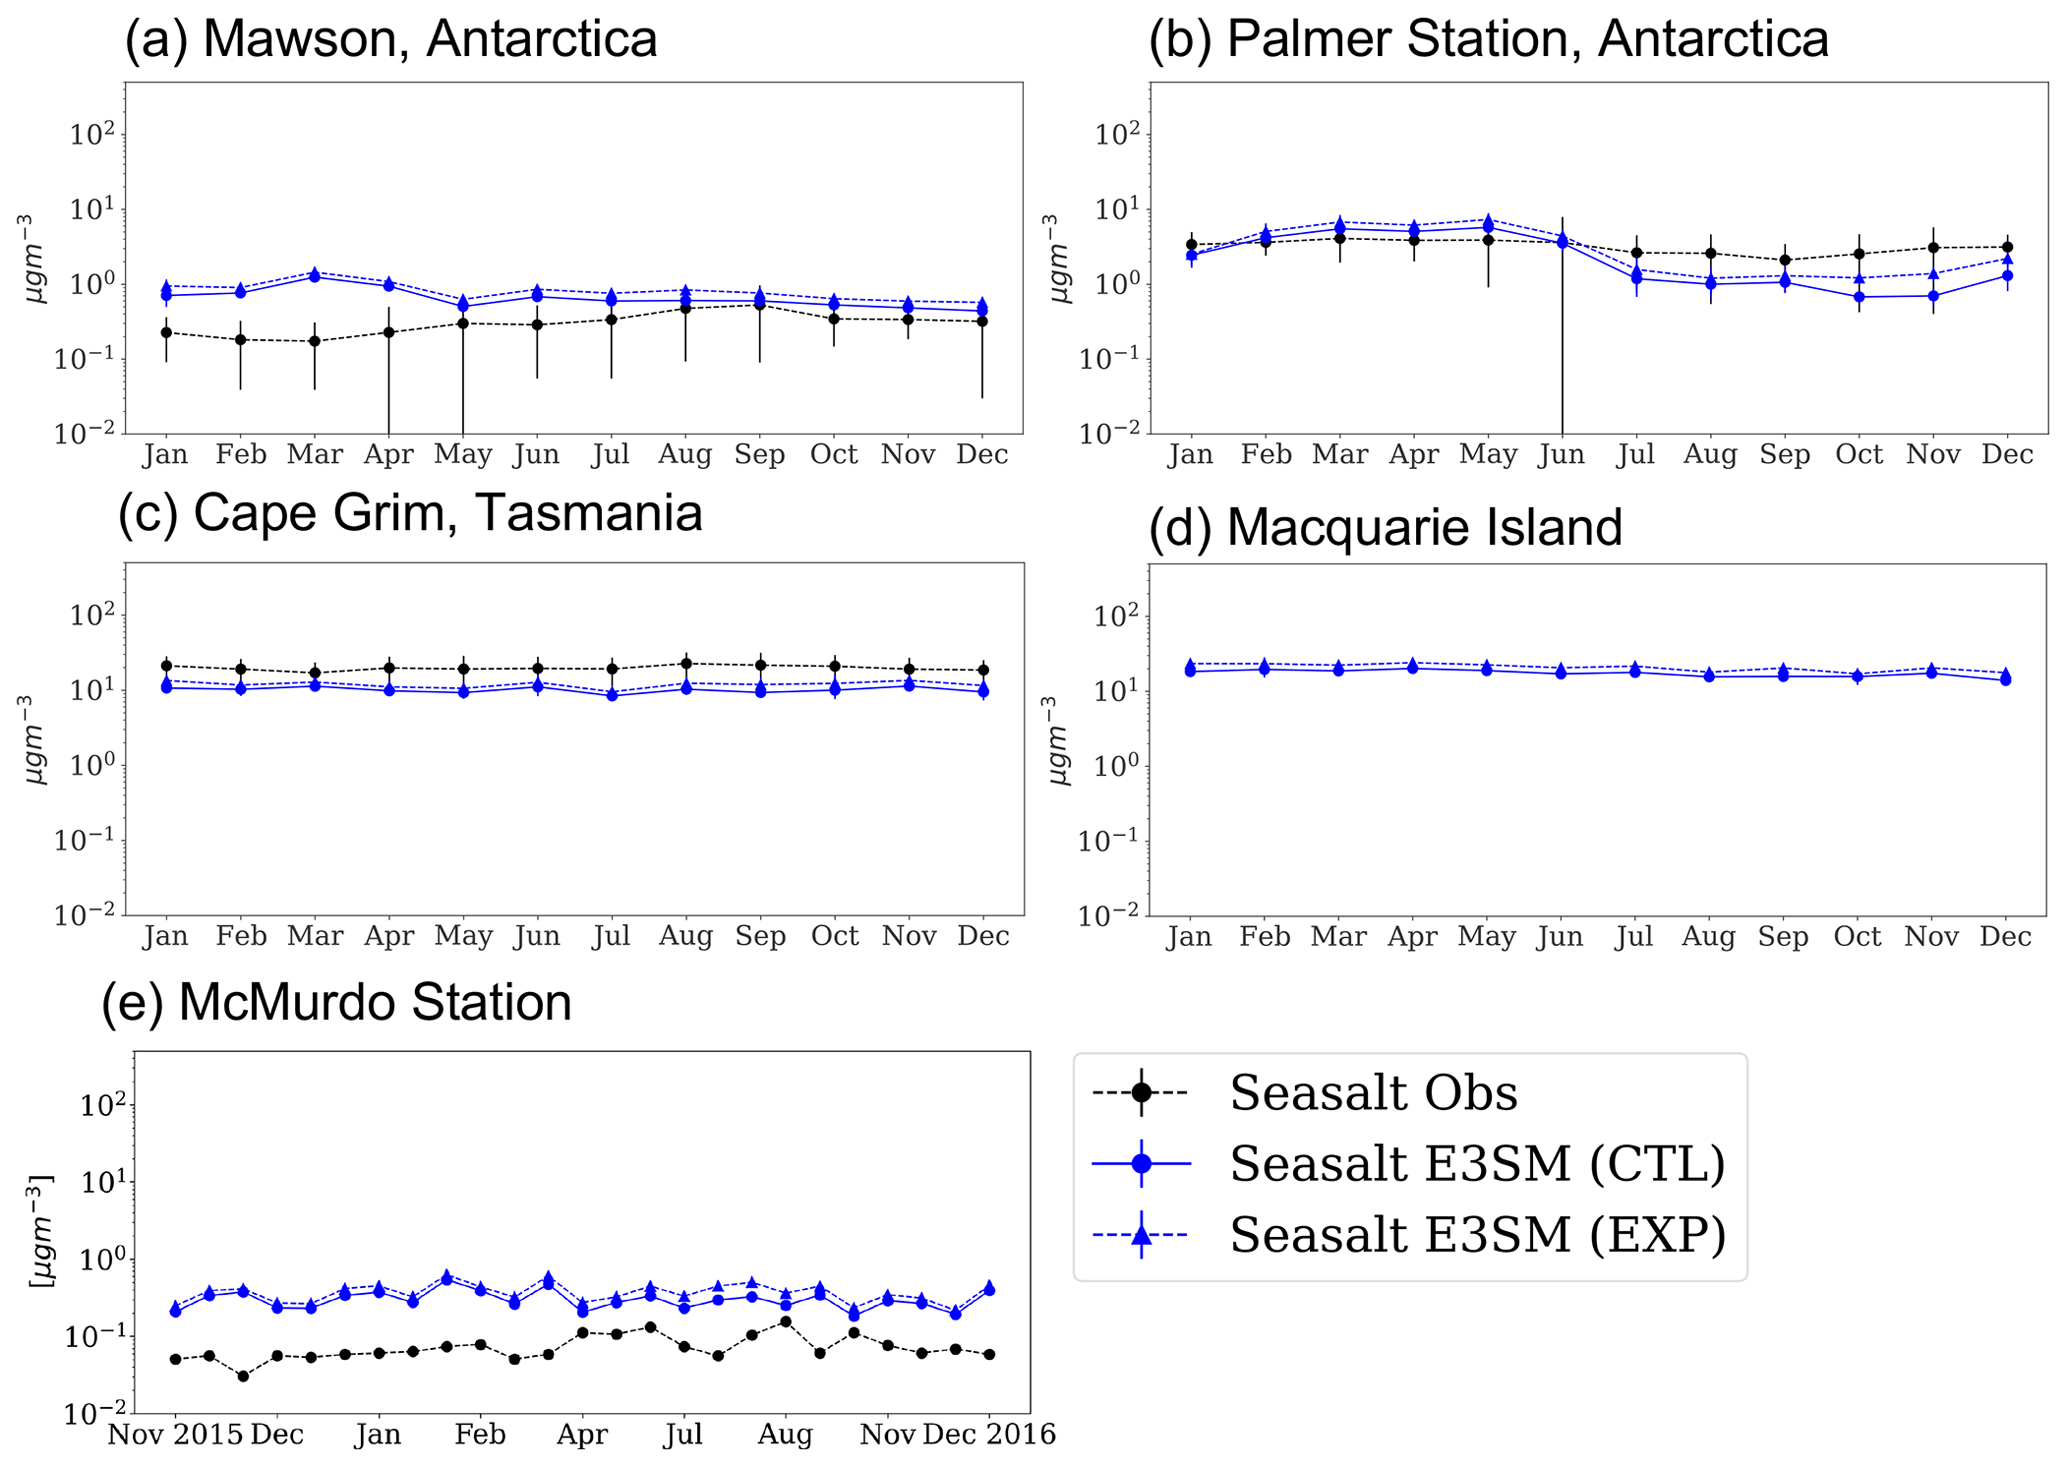
Figure 3Climatology of sea salt concentrations from ground stations in the Southern Hemisphere (SH) compared against E3SMv1 aerosol climatology. Ground stations and their locations are listed in Table 1. Model aerosol concentrations were derived from monthly average sea salt concentrations for the period 2016–2018. Error bars in the model represent standard deviation of aerosol mass concentrations for 2016–2018. Error bars in the observations for each ground station represent standard deviation of measurements for the periods shown in Table 1. Both CTL and sensitivity simulations (EXP) are shown for comparison with observations. Also shown is the E3SM-simulated sea salt climatology at Macquarie Island.
We considered whether these biases in dust and sea salt simulation might be caused by model biases in simulation of dry deposition, by examining the model's response to adjusted dry0deposition coefficients in the EXP sensitivity case. Dry deposition is a major loss process for super-micron aerosol, and the parameterization of dry deposition used in E3SM was recently shown to overestimate deposition to the ocean (Emerson et al., 2020). This adjustment does not yield significant improvements to dust and sea salt concentrations in SH high-latitude sites. Dust and sea salt budgets from CTL and EXP simulations are provided in Table 2. Using revised dry-deposition coefficients does not significantly improve the dry-deposition flux for dust or sea salt.
While this adjustment affects the dust life cycle, quantifying the causes of biases in dust and sea salt aerosols in E3SMv1 requires further investigation of other sources such as missing emission hotspots (recently shown to be important for high-latitudes (Neff and Bertler, 2015; Bullard, 2017)), loss processes (wet scavenging by precipitation and dry deposition to surfaces), uncertainties in wind-driven dust emissions (Gliß et al., 2021) and numerical diffusion (Ginoux et al., 2004).
Table 2Global aerosol budget: CTL and EXP E3SMv1 simulations.
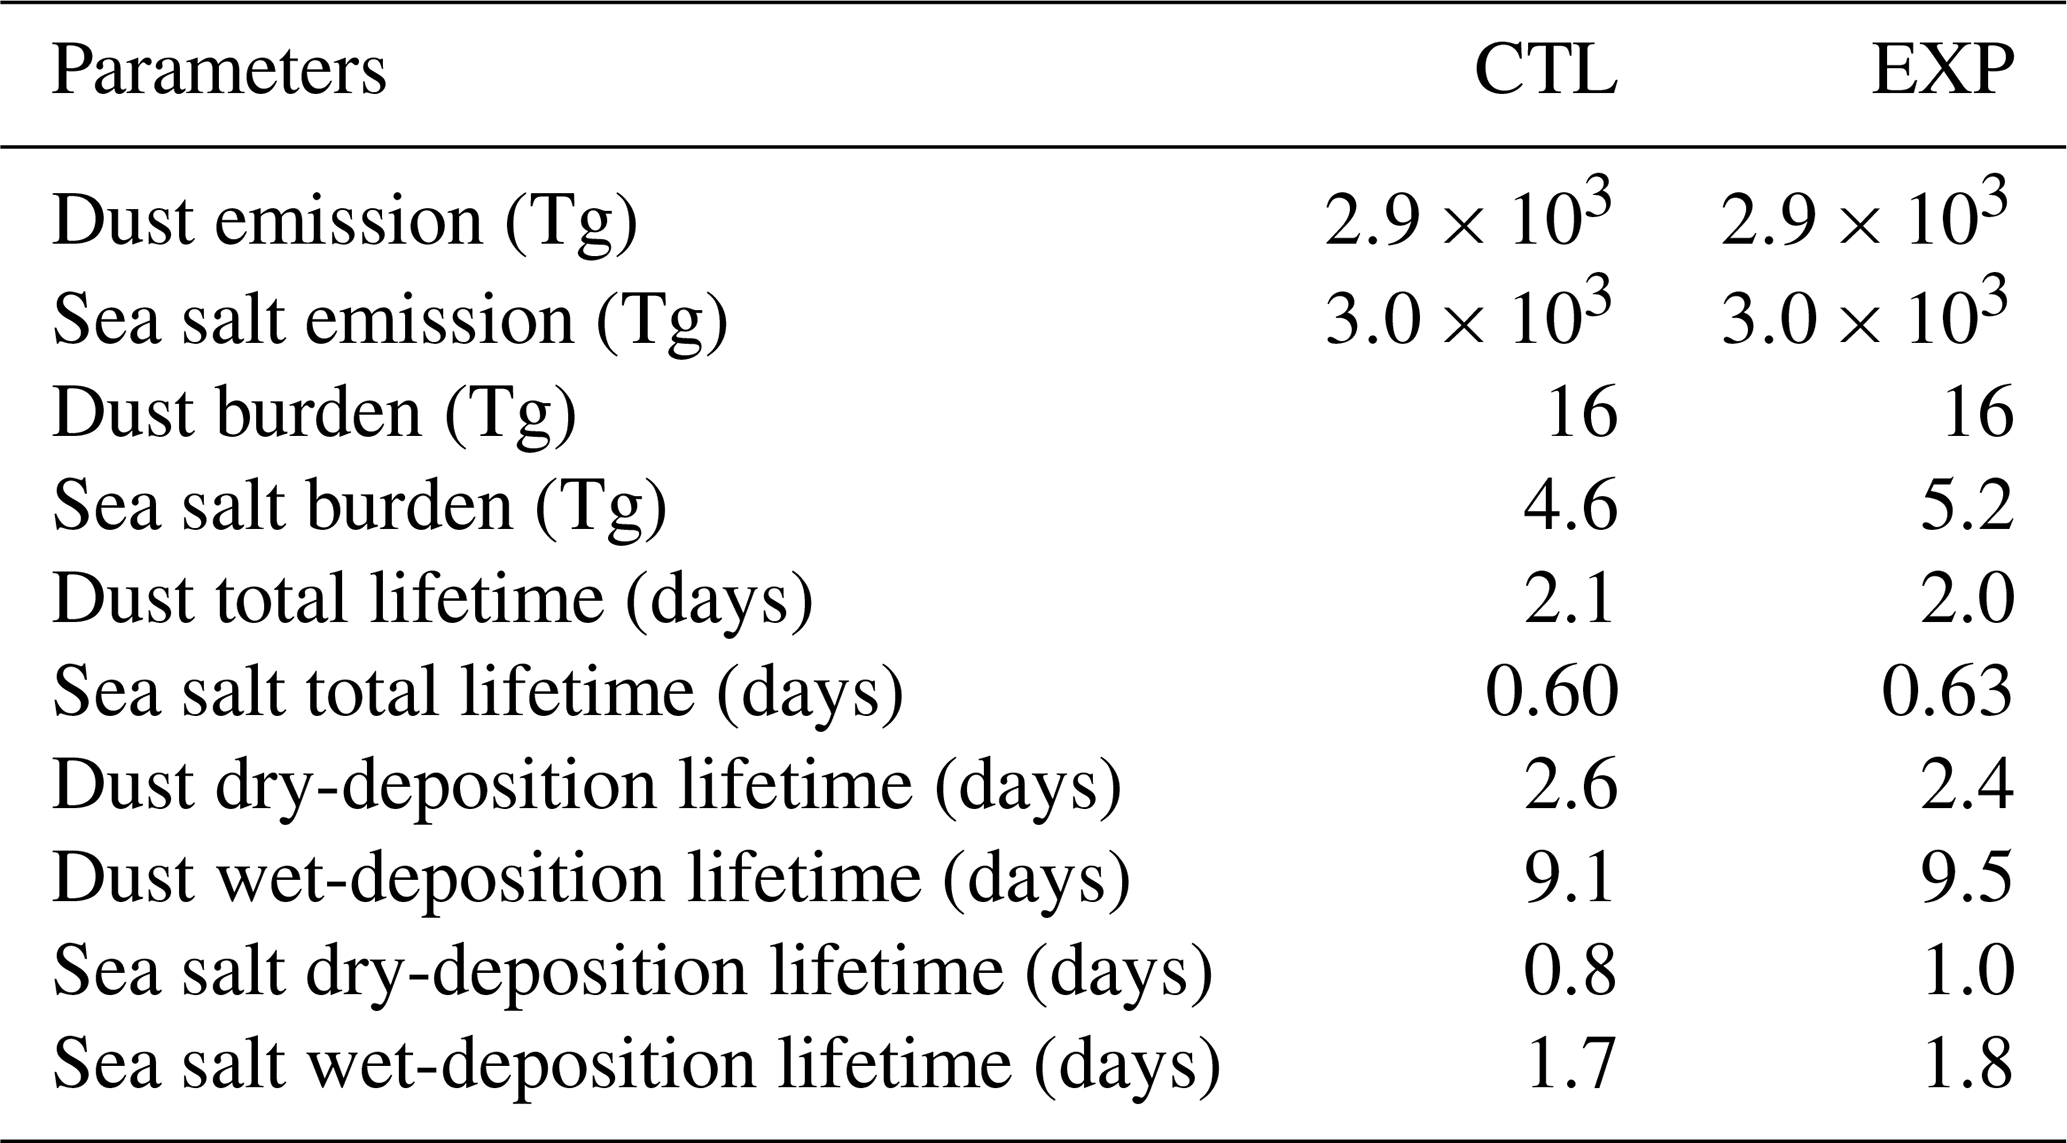
EXP is the experiment with the dry-deposition parameterization following Emerson et al. (2020).
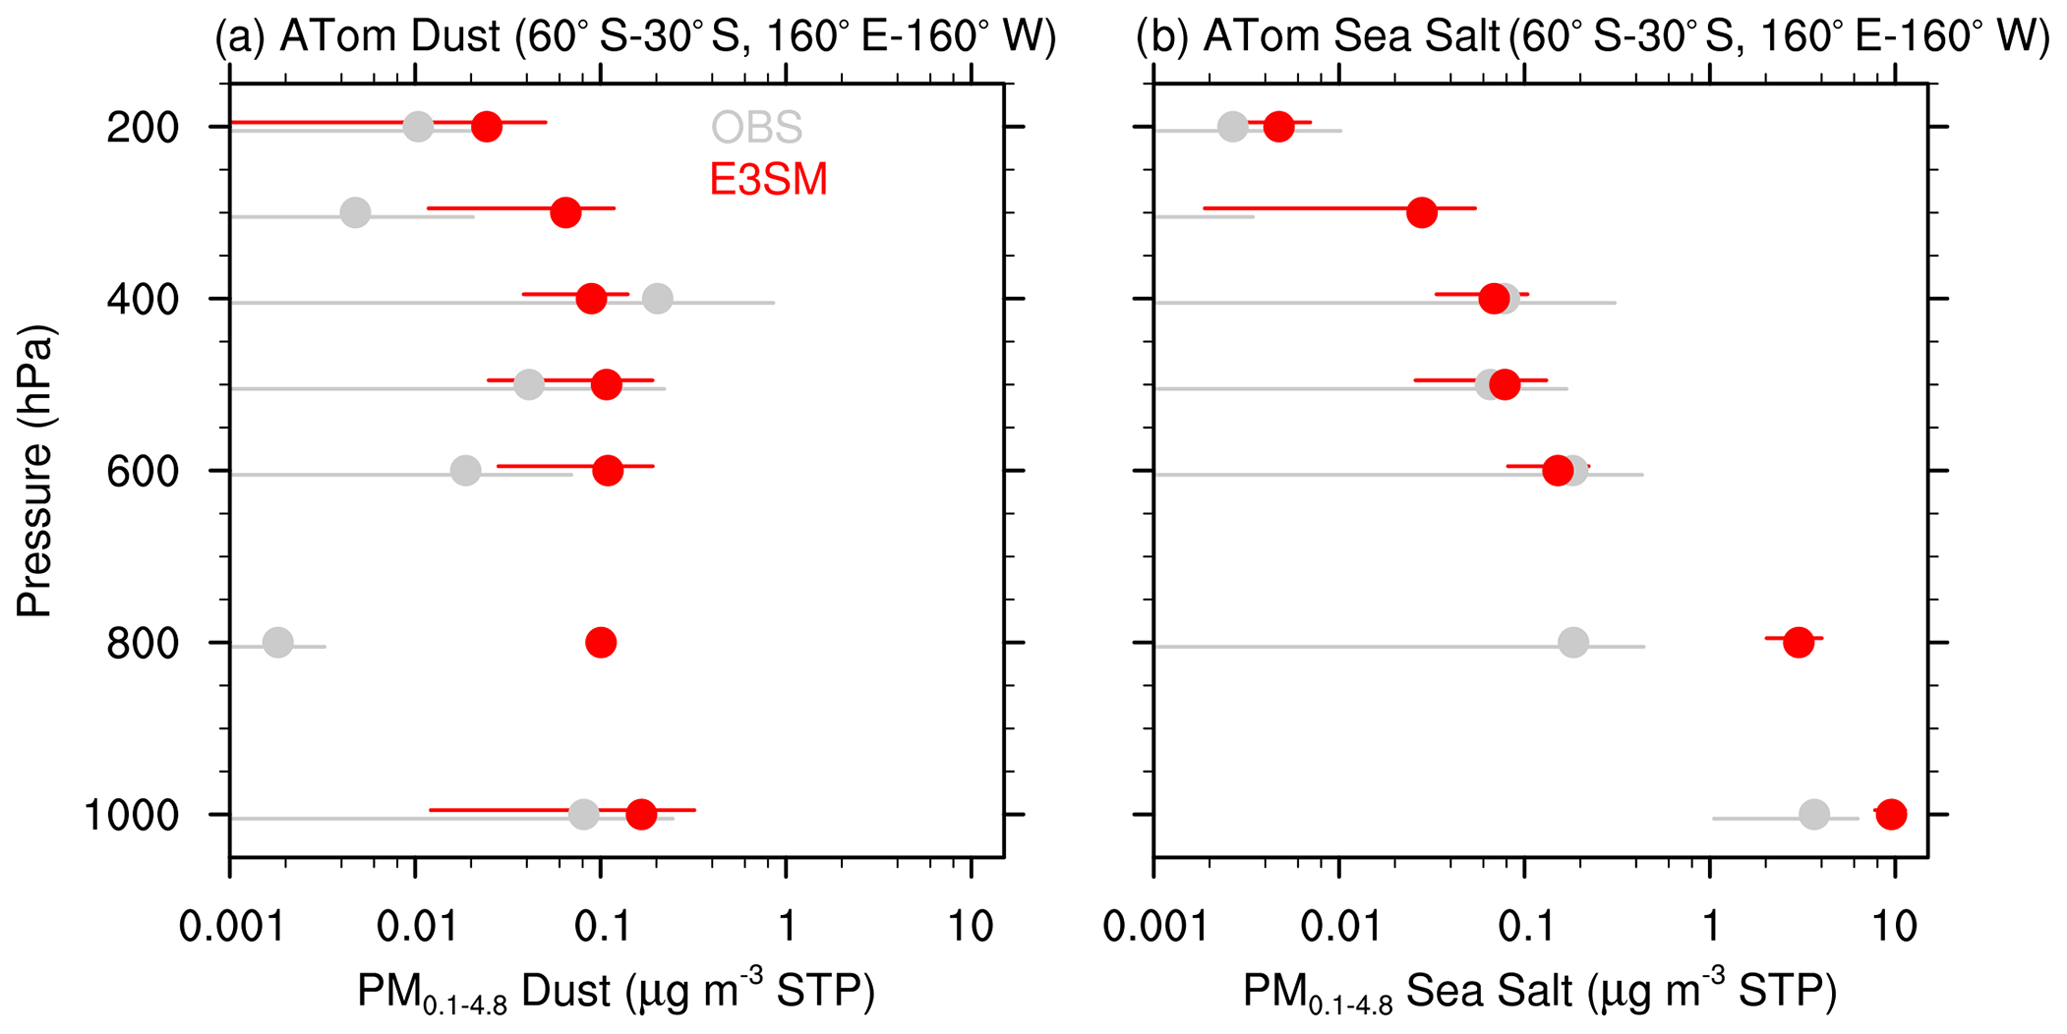
Figure 4Vertical profiles of dust and sea salt concentrations from ATom aircraft observations using the PALMS instrument and E3SMv1 simulations averaged over 30–60∘ S and 160∘ E–160∘ W (grey, ATom observations and red, E3SMv1 simulations). Standard deviations for ATom flight tracks are shown as grey lines, and those from the model are shown as red lines. Vertical profiles of dust are shown for the size range 0.1 to 4.8 µm diameter. The total number of observations at each pressure is given here: 1000 hPa – 24, 900 hPa – 0, 800 hPa – 2, 700 hPa: 0, 600 hPa – 15, 500 hPa – 29, 400 hPa – 11, 300 hPa: 25, 200 hPa – 16. Profiles include flight tracks from 8 August 2016, 12 August 2016, 5 February 2017, 8 October 2017, 11 October 2017, 3 May 2018, and 6 May 2018.
While the MICRE observations were conducted in near-surface air, the impacts of INPs on clouds occur at higher altitudes. Therefore, adequate simulation of dust and sea spray aerosols above the surface level is also required to correctly simulate the impacts of INPs on cloud properties. Evaluating the vertical profiles of aerosols from model and observations helps to identify if simulated biases in INP concentrations are mainly due to the biases in the model transport and removal mechanisms of aerosol particles or due to the aerosol emissions near the surface (Burrows et al., 2022b). Because desert dust and other INP-relevant aerosol particles can be transported to longer distances from source regions, knowledge of aerosol vertical profiles is important to understand the INP contribution from different aerosol source types (Schrod et al., 2017).
To evaluate the model-simulated vertical distributions of aerosols in the SO, we compare simulated vertical profiles of dust and sea salt aerosols with aircraft measurements of ATom in the size range 0.1 to 4.8 µm diameter averaged over 30–60∘ S and 160∘ E–160∘ W (Thompson et al., 2021). Figure 4 shows that E3SMv1 adequately simulates the dust and sea salt concentrations to within the range of observed values at all pressure levels up to 400 hPa, with the exception of 800 hPa, where the number of observations is too small to provide a meaningful sample (sample size =2). ATom measurements are converted to concentrations under standard temperature and pressure. We find that the simulated dust concentrations from E3SM (Fig. 4, red lines) show smaller standard deviation compared to that observed in ATom measurements (Fig. 4, grey lines). We find that the dust concentrations do not vary much from the surface up to 400 hPa in E3SM simulations and ATom measurements, which can be attributed to vertical mixing of the advected dust from the continental regions. In contrast, sea spray concentrations decline monotonically with altitude, consistent with the presence of local surface emissions driven by strong winds.
The interpretation of model–observation agreement in vertical profiles should be taken with caution because the ATom measurements used in Fig. 4 includes only 8 d of flights (dates are provided in Fig. 4 caption) and might only be representative of zonal average aerosol concentrations for the flight days. However, E3SM-simulated dust and sea salt concentrations represent monthly averaged values for the flight track. This is likely one of the reasons why simulated dust concentrations in E3SMv1 show an underestimation of dust compared to in situ dust climatologies at SH stations (Fig. 2) but are within the observational uncertainty for ATom measurements. Although the ATom flights did not directly pass over Macquarie Island, these comparisons are useful to understand the model's general behavior in simulating the vertical profiles of dust and sea salt concentrations in this region. Visual inspection of the simulated and observed vertical gradients in dust and sea salt aerosols shows good agreement and therefore indicates that vertical mixing is likely a smaller concern compared to other sources of biases in simulated INP concentrations in this region. The agreement between model and observations was assessed by checking if ATom observed mean values are within the simulated standard deviation for dust and sea salt. The model evaluation of vertical aerosol profiles has implications for the role of INPs in cloud optical and microphysical properties in the marine boundary layer (MBL) and free troposphere (Murray et al., 2021; Tan and Storelvmo, 2019; Burrows et al., 2022b). For example, using lidar retrievals of dust, smoke and cloud phase, Tan et al. (2014) showed that the presence of dust and smoke particles was negatively correlated with the supercooled liquid fraction.
3.2 Simulated global mean INP distributions
Atmospheric concentrations of INPs vary significantly between different regions of the globe due to geographic variations in the concentrations of various INP-active aerosols. For example, Atkinson et al. (2013) showed that ice nucleation active site densities for different types of feldspar dust mineral span 7 orders of magnitude at C. We illustrate the global distributions of simulated INPs in Fig. 5, which shows maps of surface annual mean immersion-mode INP concentrations calculated using various INP parameterizations, at −28 ∘C (left panels) and −20 ∘C (right panels).
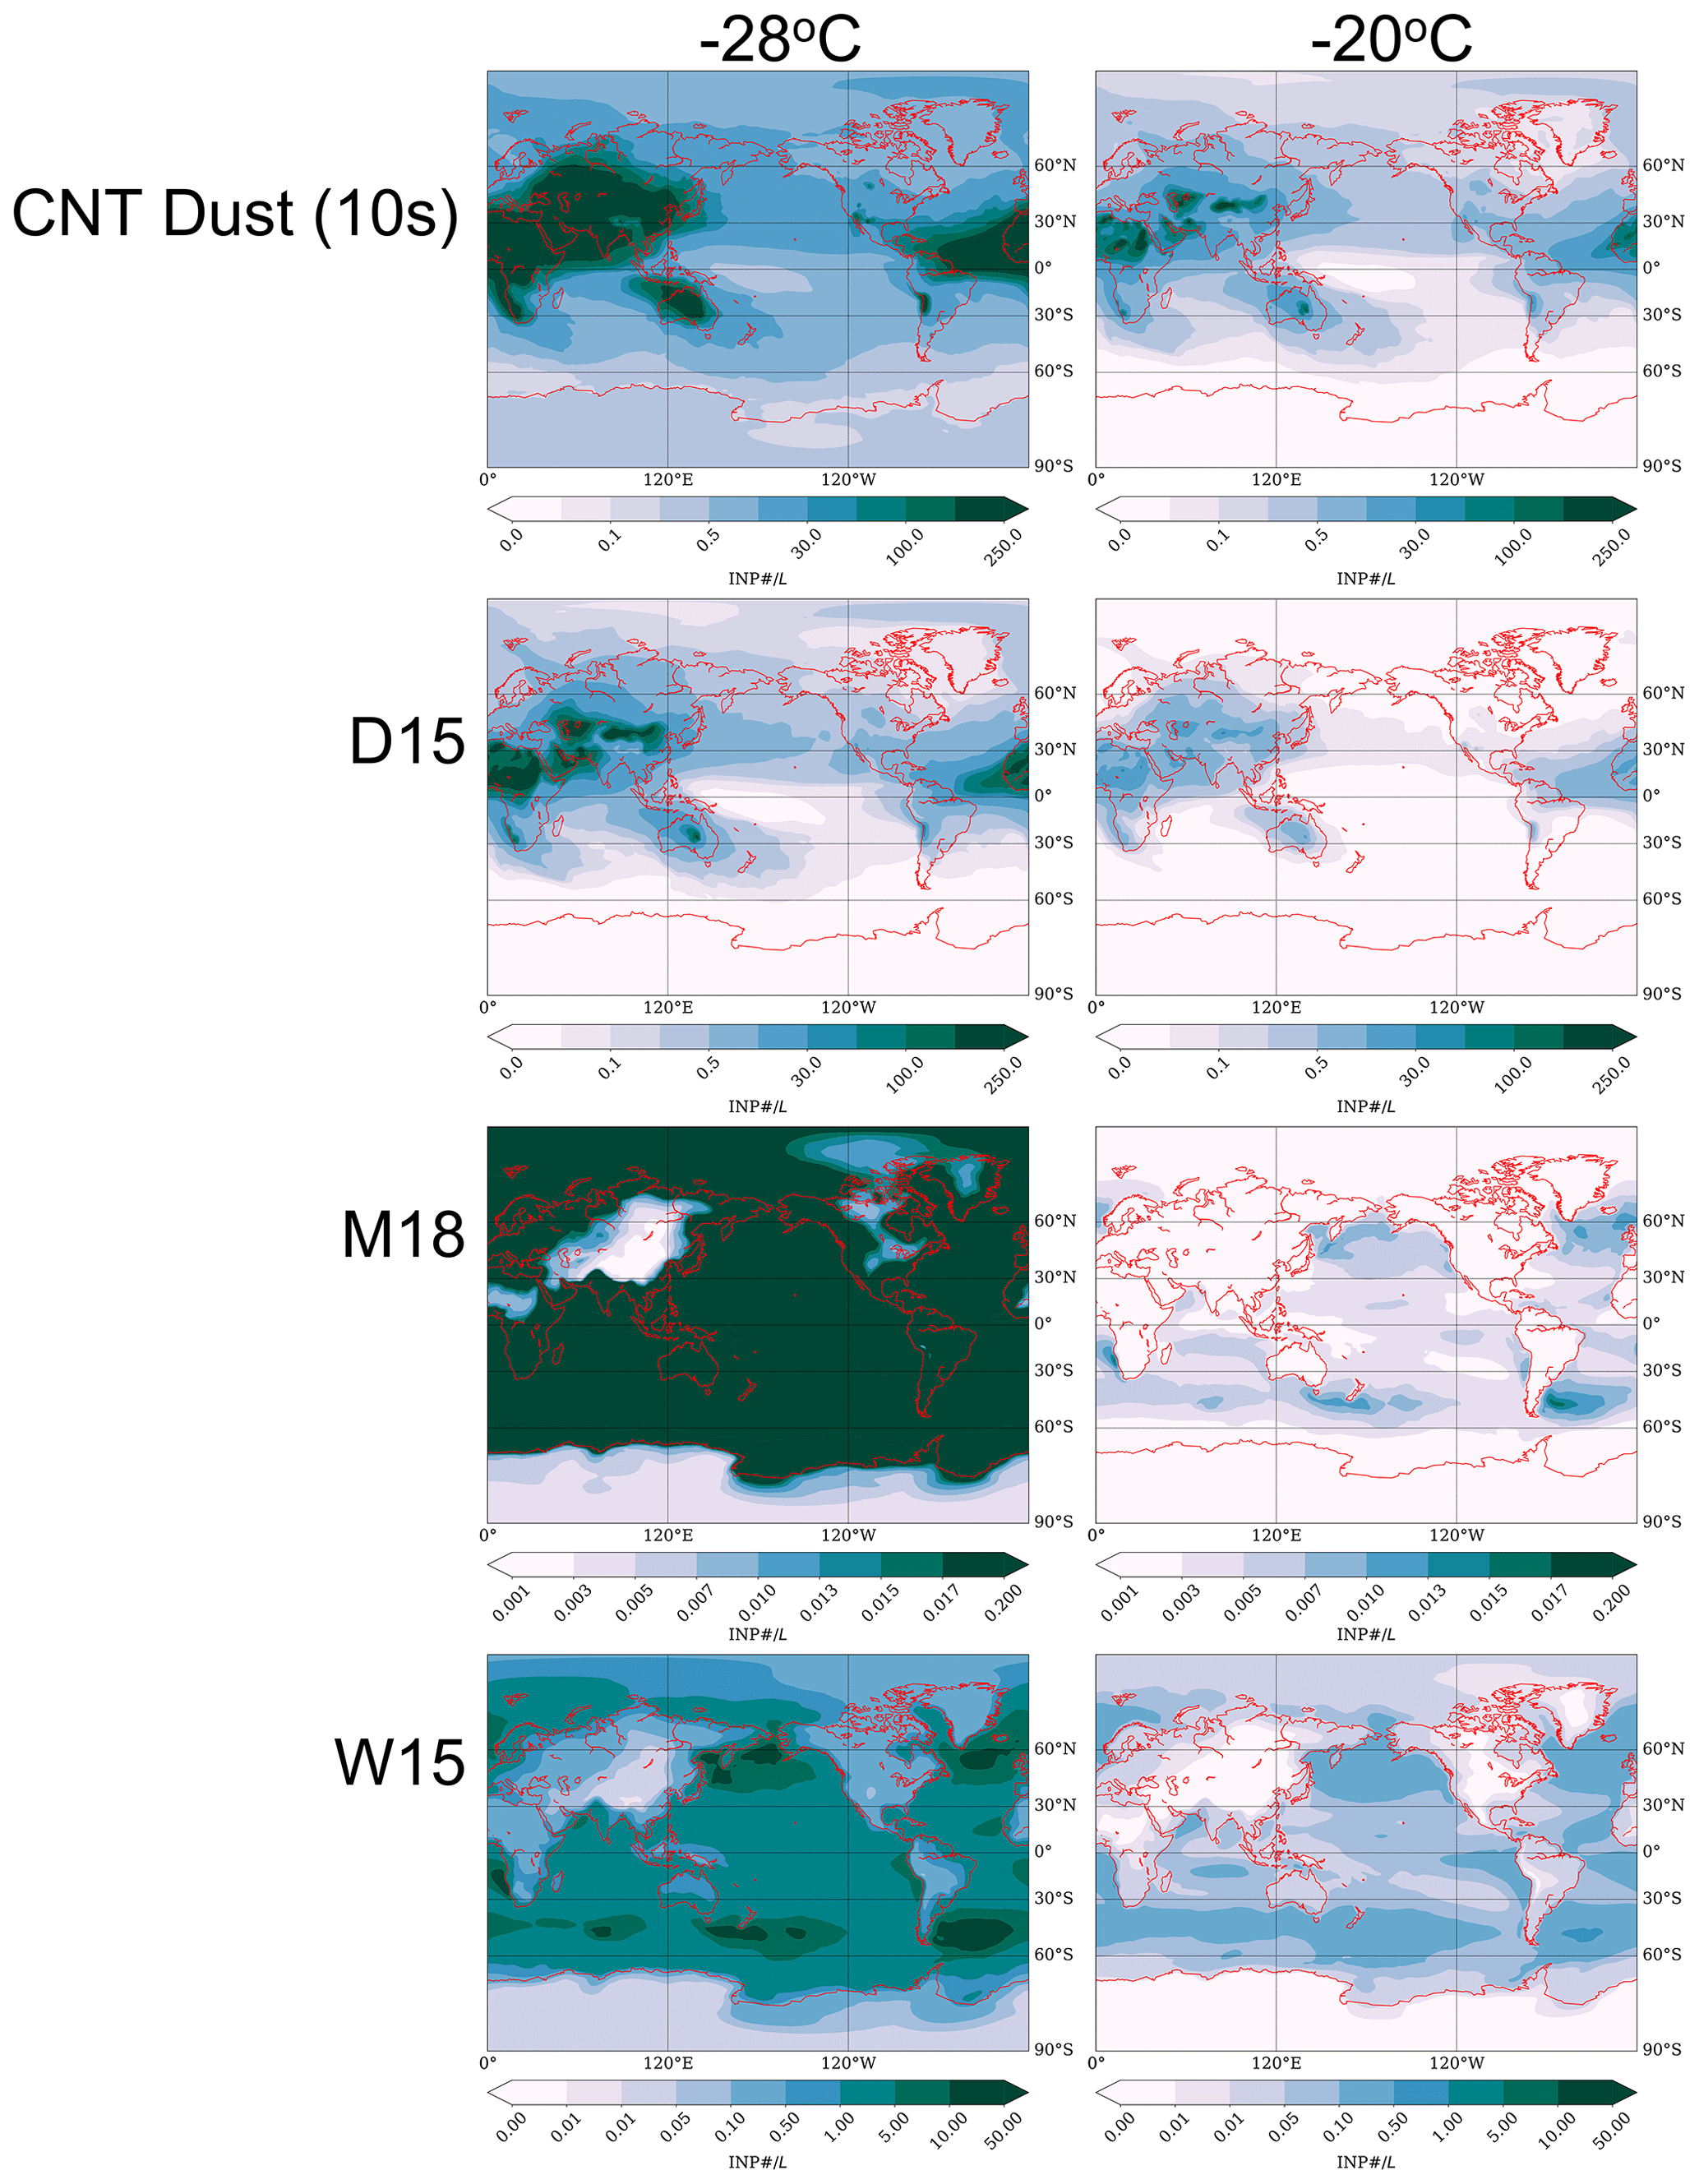
Figure 5Global annual mean INP concentrations for 2017 at activation temperatures −28 ∘C (left panels) and −20 ∘C (right panels). Rows represent different INP parameterizations used in this study: CNT (dust) 10s, D15 (dust), M18 (sea spray) and W15 (marine organic sea spray). Details on INP parameterizations can be found in Table S1.
Different INP parameterizations produce substantially different concentrations of INPs. For example, CNT at 10s produces annual mean dust INP concentrations that are 1–3 orders of magnitude higher than the D15 parameterization globally. The ratio of CNT : D15 is highest near the SH polar regions, indicating that these regions are most sensitive to the choice of dust INP parameterization during the dust episodes. Figure S3 shows the ratio of CNT : D15 over the SO being larger at −20 ∘C compared to −28 ∘C. This can be explained by differences in the INP–temperature dependence, i.e., the slope of INP[L for the two parameterizations, which is shown in Fig. S4.
In Tables 3 and 4, we show statistics for the annual and seasonal INP concentrations in the SH and across the globe, at two activation temperatures, −28 and −20 ∘C. Dust INPs dominate the global mean INP concentrations and the INP variability at both −28 and −20 ∘C. CNT shows the highest variability in INP concentrations as seen from the standard deviation values in Tables 3 and 4.
W15 has been used in past modeling studies of marine INP impacts on cloud properties (Vergara-Temprado et al., 2018) and in the evaluation of model-simulated INPs in the SO (McCluskey et al., 2019). W15 was developed on the basis of samples of organic matter collected from the sea surface microlayer (SSML) in the North Atlantic and Arctic Oceans. The concentration of ice-nucleating entities (INEs) in these samples was shown to be correlated with their total organic carbon mass. W15 parameterizes marine INPs as a function of simulated MOA, on the assumption that the relationship between organic mass and INPs found in SSML material can be extrapolated to sea spray aerosol. This assumption may have important limitations, e.g., differences in the size distribution and composition of INEs released into atmospheric SSA particles due to the different SSA production mechanisms (Wang et al., 2017). A recent study using laboratory measurements showed that the INP concentrations from submicron-sized SSA were lower by a factor of 10 compared to atmospheric INP concentrations from total SSA (Mitts et al., 2021). This study found that in addition to the submicron INEs within the SSML, super-micron-sized SSA particles produced from jet drops were also important to the total marine INP concentrations. Using the cruise measurements, Trueblood et al. (2021) investigated the relationships between SSML INPs and SSA INPs at C during a dust wet-deposition event in the Mediterranean Sea. These observations showed a 3 d lag between the increase in INP concentrations in the SSML and the increase in INPs from total SSA. This study concluded that processes governing the evolution of INPs in SSA and INPs in SSML are not the same. The effects of INEs and INPs on clouds in remote marine regions will therefore vary based on their composition and other physical properties.
As shown in Table 3, global annual mean INP concentrations simulated by W15 are approximately an order of magnitude higher than those simulated by M18 for background sea spray INPs. Such order-of-magnitude differences in INPs can have important impacts on simulated cloud processes, including precipitation and cloud phase feedbacks on climate (Shi and Liu, 2019; Kawai et al., 2021; Fan et al., 2017). Given this large discrepancy between the INP concentrations from various parameterizations, additional efforts are needed to evaluate and improve upon the existing parameterizations of marine INPs, particularly in understanding the emissions and INP effectiveness of marine biogenic INPs emitted episodically from the ocean surface (Steinke et al., 2022).
Kanji et al. (2017) compared temperature–INP spectra from studies of field measurements conducted globally for different categories of INP composition. This study found differences of several orders of magnitude in INP concentration within any air mass or particle composition. Figure 10 in Kanji et al. (2017) shows that at C, INP concentrations for marine samples range from 0.001 to 2.0 L−1. The SH INP number concentration mean from D15, W15, CNT and M18 is also within the range estimated in Kanji et al. (2017). The E3SM-simulated SH INP mean across the temperature spectra is also within the range of most frequently observed INP concentrations (0.0001 to 0.1 L−1) shown in Fig. 5 of Welti et al. (2020) for the south polar marine regions.
Table 3Mean and standard deviations for E3SM surface INP concentrations for −28 ∘C. For context, both global and SH statistics are shown for 2017.
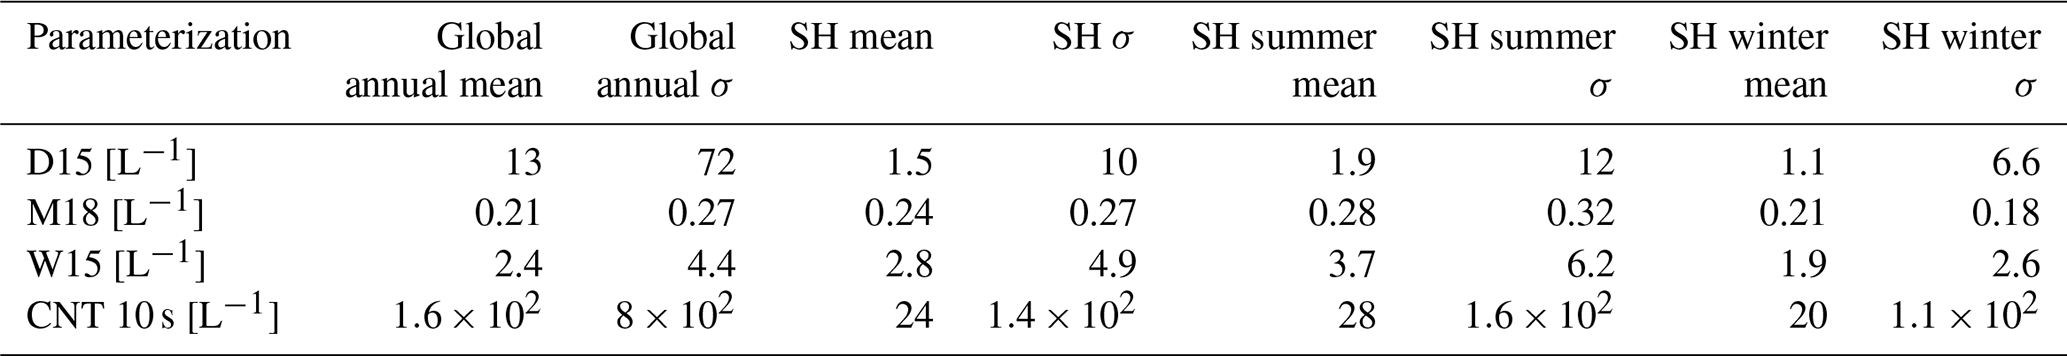
σ represents standard deviation of the season or year.
Table 4Mean and standard deviations for E3SM surface INP concentrations for −20 ∘C. For context, both global and SH statistics are shown for 2017.
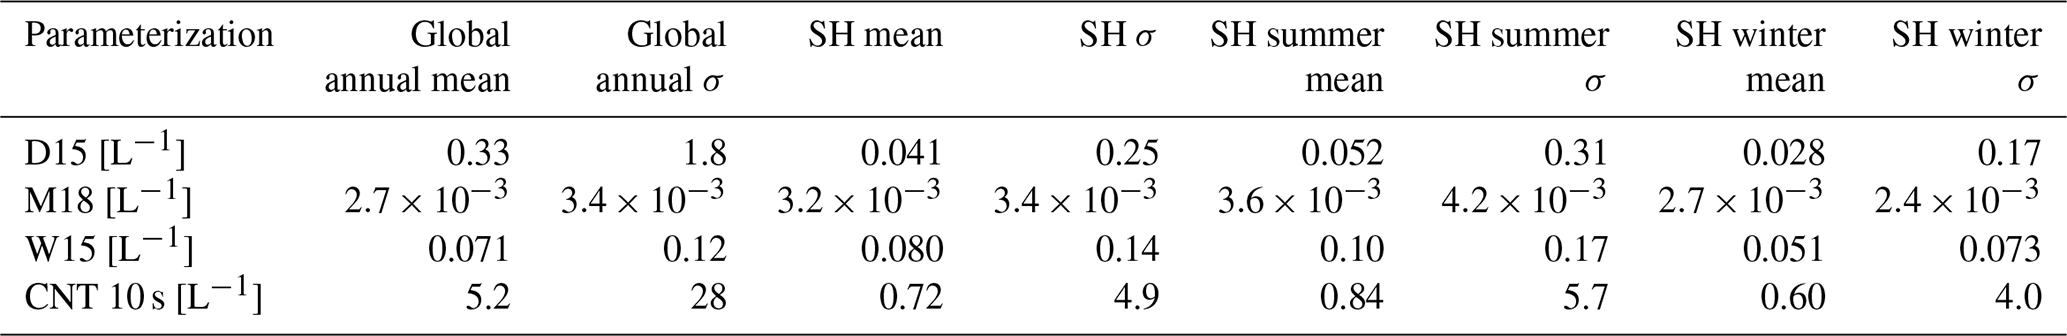
σ represents standard deviation of the season or year.
3.3 Comparisons of simulated INPs with MICRE measurements
In the previous section, we compared global distributions of INPs from different parameterizations. In this section, we compare the model-simulated INPs against MICRE observations at Macquarie Island, which can help evaluate the day-to-day and long-term INP predictive skill of the model for remote marine regions in high latitudes. In Fig. 6, we show scatter plots of simulated INPs from several INP parameterizations compared against MICRE INP measurements (for collections made over 2–3 d) and corresponding performance metrics.
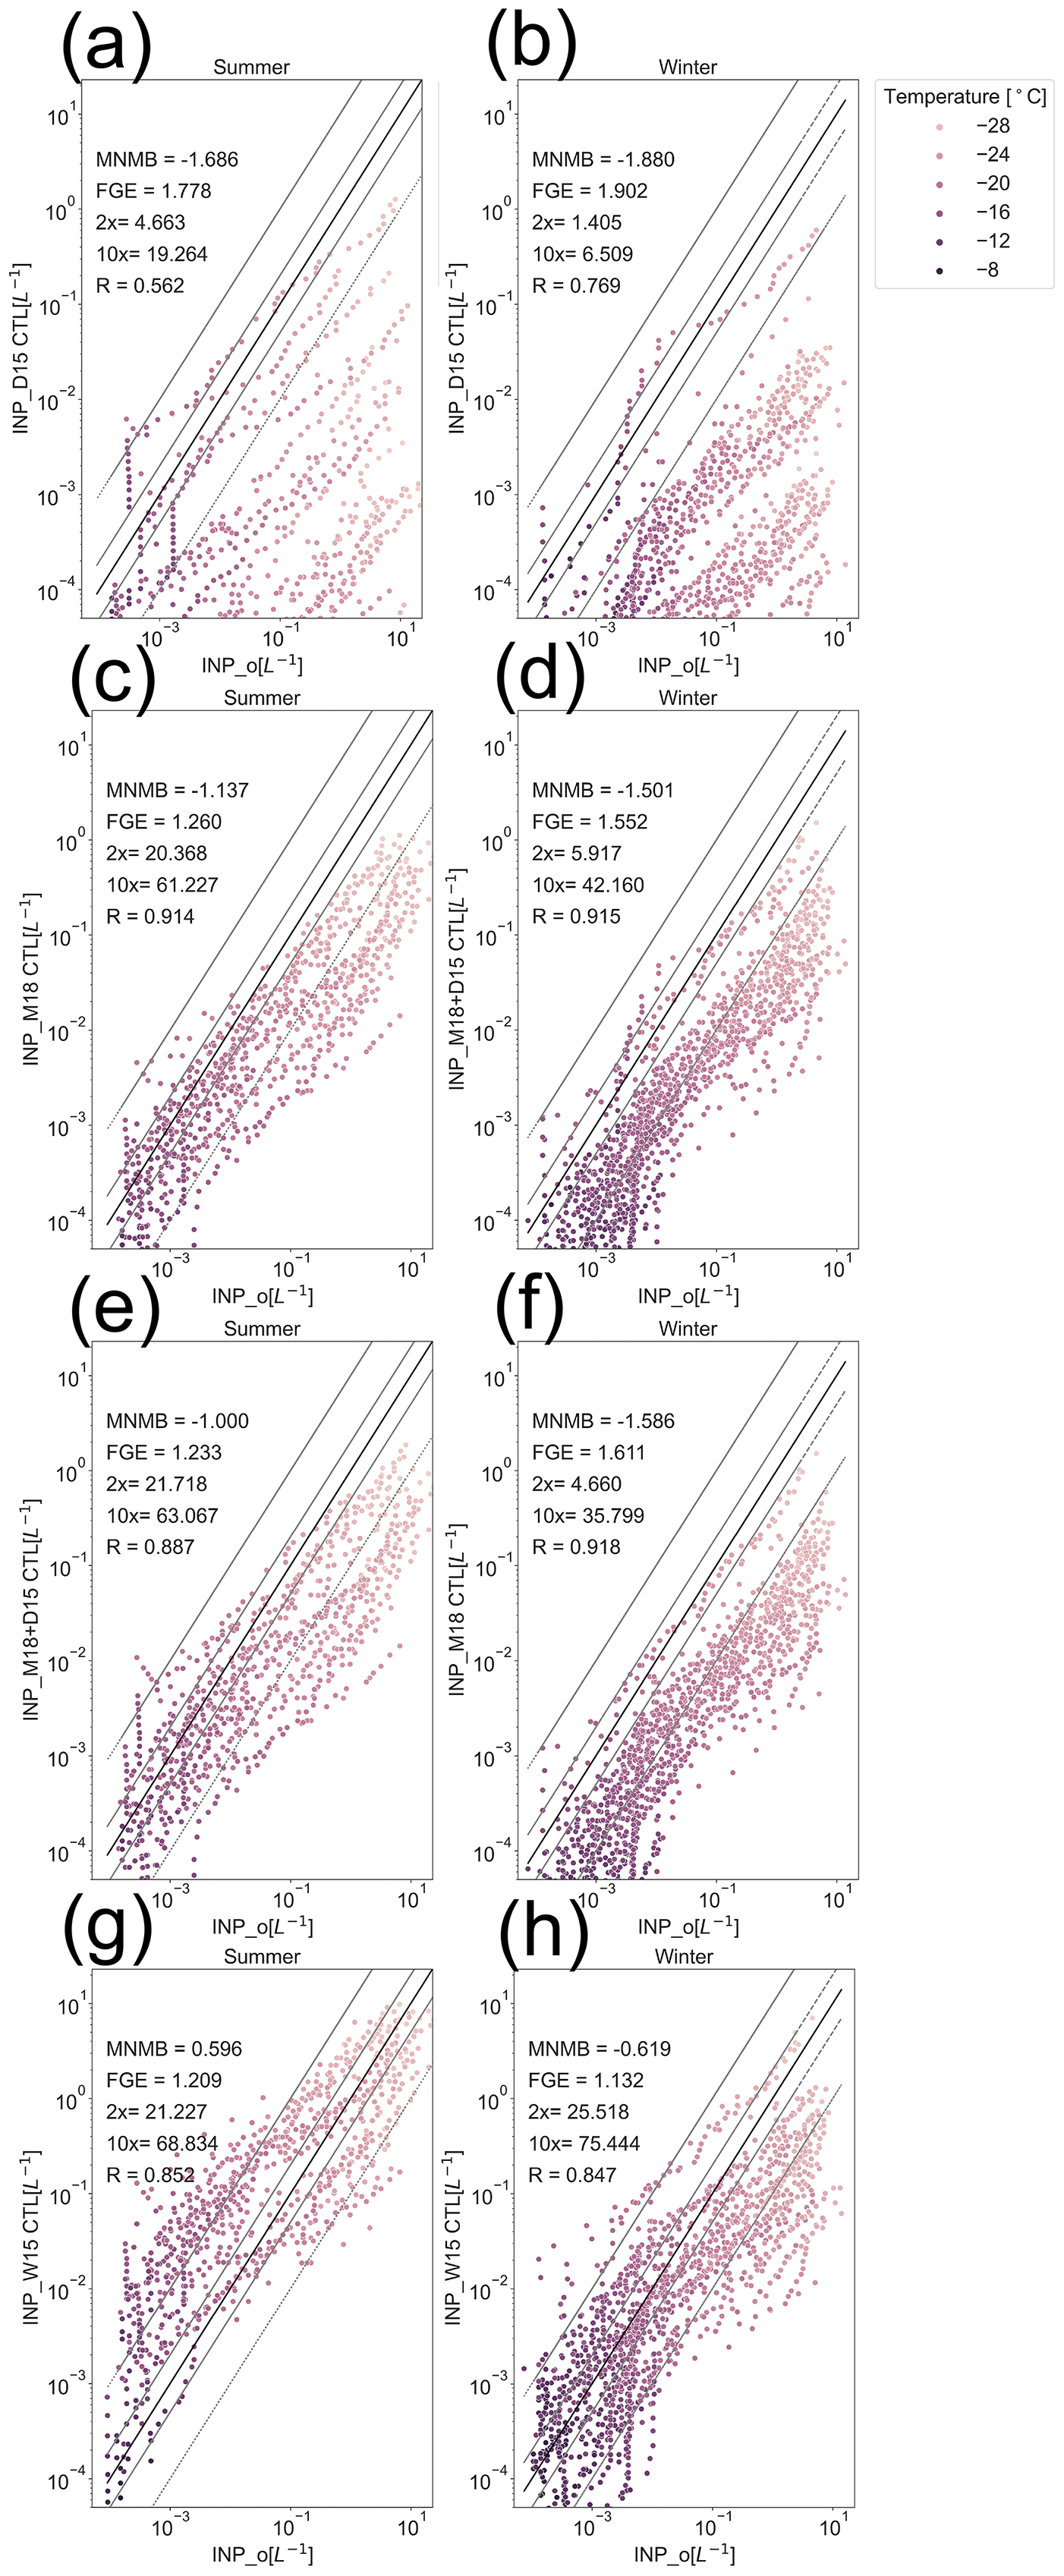
Figure 6Observed INP concentrations (L−1) at Macquarie Island from MICRE and simulated INPs from E3SMv1 and INP parameterizations. (a) and (b) D15, (c) and (d) M18, (e) and (f) M18+D15, and (g) and (h) W15. INP concentrations are colored by activation temperatures used for measurements. Solid line in each panel represents 1:1 comparison, while dashed lines represent a factor of 2 and 10 from the observations. Error metrics in each panel include fractional gross error (FGE), modified normalized mean bias (MNMB), Spearman's correlation (R), percentage of model INPs within a factor of 2 from observations (2×) and percentage of model INPs within a factor of 10 from observations (10×). Scatter plots for austral summer (October–February) are shown in the left column, and those for austral winter (March–September) are shown in the right column.
We show results separately for austral summer (Fig. 6, left) and austral winter (Fig. 6, right). In both seasons, INPs are significantly underpredicted using dust alone (D15; MNMB of −1.68 during the summer and −1.88 during the winter) or sea spray alone (M18; MNMB of −1.13 during the summer and −1.58 during the winter). Across all measurement temperatures, D15 is biased low by up to 4 orders of magnitude compared to the measurements.
This low bias is consistent with the findings of McCluskey et al. (2019), who showed that using a combination of M18 and D15 INPs from dust and sea spray aerosols simulated by the CESM model produced better agreement with immersion freezing INP measurements at Mace Head research station and in the SO for the CAPRICORN campaign. Similarly, we find that better agreement is achieved at MICRE when using the combination of M18 sea spray and D15 dust INPs (Fig. 6g and h) than by either sea spray or dust alone. Potential reasons for the remaining model–observation disagreement will be discussed further in Sect. 3.6.
Interestingly, the W15 parameterization also produces better agreement with observed INPs compared to M18+D15 based on the metrics shown in scatter plots in Fig. 5. While W15 overpredicts summertime INPs by 1–2 orders of magnitude for temperatures warmer than −20 ∘C, summertime INPs at colder temperatures, and wintertime INPs at warmer temperatures, agree better with observations than INPs predicted by the other parameterizations. Given the large uncertainties currently associated with prediction of sea spray organic matter (Burrows et al., 2022a) and its INP efficiency (Steinke et al., 2022; Mitts et al., 2021), and the lack of aerosol chemistry measurements at MICRE, it is difficult to discern at this time whether this improved agreement reflects a better representation of the underlying physical and chemical processes. Clearly, more study is needed to understand the regional and seasonal impacts of marine biology on sea spray INPs (Wolf et al., 2020; Trueblood et al., 2021).
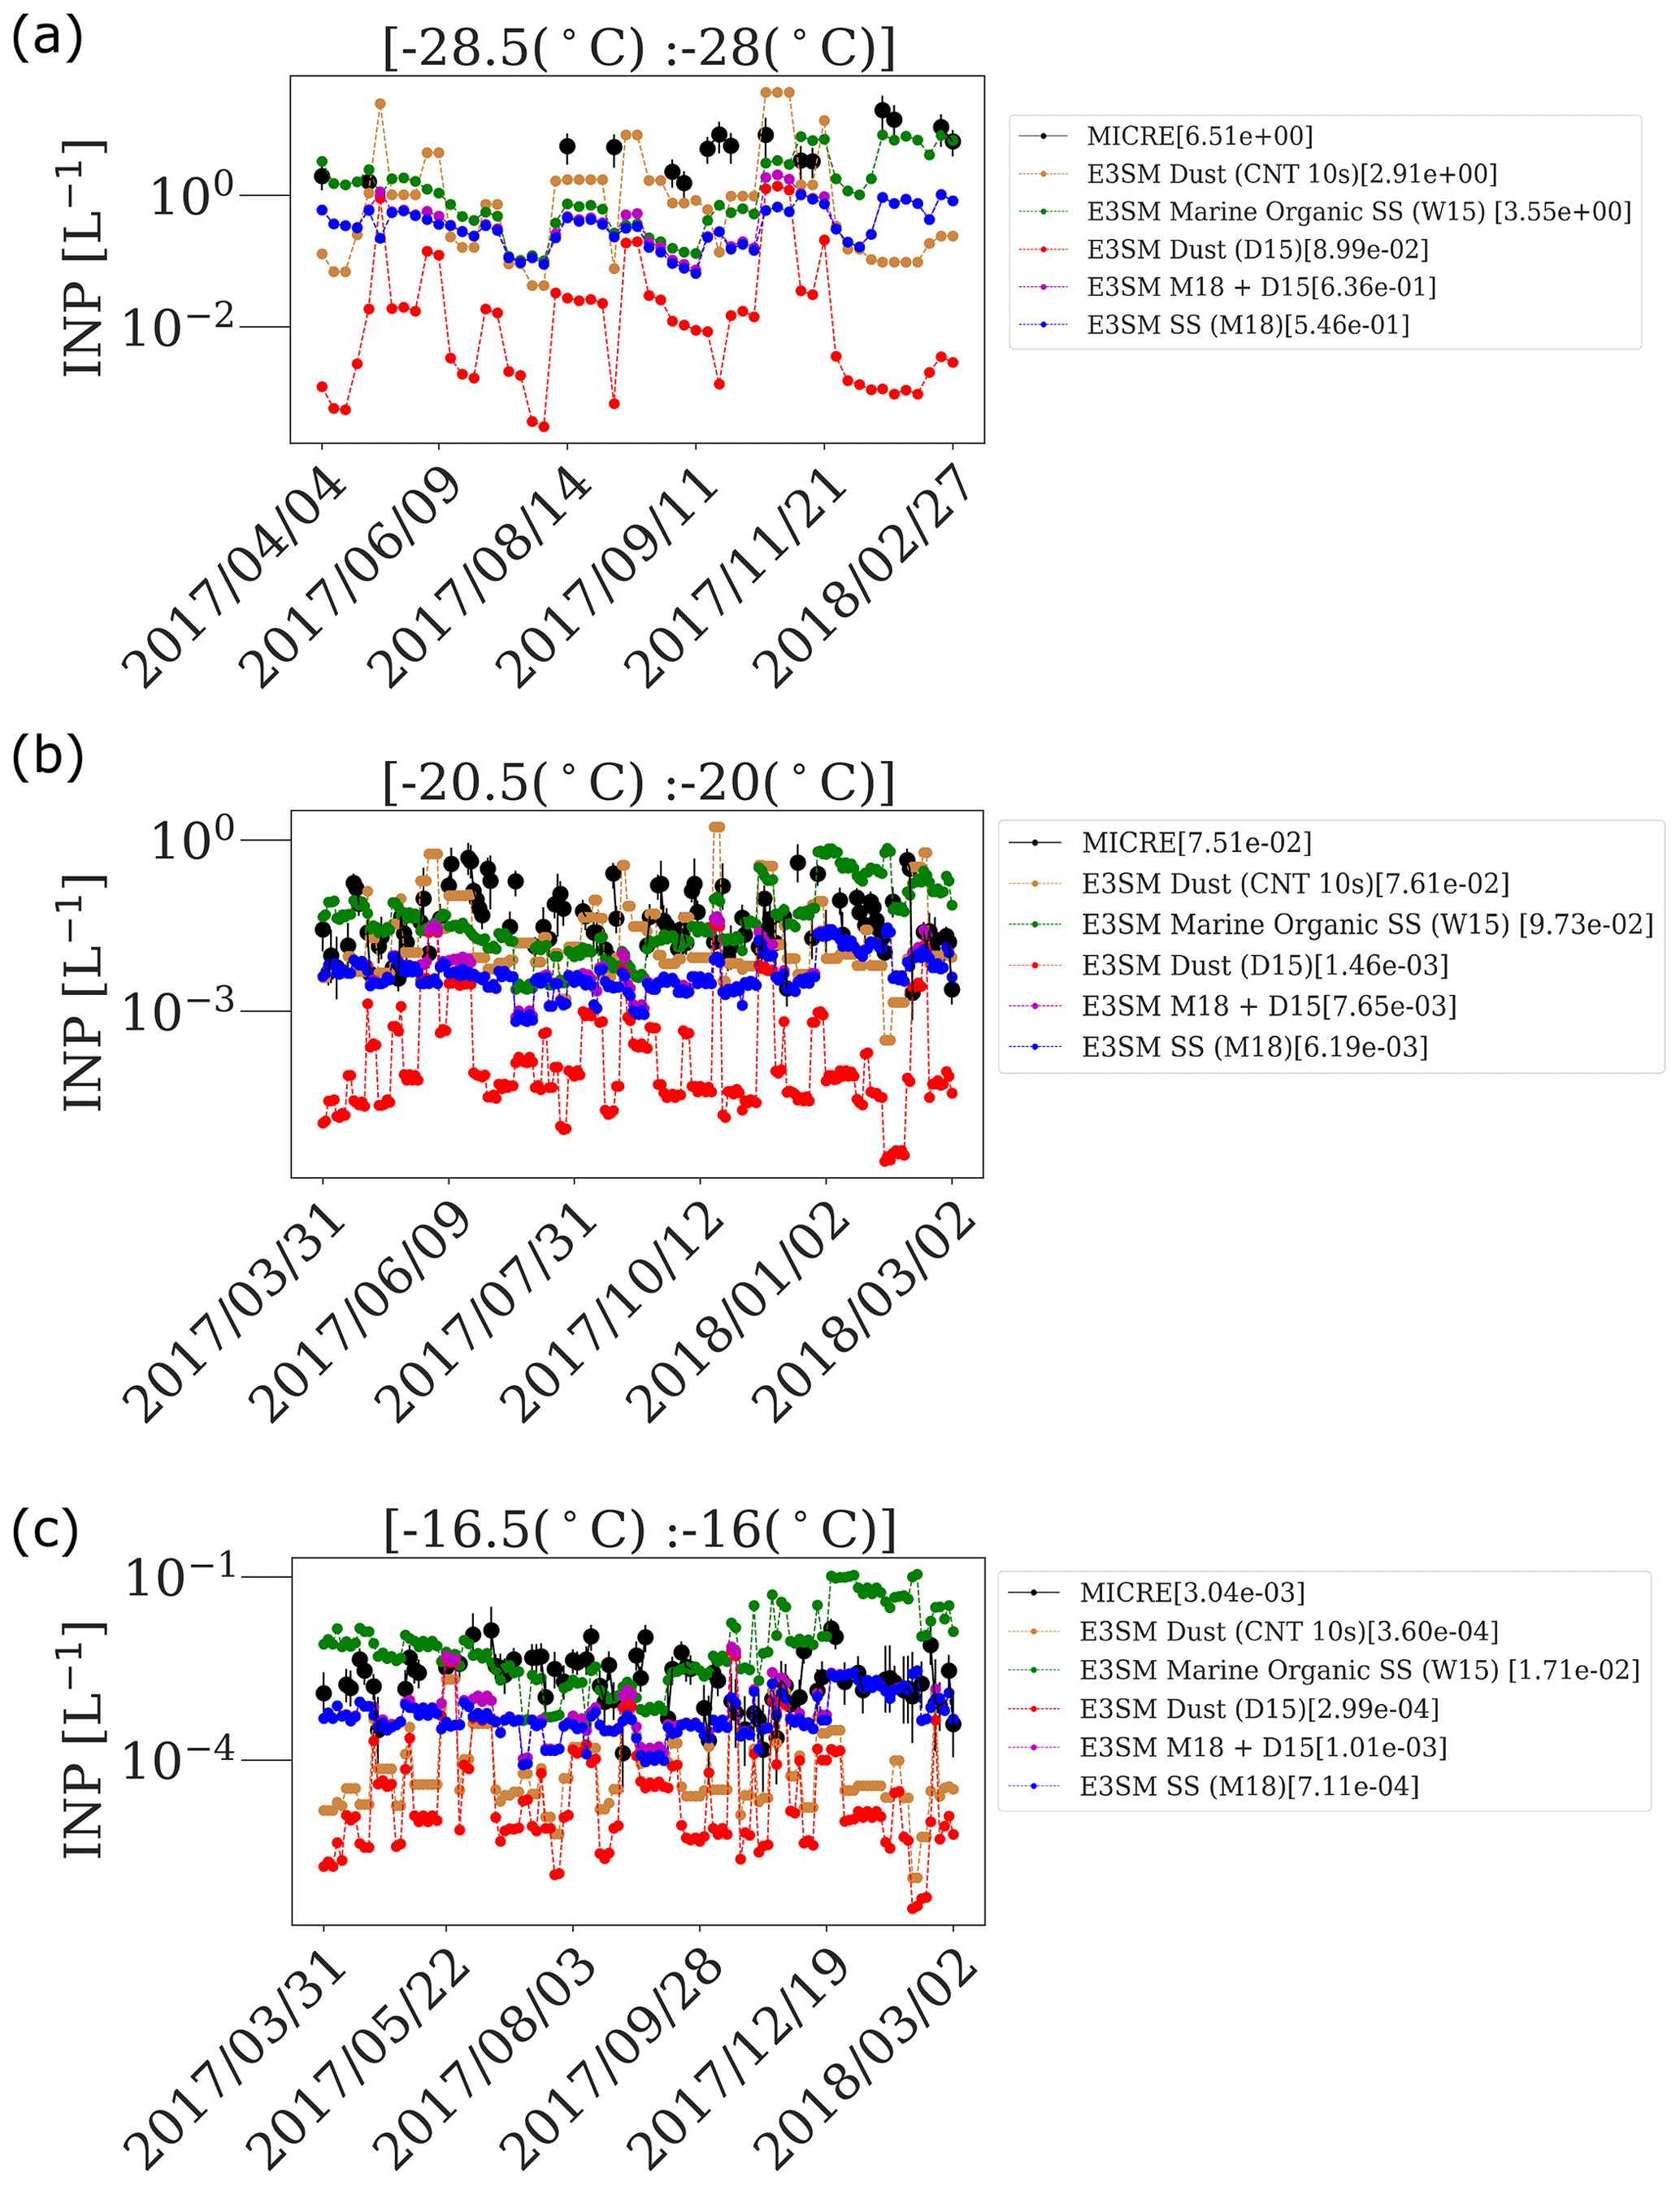
Figure 7Time series of near-daily INP concentrations at Macquarie Island for specific activation temperature intervals: (a) −28.5 to −28 ∘C, (b) −20.5 to −20 ∘C and −16.5 to −16 ∘C. INP observations from MICRE are shown in black circles. Error bars on the observations represent 95 % confidence interval width for number of INPs per liter of air at ambient temperature and pressure. Simulated INP concentrations are interpolated to the grid box closest to Macquarie Island using the nearest-neighbor interpolation method. For each sampling period, simulated values are output as instantaneous values every 30 min and averaged from the start date to the end date. We color-code different parameterizations as follows: D15 (red), CNT (orange), W15 (green), M18 (blue) and M18+D15 (magenta). The values displayed in the brackets in the legend show the mean values from observed and simulated INP concentrations.
3.4 Variability in INPs
The time series of near-daily observed and simulated INP concentrations from 2017–2018 at Macquarie Island show that at a given temperature, variability in INP measurements ranges over 2–3 orders of magnitude (Fig. 7). We choose an interval of 0.5 ∘C for the time series analysis because this interval matches the MICRE-reported measurement increments for temperature. Panels a, b and c in Fig. 7 correspond to temperature intervals, −28.5 to C, −20.5 to −20 ∘C and −16.5 to −16 ∘C respectively. From both observed and simulated INP concentrations, we do not see a clear seasonal cycle. INP highs in the observations are episodic and are not restricted to specific seasons. However, some of the peak observed INP concentrations occurring in Fig. 7b during the austral summer months coincide with the time period for major dust emission events in southern Australia and favorable ocean conditions for phytoplankton growth (Gabric et al., 2010). At −20.5 to −20 ∘C range, CNT agrees well with INP measurements. However, for temperatures warmer than −20 ∘C, CNT significantly underestimates INP measurements by 2–3 orders of magnitude.
Episodic dust from long-range transport may contribute to INP concentrations in the SO. For example, Neff and Bertler (2015) found that dust emissions of 30 Tg a−1 in New Zealand could contribute as much as 21.9 % to dust deposition in the SO. In particular, previous studies using back trajectories and observed radon concentrations have shown that air masses arriving at Macquarie Island can be influenced by aerosol emissions in Australia and Antarctica (Brechtel et al., 1998). In order to understand the potential dust sources to Macquarie Island, we performed 15 d back-trajectory analyses using the Hybrid Single-Particle Lagrangian Integrated Trajectory model (HYSPLIT) (Draxler and Rolph, 2010). Often, we found that air transported to Macquarie Island had passed over potential regional dust sources, including the coasts of Antarctica and South America (not shown).
3.5 INP statistics in models and measurements
We evaluate the shape of the INP probability density functions (PDFs) to understand how the frequency distribution of simulated INP concentrations compares against those from the MICRE observations. Figure 8 presents the PDFs of simulated and observed log10(INP) concentrations, in several freezing temperature ranges. The PDFs for the model represent only the days when the MICRE INP observations are valid at a given measurement temperature.
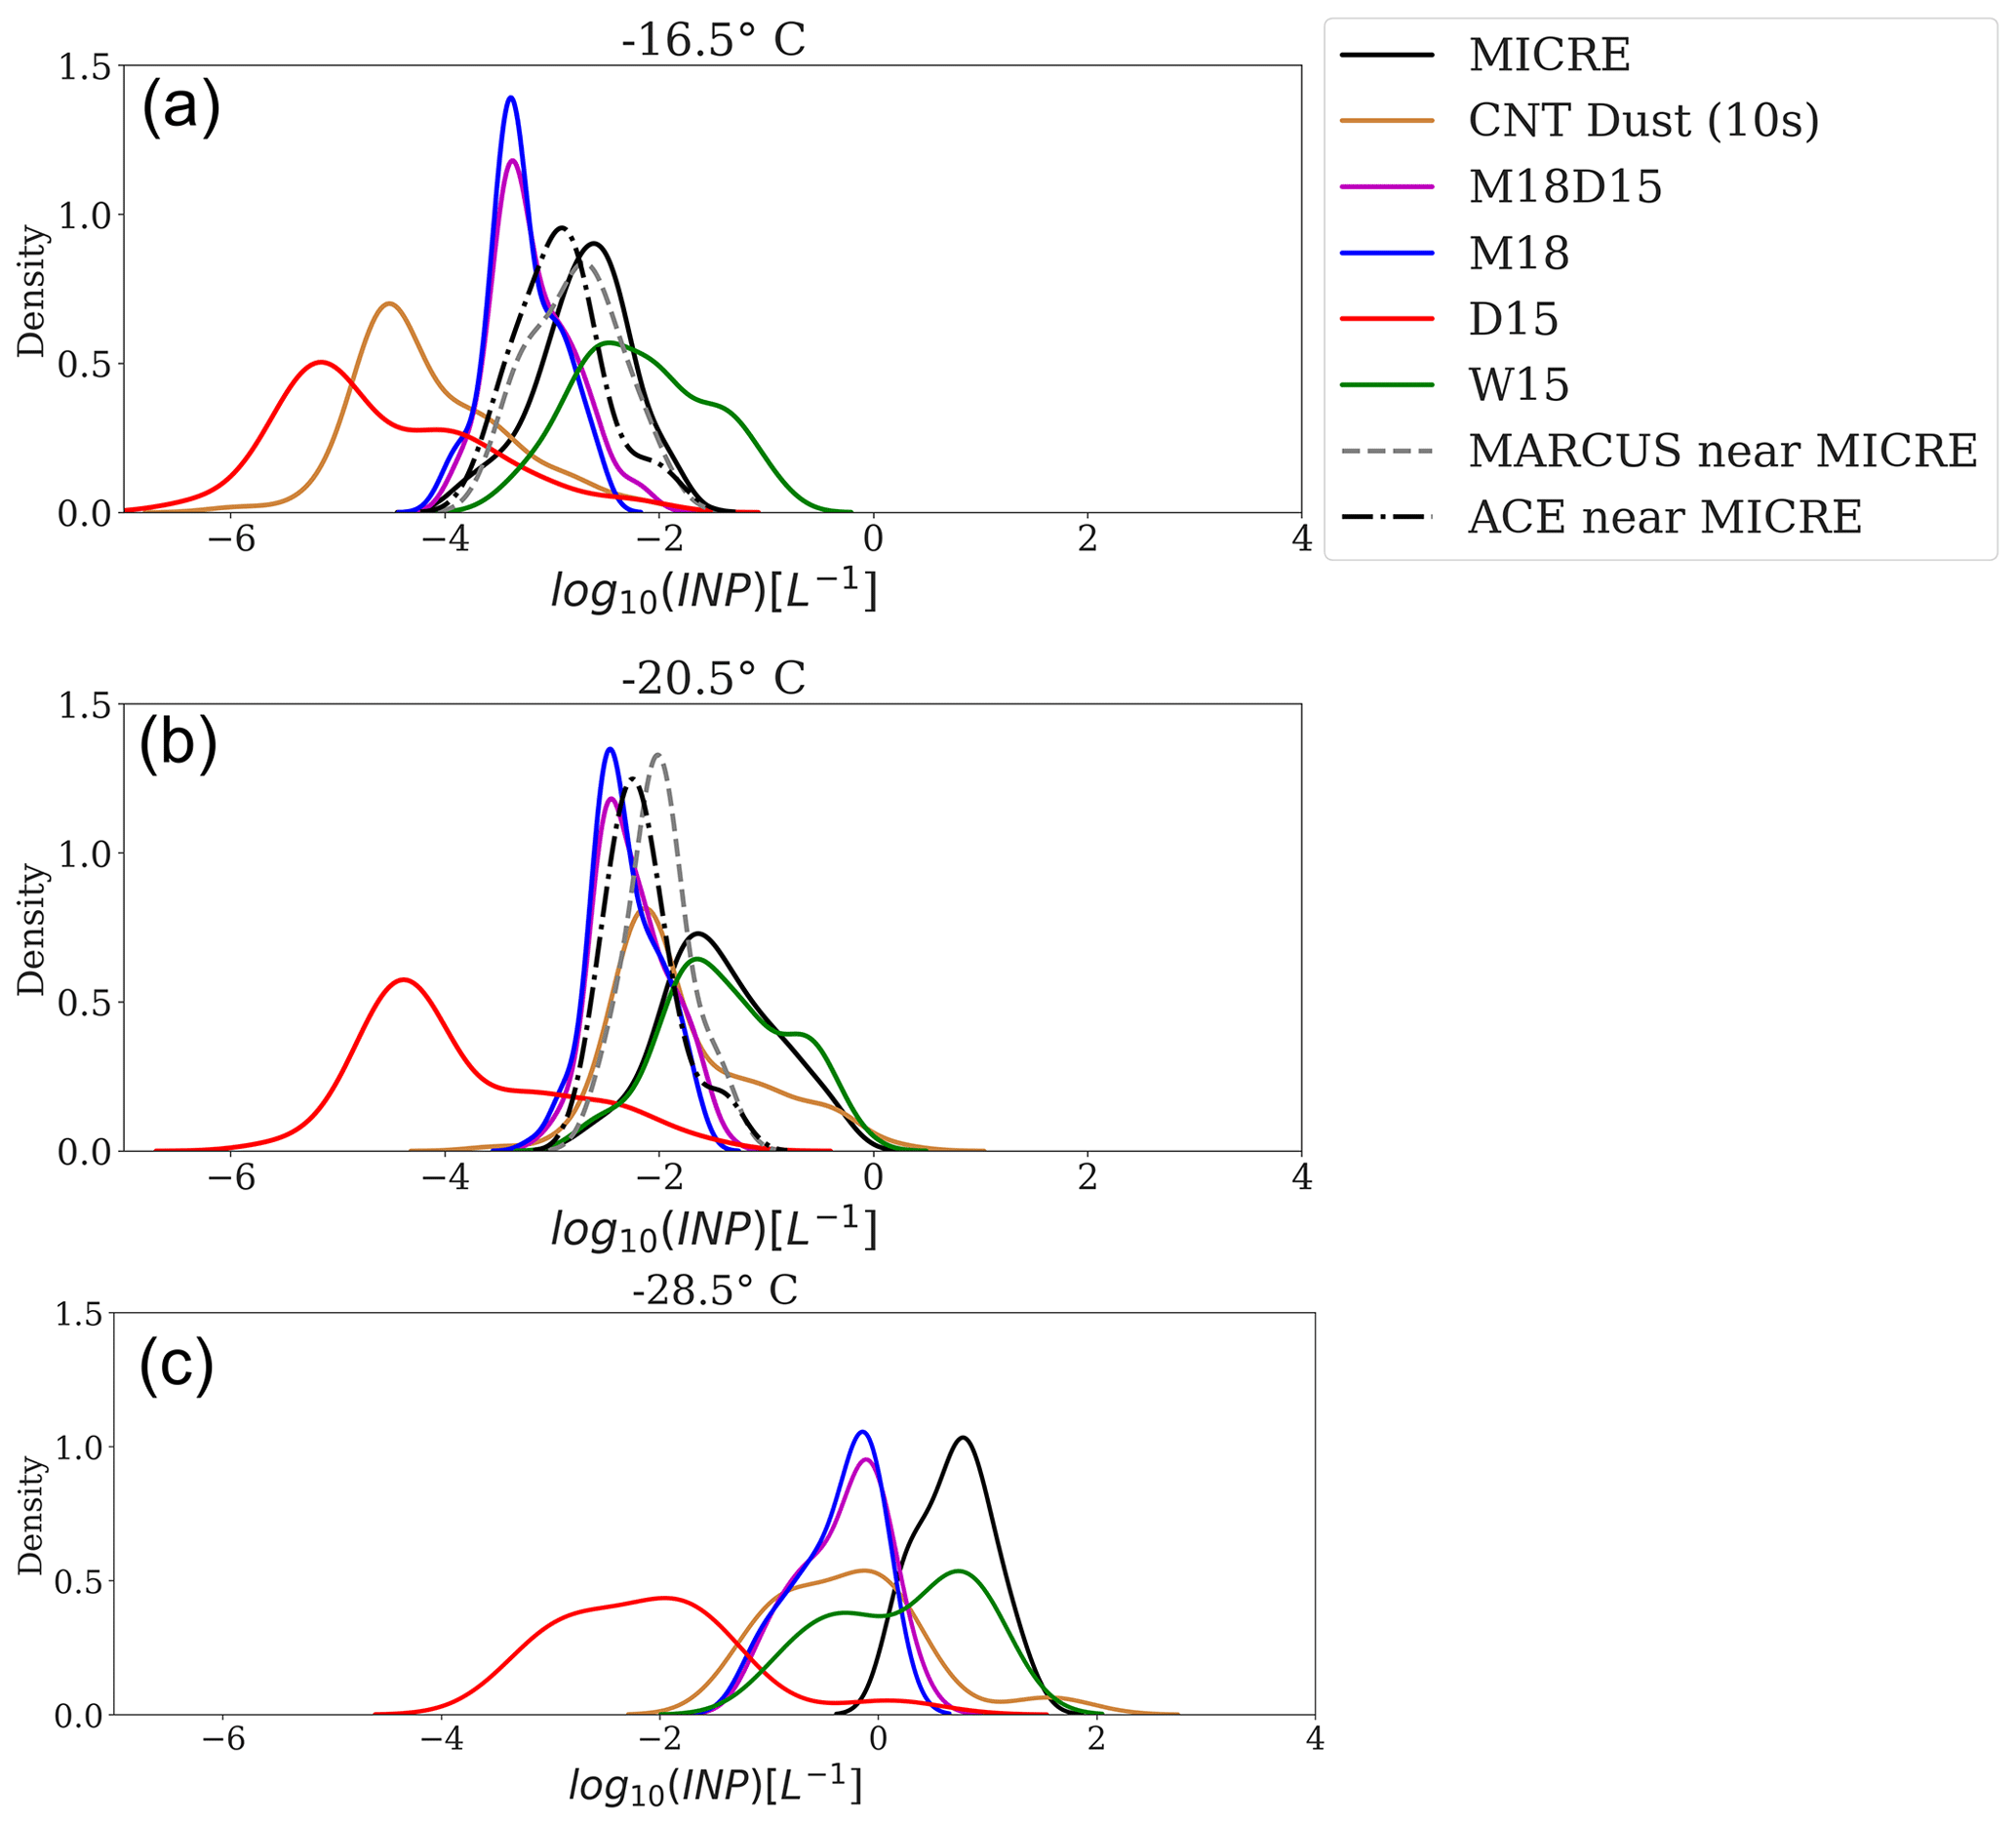
Figure 8Probability density function (PDF) plots of log10INP (T) from E3SM CTL simulations and MICRE observations for 2017–2018. Also shown are the PDFs of INP measurements from other SO field campaigns, MARCUS and ACE (includes INP measurements collected closer to Macquarie Island). We show simulated and observed log10INP (T) PDFs for temperatures (a) −16.5 to −16 ∘C, (b) −20.5 to −20 ∘C and (c) −28.5 to −28 ∘C. Corresponding MARCUS and ACE PDFs are shown for −20 and −16 ∘C in panels (a), (b) and (c). For PDFs of simulated and observed INPs during MICRE, the panels include 16 data points for −16.5 to −16 ∘C, 103 for −20.5 to −20 ∘C and 78 for −28.5 to −28 ∘C. Model-simulated INPs are included only for co-located days with MICRE.
Such an analysis can provide qualitative insights into the sources likely to be relevant to peak INP concentrations (Hartmann et al., 2019). For example, previous studies have shown that the lognormal shape of the INP PDF distributions can be associated with air-quality events that involve more mixing and dilution, whereas skewed distributions can be associated with local emission sources (Gong et al., 2019).
Figure 8 is consistent with the results observed in Fig. 7 and shows that M18+D15 PDF peak is centered at INP concentration about an order of magnitude lower than MICRE PDF. The D15 PDFs are consistently shifted to lower values compared to MICRE and other parameterizations, and the distribution is bimodal. We observe that E3SM's default CNT dust parameterization predicts significantly more freezing than D15, especially at colder measurement temperatures. The PDFs for W15 parameterization are also bimodal and have a broader spread compared to MICRE.
We also compare MICRE INP PDFs with INP PDFs from other ship-based campaigns in the SO to assess the island effects on the MICRE data. At −16.5 ∘C, PDFs for INPs sampled closer to Macquarie Island from other ship-based campaigns, MARCUS and ACE, are similar to MICRE PDFs and centered between 0.001 and 0.01 L−1. Even though we include INPs sampled near Macquarie Island, we see a growing discrepancy between MICRE and other ship-based campaigns at colder temperatures (Fig. 8b). These results show that the island effects are not uniform with temperature.
3.6 Potential reasons for model INP bias
By taking into account additional observational evidence and recent studies documenting limitations in the E3SMv1 aerosol representation, we discuss three likely sources of model–observation discrepancies in MICRE INPs: (1) potential local or regional INP sources that are not represented in the model, such as land sources, sea spray arising from coastal wave action, coastal shelf-induced changes in ocean biology, ocean chemistry and sea spray composition or re-suspension of dust from surface waters (Cornwell et al., 2020); (2) E3SMv1's underprediction of dust aerosol, especially over remote regions away from emission sources, including high latitudes; (3) a likely high bias in dust freezing rates in the E3SMv1 CNT parameterization that partially compensates for the underprediction of dust concentrations; and (4) regionally elevated marine organic emissions that are not necessarily accurately represented at local scale in the OCEANFILMS MOA emission model or in their ice nucleation efficiency by W15.
3.6.1 Bias in E3SM CNT INP concentrations
Potential causes of bias in E3SM's CNT-based dust INPs include (1) overestimation of dust immersion freezing rate coefficients estimated by the Wang et al. (2014) parameterization used in E3SM (Cornwell et al., 2021) and (2) biases associated with using E3SMv1's CNT-based INP 10 s diagnostic as a proxy for INPs measured by the ice spectrometer.
To compare the E3SMv1 model’s CNT-based parameterization with INPs observed by the ice spectrometer, it is necessary to make assumptions, either implicit or explicit, about the time dependence of immersion freezing. Throughout this paper, we have used E3SM’s built-in 10 s diagnostic to compare E3SM’s prediction of INPs with observations. This diagnostic is calculated from the rate of change of freezing rate (also called the tendency) over the E3SM model's cloud microphysics time step of 300 s, and linearly interpolated to a time step of 10 s . In taking this approach, we have implicitly assumed that the INPs measured by the ice spectrometer can be adequately estimated by a linearized version of the CNT model that simulates isothermal freezing over a 10 s timescale. Since ice spectrometer experiments are not performed isothermally, but at a constant cooling rate, these assumptions are inconsistent with the experimental approach used in these observations. We quantified how much the number of INPs predicted by E3SM’s CNT parameterization would change if the parameterization were applied to an idealized ice spectrometer measurement performed at a constant cooling rate.
We conducted idealized simulations of isothermal and constant cooling rate droplet freezing experiments to explore the implications of the time-dependent behavior assumed by the E3SM's CNT parameterization when compared with observed INPs from the ice spectrometer. We perform sensitivity simulations for conditions representative of high- and low-INP regimes.
We calculated the heterogeneous ice nucleation rate coefficient for a given temperature (Jhetcoeffimm(Tmeasurement) []) by dividing the nucleation rate Jimm,dust [s−1] by the particle surface area. We assumed a median particle radius of 1.5 µm. To calculate dust ice nucleation tendencies, we adopted the CNT expression proposed by Wang et al. (2014), but we used a fixed contact angle of 46∘. We note that except for the idealized simulations, all other CNT-based results shown in this study use a probability density function (PDF) model for contact angle distributions following Wang et al. (2014). Since a linearized version of CNT is frequently used to approximate the relationships between frozen fractions and particle freezing properties, we also compared the idealized simulations of frozen fractions and INPs from the isothermal prognostic CNT against the linearized version of CNT (Eq. 5):
where Δtmeasurement is the measurement time after the start of the experiment at which the measurement of frozen fraction is made, and Ag is the median ice nucleation active surface area per droplet.
We first estimated the dust total surface area per filter by multiplying the dust surface area per grid box volume simulated in the E3SM model by the volume of air sampled by the ice spectrometer during the MICRE campaign. For ice spectrometer measurements of INPs, filters collected are placed in tubes with 7 mL of deionized water, and immersion freezing spectra are obtained by dispensing 50 µL aliquots of aerosol suspensions into multiple well trays (Creamean et al., 2022b). We multiplied the total particle surface area per filter by a factor of and diluted 11-fold to calculate the median ice nucleation active surface area per droplet (Ag) to be used in constant cooling rate experiments. Because isothermal measurements use one particle per droplet, we renormalized the dust total surface area per filter by the E3SM model simulated dust number concentrations at Macquarie Island. We assumed a lognormal distribution centered around Ag with 1 standard deviation, representative of monodisperse INPs.
We simulated droplet freezing and calculated the ensemble mean frozen fraction using a Monte Carlo approach following Alpert and Knopf (2016). For each experiment, we calculated the ensemble mean frozen fraction by sampling a random amount of ice nucleation surface area for each one of 1000 droplets in 10 trials. From the fraction of droplets frozen and the known volume of air filtered, we calculated INP concentrations for constant cooling rate experiments using Eq. (6) (Vali, 1971).
where FF is the frozen fraction, Vdrop is the volume of each drop 7 mL, Vsuspension is the volume of the aerosol suspension 50 µL diluted 11-fold and Vair is the volume of air per sample from the MICRE measurements. For isothermal experiments, we calculated INP concentrations by multiplying the frozen fraction and the total dust aerosol number concentrations in Macquarie Island co-located using E3SM outputs. Since these are idealized simulations, we chose an average estimate of total dust aerosol number concentrations for the duration of the MICRE campaign. Figure 9 shows idealized simulations of INP concentrations for INP surface areas typically found in Macquarie Island (low dust loading) and the Sahara (high dust loading). We list and describe the idealized immersion freezing simulations in Table 5.
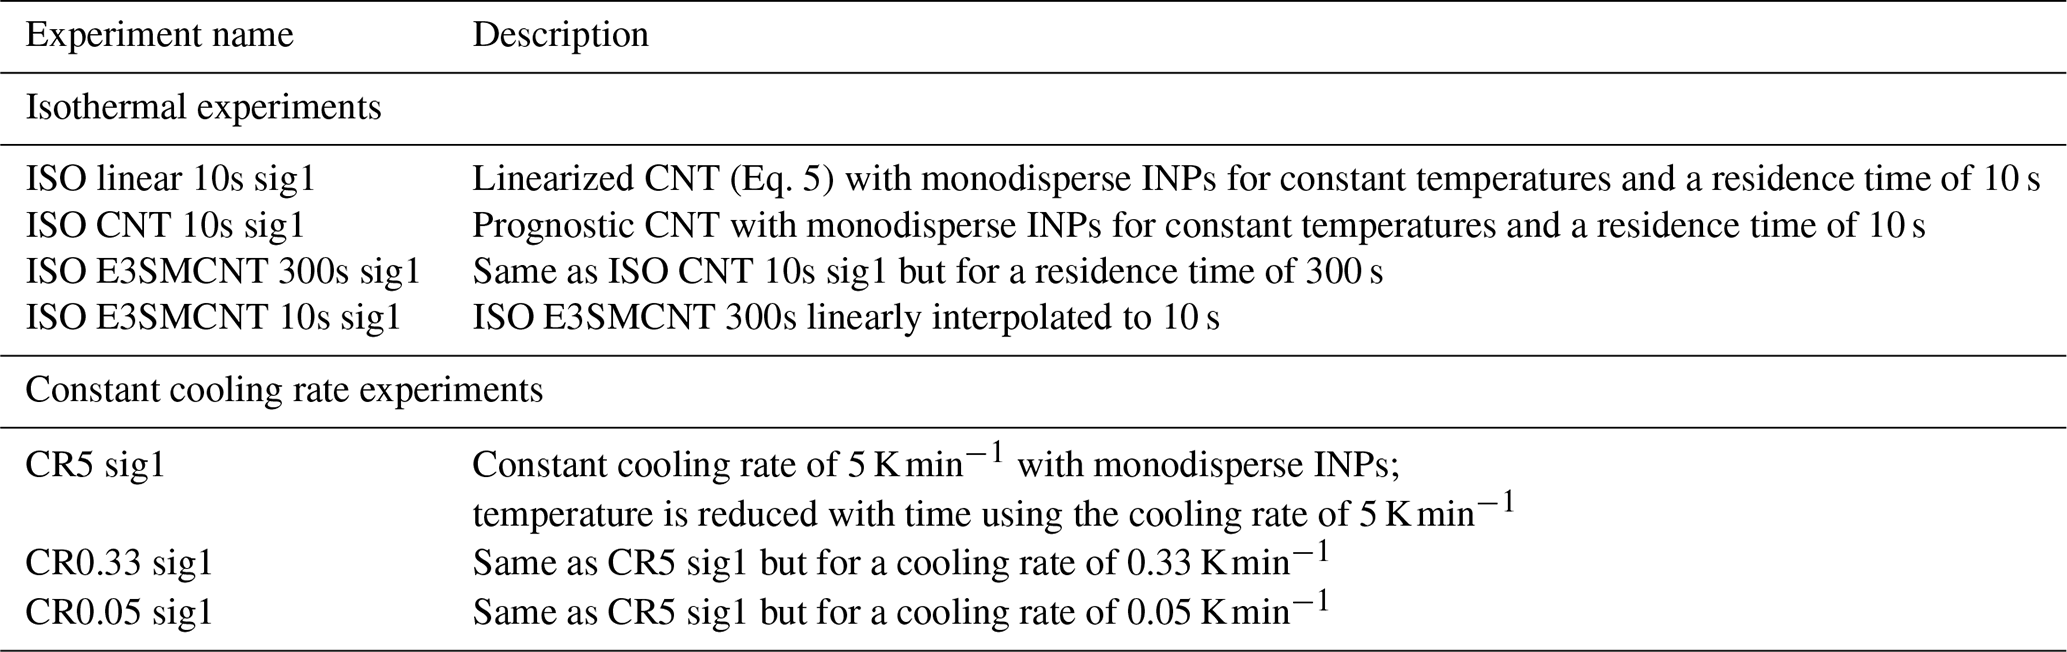
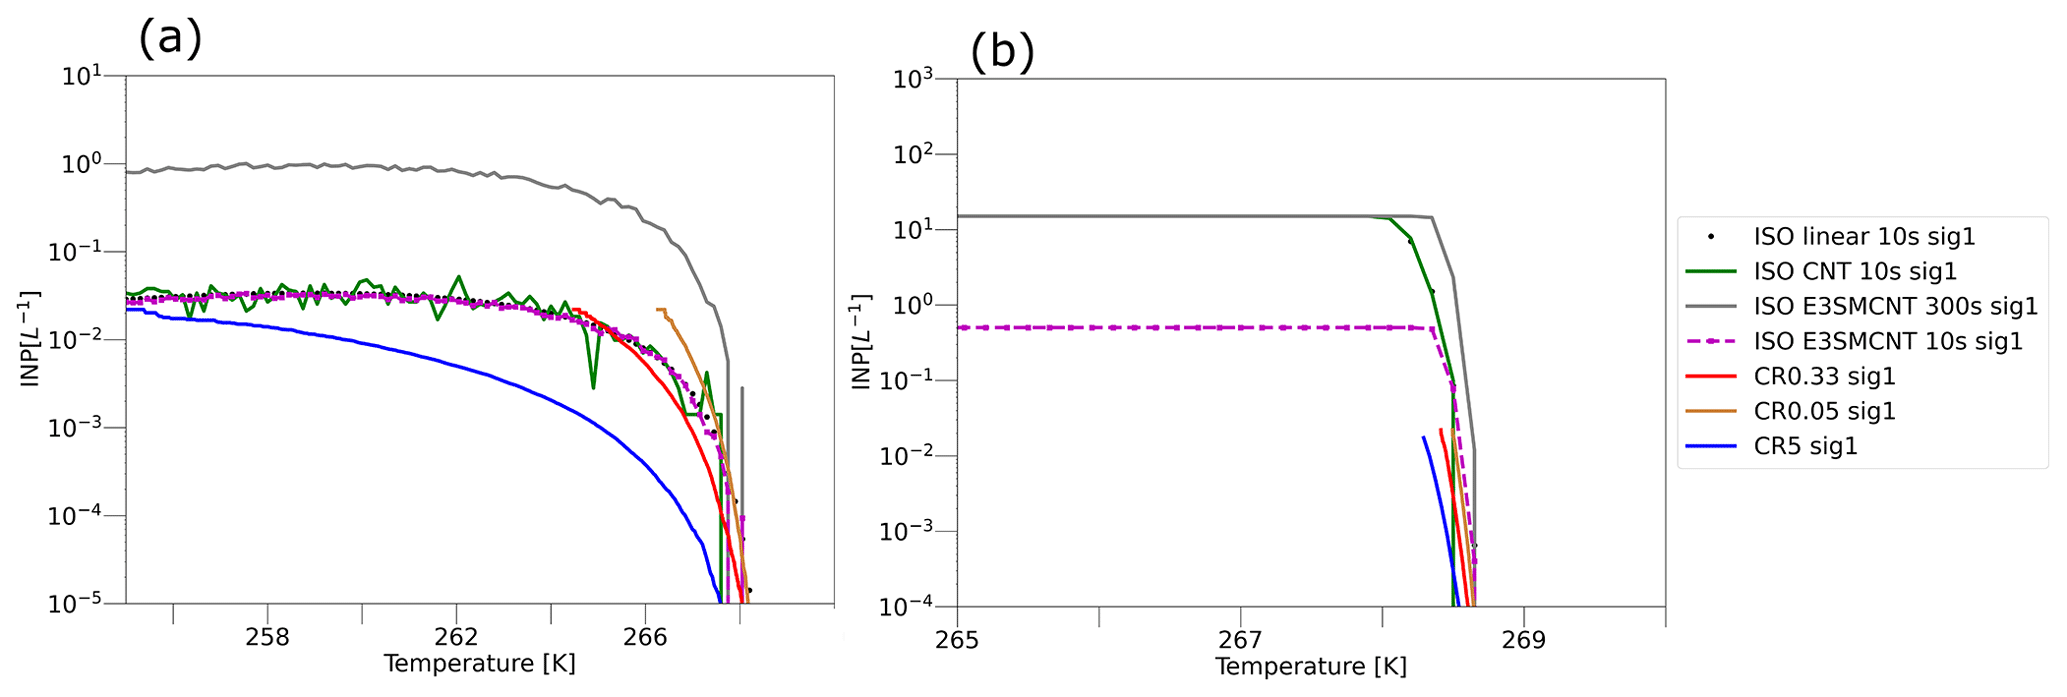
Figure 9Idealized simulations of CNT-based INP concentrations using isothermal and constant cooling rate stochastic freezing experiments. Table 5 describes the different experiments shown in this figure. (a) Low-dust conditions with Ag for isothermal experiments = cm2 per droplet and Ag for constant cooling rate experiments = cm2 per droplet. (b) High-dust conditions with Ag for isothermal experiments = cm2 per droplet and Ag for constant cooling rate experiments = cm2 per droplet.
We find that E3SMv1's CNT-based linearized 10 s diagnostic is a good approximation of the prognostic CNT formulation used in ISO CNT 10s sig1 for low-INP conditions similar to those observed at MICRE. However, the linearized diagnostic underestimates the exact formula by an order of magnitude or more in places like the Sahara where the dust loading is several orders of magnitude higher than in Macquarie Island. This can be attributed to the fact that the E3SM INP 10 s diagnostic is linearly interpolated from the ice nucleation rate tendencies calculated over the E3SM model's internal cloud processing time step size of 300 s (Zhang et al., 2018). This implies that the time dependence of nucleation becomes more non-linear in high-dust-loading conditions and cannot be represented using the linearized formulation of CNT.
We find that in high-dust-loading conditions (Fig. 9b), idealized simulations of different measurement approaches (isothermal and constant cooling rate) yield similar INP results, whereas they yield very different results in low-dust-loading conditions. We find that relatively smaller INP concentrations are simulated for higher cooling rates (Fig. 9; CR5 sig1, CR0.03 sig1, CR0.33 sig1). This is because droplets are exposed to colder temperatures for a shorter duration at higher cooling rates, and therefore the droplets are less likely to freeze. A dependence of frozen fraction on cooling rate has been reported in some past experimental studies of certain INP types that include some pure minerals of certain mass concentrations in drops (e.g. Alpert and Knopf, 2016; Broadley et al., 2012; Herbert et al., 2014).
Because the INP 10 s diagnostic is used only for model comparisons against in situ measurements, this bias in the calculation of the CNT-based INP 10 s diagnostic does not affect the cloud properties simulated in the microphysics modules in E3SM. Revisiting the treatment of CNT in E3SM is beyond the scope of this paper. However, we recommend that future studies of this kind should consider the non-linear time-dependent behavior of heterogeneous ice nucleation in models when comparing INP observations against model simulations, especially in regions with high-INP concentrations.
We show that for aerosol conditions similar to MICRE, the INP concentrations simulated by CNT for idealized ice spectrometer experiments are similar to the INP concentrations estimated using the 10 s INP diagnostic that we have used throughout this paper. These results indicate that the 10 s diagnostic is a reasonable approximation of the exact formulation of CNT used by E3SM, when applied to ice spectrometer measurements at this location.
We have used idealized experiments here to explore the implications of parameterization choices for the evaluation of INPs simulated by models that use CNT parameterizations. However, it is important to note that, to date, the prediction of time-dependent behavior arising from idealized CNT-based simulations has not been systematically validated with experimental results from the ice spectrometer. Given the potentially important implications of these parameterization choices for model evaluation, controlled laboratory studies would be valuable that challenge this theory by targeting experimental conditions where the predictions of CNT differ from those of deterministic parameterizations.
3.6.2 Bias in E3SM-simulated aerosol properties
Biases in E3SM-simulated aerosol could contribute to model–observation differences in INP concentrations. One of the known reasons for underestimation of high-latitude dust concentrations in E3SMv1 is the lack of high-latitude dust emission sources. Shi et al. (2022) found that adding high-latitude dust sources led to improvements in model simulations of INP concentrations in the Arctic. Aerosol bias in climate models can be due to inaccurate representations of one or more important processes in the aerosol life cycle. For example, Rosenberg et al. (2014) compared global climate model simulations with Saharan dust measurements and concluded that most models underestimated coarse-mode Saharan dust emissions. As previously discussed, E3SM underpredicts dust concentrations at high latitudes, due in part to a low bias in the dust lifetime (Wu et al., 2020). Adebiyi and Kok (2020) found that the systematic underestimation of coarse dust in climate models is primarily determined by the dust size distribution. In this study, we have shown that in E3SMv1, biases in dust are ameliorated but do not appear to be fully resolved by revising the dry-deposition coefficients. Many other processes could cause biases in simulated dust, such as structural errors in E3SM's dry deposition, errors in parameterized wet deposition and errors associated with the model's numerics.
3.6.3 Island effects and comparisons to other ship-based campaigns
We discuss the evidence that the island may affect observed INP concentrations and contribute to model–observation differences during MICRE. To understand whether MICRE is representative of the SO region, we compare MICRE INPs with those from other ship-based campaigns in the SO, Measurements of Aerosols, Radiation, and Clouds over the Southern Ocean (MARCUS) (DeMott et al., 2018b) and Antarctic Circumnavigation Expedition (ACE) (Tatzelt et al., 2022). Figure S5 (top panel) shows an aerial shot of Macquarie Island, along with the Aurora Australis ship used for the MARCUS field campaign. MARCUS INP measurements (November 2017–April 2018) were largely collected over the open ocean and likely less impacted by local island effects. The bottom panel in Fig. S5 shows the MICRE filter. ACE INP measurements were carried out during the austral summer of 2016–2017, and INP concentrations were estimated using the immersion freezing droplet array method (Conen et al., 2012).
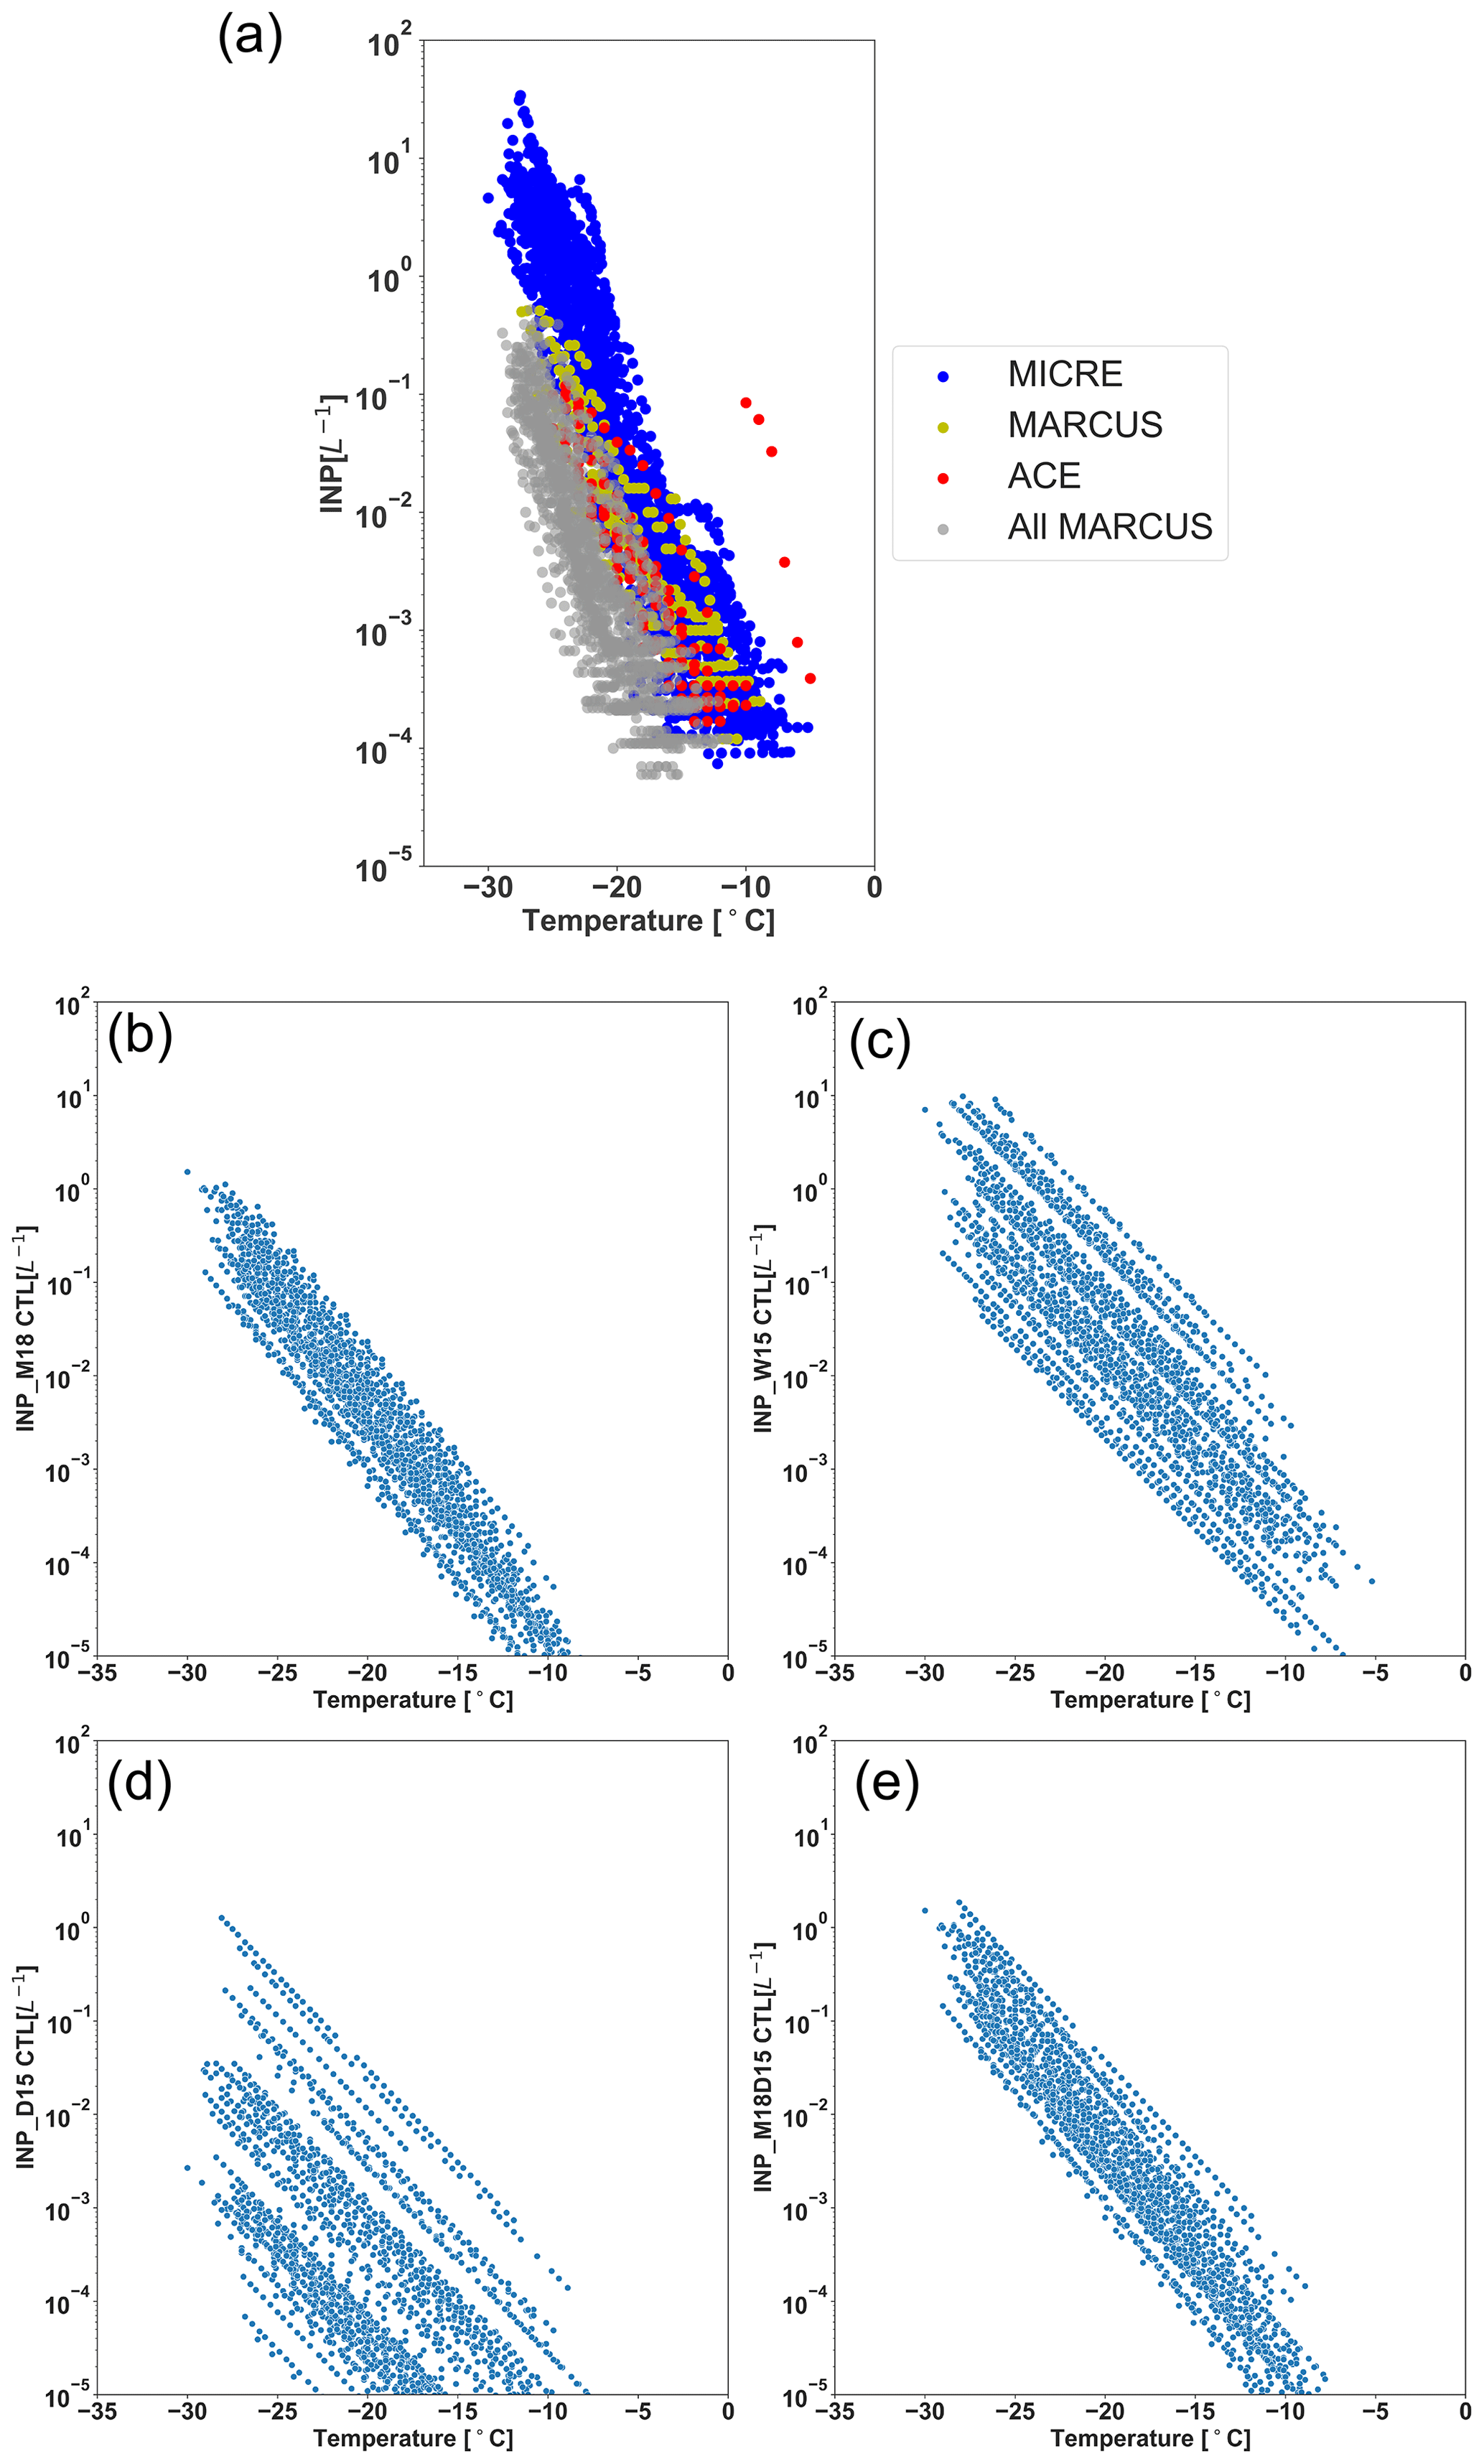
Figure 10Relationships between temperature and INP concentrations. (a) MICRE INP measurements (in blue) along with MARCUS (15–30 March 2018) (in yellow) and ACE (December 2016–January 2017) (red) ship measurements when the ships were closer to Macquarie Island. Also shown are other MARCUS measurements from dates when the ship was in the open ocean (grey). Shown in other panels are INP–temperature dependency for E3SM-simulated INPs (b) M18+D15, (c) M18, (d) D15 and (e) W15. Model INP concentrations are shown only at Macquarie Island for the time period of the MICRE campaign.
Figure 10a shows INP–temperature dependency for INPs collected during MICRE (blue) and the ship-based campaigns in the SO. Below C, observed INP concentrations during MICRE are significantly higher than open-ocean INPs during MARCUS (grey) and ACE (red) campaigns. For temperatures above C, few INP values in the ACE campaign are higher than MICRE, but these are likely the INP data measured when the cruise was in the vicinity of the land (Tatzelt et al., 2022). MARCUS INPs measured closer to Macquarie Island (yellow) are in the range of INP concentrations seen from MICRE. Figure 10a suggests that processes local to Macquarie Island may produce local INP concentrations that are significantly higher than over the open ocean.
Porter et al. (2022) found that small island sources off the coast of Russia contribute to high concentrations of biological INPs in the Arctic due to the nutrient-rich water from the riverine sources. Their findings indicated that islands may be potential sources of biogenic INPs near the Russian coast. Although more work is needed to define the key sources of biological or biogenic INPs affecting MICRE INP concentrations, similar island processes may play a role in altering the marine boundary-layer dynamics near Macquarie Island. These effects could potentially influence surface INP sources, losses and boundary-layer mixing due to surface drag and orographic lifting caused by the island. Inoue et al. (2021) investigated the cruise data from the marginal ice zone in the Chukchi Sea and found high-INP concentrations from sea salt and organic carbon above C during the high wave conditions. Since MICRE collected samples near the surf zone, taller waves and high surface winds may increase sea spray supply to the INPs. Figure S5 shows that the sea spray aerosols emitted from wave breaking on the western side of the island pass over the entire isthmus during the regular strong wind conditions present at these latitudes. The potential existence of local terrestrial or anthropogenic sources from the island could yield high INP concentrations during MICRE compared to open-ocean INP samples from ACE or MARCUS campaigns in the SO. It would be interesting to employ a regional model with atmosphere–ocean–wave coupling to test these localized island processes. If local sources indeed dominate the INPs observed at MICRE, it may therefore be expected to be less directly comparable to global models than the open-ocean measurements from ship-based campaigns such as MARCUS.
For comparison, we also plot simulated INP concentrations versus temperature using different parameterizations (Fig. 10b–e). We find that INPs simulated using the combination of M18 and D15 are more similar to the MARCUS measurements than to MICRE. Therefore, we tentatively conclude that some combination of potential nearby terrestrial and coastal effects, along with model bias in aerosol concentrations from regional sea spray and long-range dust transport, may be the primary cause of model–observation differences at MICRE.
As global models increasingly introduce aerosol-aware treatments of cloud freezing, they improve their process realism and their ability to dynamically simulate climate and Earth system responses to future change (e.g., increases in dust and sea spray emissions associated with higher wind speeds in a warmer climate; increases in Arctic sea spray emissions as the sea ice retreats; and changes in dust emissions associated with desertification, permafrost melt and changes in land management practices). However, with this increased complexity of process representations, model simulations of cloud processes also become increasingly susceptible to biases in simulated aerosol.
In this study, we use the first long-term observations of INPs from the SO to evaluate the potential of a state-of-the art Earth System model, E3SMv1, to accurately simulate SO INPs on the basis of simulated aerosol. First, we evaluate and identify biases in E3SMv1 simulation of the major aerosol sources of INPs in the SO (sea spray and dust aerosol) by using regional in situ observations from across the SO. Consistent with previous studies, we find that E3SMv1 underpredicts near-surface dust aerosol mass concentrations as compared with ground-based in situ measurements at several SO coastal sites in the University of Miami measurement network and the AWARE field campaign. However, vertical dust concentration profiles are consistent with limited aircraft-based measurements in the SO from the ATom campaign. Both the model and observations show little change in dust concentration with height, which is consistent with dust arising from remote sources. However, the decline in sea spray aerosol amount with increasing height above sea level is also consistent with ATom observations, suggesting that E3SMv1 adequately represents the mixing of aerosol tracers between boundary-layer and free-tropospheric air in this region.
These model evaluations enable us to clearly articulate both the key limitations of the MICRE INP observations as a model evaluation dataset and certain key limitations of E3SMv1 aerosol process representations for simulating INPs that are adequate for use in cloud microphysics parameterizations. Here we summarize the main limitations of this study and make recommendations for future field experiments and model developments to overcome these limitations.
For future field campaigns measuring INP concentrations, it will be valuable to include a strategy for parallel measurement of size-resolved aerosol concentration and composition, ideally including super-micron particles. On the other hand, other long-term INP field studies (Schrod et al., 2020; Tatzelt et al., 2022; Welti et al., 2018) have shown that bulk aerosol concentrations do not necessarily correlate with INP climatology. A recent work by Creamean et al. (2022a) also showed that there was no significant relationship between the INP concentrations and particle size in the central Arctic for year-long size-resolved INP observations. However, due to the lack of in situ aerosol measurements during MICRE, we could not conclusively attribute the causes of the model–observation differences or explain the sources of day-to-day variability in measured INPs, although a closer investigation of this issue is the topic of a separate, ongoing study. While a multi-week campaign with simultaneous measurements of INPs, particle chemistry and particle size distributions can improve the predictability of INP concentrations, long-term INP measurements such as MICRE are important to understand the impacts of synoptic weather and seasonal aerosol characteristics on INP concentrations.
Another interesting finding from this study is the unexpected discrepancy between observed INP concentrations at a coastal site (MICRE) and over the open ocean (MARCUS). One approach to utilize island sites yet limit the island impacts is to tie auxiliary observations such as wind speed, wind direction and aerosol properties to days that are significantly impacted by local sources. A second approach is to collect observations directly over the open ocean. Such measurements have been conducted during ship campaigns in recent years. However, with a few notable exceptions, most of these campaigns have lasted only a few weeks. Although ship-based short-term campaigns have provided important insights into INP sources and model performance (McCluskey et al., 2019), in light of the day-to-day variability in INP concentrations during MICRE that is ca. 3 orders of magnitude, long-term multi-season INPs and aerosol measurements are critical to adequately evaluate INP variability over the SO in climate models. Despite their inherent challenges, it would be interesting to explore longer-term at-sea measurement platforms (e.g., ship-based experiments covering multiple months or a full seasonal cycle, unmanned floating platforms) that collect representative samples of INPs in open- and remote-ocean regions.
We note that for all of the INP parameterizations we have used, it was necessary to extend them beyond the conditions for which they were originally developed, in order to apply them to model simulation of INPs. For example, D15 was originally developed for activation temperatures below −19 ∘C, but we have extrapolated it to warmer temperatures in this study. Similarly, the M18 and W15 parameterizations were developed on the basis of sampled aerosol and sea surface microlayer material from limited geographic regions and seasons. However, recent studies have shown that the efficiency of ice nucleating entities in seawater changes in response to ocean biological processes and the INP efficiency is not uniformly high in all marine regions with high primary productivity (Wolf et al., 2020). Future experimental efforts should continue to extend the temperature range of available INP parameterizations and also to evaluate and improve their representativeness of different environmental conditions.
Additionally, INPs can interact with other aerosol particles and trace gases, which can affect their IN ability and lifetime in the atmosphere. For example, Creamean et al. (2019) showed that biological INPs from summertime phytoplankton blooms and bacterial respiration were likely transported hundreds of kilometers from the Bering Strait to the Arctic atmosphere, with the result that these INPs experienced significant exposure to the weather and chemistry along the transport pathways. The impacts of atmospheric and cloud processing on INP effectiveness are currently not fully understood and require more study.
The simulation of INPs in this study is subject to biases in E3SMv1 simulation of dust and sea spray aerosol. However, we find that E3SMv1 underpredicts dust in the SO, consistent with previous studies, while E3SMv1's native CNT parameterization of dust INPs likely overpredicts their freezing efficiency compared to recent measurements and parameterizations of natural and ambient dusts (Cornwell et al., 2021). Therefore, it is important to improve both the simulated dust lifecycle and dust INP parameterizations to correct INP biases in high latitudes.
We examined one model process potentially contributing to biases in aerosol simulation: the choice of coefficients in the model's dry-deposition parameterization. Dry deposition has important impacts on long-range transport of coarse-mode aerosol, and the parameterization used in E3SMv1 was recently shown by Emerson et al. (2020) to be inconsistent with a meta-analysis of experimental results. However, our sensitivity experiment shows that E3SMv1's biases in sea spray and dust deposition were not alleviated by adopting the dry-deposition coefficient values recommended by Emerson et al. (2020). A more comprehensive analysis of biases in E3SM-simulated aerosol, and the causes of those biases, is an important topic that will be examined in separate ongoing and future research activities. As a result, INP concentrations do not improve on using the revised dry-deposition coefficients (Fig. S6).
In addition to the above limitations, additional model development would be helpful to improve the simulation of processes affecting INPs in global models, such as the addition of parameterizations for the emissions of agricultural dusts (Tobo et al., 2014; O'Sullivan et al., 2014; Steinke et al., 2016; Suski et al., 2018), mineralogy of dust particles (Atkinson et al., 2013; Harrison, 2019; Vergara-Temprado et al., 2017) and biological particles that act as efficient INPs at warmer temperatures such as fungal spores and bacteria (Prenni et al., 2009; Huffman et al., 2013; Tobo et al., 2013; Mason et al., 2015).
We have shown that E3SMv1's current immersion freezing parameterizations do not consider sea spray aerosol, which is an important source of INPs in the SO. Further, E3SMv1's treatment of dust immersion freezing is impacted by compensating biases – an underprediction of dust amount was compensated by an overprediction of its effectiveness as INPs. Overall, we find that using recent INP parameterizations for both sea spray and dust (M18 and D15), E3SMv1 would underpredict INPs by 2–3 orders of magnitude at Macquarie Island, although biases over the open ocean are likely smaller. Previous studies have shown that INP simulation errors of 1 order of magnitude (or less) can contribute to significant biases in modeled cloud radiative effects and cloud–climate feedbacks. For example, Zhao et al. (2021) showed that strong seasonal changes in cloud properties and radiative forcing occurred in global model simulations after including MOA INPs. Consequently, global net cloud forcing changed by 0.016 W m−2 per year due to INP variations. Our findings therefore have important implications for climate model simulations of the cloud-phase climate feedback (Murray et al., 2021; Vignon et al., 2021) and seasonal climate in high latitudes (Prenni et al., 2007), particularly for future climate projections where aerosol INP sources will change in a changing Earth system.
INP measurements from MICRE and MARCUS campaigns used in this study can be found in the DOE ARM archive at https://doi.org/10.5439/1638330 (Hill, 2018) (MICRE INP data) and https://doi.org/10.5439/1638968 (DeMott, 2023) (MARCUS INP data). INP measurements from the ACE campaign are available through the web portal Zenodo: https://doi.org/10.5281/zenodo.3832045 (Volpi et al., 2020). FTIR and XRF measurements are available in UCSD digital archives: https://doi.org/10.6075/J0WM1BKV (Liu et al., 2018b). Other data are available on the ARM Data Discovery: https://www.arm.gov/research/campaigns/amf2015aware, last access: 12 March 2023. Dust and sea salt climatology data are available to download through the AEROCOM website: https://aerocom-classic.met.no/DATA/download/DUST_BENCHMARK_HUNEEUS2011/ (Prospero, 1999; Prospero et al., 2010). Atom aerosol data are available at https://espo.nasa.gov/atom/archive/browse/atom/DC8/MER-SAGA-AERO (Thompson et al., 2022). Co-located model and MICRE data and the Python scripts can be found at https://doi.org/10.5281/zenodo.7790011 (Raman et al., 2023). Underway RSV Aurora Australis ship location data were provided by the Australian Antarctic Division and can be accessed through their data center at https://data.aad.gov.au/aadc/metadata/metadata_redirect.cfm?md=/AMD/AU/201718010 (Symons, 2018).
The EAMv1/E3SMv1 source code can be found at https://doi.org/10.11578/E3SM/dc.20180418.36 (E3SM Project, 2018). Code for droplet freezing idealized simulations will be available upon request.
The supplement related to this article is available online at: https://doi.org/10.5194/acp-23-5735-2023-supplement.
AR and SMB designed the model experiments and analyses. AR prepared the figures and wrote the manuscript with help from SMB and other co-authors. BS helped with the model simulations, and KZ and PLM helped with the nudged E3SM simulations and input files for nudging. MW and HW helped with the preparation of figures for comparing aerosol data from the ATom campaign with the E3SM model. PJD, TH and SPA helped with the interpretation of MICRE and MARCUS observations.
At least one of the (co-)authors is a member of the editorial board of Atmospheric Chemistry and Physics. The peer-review process was guided by an independent editor, and the authors also have no other competing interests to declare.
Publisher’s note: Copernicus Publications remains neutral with regard to jurisdictional claims in published maps and institutional affiliations.
This research was funded by the U.S. Department of Energy (DOE), Office of Science, Office of Biological and Environmental Research through the Early Career Research Program (KP1701010/72149). Observations were obtained from the DOE Atmospheric Radiation Measurement (ARM) data discovery archive funded by the Atmospheric System Research (ASR) program. Technical, logistical and ship support for MARCUS and MICRE were provided by the Australian Antarctic Division through Australian Antarctic Science projects 4292 and 4387, and we thank Steven Whiteside, Lloyd Symonds, Rick van den Enden, Peter de Vries, Chris Young, Chris Richards, Andrew Klekociuk, John French, Peter de Vries, Terry Egan, Nick Cartwright and Ken Barrett for all of their assistance. Modeling tools were obtained from the Energy Exascale Earth System Model project. The Pacific Northwest National Laboratory is operated for DOE by Battelle Memorial Institute under contract DE-1713 AC05-76RL01830. This research used high-performance computing resources from the PNNL Research Computing, and the National Energy Research Scientific Computing Center (NERSC), a DOE Office of Science User Facility supported by the Office of Science of the U.S. Department of Energy under contract no. DE-AC02-05CH11231. The authors thank the PNNL communication team members for their efforts in proofreading the manuscript. The authors would also like to thank Christian Tatzelt and the Antarctic Circumnavigation Expedition (ACE) group for sharing the INP concentration dataset from the ACE campaign.
Paul J. DeMott and Thomas Hill were supported by the U.S. Department of Energy's Atmospheric System Research, an Office of Science Biological and Environmental Research program, under award number DE-SC0021116. Hailong Wang, Mingxuan Wu, Balwinder Singh and Kai Zhang were supported as part of the Energy Exascale Earth System Model (E3SM) project (grant no. 65814), funded by the US Department of Energy, Office of Science, Office of Biological and Environmental Research. Po-Lun Ma was supported by the Enabling Aerosol–cloud interactions at GLobal convection-permitting scalES (EAGLES) project (project no. 74358), sponsored by the United States Department of Energy (DOE), Office of Science, Office of Biological and Environmental Research, Earth System Model Development (ESMD) program area.
This paper was edited by Ari Laaksonen and reviewed by two anonymous referees.
Adebiyi, A. A. and Kok, J. F.: Climate models miss most of the coarse dust in the atmosphere, Sci. Adv., 6, eaaz9507 https://doi.org/10.1126/sciadv.aaz9507, 2020. a, b
Alpert, P. A. and Knopf, D. A.: Analysis of isothermal and cooling-rate-dependent immersion freezing by a unifying stochastic ice nucleation model, Atmos. Chem. Phys., 16, 2083–2107, https://doi.org/10.5194/acp-16-2083-2016, 2016. a, b
Atkinson, J. D., Murray, B. J., Woodhouse, M. T., Whale, T. F., Baustian, K. J., Carslaw, K. S., Dobbie, S., O’Sullivan, D., and Malkin, T. L.: The importance of feldspar for ice nucleation by mineral dust in mixed-phase clouds, Nature, 498, 355–358, 2013. a, b
Beall, C. M., Stokes, M. D., Hill, T. C., DeMott, P. J., DeWald, J. T., and Prather, K. A.: Automation and heat transfer characterization of immersion mode spectroscopy for analysis of ice nucleating particles, Atmos. Meas. Tech., 10, 2613–2626, https://doi.org/10.5194/amt-10-2613-2017, 2017. a
Bergametti, G., Marticorena, B., Rajot, J.-L., Foret, G., Alfaro, S., and Laurent, B.: Size-Resolved Dry Deposition Velocities of Dust Particles: In Situ Measurements and Parameterizations Testing, J. Geophys. Res.-Atmos., 123, 11080–11099, 2018. a
Bogenschutz, P. A., Gettelman, A., Morrison, H., Larson, V. E., Craig, C., and Schanen, D. P.: Higher-order turbulence closure and its impact on climate simulations in the Community Atmosphere Model, J. Clim., 26, 9655–9676, 2013. a
Boose, Y., Welti, A., Atkinson, J., Ramelli, F., Danielczok, A., Bingemer, H. G., Plötze, M., Sierau, B., Kanji, Z. A., and Lohmann, U.: Heterogeneous ice nucleation on dust particles sourced from nine deserts worldwide – Part 1: Immersion freezing, Atmos. Chem. Phys., 16, 15075–15095, https://doi.org/10.5194/acp-16-15075-2016, 2016. a
Brechtel, F. J., Kreidenweis, S. M., and Swan, H. B.: Air mass characteristics, aerosol particle number concentrations, and number size distributions at Macquarie Island during the First Aerosol Characterization Experiment (ACE 1), J. Geophys. Res.-Atmos., 103, 16351–16367, 1998. a
Broadley, S. L., Murray, B. J., Herbert, R. J., Atkinson, J. D., Dobbie, S., Malkin, T. L., Condliffe, E., and Neve, L.: Immersion mode heterogeneous ice nucleation by an illite rich powder representative of atmospheric mineral dust, Atmos. Chem. Phys., 12, 287–307, https://doi.org/10.5194/acp-12-287-2012, 2012. a
Bullard, J. E.: The distribution and biogeochemical importance of high-latitude dust in the Arctic and Southern Ocean-Antarctic regions, J. Geophys. Res.-Atmos., 122, 3098–3103, 2017. a
Burrows, S. M., Hoose, C., Pöschl, U., and Lawrence, M. G.: Ice nuclei in marine air: biogenic particles or dust?, Atmos. Chem. Phys., 13, 245–267, https://doi.org/10.5194/acp-13-245-2013, 2013. a
Burrows, S. M., Easter, R. C., Liu, X., Ma, P.-L., Wang, H., Elliott, S. M., Singh, B., Zhang, K., and Rasch, P. J.: OCEANFILMS (Organic Compounds from Ecosystems to Aerosols: Natural Films and Interfaces via Langmuir Molecular Surfactants) sea spray organic aerosol emissions – implementation in a global climate model and impacts on clouds, Atmos. Chem. Phys., 22, 5223–5251, https://doi.org/10.5194/acp-22-5223-2022, 2022a. a, b, c
Burrows, S. M., McCluskey, C. S., Cornwell, G., Steinke, I., Zhang, K., Zhao, B., Zawadowicz, M., Raman, A., Kulkarni, G., China, S., et al.: Ice-Nucleating Particles That Impact Clouds and Climate: Observational and Modeling Research Needs, Rev. Geophys., 60, e2021RG000745, https://doi.org/10.1029/2021RG000745, 2022b. a, b
Conen, F., Henne, S., Morris, C. E., and Alewell, C.: Atmospheric ice nucleators active ≥−12 ∘C can be quantified on PM10 filters, Atmos. Meas. Tech., 5, 321–327, https://doi.org/10.5194/amt-5-321-2012, 2012. a
Cornwell, G. C., McCluskey, C. S., Levin, E. J. T., Suski, K. J., DeMott, P. J., Kreidenweis, S. M., and Prather, K. A.: Direct Online Mass Spectrometry Measurements of Ice Nucleating Particles at a California Coastal Site, J. Geophys. Res.-Atmos., 124, 12157–12172, 2019. a, b
Cornwell, G. C., Sultana, C. M., Prank, M., Cochran, R. E., Hill, T. C., Schill, G. P., DeMott, P. J., Mahowald, N., and Prather, K. A.: Ejection of dust from the ocean as a potential source of marine ice nucleating particles, J. Geophys. Res.-Atmos., 125, e2020JD033073, https://doi.org/10.1029/2020JD033073, 2020. a
Cornwell, G. C., McCluskey, C. S., DeMott, P. J., Prather, K. A., and Burrows, S. M.: Development of heterogeneous ice nucleation rate coefficient parameterizations from ambient measurements, Geophys. Res. Lett., 48, e2021GL095359, https://doi.org/10.1029/2021GL095359, 2021. a, b
Crawford, I., Bower, K. N., Choularton, T. W., Dearden, C., Crosier, J., Westbrook, C., Capes, G., Coe, H., Connolly, P. J., Dorsey, J. R., Gallagher, M. W., Williams, P., Trembath, J., Cui, Z., and Blyth, A.: Ice formation and development in aged, wintertime cumulus over the UK: observations and modelling, Atmos. Chem. Phys., 12, 4963–4985, https://doi.org/10.5194/acp-12-4963-2012, 2012. a, b
Creamean, J., Cross, J. N., Pickart, R., McRaven, L., Lin, P., Pacini, A., Hanlon, R., Schmale, D., Ceniceros, J., Aydell, T., Colombi, N., Bolger, E., and DeMott, P. J.: Ice nucleating particles carried from below a phytoplankton bloom to the Arctic atmosphere, Geophys. Res. Lett., 46, 8572–8581, 2019. a
Creamean, J. M., Barry, K., Hill, T. C., Hume, C., DeMott, P. J., Shupe, M. D., Dahlke, S., Willmes, S., Schmale, J., Beck, I., Hoppe, C. J. M., Fong, A., Chamberlain, E., Bowman, J., Scharien, R., and Persson, O.: Annual cycle observations of aerosols capable of ice formation in central Arctic clouds, Nat. Commun., 13, 1–12, 2022a. a
Creamean, J. M., Hill, T. C., and Hume, C. C.: Ice Nucleation Spectrometer (INS) Instrument Handbook, Tech. rep., Oak Ridge National Lab.(ORNL), Oak Ridge, TN (United States), Atmospheric, 2022b. a
Cuevas, E., Camino, C., Benedetti, A., Basart, S., Terradellas, E., Baldasano, J. M., Morcrette, J. J., Marticorena, B., Goloub, P., Mortier, A., Berjón, A., Hernández, Y., Gil-Ojeda, M., and Schulz, M.: The MACC-II 2007–2008 reanalysis: atmospheric dust evaluation and characterization over northern Africa and the Middle East, Atmos. Chem. Phys., 15, 3991–4024, https://doi.org/10.5194/acp-15-3991-2015, 2015. a
DeMott, P.: MARCUS Ice Nucleating Particle Measurements (revised 7/2020), ARM [data set], https://doi.org/10.5439/1638968 (last access: 14 April 2023), 2018. a
DeMott, P. J., Prenni, A. J., McMeeking, G. R., Sullivan, R. C., Petters, M. D., Tobo, Y., Niemand, M., Möhler, O., Snider, J. R., Wang, Z., and Kreidenweis, S. M.: Integrating laboratory and field data to quantify the immersion freezing ice nucleation activity of mineral dust particles, Atmos. Chem. Phys., 15, 393–409, https://doi.org/10.5194/acp-15-393-2015, 2015. a, b
DeMott, P. J., Hill, T. C., McCluskey, C. S., Prather, K. A., Collins, D. B., Sullivan, R. C., Ruppel, M. J., Mason, R. H., Irish, V. E., Lee, T., Hwang, C. Y., Rhee, T. S., Snider, J. R., McMeeking, G. R., Dhaniyala, S., Lewis, E. R., Wentzell, J. J. B., Abbatt, J., Lee, C., Sultana, C. M., Ault, A. P., Axson, J. L., Diaz Martinez, M., Venero, I., Santos-Figueroa, G., Stokes, M. D., Deane, G. B., Mayol-Bracero, O. L., Grassian, V. H., Bertram, T. H., Bertram, A. K., Moffett, B. F., and Franc, G. D.: Sea spray aerosol as a unique source of ice nucleating particles, P. Natl. Acad. Sci. USA, 113, 5797–5803, 2016. a
DeMott, P. J., Hill, T. C., Marchand, R., and Alexander, S.: Macquarie Island Cloud and Radiation Experiment (MICRE) Ice Nucleating Particle Measurements Field Campaign Report, Tech. rep., DOE Office of Science Atmospheric Radiation Measurement (ARM) Program, 2018a. a, b, c, d
DeMott, P. J., Hill, T. C., and McFarquhar, G.: Measurements of Aerosols, Radiation, and Clouds over the Southern Ocean (MARCUS) ice nucleating particle measurements field campaign report, Tech. rep., DOE Office of Science Atmospheric Radiation Measurement (ARM) Program, 2018b. a
Dennis, J. M., Edwards, J., Evans, K. J., Guba, O., Lauritzen, P. H., Mirin, A. A., St-Cyr, A., Taylor, M. A., and Worley, P. H.: CAM-SE: A scalable spectral element dynamical core for the Community Atmosphere Model, The Int. J. High Perform. C., 26, 74–89, 2012. a
Draxler, R. and Rolph, G.: HYSPLIT (HYbrid Single-Particle Lagrangian Integrated Trajectory) model access via NOAA ARL READY website (https://www.ready.noaa.gov/HYSPLIT_traj.php, last access: last access: 23 March 2023), NOAA Air Resources Laboratory, Silver Spring, MD, 25, 2010. a
Emerson, E. W., Hodshire, A. L., DeBolt, H. M., Bilsback, K. R., Pierce, J. R., McMeeking, G. R., and Farmer, D. K.: Revisiting particle dry deposition and its role in radiative effect estimates, P. Natl. Acad. Sci. USA, 117, 26076–26082, 2020. a, b, c, d, e, f, g
Eskes, H., Huijnen, V., Arola, A., Benedictow, A., Blechschmidt, A.-M., Botek, E., Boucher, O., Bouarar, I., Chabrillat, S., Cuevas, E., Engelen, R., Flentje, H., Gaudel, A., Griesfeller, J., Jones, L., Kapsomenakis, J., Katragkou, E., Kinne, S., Langerock, B., Razinger, M., Richter, A., Schultz, M., Schulz, M., Sudarchikova, N., Thouret, V., Vrekoussis, M., Wagner, A., and Zerefos, C.: Validation of reactive gases and aerosols in the MACC global analysis and forecast system, Geosci. Model Dev., 8, 3523–3543, https://doi.org/10.5194/gmd-8-3523-2015, 2015. a
E3SM Project, DOE: Energy Exascale Earth System Model v1.0, Computer Software, DOE Code [code], https://doi.org/10.11578/E3SM/dc.20180418.36, 2018. a
Fan, J., Leung, L. R., Rosenfeld, D., and DeMott, P. J.: Effects of cloud condensation nuclei and ice nucleating particles on precipitation processes and supercooled liquid in mixed-phase orographic clouds, Atmos. Chem. Phys., 17, 1017–1035, https://doi.org/10.5194/acp-17-1017-2017, 2017. a
Field, P. R., Lawson, R. P., Brown, P. R. A., Lloyd, G., Westbrook, C., Moisseev, D., Miltenberger, A., Nenes, A., Blyth, A., Choularton, T., Connolly, P., Buehl, J., Crosier, J., Cui, Z., Dearden, C., DeMott, P., Flossmann, A., Heymsfield, A., Huang, Y., Kalesse, H., Kanji, Z. A., Korolev, Kirchgaessner, A., Lasher-Trapp, S., Leisner, T., anda V. Phillips, G. M., Stith, J., and Sullivan, S.: Chapter 7. Secondary Ice Production – current state of the science and recommendations for the future, Meteorol. Monogr., 58, 7.1–7.20, https://doi.org/10.1175/AMSMONOGRAPHS-D-16-0014.1, 2017. a
Froyd, K. D., Murphy, D. M., Brock, C. A., Campuzano-Jost, P., Dibb, J. E., Jimenez, J.-L., Kupc, A., Middlebrook, A. M., Schill, G. P., Thornhill, K. L., Williamson, C. J., Wilson, J. C., and Ziemba, L. D.: A new method to quantify mineral dust and other aerosol species from aircraft platforms using single-particle mass spectrometry, Atmos. Meas. Tech., 12, 6209–6239, https://doi.org/10.5194/amt-12-6209-2019, 2019. a
Gabric, A., Cropp, R., McTainsh, G., Johnston, B., Butler, H., Tilbrook, B., and Keywood, M.: Australian dust storms in 2002–2003 and their impact on Southern Ocean biogeochemistry, Global Biogeochem. Cy., 24, https://doi.org/10.1029/2009GB003541, 2010. a
Gelaro, R., McCarty, W., Suárez, M. J., Todling, R., Molod, A., Takacs, L., Randles, C. A., Darmenov, A., Bosilovich, M. G., Reichle, R., Wargan, K., Coy, L., Cullather, R., Draper, C., Akella, S., Buchard, V., Conaty, A., da Silva, A. M., Gu, W., Kim, G., Koster, R., Lucchesi, R., Merkova, D., Nielsen, J. E., Partyka, G., Pawson, S., Putman, W., Rienecker, M., Schubert, S. D., Sienkiewicz, M., and Zhao, B.: The modern-era retrospective analysis for research and applications, version 2 (MERRA-2), J. Clim., 30, 5419–5454, 2017. a, b
Gettelman, A., Morrison, H., Santos, S., Bogenschutz, P., and Caldwell, P.: Advanced two-moment bulk microphysics for global models. Part II: Global model solutions and aerosol–cloud interactions, J. Clim., 28, 1288–1307, 2015. a
Gettelman, A., Bardeen, C., McCluskey, C. S., Järvinen, E., Stith, J., Bretherton, C., McFarquhar, G., Twohy, C., D'Alessandro, J., and Wu, W.: Simulating observations of Southern Ocean clouds and implications for climate, J. Geophys. Res.-Atmos., 125, e2020JD032619, https://doi.org/10.1029/2020JD032619, 2020. a
Ginoux, P., Prospero, J. M., Torres, O., and Chin, M.: Long-term simulation of global dust distribution with the GOCART model: correlation with North Atlantic Oscillation, Environ. Model. Softw., 19, 113–128, 2004. a
Gliß, J., Mortier, A., Schulz, M., Andrews, E., Balkanski, Y., Bauer, S. E., Benedictow, A. M. K., Bian, H., Checa-Garcia, R., Chin, M., Ginoux, P., Griesfeller, J. J., Heckel, A., Kipling, Z., Kirkevåg, A., Kokkola, H., Laj, P., Le Sager, P., Lund, M. T., Lund Myhre, C., Matsui, H., Myhre, G., Neubauer, D., van Noije, T., North, P., Olivié, D. J. L., Rémy, S., Sogacheva, L., Takemura, T., Tsigaridis, K., and Tsyro, S. G.: AeroCom phase III multi-model evaluation of the aerosol life cycle and optical properties using ground- and space-based remote sensing as well as surface in situ observations, Atmos. Chem. Phys., 21, 87–128, https://doi.org/10.5194/acp-21-87-2021, 2021. a
Golaz, J.-C., Larson, V. E., and Cotton, W. R.: A PDF-based model for boundary layer clouds. Part I: Method and model description, J. Atmos. Sci., 59, 3540–3551, 2002. a
Golaz, J.-C., Caldwell, P. M., Van Roekel, L. P., Petersen, M. R., Tang, Q., Wolfe, J. D., Abeshu, G., Anantharaj, V., Asay-Davis, X. S., Bader, D. C., Baldwin, S. A., Bisht, G., Bogenschutz, P. A., Branstetter, M., Brunke, M. A., Brus, S. R., Burrows, S. M., Cameron-Smith, P. J., Donahue, A. S., ... Zhu, Q.: The DOE E3SM coupled model version 1: Overview and evaluation at standard resolution, J. Adv. Model. Earth Sys., 11, 2089–2129, 2019. a, b
Gong, X., Wex, H., Müller, T., Wiedensohler, A., Höhler, K., Kandler, K., Ma, N., Dietel, B., Schiebel, T., Möhler, O., and Stratmann, F.: Characterization of aerosol properties at Cyprus, focusing on cloud condensation nuclei and ice-nucleating particles, Atmos. Chem. Phys., 19, 10883–10900, https://doi.org/10.5194/acp-19-10883-2019, 2019. a
Hande, L. B. and Hoose, C.: Partitioning the primary ice formation modes in large eddy simulations of mixed-phase clouds, Atmos. Chem. Phys., 17, 14105–14118, https://doi.org/10.5194/acp-17-14105-2017, 2017. a
Harrison, A. D.: Ice nucleation by mineral dusts, Ph.D. thesis, University of Leeds, https://etheses.whiterose.ac.uk/25833/ (last access: 28 April 2023), 2019. a
Hartmann, M., Blunier, T., Brügger, S. O., Schmale, J., Schwikowski, M., Vogel, A., Wex, H., and Stratmann, F.: Variation of ice nucleating particles in the European Arctic over the last centuries, Geophys. Res. Lett., 46, 4007–4016, 2019. a
Hawker, R. E., Miltenberger, A. K., Wilkinson, J. M., Hill, A. A., Shipway, B. J., Cui, Z., Cotton, R. J., Carslaw, K. S., Field, P. R., and Murray, B. J.: The temperature dependence of ice-nucleating particle concentrations affects the radiative properties of tropical convective cloud systems, Atmos. Chem. Phys., 21, 5439–5461, https://doi.org/10.5194/acp-21-5439-2021, 2021. a
Herbert, R. J., Murray, B. J., Whale, T. F., Dobbie, S. J., and Atkinson, J. D.: Representing time-dependent freezing behaviour in immersion mode ice nucleation, Atmos. Chem. Phys., 14, 8501–8520, https://doi.org/10.5194/acp-14-8501-2014, 2014. a
Hill, T.: Ice nucleating particle concentrations at Macquarie Island, ARM [data set], https://doi.org/10.5439/1638330 (last access: 12 March 2022), 2018. a
Hoose, C., Kristjánsson, J., and Burrows, S.: How important is biological ice nucleation in clouds on a global scale?, Environ. Res. Lett., 5, 024009, https://doi.org/10.1088/1748-9326/5/2/024009, 2010. a, b
Hu, Y., Rodier, S., Xu, K.-m., Sun, W., Huang, J., Lin, B., Zhai, P., and Josset, D.: Occurrence, liquid water content, and fraction of supercooled water clouds from combined CALIOP/IIR/MODIS measurements, J. Geophys. Res.-Atmos., 115, D00H34, https://doi.org/10.1029/2009JD012384, 2010. a
Huffman, J. A., Prenni, A. J., DeMott, P. J., Pöhlker, C., Mason, R. H., Robinson, N. H., Fröhlich-Nowoisky, J., Tobo, Y., Després, V. R., Garcia, E., Gochis, D. J., Harris, E., Müller-Germann, I., Ruzene, C., Schmer, B., Sinha, B., Day, D. A., Andreae, M. O., Jimenez, J. L., Gallagher, M., Kreidenweis, S. M., Bertram, A. K., and Pöschl, U.: High concentrations of biological aerosol particles and ice nuclei during and after rain, Atmos. Chem. Phys., 13, 6151–6164, https://doi.org/10.5194/acp-13-6151-2013, 2013. a
Huijnen, V. and Eskes, H.: Skill Scores and Evaluation Methodology for The MACC II Project, MACC-II Deliverable D_85.2, https://atmosphere.copernicus.eu/sites/default/files/repository/MACCII_FinalReport_0.pdf, last access: 28 April 2023. a
Huneeus, N., Schulz, M., Balkanski, Y., Griesfeller, J., Prospero, J., Kinne, S., Bauer, S., Boucher, O., Chin, M., Dentener, F., Diehl, T., Easter, R., Fillmore, D., Ghan, S., Ginoux, P., Grini, A., Horowitz, L., Koch, D., Krol, M. C., Landing, W., Liu, X., Mahowald, N., Miller, R., Morcrette, J.-J., Myhre, G., Penner, J., Perlwitz, J., Stier, P., Takemura, T., and Zender, C. S.: Global dust model intercomparison in AeroCom phase I, Atmos. Chem. Phys., 11, 7781–7816, https://doi.org/10.5194/acp-11-7781-2011, 2011. a
Inoue, J., Tobo, Y., Taketani, F., and Sato, K.: Oceanic Supply of Ice-Nucleating Particles and Its Effect on Ice Cloud Formation: A Case Study in the Arctic Ocean During a Cold-Air Outbreak in Early Winter, Geophys. Res. Lett., 48, e2021GL094646, https://doi.org/10.1029/2021GL094646 2021, 2021. a
Ito, A. and Kok, J. F.: Do dust emissions from sparsely vegetated regions dominate atmospheric iron supply to the Southern Ocean?, J. Geophys. Res.-Atmos., 122, 3987–4002, 2017. a
Kanji, Z. A., Ladino, L. A., Wex, H., Boose, Y., Burkert-Kohn, M., Cziczo, D. J., and Krämer, M.: Overview of ice nucleating particles, Meteorol. Monogr., 58, 1–1, 2017. a, b, c, d, e
Kanji, Z. A., Welti, A., Corbin, J. C., and Mensah, A. A.: Black carbon particles do not matter for immersion mode ice nucleation, Geophys. Res. Lett., 47, e2019GL086764, https://doi.org/10.1029/2019GL086764, 2020. a
Kawai, K., Matsui, H., and Tobo, Y.: High Potential of Asian Dust to Act as Ice Nucleating Particles in Mixed-Phase Clouds Simulated With a Global Aerosol-Climate Model, J. Geophys. Res.-Atmos., 126, e2020JD034263, https://doi.org/10.1029/2020JD034263, 2021. a
Knopf, D., Alpert, P., Wang, B., and Aller, J.: Stimulation of ice nucleation by marine diatoms, Nat. Geosci., 4, 88–90, 2011. a
Knopf, D. A., Barry, K. R., Brubaker, T. A., Jahl, L. G., Jankowski, K. A., Li, J., Lu, Y., Monroe, L. W., Moore, K. A., Rivera-Adorno, F. A., Sauceda, K. A., Shi, Y., Tomlin, J. M., Vepuri, H. S. K., Wang, P., Lata, N. N., Levin, E. J. T., Creamean, J. M., Hill, T. C. J., China, S., Alpert, P. A., Moffet, R. C., Hiranuma, N., Sullivan, R. C., Fridlind, A. M., West, M., Riemer, N., Laskin, A., DeMott, P. J., and Liu, X.: Aerosol–Ice Formation Closure: A Southern Great Plains Field Campaign, B. Am. Meteorol. Soc., 102, E1952–E1971, https://doi.org/10.1175/BAMS-D-20-0151.1, 2021. a
Komurcu, M., Storelvmo, T., Tan, I., Lohmann, U., Yun, Y., Penner, J. E., Wang, Y., Liu, X., and Takemura, T.: Intercomparison of the cloud water phase among global climate models, J. Geophys. Res.-Atmos., 119, 3372–3400, 2014. a
Koop, T. and Murray, B. J.: A physically constrained classical description of the homogeneous nucleation of ice in water, J. Chem. Phys., 145, 211915, https://doi.org/10.1063/1.4962355, 2016. a
Korolev, A. and Leisner, T.: Review of experimental studies of secondary ice production, Atmos. Chem. Phys., 20, 11767–11797, https://doi.org/10.5194/acp-20-11767-2020, 2020. a
Larson, V. E. and Golaz, J.-C.: Using probability density functions to derive consistent closure relationships among higher-order moments, Mon. Weather Rev., 133, 1023–1042, 2005. a
Larson, V. E., Golaz, J.-C., and Cotton, W. R.: Small-scale and mesoscale variability in cloudy boundary layers: Joint probability density functions, J. Atmos. Sci., 59, 3519–3539, 2002. a
Lawrence, P. J. and Chase, T. N.: Representing a new MODIS consistent land surface in the Community Land Model (CLM 3.0), J. Geophys. Res.-Biogeosc., 112, G01023, https://doi.org/10.1029/2006JG000168, 2007. a
Liu, J., Dedrick, J., Russell, L. M., Senum, G. I., Uin, J., Kuang, C., Springston, S. R., Leaitch, W. R., Aiken, A. C., and Lubin, D.: High summertime aerosol organic functional group concentrations from marine and seabird sources at Ross Island, Antarctica, during AWARE, Atmos. Chem. Phys., 18, 8571–8587, https://doi.org/10.5194/acp-18-8571-2018, 2018a. a, b
Liu, J., Lewis, S., and Russell, L. M.: Organic and Elemental Composition of Submicron Aerosol Particles during AWARE at McMurdo Station, Antarctica, UC San Diego Library Digital Collections [data set], https://doi.org/10.6075/J0WM1BKV, 2018b. a
Liu, X., Ma, P.-L., Wang, H., Tilmes, S., Singh, B., Easter, R. C., Ghan, S. J., and Rasch, P. J.: Description and evaluation of a new four-mode version of the Modal Aerosol Module (MAM4) within version 5.3 of the Community Atmosphere Model, Geosci. Model Dev., 9, 505–522, https://doi.org/10.5194/gmd-9-505-2016, 2016. a
Ma, H.-Y., Chuang, C., Klein, S., Lo, M.-H., Zhang, Y., Xie, S., Zheng, X., Ma, P.-L., Zhang, Y., and Phillips, T.: An improved hindcast approach for evaluation and diagnosis of physical processes in global climate models, J. Adv. Model. Earth Sys., 7, 1810–1827, 2015. a
Mahowald, N. M., Muhs, D. R., Levis, S., Rasch, P. J., Yoshioka, M., Zender, C. S., and Luo, C.: Change in atmospheric mineral aerosols in response to climate: Last glacial period, preindustrial, modern, and doubled carbon dioxide climates, J. Geophys. Res.-Atmos., 111, D10202, https://doi.org/10.1029/2005JD006653, 2006. a
Mårtensson, E., Nilsson, E., de Leeuw, G., Cohen, L., and Hansson, H.-C.: Laboratory simulations and parameterization of the primary marine aerosol production, J. Geophys. Res.-Atmos., 108, 4297, https://doi.org/10.1029/2002JD002263, 2003. a
Mason, R. H., Si, M., Li, J., Chou, C., Dickie, R., Toom-Sauntry, D., Pöhlker, C., Yakobi-Hancock, J. D., Ladino, L. A., Jones, K., Leaitch, W. R., Schiller, C. L., Abbatt, J. P. D., Huffman, J. A., and Bertram, A. K.: Ice nucleating particles at a coastal marine boundary layer site: correlations with aerosol type and meteorological conditions, Atmos. Chem. Phys., 15, 12547–12566, https://doi.org/10.5194/acp-15-12547-2015, 2015. a
McCluskey, C., Hill, T., Humphries, R., Rauker, A., Moreau, S., Strutton, P., Chambers, S., Williams, A., McRobert, I., Ward, J., Keywood, M. D., Harnwell, J., Ponsonby, W., Loh, Z. M., Krummel, P. B., Protat, A., Kreidenweis, S. M., and DeMott, P. J.: Observations of ice nucleating particles over Southern Ocean waters, Geophys. Res. Lett., 45, 11989–11997, 2018a. a, b, c
McCluskey, C. S., Hill, T. C., Malfatti, F., Sultana, C. M., Lee, C., Santander, M. V., Beall, C. M., Moore, K. A., Cornwell, G. C., Collins, D. B., Prather, K. A., Jayarathne, T., Stone, E. A., Azam, F., Kreidenweis, S. M., and DeMott, P. J.: A dynamic link between ice nucleating particles released in nascent sea spray aerosol and oceanic biological activity during two mesocosm experiments, J. Atmos. Sci., 74, 151–166, 2017. a, b
McCluskey, C. S., Hill, T. C., Sultana, C. M., Laskina, O., Trueblood, J., Santander, M. V., Beall, C. M., Michaud, J. M., Kreidenweis, S. M., Prather, K. A., Grassian, V., and DeMott, P. J.: A mesocosm double feature: Insights into the chemical makeup of marine ice nucleating particles, J. Atmos. Sci., 75, 2405–2423, 2018b. a
McCluskey, C. S., Ovadnevaite, J., Rinaldi, M., Atkinson, J., Belosi, F., Ceburnis, D., Marullo, S., Hill, T. C., Lohmann, U., Kanji, Z. A., Kreidenweis, S. M., and DeMott, P. J.: Marine and terrestrial organic ice-nucleating particles in pristine marine to continentally influenced Northeast Atlantic air masses, J. Geophys. Res.-Atmos., 123, 6196–6212, 2018c. a, b
McCluskey, C. S., DeMott, P. J., Ma, P.-L., and Burrows, S. M.: Numerical representations of marine ice-nucleating particles in remote marine environments evaluated against observations, Geophys. Res. Lett., 46, 7838–7847, 2019. a, b, c, d, e, f
McCoy, D. T., Burrows, S. M., Wood, R., Grosvenor, D. P., Elliott, S. M., Ma, P.-L., Rasch, P. J., and Hartmann, D. L.: Natural aerosols explain seasonal and spatial patterns of Southern Ocean cloud albedo, Sci. Adv., 1, e1500157, https://doi.org/10.1126/sciadv.1500157, 2015. a, b
McFarquhar, G. M., Bretherton, C. S., Marchand, R., Protat, A., DeMott, P. J., Alexander, S. P., Roberts, G. C., Twohy, C. H., Toohey, D., Siems, S., Huang, Y., Wood, R., Rauber, R. M., Lasher-Trapp, S., Jensen, J., Stith, J. L., Mace, J., Um, J., Järvinen, E., Schnaiter, M., Gettelman, A., Sanchez, K. J., McCluskey, C. S., Russell, L. M., McCoy, I. L., Atlas, R. L., Bardeen, C. G., Moore, K. A., Hill, T. C. J., Humphries, R. S., Keywood, M. D., Ristovski, Z., Cravigan, L., Schofield, R., Fairall, C., Mallet, M. D., Kreidenweis, S. M., Rainwater, B., D’Alessandro, J., Wang, Y., Wu, W., Saliba, G., Levin, E. J. T., Ding, S., Lang, F., Truong, S. C. H., Wolff, C., Haggerty, J., Harvey, M. J., Klekociuk, A. R., and McDonald, A.: Observations of clouds, aerosols, precipitation, and surface radiation over the southern ocean: An overview of CAPRICORN, MARCUS, MICRE, and SOCRATES, B. Am. Meteorol. Soc., 102, E894–E928, 2021. a, b, c
Meskhidze, N. and Nenes, A.: Phytoplankton and cloudiness in the Southern Ocean, Science, 314, 1419–1423, 2006. a
Mignani, C., Creamean, J. M., Zimmermann, L., Alewell, C., and Conen, F.: New type of evidence for secondary ice formation at around −15 ∘C in mixed-phase clouds, Atmos. Chem. Phys., 19, 877–886, https://doi.org/10.5194/acp-19-877-2019, 2019. a
Miltenberger, A. K., Lüttmer, T., and Siewert, C.: Secondary ice formation in idealised deep convection—source of primary ice and impact on glaciation, Atmosphere, 11, 542, https://doi.org/10.3390/atmos11050542, 2020. a
Mitts, B. A., Wang, X., Lucero, D. D., Beall, C. M., Deane, G. B., DeMott, P. J., and Prather, K. A.: Importance of Supermicron Ice Nucleating Particles in Nascent Sea Spray, Geophys. Res. Lett., 48, e2020GL089633, https://doi.org/10.1029/2020GL089633, 2021. a, b
Monahan, E. C.: The Ocean as a Source for Atmospheric Particles, in: The Role of Air-Sea Exchange in Geochemical Cycling, edited by: Buat-Ménard, P., NATO ASI Series, vol 185, Springer, Dordrecht, https://doi.org/10.1007/978-94-009-4738-2_6, 1986. a
Murray, B. J., Carslaw, K. S., and Field, P. R.: Opinion: Cloud-phase climate feedback and the importance of ice-nucleating particles, Atmos. Chem. Phys., 21, 665–679, https://doi.org/10.5194/acp-21-665-2021, 2021. a, b
Neale, R. B., Richter, J. H., and Jochum, M.: The impact of convection on ENSO: From a delayed oscillator to a series of events, J. Clim., 21, 5904–5924, 2008. a
Neff, P. D. and Bertler, N. A.: Trajectory modeling of modern dust transport to the Southern Ocean and Antarctica, J. Geophys. Res.-Atmos., 120, 9303–9322, 2015. a, b, c
Niemand, M., Möhler, O., Vogel, B., Vogel, H., Hoose, C., Connolly, P., Klein, H., Bingemer, H., DeMott, P., Skrotzki, J., et al.: A particle-surface-area-based parameterization of immersion freezing on desert dust particles, J. Atmos. Sci., 69, 3077–3092, 2012. a
O'Sullivan, D., Murray, B. J., Malkin, T. L., Whale, T. F., Umo, N. S., Atkinson, J. D., Price, H. C., Baustian, K. J., Browse, J., and Webb, M. E.: Ice nucleation by fertile soil dusts: relative importance of mineral and biogenic components, Atmos. Chem. Phys., 14, 1853–1867, https://doi.org/10.5194/acp-14-1853-2014, 2014. a
Phillips, V. T. J., Donner, L. J., and Garner, S. T.: Nucleation Processes in Deep Convection Simulated by a Cloud-System-Resolving Model with Double-Moment Bulk Microphysics, J. Atmos. Sci., 64, 738–761, https://doi.org/10.1175/JAS3869.1, 2007. a
Porter, G. C., Adams, M. P., Brooks, I. M., Ickes, L., Karlsson, L., Leck, C., Salter, M. E., Schmale, J., Siegel, K., Sikora, S. N., Tarn, M. D., Vüllers, J., Wernli, H., Zieger, P., Zinke, J., and Murray, B. J.: Highly Active Ice-Nucleating Particles at the Summer North Pole, J. Geophys. Res.-Atmos., 127, e2021JD036059, https://doi.org/10.1029/2021JD036059, 2022. a
Prenni, A. J., Harrington, J. Y., Tjernström, M., DeMott, P. J., Avramov, A., Long, C. N., Kreidenweis, S. M., Olsson, P. Q., and Verlinde, J.: Can ice-nucleating aerosols affect Arctic seasonal climate?, B. Am. Meteorol. Soc., 88, 541–550, 2007. a
Prenni, A. J., Petters, M. D., Kreidenweis, S. M., Heald, C. L., Martin, S. T., Artaxo, P., Garland, R. M., Wollny, A. G., and Pöschl, U.: Relative roles of biogenic emissions and Saharan dust as ice nuclei in the Amazon basin, Nat. Geosci., 2, 402–405, 2009. a
Prospero, J. M.: Long-term measurements of the transport of African mineral dust to the southeastern United States: Implications for regional air quality. Journal of Geophysical Research: Atmospheres, 104(D13), 15917-15927. https://doi.org/10.1029/1999JD900072, 1999 (data available at: https://aerocom-classic.met.no/DATA/download/DUST_BENCHMARK_HUNEEUS2011/, last access: 24 April 2022). a
Prospero, J. M., Landing, W. M., and Schulz, M.:African dust deposition to Florida: Temporal and spatial variability and comparisons to models, J. Geophys. Res.-Atmos., 115, D13304, https://doi.org/10.1029/2009JD012773, 2010 (data available at: https://aerocom-classic.met.no/DATA/download/DUST_BENCHMARK_HUNEEUS2011/, last access: 24 April 2022). a
Raman, A., Hill, T., DeMott, P. J., Singh, B., Zhang, K., Ma, P.-L., Wu, M., Wang, H., Alexander, S. P., and Burrows, S. M.: Data to “Long-term Variability in Immersion-mode Marine Ice Nucleating Particles from Climate Model Simulations and Observations”, Zenodo [data set], https://doi.org/10.5281/zenodo.7790011, 2023. a
Rasch, P. J., Xie, S., Ma, L., Lin, W., Wang, H., Tang, Q., Burrows, S. M., Caldwell, P., Zhang, K., Easter, R. C., Cameron-Smith, P., Singh, B., Wan, H., Golaz, C., Harrop, B. E., Roesler, E., Bacmeister, J., Larson, V. E., Evans, K. J., ... Yang, Y.: An overview of the atmospheric component of the Energy Exascale Earth System Model, J. Adv. Model. Earth Sy., 11, 2377–2411, 2019. a
Richter, J. H. and Rasch, P. J.: Effects of convective momentum transport on the atmospheric circulation in the Community Atmosphere Model, version 3, J. Clim., 21, 1487–1499, 2008. a
Rosenberg, P. D., Parker, D. J., Ryder, C. L., Marsham, J. H., Garcia-Carreras, L., Dorsey, J. R., Brooks, I. M., Dean, A. R., Crosier, J., McQuaid, J. B., and Washington, R.: Quantifying particle size and turbulent scale dependence of dust flux in the Sahara using aircraft measurements, J. Geophys. Res.-Atmos., 119, 7577–7598, 2014. a
Sand, M., Samset, B. H., Balkanski, Y., Bauer, S., Bellouin, N., Berntsen, T. K., Bian, H., Chin, M., Diehl, T., Easter, R., Ghan, S. J., Iversen, T., Kirkevåg, A., Lamarque, J.-F., Lin, G., Liu, X., Luo, G., Myhre, G., Noije, T. V., Penner, J. E., Schulz, M., Seland, Ø., Skeie, R. B., Stier, P., Takemura, T., Tsigaridis, K., Yu, F., Zhang, K., and Zhang, H.: Aerosols at the poles: an AeroCom Phase II multi-model evaluation, Atmos. Chem. Phys., 17, 12197–12218, https://doi.org/10.5194/acp-17-12197-2017, 2017. a
Schrod, J., Weber, D., Drücke, J., Keleshis, C., Pikridas, M., Ebert, M., Cvetković, B., Nickovic, S., Marinou, E., Baars, H., Ansmann, A., Vrekoussis, M., Mihalopoulos, N., Sciare, J., Curtius, J., and Bingemer, H. G.: Ice nucleating particles over the Eastern Mediterranean measured by unmanned aircraft systems, Atmos. Chem. Phys., 17, 4817–4835, https://doi.org/10.5194/acp-17-4817-2017, 2017. a
Schrod, J., Thomson, E. S., Weber, D., Kossmann, J., Pöhlker, C., Saturno, J., Ditas, F., Artaxo, P., Clouard, V., Saurel, J.-M., Ebert, M., Curtius, J., and Bingemer, H. G.: Long-term deposition and condensation ice-nucleating particle measurements from four stations across the globe, Atmos. Chem. Phys., 20, 15983–16006, https://doi.org/10.5194/acp-20-15983-2020, 2020. a
Schutgens, N., Sayer, A. M., Heckel, A., Hsu, C., Jethva, H., de Leeuw, G., Leonard, P. J. T., Levy, R. C., Lipponen, A., Lyapustin, A., North, P., Popp, T., Poulsen, C., Sawyer, V., Sogacheva, L., Thomas, G., Torres, O., Wang, Y., Kinne, S., Schulz, M., and Stier, P.: An AeroCom–AeroSat study: intercomparison of satellite AOD datasets for aerosol model evaluation, Atmos. Chem. Phys., 20, 12431–12457, https://doi.org/10.5194/acp-20-12431-2020, 2020. a
Shi, Y. and Liu, X.: Dust radiative effects on climate by glaciating mixed-phase clouds, Geophys. Res. Lett., 46, 6128–6137, 2019. a
Shi, Y., Liu, X., Wu, M., Zhao, X., Ke, Z., and Brown, H.: Relative importance of high-latitude local and long-range-transported dust for Arctic ice-nucleating particles and impacts on Arctic mixed-phase clouds, Atmos. Chem. Phys., 22, 2909–2935, https://doi.org/10.5194/acp-22-2909-2022, 2022. a, b
Sotiropoulou, G., Sullivan, S., Savre, J., Lloyd, G., Lachlan-Cope, T., Ekman, A. M. L., and Nenes, A.: The impact of secondary ice production on Arctic stratocumulus, Atmos. Chem. Phys., 20, 1301–1316, https://doi.org/10.5194/acp-20-1301-2020, 2020. a
Spada, M., Jorba, O., García-Pando, C. P., Janjic, Z., and Baldasano, J.: On the evaluation of global sea-salt aerosol models at coastal/orographic sites, Atmos. Environ., 101, 41–48, 2015. a
Steinke, I., Funk, R., Busse, J., Iturri, A., Kirchen, S., Leue, M., Möhler, O., Schwartz, T., Schnaiter, M., Sierau, B., Toprak, E., Ullrich, R., Ulrich, A., Hoose, C., and Leisner, T.: Ice nucleation activity of agricultural soil dust aerosols from Mongolia, Argentina, and Germany, J. Geophys. Res.-Atmos., 121, 13559–13576, https://doi.org/10.1002/2016JD025160, 2016. a
Steinke, I., DeMott, P. J., Deane, G. B., Hill, T. C. J., Maltrud, M., Raman, A., and Burrows, S. M.: A numerical framework for simulating the atmospheric variability of supermicron marine biogenic ice nucleating particles, Atmos. Chem. Phys., 22, 847–859, https://doi.org/10.5194/acp-22-847-2022, 2022. a, b
Struve, T., Pahnke, K., Lamy, F., Wengler, M., Böning, P., and Winckler, G.: A circumpolar dust conveyor in the glacial Southern Ocean, Nat. Commun., 11, 1–11, 2020. a
Sullivan, S. C., Hoose, C., Kiselev, A., Leisner, T., and Nenes, A.: Initiation of secondary ice production in clouds, Atmos. Chem. Phys., 18, 1593–1610, https://doi.org/10.5194/acp-18-1593-2018, 2018. a
Sun, J., Zhang, K., Wan, H., Ma, P.-L., Tang, Q., and Zhang, S.: Impact of nudging strategy on the climate representativeness and hindcast skill of constrained EAMv1 simulations, J. Adv. Model. Earth Sys., 11, 3911–3933, 2019. a
Suski, K. J., Hill, T. C. J., Levin, E. J. T., Miller, A., DeMott, P. J., and Kreidenweis, S. M.: Agricultural harvesting emissions of ice-nucleating particles, Atmos. Chem. Phys., 18, 13755–13771, https://doi.org/10.5194/acp-18-13755-2018, 2018. a
Symons, L.: Aurora Australis Voyage 1 2017/18 Track and Underway Data, Ver. 1, Australian Antarctic Data Centre, https://data.aad.gov.au/metadata/201718010 (last access: 10 May 2023), 2018. a
Tan, I. and Storelvmo, T.: Sensitivity study on the influence of cloud microphysical parameters on mixed-phase cloud thermodynamic phase partitioning in CAM5, J. Atmos. Sci., 73, 709–728, 2016. a, b
Tan, I. and Storelvmo, T.: Evidence of strong contributions from mixed-phase clouds to Arctic climate change, Geophys. Res. Lett., 46, 2894–2902, 2019. a
Tan, I., Storelvmo, T., and Choi, Y.-S.: Spaceborne lidar observations of the ice-nucleating potential of dust, polluted dust, and smoke aerosols in mixed-phase clouds, J. Geophys. Res.-Atmos., 119, 6653–6665, 2014. a
Tan, I., Storelvmo, T., and Zelinka, M. D.: Observational constraints on mixed-phase clouds imply higher climate sensitivity, Science, 352, 224–227, 2016. a
Tansey, E., Marchand, R., Protat, A., Alexander, S. P., and Ding, S.: Southern Ocean precipitation characteristics observed from CloudSat and ground instrumentation during the Macquarie Island Cloud & Radiation Experiment (MICRE): April 2016 to March 2017, J. Geophys. Res.-Atmos., 127, e2021JD035370, https://doi.org/10.1029/2021JD035370, 2022. a
Tatzelt, C., Henning, S., Welti, A., Baccarini, A., Hartmann, M., Gysel-Beer, M., van Pinxteren, M., Modini, R. L., Schmale, J., and Stratmann, F.: Circum-Antarctic abundance and properties of CCN and INPs, Atmos. Chem. Phys., 22, 9721–9745, https://doi.org/10.5194/acp-22-9721-2022, 2022. a, b, c
Thompson, C. R., Wofsy, S. C., Prather, M. J., Newman, P. A., Hanisco, T. F., Ryerson, T. B., Fahey, D. W., Apel, E. C., Brock, C. A., Brune, W. H., Froyd, K., Katich, J. M., Nicely, J. M., Peischl, J., Ray, E., Veres, P. R., Wang, S., Allen, H. M., Asher, E., Bian, H., Blake, D., Bourgeois, I., Budney, J., Bui, T. P., Butler, A., Campuzano-Jost, P., Chang, C., Chin, M., Commane, R., Correa, G., Crounse, J. D., Daube, B., Dibb, J. E., DiGangi, J. P., Diskin, G. S., Dollner, M., Elkins, J. W., Fiore, A. M., Flynn, C. M., Guo, H., Hall, S. R., Hannun, R. A., Hills, A., Hintsa, E. J., Hodzic, A., Hornbrook, R. S., Huey, L. G., Jimenez, J. L., Keeling, R. F., Kim, M. J., Kupc, A., Lacey, F., Lait, L. R., Lamarque, J., Liu, J., McKain, K., Meinardi, S., Miller, D. O., Montzka, S. A., Moore, F. L., Morgan, E. J., Murphy, D. M., Murray, L. T., Nault, B. A., Neuman, J. A., Nguyen, L., Gonzalez, Y., Rollins, A., Rosenlof, K., Sargent, M., Schill, G., Schwarz, J. P., Clair, J. M. S., Steenrod, S. D., Stephens, B. B., Strahan, S. E., Strode, S. A., Sweeney, C., Thames, A. B., Ullmann, K., Wagner, N., Weber, R., Weinzierl, B., Wennberg, P. O., Williamson, C. J., Wolfe, G. M., and Zeng, L.: The NASA atmospheric Tomography (ATom) mission: imaging the chemistry of the global atmosphere, B. Am. Meteorol. Soc., 103, E761–E790, https://doi.org/10.1175/BAMS-D-20-0315.1, 2021. a
Thompson, C. R., Wofsy, S. C., Prather, M. J., Newman, P. A., Hanisco, T. F., Ryerson, T. B., Fahey, D. W., Apel, E. C., Brock, C. A., Brune, W. H., Froyd, K., Katich, J. M., Nicely, J. M., Peischl, J., Ray, E., Veres, P. R., Wang, S., Allen, H. M., Asher, E., Bian, H., Blake, D., Bourgeois, I., Budney, J., Bui, T. P., Butler, A., Campuzano-Jost, P., Chang, C., Chin, M., Commane, R., Correa, G., Crounse, J. D., Daube, B., Dibb, J. E., DiGangi, J. P., Diskin, G. S., Dollner, M., Elkins, J. W., Fiore, A. M., Flynn, C. M., Guo, H., Hall, S. R., Hannun, R. A., Hills, A., Hintsa, E. J., Hodzic, A., Hornbrook, R. S., Huey, L. G., Jimenez, J. L., Keeling, R. F., Kim, M. J., Kupc, A., Lacey, F., Lait, L. R., Lamarque, J., Liu, J., McKain, K., Meinardi, S., Miller, D. O., Montzka, S. A., Moore, F. L., Morgan, E. J., Murphy, D. M., Murray, L. T., Nault, B. A., Neuman, J. A., Nguyen, L., Gonzalez, Y., Rollins, A., Rosenlof, K., Sargent, M., Schill, G., Schwarz, J. P., Clair, J. M. S., Steenrod, S. D., Stephens, B. B., Strahan, S. E., Strode, S. A., Sweeney, C., Thames, A. B., Ullmann, K., Wagner, N., Weber, R., Weinzierl, B., Wennberg, P. O., Williamson, C. J., Wolfe, G. M., and Zeng, L.: The NASA Atmospheric Tomography (ATom) Mission: Imaging the Chemistry of the Global Atmosphere, B. Am. Meteorol. Soc., 103, E761–E790, https://doi.org/10.1175/BAMS-D-20-0315.1, 2022 (data available at: https://espo.nasa.gov/atom/archive/browse/atom/DC8/MER-SAGA-AERO, last access: 23 April 2023). a
Tobo, Y., Prenni, A. J., DeMott, P. J., Huffman, J. A., McCluskey, C. S., Tian, G., Pöhlker, C., Pöschl, U., and Kreidenweis, S. M.: Biological aerosol particles as a key determinant of ice nuclei populations in a forest ecosystem, J. Geophys. Res.-Atmos., 118, 10–100, 2013. a
Tobo, Y., DeMott, P. J., Hill, T. C. J., Prenni, A. J., Swoboda-Colberg, N. G., Franc, G. D., and Kreidenweis, S. M.: Organic matter matters for ice nuclei of agricultural soil origin, Atmos. Chem. Phys., 14, 8521–8531, https://doi.org/10.5194/acp-14-8521-2014, 2014. a
Trueblood, J. V., Nicosia, A., Engel, A., Zäncker, B., Rinaldi, M., Freney, E., Thyssen, M., Obernosterer, I., Dinasquet, J., Belosi, F., Tovar-Sánchez, A., Rodriguez-Romero, A., Santachiara, G., Guieu, C., and Sellegri, K.: A two-component parameterization of marine ice-nucleating particles based on seawater biology and sea spray aerosol measurements in the Mediterranean Sea, Atmos. Chem. Phys., 21, 4659–4676, https://doi.org/10.5194/acp-21-4659-2021, 2021. a, b
Twohy, C. H., DeMott, P. J., Russell, L. M., Toohey, D. W., Rainwater, B., Geiss, R., Sanchez, K. J., Lewis, S., Roberts, G. C., Humphries, R. S., McCluskey, C. S., Moore, K. A., Selleck, P. W., Keywood, M. D., Ward, J. P., and McRobert, I. M.: Cloud-Nucleating Particles Over the Southern Ocean in a Changing Climate, Earth's Future, 9, e2020EF001673, https://doi.org/10.1029/2020EF001673, 2021. a
Usher, C. R., Michel, A. E., and Grassian, V. H.: Reactions on mineral dust, Chem. Rev., 103, 4883–4940, 2003. a
Vali, G.: Quantitative evaluation of experimental results an the heterogeneous freezing nucleation of supercooled liquids, J. Atmos. Sci., 28, 402–409, 1971. a, b
Vali, G., DeMott, P. J., Möhler, O., and Whale, T. F.: Technical Note: A proposal for ice nucleation terminology, Atmos. Chem. Phys., 15, 10263–10270, https://doi.org/10.5194/acp-15-10263-2015, 2015. a, b
Vergara-Temprado, J., Murray, B. J., Wilson, T. W., O'Sullivan, D., Browse, J., Pringle, K. J., Ardon-Dryer, K., Bertram, A. K., Burrows, S. M., Ceburnis, D., DeMott, P. J., Mason, R. H., O'Dowd, C. D., Rinaldi, M., and Carslaw, K. S.: Contribution of feldspar and marine organic aerosols to global ice nucleating particle concentrations, Atmos. Chem. Phys., 17, 3637–3658, https://doi.org/10.5194/acp-17-3637-2017, 2017. a, b, c
Vergara-Temprado, J., Miltenberger, A. K., Furtado, K., Grosvenor, D. P., Shipway, B. J., Hill, A. A., Wilkinson, J. M., Field, P. R., Murray, B. J., and Carslaw, K. S.: Strong control of Southern Ocean cloud reflectivity by ice-nucleating particles, P. Natl. Acad. Sci. USA, 115, 2687–2692, 2018. a, b, c, d, e
Vignon, É., Alexander, S., DeMott, P., Sotiropoulou, G., Gerber, F., Hill, T., Marchand, R., Nenes, A., and Berne, A.: Challenging and improving the simulation of mid-level mixed-phase clouds over the high-latitude Southern Ocean, J. Geophys. Res.-Atmos., 126, e2020JD033490, https://doi.org/10.1029/2020JD033490, 2021. a, b, c
Volpi, M., Landwehr, S., Thomas, J., and Schmale, J.: Distance to the nearest land/coastline (including small subantarctic islands) for the five-minute average cruise track of the Antarctic Circumnavigation Expedition (ACE) during the austral summer of 2016/2017 (1.0), Zenodo [data set], https://doi.org/10.5281/zenodo.3832045, 2020. a
Wagener, T., Guieu, C., Losno, R., Bonnet, S., and Mahowald, N.: Revisiting atmospheric dust export to the Southern Hemisphere ocean: Biogeochemical implications, Global Biogeochem. Cy., 22, https://doi.org/10.1029/2007GB002984, 2008. a
Wang, H., Easter, R. C., Zhang, R., Ma, P.-L., Singh, B., Zhang, K., Ganguly, D., Rasch, P. J., Burrows, S. M., Ghan, S. J., Lou, S., Qian, Y., Yang, Y., Feng, Y., Flanner, M., Leung, L. R., Liu, X., Shrivastava, M., Sun, J., ... Yoon, H.: Aerosols in the E3SM Version 1: New developments and their impacts on radiative forcing, J. Adv. Model. Earth Sy., 12, e2019MS001851, https://doi.org/10.1029/2019MS001851, 2020. a
Wang, X., Deane, G. B., Moore, K. A., Ryder, O. S., Stokes, M. D., Beall, C. M., Collins, D. B., Santander, M. V., Burrows, S. M., Sultana, C. M., and Prather, K. A.: The role of jet and film drops in controlling the mixing state of submicron sea spray aerosol particles, P. Natl. Acad. Sci., 114, 6978–6983, 2017. a
Wang, Y., Liu, X., Hoose, C., and Wang, B.: Different contact angle distributions for heterogeneous ice nucleation in the Community Atmospheric Model version 5, Atmos. Chem. Phys., 14, 10411–10430, https://doi.org/10.5194/acp-14-10411-2014, 2014. a, b, c, d, e, f, g
Welti, A., Müller, K., Fleming, Z. L., and Stratmann, F.: Concentration and variability of ice nuclei in the subtropical maritime boundary layer, Atmos. Chem. Phys., 18, 5307–5320, https://doi.org/10.5194/acp-18-5307-2018, 2018. a, b
Welti, A., Bigg, E. K., DeMott, P. J., Gong, X., Hartmann, M., Harvey, M., Henning, S., Herenz, P., Hill, T. C. J., Hornblow, B., Leck, C., Löffler, M., McCluskey, C. S., Rauker, A. M., Schmale, J., Tatzelt, C., van Pinxteren, M., and Stratmann, F.: Ship-based measurements of ice nuclei concentrations over the Arctic, Atlantic, Pacific and Southern oceans, Atmos. Chem. Phys., 20, 15191–15206, https://doi.org/10.5194/acp-20-15191-2020, 2020. a
Wilson, T. W., Ladino, L. A., Alpert, P. A., Breckels, M. N., Brooks, I. M., Browse, J., Burrows, S. M., Carslaw, K. S., Huffman, J. A., Judd, C., Kilthau, W. P., Mason, R. H., McFiggans, G., Miller, L. A., Nájera, J. J., Polishchuk, E., Rae, S., Schiller, C. L., Si, M., Temprado, J. V., Whale, T. F., Wong, J. P., Wurl, O., Yakobi-Hancock, J. D., Abbatt, J. P., Aller, J. Y., Bertram, A. K., Knopf, D. A., and Murray, B. J.: A marine biogenic source of atmospheric ice-nucleating particles, Nature, 525, 234–238, 2015. a, b, c
Witek, M. L., Diner, D. J., and Garay, M. J.: Satellite assessment of sea spray aerosol productivity: Southern Ocean case study, J. Geophys. Res.-Atmos., 121, 872–894, 2016. a
Wolf, M. J., Goodell, M., Dong, E., Dove, L. A., Zhang, C., Franco, L. J., Shen, C., Rutkowski, E. G., Narducci, D. N., Mullen, S., Babbin, A. R., and Cziczo, D. J.: A link between the ice nucleation activity and the biogeochemistry of seawater, Atmos. Chem. Phys., 20, 15341–15356, https://doi.org/10.5194/acp-20-15341-2020, 2020. a, b
Wu, M., Liu, X., Yu, H., Wang, H., Shi, Y., Yang, K., Darmenov, A., Wu, C., Wang, Z., Luo, T., Feng, Y., and Ke, Z.: Understanding processes that control dust spatial distributions with global climate models and satellite observations, Atmos. Chem. Phys., 20, 13835–13855, https://doi.org/10.5194/acp-20-13835-2020, 2020. a, b, c, d, e
Yun, Y. and Penner, J. E.: Global model comparison of heterogeneous ice nucleation parameterizations in mixed phase clouds, J. Geophys. Res.-Atmos., 117, D07203, https://doi.org/10.1029/2011JD016506, 2012. a
Zender, C. S., Newman, D., and Torres, O.: Spatial heterogeneity in aeolian erodibility: Uniform, topographic, geomorphic, and hydrologic hypotheses, J. Geophys. Res.-Atmos., 108, 4543, https://doi.org/10.1029/2002JD003039, 2003. a
Zhang, G. J. and McFarlane, N. A.: Sensitivity of climate simulations to the parameterization of cumulus convection in the Canadian Climate Centre general circulation model, Atmosphere-Ocean, 33, 407–446, 1995. a
Zhang, K., Rasch, P. J., Taylor, M. A., Wan, H., Leung, R., Ma, P.-L., Golaz, J.-C., Wolfe, J., Lin, W., Singh, B., Burrows, S., Yoon, J.-H., Wang, H., Qian, Y., Tang, Q., Caldwell, P., and Xie, S.: Impact of numerical choices on water conservation in the E3SM Atmosphere Model version 1 (EAMv1), Geosci. Model Dev., 11, 1971–1988, https://doi.org/10.5194/gmd-11-1971-2018, 2018. a
Zhang, L., Gong, S., Padro, J., and Barrie, L.: A size-segregated particle dry deposition scheme for an atmospheric aerosol module, Atmos. Environ., 35, 549–560, 2001. a
Zhao, X., Liu, X., Burrows, S. M., and Shi, Y.: Effects of marine organic aerosols as sources of immersion-mode ice-nucleating particles on high-latitude mixed-phase clouds, Atmos. Chem. Phys., 21, 2305–2327, https://doi.org/10.5194/acp-21-2305-2021, 2021. a