the Creative Commons Attribution 4.0 License.
the Creative Commons Attribution 4.0 License.
 | 22 May 2023
Modelling wintertime sea-spray aerosols under Arctic haze conditions
Eleftherios Ioannidis
Jean-Christophe Raut
Louis Marelle
Tatsuo Onishi
Rachel M. Kirpes
Lucia M. Upchurch
Thomas Tuch
Alfred Wiedensohler
Andreas Massling
Henrik Skov
Patricia K. Quinn
Kerri A. Pratt
Anthropogenic and natural emissions contribute to enhanced concentrations of aerosols in the Arctic winter and early spring, with most attention being paid to anthropogenic aerosols that contribute to so-called Arctic haze. Less-well-studied wintertime sea-spray aerosols (SSAs) under Arctic haze conditions are the focus of this study, since they can make an important contribution to wintertime Arctic aerosol abundances. Analysis of field campaign data shows evidence for enhanced local sources of SSAs, including marine organics at Utqiaġvik (formerly known as Barrow) in northern Alaska, United States, during winter 2014. Models tend to underestimate sub-micron SSAs and overestimate super-micron SSAs in the Arctic during winter, including the base version of the Weather Research Forecast coupled with Chemistry (WRF-Chem) model used here, which includes a widely used SSA source function based on Gong et al. (1997). Quasi-hemispheric simulations for winter 2014 including updated wind speed and sea-surface temperature (SST) SSA emission dependencies and sources of marine sea-salt organics and sea-salt sulfate lead to significantly improved model performance compared to observations at remote Arctic sites, notably for coarse-mode sodium and chloride, which are reduced. The improved model also simulates more realistic contributions of SSAs to inorganic aerosols at different sites, ranging from 20 %–93 % in the observations. Two-thirds of the improved model performance is from the inclusion of the dependence on SSTs. The simulation of nitrate aerosols is also improved due to less heterogeneous uptake of nitric acid on SSAs in the coarse mode and related increases in fine-mode nitrate. This highlights the importance of interactions between natural SSAs and inorganic anthropogenic aerosols that contribute to Arctic haze. Simulation of organic aerosols and the fraction of sea-salt sulfate are also improved compared to observations. However, the model underestimates episodes with elevated observed concentrations of SSA components and sub-micron non-sea-salt sulfate at some Arctic sites, notably at Utqiaġvik. Possible reasons are explored in higher-resolution runs over northern Alaska for periods corresponding to the Utqiaġvik field campaign in January and February 2014. The addition of a local source of sea-salt marine organics, based on the campaign data, increases modelled organic aerosols over northern Alaska. However, comparison with previous available data suggests that local natural sources from open leads, as well as local anthropogenic sources, are underestimated in the model. Missing local anthropogenic sources may also explain the low modelled (sub-micron) non-sea-salt sulfate at Utqiaġvik. The introduction of a higher wind speed dependence for sub-micron SSA emissions, also based on Arctic data, reduces biases in modelled sub-micron SSAs, while sea-ice fractions, including open leads, are shown to be an important factor controlling modelled super-micron, rather than sub-micron, SSAs over the north coast of Alaska. The regional results presented here show that modelled SSAs are more sensitive to wind speed dependence but that realistic modelling of sea-ice distributions is needed for the simulation of local SSAs, including marine organics. This study supports findings from the Utqiaġvik field campaign that open leads are the primary source of fresh and aged SSAs, including marine organic aerosols, during wintertime at Utqiaġvik; these findings do not suggest an influence from blowing snow and frost flowers. To improve model simulations of Arctic wintertime aerosols, new field data on processes that influence wintertime SSA production, in particular for fine-mode aerosols, are needed as is improved understanding about possible local anthropogenic sources.
- Article
(8295 KB) - Full-text XML
- BibTeX
- EndNote


The Arctic region is warming faster than any other region on Earth due to carbon dioxide, in particular, and also due to short-lived climate forcers like methane, tropospheric ozone (O3), and aerosols (AMAP, 2015; IPCC, 2021). During winter and early spring, aerosols also affect clouds (aerosol–cloud indirect effects) and, more specifically, cloud droplet number concentrations and size by increasing the longwave emissivity of clouds (longwave warming effect; (Zhao and Garrett, 2015; Horowitz et al., 2020)). At this time of year, elevated aerosol concentrations of black carbon (BC), nitrate (), non-sea-salt (nss) sulfate (), and organic aerosols (OAs) are observed in the Arctic, a phenomenon known as Arctic haze (Rahn and McCaffrey, 1980; Barrie et al., 1994; Quinn et al., 2002), due to the transport of anthropogenic aerosols and precursors from mid-latitude sources and within-Arctic sources (Heidam et al., 2004; Quinn et al., 2007; Law et al., 2014, 2017; Schmale et al., 2018). Natural aerosol sources such as dust, volcanic emissions, and sea-spray aerosols (SSAs) also contribute to wintertime Arctic aerosol burdens (Barrie and Barrie, 1990; Quinn et al., 2002; Zwaaftink et al., 2016; Kirpes et al., 2018), with SSAs also peaking in the wintertime (Schmale et al., 2022). It is important to quantify wintertime natural aerosols, as well as anthropogenic components, since they can affect the Arctic radiative budget via indirect effects (Schmale et al., 2018). There are also important interactions between SSAs and anthropogenic components via heterogeneous uptake on the surfaces of SSAs, leading to inorganic aerosol formation (Su et al., 2022), which can influence the ability of models to simulate Arctic haze. In this study, we focus on SSAs under wintertime Arctic haze conditions.
SSAs are produced by bubble bursting (jet-drop and film-drop formation) on the sea surface due to wind stress during whitecap formation (Monahan et al., 1986). SSA emissions also depend on sea-surface temperatures (SSTs) and salinity (Jaeglé et al., 2011; Sofiev et al., 2011; Revell et al., 2019). Frost flowers and blowing snow have also been proposed as a source in polar regions during wintertime (Xu et al., 2013; Huang and Jaeglé, 2017). SSAs are composed primarily of sodium (Na+), chloride (Cl−), organics, and sea-salt (ss) . SSAs may influence cloud formation, including Arctic mixed-phase clouds (Adachi et al., 2022), since they can act as cloud condensation nuclei (CCN; Quinn et al., 2017); likewise, organics may contribute to ice-nucleating particles (INPs; Burrows et al., 2013). Arctic warming is leading to a decrease in summer sea ice and thinner sea ice during wintertime (Stroeve et al., 2012). Increases in the area of the open ocean or more open leads in sea ice may increase winter SSAs over Arctic coastal regions, potentially influencing radiative forcing (Ma et al., 2008; Eidhammer et al., 2010; Partanen et al., 2014; Schmale et al., 2022).
The ability of models to capture wintertime Arctic aerosols has largely focused on the evaluation of anthropogenic Arctic haze components, particularly BC and (e.g. Eckhardt et al., 2015; Whaley et al., 2022). Whaley et al. (2022) showed that, in general, models underestimate and BC in winter. Very few model studies have assessed both anthropogenic and natural aerosols, like SSAs, and these models do not generally make the distinction between nss and ss components of or OAs. A recent study by Moschos et al. (2022a) estimated that wintertime Arctic OAs have largely anthropogenic origins, but a possible contribution from local marine organics was not considered. An analysis of single-particle data from a field campaign near Utqiaġvik, northern Alaska, in winter 2014 showed that, in addition to organic-sulfate haze aerosols, there were abundant fresh SSAs based on the presence of Na+, Cl−, magnesium, and sulfur in ratios similar to those in seawater, produced locally from open leads and including marine OAs originating from secretions from sea-ice algae and bacteria (Kirpes et al., 2018, 2019). It can be noted that, during winter, fresh SSAs can constitute a significant fraction of particulate matter, contributing up to 40 % of super-micron (1 to 10 µm particle diameter) and 25 % of sub-micron (up to 1 µm particle diameter) aerosol mass (Quinn et al., 2002). Kirpes et al. (2018) also observed aged SSAs, which made up the majority of the sub-micron number fraction, during their campaign at Utqiaġvik. These aged SSAs were internally mixed with secondary or both and , and Cl− was depleted, indicating that multi-phase reactions had occurred during transport. The aged SSAs were sampled in air masses influenced by background Arctic haze and regional northern Alaskan oil field emissions. Their findings support an earlier analysis of Ny-Ålesund (Svalbard) data showing that aged SSAs were always internally mixed with , , and organics (Chi et al., 2015). In fact, heterogeneous reactions occurring on the surface of SSAs involving the uptake of sulfuric, nitric, or organic acids and associated Cl− displacement are more evident in aged SSAs (Chi et al., 2015). Chen et al. (2016) showed that uncertainties in modelled SSAs can have a significant impact on sub-micron and super-micron due to heterogeneous uptake of nitric acid (HNO3) on SSAs, which produces . The uptake of sulfuric acid on SSAs in the marine boundary layer can result in production (Alexander et al., 2005). Li et al. (2018) and Wu et al. (2019) emphasised the importance of heterogeneous reactions occurring on SSAs for improved simulation of and size distributions. Since nitric and sulfuric acid have largely anthropogenic origins, this highlights important links between natural SSAs and anthropogenic inorganic aerosols.
This study is motivated by the findings of Kirpes et al. (2018, 2019) regarding wintertime Arctic aerosols, including SSAs coated with marine organics, in northern coastal Alaska. Our main objectives are to assess the ability of the regional atmospheric Weather Research Forecast coupled with Chemistry (WRF-Chem) model to simulate wintertime aerosols, particularly SSAs, under Arctic haze conditions and, in particular, to examine the model sensitivity to processes which may be influencing SSAs over northern Alaska. We also assess the observed and modelled contributions of SSAs to total inorganic aerosols during Arctic wintertime.
Firstly, we focus on improving the model SSA emission scheme over the wider Arctic during winter. This includes updating the wind speed dependence, including a dependence on SSTs, and adding sources of marine OAs and ss . Due to the links between SSAs and other inorganic aerosols that contribute to Arctic haze, model results are evaluated against observations of all aerosol components at remote Arctic sites. To our knowledge, these aspects have not been considered in previous studies using either WRF-Chem or other models (e.g. Whaley et al., 2022). Secondly, we investigate the sensitivity of modelled SSAs to processes influencing SSAs, including organics and other inorganic aerosols, at Utqiaġvik using the improved model run at a higher resolution over northern Alaska for periods corresponding to the Kirpes et al. (2018, 2019) campaign. The sensitivity of the model results to the addition of a local source of marine organics, wind speed dependence, and sea-ice fractions is investigated based on the findings of this field campaign and other data collected in the Arctic. A possible contribution from frost flowers or blowing snow is also considered.
The model setup, including anthropogenic and natural emissions, is described in Sect. 2. The aerosol observations used to evaluate the model are introduced in Sect. 3. Details about the SSA emission scheme in the base model version, together with improvements to this scheme, are presented in Sect. 4. Evaluation of simulated SSAs as well as other inorganic and organic aerosols against Arctic observations is presented in Sect. 5 together with an estimation of the contribution of SSAs to total inorganic aerosols. Results from the regional study over northern Alaska are presented in Sect. 6. The implications of our findings for the simulation of SSAs under wintertime Arctic haze conditions are presented in Sect. 7 (conclusions).
2.1 Model setup
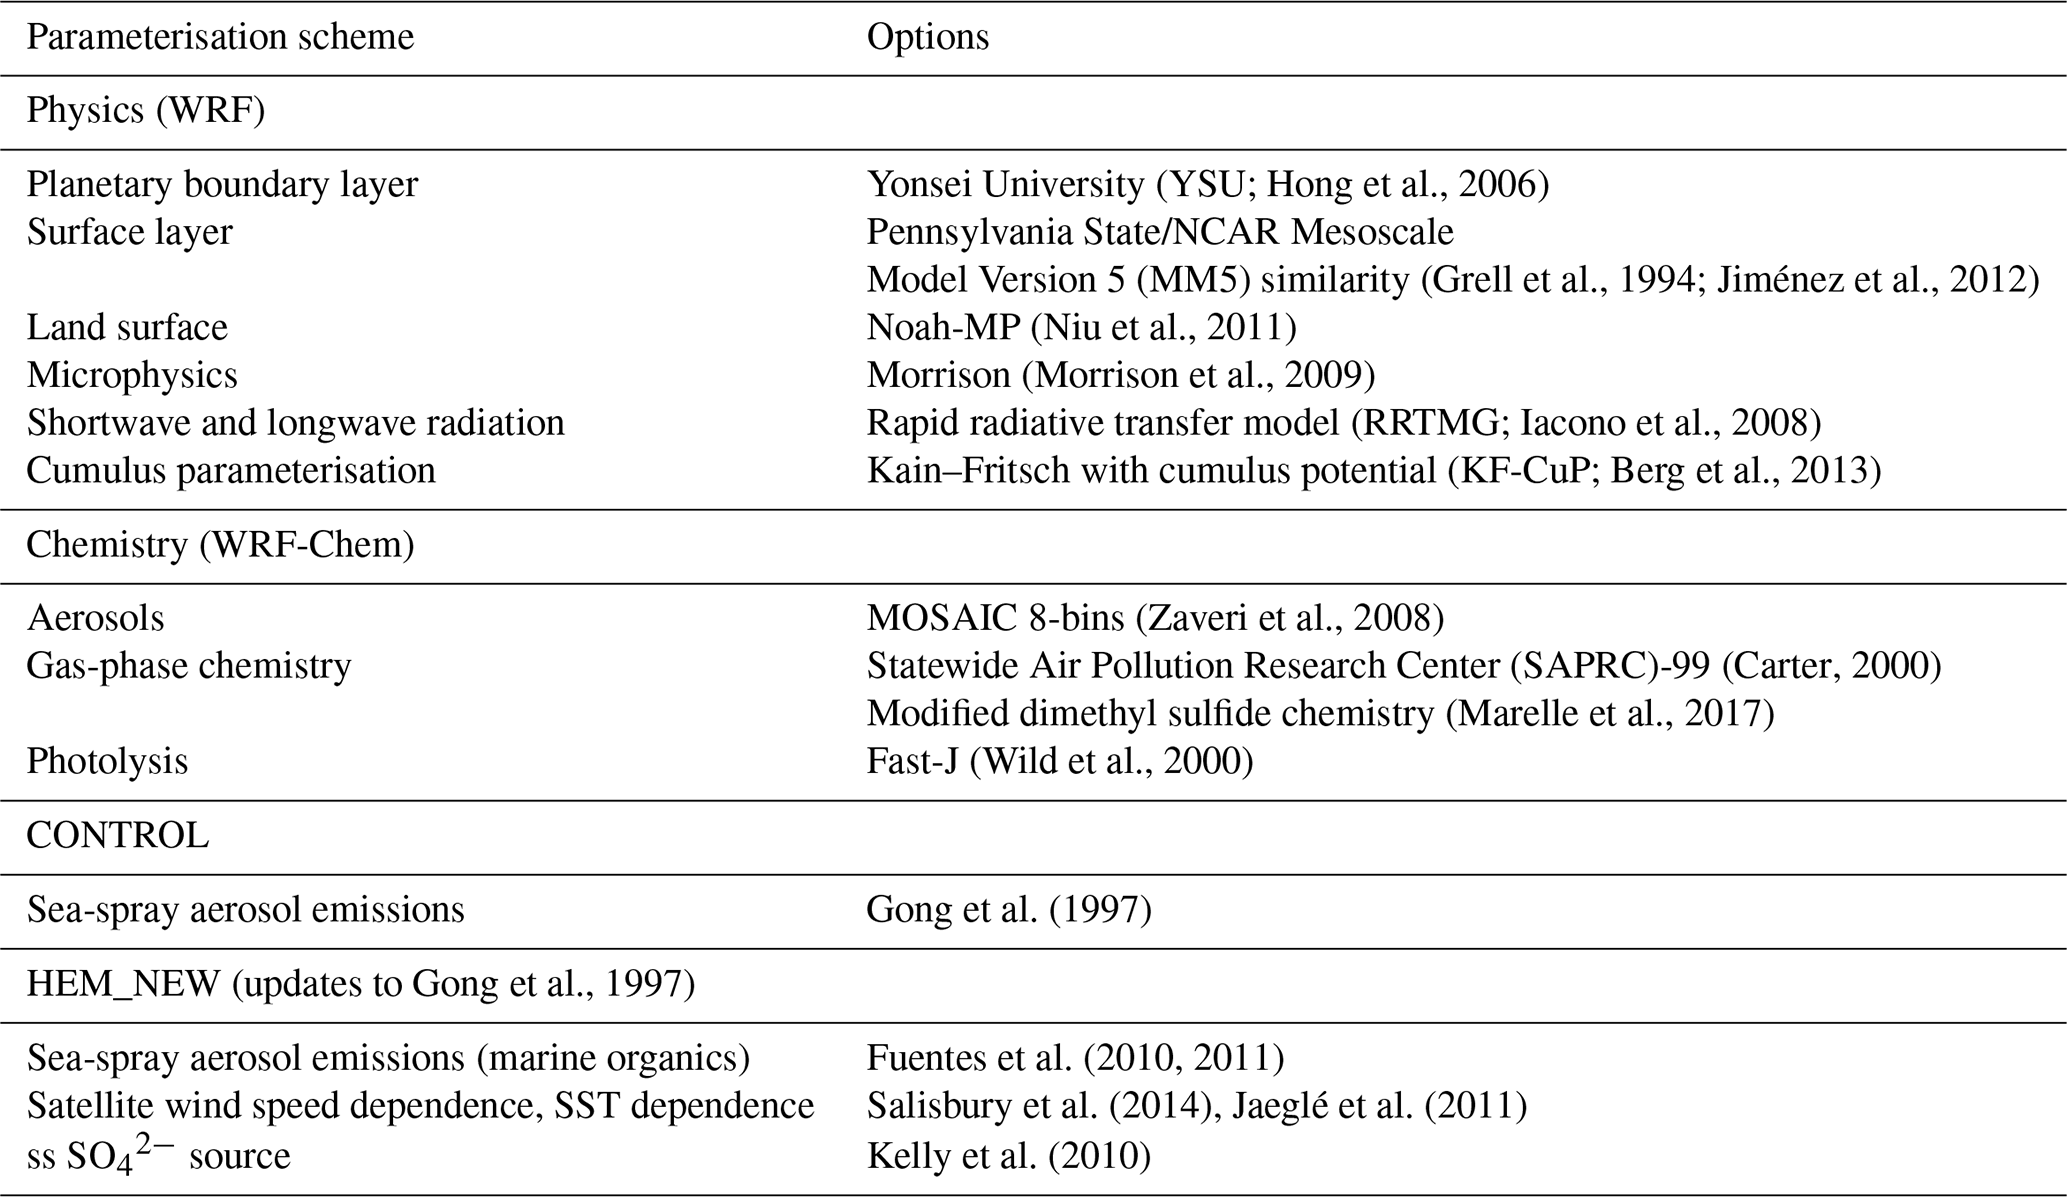
WRF-Chem model version 3.9.1.1 is used in this study. It is a fully coupled, online meteorological and chemical transport mesoscale model (Grell et al., 2005; Fast et al., 2006). Recent improvements to the WRF-Chem model over the Arctic are included in the version used here (Marelle et al., 2017). The model setup, including meteorological and chemical schemes, is shown in Table 1. Briefly, Yonsei University (YSU – boundary layer), Model Version 5 similarity (MM5 – surface layer), and the Noah-Multiparameterization land surface model (Noah MP LSM) are used. More details about the Noah-MP scheme are given in Appendix A.
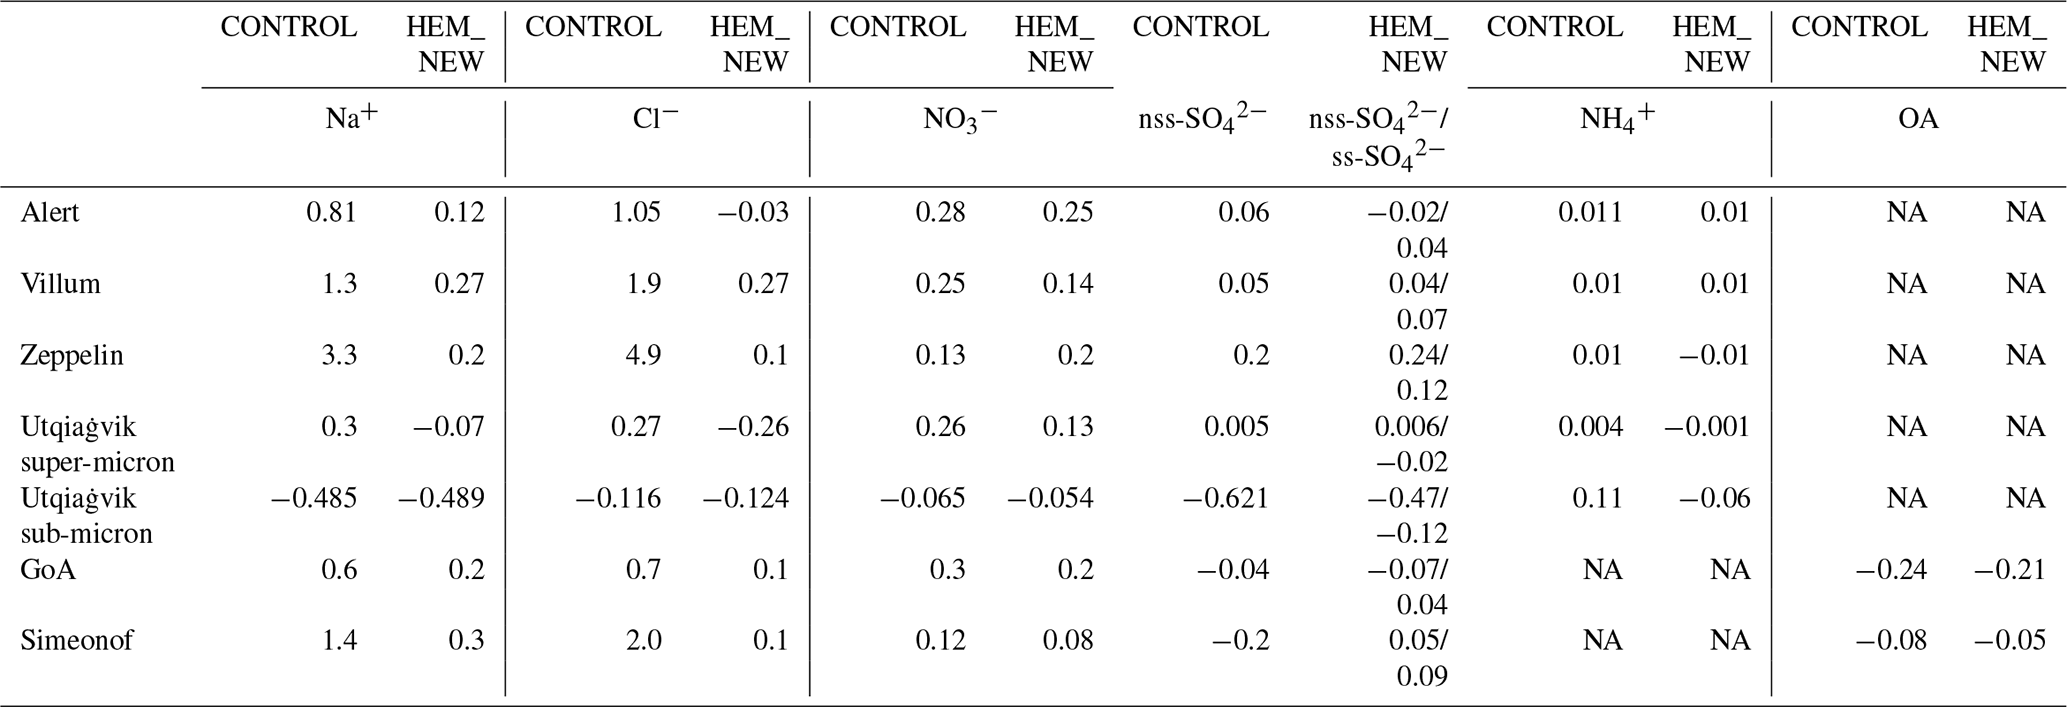
Hong et al., 2006(Grell et al., 1994; Jiménez et al., 2012)(Niu et al., 2011)(Morrison et al., 2009)Iacono et al., 2008Berg et al., 2013(Zaveri et al., 2008)(Carter, 2000)(Marelle et al., 2017)(Wild et al., 2000)Gong et al. (1997)Gong et al., 1997Fuentes et al. (2010, 2011)Salisbury et al. (2014)Jaeglé et al. (2011)Kelly et al. (2010)Table 1WRF-Chem model setup. The source functions for SSA emissions and their main updates are summarised below. CONTROL includes only Gong et al. (1997), while HEM_NEW includes updates to the SSA emission scheme. See text for details.
The well-known processes for aerosols in the atmosphere, like nucleation, evaporation, coagulation, condensation, dry deposition, aerosol–cloud interactions, and aqueous chemistry, are included in the Model for Simulating Aerosol Interactions and Chemistry (MOSAIC; Zaveri et al., 2008) aerosol scheme used here. MOSAIC treats all the major aerosol species, such as , , Cl−, ammonium (), Na+, calcium (Ca2+), BC, and OAs. Reactive inorganic species such as potassium (K+) and magnesium (Mg2+) are not modelled in MOSAIC. The size distribution of each aerosol species is represented by eight bins, from 0.0391 micrometres (µm) to 10 µm: [0.0391 to 0.0781], [0.0781 to 0.1562], [0.1562 to 0.3125], [0.3125 to 0.625], [0.625 to 1.25], [1.25 to 2.5], [2.5 to 5.0], and [5.0 to 10.0] in µm. Each bin is assumed to be internally mixed, and both mass and number are simulated. As a result, aerosols are aged when emitted (coagulated with other species). The MOSAIC version used in this study also includes 18 irreversible heterogeneous reactions (see Table 1 in Zaveri et al., 2008), such as the reaction of HNO3 on sodium chloride (NaCl) to form sodium nitrate (NaNO3), with depletion of Cl−. The reaction between NaCl and sulfuric acid (H2SO4) to produce sodium sulfate (Na2SO4), with associated Cl− depletion, is also included. Nighttime chemistry, notably heterogeneous hydrolysis of dinitrogen pentoxide leading to HNO3 formation, is also included (Archer-Nicholls et al., 2014). The applied MOSAIC version includes secondary organic aerosol (SOA) formation from the oxidation of anthropogenic and biogenic species (Shrivastava et al., 2011; Marelle et al., 2017) and is combined with SAPRC-99 gas-phase chemistry. In the base model, OAs are the sum of SOA and anthropogenic emissions of organic matter (OM). Aqueous chemistry in grid-scale (Morrison et al., 2009) and subgrid-scale clouds (Berg et al., 2015) is also included. Aerosol sedimentation in MOSAIC is calculated throughout the atmospheric column based on the Stokes velocity scheme, as described in Marelle et al. (2017). Wet removal of aerosols by grid-resolved stratiform clouds (precipitation) includes in-cloud and below-cloud removal by rain, snow, and graupel by Brownian diffusion, interception, and impaction mechanisms following Easter et al. (2004) and Chapman et al. (2009). Wet removal due to subgrid-scale convective clouds (Berg et al., 2015) is also included in this MOSAIC version and is described in previous studies (Marelle et al., 2017; Raut et al., 2017).
2.2 Anthropogenic and natural emissions
Anthropogenic emissions are from the Evaluating the Climate and Air Quality Impacts of Short-Lived Pollutants version 6 (ECLIPSE v6b) inventory, with a resolution of (Whaley et al., 2022). Emissions of dimethyl sulfide (DMS) and lightning nitrogen oxides (NOx) are calculated online in the model (see Marelle et al., 2017, and references therein). Dust emissions in MOSAIC are calculated following Shaw et al. (2008). Biogenic emissions for 2014 are calculated online using the Model of Emissions of Gases and Aerosol from Nature (MEGAN) model (Guenther et al., 2012). Details about the treatment of SSA emissions and their improvement in the model are provided in Sect. 4 and are summarised in Table 1.
2.3 Simulations
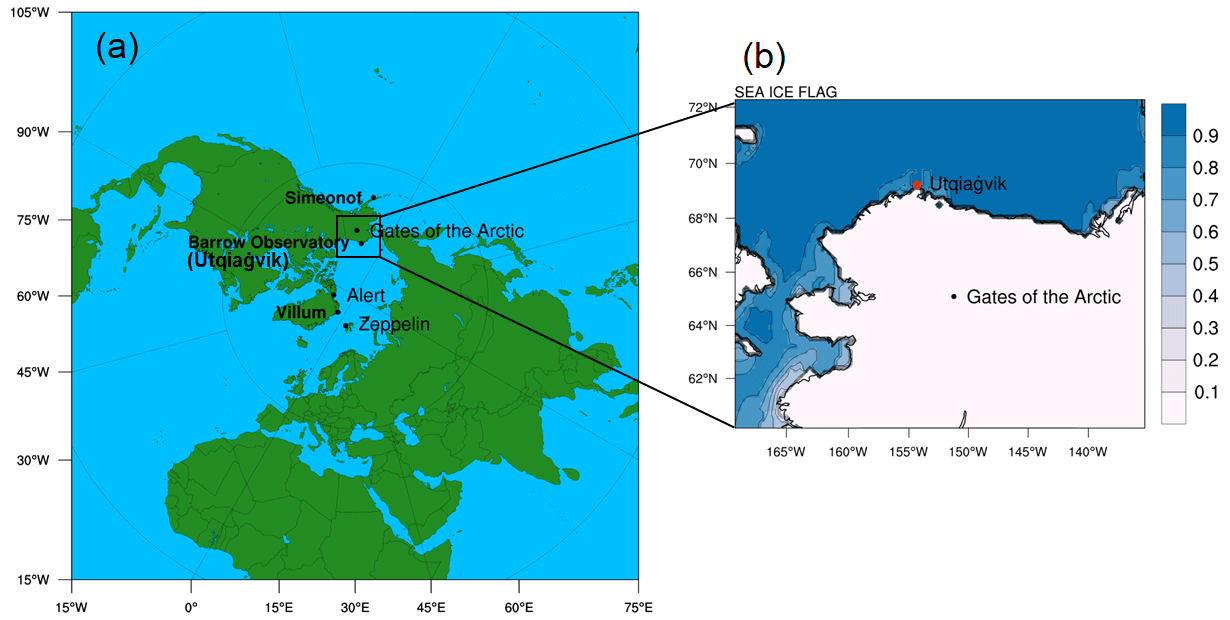
Two simulation domains on a polar stereo-graphic projection are used in this study, as shown in Fig. 1. The first (parent) domain (d01) covers a large part of the Northern Hemisphere with 100 km×100 km horizontal resolution. The boundary and initial conditions are derived from the National Centers for Environmental Prediction Final meteorological reanalysis data (NCEP FNL) and the Model for OZone And Related chemical Tracers (MOZART; Emmons et al., 2010) for atmospheric trace gases and aerosols. The nested domain (d02), run at a horizontal resolution of 20 km×20 km, covers continental Alaska, a small area of northwest Canada, and the Chukchi Sea and Beaufort Sea (see Fig. 1). A total of 50 vertical levels and grid nudging are used for the 100 km resolution domain, while spectral nudging, following Hodnebrog et al. (2019), is implemented in the nested domain. WRF-Chem temperatures and winds are nudged at each dynamical step toward the reanalysis and are updated every 6 h above the atmospheric boundary layer.
Two simulations at 100 km are performed, one using the base model version (CONTROL) and one using CONTROL plus improvements to the SSA emissions (HEM_NEW; see Sect. 4). They are run for 4 months from November 2013 until the end of February 2014, with the first 2 months considered to be a spin-up. The results are evaluated over the wider Arctic in Sect. 5. Results from HEM_NEW are then used as boundary conditions for regional runs over northern Alaska at 20 km for two different periods (23–28 January and 24–28 February 2014) corresponding to the Utqiaġvik campaign described earlier (Kirpes et al., 2018, 2019), referred to as KRP18 and KRP19 from now on (see also Sect. 3.2). In this case, the model is run for 4 d prior to the beginning of each campaign, and this time is considered to be a spin-up. Results from a series of sensitivity runs examining processes that affect SSAs on a regional scale are discussed in Sect. 6. In all runs, model results are output every 3 h.
The sites discussed in this section are shown in Fig. 1.
3.1 Routine monitoring sites
Surface mass concentration data (for aerodynamic diameters (defined as da) < 10 µm) from EMEP (European Monitoring and Evaluation Programme), available via EBAS, for Zeppelin, Ny-Ålesund, Norway (78.9∘ N, 11.9∘ W), and for Alert, Canada (82.5∘ N, −63.3∘ W), are used to evaluate the 100 km model simulations together with total suspended particulate (TSP; cutoff at 20 µm) data from Villum Research Station, Station Nord, Greenland (81.6∘ N, −16.7∘ W), referred to as Villum from now on. The data are collected on a daily (Zeppelin) and weekly (Villum, Alert) basis. At Alert, observations of Na+, Cl−, , and total measured with ion chromatography are used (Sharma et al., 2019). This is also the case at Zeppelin (Aas et al., 2021). At Villum, the same observations are collected using a filter pack over a week and are analysed using ion chromatography (Cl−, total ) and cation ion chromatography (Na+). For all the EBAS stations, observed inorganic aerosols (total , ) are converted to mass concentrations (µg m−3) for comparison to model results using the ratio of the molar weights of and to the molar weights of nitrogen and sulfur, respectively. With regard to measurement uncertainties, EBAS documentation notes that uncertainties range between 33 % and 36 % for Na+, total , , and Cl− at Alert. These high uncertainties may be related to uncertainties in the size cut-off of sub-micron filters. Uncertainties in coarse-particle observations (da<10 µm) are based on the difference between high-volume (TSP) filters collected outside and sub-micron filters collected inside.
Fine-mode (da≤2.5 µm) mass concentration data from the Interagency Monitoring for Protected Visual Environments (IMPROVE) database are also used for model evaluation for the sub-Arctic site Simeonof (55.3∘ N, −160.5∘ W) on the Aleutian Islands, south of Alaska, and for an inland site, Gates of the Arctic (66.9∘ N, −151.5∘ W), referred to as GoA from now on, which is located 391 km southeast of Utqiaġvik town in northern Alaska (see Fig. 1). The samples are collected on-site over the course of 24 h every 3 d (Malm et al., 1994). At these two sites, observations of Na+, Cl−, organic carbon (OC), , and total are used. To compare with the OC observations at the two Alaskan sites, modelled OA is divided by 1.8, the ratio of OMOC reported in the documentation for these two stations (Malm et al., 1994). Sub-micron (da<1.0 µm) and super-micron ( µm) surface mass concentration data from the National Oceanic and Atmospheric Administration (NOAA) Barrow Observatory (71.3∘ N, −156.8∘ W), near Utqiaġvik town (Utqiaġvik from now on), are also used in this study, with daily and weekly temporal coverage, respectively. The sampling site is located 8 km northeast of Utqiaġvik and 3 km southwest of the Arctic Ocean. It is covered with snow during winter and is 20 m above mean sea level (m.s.l.), with a prevailing, east–northeast wind off the Beaufort Sea. Na+, Cl−, , and total mass concentrations are determined by ion chromatography (Quinn et al., 1998) and are sampled only for wind directions between 0 and 130∘ (with 0∘ indicating north). According to Quinn et al. (2002), measurement uncertainties in sub-micron components of SSAs and nss are below 1.0 % ± 6.1 % µg m−3 (concentration ±95 % uncertainty). The uncertainties in sub-micron are below 0.2 % ± 7.8 % µg m−3. The uncertainties in super-micron aerosols can be up to 7 times higher than for sub-micron aerosols, since 7-daily sub-micron samples are collected for every (weekly) super-micron sample. Measurement uncertainties are also due to sampling losses in the inlets. At Utqiaġvik, for particles with a diameter up to 10 µm, losses in the inlet system from all loss mechanisms are estimated to be less than 10 %, and losses of particles with diameters between 0.01 and 1 µm are below 5 % (Sheridan et al., 2001).
At each site, observed ss is calculated from observed Na+ concentrations and the mass ratio of to Na+ in seawater of 0.252 (Bowen, 1979; Calhoun et al., 1991), and nss is the difference between total and ss . Note that, in some cases, observed nss has small negative concentrations due to the depletion of ss through fractionation processes (Quinn et al., 2002). We note that, apart from the sub-micron observations at Utqiaġvik and fine-mode observations from the IMPROVE database, there are no other sub-micron or fine-mode observations collected routinely in the Arctic, as has also been reported recently by Schmale et al. (2022). Finally, data from a scanning mobility particle sizer (SMPS) located at Utqiaġvik are used, providing measurements of particle number distributions at high temporal resolution, with a size range from 8.6 to 985 nm (0.0086 to 0.985 µm). No wind speed criteria have been applied to exclude local (Utqiaġvik town) or regional (e.g. North Slope of Alaska oil fields) pollution. Here, only SMPS observations at Utqiaġvik are used, since observations at the other Arctic sites used in this study are not available for winter 2014, as discussed by Freud et al. (2017).
The model Stokes aerosol diameters equivalent to da, estimated using the Seinfeld and Pandis (1998) formula, are used. Thus, the diameter of modelled sub-micron particles is up to 0.73 µm (including the first four MOSAIC bins and a fraction of the fifth bin), and super-micron particle diameters are between 0.73 to 7.3 µm (a fraction of the fifth bin, the sixth and seventh bins, and a fraction of the eighth bin). Seven MOSAIC bins and a fraction of the eighth bin are used (modelled Stokes ra≤7.3 µm) to compare with Alert and Zeppelin observations (da<10 µm). All model aerosol bins are used to compare with observations at Villum, where the observations are reported as TSP. For each site, modelled aerosols are estimated for the same conditions (temperature, pressure) as the reported observations. Also, observed total OC is assumed to include SOAs, anthropogenic OA emissions, and marine organics. Thus, from now on, it will be referred to as tOC to distinguish it from OAs defined earlier and from OM.
3.2 Campaign data
Details about the field campaign (23–27 January and 24–28 February 2014) measurements near Utqiaġvik, Alaska, can be found in KRP18 and KRP19. Briefly, atmospheric particles were collected using a rotating micro-orifice uniform deposition impactor located 2 m above the snow surface at a site located 5 km across the tundra from the NOAA Barrow Observatory and inland from the Arctic Ocean. The sampled particles were analysed by computer-controlled scanning electron microscopy with energy-scattering X-ray spectroscopy (CCSEM-EDX) to determine the individual particle morphology and elemental composition. The analysed samples were collected either during the daytime or the nighttime and only when wind directions were between 75 and 225∘ to minimise local pollution influence. Data analysis provided information about the different chemical components as a fraction of the total number of particles sampled during the campaign.
This section introduces the treatment of SSA emissions in the base model version of WRF-Chem using the MOSAIC aerosol scheme, followed by a description of the updates to the SSA emissions implemented in the model. The model is run with the original scheme (CONTROL run) and with the updates (HEM_NEW run). Results from both runs are evaluated against observations in the Arctic in Sect. 5.
4.1 SSA emissions – CONTROL run
SSA emission fluxes (F) in MOSAIC are calculated per particle radius r, with 1000 sub-bins per MOSAIC bin, assuming that sea salt is a simple mix of pure NaCl and using the density function (in ) based on Gong et al. (1997), referred to as G97 from now on. The G97 source function represents the rate that seawater droplets form per unit area (sea surface) and as a function of particle radius. The fraction of Na+ is calculated using the molar weight of Na+ and Cl−, and then the fraction of Cl− is estimated, with the total being equal to 1. The G97 density function derived from the source function is based on laboratory experiments described in Monahan et al. (1986), referred to as MO86 from now on. The following expression is used:
where F is a function of U, the 10 m elevation wind speed, r is relative humidity (RH) at 80 %, and . The source function is applied for particles with dry diameters of 0.45 µm or more (equivalent to model particle diameters). For particles with dry diameters less than 0.45 µm, a correction is applied based on reported data in O'Dowd et al. (1997), since G97 overestimates the production of small particles (Gong, 2003; De Leeuw et al., 2011). G97 is based on the whitecap method, where the emission flux scales linearly with the fraction of the ocean area covered by whitecaps. Over open ocean, the whitecap fraction, W(U), is determined as a function of wind speed (Monahan and Muircheartaigh, 1980; MO80 from now on):
This expression for W(U) is included implicitly in Eq. (1) following details provided in MO80. In the base version, SSA emissions are calculated for every grid cell that is open ocean or a salt-water lake. In this study, grid cells which are covered by sea ice are considered together with the fraction that is ice-free. In this way, SSA emissions from open leads are taken into account. It can be noted that this SSA scheme, based on Gong et al. (1997), is still being used in global and regional models (e.g. Community Multiscale Air Quality (CMAQ) Gantt et al., 2015), the Goddard Earth Observing System (GEOS)-Chem, (Huang and Jaeglé, 2017) or in other models (e.g. LOTUS-EUROS; Barthel et al., 2019) to simulate SSAs despite being relatively old. However, modelling studies have shown that G97 overestimates super-micron SSAs (e.g. Jaeglé et al., 2011, referred to as JA11 from now on) or underestimates sub-micron SSAs (e.g. Archer-Nicholls et al., 2014; Gantt et al., 2015).
4.2 Updates to SSA emissions – HEM_NEW run
Here, updates to the model treatment of SSA emissions are described. They are included in the run HEM_NEW, which is also used as boundary conditions for the higher-resolution runs over northern Alaska.
4.2.1 Sub-micron SSA emissions including marine organics
Previous studies have shown that there are large numbers of SSAs down to 10 nm (Ovadnevaite et al., 2014; Cravigan et al., 2015; Xu et al., 2022). Also, data-based studies in the Arctic (Kirpes et al., 2019) and over the Atlantic Ocean (O'Dowd et al., 2004; Ovadnevaite et al., 2011; Saliba et al., 2019) suggest that marine organics associated with SSAs contribute significantly to natural aerosol composition. Marine organics are not included in G97. However, Archer-Nicholls et al. (2014) implemented a scheme in the SSA emission module of MOSAIC based on Fuentes et al. (2010, 2011), referred to as F10 and F11 from now on, to include a source flux for marine organics with dry diameters from 0.003 to 0.45 µm that is coupled to G97 for larger particles. This scheme is activated in HEM_NEW simulations. F10 is applied from the lowest aerosol bin, namely 39 nm. The scheme is based on an analysis of data from a mid-latitude cruise investigating the influence of dissolved OM on the production of sub-micron SSAs. The F10 SSA source function also depends on MO80 whitecap coverage and has a high wind speed dependence. Organic fractions equal to 0.2 for the first and second MOSAIC bins, 0.1 for the third bin, and 0.01 for the remaining bins are used following the high-biogenic-activity scenario which assumes high carbon (C) : Chlorophyll a (Chl a) ratios (see Lee et al., 2010). F11 found that higher particle organic fractions are expected in algal bloom regions with high C : Chl a ratios and with Chl a that varies between 0.4–10 µg L−1. The use of the F11 high-biogenic-activity option is justified, since MODIS-Aqua satellite data (https://neo.gsfc.nasa.gov/view.php?datasetId=MY1DMW_CHLORA&year=2014, last access: 2019) for January and February 2014 show that Chl a south of Alaska, and along the west coast of the United States, varied between 0.3 and 3.0 µg L−1. Fujiki et al. (2009) also found that Chl a varied between 0.4 and 1.0 µg L−1 at six stations south of the Aleutian Islands, Alaska, during a sub-Arctic cruise in autumn 2005. Details about the F10 SSA source function are given in Appendix B. Thus, in the HEM_NEW run, OA also includes marine organics. Possible regional sources of marine organics over northern Alaska are discussed further in Sect. 6.
4.2.2 Wind speed dependence
As noted earlier, SSA emissions are highly dependent on wind speed and sea state (presence of whitecaps). The G97 scheme and the related parameterisation by Gong (2003) depend on the whitecap method and thus have a high wind speed dependence (see Eq. 1). Several studies have tried to improve upon the whitecap method. Callaghan et al. (2008) used an automated whitecap extraction technique to derive two whitecap expressions that differ from MO80 and that are based on cubed relationships for U10. For sub-micron SSAs, Ovadnevaite et al. (2012) showed that source functions, such as those of Gong (2003), based on the MO80 wind speed dependence, are responsible for an overestimation of the SSA emission flux. They found a lower wind speed dependence for small particles based on an autumn field study off the west coast of Ireland. Other factors, such as the wave field (Salisbury et al., 2013) or the fetch-dependent threshold for breaking waves (Revell et al., 2019; Hartery et al., 2020), have also been shown to affect whitecap lifetime, with implications for SSA production. In a study by Salisbury et al. (2014), referred to as SALI14 from now on, satellite data from the Quick Scatterometer (QuikSCAT) were used to derive an expression with a lower wind speed dependence compared to MO80. Here, the SALI14 parameterisation is implemented instead of the MO80 whitecap fraction expression, since it is based on satellite data analysis, providing information with global coverage including the Arctic (e.g. Chukchi Sea and Barents Sea during autumn) and the south of Alaska. The following expression is used:
Based on Fig. 2, in SALI14, the seasonal mean of W(U) using Eq. (3) is lower at latitudes above 40∘ N and 40∘ S compared to in MO80 during autumn and winter.
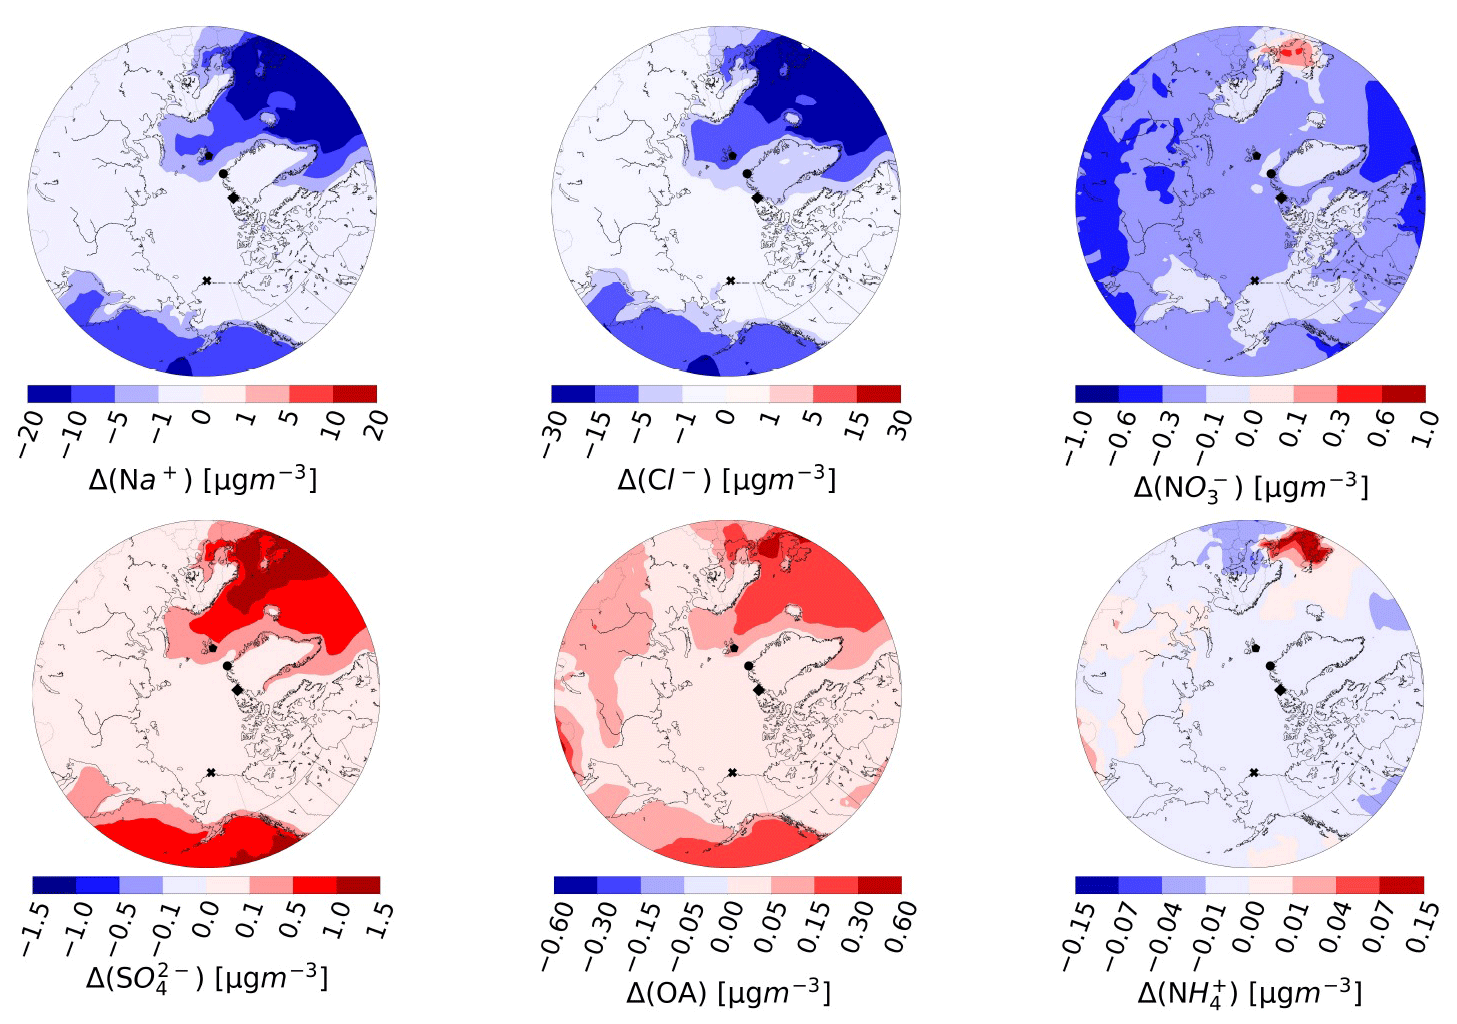
Figure 2Average absolute differences in super-micron aerosol mass concentrations (in µg m−3) between HEM_NEW and CONTROL during January and February 2014 at the surface. The black × in northern Alaska shows where Utqiaġvik is located. The black circle shows Villum in Greenland; the black diamond shows Alert, Canada; and the black pentagon shows Zeppelin, Svalbard. Total is shown. All the results are shown north of 50∘ N. Note the different scales.
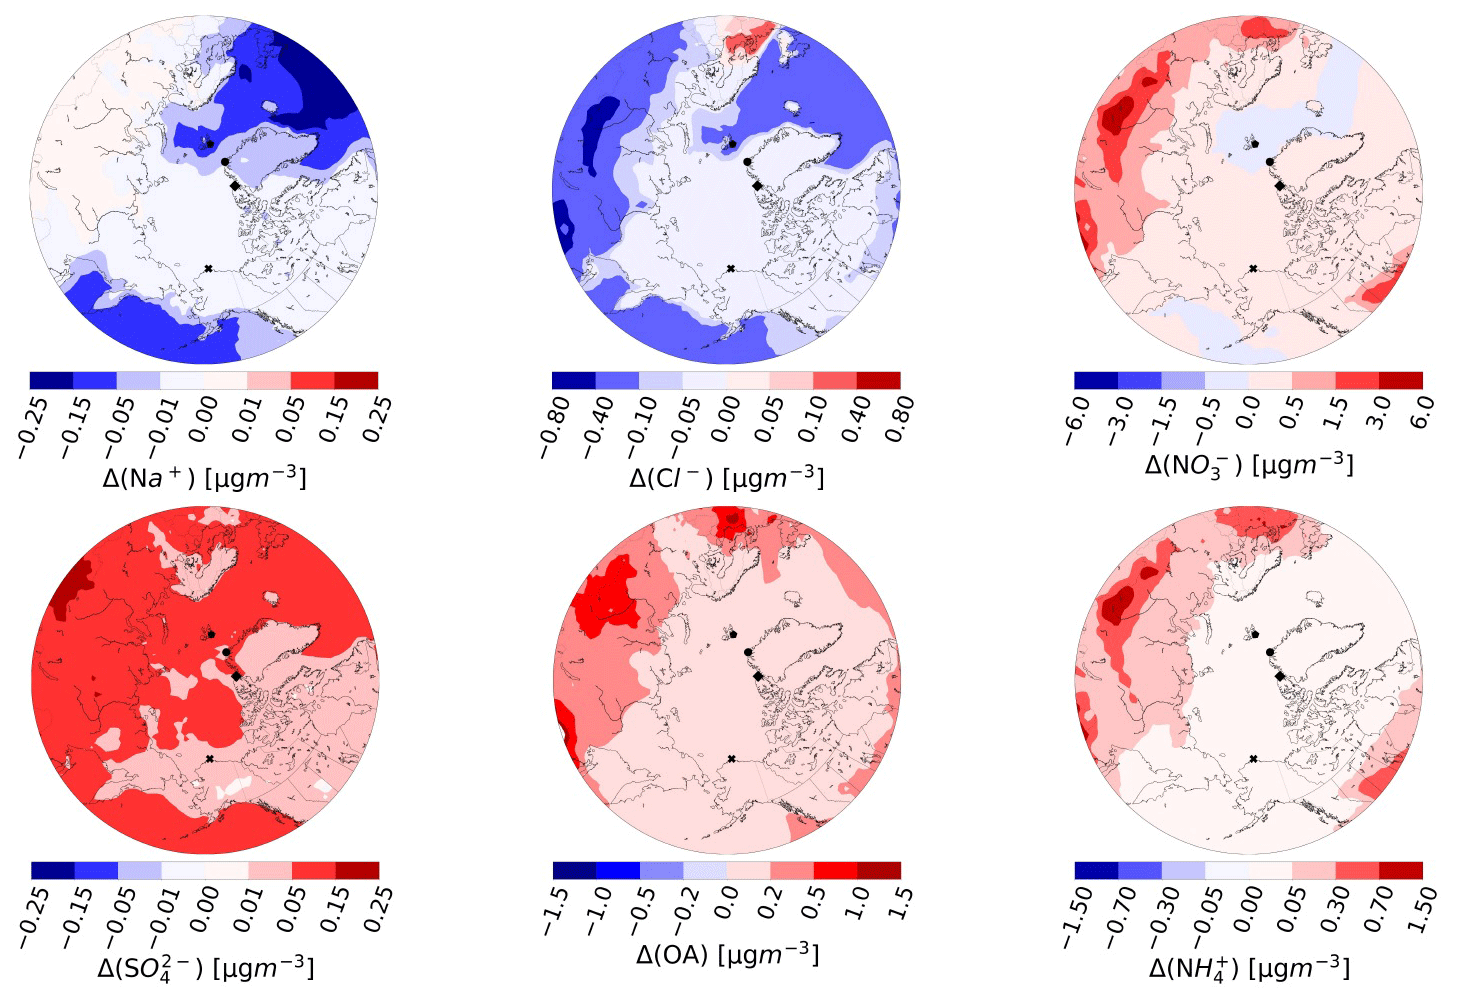
Figure 3The same as Fig. 2 but for sub-micron aerosol mass concentrations (in µg m−3).
4.2.3 SST dependence
Wind speed alone cannot predict SSA variability, and it is important to also include a dependence on SSTs, as pointed out by, for example, data-based studies in the Arctic (Saliba et al., 2019; S. Liu et al., 2021) and mid-latitudes, such as the study by Ovadnevaite et al. (2014). Modelling studies also showed that the application of a SST dependence improves simulated SSA concentrations compared to observations (Jaeglé et al., 2011; Sofiev et al., 2011; Spada et al., 2013; Barthel et al., 2019), but this has not yet been implemented in WRF-Chem. More specifically, previous studies tested different SSA source functions and reported that including a SST dependence improves model results regardless of the wind speed dependence employed (Spada et al., 2013; Grythe et al., 2014; Barthel et al., 2019). However, uncertainties still remain about the influence of SSTs on SSA production (Revell et al., 2019), including the role of other factors, such as seawater composition (Callaghan et al., 2014) or wave characteristics (e.g. wave speed and breaking-wave type; Callaghan et al., 2012), which might be more important than SSTs alone. Here, the JA11 SST correction factor is applied when SSTs are between −2 and 30∘C to evaluate the effect of SSTs on sub- and super-micron SSA emissions. SSTs are provided by the reanalyses data, in this case FNL, and in the presence of sea ice, SSTs are set equal to −1.75∘C. In that case, the SST correction factor is set to the minimum value based on Barthel et al. (2019).
Table 2Biases in aerosol mass concentrations, in µg m−3, averaged over January and February 2014 for CONTROL and HEM_NEW simulations compared to the observations. NA stands for not available.
4.2.4 Sea-salt sulfate
A source of ss is included in the MOSAIC SSA emission scheme (HEM_NEW), since it was not included in the base model version (CONTROL). The mass fraction of ss is estimated to be 0.252 of the Na+ mass fraction based on Kelly et al. (2010) and Neumann et al. (2016). The fraction of ss is subtracted from the fraction of Na+, Cl−, and marine OA. Note that the total fraction of Na+, Cl−, marine OA, and ss is equal to 1.0, and additional emissions are not added. We find that, on average, the mass fraction of ss emissions in our simulations is around 9.9 % of the total SSA emissions. This can be compared with the CMAQ model where the ss emissions are estimated to be 7 % of the total SSA emissions (Kelly et al., 2010).
First, absolute differences in simulated aerosol concentrations between the HEM_NEW and CONTROL results, averaged over January and February 2014, are presented. Model results from the two runs are then evaluated against available observations of not only Na+ and Cl− but also OA and , which now include a sea-salt component, and , which is affected by heterogeneous reactions on SSAs. We also show for completeness. Lastly, we compare observation-based and modelled contributions of SSAs to total wintertime inorganic-aerosol concentrations during winter 2014.
5.1 SSA emission updates: HEM_NEW versus CONTROL
Average absolute differences in super-micron and sub-micron inorganic aerosols between the HEM_NEW and CONTROL are shown in Figs. 2 and 3, respectively. HEM_NEW simulates less super-micron Na+ by up to 20 µg m−3 and less Cl− by up to 30 µg m−3, especially south of Alaska and over the northern Atlantic Ocean. This is due to the combined effect of using a lower wind speed dependence and including the SST dependence (Fig. 2). Inclusion of the SST dependence leads to a larger decrease in locally produced super-micron Na+ and Cl− over the Arctic and sub-Arctic ice-free regions due to lower temperatures north of 50∘ N compared to using the lower wind speed dependence based on SAL14, which has a smaller effect. Overall, one-third of the super-micron reductions can be attributed to the lower wind speed dependence, and two-thirds can be attributed to the SST dependence. Super-micron is also lower (by up to 1.0 µg m−3) due to less formation of via heterogeneous uptake of HNO3 on SSAs. These reactions involving heterogeneous uptake of acid gases also produce HCl, thus depleting Cl− relative to Na+ (Su et al., 2022). The presence of sea ice also plays a role. Smaller decreases in Na+ and Cl− are found north of Alaska (Beaufort Sea) compared to in ice-free regions such as the northern Atlantic Ocean. The local influence of sea-ice fraction and open leads on SSA production over northern Alaska is examined further in Sect. 6. Furthermore, due to the addition of marine organics and ss in HEM_NEW, there is more super-micron , by up to 2 µg m−3, and more super-micron OA, by up to 0.6 µg m−3, over marine regions. Super-micron increases slightly, up to 0.15 µg m−3, over regions where increases.
There are smaller decreases in HEM_NEW sub-micron Na+ compared to in CONTROL by up to 0.25 µg m−3, south of Alaska and in the North Atlantic (Fig. 3). Again, this is due primarily to the introduction of the SST dependence. When using the SALI14 lower wind speed dependence alone, there is a small decrease in sub-micron Cl− and a small increase in sub-micron Na+ over the Arctic. Sub-micron Cl− also decreases over continental areas, where and HNO3 are higher due to anthropogenic sources (Fig. 3). Heterogeneous uptake on SSAs reduces Cl− and increases sub-micron by up to 6.0 µg m−3 in HEM_NEW over continental regions, while the increases over the Arctic Ocean are smaller. This is in contrast to super-micron decreases. These results are consistent with the study of Chen et al. (2016), who also used WRF-Chem with MOSAIC and who noted that, since SSAs are primarily present in the coarse (super-micron) mode, this favours the formation of NaNO3, which is thermodynamically stable, and limits the formation of NH4NO3, which is semi-volatile (Chen et al., 2020). Therefore, lower super-micron SSAs in HEM_NEW result in less super-micron and more sub-micron . We also note that, for these reasons, sub-micron also increases by up to 1.5 µg m−3, especially over continental areas, and displays similar regional patterns to sub-micron . The inclusion of marine organics linked to SSAs leads to increases in sub-micron OA, by up to 1.5 µg m−3, and total increases due to the addition of ss .
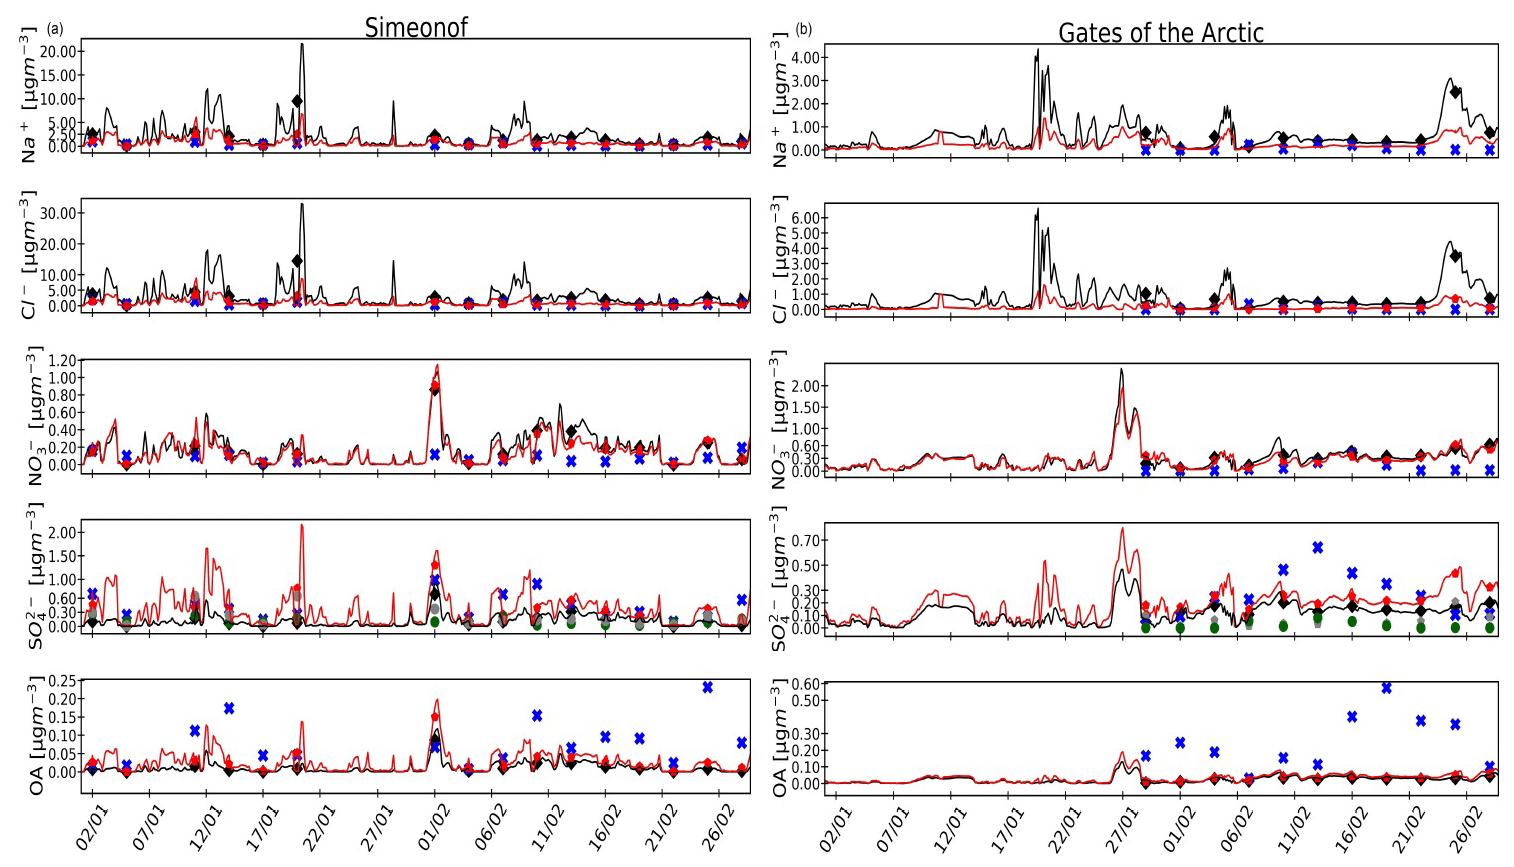
Figure 4Evaluation of modelled aerosol composition against in situ fine-mode aerosol observations in µg m−3 at (a) Simeonof, Aleutians Islands, Alaska, and (b) GoA, north of Alaska, in local Alaskan time (AKST). Observations are shown as blue crosses only when they are available. For observed , dark-green circles show ss , while blue crosses are total . The black line shows model results from the CONTROL run; the red line shows results from the HEM_NEW run. Model daily averages are shown as black diamonds for the CONTROL and as red pentagons for HEM_NEW, while grey circles show ss from the HEM_NEW simulation. See the text for more details. Note the different scales.
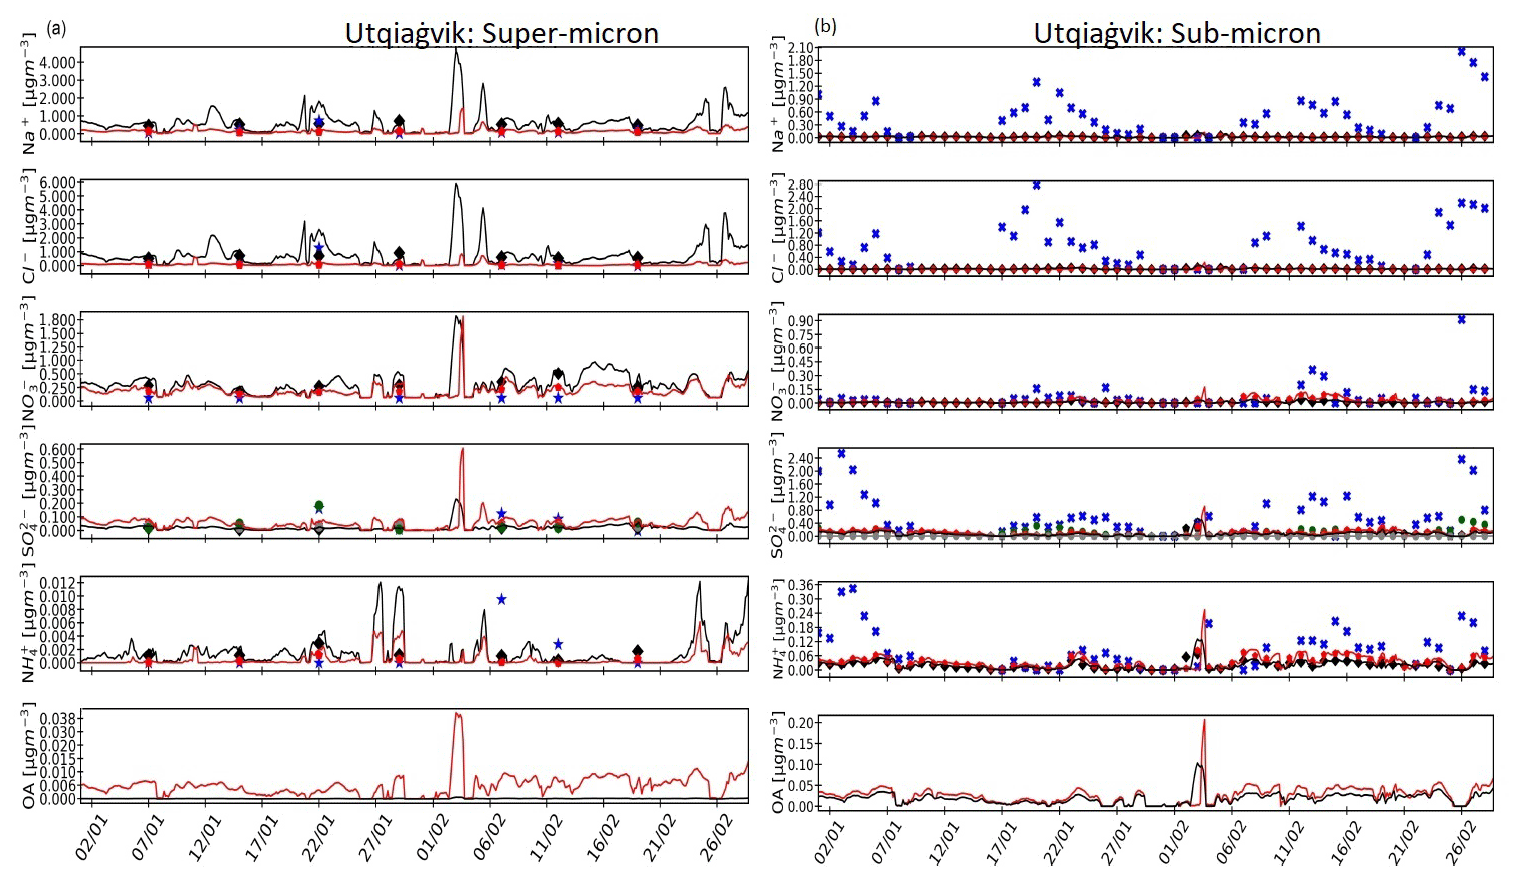
Figure 5Evaluation of modelled aerosol composition against observations at Utqiaġvik in µg m−3 for (a) super-micron and (b) sub-micron in coordinated universal time (UTC) and standard temperature pressure (STP) conditions. Observations are shown only when available. The lines and the symbols are the same as in Fig. 4. See the text for more details. Note the different scales.
5.2 Evaluation against observations
Model results are evaluated against available observations of aerosols at different sites, as shown in Figs. 4–6. These figures are grouped according to the size ranges of the measurements at the different sites, as discussed in Sect. 3.1. Average biases and root-mean-square errors (RMSEs) between the observations and the model results for January and February 2014 are given in Tables 2 and C.1 (Appendix C), respectively. In the following, the main findings are discussed by aerosol component.
SSAs (Na+ and Cl−). Updates to the treatment of SSA emissions in HEM_NEW greatly improve modelled SSAs over the Arctic, with notable reductions in Na+ and Cl− biases and RMSEs compared to observations at Alert, Zeppelin (da<10 µm), Villum (TSP), Gates of the Arctic (GoA; fine mode), and the sub-Arctic site Simeonof (fine mode). Overall, HEM_NEW captures the spatial variability between observed Na+ and Cl− at the different sites, particularly the lower observed concentrations at Villum, which is surrounded by sea ice at this time of year, and the higher concentrations at Simeonof and Zeppelin. The extent to which sea ice is present near different sites is an important factor. For example, the high variability in modelled SSAs at Villum at the end of January and in the middle of February 2014 is likely to be due to fluctuations in sea-ice fractions around the site (0.9–1.0 in the FNL analyses). At Utqiaġvik, the model captures better super-micron Na+, whereas Cl− is now underestimated due to Cl− depletion. Sub-micron Na+ and Cl− are still underestimated in HEM_NEW at this site, with average biases of about −0.5 µg m−3 for Na+ and −0.12 µg m−3 for Cl−, with higher biases during episodes with elevated observed SSAs. Here, sub-micron SSAs may have been transported to the Arctic from the Pacific Ocean (Quinn et al., 2002; May et al., 2016); thus, model underestimations may point to deficiencies in the SSA source function further south or to issues related either to long-range transport or to wet- and dry-deposition treatments in the model. However, the fact that the model agrees better with observations over the wider Arctic, as well as at the sub-Arctic Simeonof, provides confidence in the modelled long-range transport as a source of Arctic (sub-micron) SSAs. HEM_NEW Na+ also compares well with reported weekly averaged sub-micron Na+ mass concentrations collected during January and February 2014 at Alert (0.1 µg m−3 observed; Leaitch et al., 2018; up to 0.08 µg m−3 modelled). We also note that, at Utqiaġvik, while May et al. (2016) attributed sub-micron SSAs to long-range transport, KRP18 estimated that, in the sub-micron range, for their analysed samples, 42 % were fresh SSAs with chemical signatures similar to seawater, 18 % were classed as partially aged with enhanced anthropogenic components (S, N) and depleted Cl−, and the remainder included organics and sulfate particles. Thus, model discrepancies may also be due to local processes that influence SSAs over northern Alaska. This is investigated further in Sect. 6.
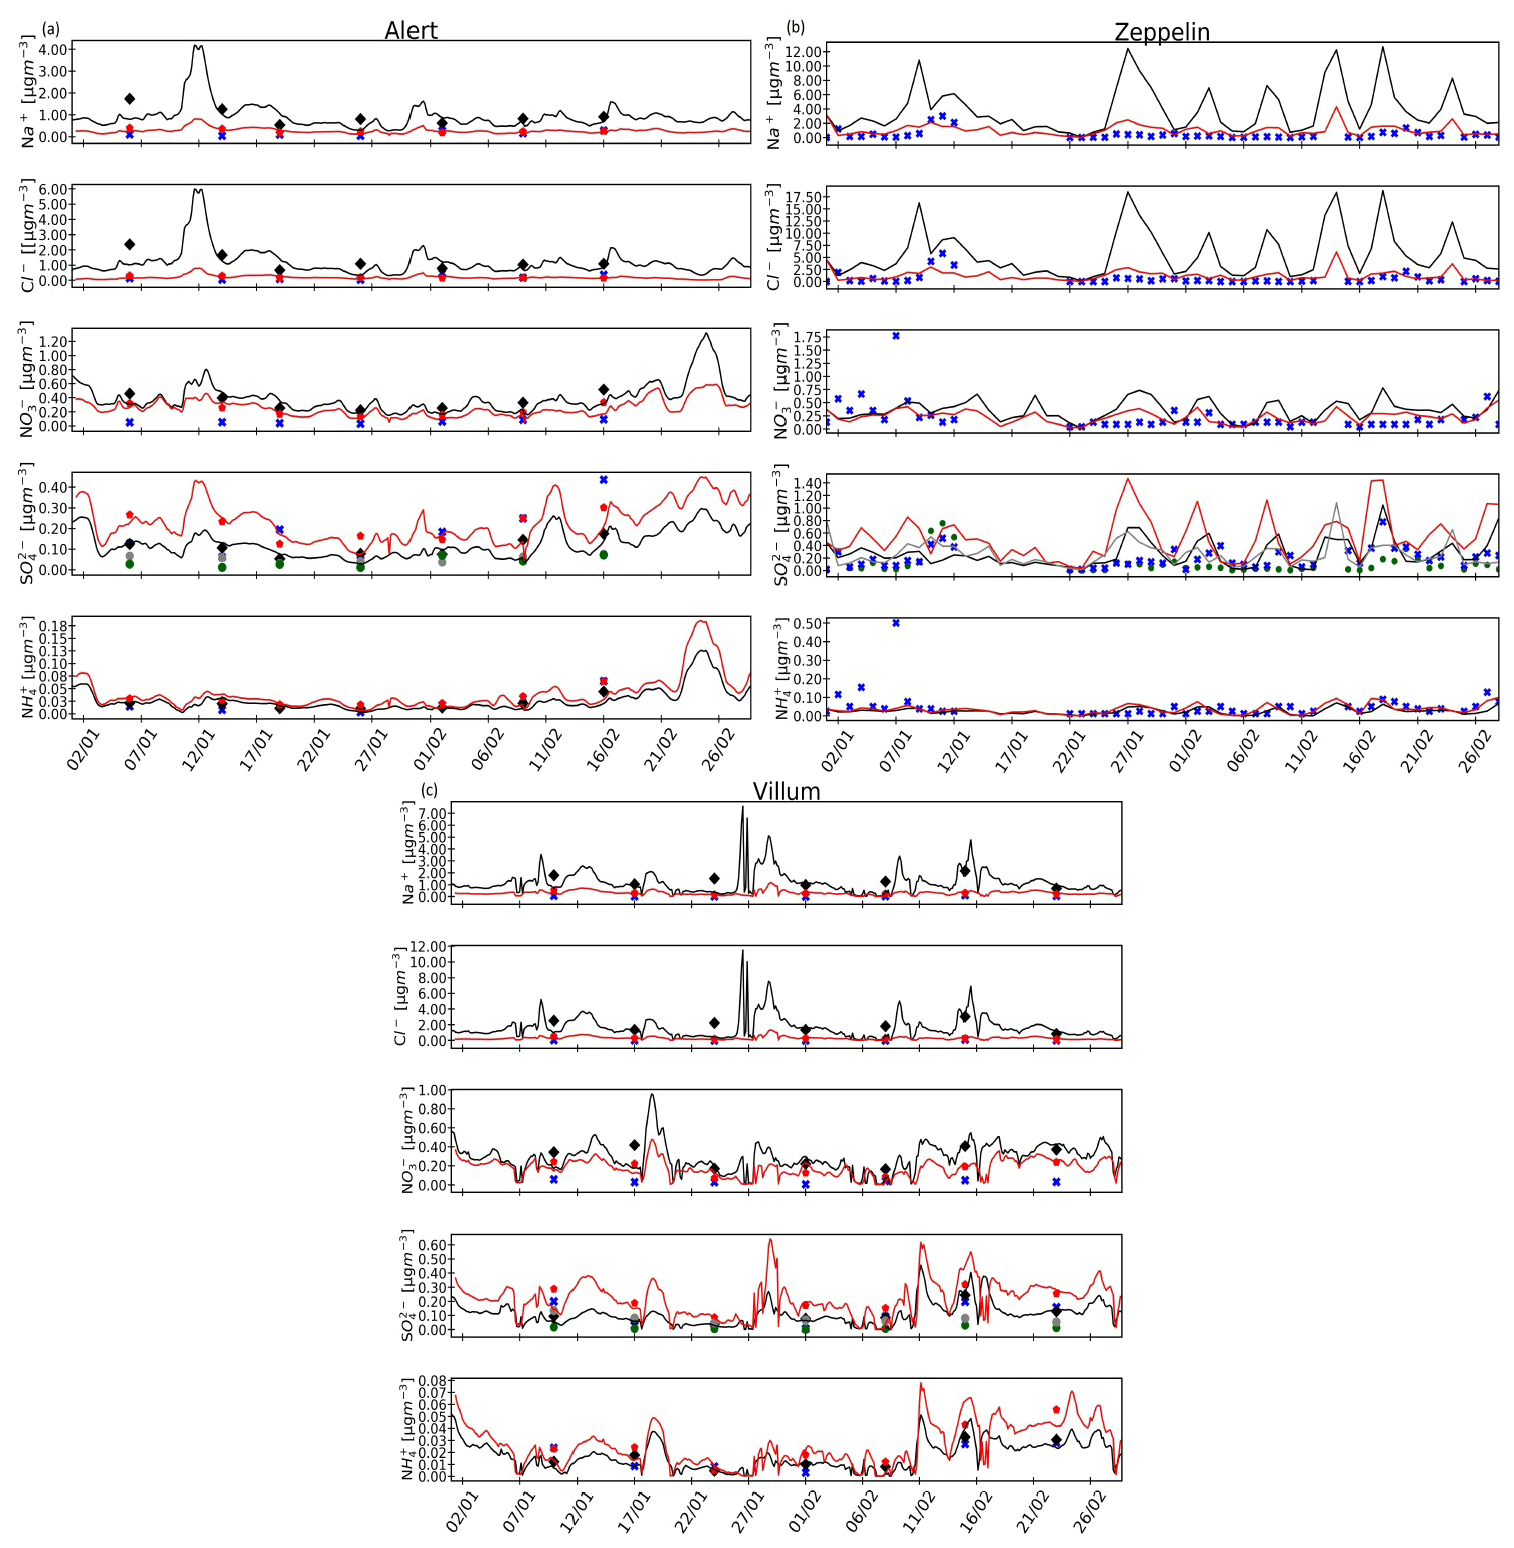
Figure 6Evaluation of modelled aerosol composition against in situ aerosol observations with da<10 µm in µg m−3 at (a) Alert, Canada (STP conditions); (b) Zeppelin, Svalbard; and (c) TSP aerosols at Villum, Greenland, in UTC. Observations are shown only when available. The lines and the symbols are the same as in Fig. 4. See the text for more details. Note the different scales.
Nitrate. Improved SSA treatments in HEM_NEW also lead to improved simulation of at some sites, notably at Simeonof, GoA, Alert, and Villum, and biases are reduced (see Table 2). While modelled super-micron at Utqiaġvik is improved, the model still underestimates certain periods when elevated sub-micron is observed, which is also the case at GoA and Simeonof. The improved behaviour of modelled is, in general, due to reductions in Na+ and Cl−, leading to less production in the coarse mode, especially close to or just downwind of major anthropogenic emission regions at mid-latitudes, and to a shift to more in the fine mode, as discussed previously. These effects are most evident at Utqiaġvik, where the model can be compared to sub- and super-micron data. Comparison with data from other sites is with either total, coarse- plus fine-mode, or fine-mode aerosol observations and therefore includes both increases and decreases in simulated . Overall, these results illustrate the importance of correctly simulating SSAs and their effects on anthropogenic aerosols. While observed concentrations are generally lower than other aerosol components, such as Na+, Cl−, or nss , during Arctic winter, a recent trend analysis study showed that is clearly increasing at Alert, especially during the winter months (Schmale et al., 2022). Such increases in may be due to increased formation due to lower acidity following sulfur dioxide (SO2) reductions that outweigh reductions in NOx emissions at mid-latitudes (Sharma et al., 2019). However, increases in SSAs over the Arctic Ocean due to reductions in ice-covered waters may also explain these changes (e.g. Browse et al., 2014), although no significant trends in Na+ have yet been detected (Schmale et al., 2022).
Sulfate. Figures 4–6 show observed ss and total together with results from CONTROL and HEM_NEW. With regard to total simulated , the addition of ss improves the model results, for example, at Simeonof, where observed fine-mode ss makes a significant contribution (30 %–80 %, up to 0.3 µg m−3) to total ; ss also contributes between 10 %–40 % of the total at Alert and Villum, and modelled ss agrees better with the observations. The remainder is nss , a dominant component of Arctic haze resulting from long-range transport from sources in Russia and Europe at these sites (Leaitch et al., 2018; Lange et al., 2018). Model results are at the lower end (up to 0.3 µg m−3) of reported sub-micron nss mass concentrations (0.3–1.1 µg m−3) at Alert during winter 2014 (Leaitch et al., 2018). On the other hand, HEM_NEW further overestimates total observed at Zeppelin due to the inclusion of ss , especially during certain episodes with elevated concentrations. We note that Zeppelin is a mountain site at 471 m, and thus discrepancies compared to the observations may also be due to issues simulating the vertical distribution and transport of nss from Eurasian source regions (Hirdman et al., 2010). At Utqiaġvik, on the northern coast of Alaska, most of the total observed super-micron is ss (up to 0.18 µg m−3, around 80 %), and the inclusion of ss in HEM_NEW improves agreement with the observations. With regard to total sub-micron , high mass concentrations are observed at Utqiaġvik compared to at other Arctic sites, consisting mostly of nss and peaking at 2.4 µg m−3, which is much higher than the total super-micron (peaking at 0.5 µg m−3), as also reported by Quinn et al. (2002). However, the model underestimates nss at this site. As noted by KRP18 and KRP19, there is a local influence from the North Slope of Alaska (NSA) oil fields to the east, and these emissions may be underestimated in the model. In a companion paper investigating BC at Utqiaġvik, it is estimated that up to 30 %–50 % of BC originates from these regional emissions (Law et al., 2023). Indeed, at GoA, 391 km inland from the coast, and south of the NSA oil fields, the contribution of nss is more important, and ss is negligible. Here, the model captures total fine-mode (peaking at up to 0.64 µg m−3), and the addition of ss does not affect the results. In addition to local sources, difficulties simulating sub-micron nss at Utqiaġvik may be due to an underestimation in the transport of nss from mid-latitudes to the Arctic or issues related to deposition (as noted earlier for SSAs), as also discussed in previous studies such as that of Whaley et al. (2022). formation mechanisms under dark, cold winter conditions may also be lacking in the model. For example, high concentrations of hydroxymethane sulfonate (HMS) have been measured recently during winter in Fairbanks, Alaskan Interior (Campbell et al., 2022), contributing to secondary formation during Arctic winter, although only a small contribution from HMS to was found in observations at Oliktok Point, situated within the NSA oil fields (J. Liu et al., 2021). Oxidation of SO2 by O3 in alkaline SSAs could also contribute up to 9 % to formation (Alexander et al., 2005). However, the version of WRF-Chem used here does not include such reactions, in common with many chemistry–aerosol models run over the Arctic (Whaley et al., 2022).
Ammonium. observations are available at all sites except for Simeonof and GoA. Observed concentrations are very low (below 0.2 µg m−3) at Alert and Villlum, with higher concentrations observed at Zeppelin. Overall, there is a good agreement between the model and measurements, with very low biases and RMSEs in both runs, apart from an underestimation of elevated at Zeppelin. At Utqiaġvik, there is good agreement with super-micron , except for periods with higher observed (up to 0.1 µg m−3). However, the model underestimates periods with elevated sub-micron of up to 0.4 µg m−3, which is higher compared to the other sites. Temporal variations in during January and February 2014 generally follow nss , as preferentially forms ammonium bisulfate and, to a lesser extent, ammonium sulfate in the particle phase (Schmale et al., 2022), and they have common anthropogenic origins. Previous studies also noted that is 2 times higher at Utqiaġvik than at Alert, Zeppelin, and Villum, while is similar at all the sites (Schmale et al., 2022), possibly suggesting differences in aerosol acidity at the different sites. This is also found in this study based on the observations and model results (HEM_NEW). It is therefore interesting to investigate the effect of the improved SSA emissions on modelled aerosol acidity. For this, we estimate the neutralisation factor f following Fisher et al. (2011). The results are discussed in Appendix D. CONTROL tends to predict more acidic aerosols than observed. Based on the observations, most acidic aerosols are found at Alert, Zeppelin, and Utqiaġvik (super-micron), with somewhat less-acidic aerosols at Villum and Utqiaġvik (sub-micron). This is improved to some degree in HEM_NEW, with aerosols becoming less acidic at some sites, notably at Alert and Villum, due to decreases in simulated . However, modelled sub-micron aerosols at Utqiaġvik are less acidic than the observations due to the underestimation of nss . Overall, the updates to SSA emissions lead to somewhat-less-acidic anthropogenic aerosols over the Arctic, again highlighting the importance of interactions between SSAs and other inorganic aerosols.
Organic aerosols. Only two sites provide tOC fine-mode observations ranging from 0.15 to 0.3 µg m−3 at Simeonof and from 0.15 to 0.5 µg m−3 at GoA during January and February 2014. The inclusion of marine organics in HEM_NEW improves modelled OAs, especially at the coastal Simeonof site. Since observations at other sites are not available for winter 2014, results are compared with other reported measurements. Shaw et al. (2010) reported sub-micron OAs at Utqiaġvik of around 0.3 µg m−3 during winter 2008 (November to February). However, a more recent study by Moschos et al. (2022a) reported lower wintertime OA concentrations (da<10 µm) at this site (around 0.1 µg m−3), attributed mostly to primary anthropogenic or haze OAs originating from Eurasia. However, modelled OA for the same size range is only up to 0.05 µg m−3. At Villum, Nielsen et al. (2019) also reported higher sub-micron OA observations, peaking at 2.2 µg m−3 in February 2015, attributed mostly to Arctic haze influence (up to 1.1 µg m−3), with secondary influences from hydrocarbon-like organics (up to 1.0 µg m−3) and marine sources (up to 0.2 µg m−3). Modelled OA in HEM_NEW at this site does not exceed 0.1 µg m−3. Overall, the model underestimates Arctic OAs, in common with many other models (Whaley et al., 2022). These discrepancies may be due to missing or underestimated anthropogenic or natural sources. For example, it is known that there are large uncertainties in anthropogenic OA emissions (Marelle et al., 2017). The possibility of a wintertime marine OA source over northern Alaska is explored further in Sect. 6.
Table 3Calculated fractions of observed and modelled (HEM_NEW) SSAs to total inorganic aerosol mass concentrations. For each site, SSAs are defined as the sum of Na+, Cl−, and ss . Total is defined as the sum of SSAs and inorganic aerosols. Inorganic is the sum of nss , , and for each site, except for Simeonof and GoA, where inorganic is the sum of nss and . Total_all below is defined as the sum of SSAs, nss , , , BC, OAs, and dust (model only). The aerosol size range for SSAs (Total and Total_all) varies per site and corresponds to observed aerosol sizes as described in Sect. 3.
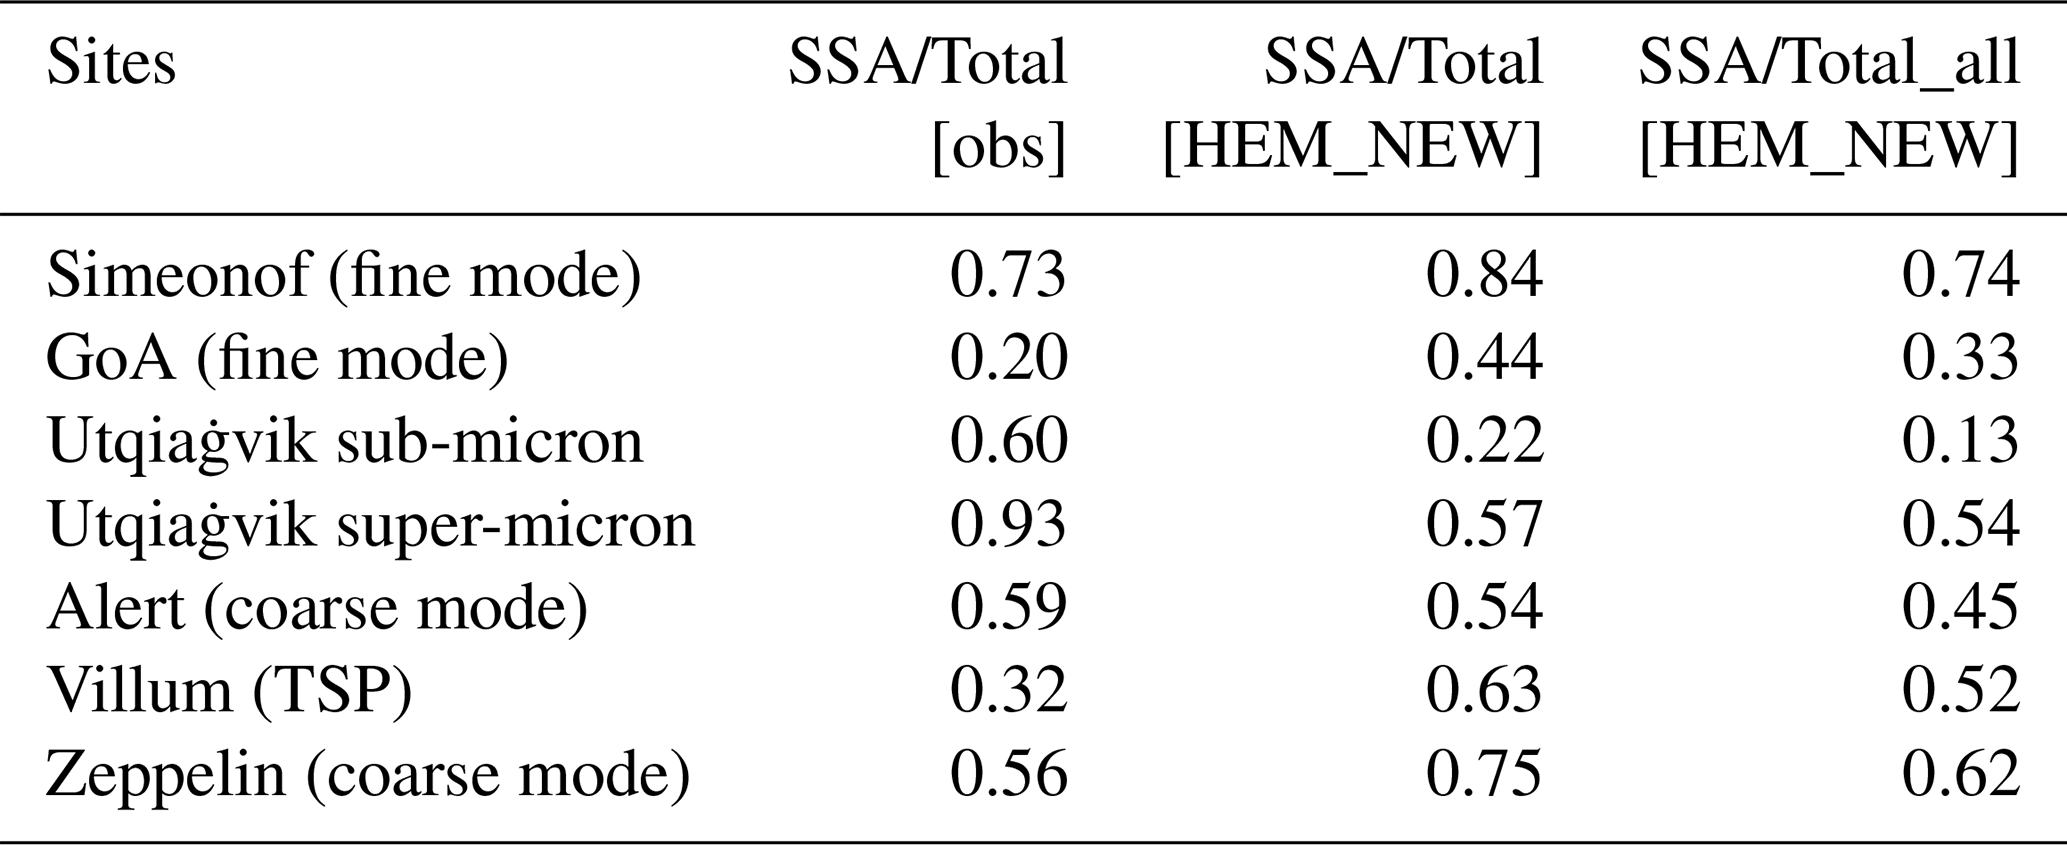
Table 4Description of the regional-scale WRF-Chem model simulations at 20 km resolution over northern Alaska. See text for details.

5.3 Contribution of SSAs to total inorganic aerosols
Lastly, we assess the contribution of SSAs to total inorganic aerosols in the Arctic during wintertime, since previous studies noted that they can make an important contribution to total sub-micron and super-micron mass fractions at this time of year (Quinn et al., 2002; May et al., 2016; Kirpes et al., 2018, 2019). Moschos et al. (2022b) also showed that SSAs dominate wintertime PM10 (particulate matter with da≤10 µm) mass concentrations at remote Arctic sites, including Alert (56 %), Baranova (northern Russia; 41 %), Utqiaġvik (66 %), Villum (32 %), and Zeppelin (65 %). In contrast, at sites such as Tiksi (northern Russia) and Pallas (Finland), and OAs dominate (70 % and 55 %, respectively). To investigate the contribution of SSAs to total mass concentrations during the period of this study, observed and modelled fractions of SSAs to total (SSAs plus inorganic) aerosols are estimated (see Table 3). It should be noted that this fraction varies between sites, since not all components were measured. Taking into account the observations available at each site, the fraction of SSAs to total SSAs plus inorganics is higher at all the coastal sites (Utqiaġvik, Alert, Simeonof, and Villum) and at Zeppelin, ranging from 54 % to 93 %. Only at the GoA and Villum is the fraction of SSAs smaller (20 % and 32 %, respectively). SSA fractions, calculated using the HEM_NEW results, show similar patterns compared to the observations, with fractions ranging between 44 % and 84 %. An exception is Utqiaġvik, where the modelled fraction is lower than in the observations due to low simulated sub-micron SSA concentrations. When taking into account all aerosol components in the model, including OAs, BC, and dust, SSA is dominant at Simeonof, Utqiaġvik (super-micron), Zeppelin, and Villum (more than 54 %), whereas at Alert, SSAs contribute about 45 %. This analysis shows that SSAs are an important fraction of total inorganic aerosols at most Arctic coastal sites during wintertime.
Overall, the results presented here show that the simulation of Arctic SSAs and of other inorganic and organic aerosols is improved as a result of the updated SSA emission treatments. In particular, simulated aerosols, including the coarse-mode or super-micron fraction, are improved compared to the observations. The results also show that it is important to include natural SSA emissions of ss and marine organics, although the latter are highly uncertain. Missing anthropogenic sources could also contribute to the underestimation of OAs and nss . Many models in a recent Arctic Monitoring and Assessment Programme (AMAP) model evaluation of Arctic composition also showed similar discrepancies, attributed to issues with anthropogenic emissions or model transport, deposition, and aerosol formation (Whaley et al., 2022). The results presented here also confirm the importance of interactions between SSAs and other inorganic aerosols via heterogeneous uptake, affecting mass concentrations and size distributions, notably , and thus model ability to capture wintertime Arctic haze.
Possible processes affecting emissions of SSAs on a regional scale over northern Alaska are now examined in more detail, particularly those which may explain the low modelled sub-micron SSAs at Utqiaġvik. Model simulations are run at 20 km over northern Alaska for shorter periods in January and February 2014, corresponding to the KRP18 measurement campaign. The boundary and initial conditions are taken from HEM_NEW. The sensitivity of modelled SSAs to a local source of marine organic aerosols, wind speed dependence, and the representation of sea-ice fraction are investigated (see Table 4 for details about the simulations). Differences between runs with and without specific sensitivity tests are examined sequentially for the February period before evaluating a run including the main changes against observations at Utqiaġvik during the January and February periods. The possible role of blowing snow and frost flowers is also addressed.
6.1 Local source of marine organics
The F10 parameterisation used in the 100 km HEM_NEW run is based on the C : Chl a ratio from a cruise at mid-latitudes. Whilst phytoplankton blooms may not be expected in the high Arctic winter, previous studies have shown evidence of sea-ice biological activity under low-light conditions coupled with decreased sea ice in the Arctic (Krembs et al., 2002; Lovejoy et al., 2007; Hancke et al., 2018). Analysis of data collected over the Arctic and North Atlantic during winter and the winter–spring transition also showed that the majority of sub-micron OM is highly correlated with Na+ concentrations (Russell et al., 2010; Shaw et al., 2010; Frossard et al., 2011; Leaitch et al., 2018). More specifically, Russell et al. (2010), referred to as RUS10 from now on, analysed samples from the International Chemistry Experiment in the Arctic Lower Troposphere (ICEALOT) cruise and found that most OM in the North Atlantic and the Arctic is composed of carbohydrate-like compounds containing organic hydroxyl groups from primary ocean emissions. Frossard et al. (2014), referred to as FRSS14 from now on, investigated the sources and composition of atmospheric marine aerosol particles based on the analysis of various samples, including ICEALOT, reporting that ocean-derived organic particles include primary marine OAs. In particular, they calculated the ratio of OC : Na+ as a metric for comparing the composition of model-generated primary marine aerosols and seawater and reported OC : Na+ ratios of 0.45 in atmospheric marine aerosol particles. KRP19 also reported that, during their campaign in 2014, almost all individual SSAs had thick organic coatings made up of marine saccharides, with average C:Na mole ratios of 0.5 and 0.3 for sub-micron and super-micron SSAs, respectively. They also identified open sea-ice leads enriched with exopolymeric substances as contributors to OAs in winter SSAs. Here, elemental fractions for sub- and super-micron aerosols, sampled during the KRP19 campaign, are used to better constrain modelled marine OC emissions. The ratio of sub- and super-micron OC : Na+ is calculated following FRSS14 and using the elemental fractions from KRP19 as an indicator of the presence of a local source of marine organics. The organic fraction of SSA emissions in WRF-Chem is increased from 0.2 to 0.4 for first and second MOSAIC bins, from 0.1 to 0.4 for the third MOSAIC bin, and from 0.01 to 0.11 for the remaining MOSAIC bins. Note again that no additional SSA mass is added.
Figure 7Average absolute differences in aerosol mass concentrations between LOC_ORG_FEB and ALASKA_CONTROL_FEB during the February campaign for sub-micron Na+, OAs, (in µg m−3). All the results are shown at the surface. See text and Table 4 for more details. Utqiaġvik is shown by the black dot. Note the different scales.
Figure 7 shows the sensitivity of the model results to including a larger marine organic fraction over the regional domain. Sub-micron OA concentrations increase by a small amount, by up to 0.009 µg m−3, especially southwest of Alaska and along coastal areas, including around Utqiaġvik. There are only two available daily observations at GoA during the February simulation period to evaluate the model results. The model better captures observed tOC at the end of February in the run (LOC_ORG_FEB) with higher organic fractions (not shown here). However, it underestimates tOC on 25 February when the observed tOC reached 0.33 µg m−3. As mentioned previously, this discrepancy could also be due to missing local anthropogenic OA sources. Higher OA fractions in the super-micron leads to lower Na+ and, as a result, lower . As indicated above in Sect. 5, a decrease in super-micron results in an increase in sub-micron . It is probable that sub-micron Na+ increases due to the formation of NaNO3 in the model. In the following runs, higher organic fractions are used instead of those from F10.
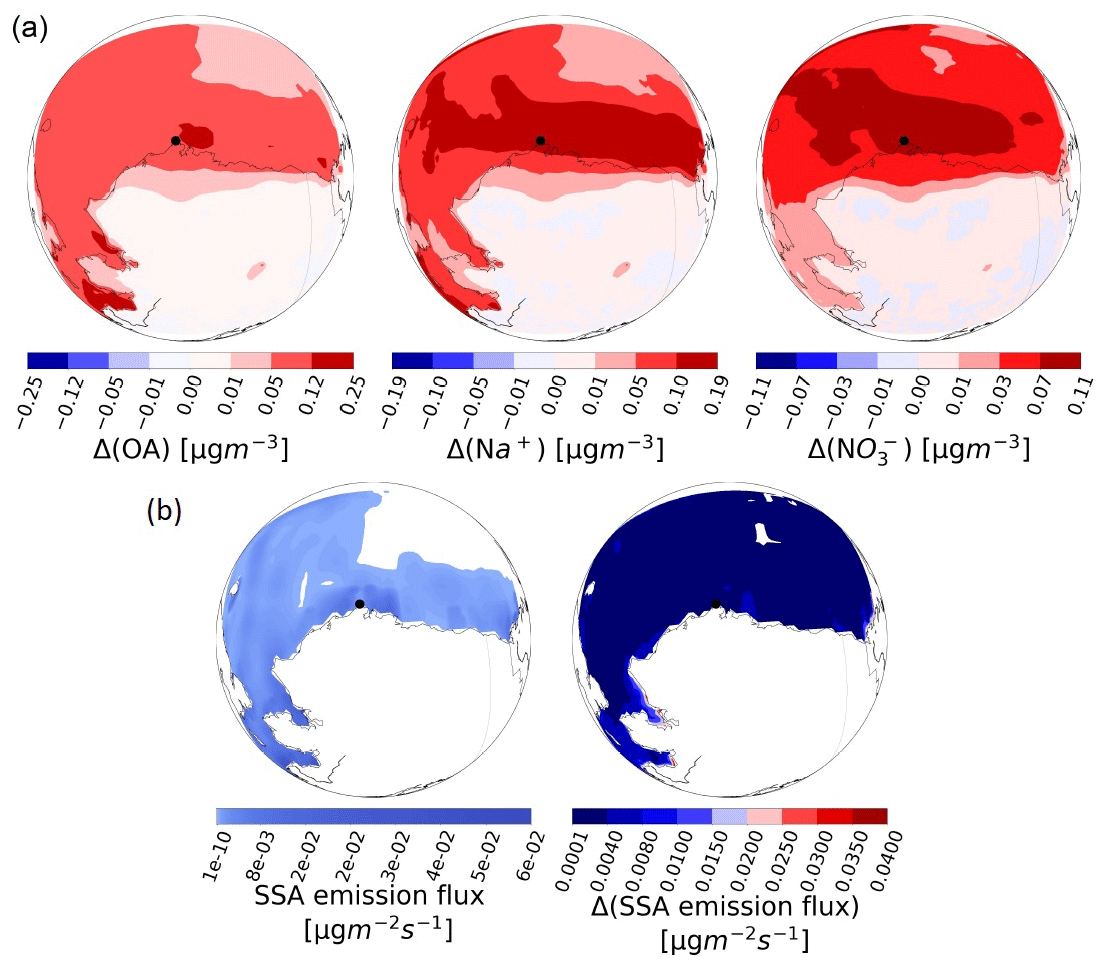
Figure 8Average absolute differences in aerosol mass concentrations of (a) sub-micron Na+, OAs, and in µg m−3 between SSA_WS_DEP_FEB and LOC_ORG_FEB. (b) The map on the left shows the average value of SSA emission fluxes in during the February campaign, and the map on the right shows the average differences between SSA_WS_DEP_FEB and LOC_ORG_FEB emission fluxes in . All the results are shown at the surface. Utqiaġvik is shown by the black dot. Note the different scales.
6.2 Wind speed dependence
In the 100 km HEM_NEW run, a lower wind speed dependence based on satellite data is used, since it improves modelled SSAs compared to observations at many sites over the Arctic, as discussed in Sect. 5. However, RUS10 found evidence for a higher wind speed dependence in the Arctic based on data collected during the Arctic leg of the ICEALOT cruise. They found that wind speed is a good predictor of a marine factor, calculated using positive matrix factorisation, for sub-micron organic matter (OM1sea). Their analysis showed a high correlation between OM1sea, sub-micron sodium (Na+1), and wind speed at 28 m (correlation r equal to 0.90 for the North Atlantic and the Arctic region; see Table S3 in the supplementary material in RUS10). Average OM1sea concentrations (0.2 µg m−3) reported by RUS10 for the eastern Arctic Ocean are about half those reported at Utqiaġvik by, for example, Shaw et al. (2010) during wintertime.
In a sensitivity run, results from RUS10 are used to include a higher wind speed dependence for sub-micron SSAs. This linear dependence differs from the power dependencies included in G97, SAL14, and other studies but is based on empirical relationships determined from the analysis of data collected in the Arctic. Equations (5) and (6) from the RUS10 analysis for the Arctic legs of their cruise are applied to the model as a correction factor as follows:
where U18 is wind speed at 18 m in m s−1 for wind speeds between 2 and 14 m s−1 (Fig. 2, RUS10). RUS10 used Na+1 as a proxy for sub-micron NaCl, and subsequently for SSAs, because Na+1 equalled sub-micron Cl−1 on a molar basis for the North Atlantic and Arctic sampling regions. Thus, Eq. (5) is also used to estimate a correction factor for Cl−. Here, wind speeds in the first model layer are used, i.e. around 26 m. Differences in U18m and U26m reach a maximum of 1 m s−1 (see Fig. E1 in Appendix E). Comparison with radiosonde data at Utqiaġvik shows that the model performs well in terms of winds and temperatures (see Appendix E), and the role of meteorology in relation to aerosols is not discussed further here. The correction factors are only applied to the simulated number and mass of the SSA emissions when modelled wind speeds are between 2 and 14 m s−1 and when RUS10-calculated sub-micron SSA emissions are greater than model-calculated SSA. In this way, SSA emissions are enhanced during periods with higher wind speeds.
To illustrate the sensitivity of the results to applying this correction, Fig. 8 shows the differences in sub-micron aerosol mass concentrations compared to the run including local marine organics and model SSA emission fluxes, the latter being the sum of dry mass emissions calculated in the model. The SSA emission flux is affected over ice-free model grids, leading to increased SSA production east and west of Utqiaġvik (by up to 0.015 ), while the highest increases are southwest of Alaska (by up to 0.035 µg m−2). This results in an increase of 0.25, 0.19, and 0.11 µg m−3 in sub-micron Na+, , and OAs, respectively, over the Utqiaġvik region and over southwest Alaska during the February campaign. These results further illustrate the sensitivity of SSA emissions to wind speeds, which, in this case, affect fine-mode aerosols. These results are in contrast to previous studies that found stronger wind speed dependencies for larger SSA particles, such as S. Liu et al. (2021), who analysed aircraft data, including over the Arctic. However, size-dependent source functions need to be developed for the Arctic region.
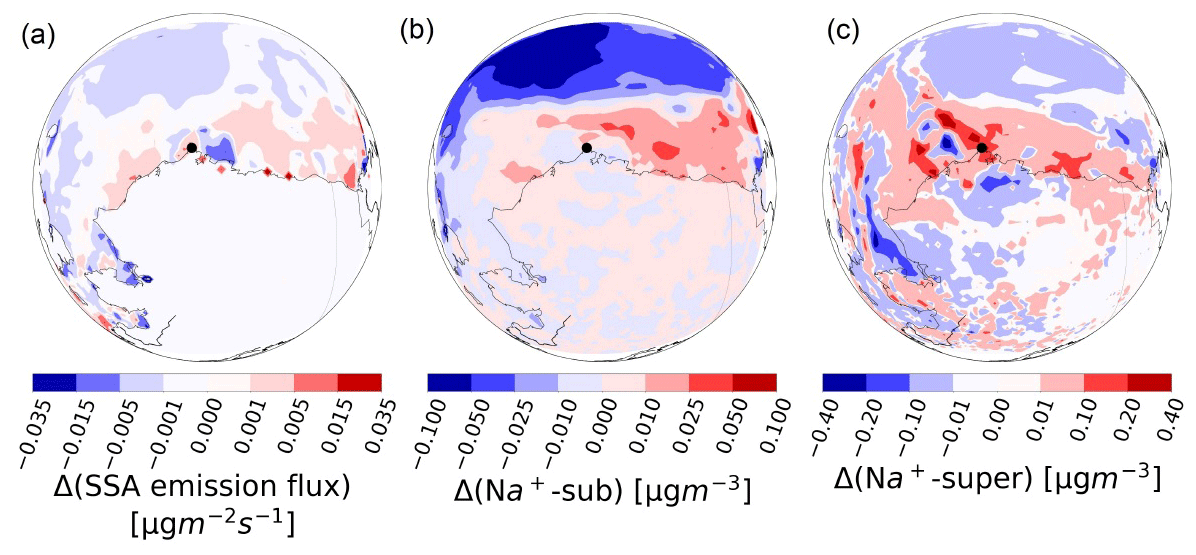
Figure 9Average absolute differences between ALASKA_NEW_FEB and SSA_WS_DEP_FEB showing the effect of switching from FNL to ERA5 sea-ice fractions during the February campaign for (a) SSA emission flux (), (b) sub-micron Na+, and (c) super-micron Na+ mass concentrations in µg m−3. All the results are shown at the surface. Utqiaġvik is shown by the black dot. Note the different scales.
6.3 Sea-ice fractions
The sensitivity of modelled SSAs to prescribed sea-ice fractions during wintertime and the role of leads are also investigated, since KRP19 already pointed out the importance of using realistic sea-ice distributions to simulate marine aerosols. High-spatial-resolution images of sea-ice cover are available, including during the polar night, from a radar operating on top of a building in Utqiaġvik town ( N, W) 22.5 m above sea level, with a range of up to 11 km to the northwest (Druckenmiller et al., 2009; Eicken et al., 2011). May et al. (2016) previously showed increased super-micron Na+ mass concentrations during periods of elevated wind speeds and lead presence in a multi-year study using the sea-ice radar data at Utqiaġvik. Between 23–28 January 2014, when the winds at Utqiaġvik were easterly, the radar showed that the coastal area east of Utqiaġvik featured open leads (KRP19). From 24–28 February 2014, the west coastal area also featured leads, as also shown by Moderate Resolution Imaging Spectroradiometer (MODIS) satellite images (KRP19). To examine the sensitivity of modelled SSA emissions to sea-ice cover, ERA5 sea-ice fractions with a resolution of are used instead of the FNL fraction at resolution. Note that only the sea-ice fraction field is different, while the rest of the meteorological fields are from FNL.
Results for February are shown in Fig. 9. The SSA emission flux (Fig. 9a) increases over a small region west of Utqiaġvik and across the North Slope of Alaska due to decreased sea-ice fractions, but it decreases just to the east of Utqiaġvik and southwest of Alaska due to increased sea-ice fractions. Sub-micron Na+ increases slightly along the north coast of Alaska and around Utqiaġvik by up to 0.1 µg m−3 (see Fig. 9b). Larger super-micron Na+ is simulated by up to 0.4 µg m−3 around Utqiaġvik and decreases by up to 0.4 µg m−3 southwest of Alaska (Fig. 9c). SSA emission fluxes increased more during February (0.035 ) compared to during January (0.015 ), since there is more sea ice in the region east of Utqiaġvik and south west of Alaska in the January simulation (not shown here). Two further simulations are performed to explore model sensitivity to sea-ice fractions. First, ERA5 sea-ice fractions are set to be equal to zero to the north, west, and east of Utqiaġvik to examine the effect of having ice-free conditions and the presence of open leads locally (as seen by the radar). Second, ERA5 sea-ice fractions are set to be equal to 0.75 north, west, and east of Utqiaġvik and northwest of Alaska. In both cases, the model is run on a windy day (28 February 2014). The first sensitivity test leads to an increase in SSA emission fluxes of up to 0.2 when sea-ice fractions equal zero and to an increase of up to 1.2 and 0.05 µg m−3 in super-micron and sub-micron Na+, respectively. The second sensitivity test yields similar results. This is because ERA5 sea-ice fractions are higher (more sea ice) than those of the test case (0.75), leading to increases in the SSA emission fluxes, especially east of Utqiaġvik. Again, super-micron SSAs (increases of up to 1.5 µg m−3) are affected more than sub-micron SSAs. These results illustrate the regional sensitivity of super-micron SSAs rather than of sub-micron SSAs to prescribed sea-ice fractions. Missing mechanisms influencing sub-micron SSA emissions may need to be included in the model, such as SSA production of, in particular, ultrafine particles from breaking waves in the surf zone (Clarke et al., 2006). However, information about wave-breaking activity in the surf zone during winter along the northern Alaskan coast is needed to address this.
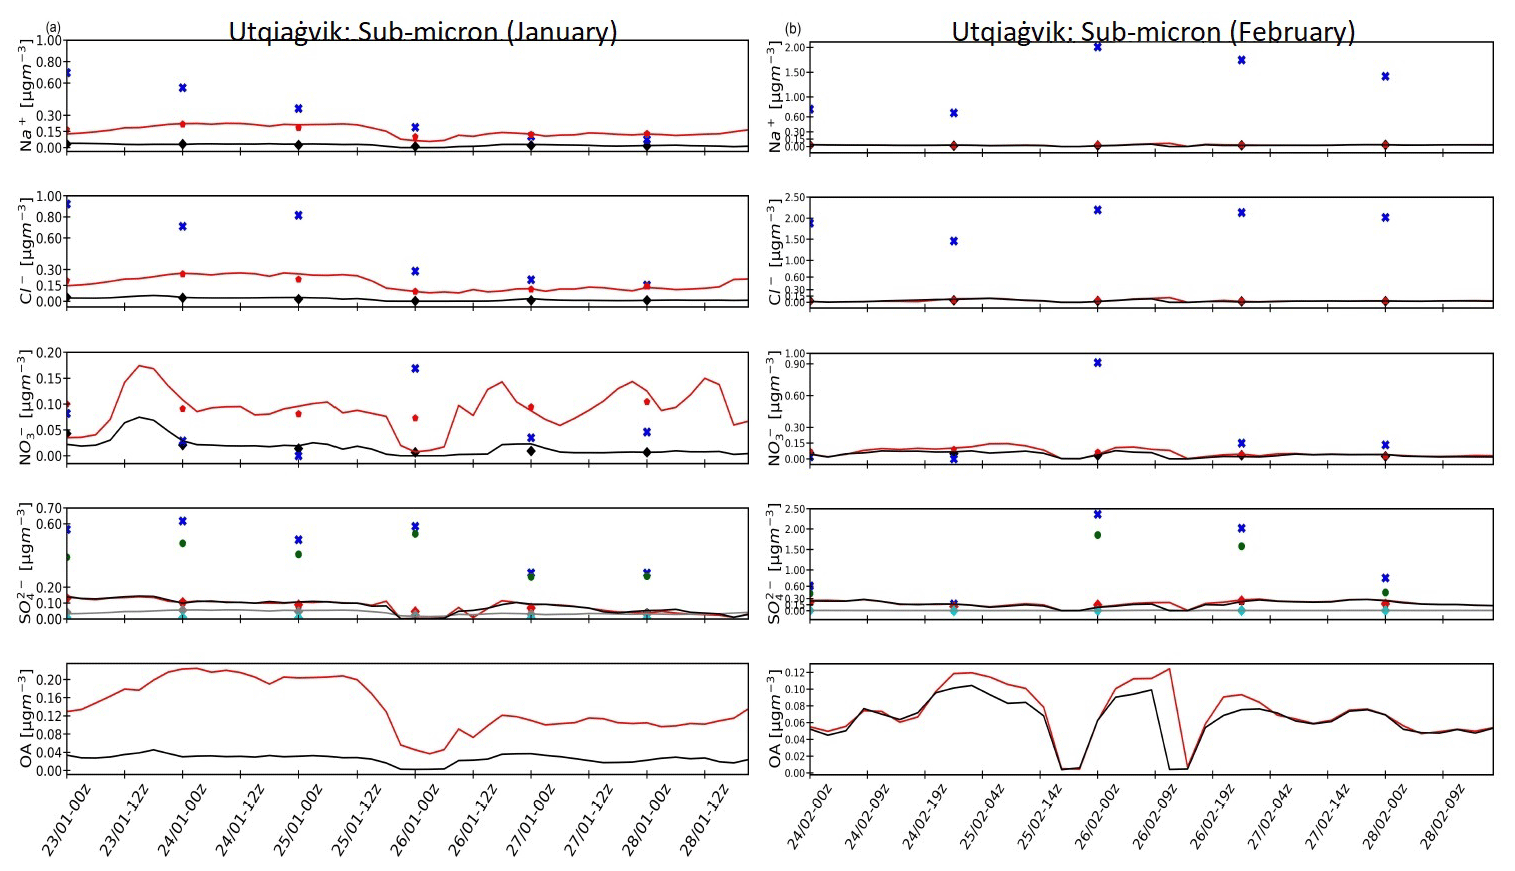
Figure 10Evaluation of daily averaged modelled aerosol composition against in situ daily observations at Utqiaġvik during the (a) January and (b) February 2014 campaign periods in UTC and STP conditions. The black lines show model results from the ALASKA_CONTROL_JAN/FEB; the red lines show the ALASKA_NEW_JAN/FEB, while the daily average observations are shown as blue crosses. The corresponding model daily averages are shown as black diamonds for the ALASKA_CONTROL_JAN/FEB runs and as red pentagons for ALASKA_NEW_JAN/FEB runs. Green circles show observed ss . The grey lines and pentagons show modelled ss for ALASKA_NEW_JAN/FEB, and dark-turquoise pentagons show modelled daily average ss for ALASKA_CONTROL_JAN/FEB. Note the different scales. See the text for more details.
6.4 Evaluation against observations in northern Alaska
Results from runs at 20 km with and without the main changes included in the sensitivity tests (local source of marine organics, higher wind speed dependence, and ERA-5 sea-ice fractions) are compared to sub-micron aerosol observations at Utqiaġvik for both the January and February 2014 periods (see Fig. 10). We note that there are no super-micron observations available due to the weekly sampling frequency. It is interesting to compare to these periods, since the observations show different behaviours. While observed sub-micron Na+ and Cl− concentrations reached up to 2.5 µg m−3 in February, they did not exceed 1 µg m−3 in January. As noted earlier, such high concentrations were not observed at Alert and Villum during January and February 2014. The January run, including all the updates (ALASKA_NEW_JAN), better captures sub-micron Na+ and Cl− (reduced biases and RMSEs – see Table F1 in Appendix F), although it underestimates observations by up to 0.6 and 0.8 µg m−3 (Fig. 10a), respectively, while sub-micron is slightly overestimated. Biases and RMSEs (see Table F2 in Appendix F) are also slightly improved for February, although sub-micron Na+ and Cl− are still underestimated by up to 1.5 µg m−3. Slightly more is simulated in January, even if the model still underestimates the elevated observations. Up to 6 times more OA is simulated during both periods, which is in better agreement with reported observations (Moschos et al., 2022b), as discussed in Sect. 5.2. The sensitivity tests discussed in this section do not directly address the model underestimation of elevated episodes of sub-micron total , since it is mostly nss , and thus the changes are small (during both simulation periods). We note that these runs at 20 km are for periods including elevated aerosols and are thus more challenging for the model to reproduce. Runs at a higher resolution may be needed to better resolve, for example, sea-ice distributions.
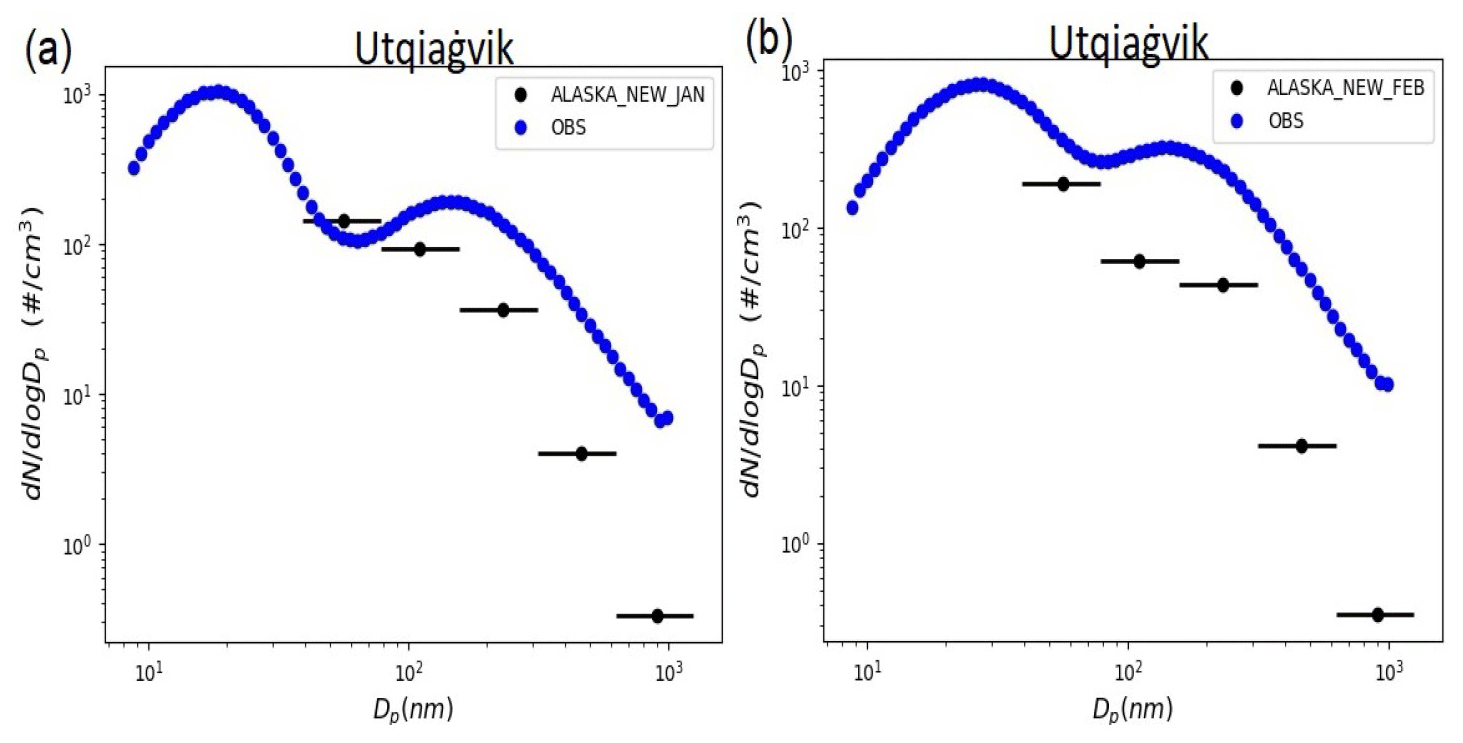
Figure 11Averaged modelled (black) and measured (blue) particle number size distributions (y axis) in particle number(#)cm−3 during the (a) January and (b) February 2014 campaign periods at Utqiaġvik as a function of particle diameter (Dp) in nm. The model results are from the ALASKA_NEW_JAN and ALASKA_NEW_FEB simulations. The black dot is plotted in the middle of each MOSAIC bin. The lines left and right of each dot indicate the minimum and the maximum of range of each bin.
Observations of particle number concentration are also used to validate the regional model results at Utqiaġvik (see Fig. 11). High number concentrations are observed during both periods, up to 103 particles per cm3, especially for particle sizes less than 20 nm. Freud et al. (2017) reported similar wintertime magnitudes in the accumulation mode (diameter range 100–200 nm) at Utqiaġvik, averaging between 1×10² and 2×10² particles per cm3, whereas smaller number concentrations were reported for particles less than 50 nm compared to that shown here. These differences can be explained by the fact that the SMPS data used here do not exclude local and/or regional pollution based on wind speed criteria, unlike Freud et al. (2017). Local or regional pollution influenced by Utqiaġvik town or by NSA oil fields could lead to new particle growth events (small particles) in the absence of sunlight, as discussed by Kolesar et al. (2017). Freud et al. (2017) also noted that particle number concentrations are higher at Utqiaġvik and Tiksi (sites in proximity to local sources) compared to at other Arctic sites (Alert, Villum, and Zeppelin). The model tends to underestimate observed number concentrations, especially in the fourth (312.5 to 625.0 nm) and fifth (625.0 to 1250 nm) MOSAIC bins, even if the model compares better in January when measured number concentrations are lower. This is consistent with the evaluation of sub-micron SSAs and other aerosol components, particularly for episodes when observed aerosols were enhanced (Fig. 10). Note that the model results cannot be compared to measurements smaller than 39 nm because MOSAIC does not represent these aerosols explicitly and because nucleation is parameterised. Inclusion of a source function to account for ultrafine SSA emissions, for example, from breaking waves at the surf zone, could also lead to improved model results (Clarke et al., 2006).
Overall, the results presented in this section so far show that modelled sub-micron SSAs (Na+, Cl−) and, as a consequence, are more sensitive to using a higher wind speed dependence than sea-ice fractions over northern Alaska based on estimated biases and RMSEs for each test simulation (not shown here). Sea-ice fractions have a greater effect on super-micron SSA mass concentrations. Modelled sub-micron OAs are more sensitive to a higher wind speed dependence and, to a lesser extent, the introduction of an additional source of local marine organics. However, the latter is highly uncertain.
6.5 Are blowing snow and/or frost flowers a source of sub-micron SSAs during wintertime at Utqiaġvik?
Lastly, we consider whether enhanced SSAs, particularly in the sub-micron size range, at Utqiaġvik could be due to blowing-snow or frost flower sources. As noted earlier, KRP19 found no evidence of blowing snow or frost flowers at this site but found that SSAs originated from open leads during wintertime. Their findings are supported by the earlier laboratory study of Roscoe et al. (2011), who reported that frost flowers are not an efficient source of SSAs. However, Shaw et al. (2010) found that, during winter at Utqiaġvik, surface frost flowers forming on sea and lake ice are a source of marine-derived OM. Modelling studies including a source of blowing snow and frost flowers suggest that they are contributors to SSAs at this time of year at Utqiaġvik, Alert, and Zeppelin (Xu et al., 2013, 2016; Huang and Jaeglé, 2017; Rhodes et al., 2017).
To investigate whether blowing snow or frost flowers could also be a source of SSAs during the campaign at Utqiaġvik, depletion factors are estimated following Frey et al. (2020), referred to as FR20 from now on. FR20 reported that blowing snow was the main source of SSAs rather than frost flowers and open leads in Antarctic wintertime based on and bromide (Br−) depletion in SSAs being indicative of a blowing-snow origin and not of a seawater origin. Other studies also suggested that blowing snow and frost flowers near Utqiaġvik are more characterised by depletion compared to seawater (Douglas et al., 2012; Jacobi et al., 2012).
Here, depletion factors are calculated using modelled and observed sub-micron aerosol mass concentrations during the campaign periods. More specifically, total depletion relative to Na+ (DF), Na+ depletion relative to Cl− (DF), and Br− depletion relative to Na+ (DF only for observations in this case) are calculated using the following equation:
where R is the mass ratio (x:y) of species x and y in the model or in the sample and in reference seawater (RSW) (Millero et al., 2008). A depletion factor (DFx) between zero (small) and 1 (strong) indicates 0 %–100 % depletion, whereas DFx less than zero indicates enrichment. FR20 suggested, based on the depletion of relative to Na+, that most SSA originates from blowing snow on sea ice, with minor contributions from frost flowers, and not from open leads.
Table 5Average sub-micron modelled and observed depletion factors, following Frey et al. (2020), during the campaign periods in January and February 2014 at Utqiaġvik. Model results for ALASKA_NEW_JAN and ALASKA_NEW_FEB simulations are shown, respectively. Observations refer to sub-micron data from NOAA.
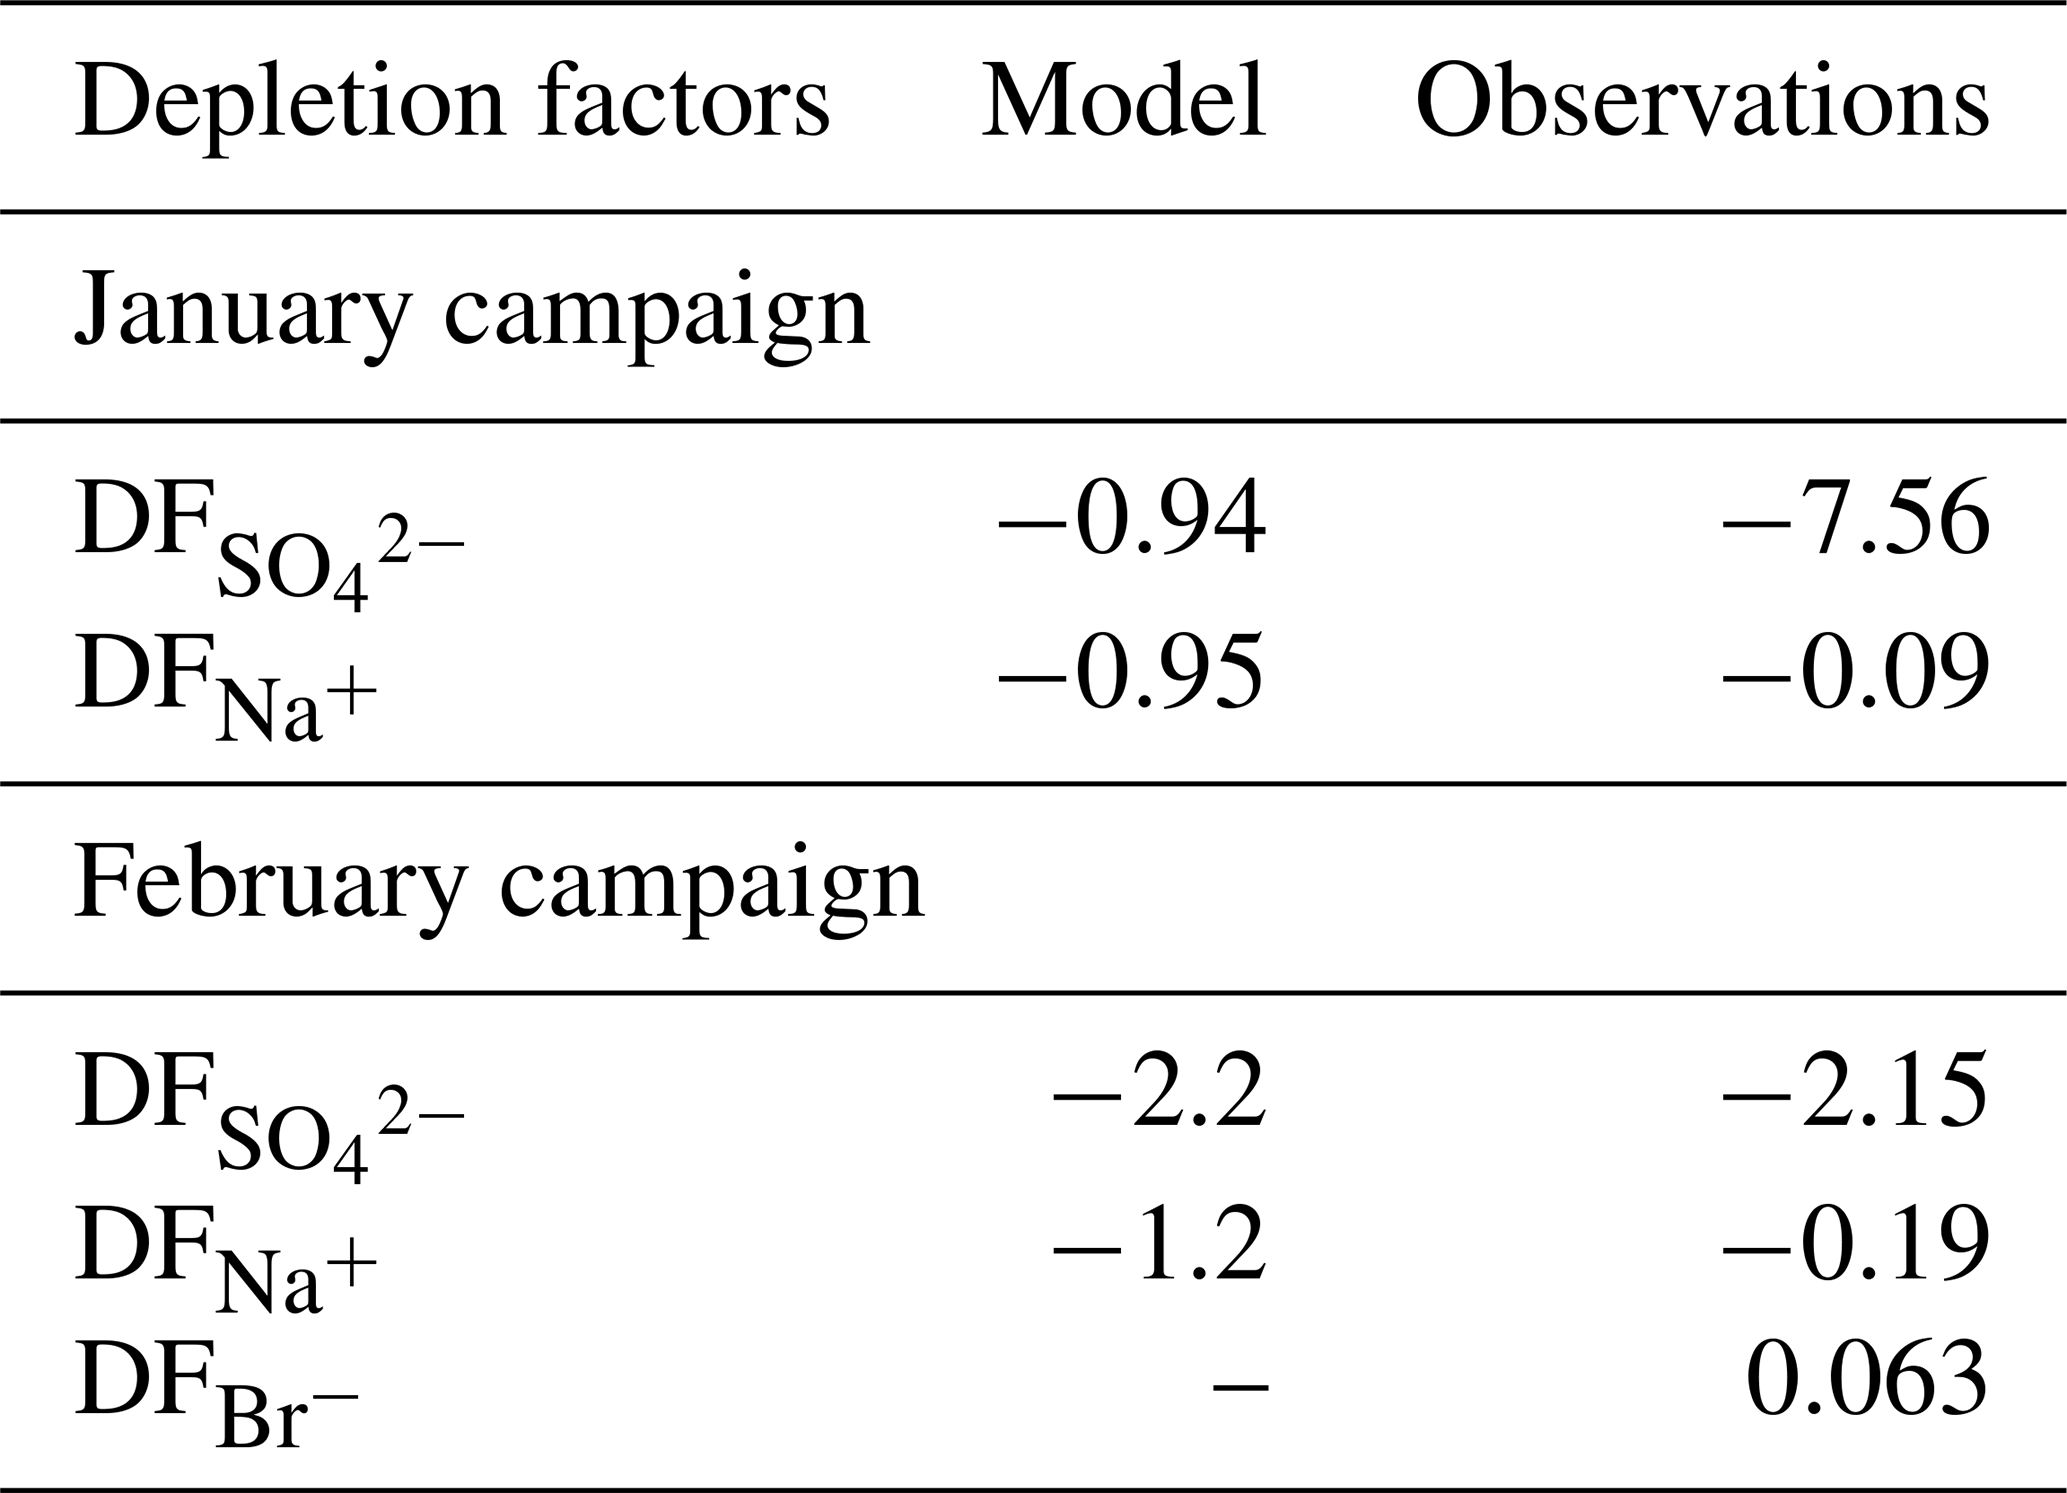
The average values of modelled and observed DFs are shown in Table 5. Total is enriched relative to Na+ in both the observations and the model results during both campaign periods; this is in contrast to FR20, who reported substantial depletion. In February, observed and modelled results both indicate enrichment relative to seawater, whereas in January, model results are less enriched compared to the observations, possibly due to underestimation of nss . In January, observed total concentrations are 7.56 times higher than in reference seawater, possibly due to internal mixing with anthropogenic nss , as noted by KRP18. Modelled total is less enriched than the observations (0.94 times higher than in reference seawater), likely due the model underestimation of nss . FR20 did report a case of enrichment due to possible contamination from the ship, an anthropogenic source. The Na+ depletion factor also shows enrichment during both campaigns, albeit more negligible in the observations than in the model. Observed Na+ depletion relative to Cl− is 1.09 or 1.19 times more than in reference seawater during January and February, respectively. Our analysis suggests that blowing snow and frost flowers are not a significant source of SSAs, at least during this campaign in winter 2014.
SSAs can also play an important role in polar tropospheric O3 and halogen chemistry through the release of active bromine during spring (Fan and Jacob, 1992; Simpson et al., 2007; Peterson et al., 2017). Reactions involving bromine are an important sink of O3 (e.g. Barrie, 1986; Marelle et al., 2021). Br− depletion relative to Na+ is calculated only during February, since observed Br− was zero during the January campaign period. The results for February show a small enrichment, indicating a seawater origin. The observed mass ratio of Br− to Na+ ranges between 0.0057 and 0.0059, while the mass ratio of Br− to Na+ in reference seawater is equal to 0.006. FR20 reported no or little Br− depletion relative to Na+ due to Br− losses at the surface and small depletion further aloft (in Antarctica). For a more comprehensive analysis, observations are required at different locations and altitudes across northern Alaska. We note that the version of WRF-Chem used in this study does not include halogen chemistry. It has since been implemented in a later version by Marelle et al. (2021) to examine springtime O3 depletion events at Utqiaġvik. Heterogeneous reactions on SSAs from the sublimation of lofted blowing snow were also included. Their results suggested that blowing snow could be a source of SSAs during spring, although it should be noted that this model version (including blowing snow as a source of SSAs) overestimated SSAs (da<10 µm) at Arctic sites such as Alert and Villum during spring, while wintertime conditions were not examined.
Table 6Average modelled and observed molar ratios for sub-micron SSAs, following Kirpes et al. (2019), during the campaign periods in January and February 2014 at Utqiaġvik. Model results from ALASKA_NEW_JAN and ALASKA_NEW_FEB simulations are used. Observations refer to sub-micron data from NOAA.
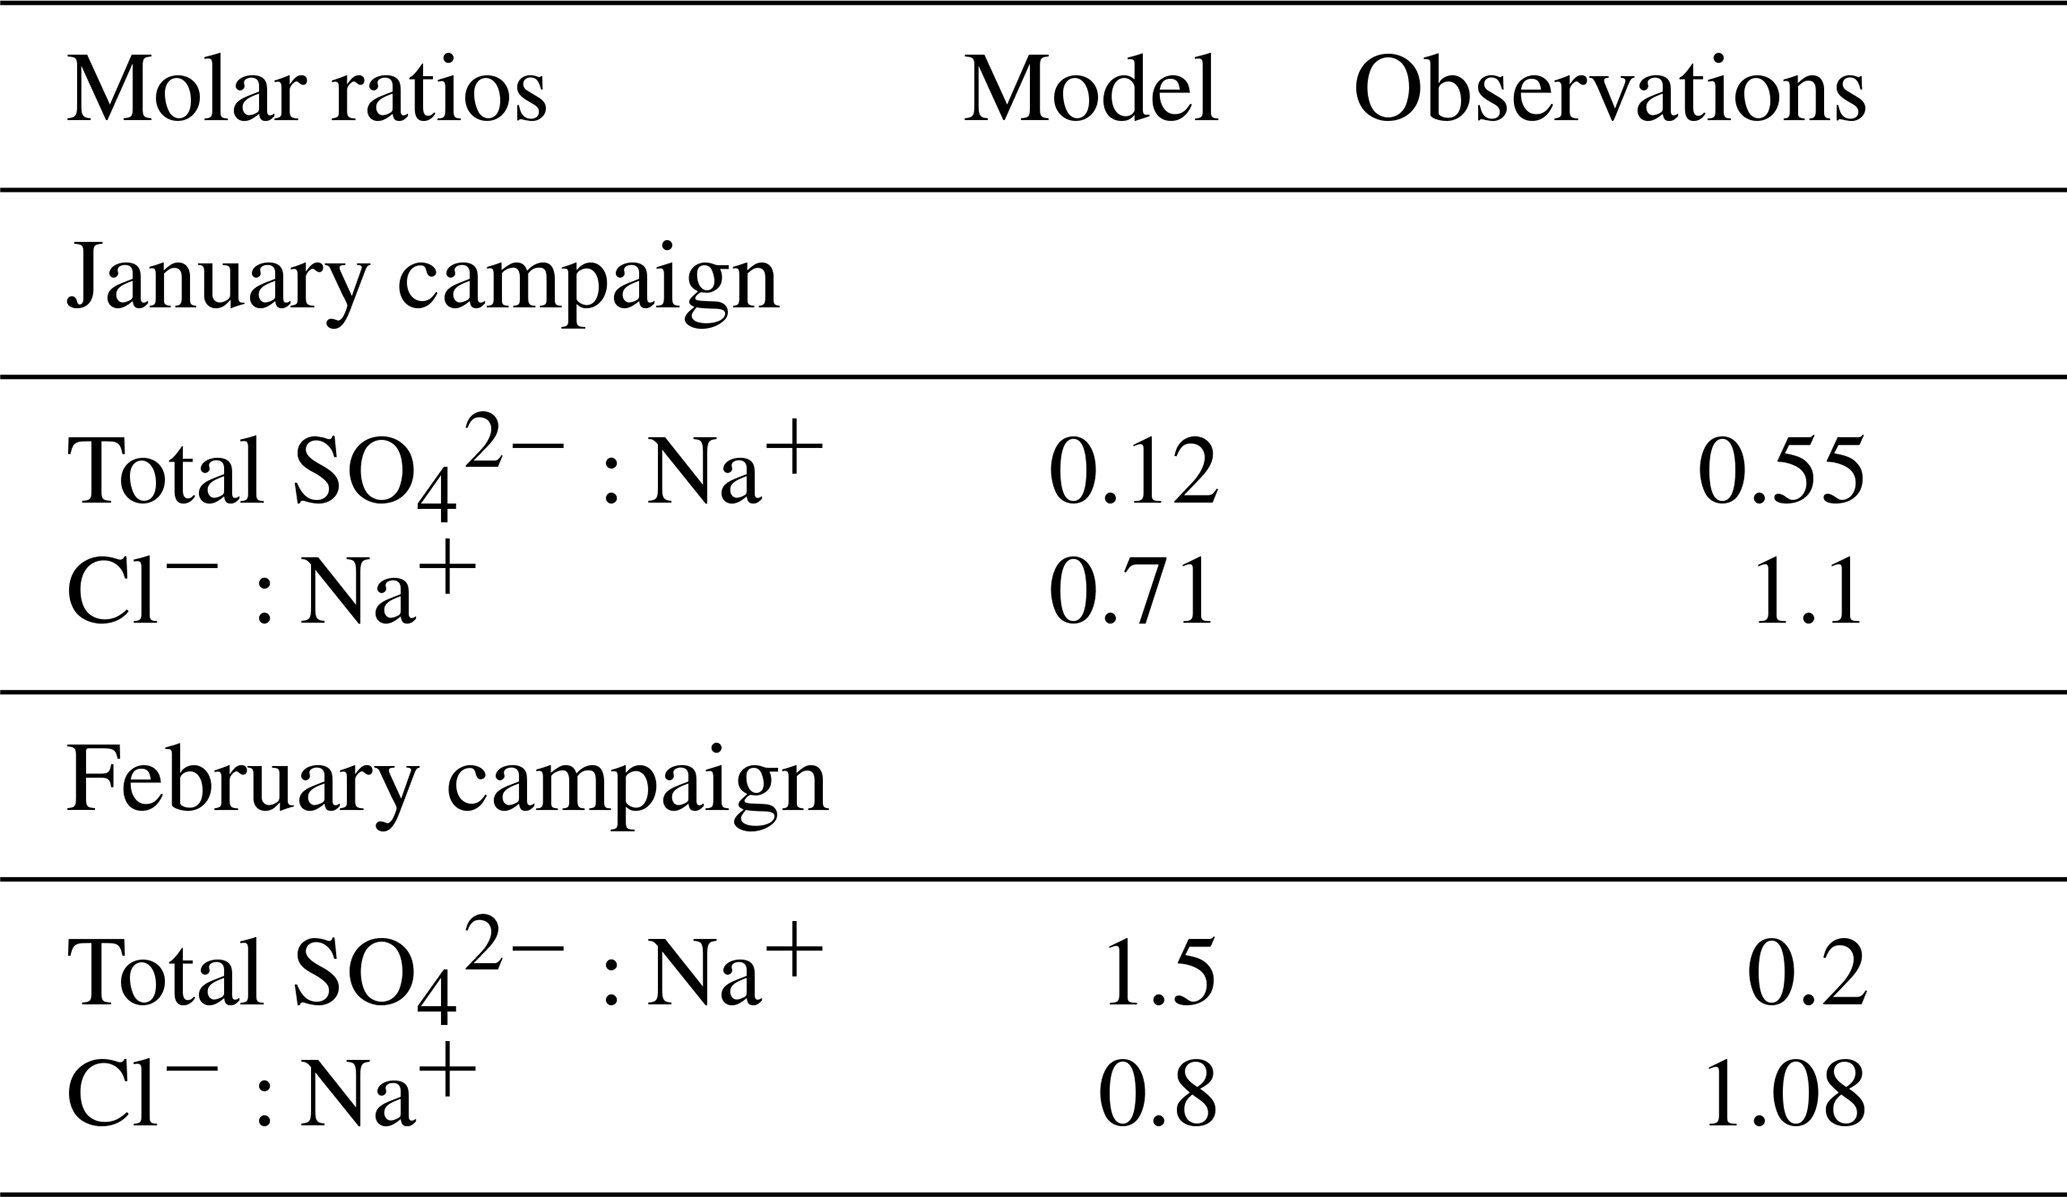
Finally, modelled and observed molar ratios of sub-micron and are estimated to further examine the origins of SSAs and to compare our findings with KPR19 (see Table 6). The averaged molar ratios of sub-micron and derived here for the campaign periods (Table 6) agree with KRP19 ( equal to 1.08; see Table S3 in the Supplement of KRP19, as well as the text and references within). They indicate a seawater origin and confirm the findings of KRP19 that there was no evidence for blowing snow and frost flowers as a source of SSAs during the Utqiaġvik campaign, which is also in agreement with previous studies (May et al., 2016). Model averaged molar ratios are smaller in magnitude than the observations. These discrepancies could be due to the fact that the model underestimates sub-micron SSAs and for the reasons noted earlier. Differences could also be due to issues with modelled SSA lifetime and chemical processing during long-range transport. May et al. (2016) used molar ratio enrichment factors as an indicator of the influence of long-range transport on SSAs at Utqiaġvik. They reported that Cl− depletion was larger for aged sub-micron than for aged super-micron SSAs due to a longer lifetime, which is in line with other studies (Leck et al., 2002; Hara et al., 2002). The regional results (ALASKA_NEW_JAN and ALASKA_NEW_FEB) indicate that modelled sub-micron Cl− has undergone significant atmospheric processing. Thus, the regional model results, influenced by the simulation at 100 km, overestimate aged sub-micron SSAs, while the contribution from locally produced sub-micron SSAs may be too low in the model (modelled enrichment factors equal to 0.5 and 0.4 during January and February simulation periods, respectively, which is lower than the threshold (0.75) defined by May et al., 2016). On the other hand, modelled enrichment factors for super-micron are equal to 0.6 and 0.85 during January and February, respectively, indicating that there is a possible background influence on super-micron SSAs during January, while they are locally produced during February. KRP18 reported the presence of both fresh (locally produced) SSAs and aged (partially Cl−-depleted) SSAs for sub-micron SSAs, while super-micron were mostly fresh (KRP18, Fig. 2). Based on the analysis above (including observations), there is little evidence suggesting that blowing snow or frost flowers are a significant source of SSAs at Utqiaġvik during winter, and open leads are an important primary source, in agreement with KRP19.
In this study, the ability of the WRF-Chem model to simulate wintertime Arctic aerosols is assessed, with a particular focus on SSAs under Arctic haze conditions. The inclusion of updated treatments of SSA emissions leads to improved simulation of SSAs over the wider Arctic compared to the still widely used Gong et al. (1997)-based source function included in the base model. Na+ and Cl− biases are reduced by a factor of 7 to 16 compared to observations at Alert, Villum, and Zeppelin and by a factor of 4 compared to super-micron Na+ and Cl− data at Utqiaġvik. The addition of the SST dependence has a larger effect on modelled SSAs compared to updating the wind speed dependence and is responsible for two-thirds of the reductions in super-micron and/or coarse-mode SSAs due to low SSTs in the Arctic. The use of a more-realistic lower wind speed dependence, based on satellite data, also results in lower super-micron SSAs, though this is up to 5 times less compared to the use of the SST dependence. In addition to uncertainties in wind speed and SST dependencies influencing the production of SSAs, other factors such as seawater composition, wave characteristics, fetch, and salinity may also be playing a role and should be considered in future versions of WRF-Chem. Other SST dependencies could also be tested, which could increase sub-micron SSAs at low temperatures (Sofiev et al., 2011; Salter et al., 2015; Barthel et al., 2019). In addition, missing sources of ultrafine SSA particles, for example, due to breaking waves at the coast, could also be included by defining a surf zone in the model (Clarke et al., 2006). In all cases, more field data are needed to understand and develop source functions for SSAs specific to the Arctic during winter.
Results from this study also highlight the importance of interactions between SSAs and other inorganic aerosols, notably , which have largely anthropogenic origins and contribute to wintertime Arctic haze. Improved simulation of Na+ and Cl− leads to less coarse-mode and more fine-mode in the model, which is in better agreement with the observations. This is due to less formation of via heterogeneous uptake of HNO3, primarily in the coarse mode, and more in the fine mode, in line with previous mid-latitude studies. As a result, simulated aerosols in the updated model are slightly less acidic in the Arctic, improving agreement at some Arctic sites, even if the model tends to simulate aerosols which are too acidic (at some sites).
Marine organic aerosols are also activated in the model, since they are an important component of SSAs in the Arctic and globally, and a source of ss is also added. Simulated OAs are improved by up to a factor of 4 at the Simeonof sub-Arctic site with reduced biases, although, in general, OAs are underestimated at sites over the wider Arctic. The addition of ss agrees well with ss derived from the observations at most Arctic sites and leads to improved modelled total . However, at Zeppelin and Villum, which are dominated by nss , this additional source results in further overestimation. While super-micron , primarily of sea-salt origin, is captured better at Utqiaġvik on the northern Alaskan coast, sub-micron , which is primarily nss , is underestimated at this site during episodes with elevated concentrations and also at GoA further inland. Model discrepancies in terms of OAs and nss may be due to missing local anthropogenic emissions coupled with missing heterogeneous or dark reactions leading to secondary aerosol formation. In the case of OAs, primary marine emissions may also be underestimated. It can be noted that such underestimations are a common feature in other models (Whaley et al., 2022). The above, combined with uncertainties in model transport and wet- and dry-deposition processes, contributes to model deficiencies in simulating wintertime Arctic aerosols (Whaley et al., 2022).
Model sensitivity to different processes affecting wintertime SSAs over northern Alaska is explored further with the aim of understanding, in particular, model underestimation of sub-micron SSAs at Utqiaġvik during winter 2014 when field data analysis showed that marine emissions from open leads were an important source of SSAs, including marine organics (KRP18, KRP19). Based on observed ratios of OC : Na+ from the Utqiaġvik campaign, a local source of marine organics is included in model runs at 20 km over northern Alaska. This results in higher modelled OAs, in better agreement with previous measurements at this site and at other sites such as Alert, although the model still tends to underestimate reported data.
The sensitivity of modelled SSAs over northern Alaska to using a higher wind speed dependence, based on Arctic data, is also investigated. This leads to an increase in modelled sub-micron SSAs, with the model performing better during January than in February. Model sensitivity to prescribed sea-ice fractions is also explored. In a run with ERA5 instead of FNL sea-ice fractions, modelled super-micron SSAs are more sensitive to sea-ice treatments than sub-micron SSAs. In general, modelled sub-micron SSAs are more sensitive to the use of a higher wind speed dependence rather than to the distribution of sea ice. To improve model simulations in this region, field campaigns are needed to study processes that influence wintertime production of SSAs and to determine more realistic sea-ice fractions, which vary on, at least, a daily basis. The use of satellite sea-ice data, combined with higher-resolution simulations over Utqiaġvik, will also help to gain further insights into the influence of open leads on the production of SSAs, including marine organics, during wintertime.
Missing local anthropogenic sources could also explain some of the discrepancies in modelled sub-micron SSAs. For example, anthropogenic sources of Cl−, such as coal combustion, waste incineration, and other industrial activities (Wang et al., 2019) which are not included in current emission inventories, may need to be considered. WRF-Chem and models in general also lack anthropogenic emissions of Na+, which could possibly account for up to 30 % of Na+, as noted by Barrie and Barrie (1990). However, the analysis of depletion factors and molar ratios, presented here for Utqiaġvik, shows that the main source of fresh SSAs is from marine sources, including open ocean or leads. We also find no evidence for frost flowers or blowing snow as a source of SSAs at Utqiaġvik, which is in agreement with the findings of KRP19 and previous studies (May et al., 2016). Further insights into wintertime marine SSA sources, including organics, are needed, as well as improved quantification of local anthropogenic emissions.
Overall, we find that wintertime SSAs at remote Arctic sites contribute between 54 % and 84 % to total inorganic SSAs (observations and improved model results), in agreement with previous findings that SSAs are important contributors to super-micron (coarse-mode, TSP) mass concentrations. Ice fractures and the area of open ocean are likely to become more important with decreasing sea-ice cover in the Arctic as a result of climate warming. This may lead to more SSAs which can act as CCN or INPs, with implications for Arctic aerosol–cloud indirect feedbacks, notably longwave radiative effects which dominate in winter (Eidhammer et al., 2010; Partanen et al., 2014). In addition to ground-based measurements, vertical profiles of SSA components are also needed to better understand SSA sources and their impacts on clouds. Such studies will ultimately help to reduce uncertainties in estimates of aerosol–cloud indirect radiative effects and the magnitude of the associated radiative cooling (Horowitz et al., 2020) or warming (Zhao and Garrett, 2015).
Following Monaghan et al. (2018), the Noah-MP parameter file MPTABLE.TBL has been modified, and it can be used for simulations over Alaska. These modifications improved the model's capability to capture cold surface temperatures and meteorological profiles (e.g. wind speed, relative humidity, temperature) over Alaska during winter. See Table A1.
(Ball et al., 1987; Collatz et al., 1991, 1992; Bonan, 1996; Sellers et al., 1996)(Chen et al., 1997)(Niu et al., 2007)(Niu and Yang, 2004)(Niu and Yang, 2006)Yang and Friedl, 2003Niu and Yang, 2004(Yang et al., 1997)Jordan (1991)Sakaguchi and Zeng (2009)Table A1WRF-Chem land surface (Noah-MP) parameterisation scheme. Opt_ indicates the namelist option for Noah-MP.
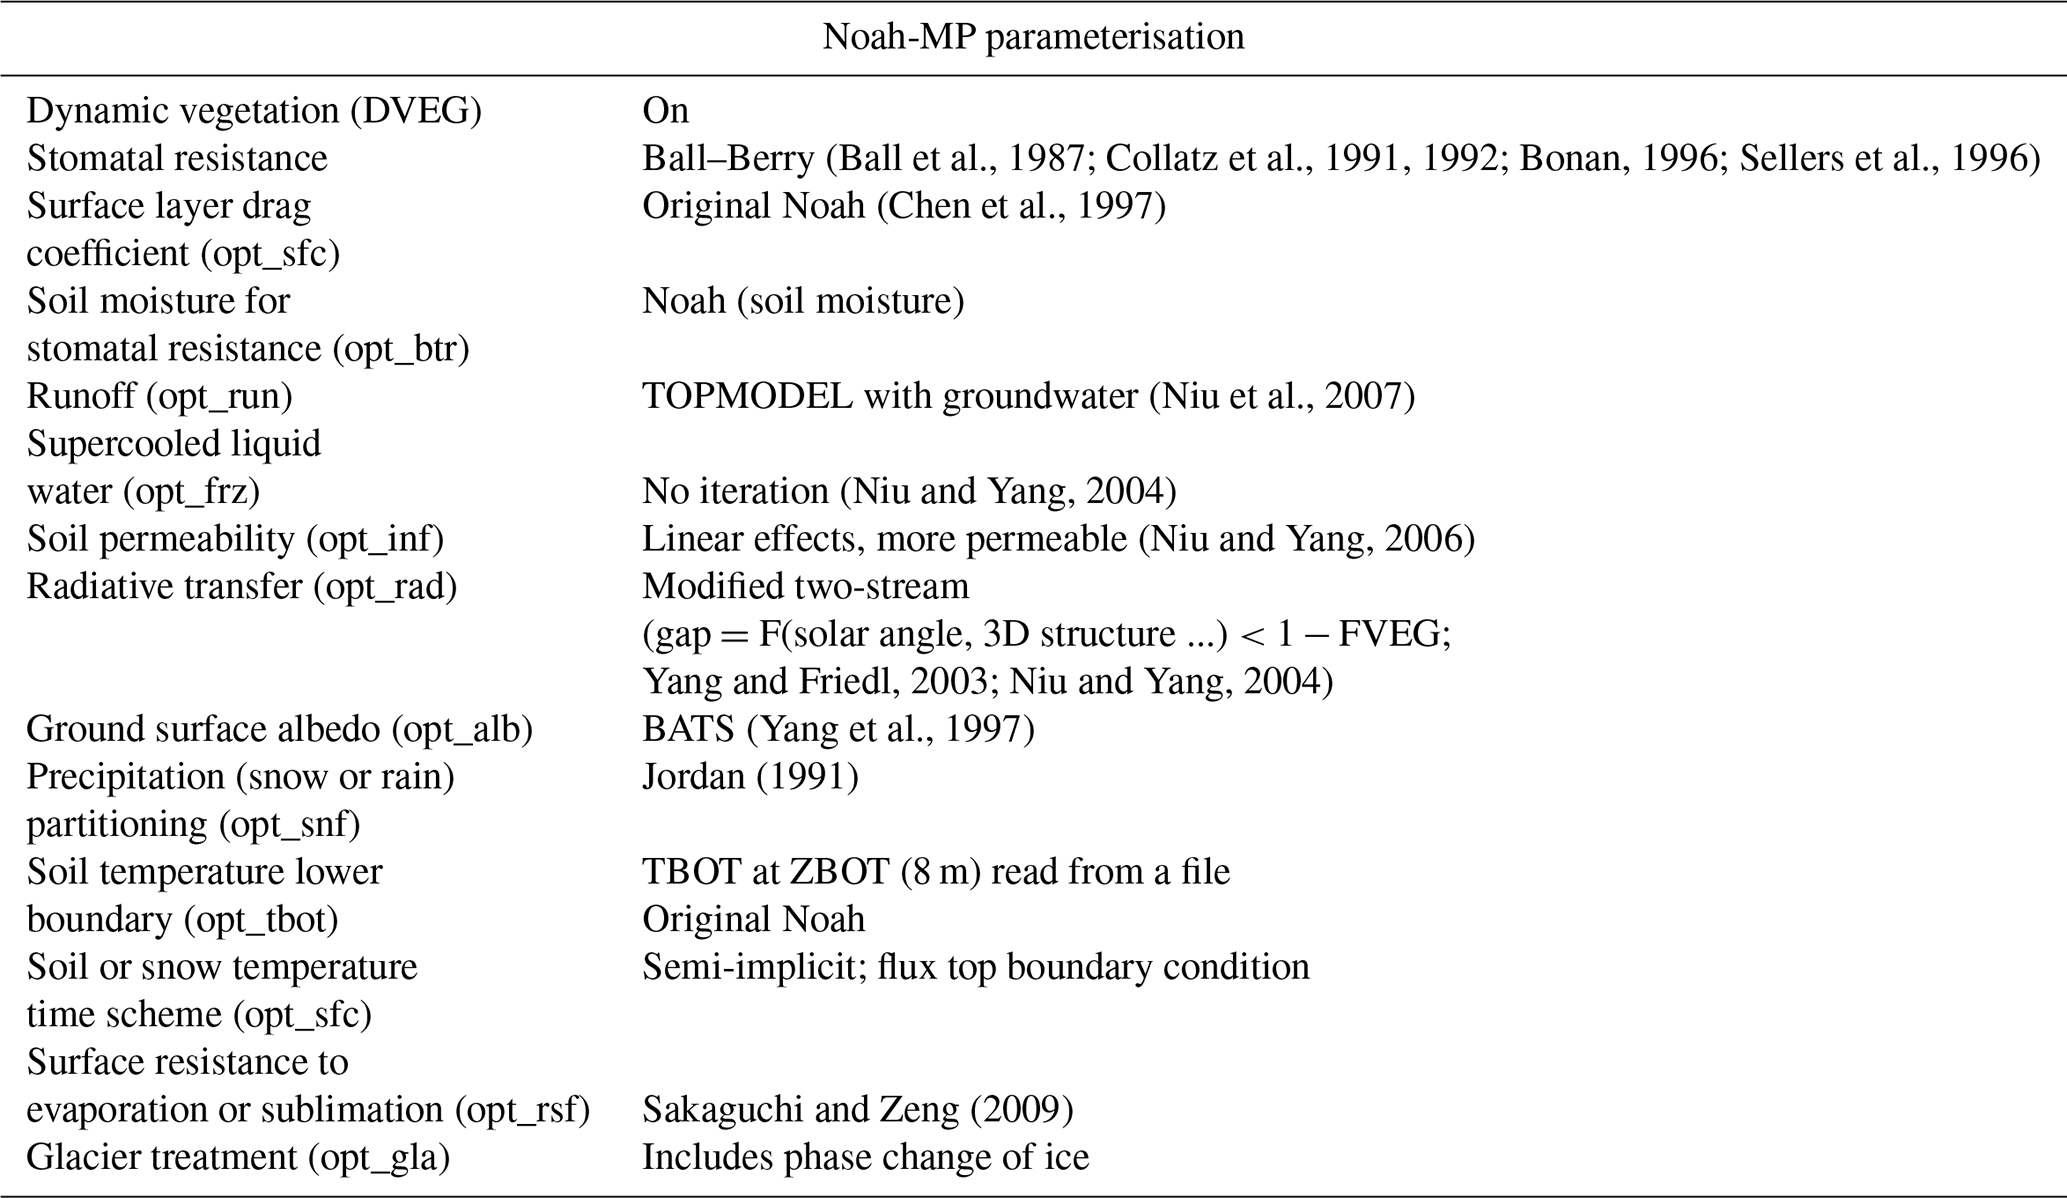
Fuentes size-resolved sea-spray source flux () in m−2 s−1:
where W(U) is Monahan and O'Muircheartaigh whitecap coverage (Monahan and Muircheartaigh, 1980); , in particles , is the size-resolved particle number flux (Fp) per unit time and water surface covered by bubbles; Dp0 (in nm) is the dry diameter; Q is the sweep air flow; Ab is the total surface area covered by bubbles; and is the sub-micron particle size distribution (the sum of four log-normal modes) and is equal to the following:
where i is the sub-index for the mode number (1 to 4); and Ni, Dp0g,i, and σi are the total particle number, geometric mean diameter, and geometric standard deviation for each log-normal mode. NT,i and Dp0g,i depend on parameters ai and βi derived from polynomial and exponential regressions and can be found in Table 5 in Fuentes et al. (2010). NT,i and Dp0g,i of the log-normal modes comprise the size distributions as a function of the diatomaceous OC<0.2 µm content of seawater.
The RMSEs are shown for each site and aerosol component in Table C1.
Table C1Root-mean-square errors (RMSEs), in µg m−3, averaged over January and February 2014 for the CONTROL and HEM_NEW simulations compared to the observations. NA stands for not available.
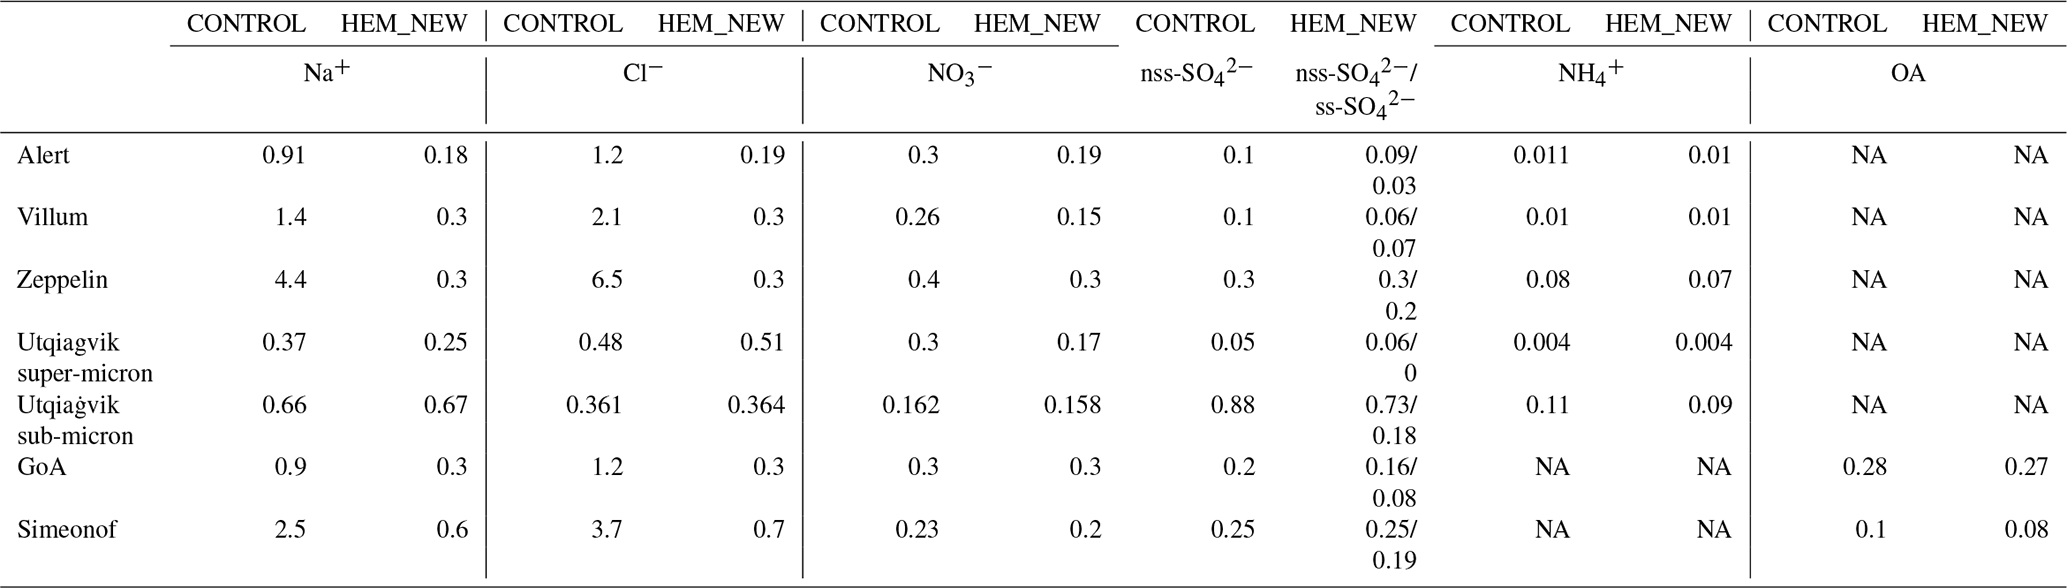
To investigate aerosol acidity, the mean neutralised factor (f) is calculated as the ratio of to the sum of (2nss + ) in molar concentrations, following Fisher et al. (2011), for sites in the Arctic with available observations for these aerosols. When f is equal to 1, then aerosols are assumed to be neutralised; on the other hand, when f<1 then aerosols are acidic, and they are more acidic when f is closer to zero (Fisher et al., 2011). In general, higher molar concentrations were observed for nss compared to for and . Table D1 shows f for observations and the two 100 km simulations at the different sites. Overall, modelled f increases due to the improved treatment of SSAs and the associated influence on via heterogeneous reactions. Since aerosols are assumed to be internally mixed in the model, and nss mass concentrations also vary between the two simulations. Thus, aerosols in HEM_NEW tend to be less acidic (e.g. at Alert and Villum) due to decreases in the coarse-mode and TSP size range. This leads to better agreement with the observed f at Alert, in particular. At Villum, observed aerosols are less acidic than in the model. This could be due to the fact that the model has more compared to the observations. Only small changes are found at Utqiaġvik between the two runs, and the model tends to have aerosols which are slightly more acidic (super-micron) and less acidic (sub-micron) compared to the observations. The small increase in model sub-micron f at Utqiaġvik could be due to the increase in sub-micron and the insignificant changes in and nss . Differences compared to the observed values could be explained by the underestimation of nss at this site. The calculated f for observations could also be biased low (too acidic), since some of the and are present as Na2SO4 and NaNO3 in the atmosphere, which are not measured.
Table D1Estimated mean neutralised factor, f, using the observations and the results from the two quasi-hemispheric simulations (100 km), CONTROL and HEM_NEW at the different sites. f is not estimated for the Simeonof and GoA sites, as there are no observations of .
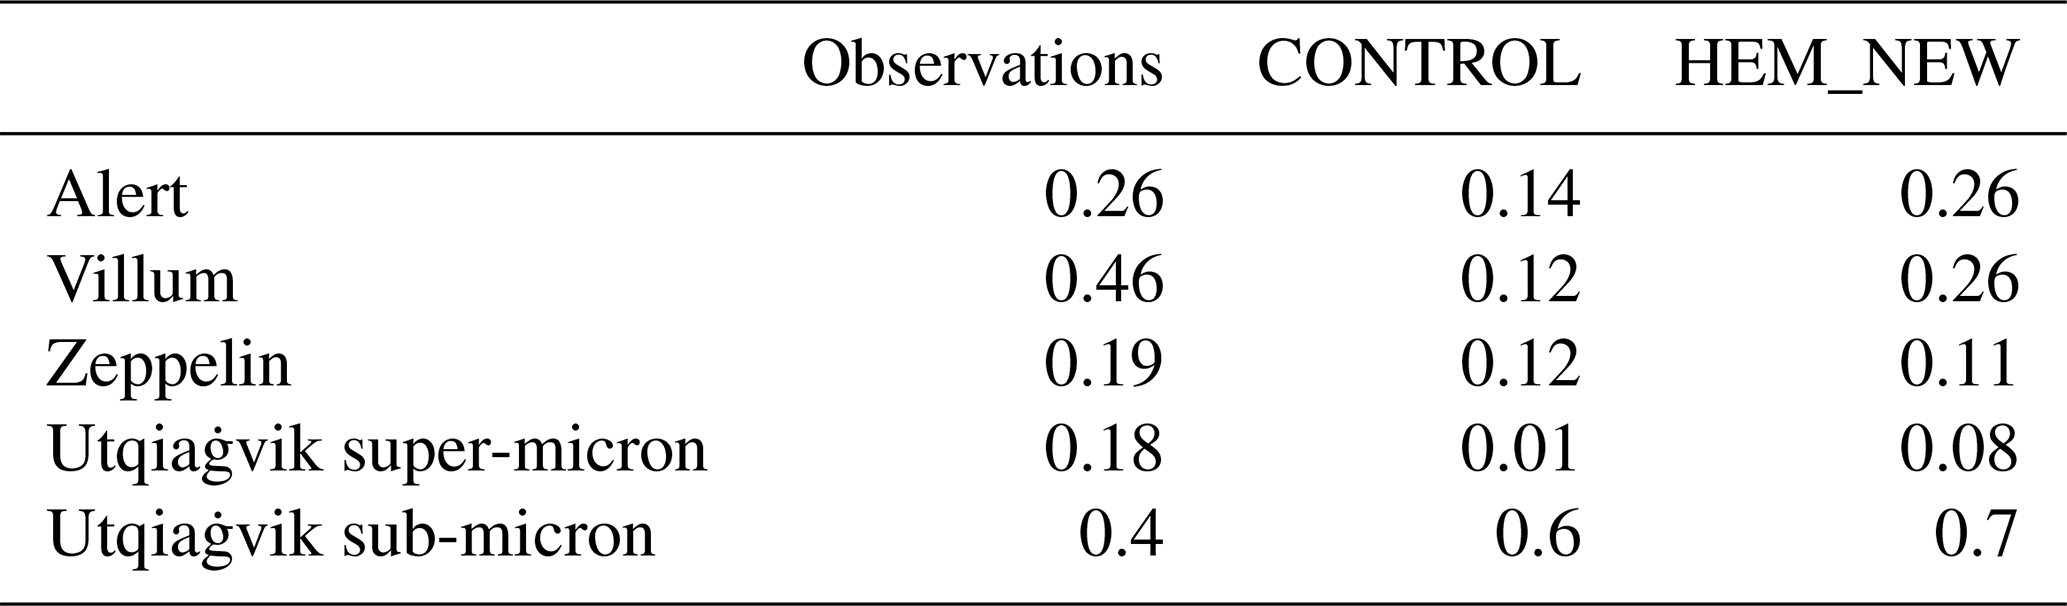
Surface observations are used to validate the meteorological conditions at Utqiaġvik in winter 2014. The model is validated against the surface (hourly) observations obtained from NOAA. Radiosonde data are also used to evaluate model performance at different altitudes. The Utqiaġvik site is located at 71.2∘ N latitude and −156.7∘ W longitude. Figure E1 below shows the comparison between the average observed and model temperatures and winds as a function of altitude for January and February 2014. Figure E2 shows the time series of observed and modelled 2 and 10 m temperatures and winds at Utqiaġvik during January and February 2014. In both figures, the model results are from the CONTROL run (100 km) and the NEW_ALASKA_JAN and NEW_ALASKA_FEB simulations at 20 km.
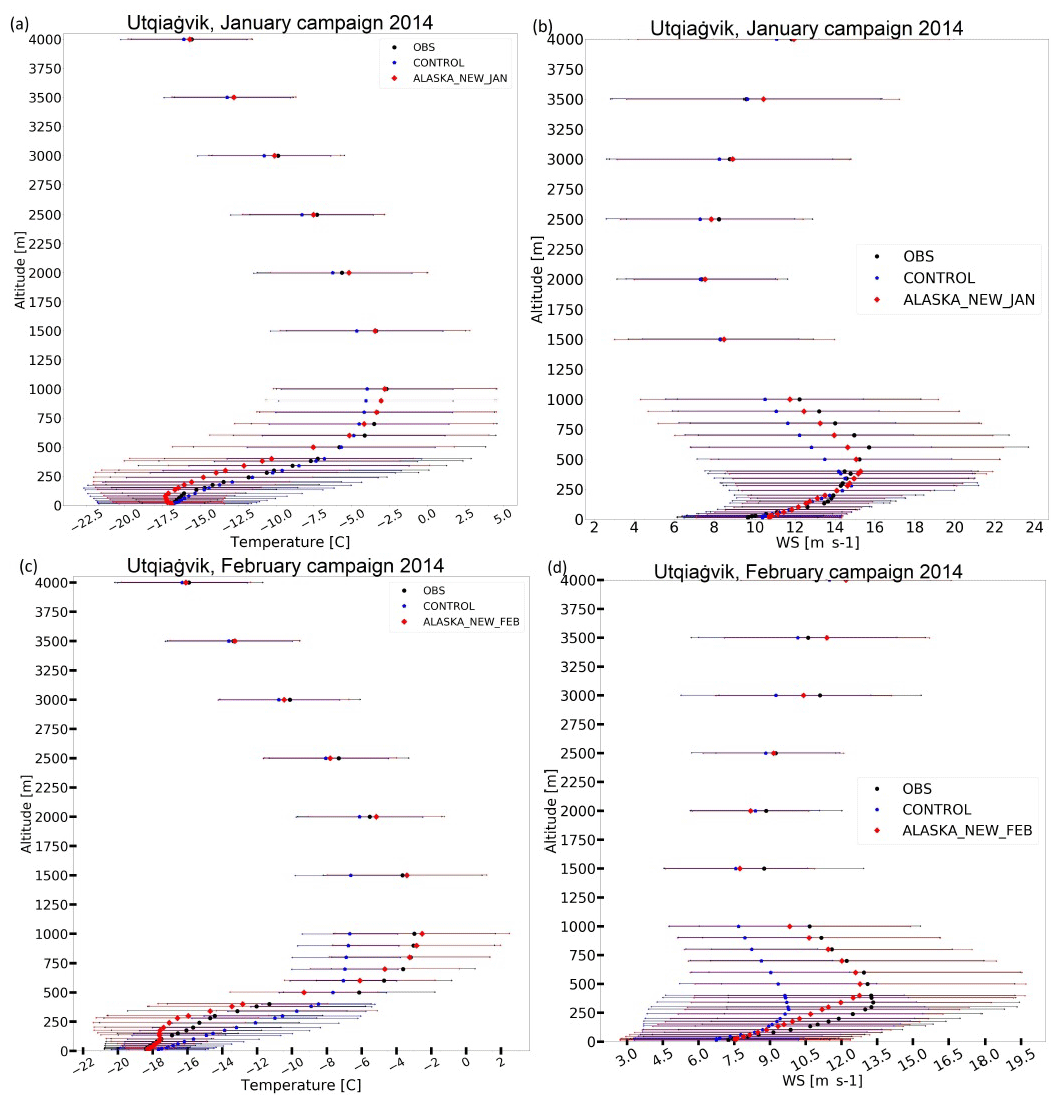
Figure E1Average temperatures, in ∘C, and wind speeds (WS), in m s−1, as a function of altitude (m) up to 4 km during the (a, b) January and (c, d) February campaigns in 2014 at Utqiaġvik, Alaska. The radiosonde observations are shown as black circles. The blue pentagons show the model results for the CONTROL simulation (at 100 km), and the red diamonds show the model results for NEW_ALASKA_JAN and NEW_ALASKA_FEB. Observations are from IGRA2 and are available every 12 h (00:00 and 12:00 UTC). For the comparison, model output at 00:00 and 12:00 UTC is used. The corresponding horizontal lines show the standard deviations.
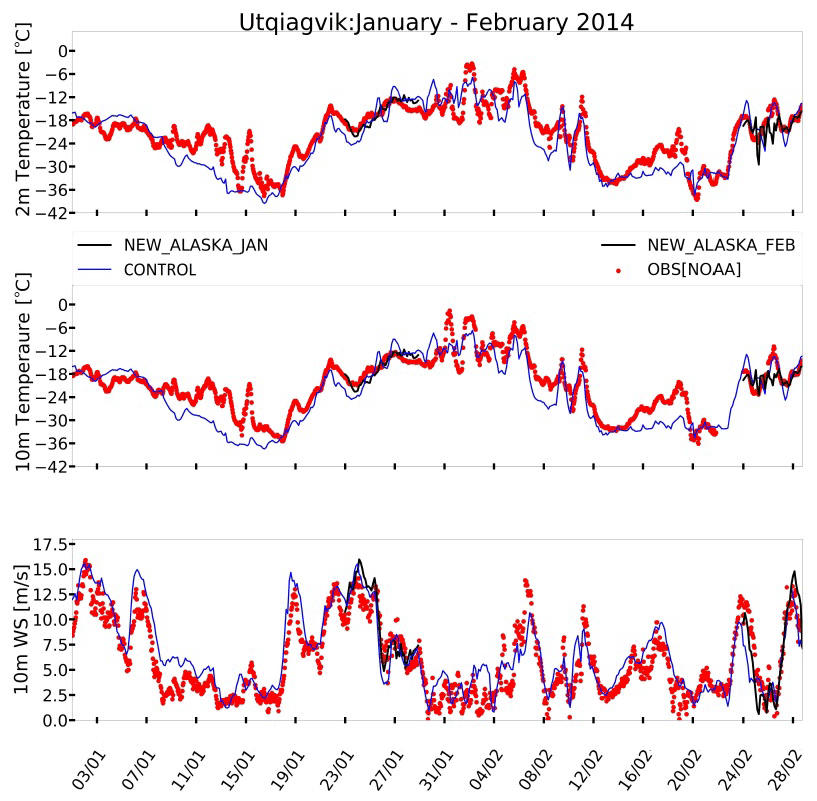
Figure E2Time series of observed and modelled 2 and 10 m temperatures and 10 m wind speeds (WS) at Utqiaġvik, Alaska, in UTC during January and February 2014. The observations shown in red are from the NOAA Observatory. The blue line shows the results for the CONTROL simulation at 100 km, while the black lines show results for the ALASKA_NEW_JAN and ALASKA_NEW_FEB simulations at 20 km. The observations are hourly, while the model output is every 3 h.
Table E1Biases and RMSEs in temperature (∘C), wind speed (m s−1), and wind directions (∘) are calculated between ALASKA_NEW_JAN, ALASKA_NEW_FEB, and in situ meteorological observations from the NOAA Observatory during the campaign periods in January and February 2014. Absolute biases are calculated as the difference between model simulations and the observations.
Biases and RMSEs calculated between ALASKA_NEW_JAN and ALASKA_NEW_FEB and the observations of aerosol composition for Utqiaġvik at 20 km. See Tables F1 and F2. See main text for details.
Table F1Absolute biases and RMSEs in sub-micron aerosol mass concentrations (in µg m−3,) at Utqiaġvik, north of Alaska, during the January 2014 campaign for ALASKA_CONTROL_JAN and ALASKA_NEW_JAN simulations at 20 km compared to observations.
Table F2Absolute biases and RMSEs in sub-micron aerosol mass concentrations (in µg m−3) at Utqiaġvik, north of Alaska, during the February 2014 campaign for ALASKA_CONTROL_FEB and ALASKA_NEW_FEB simulations at 20 km compared to observations.
The code used to calculate SSA emissions in this study is available on Zenodo: https://doi.org/10.5281/zenodo.7502210 (Ioannidis et al., 2023).
ECLIPSE v6b emissions are available online at https://previous.iiasa.ac.at/web/home/research/researchPrograms/air/ECLIPSEv6b.html (last access: 2020; IIASA, 2021). All data used in the present paper for Zeppelin and Alert are open access and are available at the EBAS database infrastructure at NILU – Norwegian Institute for Air research: http://ebas.nilu.no/ (Aas et al., 2021; Sharma et al., 2019; Nguyen et al., 2013). Observations for Villum are obtained after personal communication with co-author Henrik Skov. Observations from the IMPROVE database can be obtained from http://views.cira.colostate.edu/fed/QueryWizard/ (last access: 2021; Malm et al., 1994). Sub- and super-micron aerosol mass concentrations at Utqiaġvik, Alaska, can be obtained from the following link: https://saga.pmel.noaa.gov/data/stations/ (last access: 2021; Quinn et al., 2002). The SMPS data can be obtained from ftp://ftp.cmdl.noaa.gov/aerosol/brw/smps/ (last access: 2020; Wiedensohler et al., 2012). High-spatial-resolution images of sea-ice cover are obtained from https://drive.google.com/drive/folders/1jyc8RVRzs5Bzp-n_TlsaAIx6d1MOh-gX (last access: 2021; Druckenmiller et al., 2009; Eicken et al., 2011). Meteorological data used in this study at Utqiaġvik are from the National Oceanic and Atmospheric Administration/Earth System Research Laboratory/Global Monitoring Division (NOAA/ESRL/GMD) Baseline Observatories (https://www1.ncdc.noaa.gov/pub/data/igra/ (last access: 2020 Durre et al., 2018). Radiosonde data (every 12 h) are derived from the Integrated Global Radiosonde Archive version 2 (IGRA 2) (Durre et al., 2018).
The first author (EI) implemented the updates, performed the simulations and the analysis, and drafted the paper. KSL designed the study and contributed to the interpretation of the results and the analysis and to writing the paper. JCR, LM, and TO contributed to the discussions about the model setup and simulations. JCR, LM, KAP, RMK, PKQ, and LMU contributed to the analysis and interpretation of the results. AM and HS contributed to the interpretation of the results. TT and AW contributed to the interpretation of the SMPS analysis. All the co-authors contributed to the paper and the discussions about the results, as well as to the revision of the paper drafts, and have approved the final version.
The contact author has declared that none of the authors has any competing interests.
Publisher's note: Copernicus Publications remains neutral with regard to jurisdictional claims in published maps and institutional affiliations.
Eleftherios Ioannidis was supported by the French Make Our Planet Great Again (MOPGA) PhD programme. The French authors also acknowledge support from the French space agency CNES, MERLIN project. Computer modelling was performed by Eleftherios Ioannidis, who benefited from access to IDRIS HPC resources (GENCI allocations A009017141 and A011017141) and the IPSL mesoscale computing centre (CICLAD: Calcul Intensif pour le Climat, l'Atmosphère et la Dynamique). We acknowledge the use of the MOZART-4 global model output, which is available at http://www.acom.ucar.edu/wrf-chem/mozart.shtml (last access: 2019). We acknowledge the use of the WRF-Chem preprocessor tool mozbc provided by the Atmospheric Chemistry Observations and Modeling Lab (ACOM) of NCAR. We would like to thank the Arctic Monitoring and Assessment Programme AMAP and Zbigniew Klimont for the ECLIPSE v6b anthropogenic emissions. We would like to acknowledge the following European Commission 7th Framework funded projects: (i) ECLIPSE (Evaluating the Climate and Air Quality Impacts of Short-Lived Pollutants – project no. 282688), (ii) PEGASOS (Pan-European Gas-Aerosols-Climate Interaction Study – project no. 265148), and (iii) Assessment of hemispheric air pollution on EU air policy (contract no. 07.0307/2011/605671/SER/C3). Kerri A. Pratt acknowledges funding from the US National Science Foundation (grant no. OPP-1724585). This is PMEL contribution no. 5366. Lucia M. Upchurch acknowledges the Cooperative Institute for Climate, Ocean, and Ecosystem Studies (CIOCES) under NOAA Cooperative Agreement no. NA20OAR4320271 (contribution no. 2022-1224). Louis Marelle was supported by the European Union's Horizon 2020 research and innovation programme under grant agreement no. 101003826, project CRIceS. Also, we would like to acknowledge the IMPROVE database for the aerosol observations in Alaska. IMPROVE is a collaborative association of state, tribal, and federal agencies and international partners. The US Environmental Protection Agency is the primary funding source, with contracting and research support from the National Park Service. The Air Quality Group at the University of California, Davis, is the central analytical laboratory, with the ion analysis having been provided by the Research Triangle Institute and the carbon analysis having been provided by the Desert Research Institute. We would like to thank Josh Jones, University of Alaska, for providing us with detailed maps of sea-ice fraction plots from the radar at Utqiaġvik. The Villum Foundation is gratefully acknowledged for financing the establishment of the Villum Research Station. We also thank Aas Wenche (Norwegian Institute for Air Research) and Sharma Sangeeta (Environment and Climate Change Canada, Science and Technology Branch, Toronto, Canada) for providing us with EBAS observations at Zeppelin and Alert, respectively. We thank the Canadian Forces Services, Alert, NU, for maintaining the site. The observations at Zeppelin have been supported by the Norwegian Environment Agency (grant no. 17078061).
Eleftherios Ioannidis was supported by the PhD programme of the Make Our Planet Great Again (MOGPA) French initiative. We also received support from the French Agence National de Recherche (ANR) CASPA (Climate-relevant Aerosols and Sources in the Arctic) project (project no. ANR- 21-CE01-0017).
This paper was edited by Radovan Krejci and reviewed by two anonymous referees.
Aas, W., Eckhardt, S., Fiebig, M., Platt, S. M., Solberg, S., Yttri, K. E., and Zwaaftink, C. G.: Monitoring of long-range transported air pollutants in Norway. Annual Report 2020, NILU rapport, https://hdl.handle.net/11250/2659956, 2021. a, b
Adachi, K., Tobo, Y., Koike, M., Freitas, G., Zieger, P., and Krejci, R.: Composition and mixing state of Arctic aerosol and cloud residual particles from long-term single-particle observations at Zeppelin Observatory, Svalbard, Atmos. Chem. Phys., 22, 14421–14439, https://doi.org/10.5194/acp-22-14421-2022, 2022. a
Alexander, B., Park, R. J., Jacob, D. J., Li, Q., Yantosca, R. M., Savarino, J., Lee, C., and Thiemens, M.: Sulfate formation in sea-salt aerosols: Constraints from oxygen isotopes, J. Geophys. Res.-Atmos., 110, https://doi.org/10.1029/2004JD005659, 2005. a, b
AMAP: AMAP Assessment 2015: Black carbon and ozone as Arctic climate forcers, ISBN 978-82-7971-092-9, 2015. a
Archer-Nicholls, S., Lowe, D., Utembe, S., Allan, J., Zaveri, R. A., Fast, J. D., Hodnebrog, Ø., Denier van der Gon, H., and McFiggans, G.: Gaseous chemistry and aerosol mechanism developments for version 3.5.1 of the online regional model, WRF-Chem, Geosci. Model Dev., 7, 2557–2579, https://doi.org/10.5194/gmd-7-2557-2014, 2014. a, b, c
Ball, J. T., Woodrow, I. E., and Berry, J. A.: A model predicting stomatal conductance and its contribution to the control of photosynthesis under different environmental conditions, in: Progress in photosynthesis research, edited by: Biggins, J., Springer, Division of Biology and Medicine, Brown University, Providence, RI, 02912, USA, 221–224, https://doi.org/10.1007/978-94-017-0519-6_48, 1987. a
Barrie, L. and Barrie, M.: Chemical components of lower tropospheric aerosols in the high Arctic: Six years of observations, J. Atmos. Chem., 11, 211–226, 1990. a, b
Barrie, L., Staebler, R., Toom, D., Georgi, B., Den Hartog, G., Landsberger, S., and Wu, D.: Arctic aerosol size-segregated chemical observations in relation to ozone depletion during Polar Sunrise Experiment 1992, J. Geophys. Res.-Atmos., 99, 25439–25451, 1994. a
Barrie, L. A.: Arctic air pollution: An overview of current knowledge, Atmos. Environ., 20, 643–663, 1986. a
Barthel, S., Tegen, I., and Wolke, R.: Do new sea spray aerosol source functions improve the results of a regional aerosol model?, Atmos. Environ., 198, 265–278, 2019. a, b, c, d, e
Berg, L. K., Gustafson, W. I., Kassianov, E. I., and Deng, L.: Evaluation of a modified scheme for shallow convection: Implementation of CuP and case studies, Mon. Weather Rev., 141, 134–147, 2013. a
Berg, L. K., Shrivastava, M., Easter, R. C., Fast, J. D., Chapman, E. G., Liu, Y., and Ferrare, R. A.: A new WRF-Chem treatment for studying regional-scale impacts of cloud processes on aerosol and trace gases in parameterized cumuli, Geosci. Model Dev., 8, 409–429, https://doi.org/10.5194/gmd-8-409-2015, 2015. a, b
Bonan, G. B.: Land surface model (LSM version 1.0) for ecological, hydrological, and atmospheric studies: Technical description and users guide. Technical note, Tech. rep., National Center for Atmospheric Research, Boulder, CO (United States), Climate and Global Dynamics Div., PB-97-131494/XAB; NCAR/TN-417-STR TRN: 70341497, 1996. a
Bowen, H. J. M.: Environmental chemistry of the elements, Academic Press, 9780121204501, Record Number: 19800700395, 1979. a
Browse, J., Carslaw, K. S., Mann, G. W., Birch, C. E., Arnold, S. R., and Leck, C.: The complex response of Arctic aerosol to sea-ice retreat, Atmos. Chem. Phys., 14, 7543–7557, https://doi.org/10.5194/acp-14-7543-2014, 2014. a
Burrows, S. M., Hoose, C., Pöschl, U., and Lawrence, M. G.: Ice nuclei in marine air: biogenic particles or dust?, Atmos. Chem. Phys., 13, 245–267, https://doi.org/10.5194/acp-13-245-2013, 2013. a
Calhoun, J. A., Bates, T. S., and Charlson, R. J.: Sulfur isotope measurements of submicrometer sulfate aerosol particles over the Pacific Ocean, Geophys. Res. Lett., 18, 1877–1880, 1991. a
Callaghan, A., de Leeuw, G., Cohen, L., and O'Dowd, C. D.: Relationship of oceanic whitecap coverage to wind speed and wind history, Geophys. Res. Lett., 35, https://doi.org/10.1029/2008GL036165, 2008. a
Callaghan, A. H., Deane, G. B., Stokes, M. D., and Ward, B.: Observed variation in the decay time of oceanic whitecap foam, J. Geophys. Res.-Oceans, 117, https://doi.org/10.1029/2012JC008147, 2012. a
Callaghan, A. H., Stokes, M., and Deane, G.: The effect of water temperature on air entrainment, bubble plumes, and surface foam in a laboratory breaking-wave analog, J. Geophys. Res.-Oceans, 119, 7463–7482, 2014. a
Campbell, J. R., Battaglia Jr., M., Dingilian, K., Cesler-Maloney, M., St Clair, J. M., Hanisco, T. F., Robinson, E., DeCarlo, P., Simpson, W., Nenes, Athanasios, R. J. W., and Mao, J.: Source and Chemistry of Hydroxymethanesulfonate (HMS) in Fairbanks, Alaska, Environ. Sci. Technol., 56, 7657–7667, https://doi.org/10.1021/acs.est.2c00410, 2022. a
Carter, W. P.: Documentation of the SAPRC-99 chemical mechanism for VOC reactivity assessment, Contract, 92, 95–308, 2000. a
Chapman, E. G., Gustafson Jr., W. I., Easter, R. C., Barnard, J. C., Ghan, S. J., Pekour, M. S., and Fast, J. D.: Coupling aerosol-cloud-radiative processes in the WRF-Chem model: Investigating the radiative impact of elevated point sources, Atmos. Chem. Phys., 9, 945–964, https://doi.org/10.5194/acp-9-945-2009, 2009. a
Chen, F., Janjić, Z., and Mitchell, K.: Impact of atmospheric surface-layer parameterizations in the new land-surface scheme of the NCEP mesoscale Eta model, Bound.-Lay. Meteorol., 85, 391–421, 1997. a
Chen, Y., Cheng, Y., Ma, N., Wolke, R., Nordmann, S., Schüttauf, S., Ran, L., Wehner, B., Birmili, W., van der Gon, H. A. C. D., Mu, Q., Barthel, S., Spindler, G., Stieger, B., Müller, K., Zheng, G.-J., Pöschl, U., Su, H., and Wiedensohler, A.: Sea salt emission, transport and influence on size-segregated nitrate simulation: a case study in northwestern Europe by WRF-Chem, Atmos. Chem. Phys., 16, 12081–12097, https://doi.org/10.5194/acp-16-12081-2016, 2016. a, b
Chen, Y., Cheng, Y., Ma, N., Wei, C., Ran, L., Wolke, R., Größ, J., Wang, Q., Pozzer, A., Denier van der Gon, H. A. C., Spindler, G., Lelieveld, J., Tegen, I., Su, H., and Wiedensohler, A.: Natural sea-salt emissions moderate the climate forcing of anthropogenic nitrate, Atmos. Chem. Phys., 20, 771–786, https://doi.org/10.5194/acp-20-771-2020, 2020. a
Chi, J. W., Li, W. J., Zhang, D. Z., Zhang, J. C., Lin, Y. T., Shen, X. J., Sun, J. Y., Chen, J. M., Zhang, X. Y., Zhang, Y. M., and Wang, W. X.: Sea salt aerosols as a reactive surface for inorganic and organic acidic gases in the Arctic troposphere, Atmos. Chem. Phys., 15, 11341–11353, https://doi.org/10.5194/acp-15-11341-2015, 2015. a, b
Clarke, A. D., Owens, S. R., and Zhou, J.: An ultrafine sea-salt flux from breaking waves: Implications for cloud condensation nuclei in the remote marine atmosphere, J. Geophys. Res.-Atmos., 111, https://doi.org/10.1029/2005JD006565, 2006. a, b, c
Collatz, G. J., Ball, J. T., Grivet, C., and Berry, J. A.: Physiological and environmental regulation of stomatal conductance, photosynthesis and transpiration: a model that includes a laminar boundary layer, Agr. Forest Meteorol., 54, 107–136, 1991. a
Collatz, G. J., Ribas-Carbo, M., and Berry, J.: Coupled photosynthesis-stomatal conductance model for leaves of C4 plants, Funct. Plant Biol., 19, 519–538, 1992. a
Cravigan, L. T., Ristovski, Z., Modini, R. L., Keywood, M. D., and Gras, J. L.: Observation of sea-salt fraction in sub-100 nm diameter particles at Cape Grim, J. Geophys. Res.-Atmos., 120, 1848–1864, 2015. a
De Leeuw, G., Andreas, E. L., Anguelova, M. D., Fairall, C., Lewis, E. R., O’Dowd, C., Schulz, M., and Schwartz, S. E.: Production flux of sea spray aerosol, Rev. Geophys., 49, https://doi.org/10.1029/2010RG000349, 2011. a
Douglas, T. A., Domine, F., Barret, M., Anastasio, C., Beine, H. J., Bottenheim, J., Grannas, A., Houdier, S., Netcheva, S., and Rowland, G. R. S. A. S.: Frost flowers growing in the Arctic ocean-atmosphere–sea ice–snow interface: 1. Chemical composition, J. Geophys. Res.-Atmos., 117, D00R09, https://doi.org/10.1029/2011JD016186, 2012. a
Druckenmiller, M. L., Eicken, H., Johnson, M. A., Pringle, D. J., and Williams, C. C.: Toward an integrated coastal sea-ice observatory: System components and a case study at Barrow, Alaska, Cold Reg. Sci. Technol., 56, 61–72, 2009. a, b
Durre, I., Yin, X., Vose, R. S., Applequist, S., and Arnfield, J.: Enhancing the data coverage in the Integrated Global Radiosonde Archive, J. Atmos. Ocean. Tech., 35, 1753–1770, 2018. a, b
Easter, R. C., Ghan, S. J., Zhang, Y., Saylor, R. D., Chapman, E. G., Laulainen, N. S., Abdul-Razzak, H., Leung, L. R., Bian, X., and Zaveri, R. A.: MIRAGE: Model description and evaluation of aerosols and trace gases, J. Geophys. Res.-Atmos., 109, D20210, https://doi.org/10.1029/2004JD004571, 2004. a
Eckhardt, S., Quennehen, B., Olivié, D. J. L., Berntsen, T. K., Cherian, R., Christensen, J. H., Collins, W., Crepinsek, S., Daskalakis, N., Flanner, M., Herber, A., Heyes, C., Hodnebrog, Ø., Huang, L., Kanakidou, M., Klimont, Z., Langner, J., Law, K. S., Lund, M. T., Mahmood, R., Massling, A., Myriokefalitakis, S., Nielsen, I. E., Nøjgaard, J. K., Quaas, J., Quinn, P. K., Raut, J.-C., Rumbold, S. T., Schulz, M., Sharma, S., Skeie, R. B., Skov, H., Uttal, T., von Salzen, K., and Stohl, A.: Current model capabilities for simulating black carbon and sulfate concentrations in the Arctic atmosphere: a multi-model evaluation using a comprehensive measurement data set, Atmos. Chem. Phys., 15, 9413–9433, https://doi.org/10.5194/acp-15-9413-2015, 2015. a
Eicken, H., Jones, J., Meyer, F., Mahoney, A., Druckenmiller, M. L., Rohith, M., and Kambhamettu, C.: Environmental security in Arctic ice-covered seas: From strategy to tactics of hazard identification and emergency response, Mar. Technol. Soc. J., 45, 37–48, 2011. a, b
Eidhammer, T., DeMott, P., Prenni, A., Petters, M., Twohy, C., Rogers, D., Stith, J., Heymsfield, A., Wang, Z., Pratt, K. A., Prather, K. A., Murphy, S. M., Seinfeld, J. H., Subramanian, R., and Kreidenweis, S. M.: Ice initiation by aerosol particles: Measured and predicted ice nuclei concentrations versus measured ice crystal concentrations in an orographic wave cloud, J. Atmos. Sci., 67, 2417–2436, 2010. a, b
Emmons, L. K., Walters, S., Hess, P. G., Lamarque, J.-F., Pfister, G. G., Fillmore, D., Granier, C., Guenther, A., Kinnison, D., Laepple, T., Orlando, J., Tie, X., Tyndall, G., Wiedinmyer, C., Baughcum, S. L., and Kloster, S.: Description and evaluation of the Model for Ozone and Related chemical Tracers, version 4 (MOZART-4), Geosci. Model Dev., 3, 43–67, https://doi.org/10.5194/gmd-3-43-2010, 2010. a
Fan, S.-M. and Jacob, D. J.: Surface ozone depletion in Arctic spring sustained by bromine reactions on aerosols, Nature, 359, 522–524, 1992. a
Fast, J. D., Gustafson Jr., W. I., Easter, R. C., Zaveri, R. A., Barnard, J. C., Chapman, E. G., Grell, G. A., and Peckham, S. E.: Evolution of ozone, particulates, and aerosol direct radiative forcing in the vicinity of Houston using a fully coupled meteorology-chemistry-aerosol model, J. Geophys. Res.-Atmos., 111, D21305, https://doi.org/10.1029/2005JD006721, 2006. a
Fisher, J. A., Jacob, D. J., Wang, Q., Bahreini, R., Carouge, C. C., Cubison, M. J., Dibb, J. E., Diehl, T., Jimenez, J. L., Leibensperger, E. M., Zifeng, L., Meinders, M. B., Pye, H. O. T., Quinn, P. K., Sangeeta, S., Streets, D. G., van Donkelaar, A., and Yantosca, R. M.: Sources, distribution, and acidity of sulfate–ammonium aerosol in the Arctic in winter–spring, Atmospheric Environment, 45, 7301–7318, https://doi.org/10.1016/j.atmosenv.2011.08.030, 2011. a, b, c
Freud, E., Krejci, R., Tunved, P., Leaitch, R., Nguyen, Q. T., Massling, A., Skov, H., and Barrie, L.: Pan-Arctic aerosol number size distributions: seasonality and transport patterns, Atmos. Chem. Phys., 17, 8101–8128, https://doi.org/10.5194/acp-17-8101-2017, 2017. a, b, c, d
Frey, M. M., Norris, S. J., Brooks, I. M., Anderson, P. S., Nishimura, K., Yang, X., Jones, A. E., Nerentorp Mastromonaco, M. G., Jones, D. H., and Wolff, E. W.: First direct observation of sea salt aerosol production from blowing snow above sea ice, Atmos. Chem. Phys., 20, 2549–2578, https://doi.org/10.5194/acp-20-2549-2020, 2020. a, b
Frossard, A. A., Shaw, P. M., Russell, L. M., Kroll, J. H., Canagaratna, M. R., Worsnop, D. R., Quinn, P. K., and Bates, T. S.: Springtime Arctic haze contributions of submicron organic particles from European and Asian combustion sources, J. Geophys. Res.-Atmos., 116, D055205, https://doi.org/10.1029/2010JD015178, 2011. a
Frossard, A. A., Russell, L. M., Burrows, S. M., Elliott, S. M., Bates, T. S., and Quinn, P. K.: Sources and composition of submicron organic mass in marine aerosol particles, J. Geophys. Res.-Atmos., 119, 12977–13003, https://doi.org/10.1002/2014JD021913, 2014. a, b
Fuentes, E., Coe, H., Green, D., de Leeuw, G., and McFiggans, G.: On the impacts of phytoplankton-derived organic matter on the properties of the primary marine aerosol – Part 1: Source fluxes, Atmos. Chem. Phys., 10, 9295–9317, https://doi.org/10.5194/acp-10-9295-2010, 2010. a, b, c
Fuentes, E., Coe, H., Green, D., and McFiggans, G.: On the impacts of phytoplankton-derived organic matter on the properties of the primary marine aerosol – Part 2: Composition, hygroscopicity and cloud condensation activity, Atmos. Chem. Phys., 11, 2585–2602, https://doi.org/10.5194/acp-11-2585-2011, 2011. a, b
Fujiki, T., Matsumoto, K., Honda, M. C., Kawakami, H., and Watanabe, S.: Phytoplankton composition in the subarctic North Pacific during autumn 2005, J. Plankton Res., 31, 179–191, 2009. a
Gantt, B., Kelly, J. T., and Bash, J. O.: Updating sea spray aerosol emissions in the Community Multiscale Air Quality (CMAQ) model version 5.0.2, Geosci. Model Dev., 8, 3733–3746, https://doi.org/10.5194/gmd-8-3733-2015, 2015. a, b
Gong, S.: A parameterization of sea-salt aerosol source function for sub-and super-micron particles, Global Biogeochem. Cycles, 17, 1097, https://doi.org/10.1029/2003GB002079, 2003. a, b, c
Gong, S., Barrie, L., and Blanchet, J.-P.: Modeling sea-salt aerosols in the atmosphere: 1. Model development, J. Geophys. Res.-Atmos., 102, 3805–3818, 1997. a, b, c, d, e, f, g
Grell, G. A., Dudhia, J., and Stauffer, D. R.: A description of the fifth-generation Penn State/NCAR Mesoscale Model (MM5), NCAR/TN-398 + STR, NCAR TECHNICAL NOTE, 1994. a
Grell, G. A., Peckham, S. E., Schmitz, R., McKeen, S. A., Frost, G., Skamarock, W. C., and Eder, B.: Fully coupled “online” chemistry within the WRF model, Atmos. Environ., 39, 6957–6975, 2005. a
Grythe, H., Ström, J., Krejci, R., Quinn, P., and Stohl, A.: A review of sea-spray aerosol source functions using a large global set of sea salt aerosol concentration measurements, Atmos. Chem. Phys., 14, 1277–1297, https://doi.org/10.5194/acp-14-1277-2014, 2014. a
Guenther, A. B., Jiang, X., Heald, C. L., Sakulyanontvittaya, T., Duhl, T., Emmons, L. K., and Wang, X.: The Model of Emissions of Gases and Aerosols from Nature version 2.1 (MEGAN2.1): an extended and updated framework for modeling biogenic emissions, Geosci. Model Dev., 5, 1471–1492, https://doi.org/10.5194/gmd-5-1471-2012, 2012. a
Hancke, K., Lund-Hansen, L. C., Lamare, M. L., Højlund Pedersen, S., King, M. D., Andersen, P., and Sorrell, B. K.: Extreme low light requirement for algae growth underneath sea ice: A case study from Station Nord, NE Greenland, J. Geophys. Res.-Oceans, 123, 985–1000, 2018. a
Hara, K., Osada, K., Matsunaga, K., Iwasaka, Y., Shibata, T., and Furuya, K.: Atmospheric inorganic chlorine and bromine species in Arctic boundary layer of the winter/spring, J. Geophys. Res.-Atmos., 107, 4361, https://doi.org/10.1029/2001JD001008, 2002. a
Hartery, S., Toohey, D., Revell, L., Sellegri, K., Kuma, P., Harvey, M., and McDonald, A. J.: Constraining the surface flux of sea spray particles from the Southern Ocean, J. Geophys. Res.-Atmos., 125, e2019JD032026, https://doi.org/10.1029/2019JD032026, 2020. a
Heidam, N., Christensen, J., Skov, H., and Wåhlin, P.: Monitoring and modelling of the atmospheric environment in Greenland. A review, Sci. Total Environ., 331, 5–28, 2004. a
Hirdman, D., Sodemann, H., Eckhardt, S., Burkhart, J. F., Jefferson, A., Mefford, T., Quinn, P. K., Sharma, S., Ström, J., and Stohl, A.: Source identification of short-lived air pollutants in the Arctic using statistical analysis of measurement data and particle dispersion model output, Atmos. Chem. Phys., 10, 669–693, https://doi.org/10.5194/acp-10-669-2010, 2010. a
Hodnebrog, Ø., Marelle, L., Alterskjær, K., Wood, R. R., Ludwig, R., Fischer, E. M., Richardson, T., Forster, P., Sillmann, J., and Myhre, G.: Intensification of summer precipitation with shorter time-scales in Europe, Environ. Res. Lett., 14, 124050, https://doi.org/10.1088/1748-9326/ab549c, 2019. a
Hong, S.-Y., Noh, Y., and Dudhia, J.: A new vertical diffusion package with an explicit treatment of entrainment processes, Mon. Weather Rev., 134, 2318–2341, 2006. a
Horowitz, H. M., Holmes, C., Wright, A., Sherwen, T., Wang, X., Evans, M., Huang, J., Jaeglé, L., Chen, Q., Zhai, S., and Alexander, B.: Effects of Sea Salt Aerosol Emissions for Marine Cloud Brightening on Atmospheric Chemistry: Implications for Radiative Forcing, Geophys. Res. Lett., 47, e2019GL085838, https://doi.org/10.1029/2019GL085838, 2020. a, b
Huang, J. and Jaeglé, L.: Wintertime enhancements of sea salt aerosol in polar regions consistent with a sea ice source from blowing snow, Atmos. Chem. Phys., 17, 3699–3712, https://doi.org/10.5194/acp-17-3699-2017, 2017. a, b, c
Iacono, M. J., Delamere, J. S., Mlawer, E. J., Shephard, M. W., Clough, S. A., and Collins, W. D.: Radiative forcing by long-lived greenhouse gases: Calculations with the AER radiative transfer models, J. Geophys. Res.-Atmos., 113, D13, https://doi.org/10.1029/2008JD009944, 2008. a
IIASA: ECLIPSE V6b global emission fields, International Institute for Applied Systems Analysis (IIASA) [data set], https://previous.iiasa.ac.at/web/home/research/researchPrograms/air/ECLIPSEv6b.html (last access: 2020), 2021. a
Ioannidis, E., Law, K., Raut, J.-C., Marelle, L., Onishi, T., Kirpes, R. M., Upchurch, L. M., Massling, A., Skov, H., Quinn, P. K., and Pratt, K. A.: WRF-Chem 3.9.1.1: MOSAIC sea-spray emissions, Zenodo [code], https://doi.org/10.5281/zenodo.7502210, 2023. a
IPCC: IPCC, 2021: Climate Change 2021: The Physical Science Basis. Contribution of Working Group I to the Sixth Assessment Report of the Intergovernmental Panel on Climate Change, edited by: Masson-Delmotte, V., Zhai, P., Pirani, A., Connors, S. L., Péan, C., Berger, S., Caud, N., Chen, Y., Goldfarb, L., Gomis, M. I., Huang, M., Leitzell, K., Lonnoy, E., Matthews, J. B. R., Maycock, T. K., Waterfield, T., Yelekçi, O., Yu, R., and Zhou, B., 673–816, https://doi.org/10.1017/9781009157896.007, 2021. a
Jacobi, H., Voisin, D., Jaffrezo, J., Cozic, J., and Douglas, T.: Chemical composition of the snowpack during the OASIS spring campaign 2009 at Barrow, Alaska, J. Geophys. Res.-Atmos., 117, D00R13, https://doi.org/10.1029/2011JD016654, 2012. a
Jaeglé, L., Quinn, P. K., Bates, T. S., Alexander, B., and Lin, J.-T.: Global distribution of sea salt aerosols: new constraints from in situ and remote sensing observations, Atmos. Chem. Phys., 11, 3137–3157, https://doi.org/10.5194/acp-11-3137-2011, 2011. a, b, c, d
Jiménez, P. A., Dudhia, J., González-Rouco, J. F., Navarro, J., Montávez, J. P., and García-Bustamante, E.: A revised scheme for the WRF surface layer formulation, Mon. Weather Rev., 140, 898–918, 2012. a
Jordan, R.: A One-dimensional temperature model for a snow cover: technical documentation for SNTHERM.89, http://hdl.handle.net/11681/11677, 1991. a
Kelly, J. T., Bhave, P. V., Nolte, C. G., Shankar, U., and Foley, K. M.: Simulating emission and chemical evolution of coarse sea-salt particles in the Community Multiscale Air Quality (CMAQ) model, Geosci. Model Dev., 3, 257–273, https://doi.org/10.5194/gmd-3-257-2010, 2010. a, b, c
Kirpes, R. M., Bondy, A. L., Bonanno, D., Moffet, R. C., Wang, B., Laskin, A., Ault, A. P., and Pratt, K. A.: Secondary sulfate is internally mixed with sea spray aerosol and organic aerosol in the winter Arctic, Atmos. Chem. Phys., 18, 3937–3949, https://doi.org/10.5194/acp-18-3937-2018, 2018. a, b, c, d, e, f, g
Kirpes, R. M., Bonanno, D., May, N. W., Fraund, M., Barget, A. J., Moffet, R. C., Ault, A. P., and Pratt, K. A.: Wintertime Arctic Sea Spray Aerosol Composition Controlled by Sea Ice Lead Microbiology, ACS Central Science, 5, 1760–1767, https://doi.org/10.1021/acscentsci.9b00541, 2019. a, b, c, d, e, f, g, h
Kolesar, K. R., Cellini, J., Peterson, P. K., Jefferson, A., Tuch, T., Birmili, W., Wiedensohler, A., and Pratt, K. A.: Effect of Prudhoe Bay emissions on atmospheric aerosol growth events observed in Utqiaġvik (Barrow), Alaska, Atmos. Environ., 152, 146–155, https://doi.org/10.1016/j.atmosenv.2016.12.019, 2017. a
Krembs, C., Eicken, H., Junge, K., and Deming, J.: High concentrations of exopolymeric substances in Arctic winter sea ice: implications for the polar ocean carbon cycle and cryoprotection of diatoms, Deep-Sea Res. Pt. I, 49, 2163–2181, https://doi.org/10.1016/S0967-0637(02)00122-X, 2002. a
Lange, R., Dall'Osto, M., Skov, H., Nøjgaard, J., Nielsen, I., Beddows, D., Simó, R., Harrison, R. M., and Massling, A.: Characterization of distinct Arctic aerosol accumulation modes and their sources, Atmos. Environ., 183, 1–10, 2018. a
Law, K. S., Stohl, A., Quinn, P. K., Brock, C. A., Burkhart, J. F., Paris, J.-D., Ancellet, G., Singh, H. B., Roiger, A., Schlager, Hans, Dibb, J., Jacob, D. J., Arnold, S. R., Pelon J., and Thomas, J. L.: Arctic air pollution: New insights from POLARCAT-IPY, B. Am. Meteorol. Soc., 95, 1873–1895, https://doi.org/10.1175/BAMS-D-13-00017.1, 2014. a
Law, K. S., Roiger, A., Thomas, J. L., Marelle, L., Raut, J.-C., Dalsøren, S., Fuglestvedt, J., Tuccella, P., Weinzierl, B., and Schlager, H.: Local Arctic air pollution: Sources and impacts, Ambio, 46, 453–463, 2017. a
Law, K. S., Raut, J.-C., Marelle, L., Onishi, T., Andrews, E., Ohata, S., Mori, T., Moris, S., Kondo, Y., Sarma, S., Eleftheriadis, K., Klimont, Z., Soulie, A., Darras, S., Granier, C., Quinn, P. K., and Pratt, K. A.: Sensitivity of wintertime Arctic BC to removal processes and regional Alaskan sources, in preparation, 2023. a
Leaitch, W. R., Russell, L. M., Liu, J., Kolonjari, F., Toom, D., Huang, L., Sharma, S., Chivulescu, A., Veber, D., and Zhang, W.: Organic functional groups in the submicron aerosol at 82.5∘ N, 62.5∘ W from 2012 to 2014, Atmos. Chem. Phys., 18, 3269–3287, https://doi.org/10.5194/acp-18-3269-2018, 2018. a, b, c, d
Leck, C., Norman, M., Bigg, E. K., and Hillamo, R.: Chemical composition and sources of the high Arctic aerosol relevant for cloud formation, J. Geophys. Res.-Atmos., 107, AAC 1-1–AAC 1-17, https://doi.org/10.1029/2001JD001463, 2002. a
Lee, J. D., McFiggans, G., Allan, J. D., Baker, A. R., Ball, S. M., Benton, A. K., Carpenter, L. J., Commane, R., Finley, B. D., Evans, M., Fuentes, E., Furneaux, K., Goddard, A., Good, N., Hamilton, J. F., Heard, D. E., Herrmann, H., Hollingsworth, A., Hopkins, J. R., Ingham, T., Irwin, M., Jones, C. E., Jones, R. L., Keene, W. C., Lawler, M. J., Lehmann, S., Lewis, A. C., Long, M. S., Mahajan, A., Methven, J., Moller, S. J., Müller, K., Müller, T., Niedermeier, N., O'Doherty, S., Oetjen, H., Plane, J. M. C., Pszenny, A. A. P., Read, K. A., Saiz-Lopez, A., Saltzman, E. S., Sander, R., von Glasow, R., Whalley, L., Wiedensohler, A., and Young, D.: Reactive Halogens in the Marine Boundary Layer (RHaMBLe): the tropical North Atlantic experiments, Atmos. Chem. Phys., 10, 1031–1055, https://doi.org/10.5194/acp-10-1031-2010, 2010. a
Li, J., Han, Z., and Yao, X.: A modeling study of the influence of sea salt on inorganic aerosol concentration, size distribution, and deposition in the western Pacific Ocean, Atmos. Environ., 188, 157–173, 2018. a
Liu, J., Gunsch, M. J., Moffett, C. E., Xu, L., El Asmar, R., Zhang, Q., Watson, T. B., Allen, H. M., Crounse, J. D., St. Clair, J., Kim, M. P. O., Wenneberg, R. J., Weber, R. J., Sheesley, and Pratt, K. A.: Hydroxymethanesulfonate (HMS) formation during summertime fog in an Arctic oil field, Environ. Sci. Technol. Lett., 8, 511–518, https://doi.org/10.1021/acs.estlett.1c00357, 2021. a
Liu, S., Liu, C.-C., Froyd, K. D., Schill, G. P., Murphy, D. M., Bui, T. P., Dean-Day, J. M., Weinzierl, B., Dollner, M., Diskin, Glenn S, C. G., and Ru-Shan, G.: Sea spray aerosol concentration modulated by sea surface temperature, P. Natl. Acad. Sci. USA, 118, 9, https://doi.org/10.1073/pnas.2020583118, 2021. a, b
Lovejoy, C., Vincent, W. F., Bonilla, S., Roy, S., Martineau, M.-J., Terrado, R., Potvin, M., Massana, R., and Pedrós-Alió, C.: Distribution, Phylogeny, and Growth of Cold-Adapted Picoprasinophytes in Arctic Seas 1, J. Phycol., 43, 78–89, 2007. a
Ma, X., von Salzen, K., and Li, J.: Modelling sea salt aerosol and its direct and indirect effects on climate, Atmos. Chem. Phys., 8, 1311–1327, https://doi.org/10.5194/acp-8-1311-2008, 2008. a
Malm, W. C., Sisler, J. F., Huffman, D., Eldred, R. A., and Cahill, T. A.: Spatial and seasonal trends in particle concentration and optical extinction in the United States, J. Geophys. Res.-Atmos., 99, 1347–1370, https://doi.org/10.1029/93JD02916, 1994. a, b, c
Marelle, L., Raut, J.-C., Law, K. S., Berg, L. K., Fast, J. D., Easter, R. C., Shrivastava, M., and Thomas, J. L.: Improvements to the WRF-Chem 3.5.1 model for quasi-hemispheric simulations of aerosols and ozone in the Arctic, Geosci. Model Dev., 10, 3661–3677, https://doi.org/10.5194/gmd-10-3661-2017, 2017. a, b, c, d, e, f, g
Marelle, L., Thomas, J. L., Ahmed, S., Tuite, K., Stutz, J., Dommergue, A., Simpson, W. R., Frey, M. M., and Baladima, F.: Implementation and Impacts of Surface and Blowing Snow Sources of Arctic Bromine Activation Within WRF-Chem 4.1.1, J. Adv. Model. Earth Sy., 13, e2020MS002391, https://doi.org/10.1029/2020MS002391, 2021. a, b
May, N. W., Quinn, P. K., McNamara, S. M., and Pratt, K. A.: Multiyear study of the dependence of sea salt aerosol on wind speed and sea ice conditions in the coastal Arctic, J. Geophys. Res.-Atmos., 121, 9208–9219, https://doi.org/10.1002/2016JD025273, 2016. a, b, c, d, e, f, g, h
Millero, F. J., Feistel, R., Wright, D. G., and McDougall, T. J.: The composition of Standard Seawater and the definition of the Reference-Composition Salinity Scale, Deep-Sea Res. Pt. I, 55, 50–72, https://doi.org/10.1016/j.dsr.2007.10.001, 2008. a
Monaghan, A. J., Clark, M. P., Barlage, M. P., Newman, A. J., Xue, L., Arnold, J. R., and Rasmussen, R. M.: High-Resolution Historical Climate Simulations over Alaska, J. Appl. Meteorol. Clim., 57, 709–731, 2018. a
Monahan, E. and Muircheartaigh, I.: Optimal Power-Law Description of Oceanic Whitecap Coverage Dependence on Wind Speed, J. Phys. Oceanogr., 10, 2094–2099, 1980. a, b
Monahan, E., Spiel, D. E., and Davidson, K.: A Model of Marine Aerosol Generation Via Whitecaps and Wave Disruption, 1075, https://doi.org/10.1007/978-94-009-4668-2_16, 1986. a, b
Morrison, H., Thompson, G., and Tatarskii, V.: Impact of cloud microphysics on the development of trailing stratiform precipitation in a simulated squall line: Comparison of one-and two-moment schemes, Mon. Weather Rev., 137, 991–1007, 2009. a, b
Moschos, V., Dzepina, K., Bhattu, D., Lamkaddam, H., Casotto, R., Daellenbach, K. R., Canonaco, F., Rai, P., Aas, W., Becagli, S., Calzolai, G., Eleftheriadis, K., Moffet, C. E., Schnelle-Kreis, J., Severi, M., Sangeeta, S., Skov, H., Vestenius, M., Zhang, W., Hakola, H., Hellen, H., Huang, L., Jaffrezo, J.-L., Massling, A., Nøjgaard, J. K., Petäjä, T., Popovicheva, O., Sheesly, R. J., Traversi, R., Yttri, K. E., Schmale, J., Prévôt, A. S. H., Baltensperger, U., and Haddad, I. E.: Equal abundance of summertime natural and wintertime anthropogenic Arctic organic aerosols, Nat. Geosci., 15, 196–202, https://doi.org/10.1038/s41561-021-00891-1, 2022a. a, b
Moschos, V., Schmale, J., Aas, W., Becagli, S., Calzolai, G., Eleftheriadis, K., Moffett, C. E., Schnelle-Kreis, J., Severi, M., Sharma, S., Skov, H., Vestenius, M., Zhang. W., Hakola, H., Hellen, H., Huang, L., Jaffrezo, J.-L., Massling A., Nøjgaard, J. K., Petäjä, T., Popovicheva, O., Sheesley, R. J., Traversi, R., Yttri, K. E., Prévôt, A. S. H., Baltensperger, U., and Haddad, I. E.: Elucidating the present-day chemical composition, seasonality and source regions of climate-relevant aerosols across the Arctic land surface, Environ. Res. Lett., 17, 034032, https://doi.org/10.1088/1748-9326/ac444b, 2022b. a, b
NCEP: NCEP FNL Operational Model Global Tropospheric Analyses, continuing from July 1999, National Centers for Environmental Prediction, National Weather Service, NOAA, U. S. Department of Commerce, https://doi.org/10.5065/D6M043C6, 2000. a
Neumann, D., Matthias, V., Bieser, J., Aulinger, A., and Quante, M.: Sensitivity of modeled atmospheric nitrogen species and nitrogen deposition to variations in sea salt emissions in the North Sea and Baltic Sea regions, Atmos. Chem. Phys., 16, 2921–2942, https://doi.org/10.5194/acp-16-2921-2016, 2016. a
Nielsen, I. E., Skov, H., Massling, A., Eriksson, A. C., Dall'Osto, M., Junninen, H., Sarnela, N., Lange, R., Collier, S., Zhang, Q., Cappa, C. D., and Nøjgaard, J. K.: Biogenic and anthropogenic sources of aerosols at the High Arctic site Villum Research Station, Atmos. Chem. Phys., 19, 10239–10256, https://doi.org/10.5194/acp-19-10239-2019, 2019. a
Niu, G.-Y. and Yang, Z.-L.: Effects of vegetation canopy processes on snow surface energy and mass balances, J. Geophys. Res.-Atmos., 109, D23111, https://doi.org/10.1029/2004JD004884, 2004. a, b
Niu, G.-Y. and Yang, Z.-L.: Effects of frozen soil on snowmelt runoff and soil water storage at a continental scale, J. Hydrometeorol., 7, 937–952, 2006. a
Niu, G.-Y., Yang, Z.-L., Dickinson, R. E., Gulden, L. E., and Su, H.: Development of a simple groundwater model for use in climate models and evaluation with Gravity Recovery and Climate Experiment data, J. Geophys. Res.-Atmos., 112, D07103, https://doi.org/10.1029/2006JD007522, 2007. a
Niu, G.-Y., Yang, Z.-L., Mitchell, K. E., Chen, F., Ek, M. B., Barlage, M., Kumar, A., Manning, K., Niyogi, D., Rosero, E., Tewari, M., and Xia, Y.: The community Noah land surface model with multiparameterization options (Noah-MP): 1. Model description and evaluation with local-scale measurements, J. Geophys. Res.-Atmos., 116, D12109, https://doi.org/10.1029/2010JD015139, 2011. a
Nguyen, Q. T., Skov, H., Sørensen, L. L., Jensen, B. J., Grube, A. G., Massling, A., Glasius, M., and Nøjgaard, J. K.: Source apportionment of particles at Station Nord, North East Greenland during 2008–2010 using COPREM and PMF analysis, Atmos. Chem. Phys., 13, 35–49, https://doi.org/10.5194/acp-13-35-2013, 2013. a
O'Dowd, C. D., Smith, M. H., Consterdine, I. E., and Lowe, J. A.: Marine aerosol, sea-salt, and the marine sulphur cycle: a short review, Atmos. Environ., 31, 73–80, https://doi.org/10.1016/S1352-2310(96)00106-9, 1997. a
O'Dowd, C. D., Facchini, M. C., Cavalli, F., Ceburnis, D., Mircea, M., Decesari, S., Fuzzi, S., Yoon, Y. J., and Putaud, J.-P.: Biogenically driven organic contribution to marine aerosol, Nature, 431, 676–680, 2004. a
Ovadnevaite, J., Ceburnis, D., Martucci, G., Bialek, J., Monahan, C., Rinaldi, M., Facchini, M. C., Berresheim, H., Worsnop, D. R., and O'Dowd, C.: Primary marine organic aerosol: A dichotomy of low hygroscopicity and high CCN activity, Geophys. Res. Lett., 38, L21806, https://doi.org/10.1029/2011GL048869, 2011. a
Ovadnevaite, J., Ceburnis, D., Canagaratna, M., Berresheim, H., Bialek, J., Martucci, G., Worsnop, D. R., and O'Dowd, C.: On the effect of wind speed on submicron sea salt mass concentrations and source fluxes, J. Geophys. Res.-Atmos., 117. D16201, https://doi.org/10.1029/2011JD017379, 2012. a
Ovadnevaite, J., Manders, A., de Leeuw, G., Ceburnis, D., Monahan, C., Partanen, A.-I., Korhonen, H., and O'Dowd, C. D.: A sea spray aerosol flux parameterization encapsulating wave state, Atmos. Chem. Phys., 14, 1837–1852, https://doi.org/10.5194/acp-14-1837-2014, 2014. a, b
Partanen, A.-I., Dunne, E. M., Bergman, T., Laakso, A., Kokkola, H., Ovadnevaite, J., Sogacheva, L., Baisnée, D., Sciare, J., Manders, A., O'Dowd, C., de Leeuw, G., and Korhonen, H.: Global modelling of direct and indirect effects of sea spray aerosol using a source function encapsulating wave state, Atmos. Chem. Phys., 14, 11731–11752, https://doi.org/10.5194/acp-14-11731-2014, 2014. a, b
Peterson, P. K., Pöhler, D., Sihler, H., Zielcke, J., General, S., Frieß, U., Platt, U., Simpson, W. R., Nghiem, S. V., Shepson, P. B., Stirm, B. H., Dhaniyala, S., Wagner, T., Caulton, D. R., Fuentes, J. D., and Pratt, K. A.: Observations of bromine monoxide transport in the Arctic sustained on aerosol particles, Atmos. Chem. Phys., 17, 7567–7579, https://doi.org/10.5194/acp-17-7567-2017, 2017. a
Quinn, P., Coffman, D., Johnson, J., Upchurch, L., and Bates, T.: Small fraction of marine cloud condensation nuclei made up of sea spray aerosol, Nat. Geosci., 10, 674–679, 2017. a
Quinn, P. K., Coffman, D. J., Kapustin, V. N., Bates, T. S., and Covert, D. S.: Aerosol optical properties in the marine boundary layer during the First Aerosol Characterization Experiment (ACE 1) and the underlying chemical and physical aerosol properties, J. Geophys. Res.-Atmos., 103, 16547–16563, https://doi.org/10.1029/97JD02345, 1998. a
Quinn, P. K., Miller, T. L., Bates, T. S., Ogren, J. A., Andrews, E., and Shaw, G. E.: A 3 year record of simultaneously measured aerosol chemical and optical properties at Barrow, Alaska, J. Geophys. Res.-Atmos., 107, AAC 8-1–AAC 8-15, https://doi.org/10.1029/2001JD001248, 2002. a, b, c, d, e, f, g, h, i
Quinn, P. K., Shaw, G., Andrews, E., Dutton, E. G., Ruoho-Airola, T., and Gong, S. L.: Arctic haze: current trends and knowledge gaps, Tellus B, 59, 99–114, https://doi.org/10.1111/j.1600-0889.2006.00238.x, 2007. a
Rahn, K. A. and McCaffrey, R. J.: On the origin and transport of the winter Arctic aerosol, Ann. NY Acad. Sci., 338, 486–503, 1980. a
Raut, J.-C., Marelle, L., Fast, J. D., Thomas, J. L., Weinzierl, B., Law, K. S., Berg, L. K., Roiger, A., Easter, R. C., Heimerl, K., Onishi, T., Delanoë, J., and Schlager, H.: Cross-polar transport and scavenging of Siberian aerosols containing black carbon during the 2012 ACCESS summer campaign, Atmos. Chem. Phys., 17, 10969–10995, https://doi.org/10.5194/acp-17-10969-2017, 2017. a
Revell, L. E., Kremser, S., Hartery, S., Harvey, M., Mulcahy, J. P., Williams, J., Morgenstern, O., McDonald, A. J., Varma, V., Bird, L., and Schuddeboom, A.: The sensitivity of Southern Ocean aerosols and cloud microphysics to sea spray and sulfate aerosol production in the HadGEM3-GA7.1 chemistry–climate model, Atmos. Chem. Phys., 19, 15447–15466, https://doi.org/10.5194/acp-19-15447-2019, 2019. a, b, c
Rhodes, R. H., Yang, X., Wolff, E. W., McConnell, J. R., and Frey, M. M.: Sea ice as a source of sea salt aerosol to Greenland ice cores: a model-based study, Atmos. Chem. Phys., 17, 9417–9433, https://doi.org/10.5194/acp-17-9417-2017, 2017. a
Roscoe, H. K., Brooks, B., Jackson, A., Smith, M., Walker, S., Obbard, R. W., and Wolff, E. W.: Frost flowers in the laboratory: Growth, characteristics, aerosol, and the underlying sea ice, J. Geophys. Res.-Atmos., 116, D12301, https://doi.org/10.1029/2010JD015144, 2011. a
Russell, L. M., Hawkins, L. N., Frossard, A. A., Quinn, P. K., and Bates, T. S.: Carbohydrate-like composition of submicron atmospheric particles and their production from ocean bubble bursting, P. Natl. Acad. Sci. USA, 107, 6652–6657, https://doi.org/10.1073/pnas.0908905107, 2010. a, b, c
Sakaguchi, K. and Zeng, X.: Effects of soil wetness, plant litter, and under-canopy atmospheric stability on ground evaporation in the Community Land Model (CLM3.5), J. Geophys. Res.-Atmos., 114, D01107, https://doi.org/10.1029/2008JD010834, 2009. a
Saliba, G., Chen, C.-L., Lewis, S., Russell, L. M., Rivellini, L.-H., Lee, A. K. Y., Quinn, P. K., Bates, T. S., Haëntjens, N., Boss, E. S., Karp-Boss, L., Baetge, N., Carlson, C. A., and Behrenfeld, M. J.: Factors driving the seasonal and hourly variability of sea-spray aerosol number in the North Atlantic, P. Natl. Acad. Sci. USA, 116, 20309–20314, https://doi.org/10.1073/pnas.1907574116, 2019. a, b
Salisbury, D. J., Anguelova, M. D., and Brooks, I. M.: On the variability of whitecap fraction using satellite-based observations, J. Geophys. Res.-Oceans, 118, 6201–6222, 2013. a
Salisbury, D. J., Anguelova, M. D., and Brooks, I. M.: Global distribution and seasonal dependence of satellite-based whitecap fraction, Geophys. Res. Lett., 41, 1616–1623, https://doi.org/10.1002/2014GL059246, 2014. a, b
Salter, M. E., Zieger, P., Acosta Navarro, J. C., Grythe, H., Kirkevåg, A., Rosati, B., Riipinen, I., and Nilsson, E. D.: An empirically derived inorganic sea spray source function incorporating sea surface temperature, Atmos. Chem. Phys., 15, 11047–11066, https://doi.org/10.5194/acp-15-11047-2015, 2015. a
Schmale, J., Arnold, S., Law, K. S., Thorp, T., Anenberg, S., Simpson, W., Mao, J., and Pratt, K.: Local Arctic air pollution: A neglected but serious problem, Earths Future, 6, 1385–1412, 2018. a, b
Schmale, J., Sharma, S., Decesari, S., Pernov, J., Massling, A., Hansson, H.-C., von Salzen, K., Skov, H., Andrews, E., Quinn, P. K., Upchurch, L. M., Eleftheriadis, K., Traversi, R., Gilardoni, S., Mazzola, M., Laing, J., and Hopke, P.: Pan-Arctic seasonal cycles and long-term trends of aerosol properties from 10 observatories, Atmos. Chem. Phys., 22, 3067–3096, https://doi.org/10.5194/acp-22-3067-2022, 2022. a, b, c, d, e, f, g
Seinfeld, J. and Pandis, S.: Atmospheric Chemistry and Physics: From Air Pollution to Climate Change, Environment: Science and Policy for Sustainable Development, 40, 26, https://doi.org/10.1080/00139157.1999.10544295, 1998. a
Sellers, P., Randall, D., Collatz, G., Berry, J., Field, C., Dazlich, D., Zhang, C., Collelo, G., and Bounoua, L.: A revised Land Surface parameterization (SiB2) for atmospheric GCMs. Part I: Model Formulation, J. Climate, 9, 676–705, https://doi.org/10.1175/1520-0442(1996)009<0676:ARLSPF>2.0.CO;2, 1996. a
Sharma, S., Barrie, L. A., Magnusson, E., Brattström, G., Leaitch, W., Steffen, A., and Landsberger, S.: A factor and trends analysis of multidecadal lower tropospheric observations of Arctic aerosol composition, black carbon, ozone, and mercury at Alert, Canada, J. Geophys. Res.-Atmos., 124, 14133–14161, 2019. a, b, c
Shaw, P. M., Russell, L. M., Jefferson, A., and Quinn, P. K.: Arctic organic aerosol measurements show particles from mixed combustion in spring haze and from frost flowers in winter, Geophys. Res. Lett., 37, L10803, https://doi.org/10.1029/2010GL042831, 2010. a, b, c, d
Shaw, W. J., Jerry Allwine, K., Fritz, B. G., Rutz, F. C., Rishel, J. P., and Chapman, E. G.: An evaluation of the wind erosion module in DUSTRAN, Atmos. Environ., 42, 1907–1921, https://doi.org/10.1016/j.atmosenv.2007.11.022, 2008. a
Sheridan, P., Delene, D., and Ogren, J.: Four years of continuous surface aerosol measurements from the Department of Energy's Atmospheric Radiation measurement Program Southern Great Plains Cloud and Radiation Testbed site, J. Geophys. Res.-Atmos., 106, 20735–20747, 2001. a
Shrivastava, M., Fast, J., Easter, R., Gustafson Jr., W. I., Zaveri, R. A., Jimenez, J. L., Saide, P., and Hodzic, A.: Modeling organic aerosols in a megacity: comparison of simple and complex representations of the volatility basis set approach, Atmos. Chem. Phys., 11, 6639–6662, https://doi.org/10.5194/acp-11-6639-2011, 2011. a
Simpson, W. R., Carlson, D., Hönninger, G., Douglas, T. A., Sturm, M., Perovich, D., and Platt, U.: First-year sea-ice contact predicts bromine monoxide (BrO) levels at Barrow, Alaska better than potential frost flower contact, Atmos. Chem. Phys., 7, 621–627, https://doi.org/10.5194/acp-7-621-2007, 2007. a
Sofiev, M., Soares, J., Prank, M., de Leeuw, G., and Kukkonen, J.: A regional-to-global model of emission and transport of sea salt particles in the atmosphere, J. Geophys. Res.-Atmos., 116, D21302, https://doi.org/10.1029/2010JD014713, 2011. a, b, c
Spada, M., Jorba, O., Pérez García-Pando, C., Janjic, Z., and Baldasano, J. M.: Modeling and evaluation of the global sea-salt aerosol distribution: sensitivity to size-resolved and sea-surface temperature dependent emission schemes, Atmos. Chem. Phys., 13, 11735–11755, https://doi.org/10.5194/acp-13-11735-2013, 2013. a, b
Stroeve, J., Serreze, M., Holland, M., Kay, J., Malanik, J., and Barrett, A.: The Arctic's rapidly shrinking sea ice cover: a research synthesis, Climatic Change, 110, 1005–1027, https://doi.org/10.1007/s10584-011-0101-1, 2012. a
SSu, B., Wang, T., Zhang, G., Liang, Y., Lv, C., Hu, Y., Li, L., Zhou, Z., Wang, X., and Bi, X.: A review of atmospheric aging of sea spray aerosols: Potential factors affecting chloride depletion, Atmos. Environ., 290, 119–365, https://doi.org/10.1016/j.atmosenv.2022.119365, 2022. a, b
Wang, X., Jacob, D. J., Eastham, S. D., Sulprizio, M. P., Zhu, L., Chen, Q., Alexander, B., Sherwen, T., Evans, M. J., Lee, B. H., Haskins, J. D., Lopez-Hilfiker, F. D., Thornton, J. A., Huey, G. L., and Liao, H.: The role of chlorine in global tropospheric chemistry, Atmos. Chem. Phys., 19, 3981–4003, https://doi.org/10.5194/acp-19-3981-2019, 2019. a
Whaley, C. H., Mahmood, R., von Salzen, K., Winter, B., Eckhardt, S., Arnold, S., Beagley, S., Becagli, S., Chien, R.-Y., Christensen, J., Damani, S. M., Dong, X., Eleftheriadis, K., Evangeliou, N., Faluvegi, G., Flanner, M., Fu, J. S., Gauss, M., Giardi, F., Gong, W., Hjorth, J. L., Huang, L., Im, U., Kanaya, Y., Krishnan, S., Klimont, Z., Kühn, T., Langner, J., Law, K. S., Marelle, L., Massling, A., Olivié, D., Onishi, T., Oshima, N., Peng, Y., Plummer, D. A., Popovicheva, O., Pozzoli, L., Raut, J.-C., Sand, M., Saunders, L. N., Schmale, J., Sharma, S., Skeie, R. B., Skov, H., Taketani, F., Thomas, M. A., Traversi, R., Tsigaridis, K., Tsyro, S., Turnock, S., Vitale, V., Walker, K. A., Wang, M., Watson-Parris, D., and Weiss-Gibbons, T.: Model evaluation of short-lived climate forcers for the Arctic Monitoring and Assessment Programme: a multi-species, multi-model study, Atmos. Chem. Phys., 22, 5775–5828, https://doi.org/10.5194/acp-22-5775-2022, 2022. a, b, c, d, e, f, g, h, i, j
Wiedensohler, A., Birmili, W., Nowak, A., Sonntag, A., Weinhold, K., Merkel, M., Wehner, B., Tuch, T., Pfeifer, S., Fiebig, M., Fjäraa, A. M., Asmi, E., Sellegri, K., Depuy, R., Venzac, H., Villani, P., Laj, P., Aalto, P., Ogren, J. A., Swietlicki, E., Williams, P., Roldin, P., Quincey, P., Hüglin, C., Fierz-Schmidhauser, R., Gysel, M., Weingartner, E., Riccobono, F., Santos, S., Grüning, C., Faloon, K., Beddows, D., Harrison, R., Monahan, C., Jennings, S. G., O'Dowd, C. D., Marinoni, A., Horn, H.-G., Keck, L., Jiang, J., Scheckman, J., McMurry, P. H., Deng, Z., Zhao, C. S., Moerman, M., Henzing, B., de Leeuw, G., Löschau, G., and Bastian, S.: Mobility particle size spectrometers: harmonization of technical standards and data structure to facilitate high quality long-term observations of atmospheric particle number size distributions, Atmos. Meas. Tech., 5, 657–685, https://doi.org/10.5194/amt-5-657-2012, 2012 (data available at: ftp://ftp.cmdl.noaa.gov/aerosol/brw/smps/, last access: 2020). a
Wild, O., Zhu, X., and Prather, M.: Fast-J: Accurate Simulation of In- and Below-Cloud Photolysis in Tropospheric Chemical Models, J. Atmos. Chem., 37, 245–282, 2000. a
Wu, S.-P., Dai, L.-H., Zhu, H., Zhang, N., Yan, J.-P., Schwab, J. J., and Yuan, C.-S.: The impact of sea-salt aerosols on particulate inorganic nitrogen deposition in the western Taiwan Strait region, China, Atmos. Res., 228, 68–76, 2019. a
Xu, L., Russell, L. M., Somerville, R. C. J., and Quinn, P. K.: Frost flower aerosol effects on Arctic wintertime longwave cloud radiative forcing, J. Geophys. Res.-Atmos., 118, 13282–13291, https://doi.org/10.1002/2013JD020554, 2013. a, b
Xu, L., Russell, L. M., and Burrows, S. M.: Potential sea salt aerosol sources from frost flowers in the pan-Arctic region, J. Geophys. Res.-Atmos., 121, 10840–10856, https://doi.org/10.1002/2015JD024713, 2016. a
Xu, W., Ovadnevaite, J., Fossum, K. N., Lin, C., Huang, R.-J., Ceburnis, D., and O'Dowd, C.: Sea spray as an obscured source for marine cloud nuclei, Nat. Geosci., 15, 282–286, 2022. a
Yang, R. and Friedl, M. A.: Modeling the effects of three-dimensional vegetation structure on surface radiation and energy balance in boreal forests, J. Geophys. Res.-Atmos., 108, 8615, https://doi.org/10.1029/2002JD003109, 2003. a
Yang Z.-L., R. E. Dickinson, A. R., and Vinnikov, K. Y.: Validation of the snow sub-model of the Biosphere-Atmosphere Transfer Scheme with Russian snow cover and meteorological observational data, J. Climate, 10, 353–373, https://doi.org/10.1175/1520-0442(1997)010<0353:VOTSSO>2.0.CO;2, 1997. a
Zaveri, R. A., Easter, R. C., Fast, J. D., and Peters, L. K.: Model for Simulating Aerosol Interactions and Chemistry (MOSAIC), J. Geophys. Res.-Atmos., 113, D13204, https://doi.org/10.1029/2007JD008782, 2008. a, b, c
Zhao, C. and Garrett, T. J.: Effects of Arctic haze on surface cloud radiative forcing, Geophys. Res. Lett., 42, 557–564, 2015. a, b
Zwaaftink, C. G., Grythe, H., Skov, H., and Stohl, A.: Substantial contribution of northern high-latitude sources to mineral dust in the Arctic, J. Geophys. Res.-Atmos., 121, 13678–13697, https://doi.org/10.1002/2016JD025482, 2016. a
- Abstract
- Introduction
- WRF-Chem
- Aerosol observations
- Model SSA emission treatments and updates
- Evaluation of simulated wintertime SSAs and other aerosols over the Arctic
- Regional processes influencing SSAs over northern Alaska
- Conclusions
- Appendix A
- Appendix B
- Appendix C
- Appendix D
- Appendix E
- Appendix F
- Code availability
- Data availability
- Author contributions
- Competing interests
- Disclaimer
- Acknowledgements
- Financial support
- Review statement
- References