the Creative Commons Attribution 4.0 License.
the Creative Commons Attribution 4.0 License.
 | 17 May 2023
Significant contribution of inland ships to the total NOx emissions along the Yangtze River
Xiumei Zhang
Ronald van der A
Jieying Ding
Xin Zhang
Despite the large number of domestic inland river vessels in China, information on inland ship emissions is very limited, since legislation for shipping emission control is limited and there is no monitoring infrastructure. Taking the Yangtze River in the region of Nanjing as a research area, we compiled a ship emission inventory based on real-time information received from automatic identification system (AIS) signals combined with ship-related data provided by the China Classification Society (CCS) database. The total ship emissions we derived for the Jiangsu section of the Yangtze River from September 2018 to August 2019 for NOx, SO2, PM10 and PM2.5 were 83.5, 0.04, 0.006 and 0.005 kt yr−1, respectively. This ship emission inventory we constructed was compared with the Multi-resolution Emission Inventory for China (MEIC), the Shipping Emission Inventory Model (SEIM) and the satellite-derived emissions using the Daily Emissions Constrained by Satellite Observations (DECSO) algorithm. The results show a consistent spatial distribution, with riverine cities having high NOx pollution. With this comparison we analyzed the relative impact of ship emissions on densely populated regions along the river. Inland ship emissions of NOx are shown to contribute significantly, accounting for at least 40 % of air pollution close to the river.
- Article
(7113 KB) - Full-text XML
-
Supplement
(1263 KB) - BibTeX
- EndNote


Maritime transport plays an essential role in national trade, and as the number of ships increases so does the quantity of emissions they emit into the air. The main pollutants emitted by ships are sulfur dioxide (SO2), nitrogen oxides (NOx= NO + NO2), particulate matter (PM) and volatile organic compounds (VOCs) (Endresen, 2003; Moldanová et al., 2009; Tzannatos, 2010), all of which can affect regional air quality and human health (Capaldo et al., 1999; Dalsøren et al., 2009; Papanastasiou and Melas, 2009; Eyring et al., 2010). In addition to direct pollution from ship emissions, the secondary generation of fine particulate matter, sulfate and ozone further contributes to atmospheric pollution (Corbett, 1997). These pollutants are also transported to large inland areas with sea and land breezes, seriously endangering human health and ecosystems (Dalsøren et al., 2007; Endresen et al., 2007; Collins et al., 2009; Eyring et al., 2010; Fan et al., 2016). Ship emissions have direct and indirect effects on the radiation balance of the atmosphere. For example, O3 chemically produced by NOx from ship emissions can have positive radiative effects, while SO2 emissions have a negative radiative effect, and the sulfate produced by its conversion also has a negative radiative effect at the Earth's surface (Endresen, 2003; Eyring et al., 2007, 2010; Lauer et al., 2007).
According to the World Shipping Council (https://www.worldshipping.org/, last access: 14 May 2023), China possesses seven of the world's top 10 biggest ports. The large number of ships in the ports has exacerbated air pollution in the local and surrounding areas and increased traffic in the connected rivers. Ship emissions in the Yangzte River Delta (YRD) are much higher than those in the Bohai Bay and Pearl River Delta (PRD), reaching about 50 % of the total emissions in these three regions (Chen et al., 2017; Wan et al., 2020). Shipping emissions affecting air quality in the YRD region are mainly within 12 nmi of the coastline (Li et al., 2018). They can contribute between 30 % and 90 %: for example, over 75 % of ship-related SO2 concentrations and 50 % of ship-related PM2.5 concentrations. (Lv et al., 2018; Feng et al., 2019). The data from the Ministry of Transport of China show that by the end of 2021, the number of inland river transport vessels was 11.36 million, which is higher than the sum of coastal transport and ocean transport in China (Ministry of Transport; MOT, 2022). As one of the most economically developed regions in the east of China, the YRD region is the busiest inland river ship transportation corridor in China. Therefore, we focus on inland river ships in the Jiangsu section of the Yangtze River as an important area for China to investigate the contribution of inland river ships to air pollution.
Methods of creating ship emission inventories have been developed and improved over the last decades, from the early method of calculating emissions based on ship fuel-consumption data (Streets, 1997; Corbett et al., 1999; Streets et al., 2000; Endresen, 2003; Endresen et al., 2005, 2007; Psaraftis and Kontovas, 2009; Trozzi, 2010) to the method of calculating emissions based on high-temporal-resolution ship navigation data provided by the automatic identification system (AIS). Wang et al. (2008) pointed out that regional emissions obtained from the fuel-consumption method are often underestimated. For example, in North America, Europe and other regions, the values were only 20 %–70 % of the regional emissions established from the AIS method. Because AIS data include detailed information of real-time ship speed, direction, location and many other parameters, it allows for accurate calculation of pollution emitted by ships. Jalkanen et al. (2009, 2012) first developed the Ship Traffic Emission Assessment Model (STEAM) using the AIS to study the effects of ship emissions on regional air quality. Nowadays, the AIS method has been applied to many maritime regions, such as major European seas, seas around Australia and other countries (Jalkanen et al., 2009, 2012, 2016; Kalli et al., 2013; Goldsworthy and Goldsworthy, 2015; Jonson et al., 2015; Johansson, 2017; Dragović et al., 2018). Georgoulias et al. (2020) first combined observations from the TROPOspheric Monitoring Instrument on board the Sentinel 5 Precursor satellite (TROPOMI/S5P) with AIS data to measure NO2 plumes that could be detected and attributed to individual ships. Studies based on the method of combining satellite data with AIS data have been carried out mostly over seas (Kurchaba et al., 2022; Riess et al., 2022) but seldom over rivers.
Studies have also been conducted on ship emissions in Chinese ports such as the ports of Shanghai (Yang et al., 2007), Tianjin (D. Chen et al., 2016), Qingdao (Liu et al., 2011), Hong Kong (Ng et al., 2013), Xiamen (Wang et al., 2020) and Shenzhen (Yang et al., 2015). These studies were mainly based on fuel-consumption methods. Currently, studies based on AIS methods to establish ship inventories are gradually being carried out in China because the accuracy of this approach is higher than that for the fuel-based method. These studies are focusing on shipping emissions at coastal regions and ports (Song, 2014; Fan et al., 2016; Li et al., 2016; Huang et al., 2020) because the Ministry of Transport in China started the control of ship emissions in 2016 (MOT, 2015). Domestic emission control areas (DECAs) were set up in the waters of Bohai Bay, YRD and PRD to control, for example, the sulfur content of the fuel. In addition, equipment with AIS is becoming a mandatory requirement for ships of 100 gross tonnes and above. By the end of 2018, DECAs were expanded from the major ports to 12 nmi outside the coastline. The range of the Yangtze River covered by the DECAs was also raised from the original offshore cities to stretch from Shuifu in Yunnan to Liuhekou in Jiangsu (MOT, 2018). Wang et al. (2021) presented a detailed timeline of the control policies, with the DECAs 1.0 policy starting in 2017 and DECAs 2.0 in 2019, while for river vessels, the fuel sulfur content had to be gradually reduced to 10 ppm in the last half of 2017. Wang et al. (2021) showed that the latest control policies have been effective in reducing ship emissions of SO2 and PM, especially after 2018, when the DECAs 2.0 control policy became effective. The scenario study of the DECAs policies (Li et al., 2018) showed that it will take several decades to reach a similar reduction for NOx emissions compared to SO2 and PM, and this requires significant technological changes for ships. However, Li et al. (2016) and Weng et al. (2020) concluded that studies based on AIS methods over inland river ship emissions showed a higher uncertainty than for coastal and ocean-going ships, especially for SO2 and PM10 emissions.
The total quantity of air pollutants emitted by inland river vessels in the Yangtze River is higher than those emitted by seaport vessels in the Jiangsu province (Xu et al., 2019; Zhu et al., 2019). In contrast to the studies for ships on seas and in ports, studies on inland river vessel emissions are still limited. Normally, those studies use estimations for the engine power and the maximum design speed. For example, Zhu et al. (2017) assumed that ship length is related to ship tonnage and power. However, these methods require a large amount of initial ship data, which are often difficult to obtain. Moreover, the ship emission factors for the Jiangsu section of the Yangtze River used in the various studies show significant differences. Their emission factors and the main engine fuel adjustment factors are usually based on the international literature. Their applicability in China, and in Jiangsu province, needs to be validated. In addition, current studies of inland ship emissions have yet to explore the relative contribution of ship emissions to air pollution.
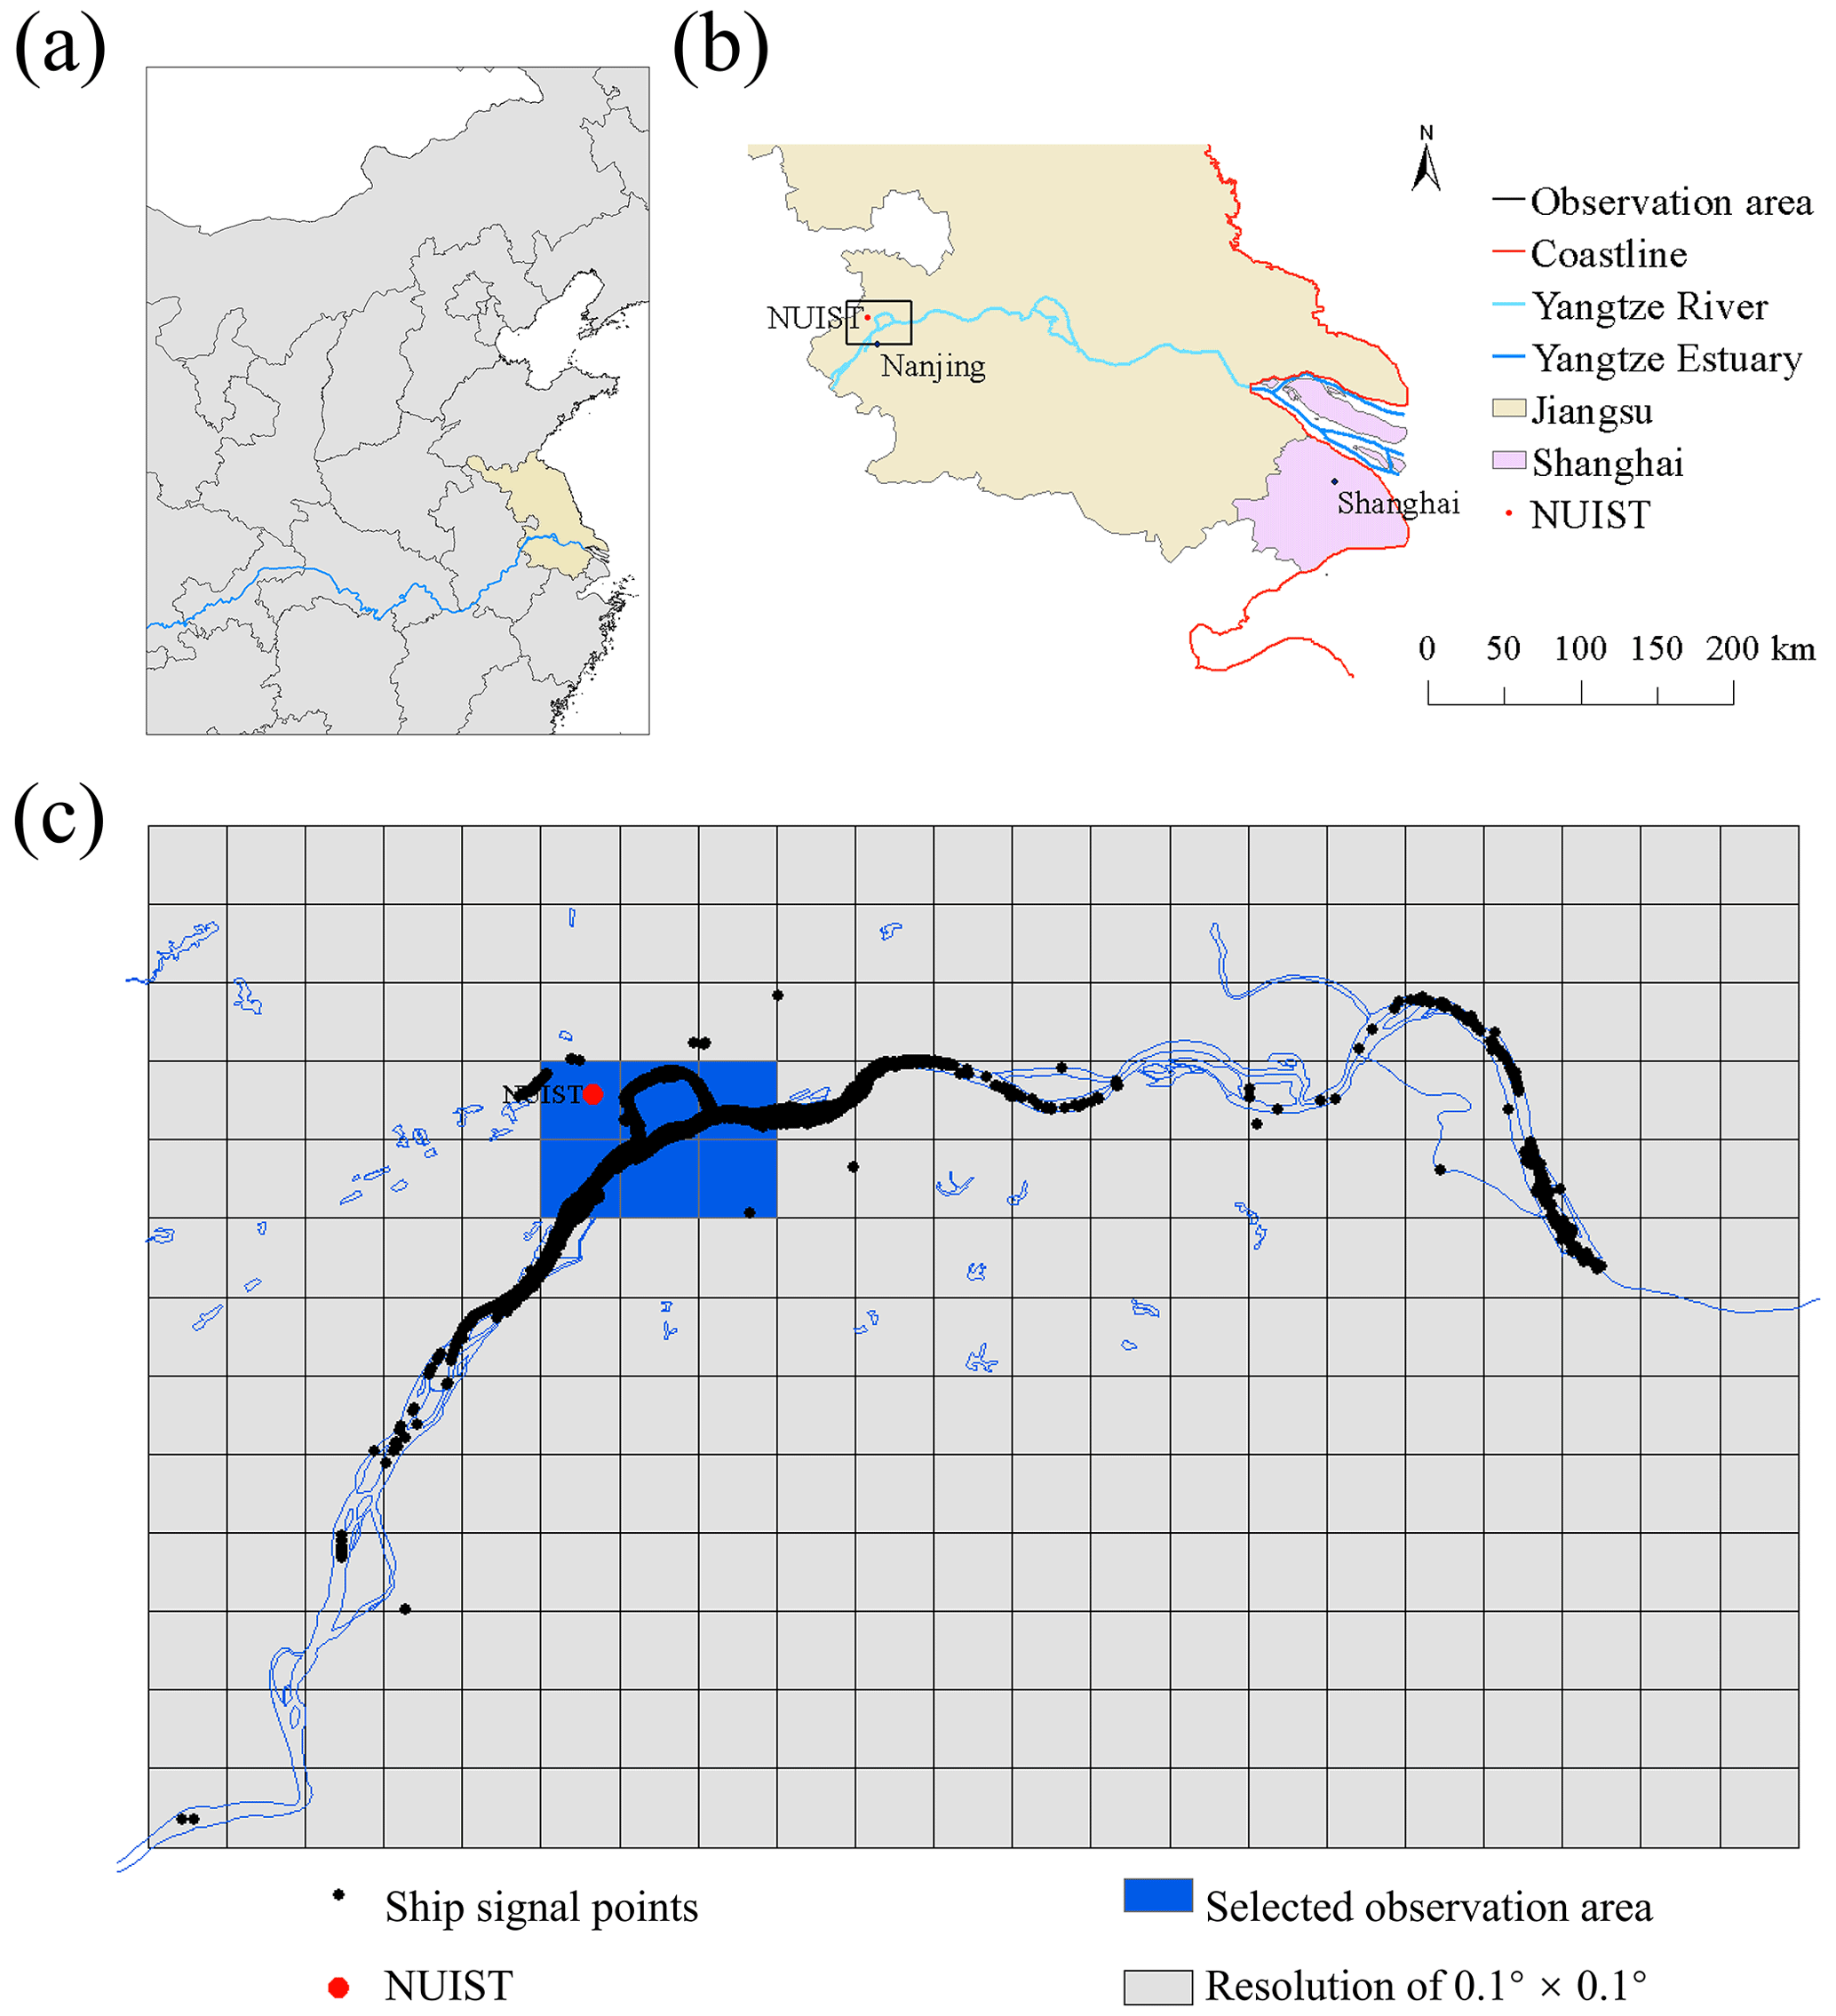
Figure 1The map of the study area. (a) Map of the Yangtze River. (b) Schematic map of the Jiangsu section of the Yangtze River. (c) Ship locations that were received by AIS in a 4 h interval shown on a grid with a resolution of 0.1∘ × 0.1∘ . The black dots are the ship locations received by AIS, which demonstrates the range of the AIS receiver. The blue box is the selected observation area with a longitude between 118.65 and 118.95∘ E and latitude between 32.05 and 32.25∘ N.
For the missing information on engine power in AIS data, our study proposes a method to reduce the difficulty in deriving emissions based on parameters directly provided by AIS. We set up an AIS receiver in Nanjing University of Information Science and Technology (NUIST) to collect ship information including ship name, ship type, position, length, speed and heading. Because of the large number of inland river ships in China and the limited range of the antenna detection, we propose a method based on the length of the river per grid cell to extend the emission estimates to larger regions.
In this study, we compile a ship emission inventory of NOx, SO2, PM10 and PM2.5 for the Jiangsu section of the Yangtze River using a bottom-up approach based on 1 year of AIS data from September 2018 to August 2019. We calculate the emission of each vessel at regular intervals (usually a few seconds) and sum up all emissions of the 588 591 ships' movement during 1 year. Emission characteristics such as ship-type dependency, monthly variation and spatial distribution will be discussed. A comparison with the Multi-resolution Emission Inventory for China (MEIC) model, Shipping Emission Inventory Model (SEIM) and the Daily Emissions Constrained by Satellite Observations (DECSO) method is performed to check the relative contribution of ship emissions to the total emissions. These results are important for the policy-makers to formulate and evaluate emission reduction policies and for ship companies in choosing the best emission reduction measures.
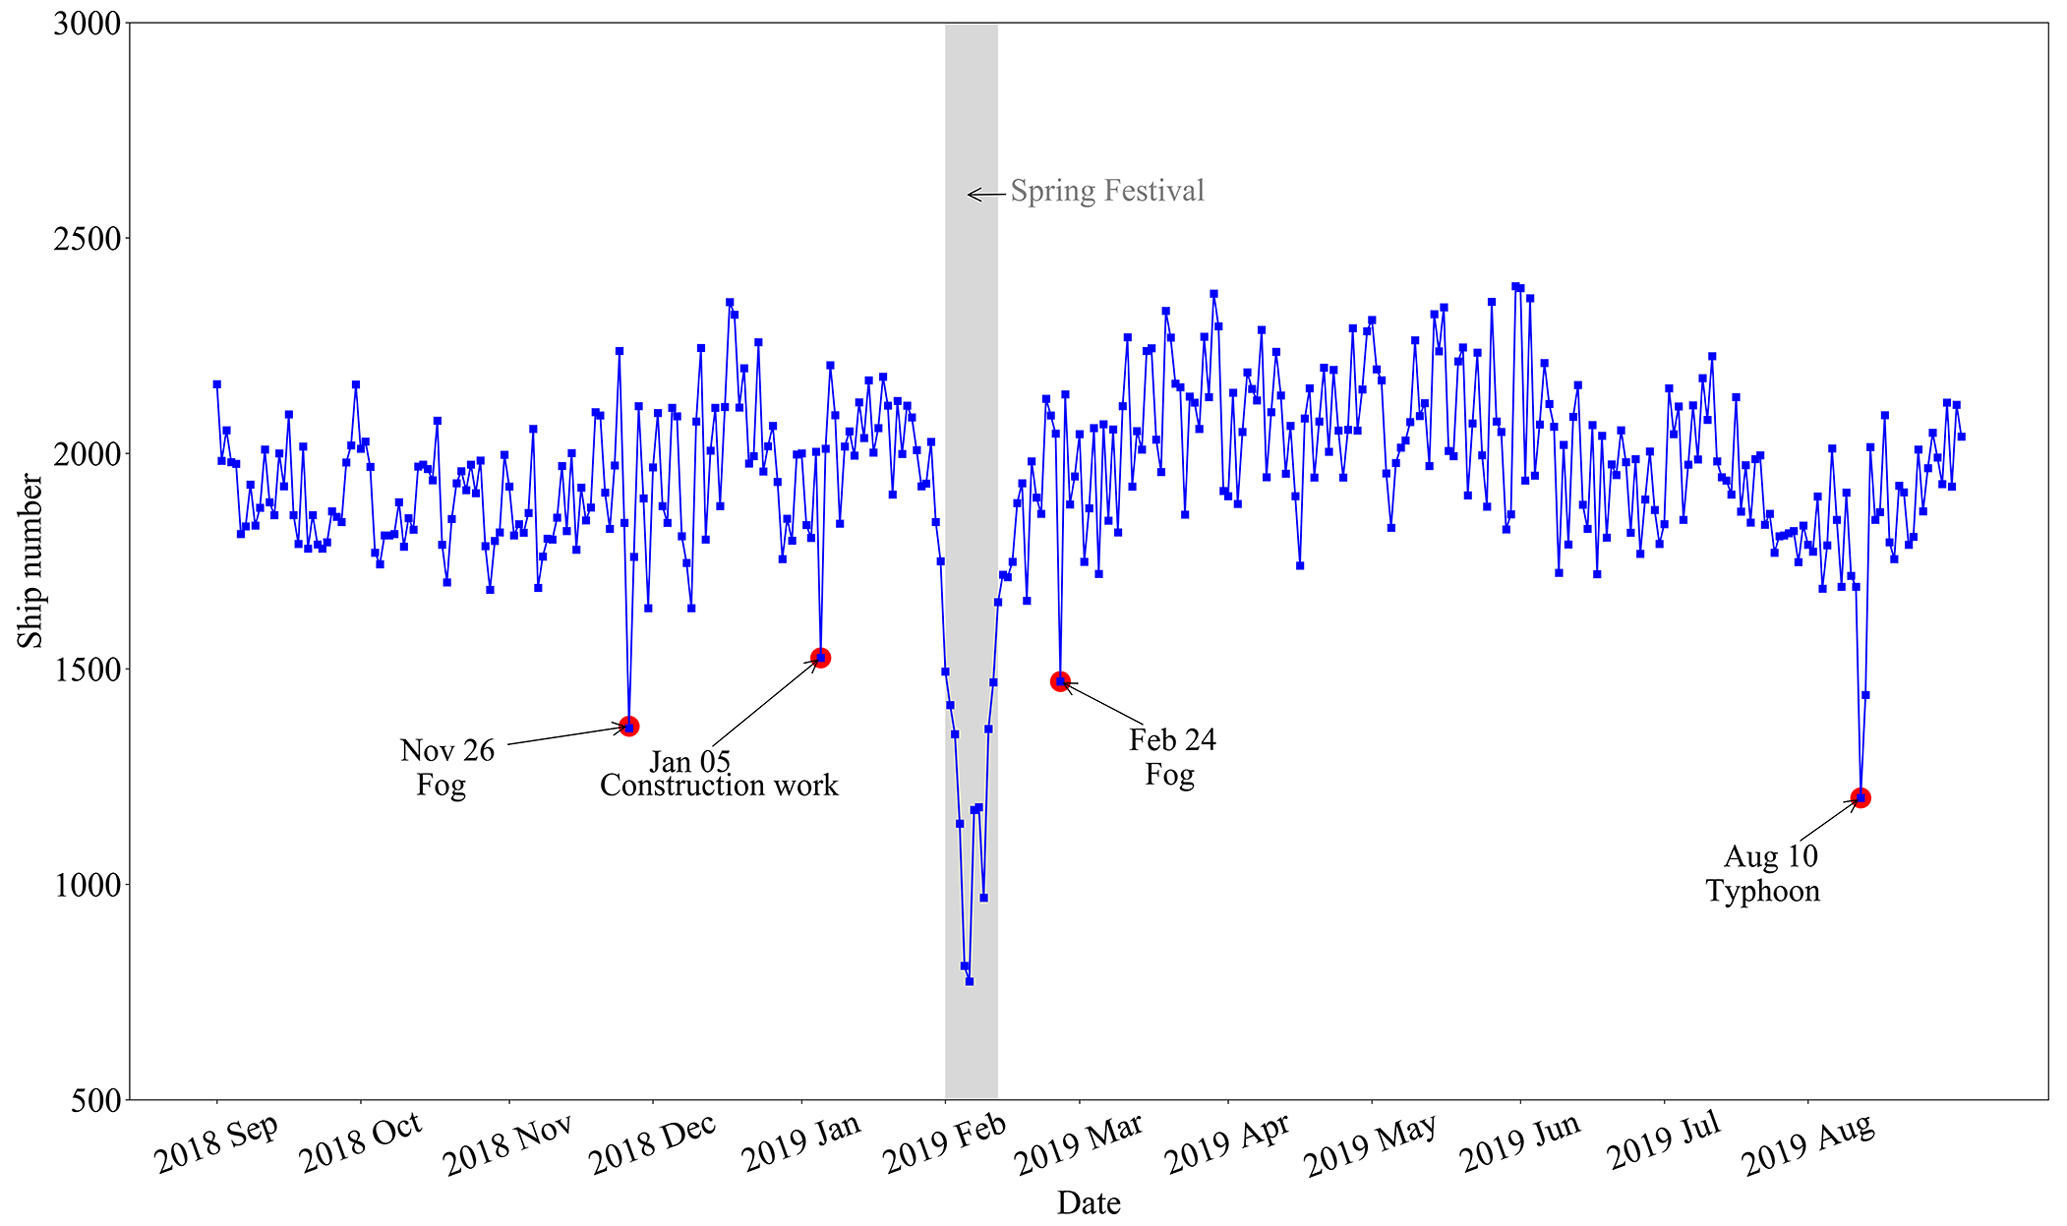
Figure 2Number of ships per day. The shaded gray area represents the Spring Festival period. The red dots indicate days with strongly reduced ship numbers.
2.1 AIS observations
The automatic identification system (AIS) is transponder technology on board ships to enhance safety by broadcasting ship information via VHF (very high-frequency) channels. It works in conjunction with the Global Positioning System (GPS) to broadcast information such as ship position, speed and heading, together with static ship information such as ship name, ship length and ship type. Each AIS-equipped vessel is identified by a unique Maritime Mobile Service Identity (MMSI) number, which is also part of the AIS data.
We have set up an observation location in Nanjing, where an AIS receiver is located on the roof of the meteorological building in NUIST. Ships transmit AIS signals at intervals varying from every 3 s to a few minutes to provide information on their position. The black dots in Fig. 1c are an example of the locations of ships according to the AIS signals received in a time interval of 4 h. We see that the antenna can receive signals within at least a 50 km radius. A region with a longitude of less than 118.95∘ E and a latitude of more than 32.05∘ N was selected as the area where all ships, including those with weak AIS transmitters, can be tracked under all conditions. AIS data were collected for 365 d from September 2018 to August 2019. Based on the AIS information, ships were classified into seven types: cargo ships, tankers, passenger ships, tugboats, dredgers, patrol vessels and others. Cargo ships include container ships, bulk carriers and ro-ro (roll-on/roll-off) vessels (excluding passenger ships); tankers comprise liquid chemical tankers, liquefied gas tankers and oil tankers; and passenger ships consist of ferries and ro-ro passenger ships. Patrol vessels are classified separately because of their small size in combination with high speed.
The AIS data show that approximately 2000 boats pass through the observation area each day, with a drop in the number of ships on specific days. Figure 2 shows the number of unique ships per day over a year. The gray box in Fig. 2 shows the Chinese New Year period when the number of vessels dropped sharply. The decrease in the number of ships on other days is usually related to the weather conditions. On 26 November 2018, very thick fog occurred, and the travel of both ships and vehicles was disrupted. On 24 February 2019, the local meteorological bureau issued a fog warning, so the number of passing vessels decreased. On 10 August 2019, typhoon Lekima made landfall and brought catastrophic damage to southeastern China. The number of ships coming from the typhoon region was greatly reduced, as was the number of local vessels in Nanjing. On 5 January 2019, the Jiangsu Maritime Bureau issued a navigational warning for construction work in the Baguazhou branch of the Yangtze River in Nanjing.
2.2 Ship emission estimation
To estimate shipping emissions from the Yangtze River, we adopt the AIS method to obtain high-resolution ship information and emission factors. Equation (1) is used for calculating the emissions of various pollutants such as NOx, SO2, PM2.5 and PM10 from a single ship based on its main power (Jalkanen et al., 2012). We only considered the emissions of the main engine of the ship while ignoring the relatively lower emissions from the auxiliary engines and boilers.
where E is the emission from the main ship engine, P is the main engine power of the ship (See Sect. 2.2.1), L is the main engine load factor (See Sect. 2.2.2), fEF is the emission factor, fLLAM is the low-load adjustment multiplier of the main engine, fF is the fuel correction factor, fC is the control factors for implementation of greener technology, and T is the sailing time.
Below we will further discuss each element of this equation.
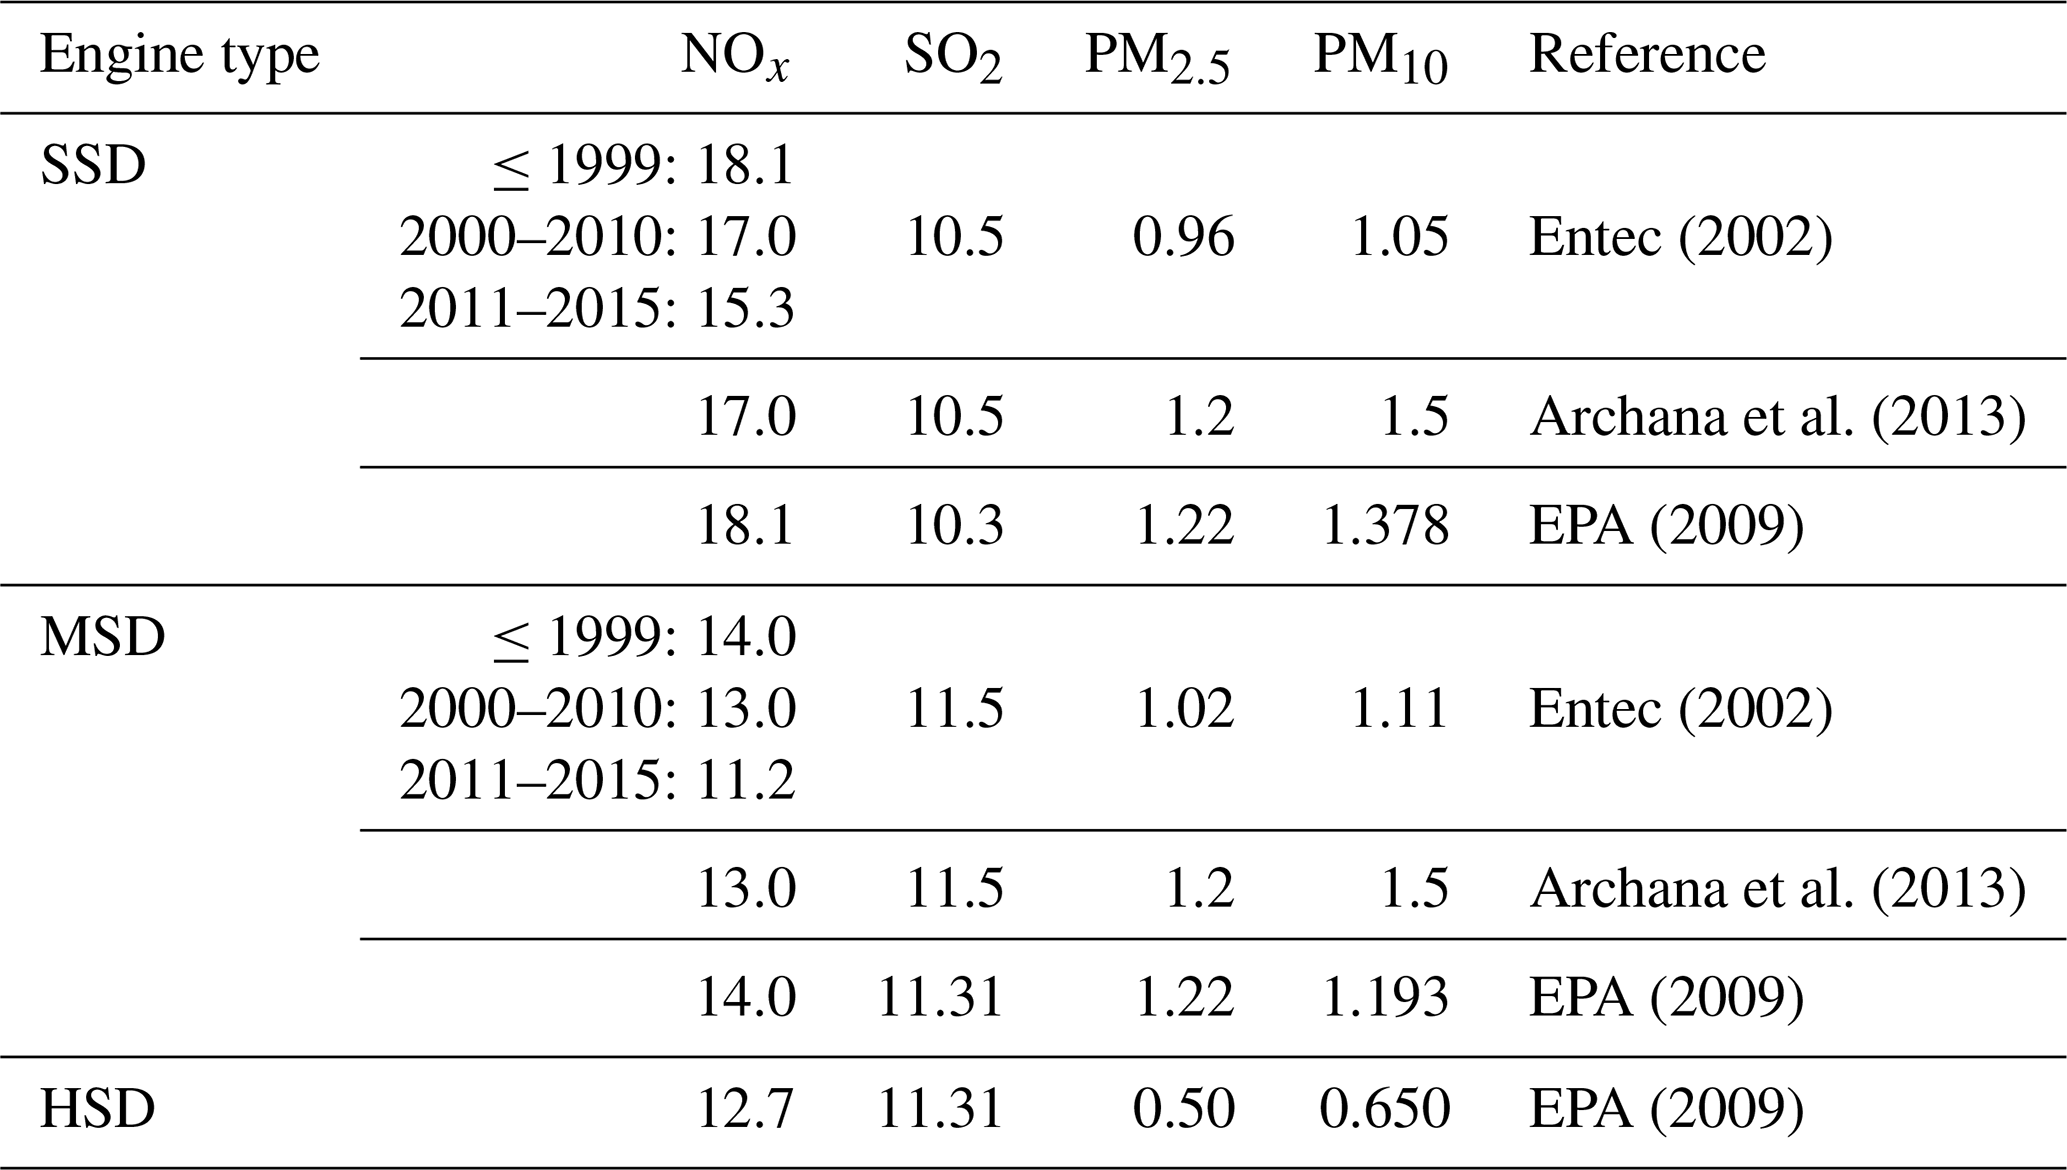
The emission factor (fEF) refers to the mass of pollutants emitted per unit of work done by a single vessel in 1 h (g kW−1 h−1). It is an essential parameter for calculating ship emissions and has not yet been studied for China. For example, the emission factors used by Wan et al. (2020) for Beijing–Tianjin–Hefei, the Yangtze River Delta and the Pearl River Delta were taken from literature referring to Europe and the United States (USEPA, 2000; Entec, 2002; EPA, 2009). Ship emission factors used by Fan et al. (2016) for the Yangtze River Delta and the East China Sea were based on an EPA report (2009) and on Goldsworthy and Goldsworthy (2015), the latter being a study for the Australian region. The emission factors used by Fu et al. (2012) for the Shanghai port were taken from the air pollutant emission inventory of the Port of Los Angeles (Archana et al., 2013). Lacking studies of ships of the Chinese fleet, our study also relies on emission factors for other regions, following the scheme in Table 1.
The low-load adjustment factor (fLLAM) is used when the main engine load factor is less than 0.2. When the load factor is below 0.2, there is an increase in emission intensity due to the inefficient engine use at low speed. Hence, the emissions from low-load vessels were multiplied by the low-load adjustment factor (EPA, 2009). The low-load adjustment multipliers for the main engine are shown in Table S1.
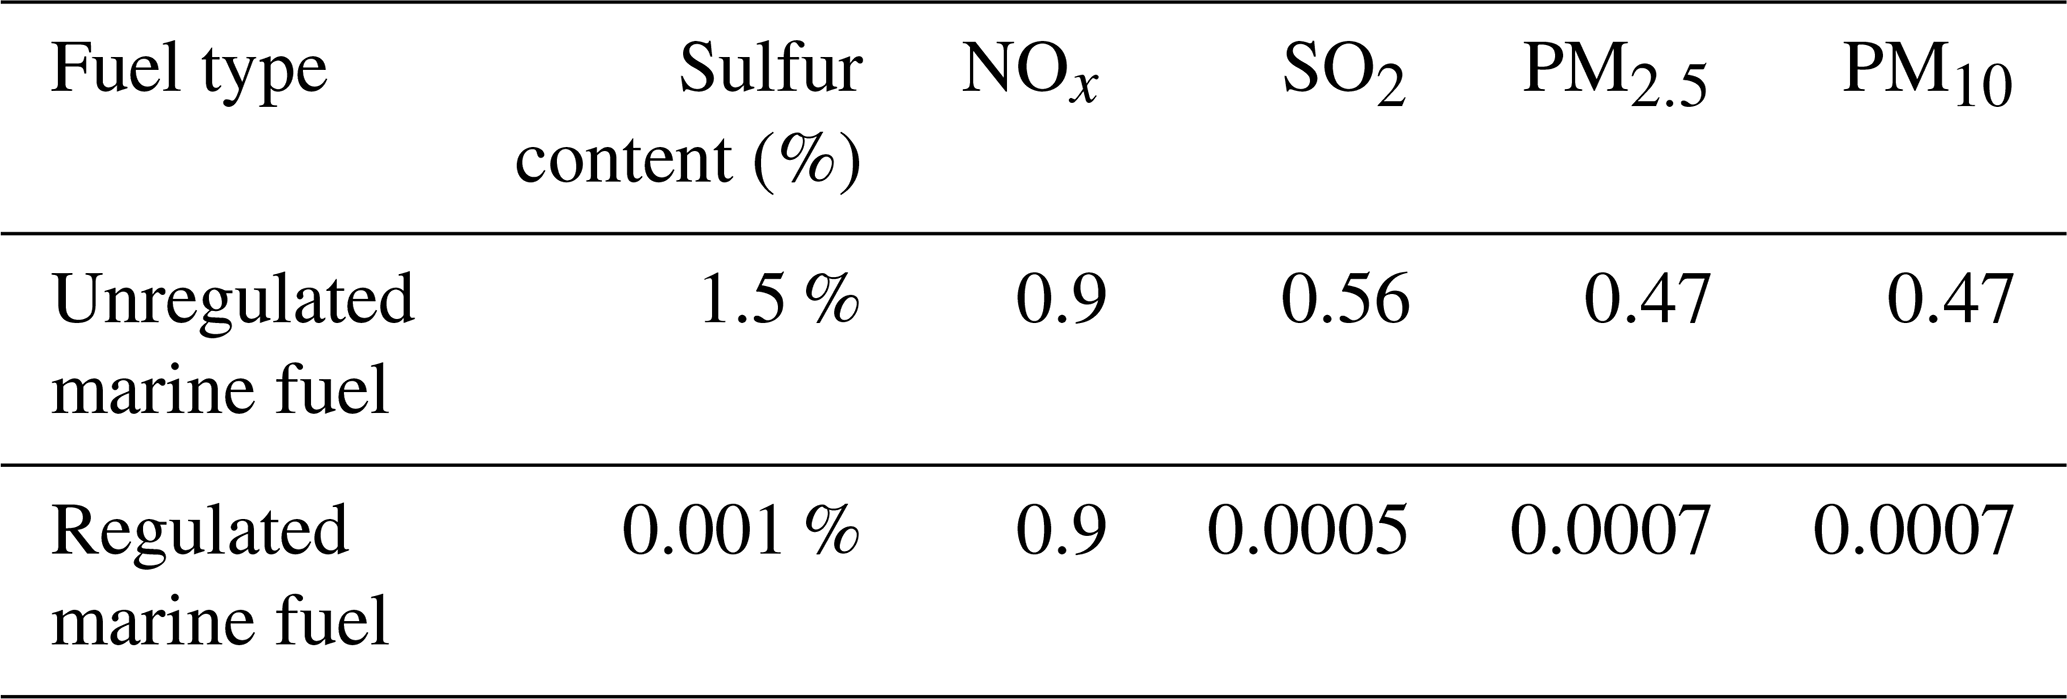
The fuel correction factor (fF) corrects the emission factors according to sulfur content of the fuel used by the ships. Ordinary inland vessels typically use general diesel oil (GDO), while larger inland ships and direct river and sea vessels use marine fuel oil (MFO). MFO includes residual oil (RO) and marine distillates (MD). The sulfur content requirements for various fuels are shown in Table S2. The emission factors mentioned above are obtained based on the assumption that marine fuel is heavy oil with a sulfur content of 2.7 % (EPA, 2009). In October 2018, the DECAs began responding to a new policy that the sulfur content of inland marine fuel cannot be higher than 0.001 % in 2019 (Wang et al. 2021). In our study, the actual inland ship emissions are calculated based on the sulfur content of 0.001 %, for which a fuel correction factor is needed. In addition, we will calculate ship emissions for an average fuel sulfur content of 1.5 % (Xu et al., 2019) for a scenario where the new policy would be absent. The fuel correction factor fF for each air pollutant is shown in Table 2.
The control factor fC is to potentially correct for higher-quality marine diesel engines or the availability of emission reduction facilities on the ships as a result of emission control policy. There is currently limited legislation to control ship emissions in inland waterway zones in China and insufficient monitoring infrastructure for enforcement; therefore the control factor is set to 1.
Table 1Emission factor (fEF) in g (kWh)−1 of the main engine reported in the literature. (SSD is slow-speed diesel, MSD is medium-speed diesel, and ≤ 1999, 2000–2010 and 2011–2015 are the years when the ship was built.)
2.2.1 Engine power
Since engine power is missing in the AIS data, we develop a method to relate the engine power to the ship type, length and speed. Those parameters are available in the AIS data, unlike the engine power.
The supplied power by ship engines (Pship) for transport should be at least equal to the dragging force (Fdrag) of the water resistance multiplied by the speed (v) of the ship. According to fluid dynamics, the resistance force is proportional to the area (As) experiencing the water resistance multiplied by the speed squared. Hence, the supplied power of a ship engine is proportional to the area times the cube of the speed: Pship∼Asv3. This is known as the propeller law (Theotokatos and Tzelepis, 2015).
For each ship type, the length–width–height dimension ratios of the boats are not expected to vary much, especially because ship design is focused on efficiency, as fuel is a dominant cost in shipping. Logically, ship designs are expected to be relatively similar. Hence, the ship area As (width times height) is to the first order expected to be proportional to the square of the ship length (). Therefore, we assume the relation of engine power of a ship with its length and its speed to be . The China Classification Society (CCS; https://www.ccs.org.cn/ccswz/, last access: 14 May 2023) database of Chinese domestic ships provides data such as ship type, main engine power, maximum ship designed speed, ship length and construction year of the ship. Using these ship parameters, we can derive the average regression relationship for each category of ship by linear fitting of this proxy (). The fitted linear relation between and the engine power P of the main engine is shown in Table 3 for each ship category. Figure S1 shows the fitted linear relationship between main engine power at full speed and the proxy at maximum speed vmax.
Table 3Regression analysis between main engine power and the square of the vessel's length multiplied by the cube of the real-time speed. (The slope refers to the ratio between power (Pmax) and .) When the tug's length is more than 40 m, the power of the main engine is assumed to be constant (1800 kW).

2.2.2 Load factors
The load factor L reflects the actual output power of the main engine as a percentage of the rated main engine power. The ship's main engine works according to the characteristics of a propeller, and the engine load factor is estimated using the propeller law, which means that the main engine load varies as the third power of the ratio of the ship's actual speed to the ship's designed speed. So the load factor is calculated as
where v is the actual sailing speed of the ship and vmax is the maximum speed of the ship using its full power.
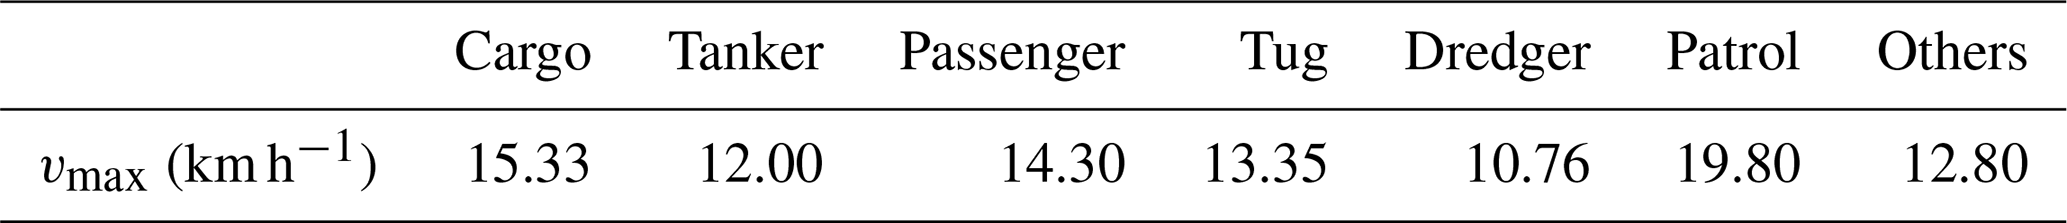
For inland waterway ships, the maximum designed speed is often unknown and cannot be obtained directly from AIS data. To obtain a maximum sailing speed per ship type we used the median of all maximum speeds (per selected ship type) registered in the CCS ship database (see Table 4).
Table 4Maximum speed per ship category. (The maximum speed value is based on the statistics of the maximum speed of about 1900 different river vessels.)
2.2.3 Correction of ship velocity for river flow
From the previous equations for calculating ship emissions, we see that the ship's real-time speed is critical. The speed related to the delivered power by the ship is the speed relative to the water, rather than the ship speed over ground, which is given in the AIS signal. Therefore, a correction for the vessel speed is required.
Assuming that the ships use similar engine power going upriver or downriver, the average speed difference between ships going downstream and upstream has been used to derive the speed of the water flow. Then the actual speed of a ship is obtained by correcting the speed with the actual river flow. When the obtained speed for an individual ship is negative, this ship is assumed to be at anchor, and the sailing speed of the ship is set to 0. Figure 3 shows the derived daily average speed of the river flow during a year. It is clear from Fig. 3 that the water speed is higher in summer than in winter, because of the difference in rain and melting water over the year. This is confirmed by a hydrological study of J. Chen et al. (2016) concluding that monthly precipitation and discharge in the Yangtze River basin are highest in July and August, with January, February and December being the lowest months. The quick change in river flow on 10 August 2019 happened during the landfall of typhoon Leikma. The actual ship speed after correction for water speed tends to be rather constant throughout the year. The actual engine power is calculated using the corrected speed as discussed above.
It is worth noting that there are some limitations of our method. For example, some ships would reduce their speed when going downstream, or some increase their speed when going upstream to compensate for the actual speed. In this case, our method may slightly underestimate the river's speed, especially in July and August.
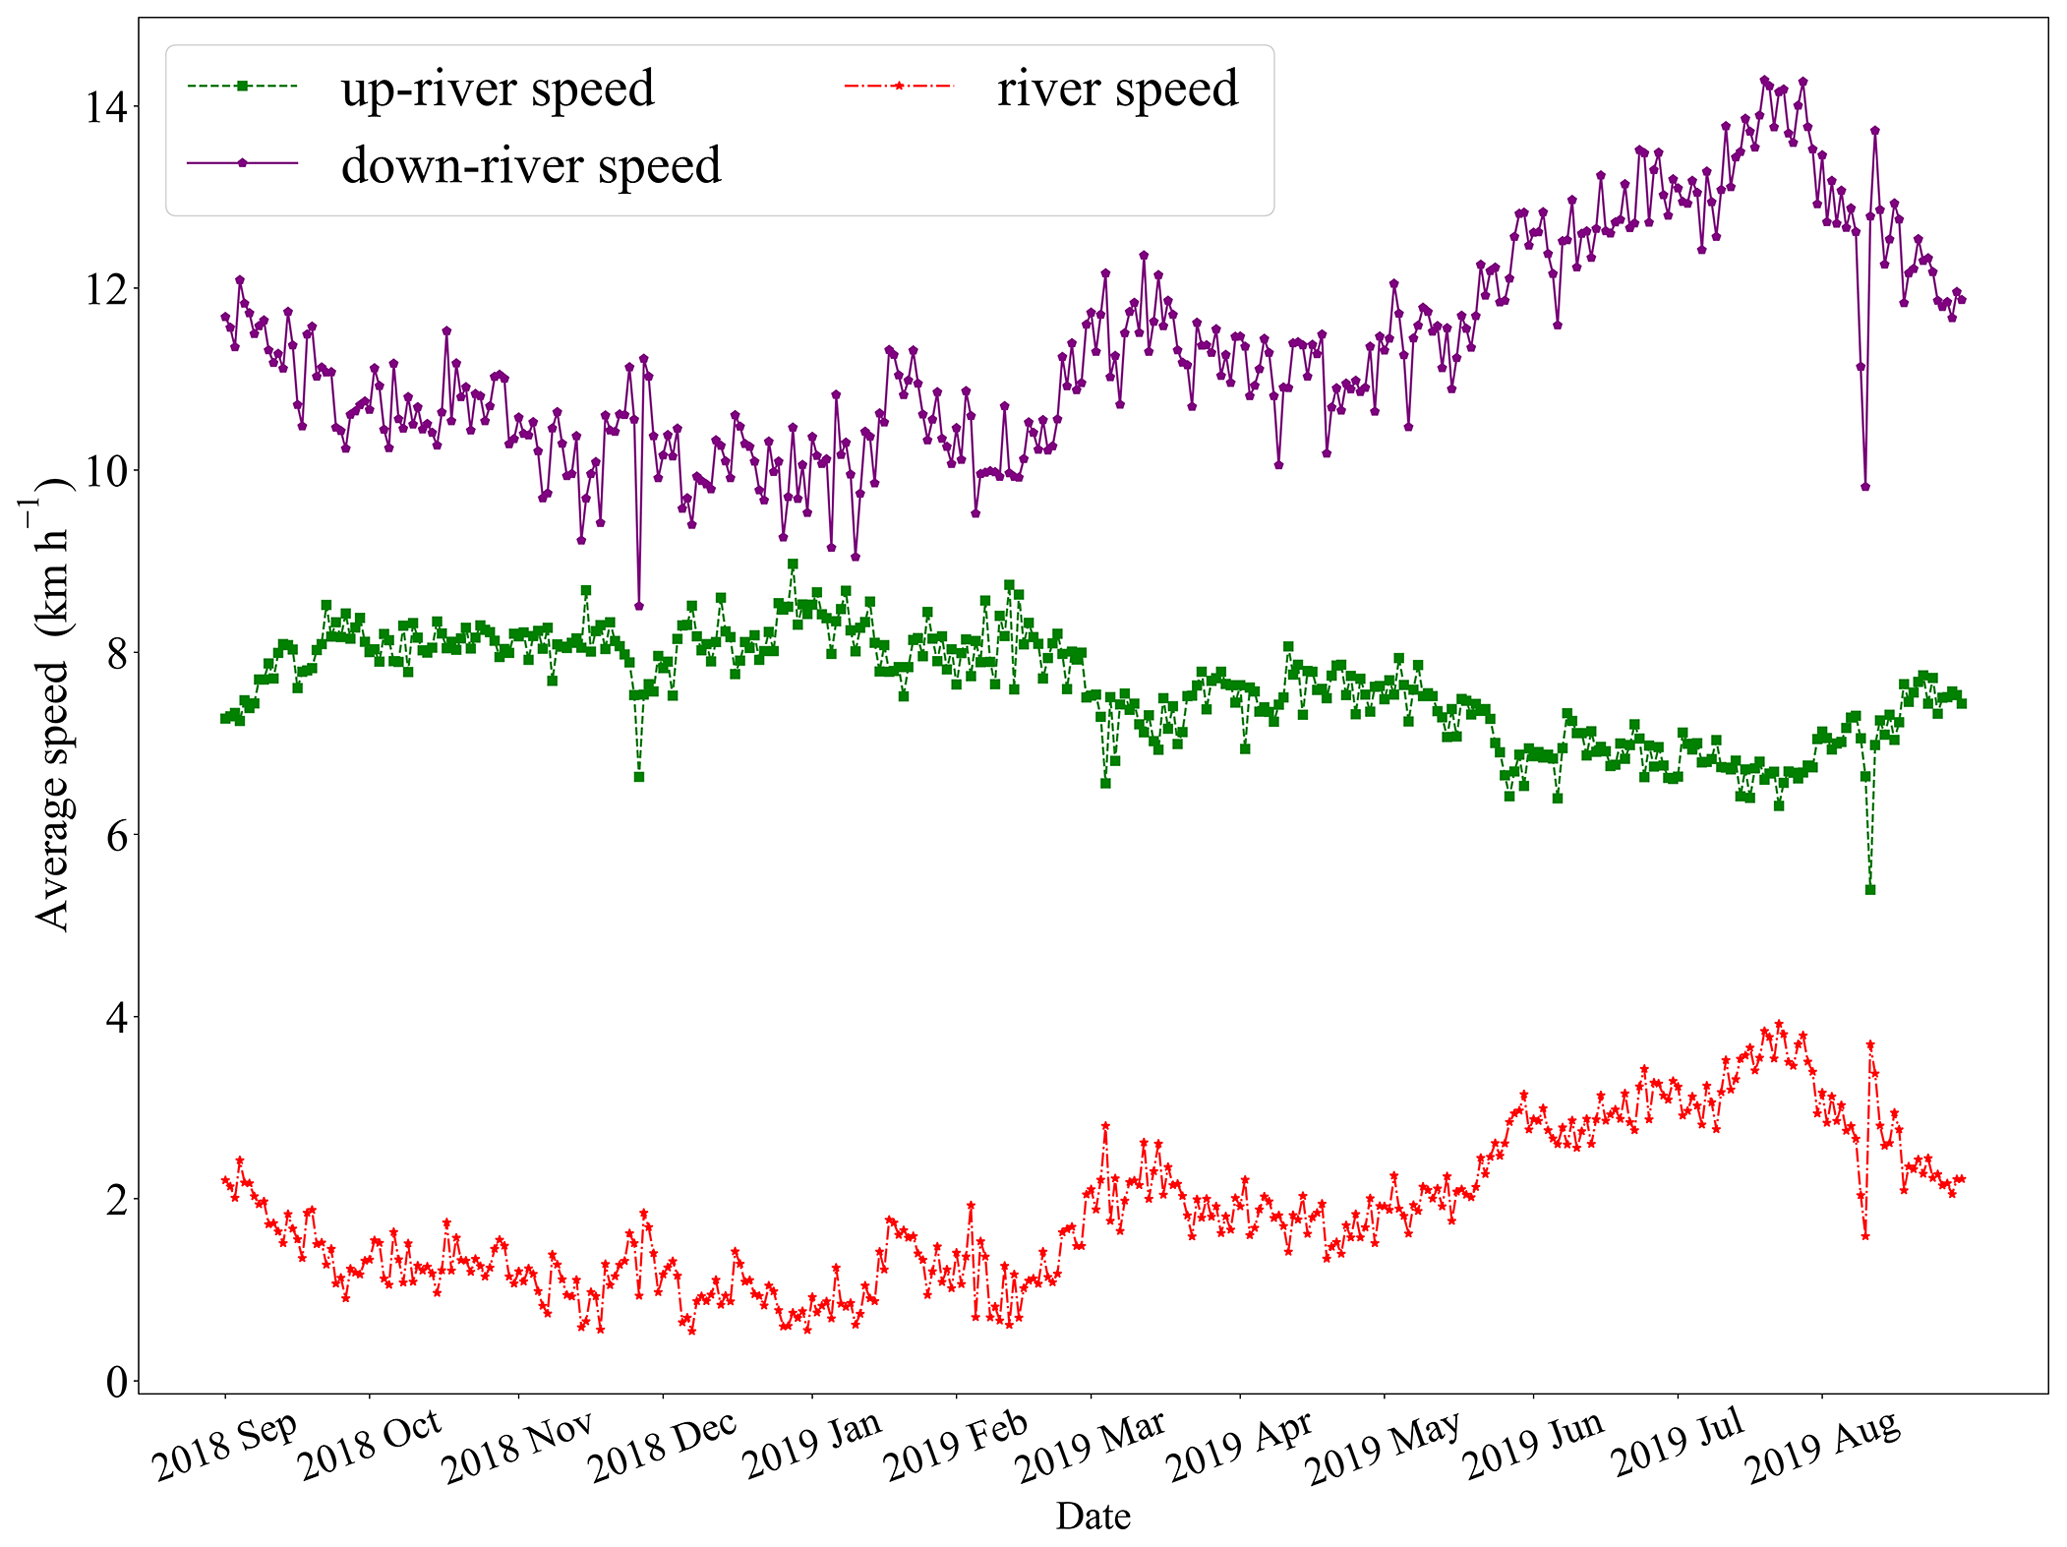
Figure 3Average daily river speed (red line) and ship speed over a year. Upriver speed and downriver speed of the ships come directly from AIS data. The river speed is based on the average difference between downstream speed and upstream speed.
2.3 Emission inventories for the Yangtze River Delta
To evaluate the emissions derived using our method, we compared them to three other emission inventories in the YRD, including the satellite-derived NOx inventory DECSO (Daily Emission derived Constrained by Satellite Observations) and the following bottom-up inventories for East Asia: MEIC (Multi-resolution Emission Inventory for China) and SEIM (Shipping Emission Inventory Model).
2.3.1 MEIC
The Multi-resolution Emission Inventory for China (MEIC; http://meicmodel.org/, last access: 14 May 2023), developed by Tsinghua University, is an emission inventory of air pollutants from anthropogenic sources in China with a spatial resolution of 0.25∘. Emissions of NOx, SO2, PM10, PM2.5, CO2, OC and BC are calculated for four sectors from 2008 to 2017: energy, industry, transport and residential. For road motor vehicle emission sources, MEIC uses an emission characterization model that includes parameters such as temperature and humidity, and it combines meteorological fields with motor vehicle emission factor models to construct a high-resolution dynamic motor vehicle emission inventory. However, the transport sector of MEIC does not include ship emissions (Zheng et al., 2014). Li et al. (2017) and Zheng et al. (2018) presented more details of the latest version MEIC v1.3. Here, the MEIC v1.3 for 2017 is used.
2.3.2 SEIM
The Shipping Emission Inventory Model (SEIM) developed by Tsinghua University has been used to construct the East Asia ship emission inventory. The model has been developed based on high-precision AIS information of ocean-going ships and encompassing worldwide international fleet activity. It provides gridded annual ship emission data with a 0.1∘ spatial resolution for the seas in the East Asia region in 2017, covering SO2, NOx, CO, VOC, PM2.5, OC and BC, a total of seven species (Liu et al., 2016, 2019). However, emissions over inland rivers, except for the delta region, are not included. Emissions from ocean-going vessels, coastal vessels and river vessels were calculated in the latest version of SEIM (SEIM v2.0) (Wang et al., 2021). Here, we use SEIM v1.0, since only this version is publicly available.
2.3.3 DECSO
Daily Emission estimates Constrained by Satellite Observations (DECSO) is an inverse modeling method to update daily emissions of NOx based on an extended Kalman filter (Mijling and van der A, 2012). NOx emissions are constrained by combining simulated NO2 column concentrations of a regional chemical transport model (CTM) with satellite observations. The latest version is referred to as DECSO v6.1 and has a spatial resolution of 0.1∘ using NO2 observations from TROPOMI (TROPOspheric Monitoring Instrument). In addition, the algorithm captures the seasonality of NOx emissions and reveals the trajectory of ships near the Chinese coast (Ding et al., 2018). DECSO provides monthly emissions with a maximum error of approximately 20 % for each grid cell. We selected NOx emissions in the Yangtze River Delta region for 2019, the earliest year that is available from DECSO for this region.
We calculated the emissions of NOx, SO2, PM10 and PM2.5 for the area considered (118.65–118.95∘ E and 32.05–32.25∘ N; the purple box in Fig. 1) from September 2018 to August 2019 based on AIS data. The total ship emissions of NOx, SO2, PM10 and PM2.5 in this area are 6679 and 2.98, 0.43 and 0.39 t yr−1, respectively.
3.1 Yearly emissions per ship category
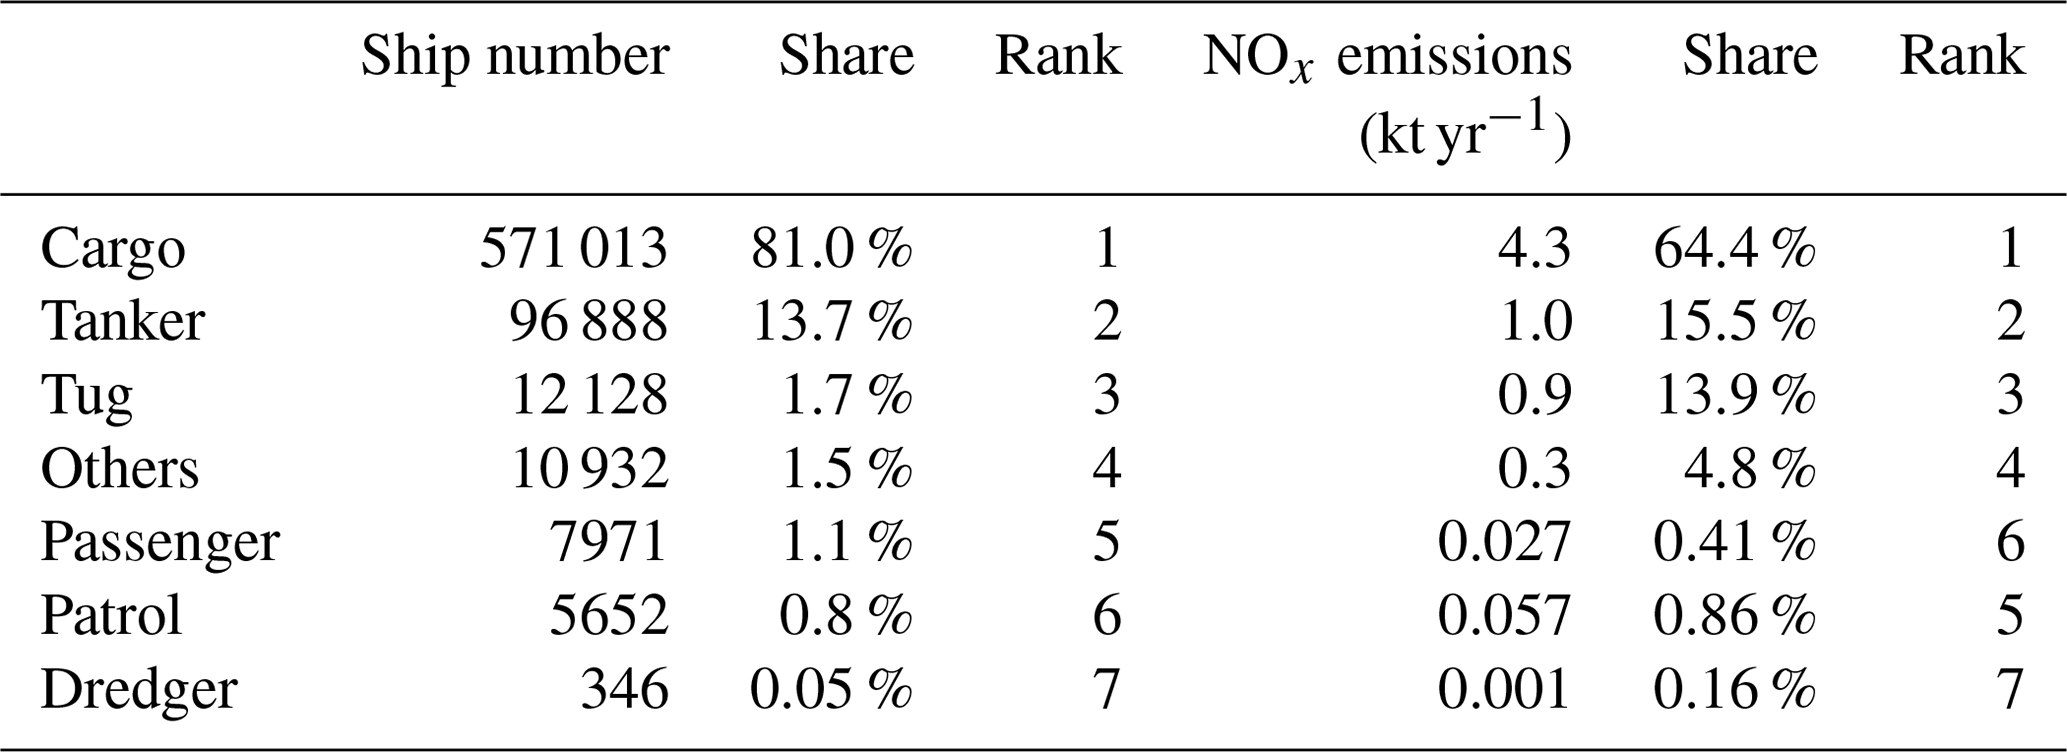
We analyzed the collected AIS data from September 2018 to August 2019 and concluded that the number of ships for each defined type was stable throughout the time period. Detailed data on the number of vessels per month are listed in Table S3. Figure 4 shows the contribution of NOx, SO2, PM10 and PM2.5 from different ship types. Emissions from cargo ships are higher than for other types of ships, followed by tankers and tugs, with dredgers and patrol boats making the lowest contribution to the emissions. Cargo ships contribute more than 58 % of the ship emissions of all species in the Nanjing section of the Yangtze River. This is because cargo ships are the dominant vessel type in this region and their number accounts for about 81 % of the total.
Dividing the total emissions from each ship type by the number of ships of that type, we obtained and analyzed average ship emissions per ship type. For a single vessel, tugs emit more pollutants (Fig. S2). This is related to the higher power needed for the engine of a tugboat, which was also concluded by Xu and Bai (2017). Compared with cargo ships, tankers have a relatively higher contribution to SO2. The sulfur content of tanker fuel is slightly higher than the sulfur content of diesel fuel for cargo ships (Zhu et al., 2019). Because SO2 emissions are directly related to the sulfur content of fuel oil, tankers will emit more SO2.
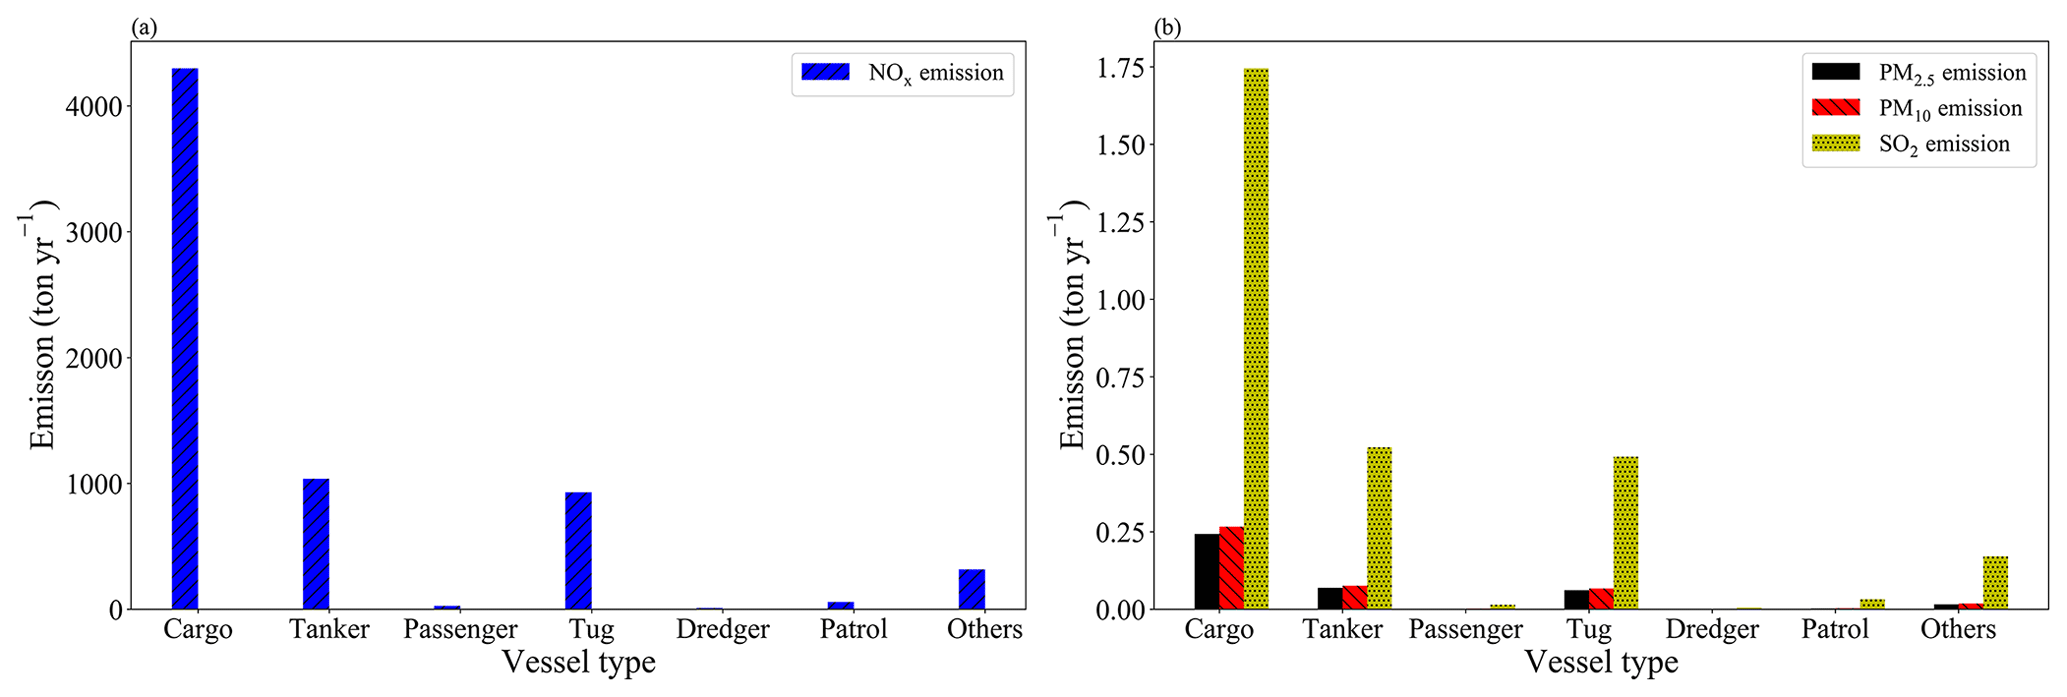
Table 5Number of ships and NOx emissions for the various ship categories.
3.2 Monthly variation of ship emissions in the observational area
We calculated the monthly emissions from the AIS data in the observational area, as is shown in Table 6. Since the same calculation method is adopted for all four pollutants, their spatial and temporal variations are consistent. Figure 5 shows the monthly variations of NOx emissions from ships from September 2018 to August 2019. We see that, except for the sharp decrease in the number of ships in February, the number in other months has basically stabilized at around 60 000. The monthly emissions are highly related to the number of ships and the speed of ships.
Ship emissions peaked in July followed by June and August. In July, the emissions are the highest due to the high river speed, and therefore more engine power (proportional to v3) is needed for upstream ships. From November to February, the emissions were lower, possibly because the water flow of the Yangtze River is lower at this period and ship activities during Spring Festival are reduced. In February, the number of ships dropped sharply, but the emissions from ships in February were similar to that from ships in January. This is due to the higher activity of tugs in February, which have larger engines and emit higher levels of emissions (Fig. S3). From February to March, we see that pollutant emissions increased due to the increase in the number of ships. This is closely related to the resumption of factory work and human activities after the holiday.
Table 6Ship emissions (t yr−1) in our study region around Nanjing from September 2018 to August 2019.
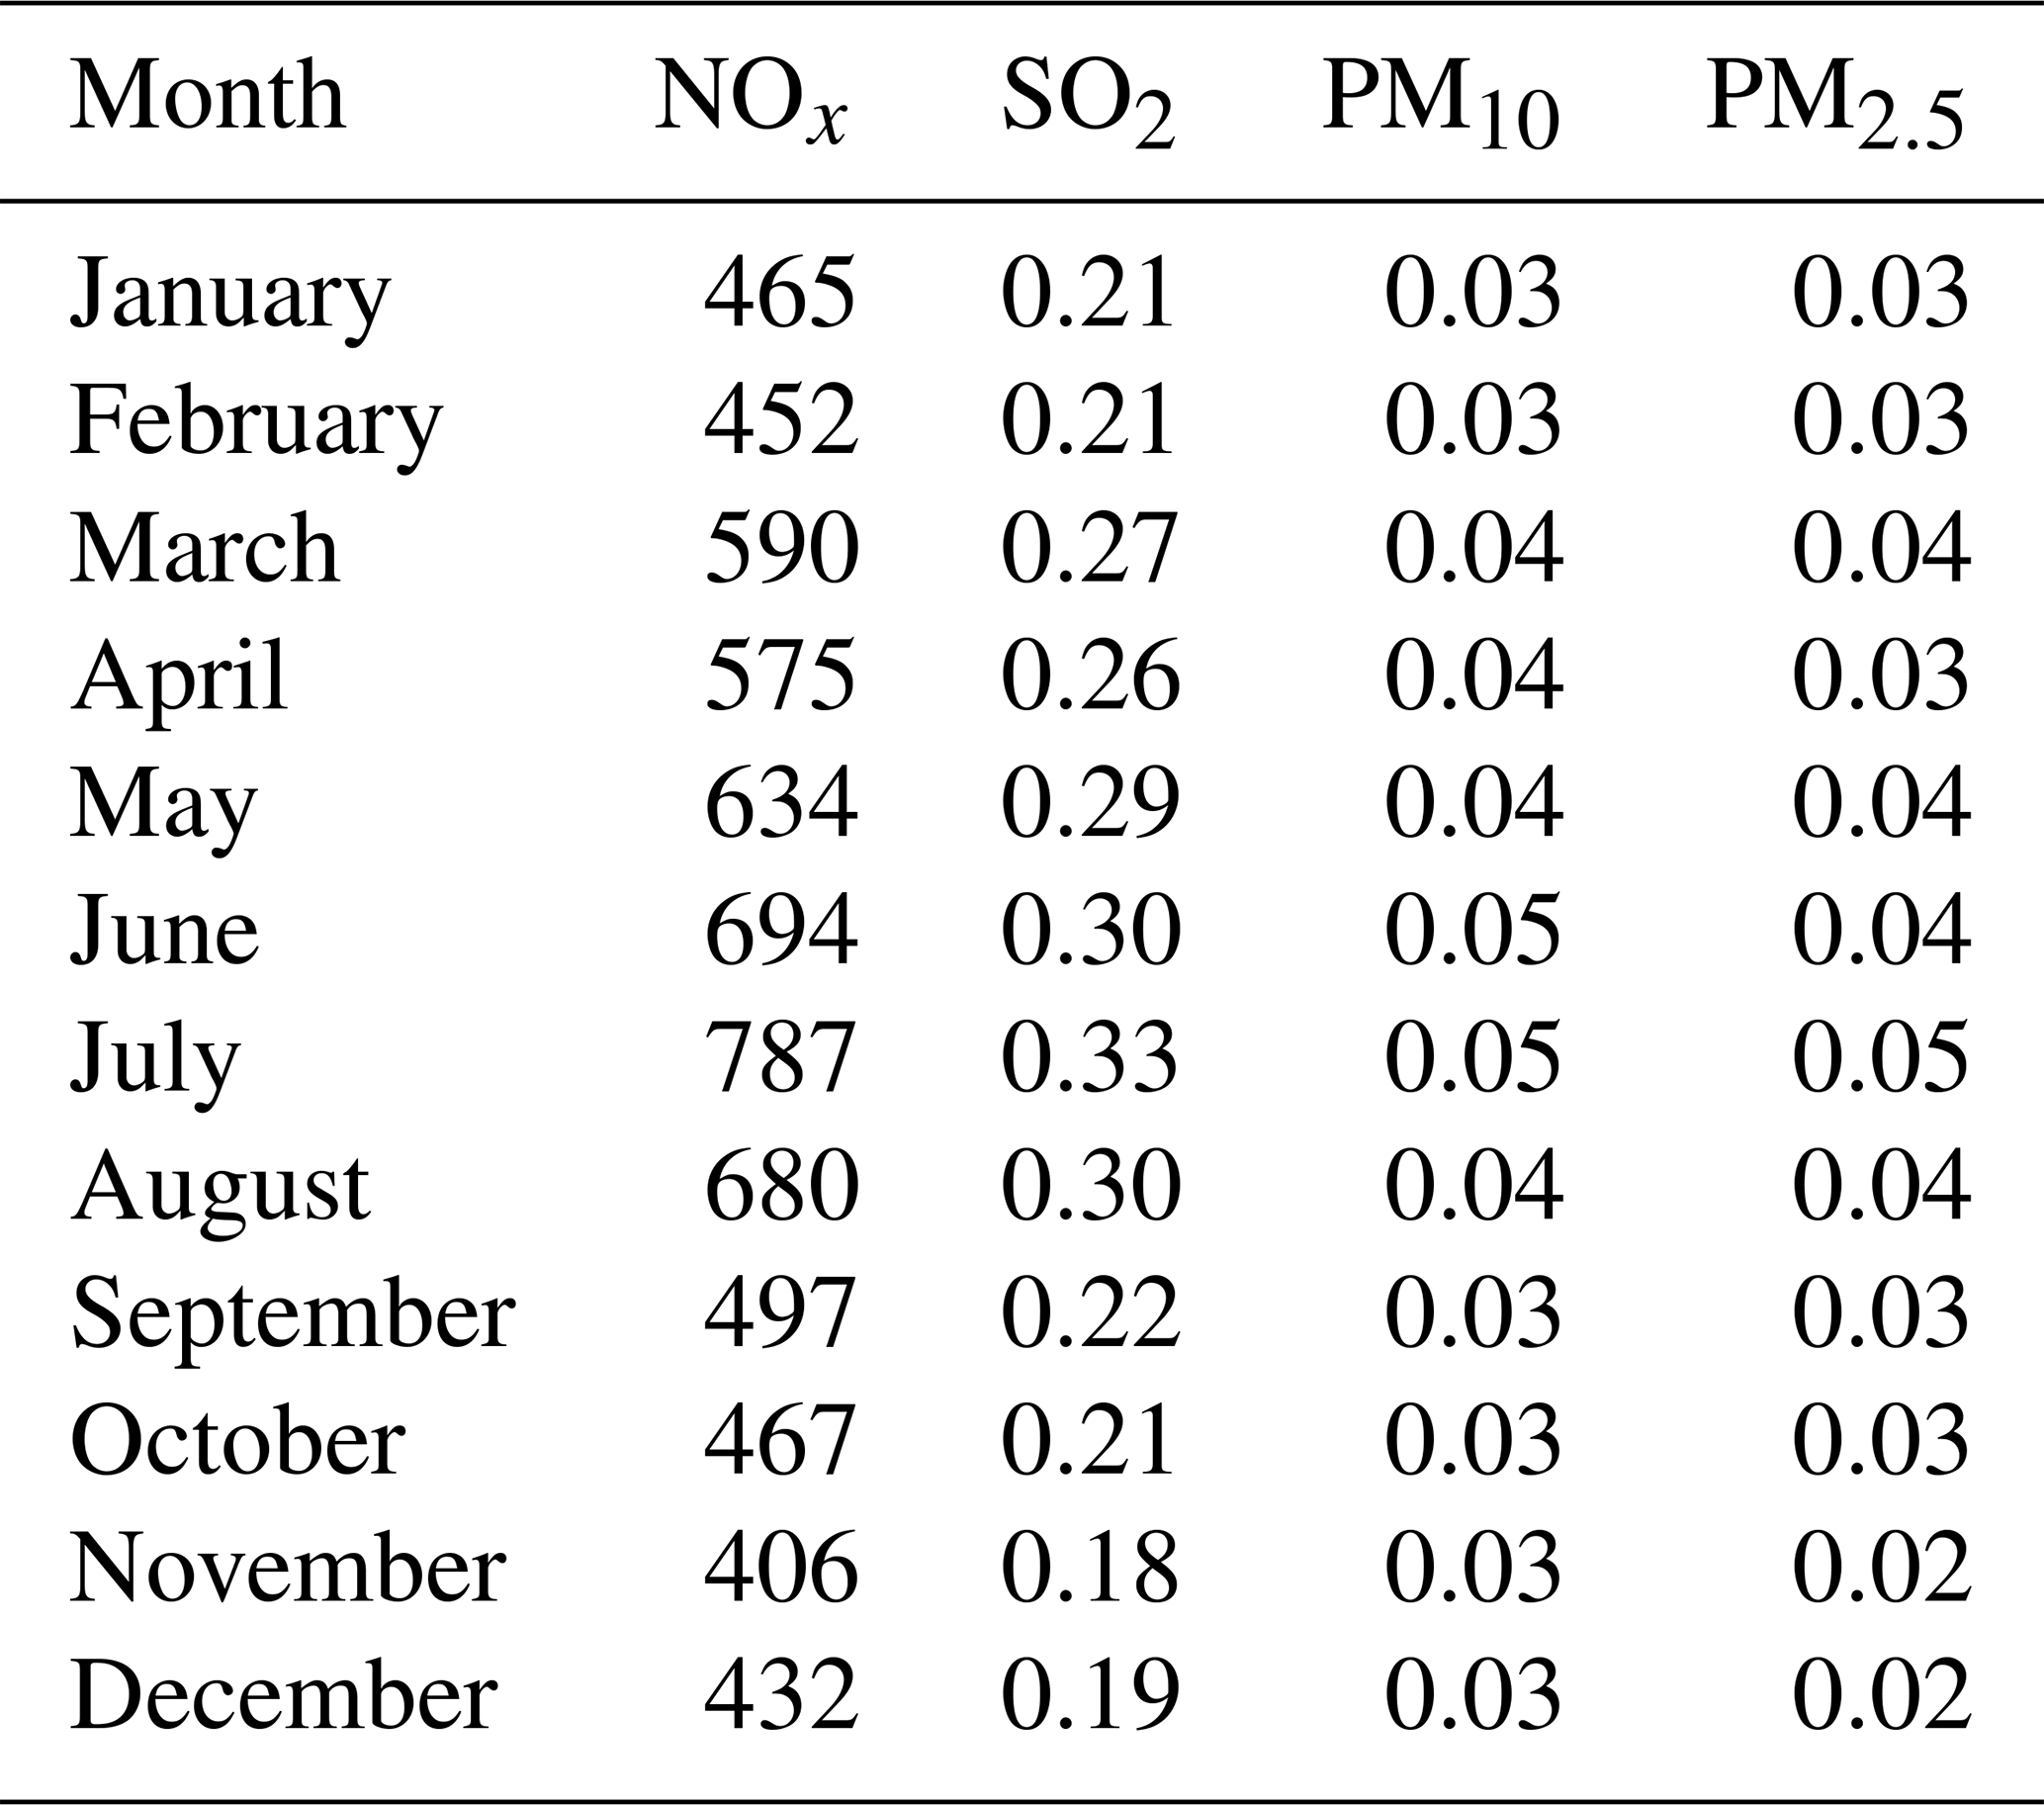
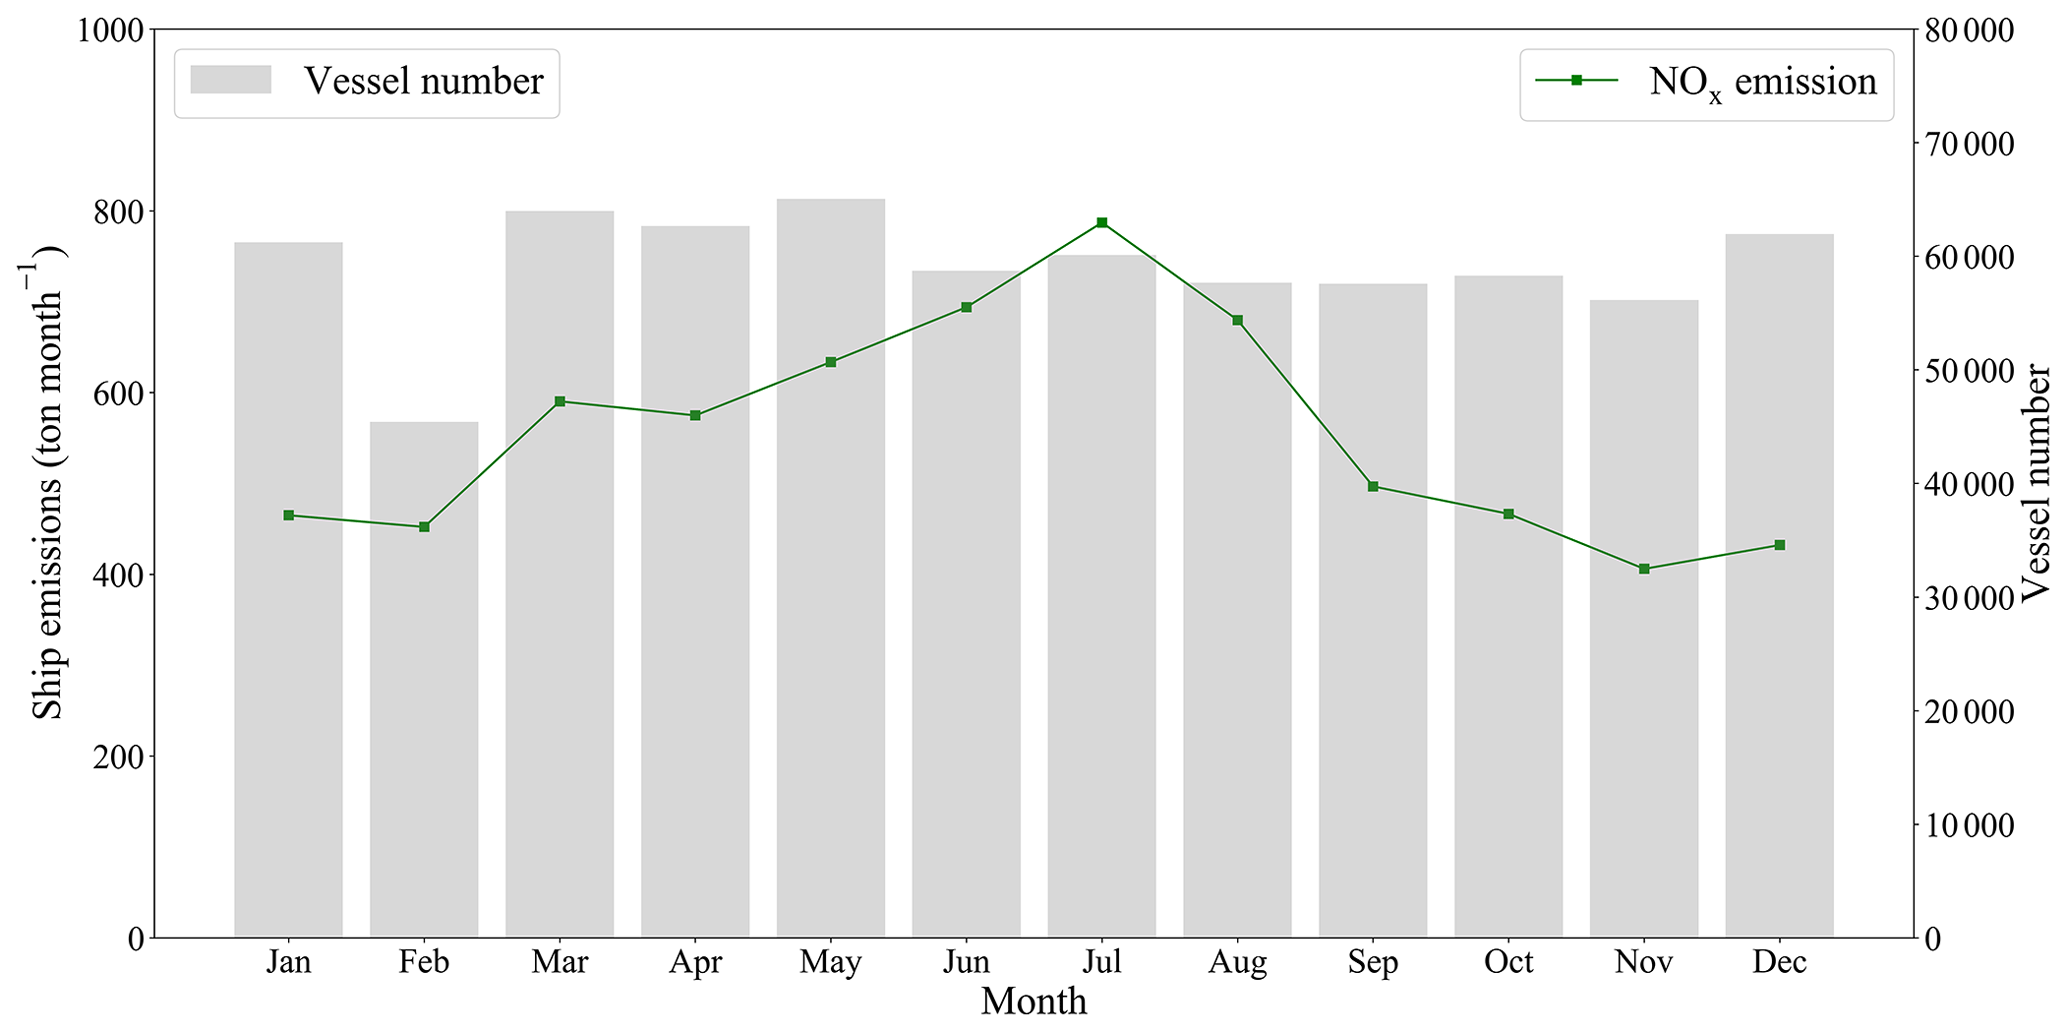
Figure 5Monthly changes in the emissions from inland river ships. The gray bars show the number of ships per month.
3.3 Spatial distribution of NOx emissions
3.3.1 Spatial distribution of NOx emissions in the observational area
The spatial distributions of emissions from different air pollutants are the same as they are based on the shape of the river. Here we choose NOx as an example to present our results. Figure 6 shows the calculated ship emissions with a spatial resolution of 0.01∘ in the observational area, not only over the main channel but also over some very small branches of the Yangtze River, such as the Chu River and Ma Cha River. The observational area also includes a slightly wider branch of the Yangtze River, known as the Jia Jiang River. On these branches, ship emissions are much lower than from ships on the main Yangtze River. The Yangtze River is around 2–3 km wide.
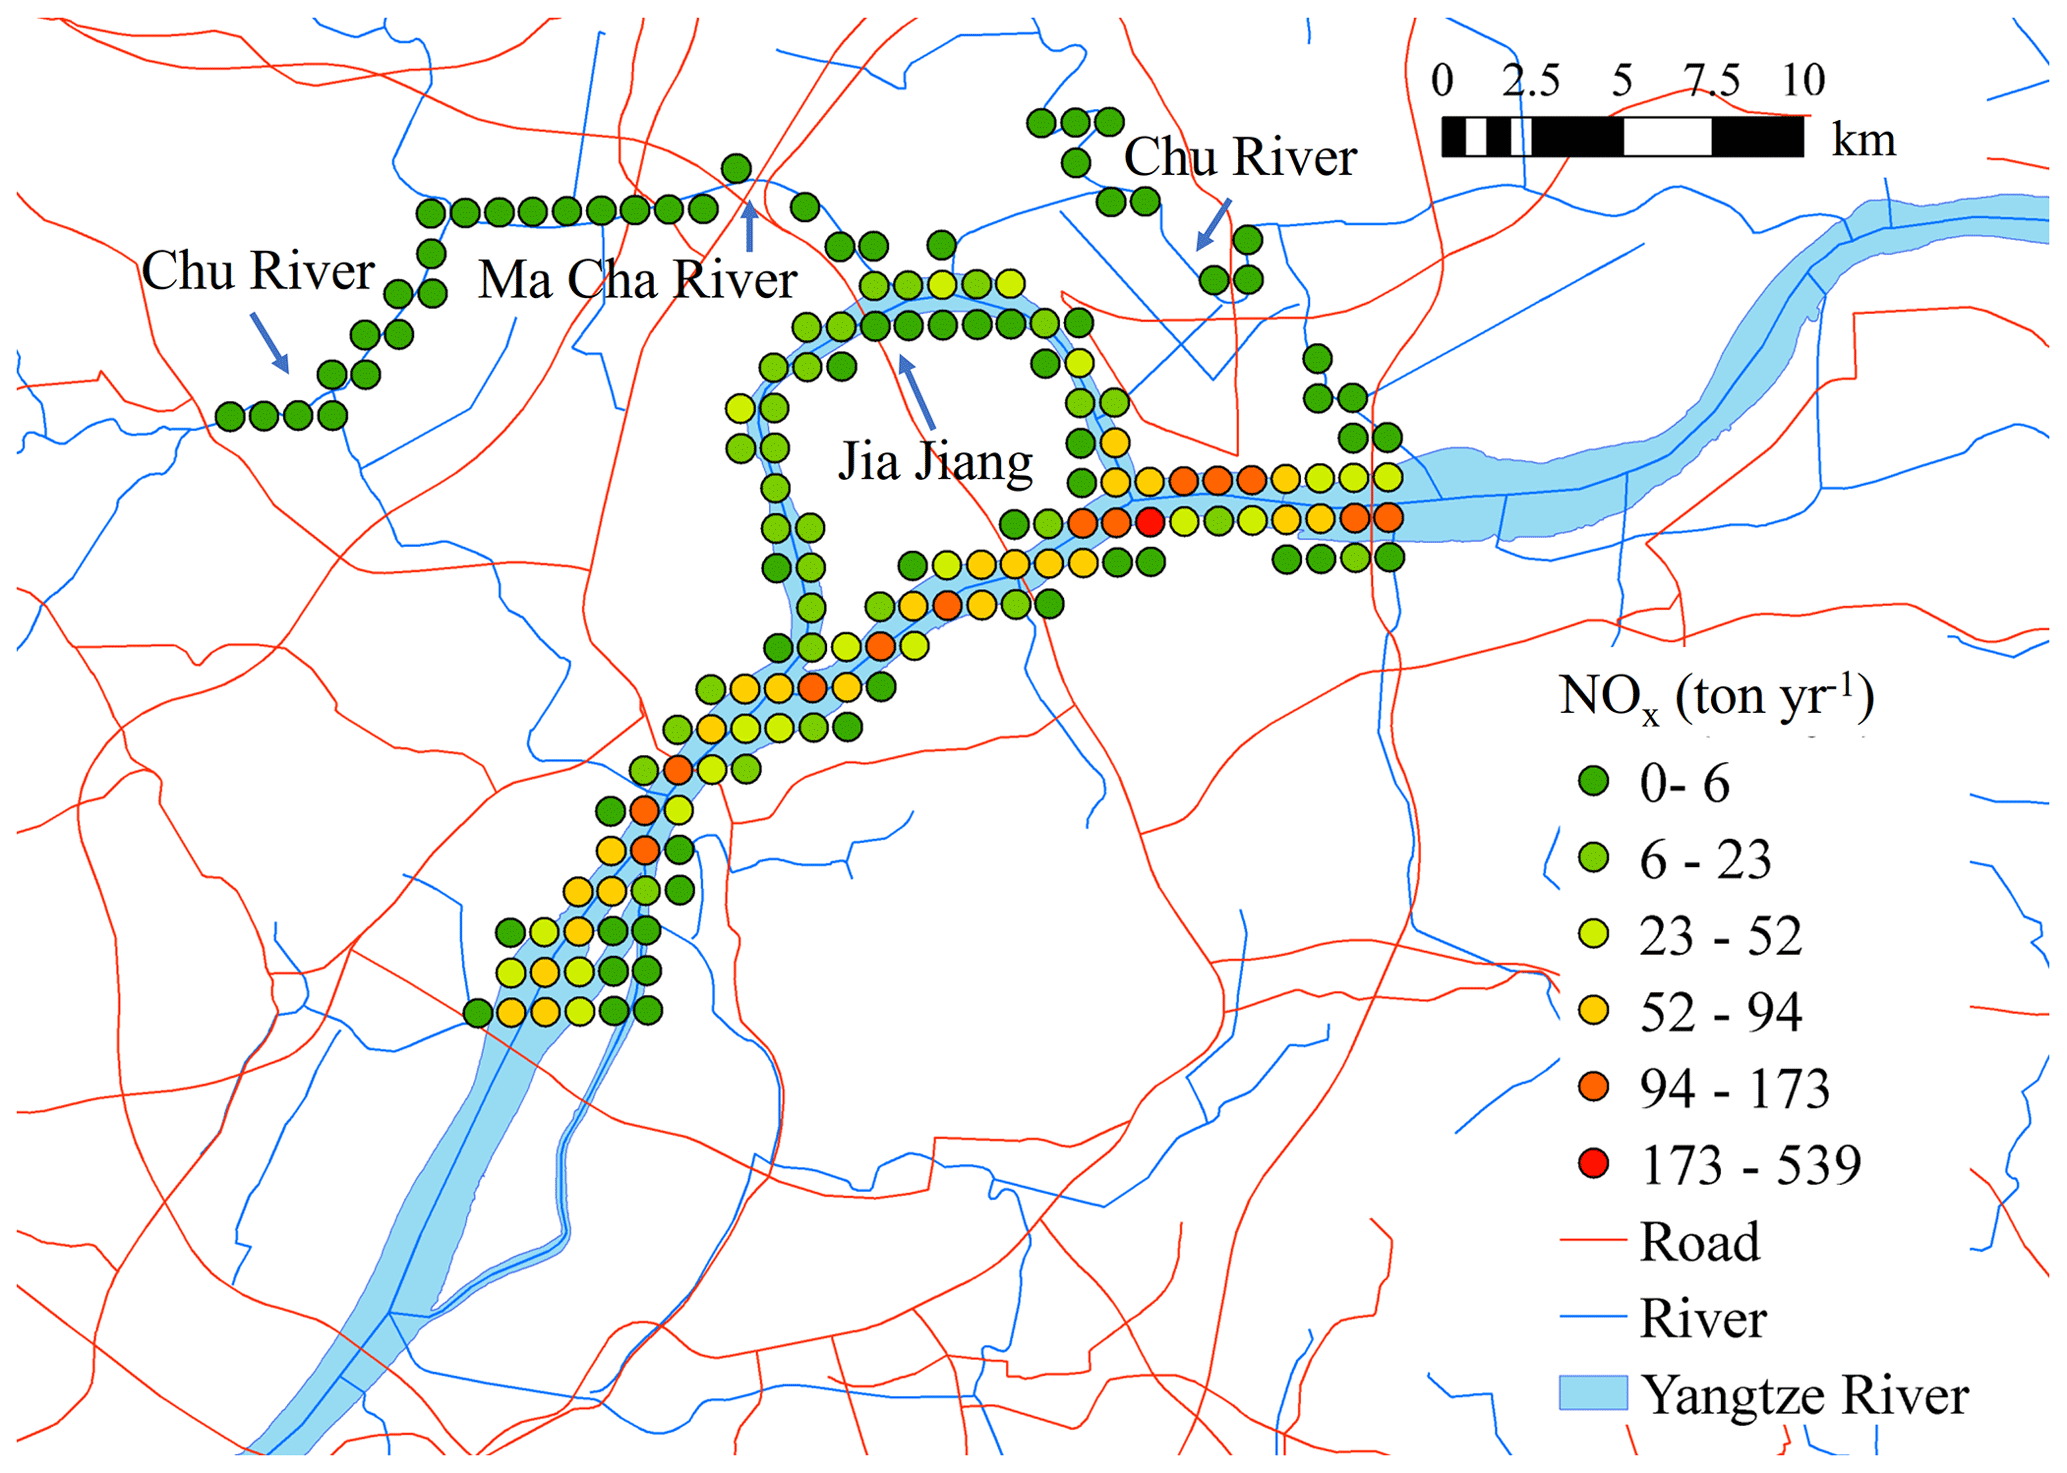
Figure 6Spatial distribution of ship emissions in the observation area at a resolution of 0.01∘ × 0.01∘.
3.3.2 Spatial distribution of NOx emissions in the YRD region
Due to the limits of the observation area, we propose a new river-length-based method to estimate ship pollution in a larger region. Emissions in inventories are often presented per grid cell. Figure 1 shows that the river width is much smaller than the size of a grid cell, and emissions from ships are more closely related to river length per grid cell than river width. Therefore, inland river ship emissions can be seen as line sources, assigning pollution to each kilometer of the river. First, we calculate the emissions per kilometer length of the river. Once we have this quantity, we can calculate the ship emissions per grid cell for any part of the river based on the length of the river in that particular grid cell. For parts of the Yangtze River that have parallel branches, the ship emissions are distributed by the corresponding proportion of the number of ships per branch.
We allocated the total ship emissions Eall in the observational area to the length Lriver of the mainstream river only: . The length of the main channel of the observational area can be inferred by analyzing the distance traveled by ships in downstream and upstream directions (Fig. S4) using the location, speed and time of the ships from the AIS data. We only calculated the distance for vessels that have fully passed through the mainstream channel with a speed of more than 3 kn downstream and more than 1 kn upstream for the entire journey. The downstream side of the river is approximately 30 km and the upstream side is around 32 km. The average length of the main channel was calculated to be 30.9 km, weighted by ships navigating in both directions. We can now obtain the ship emissions within each grid cell by multiplying the river's length within the grid cell by the calculated emissions per kilometer of the river: (kt yr−1 km−1). The Jia Jiang River has been ignored in this calculation, since only 0.04 % of all ships pass this side river.
According to the above method, we extrapolate our emissions per kilometer to the river outside our study area assuming that the ship density and speed are rather constant in this region. Figure 7 shows the spatial distribution of ship emissions in the Jiangsu section of the Yangtze River with a spatial resolution of 0.1∘. The spatial distribution of our ship emissions depends only on the length of the river within the grid cell.
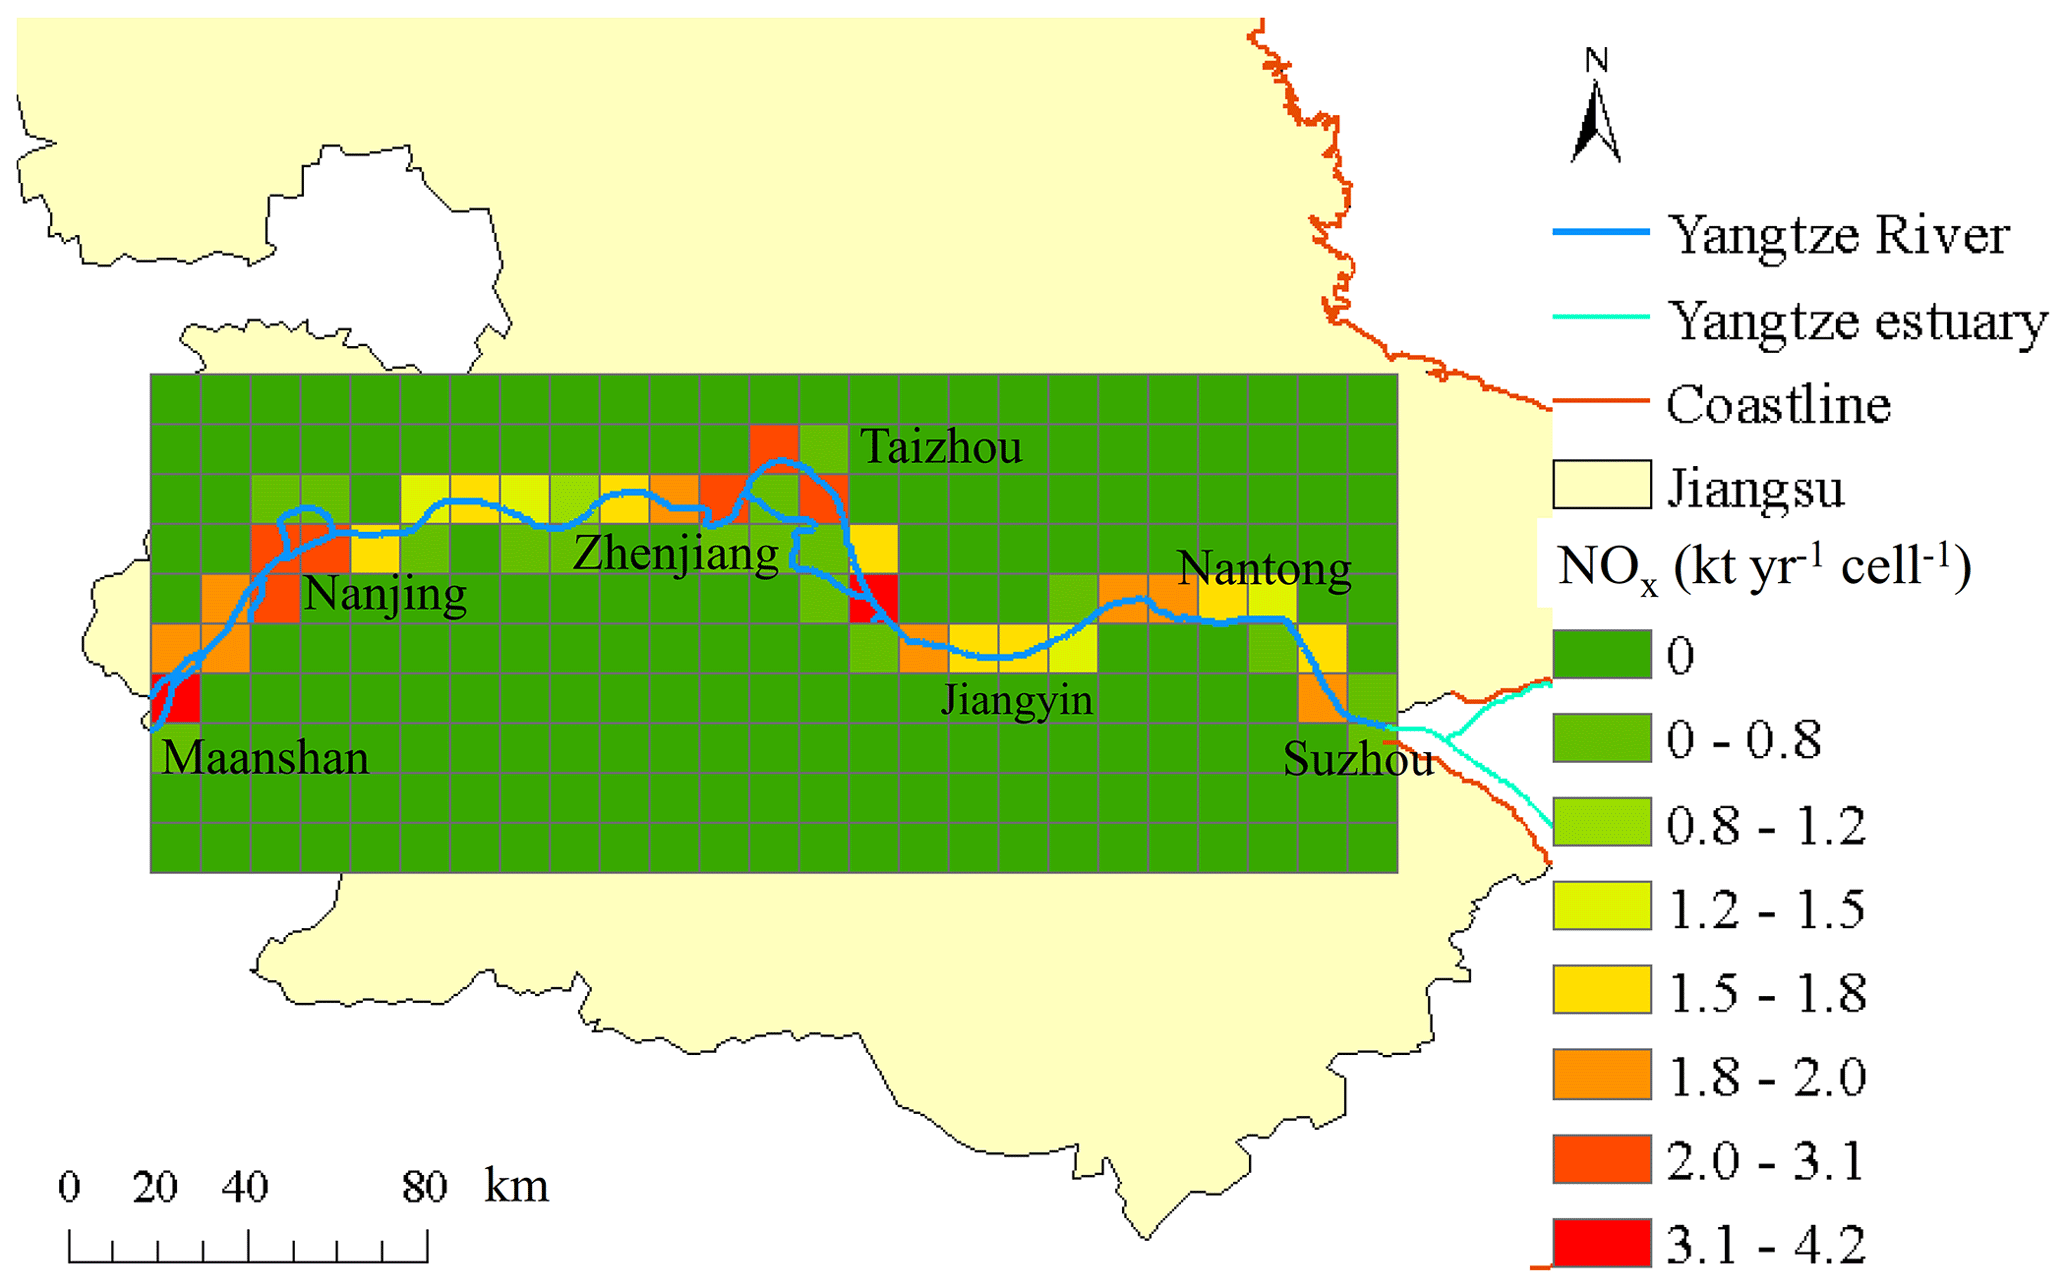
Figure 7Spatial distribution of NOx emissions in the Jiangsu section of the Yangtze River.
3.4 Uncertainty
In this section we will discuss the uncertainty in our emission inventory. Our calculations have been based on the main engine only. However, during the navigation of a ship, the main engine and auxiliary engine of the ship are working at the same time. For a moored ship, the main engine stops working. On average, 17 % of the ships in the observational area are in dock every day, and this part of the ship emissions has been not taken into account, but the auxiliary engines are still working. Based on the study of Weng et al. (2020) in the Yangtze estuary, we estimate that our emissions show an underestimation of about 12 % because of ignoring the auxiliary engine and boiler emissions at berth and underway.
However, the locations of high ship emissions are consistent with previous studies. Zhu et al. (2019) pointed out that the distribution of ship emissions in the Jiangsu section of the Yangtze River in 2017 was uneven, with the emission rates in the Nanjing section of the Yangtze River and the Jiangyin section of the Yangtze River being relatively high. Xu et al. (2019) noted that for ports along the river, Nanjing port had the highest rate of ship emissions.

Figure 8Spatial distribution of ship emissions for JSEI and SEIM.
As the Yangtze River becomes wider when getting closer to the sea, the speed of the river will be reduced, and thus the emissions from ships can be lower. In the extreme cases of stagnant water, ship emissions can be reduced by a maximum of 3 %–33 % depending on the month. We estimate that this may lead to an overestimation of about 10 % in the ship emissions outside our study area around Nanjing.
Currently, the AIS-based approach is considered the best practice for ship inventories. However, there is still a lack of reliable local emission factors, auxiliary engine power ratings and fuel correction factor in the YRD region, which contributes largely to the uncertainties in this study. The selection of accurate emission factors is critical to the calculation of the ship emission inventory and the uncertainty that comes with it. The emission factors are closely related to the age and rotation of the ship's engine and engine load, and the fuel correction factor depends on the sulfur content of the marine fuel. Earlier heavy oil was a fuel of low quality with a sulfur content of about 2.7 %. In contrast, the fuel sulfur content in this study is only 0.001 %, while at the beginning of time period the fuel sulfur content may be as high as 1.5 %. For the scenario that the sulfur content is not regulated, we have calculated that the SO2 and PM emissions would be about a factor of 700–1000 higher.
In conclusion, our derived emissions have an underestimation of 12 % due to ignoring the auxiliary engines and boilers and an overestimation in some regions of about 10 % due to the slower river flow. Adding this to the uncertainties in emission factors, we estimate the total uncertainty to be 5 %–15 %.

We constructed a Jiangsu Ship Emission Inventory (JSEI) over the Jiangsu section of the Yangtze River (118.5–121∘ E and 31.5–32.5∘ N) at different resolutions to compare it with other regional inventories. For the comparison and calculation of the contribution of ship emissions to the total emissions of air pollutants along the river, we only selected the emissions from the grid cells containing the Yangtze River.
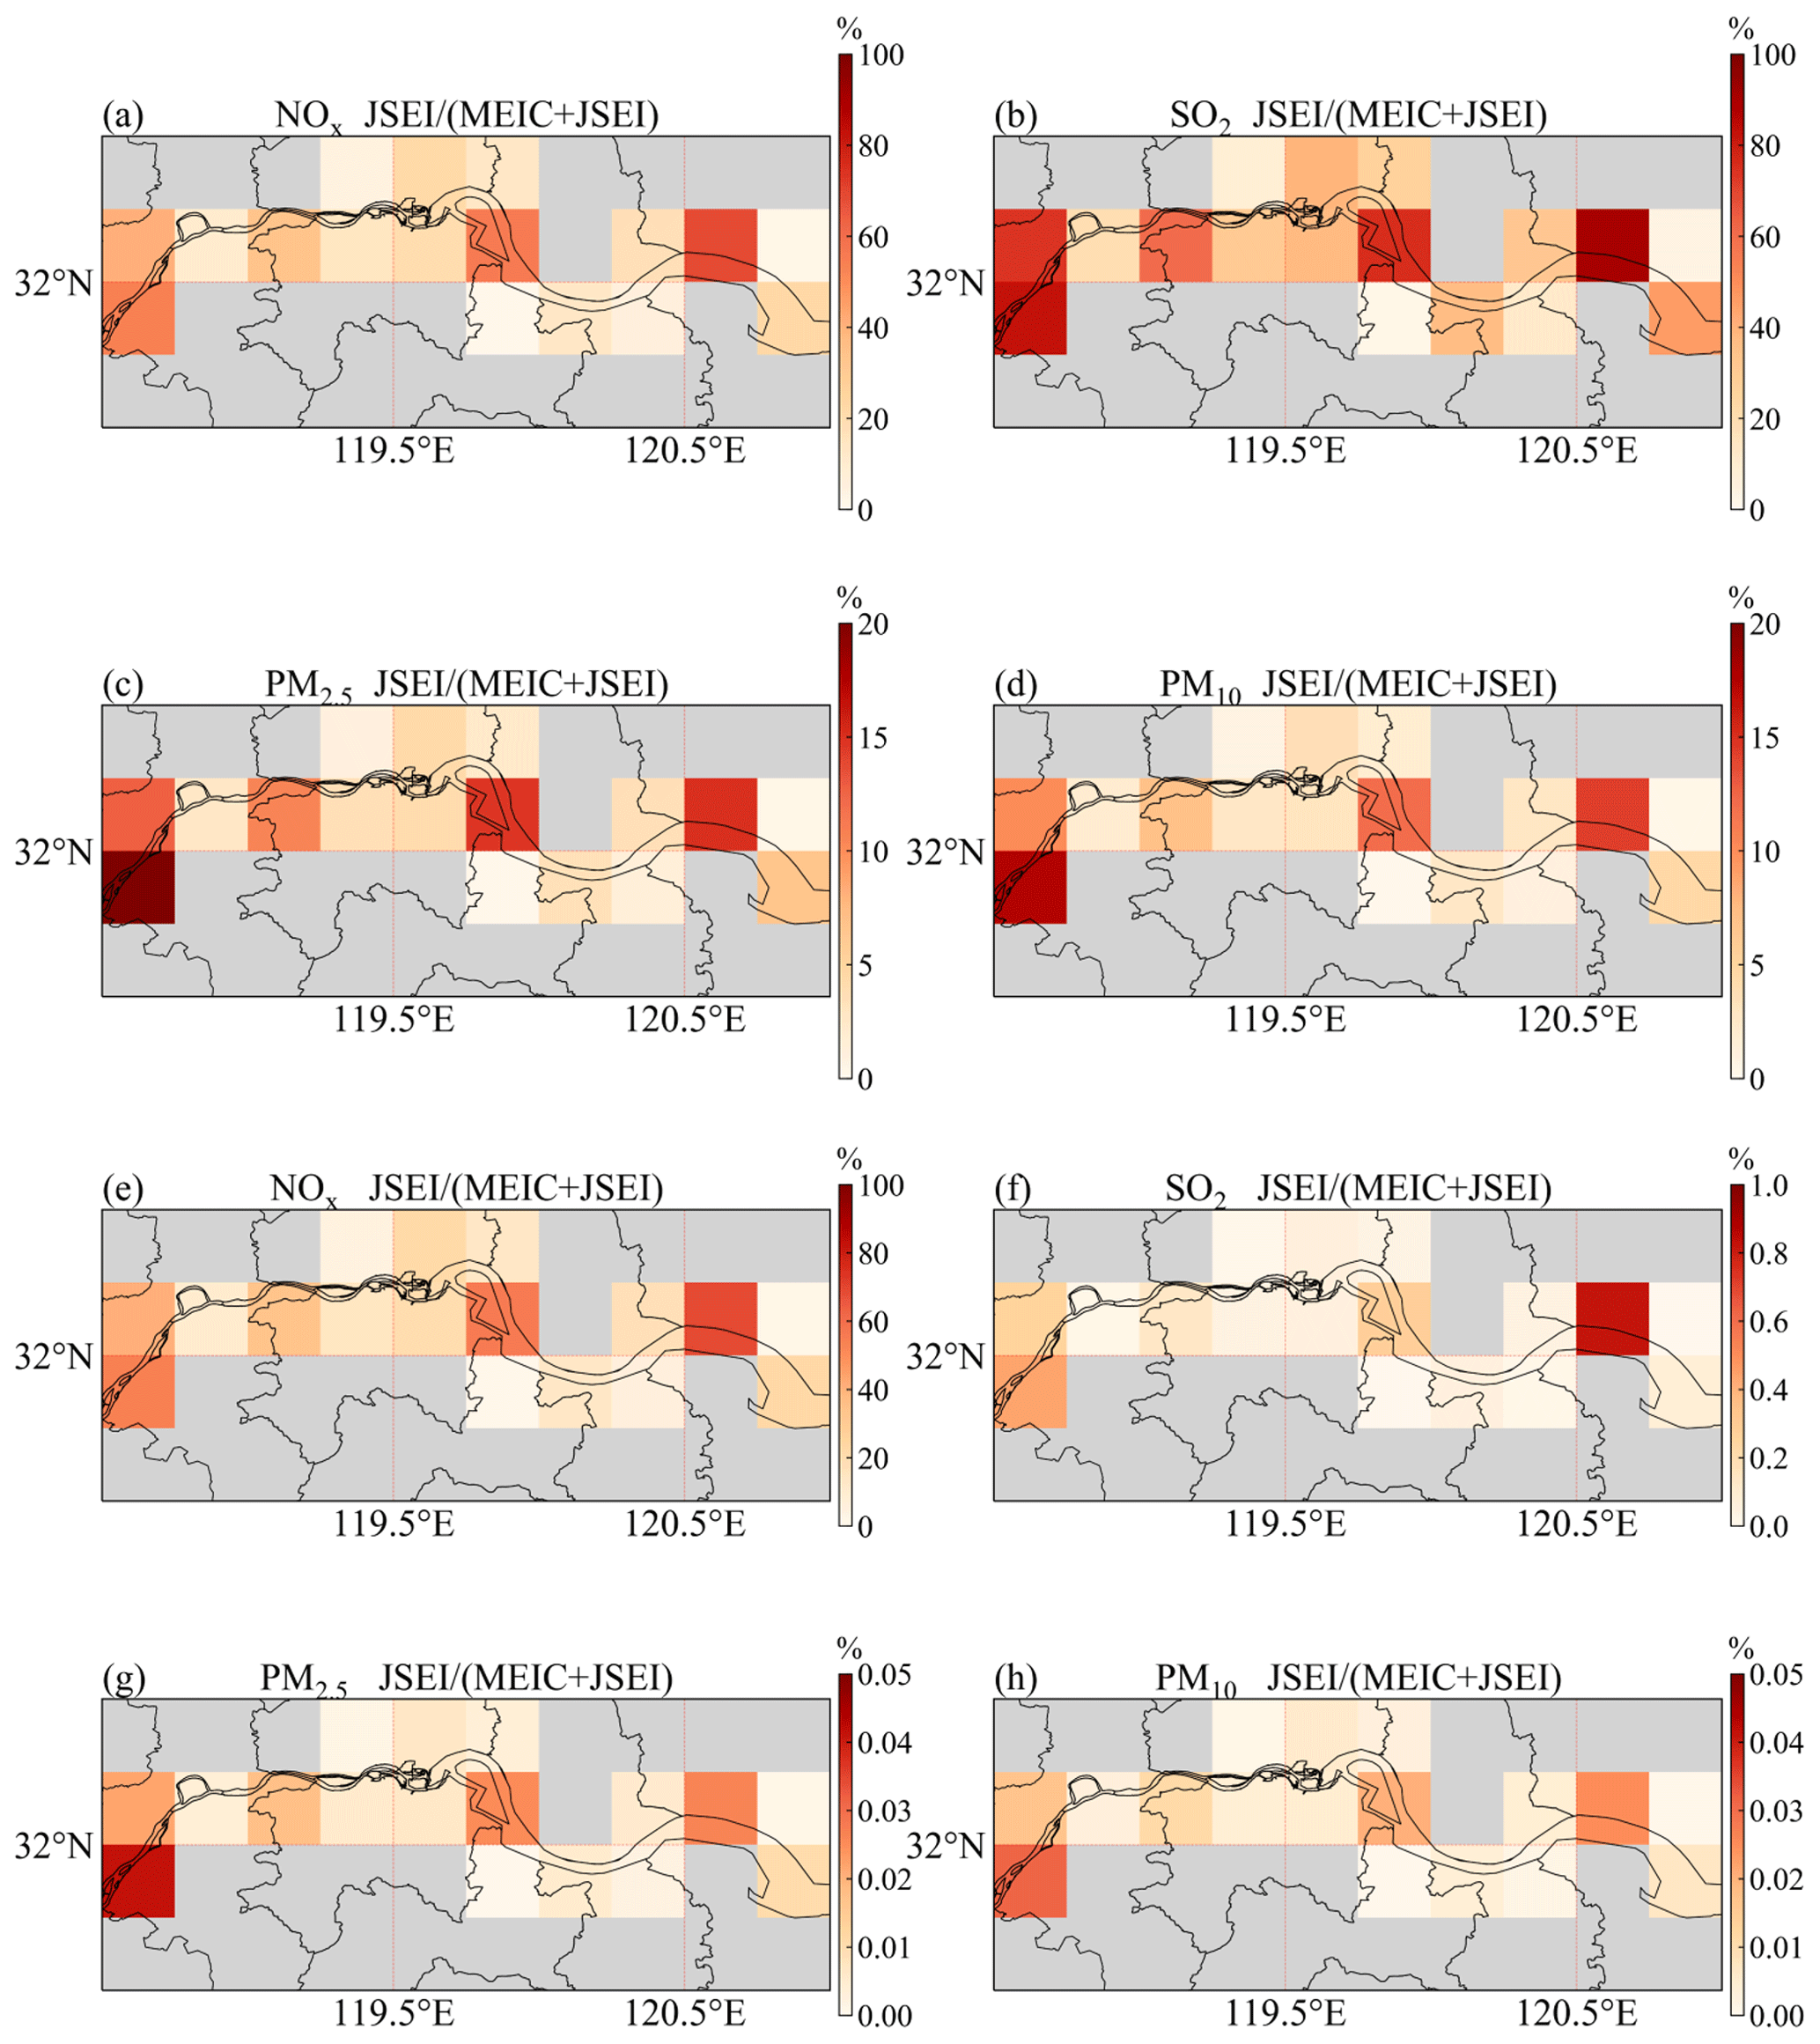
Figure 9Spatial distribution of the contribution of the river emissions (JSEI) to the total emissions (MEIC+JSEI) for NOx, SO2, PM2.5 and PM10. Panels (a), (b), (c) and (d) are based on a scenario where there is no sulfur content regulation. Panels (e), (f), (g) and (h) are based on the actual situation with a sulfur content of 0.001 %.

Figure 10Spatial distribution of NOx emissions for JSEI of 0.25∘ (a) and 0.1∘ (c) resolution, MEIC (b) and DECSO (d).
4.1 A comparison of the ship emission inventories
To verify the calculated emissions of JSEI, we compared them with the ship emissions of SEIM for the overlapping region. Figure 8 shows the spatial distribution of the ship emissions of NOx, SO2 and PM2.5 for JSEI and SEIM and the ratio of JSEI to SEIM. JSEI and SEIM only calculate ship emissions, and they overlap for less than half of the domain. When comparing the overlapping grid cells, JSEI accounts for on average about 99 %, 0.05 % and 0.06 % of the SEIM emissions for NOx, SO2 and PM2.5, respectively. The average emissions from inland ships over rivers (JSEI) compare well with average emissions of sea-going ships (SEIM) for NOx. SEIM has higher values than JSEI for SO2 and PM2.5 because SEIM calculated the emissions for 2017, when only major ports needed to strictly control the sulfur content of marine fuel. The sulfur content of marine fuel was 0.001 % in our study. In comparison, the sulfur content of ocean-going marine fuel in 2017 was about 2.7 %, much higher than that of inland river ship fuel. Ship pollutants that are greatly affected by the sulfur content of marine fuel, such as SO2 and PM, will be reduced with the reduction of sulfur content. This shows that from 2017 to 2019, the policy was of great significance for ship emissions, effectively reducing the emissions of SO2 and PM. For NOx emissions, both inventories compare remarkably well.
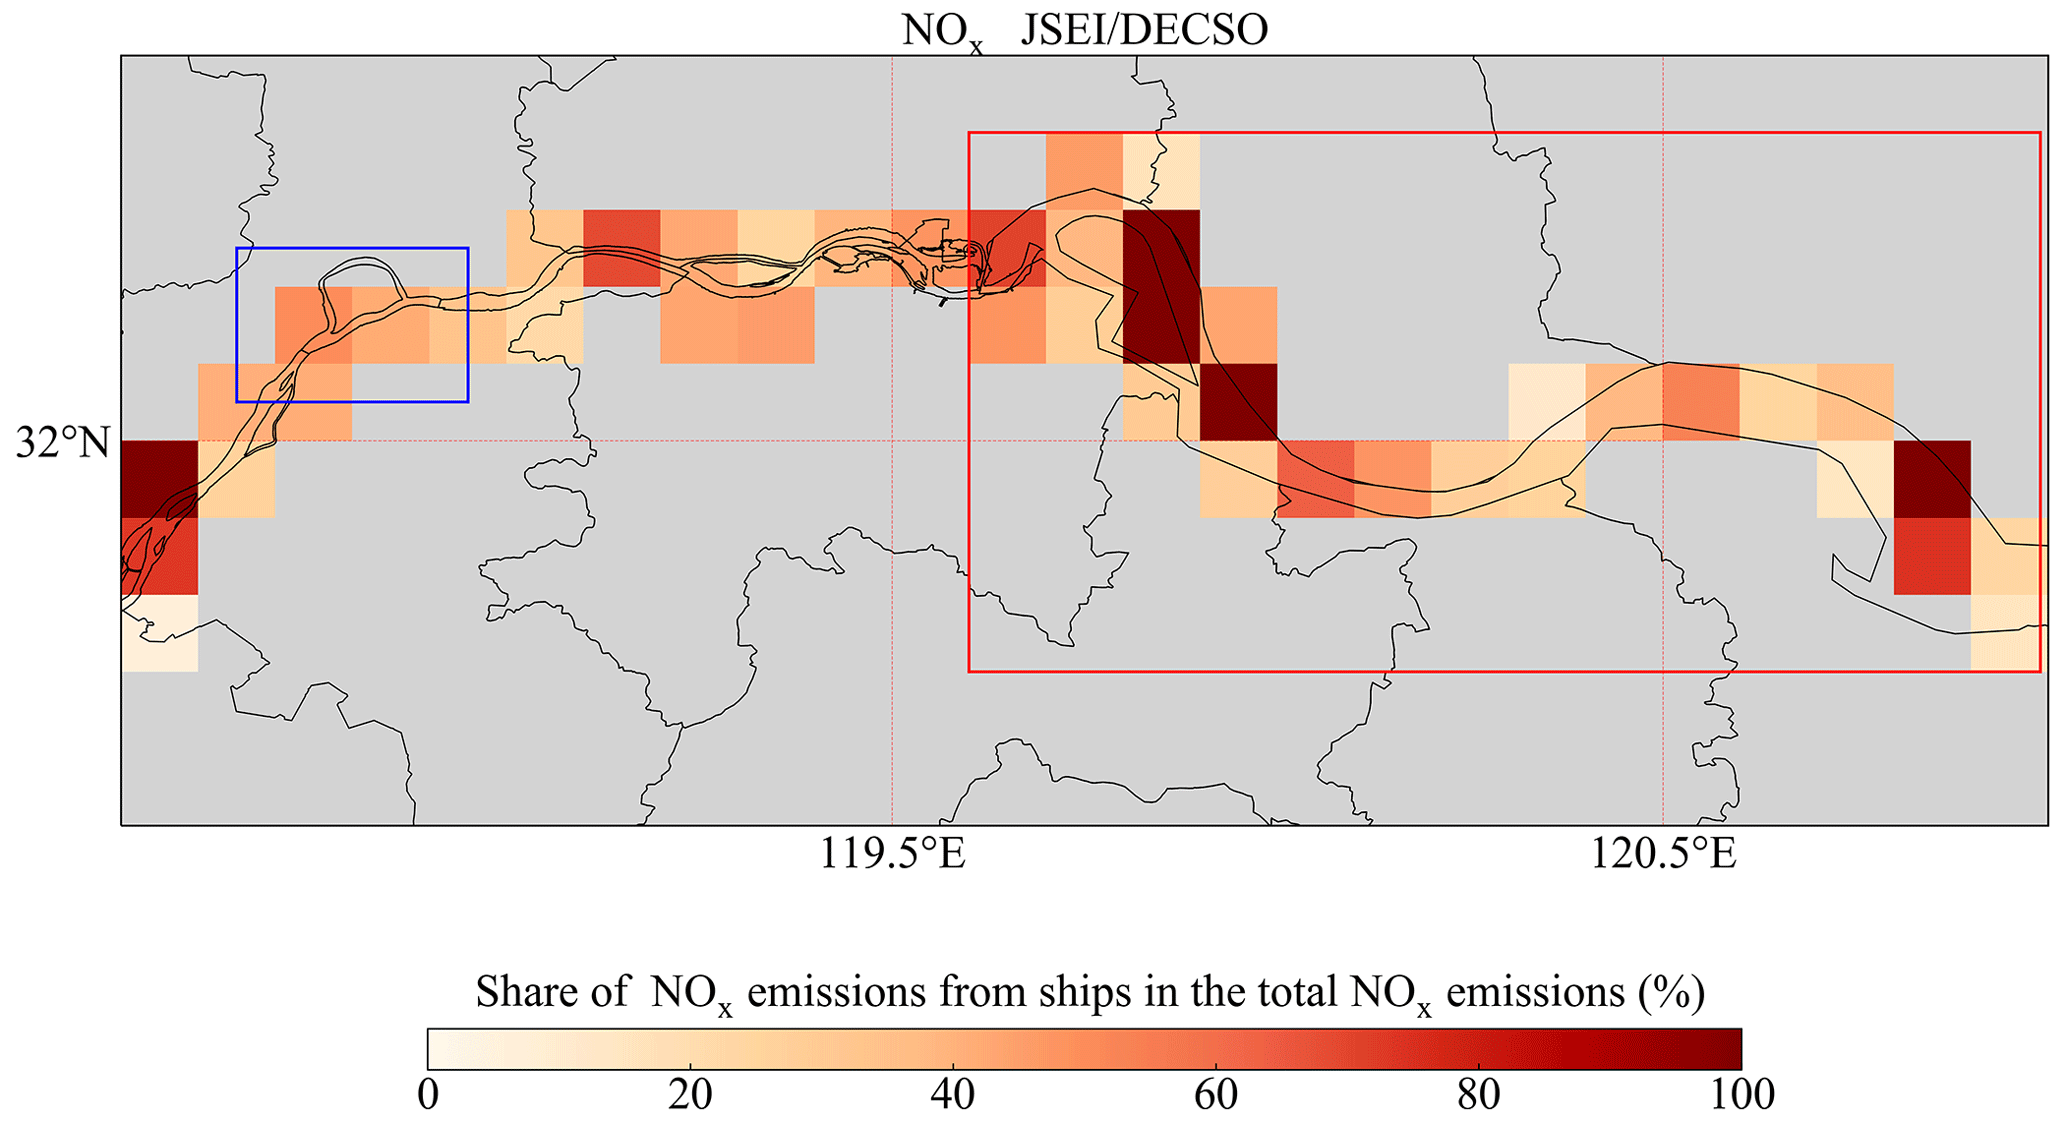
Figure 11Spatial distribution of the contribution of ship emissions (JSEI) to the total emissions (DECSO) for NOx at a 0.1×0.1 resolution. The blue box is the AIS observation area. The red box represents the section of the river with a broader width.

Figure 12Monthly contribution of NOx ship emissions to the total emissions (MEIC + JSEI, DECSO) for the grid cells including the river. The resolution of JSEI (MEIC + JSEI) is 0.25∘, and the resolution of JSEI/(DECSO) is 0.1∘.
4.2 Contribution of ship emissions compared to MEIC and DECSO
Here JSEI is added to the MEIC to represent the value of total air pollutants, as the MEIC does not include emissions from ships. Figure 9 shows the spatial distribution of the contribution of the river emissions (JSEI) over the total emissions (MEIC+JSEI) for NOx, SO2, PM2.5 and PM10 along the river. SO2 ship emissions along the river account for an average of 0.14 % of total SO2 emissions and only 0.82 % in the highest areas. PM emissions from ships along the river contribute on average 0.01 % of the total PM emissions.
Even in a scenario where there is no policy regulation, PM emissions from ships account for only a relatively low proportion of total PM, with a maximum of 20 % and an average of 5 % in riverine areas, with PM2.5 accounting for a slightly higher proportion than PM10. In this scenario, SO2 emissions from ships contribute around 40 % of the total SO2 pollution on average, while it can reach 83 % in some areas. Under the regulation of the new policy, the SO2 and PM emitted from ships are greatly reduced. Therefore, it is important to set up control zones for sulfur emissions from ships.
We integrated JSEI to 0.1∘ resolution and 0.25∘ resolution to compare with DECSO and MEIC, respectively. Because DECSO only covers NOx emissions, we focus on the contribution of NOx emissions from ships to the total emissions. Figure 10 shows the spatial distribution of NOx emissions derived from JSEI, MEIC and DECSO in the Jiangsu section of the Yangtze River. MEIC does not include ship emissions and has a coarser resolution than the other inventories.
When compared to DECSO, NOx emissions from ships account for 6.1 %–74.5 % of the total emissions (Fig. 11). From Fig. 11, we see that the width of the Yangtze River varies from region to region. The width of the Yangtze River increases significantly in Taizhou, Changzhou and the sections of the river close to the estuary of the Yangtze River (red box), where the river flow slows down. Because of the lower river speed, ship emissions in these areas might be overestimated.
The JSEI NOx emissions contribute about 28 % of total NOx emissions of MEIC in a region of 10–25 km around the river (Table 7). Compared to DECSO, the JSEI accounts for 42.9 % of total NOx emissions in the region of 5–10 km from the river. The MEIC grid cells are larger than the DECSO grid cells and therefore include more emissions than for DECSO, so the share of ship emissions for MEIC is nearly half of that for DECSO. Even on the coarser grid of MEIC, the comparison shows that ship emissions from riverine areas account for at least 25 % of the total emissions, so ship emissions should not be ignored in NOx emission inventories. When comparing the total ship emissions with the total non-vessel anthropogenic emissions in Jiangsu province in 2017, NOx emissions from ships still account for 5 % of the total non-vessel anthropogenic NOx in Jiangsu province given by the MEIC (Table S4).
4.3 Comparison of the monthly emissions in the selected river grid cells
Because SEIM is an annual emission inventory, we only compare the monthly variation of JSEI with MEIC and DECSO. Since the ship emissions for all species show similar monthly variability, we focus here only on NOx. We see that the share of NOx emissions from ships in total NOx regardless of the inventory is highest in the summer (Fig. 12). For the MEIC, NOx emissions from ships can account for 17 %–28 % of the NOx total emissions, and for DECSO, NOx emissions from ships account for 29 %–57 % of the NOx total emissions. The JSEI (MEIC + JSEI) ratio tends to coincide with the monthly variation in ship emissions, as there is no significant monthly variation in emissions of the MEIC. For DECSO, ship emissions accounted for more than 40 % of the total emissions in February, which shows that the pollution caused by ship activities during the Spring Festival is quite significant in a time period of lower emissions in general.
Ship emissions are calculated per ship based on the real-time information reported by AIS. Since the AIS information is in general insufficient to support emission calculations, we propose a method to link the engine power and maximum speed to vessel type, length and speed to effectively supplement the missing ship data. In addition, we have presented a method using the river length per grid cell to extrapolate ship emissions along the river. Based on this method, we have compiled a ship emission inventory with a resolution of 0.1∘ in the Jiangsu section of the Yangtze River.
The results show that the total ship emissions of NOx, SO2, PM10 and PM2.5 in the Jiangsu section of the Yangtze River from September 2018 to August 2019 were 83.5, 0.04, 0.006 and 0.005 kt, respectively. Cargo ships are the largest emitting ship type followed by tankers and tugs. These three ship types account for 93 % of the total emissions. Tugs have the highest single-ship emissions. The monthly ship emissions are higher in the summer and lower in the winter, especially during the Spring Festival. Ship emissions are mainly concentrated in the main channel of the Yangtze River. Ship emissions in the side rivers are minimal, accounting for only 0.1 % of the total emissions, which is negligible.
Under the regulation of the sulfur content policy starting in 2019, the SO2 and PM emitted from ships are strongly reduced. Atmospheric emissions from ships are dominated by NOx. Vessel traffic in the observation area is important because NOx emissions account for 46 % of the total NOx emissions compared to the DECSO inventory (grid of about 10×10 km). Our NOx results are similar to the SEIM inventory, up to 99 %, which shows the credibility of the results. Even if compared with the coarse resolution of the MEIC (grid of about 25×25 km), the emissions from vessels along the Yangtze River (118.5–121∘ E and 31.5–32.5∘ N) account for approximately 28 % of the total NOx emissions, respectively. Compared with the DECSO inventory (grid of about 10×10 km) based on satellite data, NOx emissions from ships along the Yangtze River account for 60 % of the total NOx emissions, which indicates that NOx along the river mainly comes from ship emissions, which are even higher than the emissions from power plants or industries. Our study indicates that riverine NOx ship emissions contribute significantly to air pollution. Riverine ship emissions can adversely affect the health of people living along the Yangtze River and have a negative impact on ecosystem, biodiversity and eutrophication.
In the future, the ship emission inventory can be applied in a chemical transport model to explore in detail the impact of inland river ship emissions on air pollution of cities along the Yangtze River. The reliability of the air quality results can be verified with observations from existing in situ stations or ground-based differential optical absorption spectroscopy (DOAS) observations along the river (Cheng et al., 2019; Krause et al., 2021). This can provide a monitoring tool for policies such as the regulation of emission control standards for ships.
The ship databases were obtained from https://www.ccs.org.cn/ccswz/ (CCS, 2014). The Multi-resolution Emission Inventory for China version 1.3 (MEIC v1.3) is available from http://meicmodel.org/ (MEIC Team, 2012). The Shipping Emission Inventory Model (SEIM) is from http://meicmodel.org.cn/?page_id=1770 (Liu et al., 2021). Daily Emission estimates Constrained by Satellite Observations version 6.1 (DECSO v6.1) are published on https://www.temis.nl/emissions/data.php (Ding et al., 2020). The monthly Jiangsu Ship Emission Inventory (JSEI) can be download from https://www.temis.nl/emissions/region_asia/datapage.php (Zhang et al., 2023).
The supplement related to this article is available online at: https://doi.org/10.5194/acp-23-5587-2023-supplement.
RvdA and YY planned the campaign; XZ and RvdA performed the measurements; XZ provided the ship data; XZ, RvdA and JD analyzed the data; XZ wrote the paper; and all authors provided input on the paper for revision before submission.
The contact author has declared that none of the authors has any competing interests.
Publisher’s note: Copernicus Publications remains neutral with regard to jurisdictional claims in published maps and institutional affiliations.
We would like to thank the China Classification Society and Nanjing Maritime Bureau for their assistance. This research has received funding from the National Natural Science Foundation of China (grant no. 42075176) and the program of China Scholarship Council (no. 202109040001).
This research has been supported by the National Natural Science Foundation of China (grant no. 42075176) and the China Scholarship Council (grant no. 202109040001).
This paper was edited by Bryan N. Duncan and reviewed by Aristeidis Georgoulias and one anonymous referee.
Archana, A., Guiselle, A., and Anderson, B.: Port of Los Angeles air emissions inventory-2009, Starcrest Cobsulting Group, LLC, United States, https://www.portoflosangeles.org/environment/air-quality/air-emissions-inventory (last access: 14 May 2023), 2013.
Capaldo, K., Corbett, J. J., Kasibhatla, P., Fischbeck, P., and Pandis, S. N.: Effects of ship emissions on sulphur cycling and radiative climate forcing over the ocean, Nature, 400, 743–746, https://doi.org/10.1038/23438, 1999.
CCS: The China Classification Society, ship databases [data set], https://www.ccs.org.cn/ccswz/ (last access: 14 May 2023), 2014.
Chen, D., Zhao, Y., Nelson, P., Li, Y., Wang, X., Zhou, Y., Lang, J., and Guo, X.: Estimating ship emissions based on AIS data for port of Tianjin, China, Atmos. Environ., 145, 10–18, https://doi.org/10.1016/j.atmosenv.2016.08.086, 2016.
Chen, D., Wang, X., Nelson, P., Li, Y., Zhao, N., Zhao, Y., Lang, J., Zhou, Y., and Guo, X.: Ship emission inventory and its impact on the PM2.5 air pollution in Qingdao Port, North China, Atmos. Environ., 166, 351–361, https://doi.org/10.1016/j.atmosenv.2017.07.021, 2017.
Chen, J., Finlayson, B. L., Wei, T., Sun, Q., Webber, M., Li, M., and Chen, Z.: Changes in monthly flows in the Yangtze River, China – With special reference to the Three Gorges Dam, J. Hydrol., 536, 293–301, https://doi.org/10.1016/j.jhydrol.2016.03.008, 2016.
Cheng, Y., Wang, S., Zhu, J., Guo, Y., Zhang, R., Liu, Y., Zhang, Y., Yu, Q., Ma, W., and Zhou, B.: Surveillance of SO2 and NO2 from ship emissions by MAX-DOAS measurements and the implications regarding fuel sulfur content compliance, Atmos. Chem. Phys., 19, 13611–13626, https://doi.org/10.5194/acp-19-13611-2019, 2019.
Collins, B., Sanderson, M. G., and Johnson, C. E.: Impact of increasing ship emissions on air quality and deposition over Europe by 2030, Meteorol. Z., 18, 25–39, https://doi.org/10.1127/0941-2948/2008/0296, 2009.
Corbett, J. J.: Emissions from Ships, Science, 278, 823–824, https://doi.org/10.1126/science.278.5339.823, 1997.
Corbett, J. J., Fischbeck, P. S., and Pandis, S. N.: Global nitrogen and sulfur inventories for oceangoing ships, J. Geophys. Res., 104, 3457–3470, https://doi.org/10.1029/1998JD100040, 1999.
Dalsøren, S. B., Endresen, Ø., Isaksen, I. S. A., Gravir, G., and Sørgård, E.: Environmental impacts of the expected increase in sea transportation, with a particular focus on oil and gas scenarios for Norway and northwest Russia, J. Geophys. Res., 112, D02310, https://doi.org/10.1029/2005JD006927, 2007.
Dalsøren, S. B., Eide, M. S., Endresen, Ø., Mjelde, A., Gravir, G., and Isaksen, I. S. A.: Update on emissions and environmental impacts from the international fleet of ships: the contribution from major ship types and ports, Atmos. Chem. Phys., 9, 2171–2194, https://doi.org/10.5194/acp-9-2171-2009, 2009.
Ding, J., van der A, R. J., Mijling, B., Jalkanen, J.-P., Johansson, L., and Levelt, P. F.: Maritime NOx emissions over Chinese seas derived from satellite observations, Geophys. Res. Lett., 45, 2031–2037, https://doi.org/10.1002/2017GL076788, 2018.
Ding, J., van der A, R. J., Eskes, H. J., Mijling, B., Stavrakou, T., van Geffen, J. H. G. M., and Veefkind, J. P.: NOx emissions reduction and rebound in China due to the COVID-19 crisis, DECSO [data set], https://doi.org/10.1029/2020GL089912, 2020.
Dragović, B., Tzannatos, E., Tselentis, V., Meštrović, R., and Škurić, M.: Ship emissions and their externalities in cruise ports, Transp. Res. D Transp. Environ., 61, 289–300, https://doi.org/10.1016/j.trd.2015.11.007, 2018.
Endresen, Ø.: Emission from international sea transportation and environmental impact, J. Geophys. Res., 108, D17, https://doi.org/10.1029/2002JD002898, 2003.
Endresen, Ø., Bakke, J., Sørgård, E., Flatlandsmo Berglen, T., and Holmvang, P.: Improved modelling of ship SO2 emissions – a fuel-based approach, Atmos. Environ., 39, 3621–3628, https://doi.org/10.1016/j.atmosenv.2005.02.041, 2005.
Endresen, Ø., Sørgård, E., Behrens, H. L., Brett, P. O., and Isaksen, I. S. A.: A historical reconstruction of ships' fuel consumption and emissions, J. Geophys. Res., 112, D12301, https://doi.org/10.1029/2006JD007630, 2007.
Entec: Quantification of Emissions from Ships Associated with Ship Movements between Ports in the European Community, Entec UK Limited, UK, https://publications.jrc.ec.europa.eu/repository/handle/JRC128870 (last access: 14 May 2023), 2002.
EPA (Environmental Protection Agency): ICF International: Current methodologies in preparing mobile source port-related emission inventories, Final Report, April 2009, U.S. Environmental Protection Agency, United States, https://www.epa.gov/moves/ (last access: 14 May 2023), 2009.
Eyring, V., Stevenson, D. S., Lauer, A., Dentener, F. J., Butler, T., Collins, W. J., Ellingsen, K., Gauss, M., Hauglustaine, D. A., Isaksen, I. S. A., Lawrence, M. G., Richter, A., Rodriguez, J. M., Sanderson, M., Strahan, S. E., Sudo, K., Szopa, S., van Noije, T. P. C., and Wild, O.: Multi-model simulations of the impact of international shipping on Atmospheric Chemistry and Climate in 2000 and 2030, Atmos. Chem. Phys., 7, 757–780, https://doi.org/10.5194/acp-7-757-2007, 2007.
Eyring, V., Isaksen, I. S. A., Berntsen, T., Collins, W. J., Corbett, J. J., Endresen, O., Grainger, R. G., Moldanova, J., Schlager, H., and Stevenson, D. S.: Transport impacts on atmosphere and climate: Shipping, Atmos. Environ., 44, 4735–4771, https://doi.org/10.1016/j.atmosenv.2009.04.059, 2010.
Fan, Q., Zhang, Y., Ma, W., Ma, H., Feng, J., Yu, Q., Yang, X., Ng, S. K. W., Fu, Q., and Chen, L.: Spatial and seasonal dynamics of ship emissions over the Yangtze River Delta and East China Sea and their potential environmental influence, Environ. Sci. Technol., 50, 1322–1329, https://doi.org/10.1021/acs.est.5b03965, 2016.
Feng, J., Zhang, Y., Li, S., Mao, J., Patton, A. P., Zhou, Y., Ma, W., Liu, C., Kan, H., Huang, C., An, J., Li, L., Shen, Y., Fu, Q., Wang, X., Liu, J., Wang, S., Ding, D., Cheng, J., Ge, W., Zhu, H., and Walker, K.: The influence of spatiality on shipping emissions, air quality and potential human exposure in the Yangtze River Delta/Shanghai, China, Atmos. Chem. Phys., 19, 6167–6183, https://doi.org/10.5194/acp-19-6167-2019, 2019.
Fu, Q., Shen, Y., and Zhang, J.: A study of ship air pollutant emission inventories in Shanghai port, J. Saf. Environ., 12, 57–64, 2012 (in Chinese).
Georgoulias, A. K., Boersma, K. F., van Vliet, J., Zhang, X., van der A, R., Zanis, P., and de Laat, J.: Detection of NO2 pollution plumes from individual ships with the TROPOMI/S5P satellite sensor, Environ. Res. Lett., 15, 124037, https://doi.org/10.1088/1748-9326/abc445, 2020.
Goldsworthy, L. and Goldsworthy, B.: Modelling of ship engine exhaust emissions in ports and extensive coastal waters based on terrestrial AIS data – An Australian case study, Environ. Model. Softw., 63, 45–60, https://doi.org/10.1016/j.envsoft.2014.09.009, 2015.
Huang, L., Wen, Y., Zhang, Y., Zhou, C., Zhang, F., and Yang, T.: Dynamic calculation of ship exhaust emissions based on real-time AIS data, Transp. Res. D Transp. Environ., 80, 102277, https://doi.org/10.1016/j.trd.2020.102277, 2020.
Jalkanen, J.-P., Brink, A., Kalli, J., Pettersson, H., Kukkonen, J., and Stipa, T.: A modelling system for the exhaust emissions of marine traffic and its application in the Baltic Sea area, Atmos. Chem. Phys., 9, 9209–9223, https://doi.org/10.5194/acp-9-9209-2009, 2009.
Jalkanen, J.-P., Johansson, L., Kukkonen, J., Brink, A., Kalli, J., and Stipa, T.: Extension of an assessment model of ship traffic exhaust emissions for particulate matter and carbon monoxide, Atmos. Chem. Phys., 12, 2641–2659, https://doi.org/10.5194/acp-12-2641-2012, 2012.
Jalkanen, J.-P., Johansson, L., and Kukkonen, J.: A comprehensive inventory of ship traffic exhaust emissions in the European sea areas in 2011, Atmos. Chem. Phys., 16, 71–84, https://doi.org/10.5194/acp-16-71-2016, 2016.
Johansson, L.: Global assessment of shipping emissions in 2015 on a high spatial and temporal resolution, Atmos. Environ., 167, 403–415, 2017.
Jonson, J. E., Jalkanen, J. P., Johansson, L., Gauss, M., and Denier van der Gon, H. A. C.: Model calculations of the effects of present and future emissions of air pollutants from shipping in the Baltic Sea and the North Sea, Atmos. Chem. Phys., 15, 783–798, https://doi.org/10.5194/acp-15-783-2015, 2015.
Kalli, J., Jalkanen, J.-P., Johansson, L., and Repka, S.: Atmospheric emissions of European SECA shipping: long-term projections, WMU J. Marit. Aff., 12, 129–145, https://doi.org/10.1007/s13437-013-0050-9, 2013.
Krause, K., Wittrock, F., Richter, A., Schmitt, S., Pöhler, D., Weigelt, A., and Burrows, J. P.: Estimation of ship emission rates at a major shipping lane by long-path DOAS measurements, Atmos. Meas. Tech., 14, 5791–5807, https://doi.org/10.5194/amt-14-5791-2021, 2021.
Kurchaba, S., van Vliet, J., Verbeek, F. J., Meulman, J. J., and Veenman, C. J.: Supervised Segmentation of NO2 Plumes from Individual Ships Using TROPOMI Satellite Data, Remote Sens., 14, 5809, https://doi.org/10.3390/rs14225809, 2022.
Lauer, A., Eyring, V., Hendricks, J., Jöckel, P., and Lohmann, U.: Global model simulations of the impact of ocean-going ships on aerosols, clouds, and the radiation budget, Atmos. Chem. Phys., 7, 5061–5079, https://doi.org/10.5194/acp-7-5061-2007, 2007.
Li, C., Yuan, Z., Ou, J., Fan, X., Ye, S., Xiao, T., Shi, Y., Huang, Z., Ng, S. K. W., Zhong, Z., and Zheng, J.: An AIS-based high-resolution ship emission inventory and its uncertainty in Pearl River Delta region, China, Sci. Total Environ., 573, 1–10, https://doi.org/10.1016/j.scitotenv.2016.07.219, 2016.
Li, C., Borken-Kleefeld, J., Zheng, J., Yuan, Z., Ou, J., Li, Y., Wang, Y., and Xu, Y.: Decadal evolution of ship emissions in China from 2004 to 2013 by using an integrated AIS-based approach and projection to 2040, Atmos. Chem. Phys., 18, 6075–6093, https://doi.org/10.5194/acp-18-6075-2018, 2018.
Li, M., Liu, H., Geng, G., Hong, C., Liu, F., Song, Y., Tong, D., Zheng, B., Cui, H., Man, H., Zhang, Q., and He, K.: Anthropogenic emission inventories in China: a review, Natl. Sci. Rev., 4, 834–866, https://doi.org/10.1093/nsr/nwx150, 2017.
Liu, H., Fu, M., Jin, X., Shang, Y., Shindell, D., Faluvegi, G., Shindell, C., and He, K.: Health and climate impacts of ocean-going vessels in East Asia, Nat. Clim. Change, 6, 1037–1041, https://doi.org/10.1038/nclimate3083, 2016.
Liu, H., Meng, Z.-H., Lv, Z.-F., Wang, X.-T., Deng, F.-Y., Liu, Y., Zhang, Y.-N., Shi, M.-S., Zhang, Q., and He, K.-B.: Emissions and health impacts from global shipping embodied in US – China bilateral trade, SEIM [data set], https://doi.org/10.1038/s41893-019-0414-z, 2019.
Liu, J., Wang, J., Song, C., and Qin, J.: Establishment and application of air pollution discharge inventory for ships in Qingdao port, Environ. China Monit., 27, 50–53, https://doi.org/10.19316/j.issn.1002-6002.2011.03.014, 2011 (in Chinese).
Lv, Z., Liu, H., Ying, Q., Fu, M., Meng, Z., Wang, Y., Wei, W., Gong, H., and He, K.: Impacts of shipping emissions on PM2.5 pollution in China, Atmos. Chem. Phys., 18, 15811–15824, https://doi.org/10.5194/acp-18-15811-2018, 2018.
MEIC Team: The Multi-resolution Emission Inventory Model for Climate and Air Pollution Research, MEIC Model [data set], http://www.meicmodel.org/ (last access: 14 May 2023), 2012.
Mijling, B. and van der A, R. J.: Using daily satellite observations to estimate emissions of short-lived air pollutants on a mesoscopic scale: daily emission estimates from space, J. Geophys. Res., 117, D17, https://doi.org/10.1029/2012JD017817, 2012.
MOT (Ministry of Transport): Notice of the Ministry of Transport on printing and distributing the implementation plan of ship emission control zone in the waters of Pearl River Delta, Yangtze River Delta and Bohai Rim (Beijing Tianjin Hebei), https://xxgk.mot.gov.cn/2020/jigou/haishi/202006/t20200630_3319179.html (last access: 14 May 2023), 2015.
MOT (Ministry of Transport): Notice of the Ministry of Transport on printing and distributing the implementation plan for the control area of air pollutant emission from ships, http://www.gov.cn/zhengce/zhengceku/2018-12/31/content_5444672.html (last access: 14 May 2023), 2018.
MOT (Ministry of Transport): Statistical bulletin on the development of the transport sector in 2021, available at: https://xxgk.mot.gov.cn/2020/jigou/zhghs/202205/t20220524_3656659.html (last access: 14 May 2023), 2022.
Moldanová, J., Fridell, E., Popovicheva, O., Demirdjian, B., Tishkova, V., Faccinetto, A., and Focsa, C.: Characterisation of particulate matter and gaseous emissions from a large ship diesel engine, Atmos. Environ., 43, 2632–2641, https://doi.org/10.1016/j.atmosenv.2009.02.008, 2009.
Ng, S. K. W., Loh, C., Lin, C., Booth, V., Chan, J. W. M., Yip, A. C. K., Li, Y., and Lau, A. K. H.: Policy change driven by an AIS-assisted marine emission inventory in Hong Kong and the Pearl River Delta, Atmos. Environ., 76, 102–112, https://doi.org/10.1016/j.atmosenv.2012.07.070, 2013.
Papanastasiou, D. K. and Melas, D.: Climatology and impact on air quality of sea breeze in an urban coastal environment, Int. J. Climatol., 29, 305–315, https://doi.org/10.1002/joc.1707, 2009.
Psaraftis, H. N. and Kontovas, C. A.: CO2 emission statistics for the world commercial fleet, WMU J. Marit. Aff., 8, 1–25, https://doi.org/10.1007/BF03195150, 2009.
Riess, T. C. V. W., Boersma, K. F., van Vliet, J., Peters, W., Sneep, M., Eskes, H., and van Geffen, J.: Improved monitoring of shipping NO2 with TROPOMI: decreasing NOx emissions in European seas during the COVID-19 pandemic, Atmos. Meas. Tech., 15, 1415–1438, https://doi.org/10.5194/amt-15-1415-2022, 2022.
Song, S.: Ship emissions inventory, social cost and eco-efficiency in Shanghai Yangshan port, Atmos. Environ., 82, 288–297, https://doi.org/10.1016/j.atmosenv.2013.10.006, 2014.
Streets, D. G.: Sulfur dioxide emissions and sulfur deposition from international shipping in Asian waters, Atmos. Environ., 10, 1573–1582, 1997.
Streets, D. G., Guttikunda, S. K., and Carmichael, G. R.: The growing contribution of sulfur emissions from ships in Asian waters, 1988–1995, Atmos. Environ., 34, 4425–4439, https://doi.org/10.1016/S1352-2310(00)00175-8, 2000
Theotokatos, G. and Tzelepis, V.: A computational study on the performance and emission parameters mapping of a ship propulsion system, Proc. Inst. Mech. Eng. M-J. Eng., 229, 58–76, https://doi.org/10.1177/1475090213498715, 2015.
Trozzi, C.: Emission estimate methodology for maritime navigation, U.S. Environmental Protection Agency, United States, https://www.academia.edu/28998830/Emission_estimate_methodology_for_maritime_navigation (last access: 14 May 2023), 2010.
Tzannatos, E.: Ship emissions and their externalities for the port of Piraeus – Greece, Atmos. Environ., 44, 400–407, https://doi.org/10.1016/j.atmosenv.2009.10.024, 2010.
USEPA: Analysis of Commercial Marine Vessels Emissions and Fuel Consumption Data, U.S. Environmental Protection Agency, http://widit.knu.ac.kr/epa/ebtpages/Air/Mobile_Sources/Marine_Engines/siteout/s2out15.pdf (last access: 14 May 2023), 2000.
Wan, Z., Ji, S., Liu, Y., Zhang, Q., Chen, J., and Wang, Q.: Shipping emission inventories in China's Bohai Bay, Yangtze River Delta, and Pearl River Delta in 2018, Mar. Pollut. Bull., 151, 110882, https://doi.org/10.1016/j.marpolbul.2019.110882, 2020.
Wang, C., Corbett, J. J., and Firestone, J.: Improving spatial representation of global ship emissions inventories, Environ. Sci. Technol., 42, 193–199, https://doi.org/10.1021/es0700799, 2008.
Wang, J., Huang, Z., Liu, Y., Chen, S., Wu, Y., He, Y., and Yang, X.: Air Pollutant Emission Inventory and Pollution Characteristics of Xiamen Ship Control Area, Environ. Sci., 1–18, https://doi.org/10.13227/j.hjkx.202001067, 2020 (in Chinese).
Wang, X., Yi, W., Lv, Z., Deng, F., Zheng, S., Xu, H., Zhao, J., Liu, H., and He, K.: Ship emissions around China under gradually promoted control policies from 2016 to 2019, Atmos. Chem. Phys., 21, 13835–13853, https://doi.org/10.5194/acp-21-13835-2021, 2021.
Weng, J., Shi, K., Gan, X., Li, G., and Huang, Z.: Ship emission estimation with high spatial-temporal resolution in the Yangtze River estuary using AIS data, J. Clean. Prod., 248, 119297, https://doi.org/10.1016/j.jclepro.2019.119297, 2020.
Xu, W., Yin, C., Xu, X., and Zhang, W.: Emission Inventory and Characteristics of Air Pollutants from Inland Waterway Vessels in Jiangsu Province, Environ. Sci., 40, 2595–2606, https://doi.org/10.13227/j.hjkx.201810207, 2019 (in Chinese).
Xu, X. and Bai, G.: Fuzzy Classification and Implementation Methods for Tugboat Main Engine Fault, MATEC Web Conf., 95, 11003, https://doi.org/10.1051/matecconf/20179511003, 2017.
Yang, D., Kwan, S. H., Lu, T., Fu, Q., Cheng, J., Streets, D. G., Wu, Y., and Li, J.: An Emission Inventory of Marine Vessels in Shanghai in 2003, Environ. Sci. Technol., 41, 5183–5190, https://doi.org/10.1021/es061979c, 2007.
Yang, J., Yin, P., Ye, S., Wang, S., Zheng, J., and Qu, J.: Ship Emission Inventory and Temporal and Spatial Characteristics of Shenzhen City, Environ. Sci., 36, 1217–1226, 2015 (in Chinese).
Zhang, X., van der A, R. J., Ding, J., Zhang, X., and Yin, Y.: Significant contribution of inland ships to the total NOx emissions along the Yangtze River, JSEI [data set], https://www.temis.nl/emissions/region_asia/datapage.php (last access: 14 May 2023), 2023.
Zheng, B., Huo, H., Zhang, Q., Yao, Z. L., Wang, X. T., Yang, X. F., Liu, H., and He, K. B.: High-resolution mapping of vehicle emissions in China in 2008, Atmos. Chem. Phys., 14, 9787–9805, https://doi.org/10.5194/acp-14-9787-2014, 2014.
Zheng, B., Tong, D., Li, M., Liu, F., Hong, C., Geng, G., Li, H., Li, X., Peng, L., Qi, J., Yan, L., Zhang, Y., Zhao, H., Zheng, Y., He, K., and Zhang, Q.: Trends in China's anthropogenic emissions since 2010 as the consequence of clean air actions, Atmos. Chem. Phys., 18, 14095–14111, https://doi.org/10.5194/acp-18-14095-2018, 2018.
Zhu, Q., Liao, C., and Wang, L.: Refined ship emission inventory method based on AIS data, China Environ. Sci., 037, 4493–4500, https://doi.org/10.3969/j.issn.1000-6923.2017.12.011, 2017 (in Chinese).
Zhu, Y., Lei, Z., Feng, X., Yuan, S., and Liang, W.: A Study on the Emission Inventory of Air Pollutants from Ships in Jiangsu Section of Yangtze River Based on AIS Big Data, Environ. Sci. Tech., 32, 41–46, 2019 (in Chinese).