the Creative Commons Attribution 4.0 License.
the Creative Commons Attribution 4.0 License.
 | 16 May 2023
Impact of solar geoengineering on wildfires in the 21st century in CESM2/WACCM6
Simone Tilmes
David M. Lawrence
Cenlin He
Louisa K. Emmons
Rebecca R. Buchholz
We quantify future changes in wildfire burned area and carbon emissions in the 21st century under four Shared Socioeconomic Pathways (SSPs) scenarios and two SSP5-8.5-based solar geoengineering scenarios with a target surface temperature defined by SSP2-4.5 – solar irradiance reduction (G6solar) and stratospheric sulfate aerosol injections (G6sulfur) – and explore the mechanisms that drive solar geoengineering impacts on fires. This study is based on fully coupled climate–chemistry simulations with simulated occurrence of fires (burned area and carbon emissions) using the Whole Atmosphere Community Climate Model version 6 (WACCM6) as the atmospheric component of the Community Earth System Model version 2 (CESM2). Globally, total wildfire burned area is projected to increase over the 21st century under scenarios without geoengineering and decrease under the two geoengineering scenarios. By the end of the century, the two geoengineering scenarios have lower burned area and fire carbon emissions than not only their base-climate scenario SSP5-8.5 but also the targeted-climate scenario SSP2-4.5.
Geoengineering reduces wildfire occurrence by decreasing surface temperature and wind speed and increasing relative humidity and soil water, with the exception of boreal regions where geoengineering increases the occurrence of wildfires due to a decrease in relative humidity and soil water compared with the present day. This leads to a global reduction in burned area and fire carbon emissions by the end of the century relative to their base-climate scenario SSP5-8.5. However, geoengineering also yields reductions in precipitation compared with a warming climate, which offsets some of the fire reduction. Overall, the impacts of the different driving factors are larger on burned area than fire carbon emissions. In general, the stratospheric sulfate aerosol approach has a stronger fire-reducing effect than the solar irradiance reduction approach.
Please read the corrigendum first before continuing.
-
Notice on corrigendum
The requested paper has a corresponding corrigendum published. Please read the corrigendum first before downloading the article.
-
Article
(11814 KB)
- Corrigendum
-
Supplement
(5553 KB)
-
The requested paper has a corresponding corrigendum published. Please read the corrigendum first before downloading the article.
- Article
(11814 KB) - Full-text XML
- Corrigendum
-
Supplement
(5553 KB) - BibTeX
- EndNote


Fire is an important component of the Earth system. It directly impacts climate in two main ways. First, the burning of biomass is one of the major sources of radiatively and/or chemically active trace gases and aerosols in the atmosphere (Andreae and Merlet, 2001; Li et al., 2022). Second, fires pose alterations to terrestrial ecosystem states and functioning such as changing vegetation distribution and structure, disturbing the carbon cycle and water cycle, and changing surface albedo (Bowman et al., 2009; Li and Lawrence, 2017; Liu et al., 2019; Lasslop et al., 2020). In addition to the impact on climate, fires also have significant impacts on air quality and weather across spatial scales (e.g., Bowman et al., 2009; Tang et al., 2022). For example, fires degrade air quality and human health, as many of the emitted gases and aerosols from fires are primary pollutants or precursors to secondary chemically produced pollutants (Wiedinmyer et al., 2006; van der Werf et al., 2006). Fires also alter regional dynamics and weather by changing surface heat and water vapor fluxes, convection, clouds, and precipitation (e.g., Bowman et al., 2009; Coen et al., 2013; Zhang et al., 2022).
Fire is regulated by various factors, including weather and climate conditions (e.g., soil moisture, temperature, precipitation, and wind speed), vegetation composition and structure, and human activity (e.g., land use and land cover change as well as human ignition and suppression) (e.g., Li et al., 2013; Chen et al., 2017; Knorr et al., 2016a, b; Li et al., 2018; Pechony and Shindell, 2010; van der Werf et al., 2008). These factors also interact with each other in the Earth system (e.g., Walker et al., 2020; Loehman, 2020). For example, climate can alter vegetation composition and structure, and vegetation can also impact climate and weather through evapotranspiration. Due to the complex interactions and feedbacks among these factors and fires, quantifying and projecting the trend in fires is challenging and is subject to large uncertainties. Despite challenges and uncertainties, previous studies have generally suggested that global fire risk will increase in the future, although with significant regional differences (e.g., Abatzoglou et al., 2019; Bowman et al., 2020; Di Virgilio et al., 2019; Flannigan et al., 2009, 2013; Ford et al., 2018; Huang et al., 2015; Li et al., 2020; Liu et al., 2010; Luo et al., 2013; Pechony and Shindell, 2010; Veira et al., 2016). This growing importance combined with large uncertainties associated with fires has posed an urge to understand and quantify future fire trends in the context of climate change. It has been suggested that future climate mitigation should consider the impact of fires (Shiogama et al., 2020; Ward et al., 2012).
The Shared Socioeconomic Pathways (SSPs) were established to facilitate the integrated analysis of future climate impacts, vulnerabilities, adaptation, and mitigation (Riahi et al., 2017). These SSP scenarios utilized in Phase 6 of the Coupled Model Intercomparison Project (CMIP6) were generated with integrated assessment models, based on five narratives describing alternative socioeconomic developments, including sustainable development (SSP1), middle-of-the-road development (SSP2), regional rivalry (SSP3), inequality (SSP4), and fossil-fueled development (SSP5). Different scenarios have different energy, land use, and emissions implications. Corresponding global population projections consistent with each of the SSPs have also been established (Jones and O'Neill, 2016).
Solar geoengineering, also known as solar radiation modification (SRM) or, more generally, as climate intervention, has been researched as a potential option to offset some of the radiative effects of increasing anthropogenic greenhouse gases in the future through solar radiation modification (e.g., Kravitz et al., 2015; Tilmes et al., 2009, 2020). One proposed approach is the injection of the precursor of sulfate aerosols (sulfur dioxide; SO2) into the stratosphere, as it can reflect incoming solar radiation. To understand the impacts of sulfate aerosols compared with direct solar irradiance reduction, both experiments have been performed in parallel (e.g., Xia et al., 2016; Visioni et al., 2021a). Previous studies have analyzed the impact of geoengineering on climate outcomes (e.g., Tilmes et al., 2013, 2020; Visioni et al., 2021a). While global surface temperature targets could be reached, SRM approaches tend to overcompensate for the hydrological cycle, with potential consequences for other impacts on climate and the Earth system (e.g., Bala et al., 2008; Tilmes et al., 2013; Lee et al., 2020). As fire is a key component of the Earth system and the drivers of fires are directly or indirectly changed by solar geoengineering, the impacts of solar geoengineering on fires should also be considered when designing and assessing solar geoengineering approaches.
In this paper, we use the fully coupled Community Earth System Model version 2 (CESM2) with the Whole Atmosphere Community Climate Model version 6 (WACCM6) as the atmospheric component. CESM2 (WACCM6) is coupled to the Community Land Model (CLM) that includes a prognostic fire scheme, which interacts with various land and atmospheric processes. WACCM6 is currently not using biomass burning emissions derived from the land model. A coupling of fire emissions to the atmosphere would allow one to identify additional climate feedback, including changes to climate and the vegetation. However, while this feedback is missing, the fire model still responds to changes in the land and atmosphere and is, therefore, suited to investigate how fires change in the 21st century. We analyze the future trends in burned area and fire carbon emissions under the two geoengineering scenarios and SSP scenarios. Following this, we then analyze how the two solar geoengineering approaches impact fire activity. This paper is organized as follows: Sect. 2 describes the model simulations, Sect. 3 presents the future trends in burned area and fire carbon emissions under SSP scenarios and geoengineering scenarios, Sect. 4 discusses how geoengineering impacts fire, and Sect. 5 concludes the study.
2.1 CESM2 (WACCM6)
CESM2 (WACCM6) is a community model that has components of ocean, atmosphere, land, sea ice, land ice, river, and wave models. These components are coupled in CESM2 by exchanging states and fluxes via a coupler (Danabasoglu et al., 2020). The Community Land Model version 5 (CLM5) is the land component of CESM2 (Lawrence et al., 2019). CLM uses prescribed temporal land use and land cover change (LULCC), which consists of an annual time series of the spatial distribution of the naturally vegetated and cropland units of each grid cell, combined with the distribution of plant functional types (PFTs) and crop functional types (CFTs) existing in those land units (Lawrence et al., 2019). The interactive fire scheme in CLM5 is a key component of this study and is described in more detail in Sect. 2.2. WACCM6 is a high-top atmospheric model with 70 vertical levels and the model top at ∼140 km; therefore, it has reasonable representation of the stratosphere. The default horizontal resolution of WACCM6 is 1.25∘ × 0.9∘ (longitude × latitude). WACCM6 also includes comprehensive chemistry and aerosol mechanisms (Gettelman et al., 2019; Emmons et al., 2020; Tilmes et al., 2019).
2.2 Description and evaluation of the fire scheme in CESM2/CLM5
The fire scheme in CESM2/CLM5 accounts for four types of fires: agricultural fires in cropland, deforestation fires in tropical closed forests, peat fires, and non-peat fires outside cropland and tropical closed forests (Li et al., 2012, 2013). Agricultural fire is accounted for in these simulations but is not included in the analysis, as we focus on wildfires here. In the fire scheme, burned area is affected by climate and weather conditions, vegetation composition and structure, and human activity. Climate and weather conditions (e.g., temperature, precipitation, wind, humidity, and soil moisture) impact natural and human ignition and fire spread through fuel availability and fuel combustibility. Human activity impacts deforestation fires via deforestation rates that are applied from the Land-Use Harmonization dataset (LUH2; Hurtt et al., 2020) which is used in these experiments. Human impacts on non-deforestation and non-peat fires include both ignition and suppression, and they are parameterized as functions of both population density and gross domestic product (GDP). In our setup, the global population scenarios corresponding to SSP scenarios (Jones and O'Neill, 2016) were used, while the regionally explicit GDP was held constant for all WACCM6 simulations analyzed in this study. Fire-induced changes (including biomass and peat burning; vegetation mortality; adjustment of the carbon and nitrogen, C N, pools; carbon emissions; changes in vegetation structure and functioning as well as surface water and energy fluxes) are then simulated based on the calculated burned area (Li et al., 2012, 2013). These fire-induced surface property changes in the land model further alter atmospheric states (i.e., temperature and water vapor) in the coupled model. Although the burned area and fire carbon emissions are simulated in CLM5, our CESM2/WACCM6 simulations use prescribed fire emissions based on the CMIP6 projected inventories for trace gases and aerosols (Riahi et al., 2017) for different SSPs and geoengineering scenarios. Changes in fires can have an impact on radiation, precipitation, and therefore vegetation. However, as this paper mainly focuses on the impacts of solar geoengineering on wildfires (instead of the other way around), we do not expect the uncoupled fire emissions to have a large impact on our results; however, future studies will be needed to further understand the impact. Full coupling of simulated fire aerosol emissions is an area of ongoing development and analysis with the CESM project.
The fire scheme in CESM has been validated and evaluated in both uncoupled and coupled versions (Li et al., 2012, 2013, 2017, 2018; Li and Lawrence, 2017), and it has been compared with other fire models within the Fire Modeling Intercomparison Project (FireMIP; Li et al., 2019). Evaluation results have shown that the fire scheme can reasonably reproduce the observed amount, spatial pattern, and seasonality of global fires; the interannual variability in global fires; and the fire–population relationship under the present-day climate; moreover, simulations using the fire scheme have a similar historical long-term trend to the multisource merged historical reconstructions used as input data for CMIP6 (Li et al., 2018, 2019). Although the model underestimates the climate impacts on fires in boreal North America, it still performs better than many other fire models (Yue et al., 2016). Here, we briefly evaluate the fire carbon emissions from the CESM2 (WACCM6) simulations with two satellite-based fire emission inventories, namely FINNv2.5 (Fire INventory from NCAR version 2.5; Wiedinmyer et al., 2023) and GFED4.1s (Global Fire Emissions Database, version 4.1s; Randerson et al., 2018). The annual total emissions and global distributions of WACCM simulations agree well with those from FINNv2.5 and GFED4.1s (Figs. S1 and S2 in the Supplement). The annual total fire carbon emissions during 2015–2019 estimated from the WACCM simulations (2.5 PgC yr−1) fall into the range of GFED4.1s (2.0 PgC yr−1) and FINNv2.5 (3.8 PgC yr−1).
2.3 SSPs and geoengineering scenarios
The Scenario Model Intercomparison Project (ScenarioMIP) based on SSPs is the primary activity within CMIP6 that provides multi-model climate projections based on alternative scenarios (O'Neill et al., 2016). These climate projections are driven by SSP scenarios and are related to the Representative Concentration Pathways (RCPs) as described below. The Land Use Model Intercomparison Project (LUMIP) also provides LULCC data for SSPs (Lawrence et al., 2016; Hurtt et al., 2020). In this study, the SSP1-2.6, SSP2-4.5, SSP3-7.0, and SSP5-8.5 scenarios (O'Neill et al., 2016) are shown. SSP1-2.6 (sustainable development) is the low end of the range of future forcing pathways in SSP and updates the RCP2.6 scenario. SSP1 includes substantial land use change, particularly with increasing global forest cover. SSP2-4.5 is a scenario that represents the middle part of the range of future forcing pathways and updates the RCP4.5 scenario. Land use and aerosol changes in SSP2 (middle-of-the-road development) are not extreme relative to other SSPs. SSP3-7.0 is a scenario with both substantial land use changes (particularly decreased global forest cover) and high near-term climate forcer emissions, particularly sulfur dioxide (SO2). SSP5-8.5 is the unmitigated baseline scenario, representing the high end of the range of future pathways, and updates the RCP8.5 scenario. There is relatively little land use change in the 21st century in this scenario which leads to a slow decline in the rate of deforestation (O'Neill et al., 2017).
The Geoengineering Model Intercomparison Project Phase 6 (GeoMIP6) proposed experiments for future projection with geoengineering measures implemented based on ScenarioMIP. In this study, we also analyze the response of wildfires under two of the geoengineering experiments: G6sulfur and G6solar (Kravitz et al., 2015). Both of these geoengineering scenarios aim to reduce globally averaged forcing from the ScenarioMIP Tier-1 high-forcing scenario (SSP5-8.5), which averages 8.5 W m−2 of forcing by 2100, to the medium-forcing scenario (SSP2-4.5), which averages 4.5 W m−2 of forcing by 2100. The geoengineering scenarios were designed to match the surface temperature of SSP2-4.5. G6sulfur reduces forcing with stratospheric sulfate aerosols. In the G6sulfur experiment, SO2, the precursor of stratospheric sulfate aerosol has been continuously injected into the model at 25 km altitude at the Equator with the goal of reducing the magnitude of the net anthropogenic radiative forcing and reaching surface temperatures at SSP2-4.5 levels. G6solar employs the same setup as G6sulfur but uses solar irradiance reduction to reduce the magnitude of the net anthropogenic radiative forcing. The reduction of the solar constant in G6solar and the injected SO2 in G6sulfur is determined by a feedback algorithm described in Kravitz et al. (2017) and used in Tilmes et al. (2018, 2020). The feedback algorithm identifies differences in the global mean surface temperature between the simulated and the prescribed target temperature each year and calculates the required changes in the solar constant or SO2 injections.
2.4 Simulations
In this study, we analyze results from fully coupled WACCM6 simulations for future projection under the aforementioned scenarios from GeoMIP and ScenarioMIP. The continuous long-term (2015–2100) simulations used in this study provide an uninterrupted picture of future fire changes and allow us to investigate when and how major changes in fire trends occur. The horizontal resolution for land and atmosphere is (longitude × latitude). Multiple simulations (two to five members) are conducted for each scenario except for the SSP1-2.6 and SSP3-7.0 scenarios (see Table S1 in the Supplement for ensemble sizes). Different ensemble sizes could result in differences in ensemble spread. To be consistent, for scenarios with multiple simulations, only ensemble means are shown and analyzed. Thus, ensemble means are calculated before any analyses or calculations, and a scenario with multiple simulations is treated in the same way as a scenario with only one simulation by only using the mean value of the ensemble members. Comparing results from a single simulation to multimember averages could introduce potential uncertainties, as ensemble mean values are generally different from values from a single member. However, the analyses and comparisons here are as useful as comparing single simulations, if not more so, because, in our approach, we attempted to improve the model projection for several scenarios by using ensemble means to replace single simulation values when possible. The future projection simulations analyzed in this study were initialized with the ensemble WACCM6 historical simulations. Therefore, the initial conditions of different ensemble members are different. Future climate under these simulations has been analyzed in Meehl et al. (2020) and Jones et al. (2021).
3.1 Future trends in burned area and fire carbon emissions under the SSP scenarios
The global total wildfire burned area in these simulations is projected to increase under all SSP scenarios (Fig. 1a). The largest increases (averages for the 2091–2100 period relative to the 2021–2030 period) in the global burned area are seen in the SSP5-8.5 scenarios (∼20 %). The changes in SSP1-2.6 and SSP2-4.5 are less than 4 % (see Table S2 for the projected regional and global change in burned area and fire carbon emissions in 2091–2100 relative to 2021–2030, as a percentage, under different scenarios). In terms of the spatial distribution, 40–70∘ N is the only latitude band in which the burned area consistently increases under all SSP scenarios (Fig. 1b). In the 10∘ S–5∘ N latitude band (tropical region), the burned area consistently decreases under all scenarios to a diverse extent. While global total burned area is expected to increase under most global warming scenarios, burned area may decrease in some regions due to changes in anthropogenic activity or reduced 2 m relative humidity and/or reduced soil moisture. A more detailed discussion on future trends in fire activity under the SSP scenarios is provided in the Supplement.

Figure 1Overall global burned area and fire carbon emission trends and changes under SSP scenarios. (a) Time series of global burned area from 2020 to 2100 under the SSP1-2.6, SSP2-4.5, SSP3-7.0, and SSP5-8.5 scenarios (represented by different colors). The time series are shown as 5-year moving averages. (b) Zonal changes (absolute value) of burned area in the 2091–2100 period relative to the 2021–2030 period (calculated by the value in 2091–2100 minus the value in 2021–2030), under the SSP1-2.6, SSP2-4.5, SSP3-7.0, and SSP5-8.5 scenarios (represented by different colors – color code is the same as it in panel a). A 5∘ moving average was applied to the shown zonal changes. Panels (c) and (d) are similar to panels (a) and (b), respectively, but for fire carbon emissions.
3.2 Future trends in burned area and fire carbon emissions with geoengineering
The two geoengineering scenarios (G6sulfur and G6solar) are based on SSP5-8.5 and targeted SSP2-4.5. As G6sulfur reduces the forcing through stratospheric sulfate aerosols whereas G6solar directly decreases total incoming solar irradiance, the difference between the two provides insight into the other impacts of sulfate aerosols on fires besides the forcing change. Although fire carbon emissions are largely driven by burned area, they are also impacted by fuel availability and combustion completeness. Therefore, the fire carbon emissions generally show trends consistent with burned area, with some notable differences. Both burned area and fire carbon emissions under the two geoengineering scenarios are lower than those under SSP5-8.5 (Fig. 2a, c). Lower fire activity in these geoengineering scenarios than in SSP5-8.5 is expected due to reduced surface warming towards SSP2-4.5 target climate conditions. However, we found that the two geoengineering scenarios have lower burned area and fire carbon emissions by the end of the century compared with not only their base-forcing scenario SSP5-8.5 but also the targeted-forcing scenario SSP2-4.5 (Fig. 2a, c; see Table S3 for the averages of regional and global annual projected burned area, in Mha yr−1, and fire carbon emissions in 2091–2100 under different scenarios). The change in the two geoengineering scenarios compared with SSP2-4.5 in the last decade of the century is small with respect to burned area (−2 % for G6solar and −12 % for G6sulfur) but relatively large with respect to fire carbon emissions (−18 % for G6solar and −23 % for G6sulfur). However, when compared with SSP5-8.5, the reduction in the two geoengineering scenarios with respect to burned area (−18 % for G6solar and −26 % for G6sulfur) is similar to that in fire carbon emissions (−20 % for G6solar and −26 % for G6sulfur). This implies that the difference in fire carbon emissions between the two geoengineering scenarios and SSP2-4.5 is less driven by burned area and that fuel availability plays a more important role in this comparison, whereas changes in burned area play more of a role in emission differences with respect to the difference to SSP5-8.5. The two geoengineering approaches (G6solar and G6sulfur) generally lead to reduced fire activity compared with SSP5-8.5 in most regions in 2091–2100, except for Northern Hemisphere Africa and equatorial Asia (Figs. S3, S4). When comparing the period 2091–2100 to the period 2021–2030, the largest decrease in global total wildfire burned area is seen in the G6sulfur scenario among all of the scenarios in this study ( %; see Table S2).
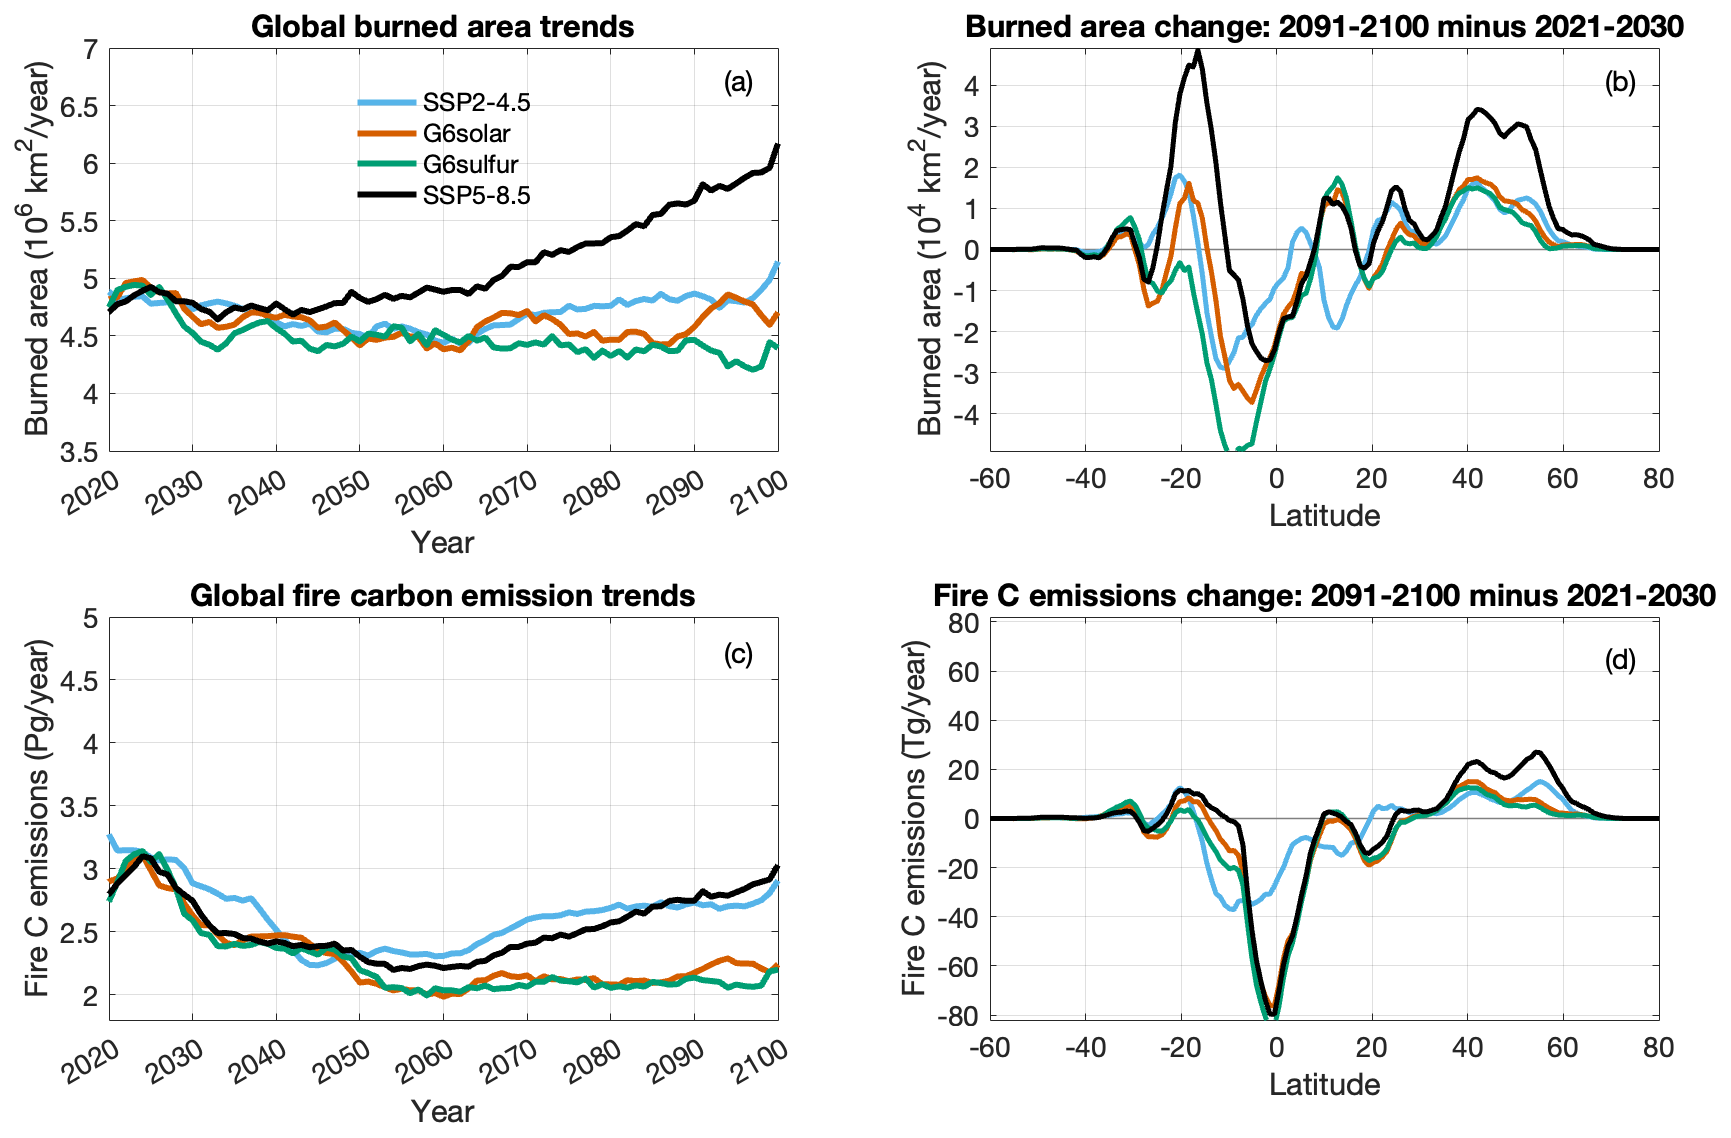
Figure 2Overall global burned area and fire carbon emission trends and changes under the G6sulfur and G6solar geoengineering scenarios relative to SSP2-4.5 and SSP5-8.5. (a) Time series of global burned area from 2020 to 2100 under the G6sulfur, G6solar, SSP2-4.5, and SSP5-8.5 scenarios (represented by different colors). The time series are shown as 5-year moving averages. (b) Zonal changes (absolute value) of burned area in the 2091–2100 period relative to the 2021–2030 period (calculated by the value in 2091–2100 minus the value in 2021–2030), under the G6sulfur, G6solar, SSP2-4.5, and SSP5-8.5 scenarios (represented by different colors – color code is the same as it in panel a). A 5∘ moving average was applied to the shown zonal changes. Panels (c) and (d) are similar to panels (a) and (b), respectively, but for fire carbon emissions.
In the 40–70∘ N latitude band, the burned area consistently increases under not only all of the SSP scenarios but also the two geoengineering scenarios when comparing the 2091–2100 period to the 2021–2030 period (Fig. 2b). However, the increase in burned area is lower in the two geoengineering scenarios compared with SSP5-8.5 and is similar to the SSP2-45 scenario. In the −20∘ S to 0∘ latitude band, the reduction in burned area is larger under G6sulfur than that under G6solar (Fig. 2b). Generally, G6sulfur has a stronger fire-reducing effect than G6solar, with exceptions such as over Europe. We also found notable differences between the two geoengineering methods for some specific regions, implying that the geoengineering method chosen could be inequitable for some countries. For example, G6solar is the better choice for producing less burned area in Europe, whereas G6sulfur is better than G6solar over Southern Hemisphere Africa (see Fig. S4).
The two SSP5-8.5-based geoengineering scenarios successfully reduce the radiative forcing from 8.5 W m−2 (as in SSP5-8.5) to 4.5 W m−2 (as in SSP2-4.5) in 2100, and the global surface temperatures between SSP2-4.5 and the two geoengineering scenarios are nearly the same. However, both geoengineering scenarios produce less fire than SSP2-4.5 by 2100 (Figs. 2, 3). There are different processes involved in the cooling in G6sulfur (due to the stratospheric sulfate aerosols) and the cooling in G6solar (due to directly reduced insolation) (Visioni et al., 2021b). Because of the difference in the resulting climate response, these two geoengineering approaches impact fires differently, even though they are designed to achieve the same forcing level by 2100. Previous studies have indicated that stratospheric heating caused by aerosols can impact precipitation and temperature at the surface through alterations to stratospheric dynamics (Jiang et al., 2019; Simpson et al., 2019; Richter et al., 2017; Visioni et al., 2020). Last but not least, the two geoengineering approaches also result in different outcomes for other quantities important for fires. For example, an enhanced stratospheric aerosol burden results in changes in direct to diffuse light which promotes plant growth (e.g., Xia et al., 2017; Xu et al., 2020). On the other hand, it can reduce the hydrological cycle and regional precipitation changes due to the aerosol heating effects in the lower tropical stratosphere (e.g., Tilmes et al., 2013; Simpson et al., 2019).

Figure 3Fractional burned area (% yr−1) and fire carbon emissions (gC m−2 yr−1) averaged for 2091–2100. (a) Spatial distribution of fractional burned area (% yr−1) averaged for 2091–2100 under SSP5-8.5. Results are not shown for model grids where the fractional burned area equals zero. The difference in fractional burned area (b) between SSP2-4.5 and SSP5-8.5, (c) between G6solar and SSP5-8.5, and (d) between G6sulfur and SSP5-8.5 averaged for 2091–2100. Results are not shown for model grids where the difference in fractional burned area equals zero. Panels (e), (f), (g), and (h) are similar to panels (a), (b), (c), and (d), respectively, but for fire carbon emissions (gC m−2 yr−1). For a scenario with multiple simulations (i.e., SSP5-8.5, SSP2-4.5, G6sulfur, and G6solar), the simulation mean is shown.
Here, we analyze the key variables in the Earth system that are involved in these processes, from the reduced insolation at the top of the atmosphere and sulfate aerosols in the stratosphere to fires at the surface. Note that, hereafter, only the ensemble mean is analyzed and shown for a scenario with multiple ensemble members. The key variables shown in this section are selected by comparing the key variables that determine fire activity in the fire scheme in CESM2/CLM5 with the key climate variables that are impacted by geoengineering approaches. The analyses are conducted for 14 individual fire regions following Giglio et al. (2010), namely boreal North America, temperate North America, Central America, Northern Hemisphere South America, Southern Hemisphere South America, Europe, the Middle East, Northern Hemisphere Africa, Southern Hemisphere Africa, boreal Asia, Central Asia, Southeast Asia, equatorial Asia, and Australia and New Zealand (Fig. S3).
4.1 Surface temperature
Even though the mean surface temperature (TS) values for the whole globe and the land are similar under the two geoengineering scenarios and SSP2-4.5 (Fig. 4), regional differences exist (Fig. 5). For example, over equatorial Asia, the annual surface mean temperatures in the two geoengineering scenarios are consistently ∼0.3 K lower than that in SSP2-4.5 during 2091–2100 (Fig. S6). The spatial distribution of burned area difference and fire carbon emission difference between G6solar/G6sulfur and SSP5-8.5 (Fig. 3) are not always co-located with their spatial distribution of surface temperature difference (Fig. 5). To understand the extent to which the surface temperature drives fire activity change, we calculate correlations of surface temperature change and burned area/fire carbon emission change for individual fire regions under SSP2-4.5, G6solar, and G6sulfur. Surface temperature change (ΔTS) for a given region is calculated based on the individual model grids within the region and annual values between 2091 and 2100. It is defined as the difference between the analyzed scenario (i.e., G6solar, G6sulfur, and SSP2-4.5) and the reference scenario (i.e., SSP5-8.5). Burned area change (ΔBA) and fire carbon emission change (ΔCemis) are defined in the same way. For example, if a region consists of 500 individual model grids, as we use 10 years of annual data, there will be 5000 (500×10) pairs of ΔTS and ΔBA to calculate correlations. The correlations calculated here account for spatial variability within the region and interannual variability during 2091–2100.
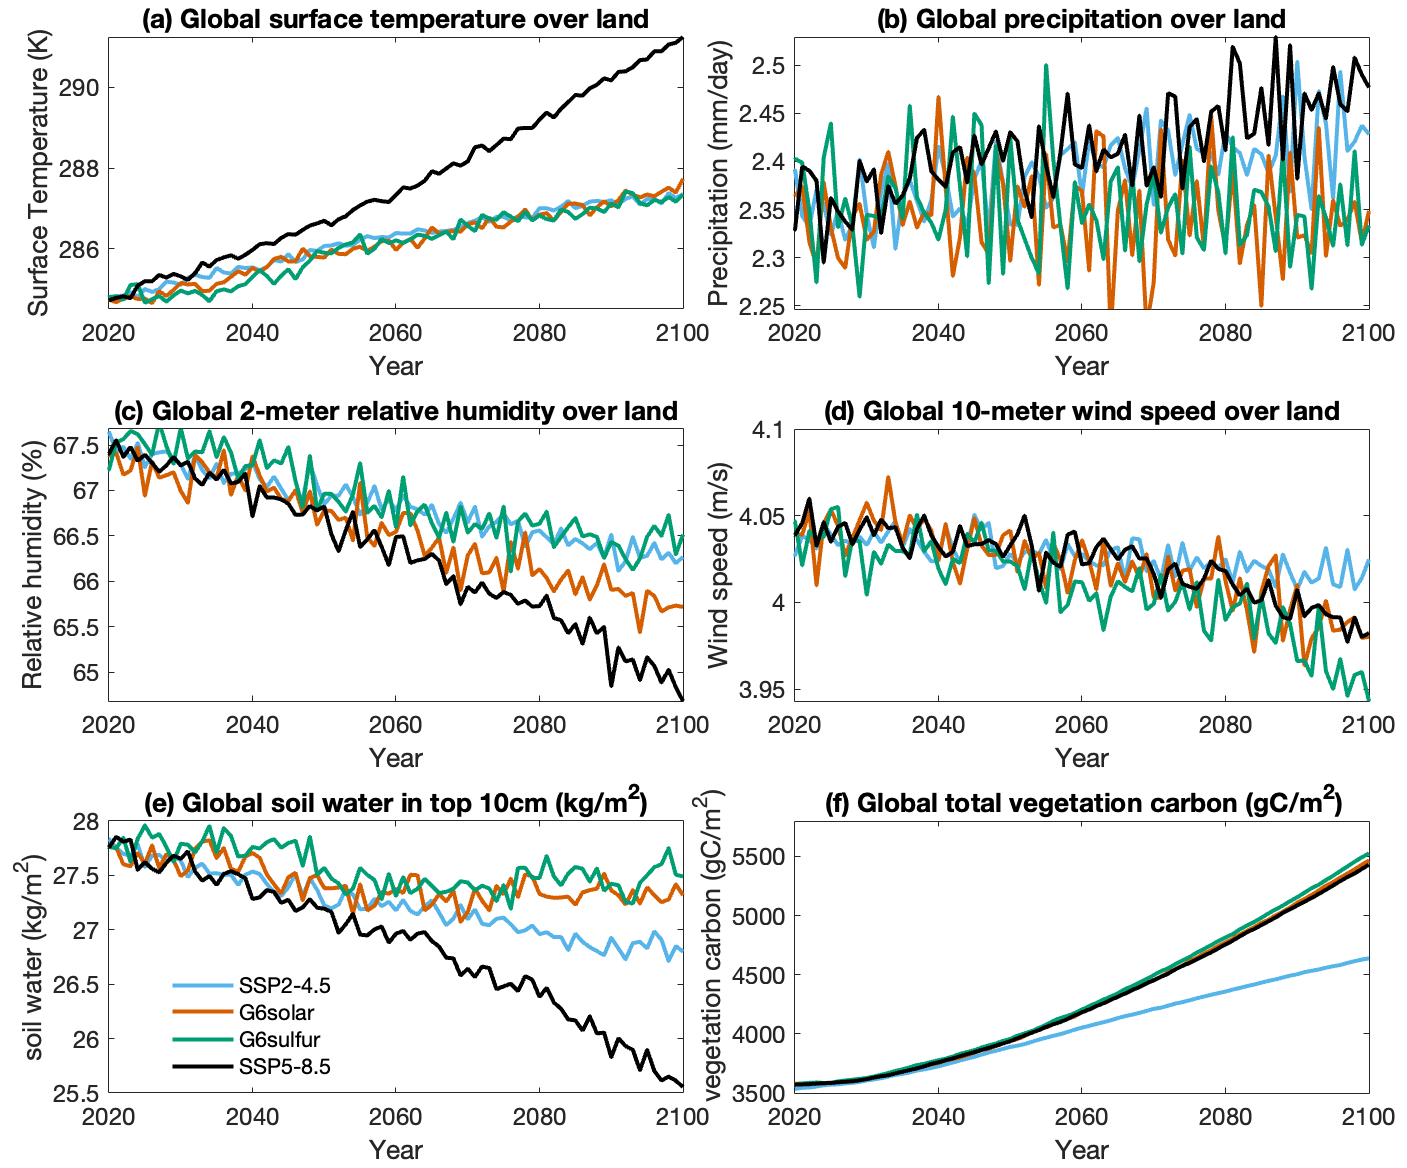
Figure 4Time series of mean (a) surface temperature (K), (b) precipitation (mm d−1) over land, (c) 2 m relative humidity (%) over land, (d) 10 m wind speed (m s−1) over land, (e) soil water content in the top 10 cm (kg m−2), and (f) vegetation carbon excluding the carbon pool (gC m−2). For a scenario with multiple simulations (i.e., SSP5-8.5, SSP2-4.5, G6sulfur, and G6solar), the simulation mean is shown.
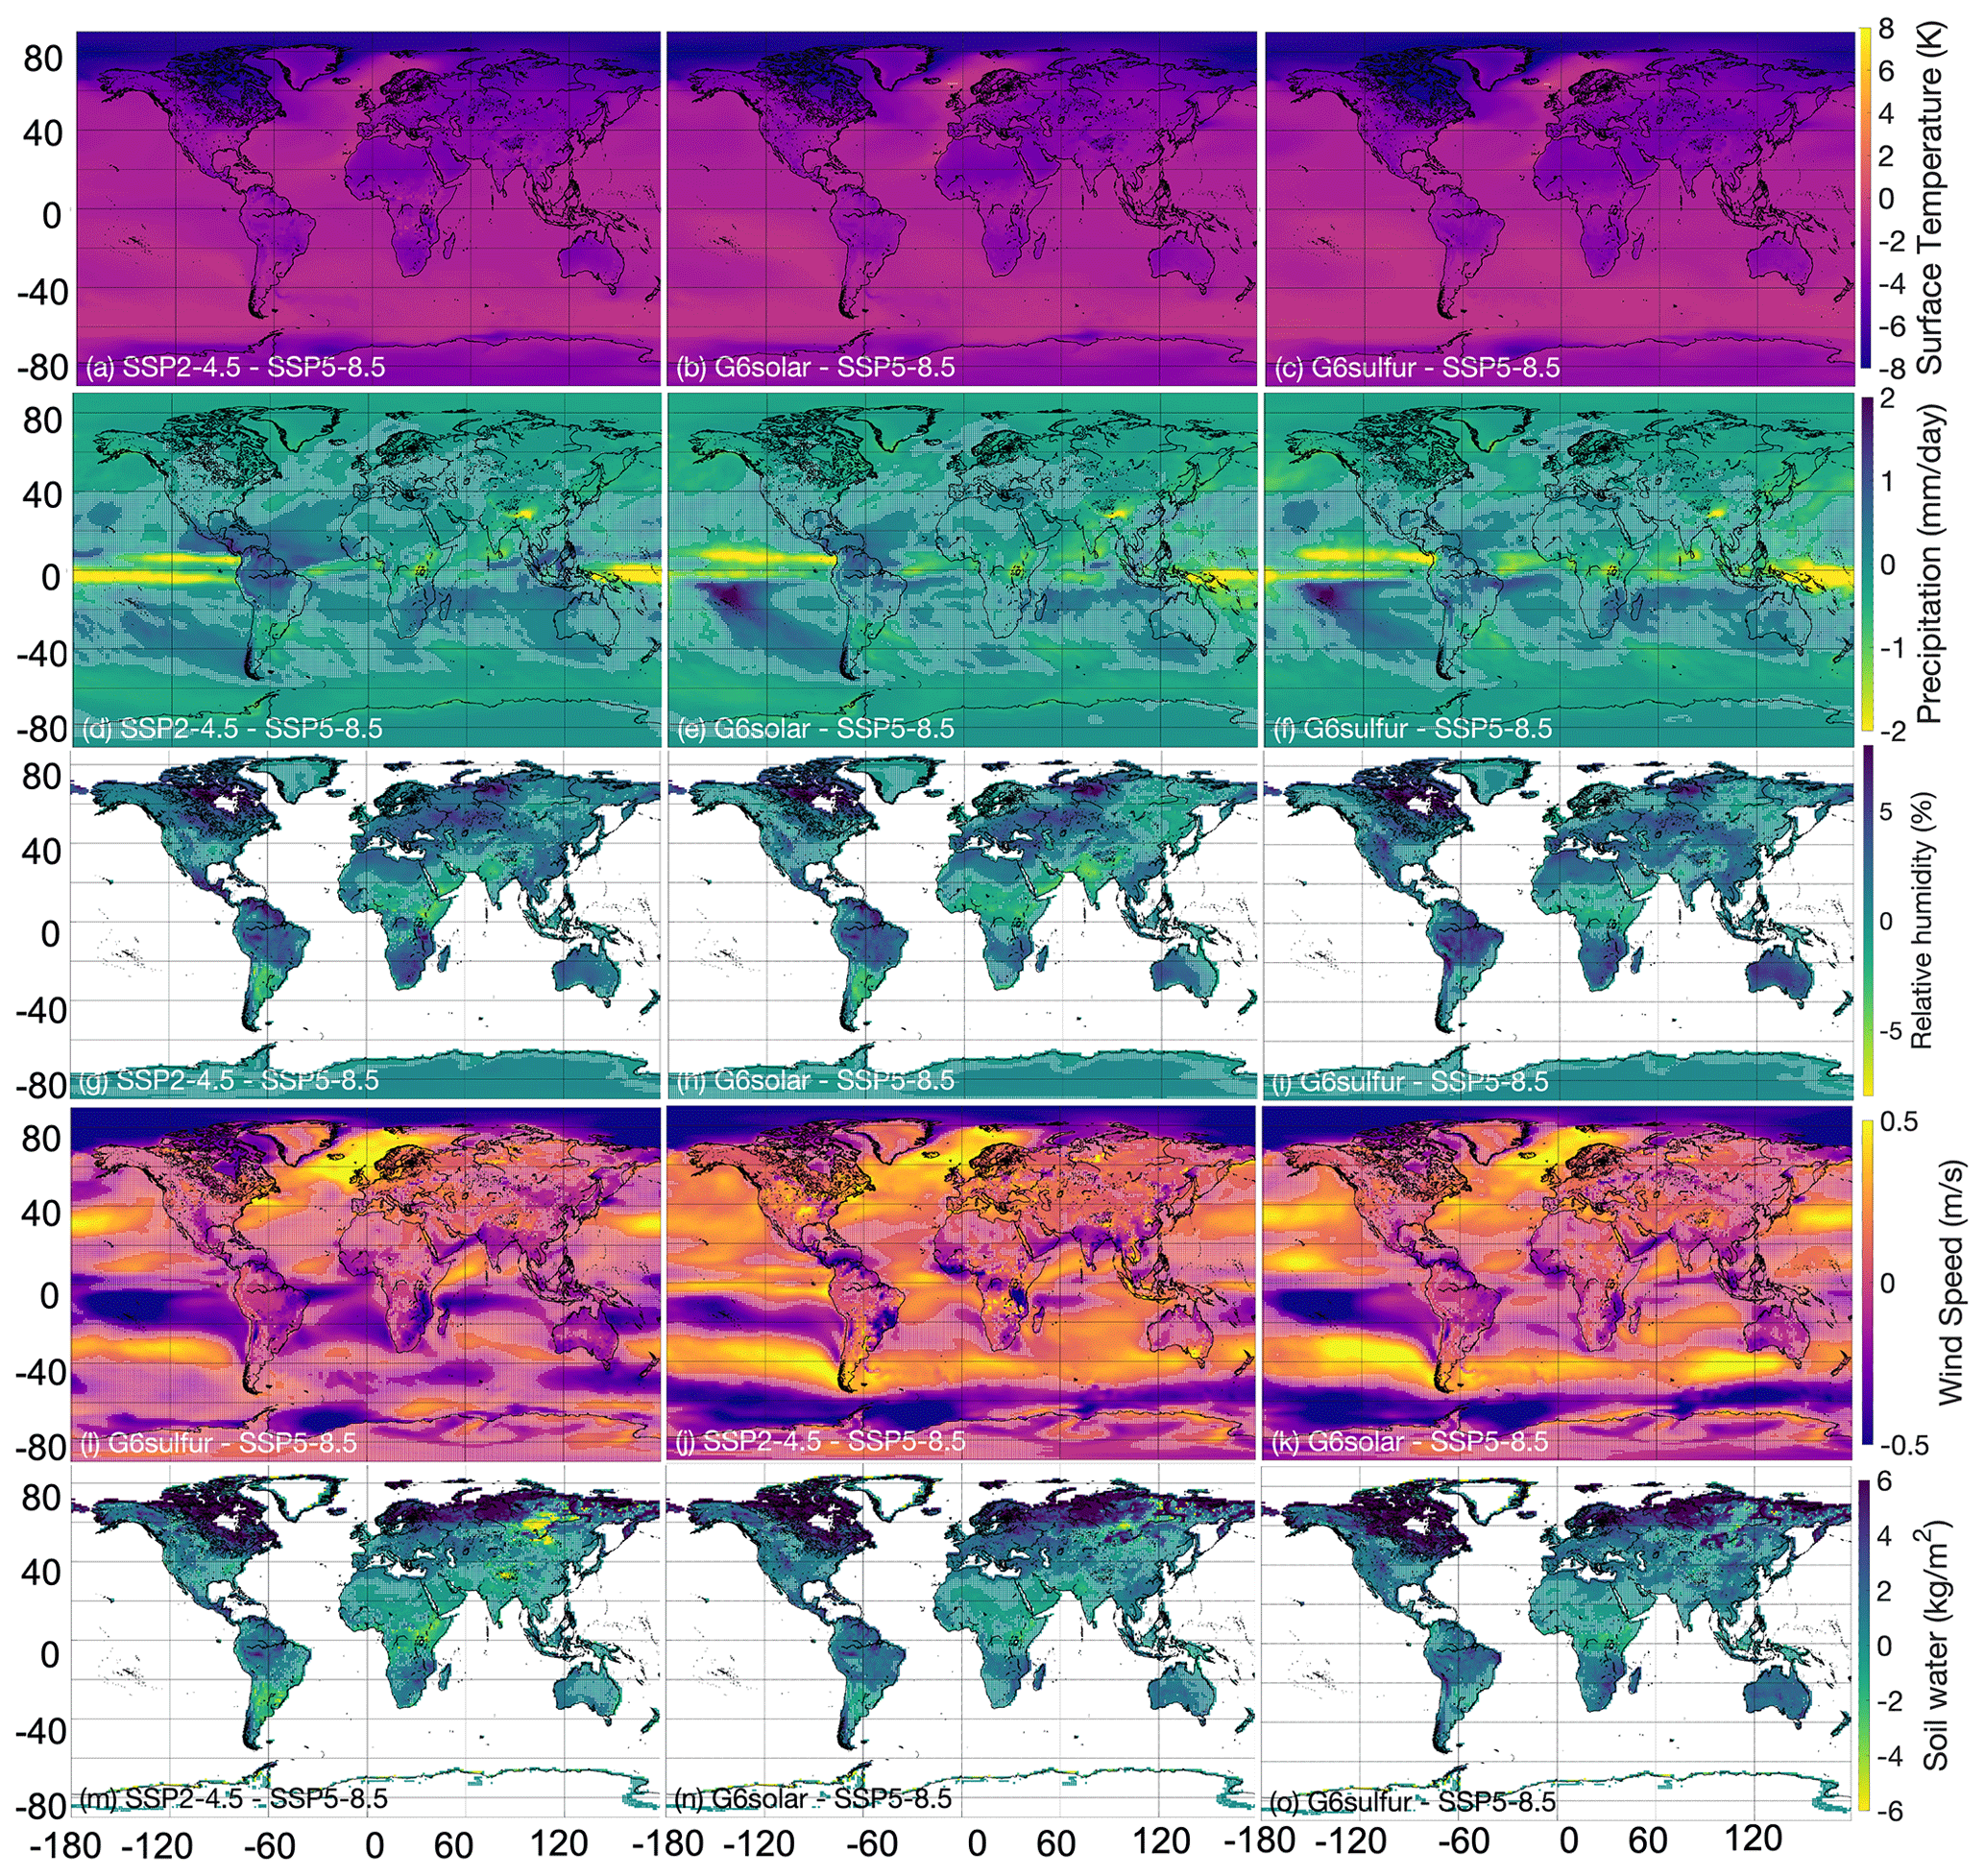
Figure 5The difference in surface temperature (K) (a) between SSP2-4.5 and SSP5-8.5, (b) between G6solar and SSP5-8.5, and (c) between G6sulfur and SSP5-8.5 averaged for 2091–2100. Panels (d), (e), and (f) are the same as panels (a), (b), and (c), respectively, but for precipitation (mm d−1). Panels (g), (h), and (i) are the same as panels (a), (b), and (c), respectively, but for 2 m relative humidity (%). Panels (j), (k), and (l) are the same as panels (a), (b), and (c), respectively, but for 10 m wind speed (m s−1). Panels (m), (n), and (o) are the same as panels (a), (b), and (c), respectively, but for soil water content in the top 10 cm (kg m−2). The grids in which SSP2-4.5, G6sulfur, or G6solar is not significantly different from SSP5-8.5 are marked with white shading. Taking the precipitation of SSP2-4.5 as an example, the significance for each model grid is calculated with a Student t test (p value is 0.1) using 10 years of SSP2-4.5 precipitation data during 2091–2100 (10 data points) and 10 years of SSP5-8.5 precipitation data during 2091–2100 (10 data points).
Overall, surface temperature plays a more important role in the decrease in fire activity in the two geoengineering scenarios compared with that in SSP2-4.5 relative to SSP5-8.5 (Fig. 6). This is expected because the only difference between the two geoengineering scenarios and SSP5-8.5 is the specific application of climate intervention; whereas the differences between SSP2-4.5 and SSP5-8.5 involve several other variations, including population growth and LULCC. For G6solar and G6sulfur, the strongest impact of surface temperature change on burned area occurs over Southern Hemisphere South America (correlation of 0.42 for G6solar and 0.45 for G6sulfur), followed by Southern Hemisphere Africa, temperate North America, and Europe. The impact of surface temperature change over boreal regions (boreal North America and boreal Asia) is relatively small. This suggests that the changes in burned area in these regions might be predominantly driven by other factors changed by geoengineering (e.g., hydrological cycle) rather than surface temperature changes, which will be analyzed in the following subsections. For G6solar and G6sulfur, the impact of surface temperature on burned area is generally larger than its impact on fire carbon emissions. This is expected, as fire carbon emissions in CESM2/WACCM6 are determined by burned area and vegetation characteristics (carbon density and combustion completeness; Li et al., 2012), which introduces more uncertainties. The only exception occurs over Northern Hemisphere South America: surface temperature plays a more important role in fire carbon emissions than burned area for not only G6solar (correlation of 0.37 versus 0.29) and G6sulfur (correlation of 0.37 versus 0.24) but also for SSP2-4.5 (correlation of 0.40 versus 0.23). Over Northern Hemisphere South America, the correlations between ΔTS and ΔBA/ΔCemis are also close under the three scenarios. As combustion completeness is a fixed parameter, this difference points to the possibility that reduced surface temperature has a larger impact on carbon density over Northern Hemisphere South America than over other regions.
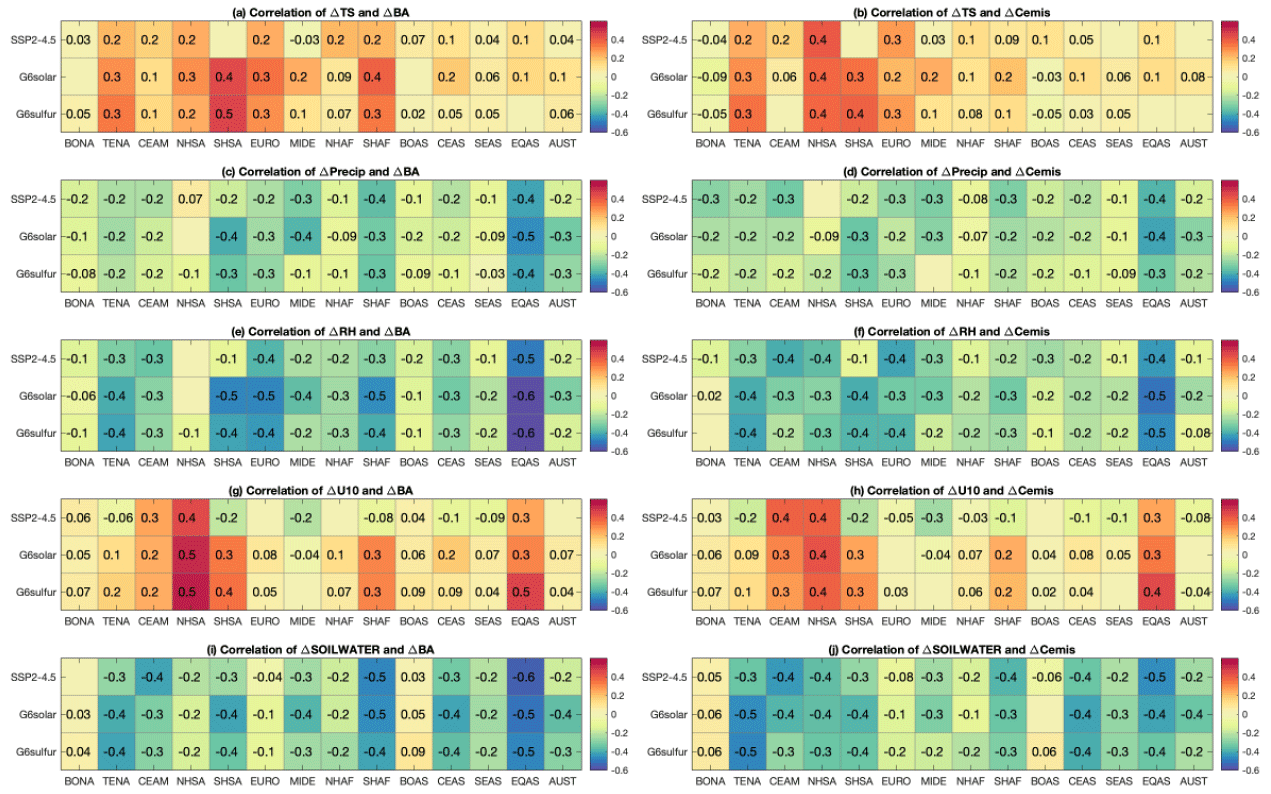
Figure 6Correlations of (a) surface temperature change (ΔTS) and burned area change for SSP2-4.5, G6solar, and G6sulfur and of (b) ΔTS and fire carbon emission change (ΔCemis) for SSP2-4.5, G6solar, and G6sulfur. Only correlations that are significant are labeled (p value =0.1). For SSP2-4.5, ΔTS is calculated for individual model grids within the region and for annual values. It is defined as TS of SSP2-4.5 minus TS of SSP5-8.5 (the reference case). For G6solar and G6sulfur, ΔTS is defined in the same way as SSP2-4.5. ΔBA and ΔCemis are defined in the same way as ΔTS. Panels (c) and (d) are the same as panels (a) and (b), respectively, but for precipitation change (ΔPrecip). Panels (e) and (f) are the same as panels (a) and (b), respectively, but for relative humidity change (ΔRH). Panels (g) and (h) are the same as panels (a) and (b), respectively, but for 10 m wind speed change (ΔU10). Panels (i) and (j) are the same as panels (a) and (b), respectively, but for the change in soil water content in the top 10 cm (ΔSOILWATER). Correlations are calculated for 14 fire regions (x axis), following Giglio et al. (2010), namely boreal North America (BONA), temperate North America (TENA), Central America (CEAM), Northern Hemisphere South America (NHSA), Southern Hemisphere South America (SHSA), Europe (EURO), the Middle East (MIDE), Northern Hemisphere Africa (NHAF), Southern Hemisphere Africa (SHAF), boreal Asia (BOAS), Central Asia (CEAS), Southeast Asia (SEAS), equatorial Asia (EQAS), and Australia and New Zealand (AUST). The definition of the regions can be found in Fig. S3.
Overall, we find that the surface temperature change introduced by the two geoengineering approaches (solar irradiance reduction and stratospheric sulfate aerosols) by the end of the century impacts burned area and fire carbon emissions (e.g., the introduced cooling results in lower fire activity). The degree of impact varies dramatically across different regions. The impact of surface temperature in G6solar and G6sulfur is close overall. However, surface temperature alone does not account for all of the changes in fire activity.
4.2 Precipitation
Precipitation change is also an important consequence of climate change and geoengineering (Fig. 4). Global precipitation is expected to increase under climate change, as higher tropospheric temperature leads to more moisture in the air. Previous studies have found that geoengineering could eliminate these increases in precipitation and could even reduce the global mean or regional precipitation relative to the target scenario, depending on the geoengineering approach (Tilmes et al., 2013; Simpson et al., 2019; Visioni et al., 2021b). The spatial distribution of precipitation changes under G6solar and G6sulfur relative to SSP5-8.5 are similar (Fig. 5). The trend in precipitation varies dramatically across regions (Fig. S7). Precipitation is also important for fires. Precipitation itself could have either a positive or a negative impact on future fires, as it can impact both fuel combustibility and fuel availability, which impact fires in opposite directions. In addition, precipitation changes can also lead to changes in relative humidity and soil water content, which are important factors for fires. Here, we apply the same analyses for precipitation change (ΔPrecip) as that used in Sect. 4.1 for surface temperature change (ΔTS).
The reduction in precipitation due to geoengineering has the opposite impact on fire to that of the reduction in surface temperature by geoengineering, as shown by the negative correlations of ΔPrecip and ΔBA/ΔCemis (Fig. 6). The correlations are consistently negative across all of the scenarios (G6solar, G6sulfur, and SSP2-4.5) and almost all regions. The largest impact of precipitation change occurs over equatorial Asia for all three scenarios (correlation is −0.45 to −0.42 for ΔBA and −0.43 to −0.33 for ΔCemis), which is aligned with the strong precipitation change over the region (Fig. 5). Over the Middle East, precipitation change has a relatively large impact on burned area and fire carbon emissions under G6solar as well as SSP2-4.5; however, the impact is small under G6sulfur. We note that, unlike the impact of ΔTS, the impact ΔPrecip is relatively large over boreal regions. We conduct a sensitivity test of a 1-year lag correlation (see Table S4 for the correlation values) to understand the impact of previous-year precipitation change on fire activity (e.g., calculating the correlation of ΔPrecip for 2091 and ΔBA/ΔCemis for 2092). We found that this correlation is still significant for most regions, although it is generally lower. Overall precipitation change is inversely related to burned area change and fire carbon emission change. Therefore, for these regions where precipitation is reduced compared with SSP5-8.5 as a consequence of geoengineering (such as equatorial Asia), the reductions in burned area and fire carbon emissions due to reduced surface temperature are offset to some extent.
4.3 Humidity
Humidity is also impacted by geoengineering. The future trends in specific humidity (g kg−1) and relative humidity (%) are the opposite of one another: specific humidity is projected to increase compared with SSP5-8.5, whereas relative humidity is projected to decrease compared with SSP5-8.5 (Fig. 4). Their spatial distribution and inter-scenario differences are also divergent (Figs. 4, 5). This is due to the fact that relative humidity is driven by not only the actual moisture content but also the temperature. The same amount of water vapor results in a higher relative humidity in colder air than in warm air. Therefore, a reduction in relative humidity in a warming climate indicates that the relative amount of water vapor has not increased proportional to the warming. Relative humidity is a driving variable in the CLM5 fire module in multiple places (e.g., lower relative humidity leads to higher fuel combustibility and larger fire spread). Here, we focus our analysis on the relative humidity change at 2 m (ΔRH), as relative humidity is directly used in the CLM5 fire module. Changes in relative humidity show a different spatial distribution between G6solar minus SSP5-8.5 and G6sulfur minus SSP5-8.5 (Fig. 5), although their global average values are close (Fig. 4).
The relative humidity change (ΔRH) is negatively correlated to ΔBA/ΔCemis across all scenarios and regions (Fig. 6). Therefore, the higher relative humidity in G6solar, G6sulfur, and SSP2-4.5 compared with SSP5-8.5 (Fig. 4) leads to less fire activity globally. Overall, the relative humidity change is more strongly correlated to ΔBA/ΔCemis, indicating that relative humidity change is a more important driver of fire activity change under geoengineering than surface temperature or precipitation.
4.4 Wind speed
Wind speed is another important driving factor in fire spread and is also indirectly impacted by geoengineering (Fig. 4). In CLM5, wind speed is used in the calculation of fire spread and, hence, burned area. Wind speed mainly has an indirect impact on fire carbon emissions via burned area. Here, we analyze the 10 m wind speed (U10). By the end of the century, SSP2-4.5 has slightly higher U10 than SSP5-8.5, G6solar has a similar U10 to SSP5-8.5, and G6sulfur has a slightly lower U10 than SSP5-8.5 over land (Fig. 4). Nevertheless, the regional difference can be relatively large (Fig. 5). G6sulfur and G6solar have a significantly different U10 over the Southern Hemisphere ocean (Fig. 5). However, the difference in U10 between G6solar and G6sulfur over land is relatively small with exceptions, such as over Australia and Northern Hemisphere Africa where G6sulfur has a lower U10.
Wind speed change has consistently positive correlations with changes in burned area and fire carbon emissions under the two geoengineering scenarios across all of the analyzed regions (which is not the case for SSP2-4.5, where ΔU10 is negatively correlated with ΔBA or ΔCemis over most regions). This indicates that the reduction in wind speed as a byproduct of geoengineering (Fig. 4) leads to less fire activity globally. The wind speed reduction is relatively large over South Hemisphere Africa (Fig. 5), and the correlations are also high, indicating that the wind speed reduction is partially responsible for the reduction in fire activity over South Hemisphere Africa.
4.5 Soil water content
Soil water content is a key driver of fire activity, as it impacts fuel combustibility and fire spread. Soil water content is indirectly impacted by the geoengineering approaches via the hydrological cycle. The precipitation changes as a result of geoengineering compared with SSP5-8.5 strongly impact the soil water content, and the soil water content further drives the relative humidity near the surface through evapotranspiration. We see a much smaller reduction in soil water content in the geoengineering runs compared with SSP2-45. Therefore, the future trends in soil water content (here we use the model variable SOILWATER_10CM, i.e., the soil water content in the top 10 cm, in kg m−2, to evaluate soil moisture) are close to the future trends in relative humidity (Fig. 4) globally. However, in the last decade of the century, the difference in soil water content among the scenarios is larger than the difference in relative humidity among the scenarios (the differences in the three scenarios from SSP5-8.5 are ∼ 1 %–2 % for relative humidity and ∼ 4 %–7 % for SOILWATER_10CM). Here, we include analyses of soil water content not only because it is a very important driver of fire activity but also because the spatial distributions of soil water change (ΔSOILWATER) can be different from relative humidity change in some regions (Fig. 5). Overall, similar to precipitation and relative humidity, soil water content change is negatively related to burned area and fire carbon emissions, with different spatial distributions (Fig. 6). For example, over the boreal regions and Europe, the impact of ΔSOILWATER is smaller than the impact of ΔRH, whereas it is larger over Central Asia.
4.6 Others
There are other relevant variables that are not analyze in detail here. For example, the reduction in the downwelling solar flux at the surface (ΔFSDS) is a direct consequence of geoengineering (solar irradiance reduction and stratospheric sulfate aerosols). In addition, water vapor content and cloud change as a consequence of geoengineering also impact downwelling solar flux at the surface. We include the analyses of downwelling solar flux in the Supplement (Figs. S8, S9), as the downwelling solar flux at the surface does not directly determine burned area nor fire carbon emissions in the model. The downwelling solar flux at the surface is positively related to burned area and fire carbon emissions. Therefore, the lower downwelling solar flux at the surface compared with SSP5-8.5 as a result of the geoengineering approaches leads to less fires globally, whereas the higher downwelling solar flux at the surface under SSP2-4.5 compared with SSP5-8.5 tends to increase fire activity and can offset the overall reduction of fires in SSP2-4.5 compared with SSP5-8.5 to some degree. As another example, vegetation carbon can also impact the total fire carbon emissions and is impacted by fire activity. However, we do not further analyze the impact of fuel load, as geoengineering approaches do not seem to change global total fuel load significantly. The future trends in total vegetation carbon under G6solar and G6sulfur are very close to SSP5-8.5, and the three aforementioned scenarios are different from SSP2-4.5, as total vegetation carbon is largely driven by CO2 (Fig. 4).
4.7 G6sulfur versus G6solar
Comparisons between G6sulfur and G6solar provide insight into the potential impact of stratospheric sulfate aerosols on fires other than the intended climate intervention. In general, using sulfur to create climate control enhances the effect of the solar management on the modeled fire response. While both geoengineering approaches show the strongest inverse relationships between fire parameters and relative humidity and soil moisture, G6sulfur shows smaller reductions in these climate variables than G6solar. Globally, G6sulfur has less burned area and lower fire carbon emissions than G6solar by the end of the century. The differences between G6sulfur and G6solar vary regionally (Fig. 7a, b). For example, over most regions, G6sulfur has less fire activity than G6solar, although G6sulfur has more fire activity than G6solar over Europe, which is related to the warming over northern Eurasia caused by G6sulfur (Fig. 7c) and a positive correlation between BA and surface temperature over Europe. However, we note that two ensemble members may not fully reflect the robust signal. The spatial distributions of differences between G6sulfur and G6solar with respect to burned area and fire carbon emissions (Fig. 7a, b) are close to the spatial distributions of difference between G6sulfur and G6solar with respect to relative humidity (Fig. 7e) and soil water content (Fig. 7g). G6sulfur has a higher relative humidity and soil water content over most regions. Over Europe, however, the relative humidity and soil water content in G6sulfur are lower than those in G6solar, which is consistent with what has been found regarding burned area and fire carbon emissions. Over South America, in addition, the distribution of the difference in relative humidity and soil water content is similar to the distribution of the difference in burned area and fire carbon emissions. This indicates that the differences in future fire activity between the two geoengineering approaches is likely driven by relative humidity and soil water content.

Figure 7The difference between G6sulfur and G6solar with respect to (a) burned area fraction (BA; % yr−1), (b) fire carbon emissions (Cemis; gC m−2 yr−1), (c) surface temperature (TS; K), (d) precipitation (Precip; mm d−1), (e) 2 m relative humidity (RH; %), (f) 10 m wind speed (U10; m s−1), (g) soil water content in the top 10 cm (SOILWATER; kg m−2), and (h) downwelling solar flux at the surface (FSDS; W m−2) averaged for 2091–2100. The grids in which SSP2-4.5, G6sulfur, or G6solar is not significantly different from SSP5-8.5 are marked with white shading. Taking the precipitation of SSP2-4.5 as an example, the significance for each model grid is calculated with a Student t test (p value is 0.1) using 10 years of SSP2-4.5 precipitation data during 2091–2100 (10 data points) and 10 years of SSP5-8.5 precipitation data during 2091–2100 (10 data points).
A summary of the relationships between ΔBA and the changes in the related variables (ΔTS, ΔPrecip, ΔRH, ΔU10, ΔSOILWATER, and ΔFSDS) for G6sulfur versus G6solar is shown in Fig. 8. (Note that ΔBA and the change in other variables are calculated by the difference in the geoengineering run from the reference case, i.e., SSP5-8.5.) Overall, the impacts of these driving variables are similar in the two geoengineering approaches (as the points fall close to the diagonal). However, these variables generally have larger impacts on burned area in G6solar than in G6sulfur (as the majority of the points fall in the shaded area where the x-axis value is larger than the y-axis value). It is possible that stratospheric sulfate aerosols could yield additional changes, such as higher diffuse radiation that benefits plant growth, thereby reducing the correlations of the analyzed factors with fires.

Figure 8Correlations between burned area change in G6solar from SSP5-8.5 (ΔBA) with the change in other variables in G6solar from SSP5-8.5 (x axis) versus correlations between burned area change in G6sulfur from SSP5-8.5 (ΔBA) with the change in other variables in G6sulfur from SSP5-8.5 (y axis). The variables shown here are surface temperature change (ΔTS), precipitation change (ΔPrecip), 2 m relative humidity change (ΔRH), 10 m wind speed change (ΔU10), soil water content in the top 10 cm change (ΔSOILWATER), and downwelling solar flux at the surface change (ΔFSDS). All “changes” refer to 2091–2100 averages. The numbers labeled in the figure correspond to the following regions: 1 – boreal North America, 2 – temperate North America, 3 – Central America, 4 – Northern Hemisphere South America, 5 – Southern Hemisphere South America, 6 – Europe, 7 – the Middle East, 8 – Northern Hemisphere Africa, 9 – Southern Hemisphere Africa, 10 – boreal Asia, 11 – Central Asia, 12 – Southeast Asia, 13 – equatorial Asia, and 14 – Australia and New Zealand. The definitions of the regions can be found in Fig. S3. The shading highlights that the correlation with ΔBA is larger than the correlation with ΔCemis. The reader is referred to Fig. S13 for plots with the variables presented separately.
4.8 Discussion
The key finding of this study is that fire burned area and emissions are lower in the geoengineering runs than in both the SSP5-8.5 run and the target SSP2-4.5 run in CESM2/WACCM6. Here, we analyze the key climate variables that are largely and/or directly impacted by the two geoengineering approaches and are important drivers of fires. A summary of the relationships between ΔBA and the change in the related variables (ΔTS, ΔPrecip, ΔRH, ΔU10, ΔSOILWATER, and ΔFSDS) versus the relationships between ΔCemis and the change in the related variables for G6solar, G6sulfur, and SSP2-4.5 are shown in Fig. 9. The future trends in the analyzed variables and their changes from SSP5-8.5 can be the opposite over different regions. However, the directions of impact (i.e., positive or negative correlation) are consistent overall across the 14 fire regions and three scenarios. Therefore, the dominant factors are also different across regions.
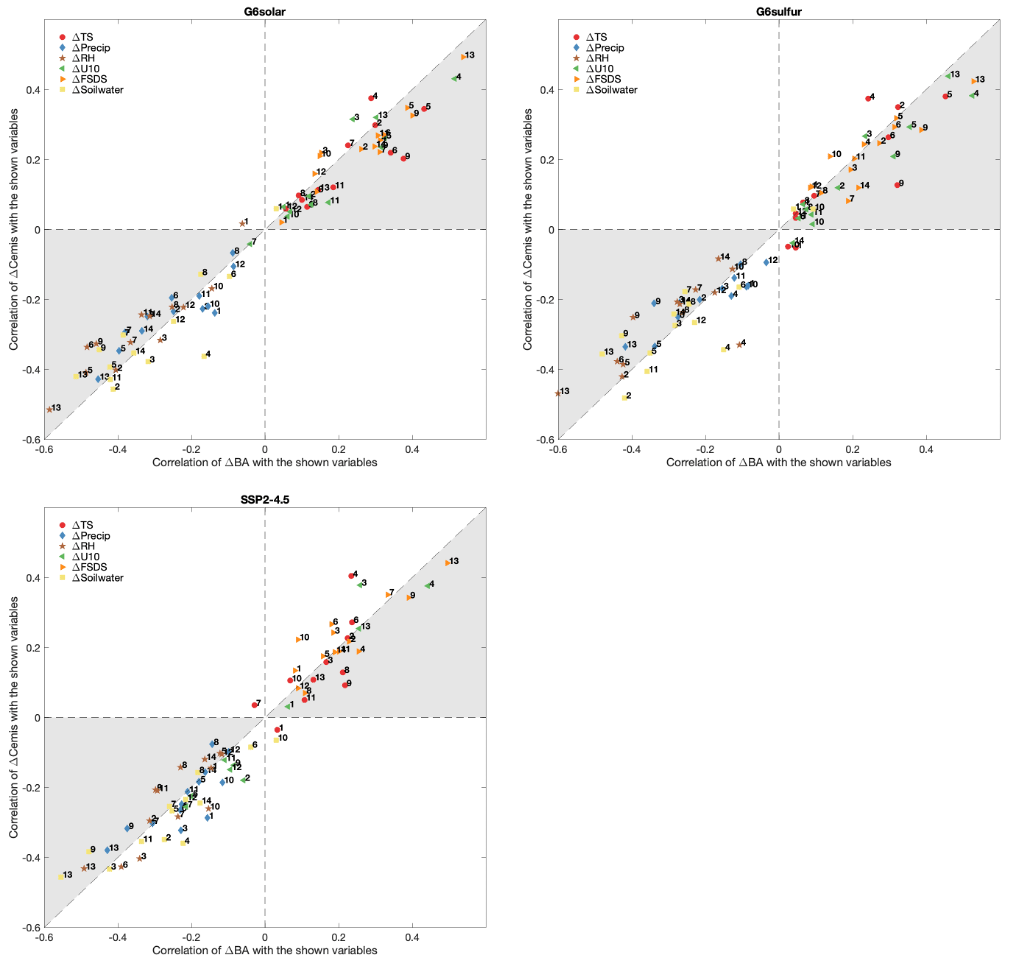
Figure 9(a) Correlations between burned area change in G6solar from SSP5-8.5 (ΔBA) with the change in other variables in G6solar from SSP5-8.5 (x axis) versus correlations between fire carbon emission change in G6solar from SSP5-8.5 (ΔCemis) with the change in other variables in G6solar from SSP5-8.5 (y axis). The variables shown here are surface temperature change (ΔTS), precipitation change (ΔPrecip), 2 m relative humidity change (ΔRH), 10 m wind speed change (ΔU10), soil water content in the top 10 cm change (ΔSOILWATER), and downwelling solar flux at the surface change (ΔFSDS). All “changes” refer to 2091–2100 averages. The numbers labeled in the figure correspond to the following regions: 1 – boreal North America, 2 – temperate North America, 3 – Central America, 4 – Northern Hemisphere South America, 5 – Southern Hemisphere South America, 6 – Europe, 7 – the Middle East, 8 – Northern Hemisphere Africa, 9 – Southern Hemisphere Africa, 10 – boreal Asia, 11 – Central Asia, 12 – Southeast Asia, 13 – equatorial Asia, and 14 – Australia and New Zealand. The definitions of the regions can be found in Fig. S3. The shading highlights that the correlation with ΔBA is larger than the correlation with ΔCemis. Panel (b) is the same as panel (a) but for G6sulfur. Panel (c) is the same as panel (a) but for SSP2-4.5. The reader is referred to Figs. S14, S15, and S16 in the Supplement for plots with the variables presented separately.
Under both geoengineering scenarios, we note that changes in relative humidity, soil water, and downwelling solar flux at the surface all have the strongest impacts over equatorial Asia (as shown by strongest correlations among the 14 regions; Fig. 9). Changes in wind speed and precipitation also have relative strong impacts over equatorial Asia compared with other regions. Overall, equatorial Asia is the most sensitive to the climate variable changes introduced by both geoengineering approaches (Fig. 9), although the resulting fire activity changes over equatorial Asia are not as strong as some other regions (Fig. 3), which is likely due to the relatively weak change in the climate variables (e.g., Fig. 5). On the contrary, boreal North America is not sensitive to most of the climate variable changes introduced by both geoengineering approaches (the correlations are the lowest and close to zero; Fig. 9), which is likely the reason why the 40–70∘ N latitude band is the only latitude band in which the zonal mean burned area consistently increases, even under the geoengineering scenarios (Figs. 1, 2). Boreal Asia is similar to boreal North America with respect to the correlations being slightly stronger overall.
For G6solar and G6sulfur, the correlations of the shown variables (especially for ΔTS, ΔRH, ΔU10, and ΔFSDS) with burned area are generally stronger than their correlations with fire carbon emissions (as shown by more data points falling into the shaded area). This is expected because these variables directly impact burned area, whereas fire carbon emissions are determined by both burned area and fuel availability. Fuel availability is further directly or indirectly impacted by many variables, including but not limited to those shown here. Therefore, the correlations between the shown variables and fire carbon emissions are not as strong as their correlations with burned area. The patterns in G6solar and G6sulfur are closer to each other when using SSP2-4.5 as a reference (Fig. 6). This is not only because their approaches to reducing forcing from SSP5-8.5 to 4.5 W m−2 are different but also because the scenario configuration of SSP2-4.5 is different from SSP5-8.5 and SSP5-8.5-based G6solar and G6sulfur (e.g., LULCC).
The analyses above (Sect. 4.1–4.7) use SSP5-8.5 as the reference case to calculate the changes (Δ), as the two geoengineering scenarios are based on SSP5-8.5 and their difference is only due to the geoengineering approaches. Here, we also include analyses that uses the target SSP2-4.5 as the reference case in the Supplement (Fig. S12). The signs of the correlations are generally consistent, regardless of whether SSP5-8.5 or SSP2-4.5 is used as the reference case (Figs. S11, S12). For example, although relative humidity change from SSP2-4.5 is very different regionally under G6solar and G6sulfur (Fig. 5), the signs of the correlations are consistently negative over all regions and under the two geoengineering scenarios. In general, the impacts of the analyzed variables on changes in the burned area and fire carbon emissions from SSP2-4.5 are weaker (Figs. S11, S12), likely due to the fact that the changes (Δ) between the two geoengineering scenarios and SSP2-4.5 are due not only to geoengineering-introduced climate variable changes (e.g., surface temperature, relative humidity, and soil water content) but also to other factors, such as atmospheric CO2 and LULCC.
4.9 Uncertainty and limitations
We recognize that there are several limitations to this study. For example, even though CESM2 is a state-of-the-art model, uncertainties and limitations exist in the model parameterizations (including the parameterization of fire-related processes and the lack of interactive fire emissions). In addition, the fire emissions of trace gases and aerosols are not fully coupled, as CESM2 uses the CMIP6 fire emission inventories. This study analyzes results from only one model (CESM2), and similar studies need to be conducted with other models to test inter-model consistency. Lastly, there are only two ensemble members in each geoengineering scenario, which can lead to larger variability at the regional scale and can specifically result in large uncertainties in the effect of geoengineering on rainfall, with implications for other relevant variables. While large-scale changes are significant, a larger ensemble size in future work would reduce uncertainties in the regional results. More studies are needed to fully understand the future trends in fires and the impact of geoengineering on fires.
Here, we analyzed future fires under geoengineering and SSP scenarios and assessed how the different geoengineering approaches impact fires. The major conclusions and implications are as follows:
-
The global total wildfire burned area is projected to increase under the unmitigated scenario (SSP5-8.5) and decrease under the two geoengineering scenarios (solar irradiance reduction and stratospheric sulfate aerosols) based on a comparison of the averages of 2091–2100 relative to 2021–2030.
-
By the end of the century, the two geoengineering scenarios exhibit lower burned area and fire carbon emissions than not only their base-forcing scenario (SSP5-8.5) but also the targeted-forcing scenario (SSP2-4.5).
-
The two geoengineering approaches (solar irradiance reduction and stratospheric sulfate aerosols) generally lead to less wildfire activity in most regions in 2091–2100, except for Northern Hemisphere Africa and equatorial Asia. The 40–70∘ N latitude band is the only latitude band in which the zonal mean burned area consistently increases under all of the scenarios, even the geoengineering scenarios.
-
Overall, changes in G6solar and G6sulfur from SSP5-8.5 with respect to surface temperature, wind speed, and downwelling solar flux at the surface are positively correlated to the changes in burned area and fire carbon emissions, whereas their changes in precipitation, relative humidity, and soil water content are negatively correlated to the changes in burned area and fire carbon emissions.
-
Generally, the stratospheric sulfate aerosols approach has a stronger fire-reducing effect than the solar irradiance reduction approach. The impacts of the analyzed variable changes are generally larger (percent-wise) on burned area than fire carbon emissions.
-
Geoengineering-imposed reductions in surface temperature and wind speed and geoengineering-imposed increases in relative humidity and soil moisture reduce fires by the end of the century. However, the reduction in precipitation resulting from geoengineering offsets its overall fire-reducing effect to some extent.
The success of future fire mitigation with the two geoengineering approaches based on the CESM2/WACCM6 model results is encouraging. However, this study is not a closure study due to the uncertainties and limitations (Sect. 4.9). More research is needed on this topic. Here, we do not indicate that fewer fires under the geoengineering approaches are definitively beneficial. After all, fire is a natural process and a key component of the dynamic Earth system, and wildfires were present long before anthropogenic activity. Lastly, fire risk increase is only one of many possible consequences of climate change, and fire activity reduction is also only one of many possible consequences of climate intervention. We present this study only as a reference for the future when geoengineering is considered.
The model source ID is CESM2-WACCM for CESM2-WACCM6. FINN2.5 data are available at https://doi.org/10.5065/XNPA-AF09 (Wiedinmyer and Emmons, 2022). GFED data are available at https://doi.org/10.3334/ORNLDAAC/1293 (Randerson et al., 2018).
The supplement related to this article is available online at: https://doi.org/10.5194/acp-23-5467-2023-supplement.
WT led the analysis with contributions from ST. ST and DML contributed to the interpretation of the model results. WT prepared the paper with improvements from ST, DML, FL, CH, LKE, RRB, and LX.
At least one of the (co-)authors is a member of the editorial board of Atmospheric Chemistry and Physics. The peer-review process was guided by an independent editor, and the authors also have no other competing interests to declare.
Publisher’s note: Copernicus Publications remains neutral with regard to jurisdictional claims in published maps and institutional affiliations.
This material is based upon work supported by the National Center for Atmospheric Research, which is a major facility sponsored by the National Science Foundation under Cooperative Agreement No. 1852977. Wenfu Tang was supported by a NCAR Advanced Study Program Postdoctoral Fellowship. We thank the reviewers for their helpful comments that improved this paper. Wenfu Tang is grateful to Wangcai Bao (Syrian hamster; 8 September 2020–22 July 2022) for his support during the pandemic.
Wenfu Tang was supported by a NCAR Advanced Study Program Postdoctoral Fellowship.
This paper was edited by Dominick Spracklen and reviewed by two anonymous referees.
Abatzoglou, J. T., Williams, A. P., and Barbero, R.: Global Emergence of Anthropogenic Climate Change in Fire Weather Indices, Geophys. Res. Lett., 46, 326–336, https://doi.org/10.1029/2018GL080959, 2019.
Andreae, M. O. and Merlet, P.: Emission of trace gases and aerosols from biomass burning, Global Biogeochem. Cy., 15, 955–966, 2001.
Bala, G., Duffy, P. B., and Taylor, K. E.: Impact of geoengineering schemes on the global hydrological cycle, P. Natl. Acad. Sci. USA, 105, 7664–7669, https://doi.org/10.1073/pnas.0711648105, 2008.
Bowman, D. M. J. S., Balch, J. K., Artaxo, P., Bond, W. J., Carlson, J. M., Cochrane, M. A., D'Antonio, C. M., DeFries, R. S., Doyle, J. C., Harrison, S. P., Johnston, F. H., Keeley, J. E., Krawchuk, M. A., Kull, C. A., Marston, J. B., Moritz, M. A., Prentice, I. C., Roos, C. I., Scott, A. C., Swetnam, T. W., van der Werf, G. R., and Pyne, S. J.: Fire in the Earth System, Science, 324, 481–484, https://doi.org/10.1126/science.1163886, 2009.
Bowman, D. M., Kolden, C. A., Abatzoglou, J. T., Johnston, F. H., van der Werf, G. R., and Flannigan, M.: Vegetation fires in the Anthropocene, Nature Reviews Earth & Environment, 1, 500–515, https://doi.org/10.1038/s43017-020-0085-3, 2020.
Chen, Y., Morton, D. C., Andela, N., Van Der Werf, G. R., Giglio, L., and Randerson, J. T.: A pan-tropical cascade of fire driven by El Niño/Southern Oscillation, Nat. Clim. Change, 7, 906–911, https://doi.org/10.1038/s41558-017-0014-8, 2017.
Coen, J., Cameron, M., Michalakes, J., Patton, E., Riggan, P., and Yedinak, K.: WRF-Fire: Coupled weather-wildland fire modeling with the Weather Research and Forecasting model, J. Appl. Meteorol. Clim., 52, 16–38, https://doi.org/10.1175/JAMC-D-12-023.1, 2013.
Danabasoglu, G., Lamarque, J. F., Bacmeister, J., Bailey, D. A., DuVivier, A. K., Edwards, J., Emmons, L. K., Fasullo, J., Garcia, R., Gettelman, A., Hannay, C., Holland, M. M., Large, W. G., Lauritzen, P. H., Lawrence, D. M., Lenaerts, J. T. M., Lindsay, K., Lipscomb, W. H., Mills, M. J., Neale, R., Oleson, K. W., OttoBliesner, B., Phillips, A. S., Sacks, W., Tilmes, S., van Kampenhout, L., Vertenstein, M., Bertini, A., Dennis, J., Deser, C., Fischer, C., Fox-Kemper, B., Kay, J. E., Kinnison, D., Kushner, P. J., Larson, V. E., Long, M. C., Mickelson, S., Moore, J. K., Nienhouse, E., Polvani, L., Rasch, P. J., and Strand, W. G.: The Community Earth System Model Version 2 (CESM2), J. Adv. Model. Earth Sy., 12, e2019MS001916, https://doi.org/10.1029/2019MS001916, 2020.
Di Virgilio, G., Evans, J. P., Blake, S. A. P., Armstrong, M., Dowdy, A. J., Sharples, J., and McRae, R.: Climate change increases the potential for extreme wildfires, Geophys. Res. Lett., 46, 8517–8526, https://doi.org/10.1029/2019GL083699, 2019.
Emmons, L. K., Schwantes, R. H., Orlando, J. J., Tyndall, G., Kinnison, D., Lamarque, J.-F., Marsh, D., Mills, M. J., Tilmes, S., Bardeen, Ch., Buchholz, R. R., Conley, A., Gettelman, A., Garcia, R., Simpson, I., Blake, D. R., Meinardi, S., and Pétron, G.: The Chemistry Mechanism in the Community Earth System Model version 2 (CESM2), J. Adv. Model. Earth Sy., 12, e2019MS001882, https://doi.org/10.1029/2019MS001882, 2020.
Flannigan, M. D., Krawchuk, M. A., De Groot, W. J., Wotton, B. M., and Gowman, L. M.: Implications of changing climate for global wildland fire, Int. J. Wildland Fire, 18, 483–507, https://doi.org/10.1071/WF08187, 2009.
Flannigan, M., Cantin, A. S., De Groot, W. J., Wotton, M., Newbery, A., and Gowman, L. M.: Global wildland fire season severity in the 21st century, Forest Ecol. Manag., 294, 54–61, 2013.
Ford, B., Martin, M. V., Zelasky, S. E., Fischer, E. V., Anenberg, S. C., Heald, C. L., and Pierce, J. R.: Future Fire Impacts on Smoke Concentrations, Visibility, and Health in the Contiguous United States, GeoHealth, 2, 229–247, https://doi.org/10.1029/2018gh000144, 2018.
Gettelman, A., Mills, M. J., Kinnison, D. E., Garcia, R. R., Smith, A. K., Marsh, D. R., Tilmes, S., Vitt, F., Bardeen, C. G., McInerny, J., Liu, H.-L., Solomon, S. C., Polvani, L. M., Emmons, L. K., Lamarque, J.-F., Richter, J. H., Glanville, A. S., Bacmeister, J. T., Phillips, A. S., Neale, R. B., Simpson, I. R., DuVivier, A. K., Hodzic, A., and Randel, W. J.: The Whole Atmosphere Community Climate Model Version 6 (WACCM6), J. Geophys. Res.-Atmos., 124, 12380–12403, https://doi.org/10.1029/2019JD030943, 2019.
Giglio, L., Randerson, J. T., van der Werf, G. R., Kasibhatla, P. S., Collatz, G. J., Morton, D. C., and DeFries, R. S.: Assessing variability and long-term trends in burned area by merging multiple satellite fire products, Biogeosciences, 7, 1171–1186, https://doi.org/10.5194/bg-7-1171-2010, 2010.
Huang, Y., Wu, S., and Kaplan, J. O.: Sensitivity of global wildfire occurrences to various factors in the context of global change, Atmos. Environ., 121, 86–92, 2015.
Hurtt, G. C., Chini, L., Sahajpal, R., Frolking, S., Bodirsky, B. L., Calvin, K., Doelman, J. C., Fisk, J., Fujimori, S., Klein Goldewijk, K., Hasegawa, T., Havlik, P., Heinimann, A., Humpenöder, F., Jungclaus, J., Kaplan, J. O., Kennedy, J., Krisztin, T., Lawrence, D., Lawrence, P., Ma, L., Mertz, O., Pongratz, J., Popp, A., Poulter, B., Riahi, K., Shevliakova, E., Stehfest, E., Thornton, P., Tubiello, F. N., van Vuuren, D. P., and Zhang, X.: Harmonization of global land use change and management for the period 850–2100 (LUH2) for CMIP6, Geosci. Model Dev., 13, 5425–5464, https://doi.org/10.5194/gmd-13-5425-2020, 2020.
Jiang, J., Cao, L., MacMartin, D. G., Simpson, I. R., Kravitz, B., Cheng, W., Visioni, D., Tilmes, S., Richter, J. H., and Mills, M. J.: Stratospheric Sulfate Aerosol Geoengineering Could Alter the High-Latitude Seasonal Cycle, Geophys. Res. Lett., 46, 14153–14163, https://doi.org/10.1029/2019GL085758, 2019.
Jones, B. and O'Neill, B. C.: Spatially explicit global population scenarios consistent with the Shared Socioeconomic Pathways, Environ. Res. Lett., 11, 4003, https://doi.org/10.1088/1748-9326/11/8/084003, 2016.
Jones, A., Haywood, J. M., Jones, A. C., Tilmes, S., Kravitz, B., and Robock, A.: North Atlantic Oscillation response in GeoMIP experiments G6solar and G6sulfur: why detailed modelling is needed for understanding regional implications of solar radiation management, Atmos. Chem. Phys., 21, 1287–1304, https://doi.org/10.5194/acp-21-1287-2021, 2021.
Knorr, W., Arneth, A., and Jiang, L.: Demographic controls of future global fire risk, Nat. Clim. Change, 6, 781–785, https://doi.org/10.1038/NCLIMATE2999, 2016a.
Knorr, W., Jiang, L., and Arneth, A.: Climate, CO2 and human population impacts on global wildfire emissions, Biogeosciences, 13, 267–282, https://doi.org/10.5194/bg-13-267-2016, 2016b.
Kravitz, B., Robock, A., Tilmes, S., Boucher, O., English, J. M., Irvine, P. J., Jones, A., Lawrence, M. G., MacCracken, M., Muri, H., Moore, J. C., Niemeier, U., Phipps, S. J., Sillmann, J., Storelvmo, T., Wang, H., and Watanabe, S.: The Geoengineering Model Intercomparison Project Phase 6 (GeoMIP6): simulation design and preliminary results, Geosci. Model Dev., 8, 3379–3392, https://doi.org/10.5194/gmd-8-3379-2015, 2015.
Kravitz, B., Lamarque, J.-F., Tribbia, J. J., Tilmes, S., Vitt, F., Richter, J. H., MacMartin, D. G., and Mills, M. J.: First Simulations of Designing Stratospheric Sulfate Aerosol Geoengineering to Meet Multiple Simultaneous Climate Objectives, J. Geophys. Res.-Atmos., 122, 12616–12634, https://doi.org/10.1002/2017JD026874, 2017.
Lasslop, G., Hantson, S., Harrison, S. P., Bachelet, D., Burton, C., Forkel, M., Forrest, M., Li F., Melton, J. R., Yue, C., Archibald, S., Scheiter, S., Arneth, A., Hickler, T., and Sitch, S.: Global ecosystems and fire: Multi-model assessment of fire-induced tree-cover and carbon storage reduction, Glob. Change Biol., 26, 5027–5041, https://doi.org/10.1111/gcb.15160, 2020.
Lawrence, D. M., Hurtt, G. C., Arneth, A., Brovkin, V., Calvin, K. V., Jones, A. D., Jones, C. D., Lawrence, P. J., de Noblet-Ducoudré, N., Pongratz, J., Seneviratne, S. I., and Shevliakova, E.: The Land Use Model Intercomparison Project (LUMIP) contribution to CMIP6: rationale and experimental design, Geosci. Model Dev., 9, 2973–2998, https://doi.org/10.5194/gmd-9-2973-2016, 2016.
Lawrence, D. M., Fisher, R. A., Koven, C. D., Oleson, K. W., Swenson, S. C., Bonan, G., Collier, N., Ghimire, B., van Kampenhout, L., Kennedy, D., Kluzek, E., Lawrence, P. J., Li, F., Li, H., Lombardozzi, D., Riley, W. J., Sacks, W. J., Shi, M., Vertenstein, M., Wieder, W. R., Xu, C., Ali, A. A., Badger, A. M., Bisht, G., Brunke, M. A., Burns, S. P., Buzan, J., Clark, M., Craig, A., Dahlin, K., Drewniak, B., Fisher, J. B., Flanner, M., Fox, A. M., Gentine, P., Hoffman, F., Keppel-Aleks, G., Knox, R., Kumar, S., Lenaerts, J., Leung, L. R., Lipscomb, W. H., Lu, Y., Pandey, A., Pelletier, J. D., Perket, J., Randerson, J. T., Ricciuto, D. M., Sanderson, B. M., Slater, A., Subin, Z. M., Tang, J., Thomas, R. Q., Val Martin, M., and Zeng, X.: The Community Land Model version 5: Description of new features, benchmarking, and impact of forcing uncertainty, J. Adv. Model. Earth Sy., 11, 4245–4287, 2019.
Lee, W., MacMartin, D., Visioni, D., and Kravitz, B.: Expanding the design space of stratospheric aerosol geoengineering to include precipitation-based objectives and explore trade-offs, Earth Syst. Dynam., 11, 1051–1072, https://doi.org/10.5194/esd-11-1051-2020, 2020.
Li, F. and Lawrence, D. M.: Role of fire in the global land water budget during the 20th century through changing ecosystems, J. Climate, 30, 1893–908, 2017.
Li, F., Zeng, X. D., and Levis, S.: A process-based fire parameterization of intermediate complexity in a Dynamic Global Vegetation Model, Biogeosciences, 9, 2761–2780, https://doi.org/10.5194/bg-9-2761-2012, 2012.
Li, F., Levis, S., and Ward, D. S.: Quantifying the role of fire in the Earth system – Part 1: Improved global fire modeling in the Community Earth System Model (CESM1), Biogeosciences, 10, 2293–2314, https://doi.org/10.5194/bg-10-2293-2013, 2013.
Li, F., Lawrence, D. M., and Bond-Lamberty, B.: Impact of fire on global land surface air temperature and energy budget for the 20th century due to changes within ecosystems, Environ. Res. Lett., 12, 044014, https://doi.org/10.1088/1748-9326/aa6685, 2017.
Li, F., Lawrence, D. M., and Bond-Lamberty, B.: Human impacts on 20th century fire dynamics and implications for global carbon and water trajectories, Global Planet. Change, 162, 18–27, 2018.
Li, F., Val Martin, M., Andreae, M. O., Arneth, A., Hantson, S., Kaiser, J. W., Lasslop, G., Yue, C., Bachelet, D., Forrest, M., Kluzek, E., Liu, X., Mangeon, S., Melton, J. R., Ward, D. S., Darmenov, A., Hickler, T., Ichoku, C., Magi, B. I., Sitch, S., van der Werf, G. R., Wiedinmyer, C., and Rabin, S. S.: Historical (1700–2012) global multi-model estimates of the fire emissions from the Fire Modeling Intercomparison Project (FireMIP), Atmos. Chem. Phys., 19, 12545–12567, https://doi.org/10.5194/acp-19-12545-2019, 2019.
Li, Y., Mickley, L. J., Liu, P., and Kaplan, J. O.: Trends and spatial shifts in lightning fires and smoke concentrations in response to 21st century climate over the national forests and parks of the western United States, Atmos. Chem. Phys., 20, 8827–8838, https://doi.org/10.5194/acp-20-8827-2020, 2020.
Li, F., Lawrence, D. M., Jiang, Y., Liu, X., and Lin, Z.: Fire aerosols slow down the global water cycle, J. Climate, 35, 3619–3633, 2022.
Liu, Y. Q., Stanturf, J., and Goodrick, S.: Trends in global wildfire potential in a changing climate, Forest Ecol. Manag., 259, 685–697, https://doi.org/10.1016/j.foreco.2009.09.002, 2010.
Liu, Z., Ballantyne, A. P., and Cooper, L. A.: Biophysical feedback of global forest fires on surface temperature, Nat. Commun., 10, 2014, https://doi.org/10.1038/s41467-018-08237-z, 2019.
Loehman, R. A.: Drivers of wildfire carbon emissions, Nat. Clim. Change, 10, 1070–1071, 2020.
Luo, L. F., Tang, Y., Zhong, S. Y., Bian, X. D., and Heilman, W. E.: Will Future Climate Favor More Erratic Wildfires in the Western United States?, J. Appl. Meteorol. Clim., 52, 2410–2417, https://doi.org/10.1175/jamc-d-12-0317.1, 2013.
Meehl, G. A, Arblaster, J. M., Bates, S., Richter, J. H., Tebaldi, C., Gettleman, A., Medeiros, B., Bacmeister, J., DeRepentigny, P., Rosenbloom, N., Shields, C., Hu, A., Teng, H., Mills, M. J., and Strand, G.: Characteristics of future warmer base states in CESM2, Earth Space Sci., 7, e2020EA001296, https://doi.org/10.1029/2020EA001296, 2020.
Randerson, J. T., van der Werf, G. R., Giglio, L., Collatz, G. J., and Kasibhatla, P. S.: Global Fire Emissions Database, Version 4.1 (GFEDv4), ORNL DAAC [data set], Oak Ridge, Tennessee, USA, https://doi.org/10.3334/ORNLDAAC/1293, 2018.
Riahi, K., van Vuuren, D. P., Kriegler, E., Edmonds, J., O'Neill, B. C., Fujimori, S., Bauer, N., Calvin, K., Dellink, R., Fricko, O., Lutz, W., Popp, A., Cuaresma, J. C., KC, S., Leimbach, M., Jiang, L., Kram, T., Rao, S., Emmerling, J., Ebi, K., Hasegawa, T., Havlik, P., Humpenöder, F., Da Silva, L. A., Smith, S., Stehfest, E., Bosetti, V., Eom, J., Gernaat, D., Masui, T., Rogelj, J., Strefler, J., Drouet, L., Krey, V., Luderer, G., Harmsen, M., Takahashi, K., Baumstark, L., Doelman, J. C., Kainuma, M., Klimont, Z., Marangoni, G., Lotze-Campen, H., Obersteiner, M., Tabeau, A., and Tavoni, M.: The Shared Socioeconomic Path ways and their energy, land use, and greenhouse gas emissions implications: An overview, Global Environ. Chang., 42, 153– 168, https://doi.org/10.1016/j.gloenvcha.2016.05.009, 2017.
Richter, J. H., Tilmes, S., Mills, M. J., Tribbia, J. J., Kravitz, B., Macmartin, D. G., Vitt, F., and Lamarque, J. F.: Stratospheric dynamical response and ozone feedbacks in the presence of SO2 injections, J. Geophys. Res.-Atmos., 122, 12557–12573, https://doi.org/10.1002/2017JD026912, 2017.
O'Neill, B. C., Tebaldi, C., van Vuuren, D. P., Eyring, V., Friedlingstein, P., Hurtt, G., Knutti, R., Kriegler, E., Lamarque, J.-F., Lowe, J., Meehl, G. A., Moss, R., Riahi, K., and Sanderson, B. M.: The Scenario Model Intercomparison Project (ScenarioMIP) for CMIP6, Geosci. Model Dev., 9, 3461–3482, https://doi.org/10.5194/gmd-9-3461-2016, 2016.
O'Neill, B. C., Kriegler, E., Ebi, K. L., Kemp-Benedict, E., Riahi, K., Rothman, D. S., van Ruijven, B. J., Van Vuuren, D. P., Birkmann, J., Kok, K., Levy, M., and Solecki, W.: The roads ahead: Narratives for shared socioeconomic pathways describing world futures in the 21st century, Global Environ. Chang., 42, 169–180, https://doi.org/10.1016/j.gloenvcha.2015.01.004, 2017.
Pechony, O. and Shindell, D.: Driving forces of global wildfires over the past millennium and the forthcoming century, P. Natl. Acad. Sci. USA, 107, 19167–19170, https://doi.org/10.1073/pnas.1003669107, 2010.
Randerson, J. T., van der Werf, G. R. Giglio, L. Collatz, G. J., and Kasibhatla, P. S.: Global Fire Emissions Database, Version 4.1 (GFEDv4), ORNL DAAC [data set], Oak Ridge, Tennessee, USA, https://doi.org/10.3334/ORNLDAAC/1293, 2018.
Shiogama, H., Hirata, R., Hasegawa, T., Fujimori, S., Ishizaki, N. N., Chatani, S., Watanabe, M., Mitchell, D., and Lo, Y. T. E.: Historical and future anthropogenic warming effects on droughts, fires and fire emissions of CO2 and PM2.5 in equatorial Asia when 2015-like El Niño events occur, Earth Syst. Dynam., 11, 435–445, https://doi.org/10.5194/esd-11-435-2020, 2020.
Simpson, I., Tilmes, S., Richter, J., Kravitz, B., MacMartin, D., Mills, M., Fasullo, J., and Pendergrass, A.: The regional hydroclimate response to stratospheric sulfate geoengineering and the role of stratospheric heating, J. Geophys. Res.-Atmos., 124, 2019JD031093, https://doi.org/10.1029/2019JD031093, 2019.
Tang, W., Emmons, L. K., Buchholz, R. R., Wiedinmyer, C., Schwantes, R. H., He, C., Kumar, R., Pfister, G. G., Worden, H. M., Hornbrook, R. S. and Apel, E. C.: Effects of Fire Diurnal Variation and Plume Rise on US Air Quality During FIREX-AQ and WE-CAN Based on the Multi-Scale Infrastructure for Chemistry and Aerosols (MUSICAv0), J. Geophys. Res.-Atmos., 127, e2022JD036650, https://doi.org/10.1029/2022JD036650, 2022.
Tilmes, S., Garcia, R. R., Kinnison, D. E., Gettelman, A., and Rasch, P. J.: Impact of geoengineered aerosols on the troposphere and stratosphere, J. Geophys. Res., 114, D12305, https://doi.org/10.1029/2008JD011420, 2009.
Tilmes, S., Fasullo, J., Lamarque, J.-F., Marsh, D. R., Mills, M., Alterskjær, K., Muri, H., Kristjánsson, J. E., Boucher, O., Schulz, M., Cole, J. N. S., Curry, C. L., Jones, A., Haywood, J., Irvine, P. J., Ji, D., Moore, J. C., Karam, D. B., Kravitz, B., Rasch, P. J., Singh, B., Yoon, J.-H., Niemeier, U., Schmidt, H., Robock, A., Yang, S., and Watanabe, S.: The hydrological impact of geoengineering in the Geoengineering Model Intercomparison Project (GeoMIP), J. Geophys. Res.-Atmos., 118, 11036–11058, https://doi.org/10.1002/jgrd.50868, 2013.
Tilmes, S., Richter, J. H., Kravitz, B., Macmartin, D. G., Mills, M. J., Simpson, I. R., Glanville, A. S., Fasullo, J. T., Phillips, A. S., Lamarque, J. F., Tribbia, J., Edwards, J., Mickelson, S., and Ghosh, S.: CESM1(WACCM) stratospheric aerosol geoengineering large ensemble project, B. Am. Meteorol. Soc., 99, 2361– 2371, https://doi.org/10.1175/BAMS-D-17-0267.1, 2018.
Tilmes, S., Hodzic, A., Emmons, L. K., Mills, M. J., Gettelman, A., Kinnison, D. E., Park, M., Lamarque, J.-F., Vitt, F., Shrivastava, M., Campuzano Jost, P., Jimenez, J., and Liu, X.: Climate forcing and trends of organic aerosols in the Community Earth System Model (CESM2), J. Adv. Model. Earth Sy., 11, 4323–4351, https://doi.org/10.1029/2019MS001827, 2019.
Tilmes, S., MacMartin, D. G., Lenaerts, J. T. M., van Kampenhout, L., Muntjewerf, L., Xia, L., Harrison, C. S., Krumhardt, K. M., Mills, M. J., Kravitz, B., and Robock, A.: Reaching 1.5 and 2.0 ∘C global surface temperature targets using stratospheric aerosol geoengineering, Earth Syst. Dynam., 11, 579–601, https://doi.org/10.5194/esd-11-579-2020, 2020.
van der Werf, G. R., Randerson, J. T., Giglio, L., Collatz, G. J., Kasibhatla, P. S., and Arellano Jr., A. F.: Interannual variability in global biomass burning emissions from 1997 to 2004, Atmos. Chem. Phys., 6, 3423–3441, https://doi.org/10.5194/acp-6-3423-2006, 2006.
van der Werf, G. R., Randerson, J. T., Giglio, L., Gobron, N., and Dolman, A. J.: Climate controls on the variability of fires in the tropics and subtropics, Global Biogeochem. Cy.,, 22, GB3028, https://doi.org/10.1029/2007GB003122, 2008.
Veira, A., Lasslop, G., and Kloster, S.: Wildfires in a warmer climate: emission fluxes, emission heights, and black carbon concentrations in 2090–2099, J. Geophys. Res.-Atmos., 121, 3195–3223, 2016.
Visioni, D., MacMartin, D. G., Kravitz, B., Lee, W., Simpson, I. R., and Richter, J. H.: Reduced poleward transport due to stratospheric heating under stratospheric aerosols geoengineering, Geophys. Res. Lett., 47, e2020GL089470, https://doi.org/10.1029/2020GL089470, 2020.
Visioni, D., MacMartin, D. G., and Kravitz, B.: Is turning down the sun a good proxy for stratospheric sulfate geoengineering?, J. Geophys. Res.-Atmos., 126, e2020JD033952, https://doi.org/10.1029/2020JD033952, 2021a.
Visioni, D., MacMartin, D. G., Kravitz, B., Boucher, O., Jones, A., Lurton, T., Martine, M., Mills, M. J., Nabat, P., Niemeier, U., Séférian, R., and Tilmes, S.: Identifying the sources of uncertainty in climate model simulations of solar radiation modification with the G6sulfur and G6solar Geoengineering Model Intercomparison Project (GeoMIP) simulations, Atmos. Chem. Phys., 21, 10039–10063, https://doi.org/10.5194/acp-21-10039-2021, 2021b.
Walker, X. J., Rogers, B. M., Veraverbeke, S., Johnstone, J. F., Baltzer, J. L., Barrett, K., Bourgeau-Chavez, L., Day, N. J., de Groot, W. J., Dieleman, C. M., and Goetz, S.: Fuel availability not fire weather controls boreal wildfire severity and carbon emissions, Nat. Clim. Change, 10, 1130, https://doi.org/10.1038/s41558-020-00920-8, 2020.
Ward, D. S., Kloster, S., Mahowald, N. M., Rogers, B. M., Randerson, J. T., and Hess, P. G.: The changing radiative forcing of fires: global model estimates for past, present and future, Atmos. Chem. Phys., 12, 10857–10886, https://doi.org/10.5194/acp-12-10857-2012, 2012.
Wiedinmyer, C. and Emmons, L.: Fire Inventory from NCAR version 2 Fire Emission, Research Data Archive at the National Center for Atmospheric Research, Computational and Information Systems Laboratory [data set], https://doi.org/10.5065/XNPA-AF09, 2022.
Wiedinmyer, C., Quayle, B., Geron, C., Belote, A., McKenzie, D., Zhang, X., O'Neill, S., and Wynne, K. K.: Estimating emissions from fires in North America for air quality modeling, Atmos. Environ., 40, 3419–3432, https://doi.org/10.1016/j.atmosenv.2006.02.010, 2006.
Wiedinmyer, C., Kimura, Y., McDonald-Buller, E. C., Emmons, L. K., Buchholz, R. R., Tang, W., Seto, K., Joseph, M. B., Barsanti, K. C., Carlton, A. G., and Yokelson, R.: The Fire Inventory from NCAR version 2.5: an updated global fire emissions model for climate and chemistry applications, EGUsphere [preprint], https://doi.org/10.5194/egusphere-2023-124, 2023.
Xia, L., Robock, A., Tilmes, S., and Neely III, R. R.: Stratospheric sulfate geoengineering could enhance the terrestrial photosynthesis rate, Atmos. Chem. Phys., 16, 1479–1489, https://doi.org/10.5194/acp-16-1479-2016, 2016.
Xia, L., Nowack, P. J., Tilmes, S., and Robock, A.: Impacts of stratospheric sulfate geoengineering on tropospheric ozone, Atmos. Chem. Phys., 17, 11913–11928, https://doi.org/10.5194/acp-17-11913-2017, 2017.
Xu, Y., Lin, L., Tilmes, S., Dagon, K., Xia, L., Diao, C., Cheng, W., Wang, Z., Simpson, I., and Burnell, L.: Climate engineering to mitigate the projected 21st-century terrestrial drying of the Americas: a direct comparison of carbon capture and sulfur injection, Earth Syst. Dynam., 11, 673–695, https://doi.org/10.5194/esd-11-673-2020, 2020.
Zhang, Y., Fan, J., Shrivastava, M., Homeyer, C. R., Wang, Y., and Seinfeld, J. H.: Notable impact of wildfires in the western United States on weather hazards in the central United States, P. Natl. Acad. Sci. USA, 119, e2207329119, https://doi.org/10.1073/pnas.2207329119, 2022.
The requested paper has a corresponding corrigendum published. Please read the corrigendum first before downloading the article.
- Article
(11814 KB) - Full-text XML
- Corrigendum
-
Supplement
(5553 KB) - BibTeX
- EndNote