the Creative Commons Attribution 4.0 License.
the Creative Commons Attribution 4.0 License.
 | 05 May 2023
Insights into characteristics and formation mechanisms of secondary organic aerosols in the Guangzhou urban area
Miaomiao Zhai
Li Liu
Yao He
Biao Luo
Wanyun Xu
Jiangchuan Tao
Changqin Yin
Chunhui Li
Hanbing Xu
Xuejiao Deng
Emission controls have substantially brought down aerosol pollution in China; however, aerosol mass reductions have slowed down in recent years in the Pearl River Delta (PRD) region, where secondary organic aerosol (SOA) formation poses a major challenge for air quality improvement. In this study, we characterized the roles of SOA in haze formation in urban Guangzhou in the PRD using year-long aerosol mass spectrometer measurements for the first time and discussed possible pathways of SOA formations. On average, organic aerosols (OA) contribute dominantly (50 %) to nonrefractory submicron aerosol mass (NR-PM1). The average mass concentration of SOA (including by less- and more-oxidized OA, LOOA and MOOA) contributed most to NR-PM1, reaching about 1.7 times that of primary organic aerosols (POA, including hydrocarbon-like and cooking-related OA) and accounting for 32 % of NR-PM1, even more than sulfate (22 %) and nitrate (16 %). Seasonal variations of NR-PM1 revealed that haze-formation mechanisms differed much among distinct seasons. Sulfate mattered more than nitrate in fall, while nitrate was more important than sulfate in spring and winter, with SOA contributing significantly to haze formations in all the seasons. Daytime SOA formation was weak in winter under low oxidant levels and air relative humidity, whereas prominent daytime SOA formation was observed in fall, spring and summer almost on a daily basis, suggesting important roles of photochemistry in SOA formations. Further analysis showed that the coordination of gas-phase photochemistry and subsequent aqueous-phase reactions likely played significant roles in quick daytime SOA formations. Obvious nighttime SOA formations were also frequently observed in spring, fall and winter, and it was found that daytime and nighttime SOA formations together had resulted in the highest SOA concentrations in these seasons and contributed substantially to severe haze formations. Simultaneous increases in nitrate with SOA after sunset suggested the important roles of NO3 radical chemistry in nighttime SOA formations, and this was further confirmed by a continuous increase in the NO+ NO fragment ratio that related to measured particulate nitrate after sunset. The findings of this study have promoted our understanding of haze pollution characteristics of the PRD and laid down future directions for investigations of SOA-formation mechanisms in urban areas of southern China that share similar emission sources and meteorological conditions.
- Article
(6592 KB) - Full-text XML
-
Supplement
(1720 KB) - BibTeX
- EndNote


Ubiquitous submicron aerosols in the atmosphere not only deteriorate human health and visibility, but also impact climate through interactions with solar radiation and clouds. Organic aerosols (OA) represent one of the most important and sometimes even dominant components (∼ 10 %–90 %) of PM1 (aerosol particle matter with an aerodynamic diameter of less than 1 µm) in urban, rural and remote areas (Zhang et al., 2007; Jimenez et al., 2009). OA can either be emitted directly from emission sources or be formed through atmospheric reactions of volatile organic compounds: the former is referred to as primary OA (POA), and the latter is referred to as secondary OA (SOA). An increasing number of studies show that SOA account for a large fraction of OA worldwide (Zhang et al., 2007, 2011) and even dominate in some cases (Kuang et al., 2020). The implementation of strict emission-reduction policies has significantly improved the air quality of the Pearl River Delta (PRD) region, which is a highly industrialized area of China, and the annual mean concentration of PM2.5 (particulate matter with an aerodynamic diameter of less than 2.5 µm) has been brought down to less than 30 µg m−3 (Xu et al., 2020). However, the reduction in PM2.5 mass concentrations in the PRD has slowed down substantially in recent years, which might be related to the significant increases in the proportion of secondary aerosols (Xu et al., 2020), especially for SOA. Insights into SOA-formation mechanisms are important for air pollution improvement.
SOA-formation mechanisms have been an active research area of interest in atmospheric chemistry in the most recent 10 years, since significant contributions of SOA to atmospheric aerosol mass have been recognized (Zhang et al., 2007; Jimenez et al., 2009) but are quite complex due to varying precursors, oxidants and formation pathways under different emission characteristics and meteorological conditions. As for SOA-formation pathways, SOA can be formed through condensation of oxidized gas-phase organic vapors during the oxidation of volatile organic compounds (VOCs): this type of formed SOA was usually referred to as gasSOA (Kuang et al., 2020). SOA can also be formed in the aqueous phase through the further oxidation of dissolved VOCs which are usually products of gas-phase oxidation of VOCs: this type of SOA was usually referred to as aqSOA (Ervens et al., 2011). Both field measurements and laboratory studies are needed in investigating detailed SOA-formation mechanisms in different regions. Field measurements provide insights into key oxidants and formation pathways under ambient conditions, and thus information from field measurements is important for both designing laboratory experiments and targeting emission-control strategies. Aerosol mass spectrometers are advanced online instruments that provide real-time quantitative characterization of aerosol particle compositions (Jayne et al., 2000; Canagaratna et al., 2007; Jimenez et al., 2003). Positive matrix factorization (PMF) (Ulbrich et al., 2009) or a multilinear engine (ME-2) (Paatero, 1999; Canonaco et al., 2013) can be employed to further resolve different OA factors that are associated with different sources and formation mechanisms from the OA mass spectra. Using these techniques, the SOA sources and formation mechanisms are extensively investigated in China (Zhou et al., 2020), and many studies have found that aqueous reactions in aerosol water contributed substantially, even dominantly, to SOA formations (Su et al., 2020) in haze episodes, with daytime and nighttime SOA formations differing much due to different meteorological conditions and oxidants (Rollins et al., 2012; Huang et al., 2021).
In fact, in a specific region, the compositions, sources and evolution processes differ much among the seasons due to changes in emission sources and meteorological conditions (Li et al., 2015). Therefore, long-term observations that cover measurements of different seasons were usually needed to characterize OA sources and SOA-formation mechanisms, thereby helping to address the challenge of fine-particulate-matter pollution mitigation. Even though aerosol mass spectrometers have been widely used in China in recent years, most studies have been conducted in specific periods due to their high cost and maintenance (He et al., 2011; Chen et al., 2021b; Qin et al., 2017), resulting in few long-term characterizations of the mass concentrations and chemical compositions of submicron particulate matter (PM1). The design of the Aerosol Chemical Speciation Monitor (ACSM) has improved this problem to some extent (Ng et al., 2011; Sun et al., 2015; Canonaco et al., 2021). For example, based on 2-year ACSM measurements, Sun et al. (2018) investigated the distinct characteristics of PM1 compositions among different seasons in the Beijing urban area and illustrated the dominant role of SOA in OA across different mass-loading scenarios during all the seasons.
Guangzhou is an expansive metropolis in the highly industrialized PRD region. Using the aerosol mass spectrometer measurements and the source-apportionment technique, Qin et al. (2017) and Huang et al. (2011) reported that SOA contributed substantially to aerosol mass during fall and winter in Guangzhou. Guo et al. (2020) found that OA played a dominant role in PM1 during winter in Guangzhou, with OA source apportionment emphasizing the dominance of SOA. Guo et al. (2020) also suggested that gasSOA contributed predominantly to SOA formation during non-pollution periods, and other mechanisms such as heterogeneous and multiphase reactions played more important roles in SOA formation during pollution episodes; however, long-term aerosol spectrometer measurements that help characterize OA sources and SOA-formation mechanisms in this region are still lacking. In this study, we performed a year-long continuous measurement of nonrefractory submicron aerosols (NR-PM1) with an ACSM in urban Guangzhou from September 2020 to August 2021 to characterize POA sources and investigate SOA-formation mechanisms in different seasons.
2.1 Sampling site and measurements
A quadrupole-Aerosol Chemical Speciation Monitor (Q-ACSM) was deployed to continuously measure nonrefractory PM1 (NR-PM1) species including OA, sulfate (SO4), nitrate (NO3), ammonium (NH4) and chloride (Cl) from September 2020 to August 2021 at an urban site located in Haizhu Wetland Park of Guangzhou, which is surrounded by commercial streets and residential buildings but with a distance of at least 1 km (Liu et al., 2022). Therefore, measurements at this site are representative of the pollution characteristics of the Guangzhou urban area. More detailed descriptions of the sampling site and the ACSM measurements can be found in Liu et al. (2022) and Ng et al. (2011), respectively. An AE33 aethalometer (Drinovec et al., 2015) set up with a flow rate of 5 L min−1 was separately operated downstream of a PM2.5 inlet (BGI SCC 1.829) to measure aerosol absorptions, from which optically equivalent black carbon (BC) mass concentrations in winter and early spring were calculated. In addition, mass concentrations of PM2.5 and trace gases such as nitrogen dioxide (NO2), ozone (O3), carbon monoxide (CO) and sulfur dioxide (SO2) were acquired from the publicly available datasets of the China National Environmental Monitoring network (http://www.cnemc.cn/en/, last access: 1 May 2023), which includes a site located within 5 km of our observation site. Measurements of meteorological parameters such as temperature, wind speed and direction (WS and WD) and relative humidity (RH) were made by an automatic weather station (Li et al., 2021). Aerosol liquid water content (ALWC) was predicted with the ISORROPIA-II thermodynamic model in reverse mode under metastable assumption (Guo et al., 2017) with aerosol chemical compositions measured by Q-ACSM as inputs (more details in Supplement Sect. S2).
2.2 Q-ACSM data analysis
The Q-ACSM data were processed using the ACSM standard data-analysis software (ACSM Local 1.5.10.0 released on 6 July 2015) written in Igor Pro (version 6.37). The composition-dependent collection efficiency (CE) parameterization scheme proposed by Middlebrook et al. (2012) was chosen to determine the mass concentrations of NR-PM1 species, which was also detailed in Liu et al. (2022). Relative ionization efficiencies (RIEs) of 5.15 and 0.7 were adopted for ammonium and sulfate quantifications which were calibrated using 300 nm pure NH4NO3 and (NH4)2SO4, while the default RIEs of 1.4, 1.1 and 1.3 were used for organic aerosol, nitrate and chloride, respectively. Moreover, we also compared the mass concentrations of NR-PM1 with PM2.5 to ensure the validity of ACSM data during the whole study. As shown in Fig. S1 of the Supplement, the measured NR-PM1 correlates highly with PM2.5 acquired from the nearest (about 5 km) Environmental Protection Agency site (R2 = 0.71), and the average ratio of NR-PM1 PM2.5 is 0.77 (±0.36).

Figure 1Mass spectral profiles, diurnal cycles and correlations with external data of COA (a–c), HOA (d–f), LOOA (g–i) and MOOA (j–l) from ME2-ACSM analysis for the entire year.
Unconstrained PMF was performed on OA mass spectra of the entire year-long dataset. For the two-factor solution, the POA factor peaking in the evening with low O C (∼ 0.28) and an oxygenated OA (OOA) factor peaking in the afternoon with high O C (∼ 0.88) can be well resolved (Fig. S2), demonstrating the markedly different influences of primary emissions and SOA formations on diel aerosol mass concentrations. However, PMF-ACSM analysis of mass spectra of OA measured by unit mass-resolution instruments still faced some uncertainties in further resolving potential POA or SOA components due to its rotational indeterminacy. For example, traffic-related hydrocarbon-like organic aerosols (HOA) were sometimes not well separated from cooking-related organic aerosols (COA), and there was also great uncertainty in distinguishing SOA with different degrees of oxidation (Sun et al., 2012, 2013; Zhang et al., 2015). Therefore, the improved source-apportionment technique called ME-2 was further used to resolve better sources of POA and SOA (Paatero, 1999; Canonaco et al., 2013; Guo et al., 2020). Previously, both Guo et al. (2020) and Liu et al. (2022) demonstrated that, during both the fall and winter seasons of the Guangzhou urban area, POA was mainly composed of HOA (which are mostly associated with traffic emissions) and COA, while SOA could be resolved into less-oxidized and more-oxidized organic aerosols (LOOA and MOOA). The number-selecting test using unconstrained PMF analysis (Fig. S3) also showed the four-factor solution to likely be the best choice. Therefore, we chose four factors for ME-2 analysis, with the a value of ME-2 ranging from 0.1 to 0.5. Furthermore, we constrained the HOA and COA profiles with HOA and COA profiles reported in Liu et al. (2022) as priors considering the following three reasons: (1) the used instrument of this study is the same one of Liu et al. (2022), (2) the COA profile reported in Liu et al. (2022) was determined during the period when both the COVID-19 silence action and the spring festival occurred, cooking activities increased and traffic activities almost vanished (thus COA dominated over HOA), and (3) resolved variations of HOA and COA are well explained by external datasets. For example, correlations of HOA with black carbon reached 0.79. The four-factor solution using the ME-2 technique with a = 0.2 was obtained and is shown in Fig. 1. The resolved HOA and COA are summed as POA, resolved LOOA and MOOA are summed as SOA, and the comparison with those resolved by the PMF is shown in Fig. 2. ME-2 analysis generally reproduced both the diurnal variations and absolute mass concentrations of POA and SOA during different months well. To explore the consistency of resolved factors using the entire year-long dataset or only using the seasonal dataset when performing ME-2 analysis, we performed individual ME-2 runs for each season. Results showed that factors resolved in each season using seasonal datasets as inputs of ME-2 are generally consistent with those resolved from the year-long dataset (Figs. S4–S7). Therefore, factors resolved using the entire year-long dataset as the input of ME-2 were used for further investigations, and this also guaranteed consistency of factors for comparisons among seasons.
The mass spectrum of COA deconvolved in this work was characterized by a high 55 : 57 ratio of 2.12, which was the same as the one reported by Guo et al. (2020) and close to the 55 : 57 ratio range of 2.2–2.8 reported by Mohr et al. (2012) for COA. Similar to previous studies (Guo et al., 2020; Sun et al., 2013), the concentration of COA was well correlated (R2 = 0.46) with 55. The O C ratio of 0.12 for COA revealed that it was less oxidized than HOA (O C = 0.16) during the whole year in Guangzhou, which was contrary to Sun et al. (2011). As shown in Fig. 3, the diurnal profile of COA presented two typical peaks during the entire year, with a noontime peak during 13:00–14:00 LT and an evening peak during 20:00–21:00 LT, which were associated with noon and evening cooking activities. It was noteworthy that the nighttime peak concentration of COA was very close to that of noontime in summer, while the evening peak of COA was significantly higher than that of noontime in the other three seasons. The ratio of the evening COA peak to that of noontime was 1.7 in fall and 1.6 in spring. In particular, the evening COA peak was nearly 4 times that of noontime in winter due to the relatively insignificant noontime peak during this period, which might be associated with the lockdown and spring festival in winter which resulted in fewer noontime activities. Similar conclusions can be found in Sun et al. (2018). More frequent cooking activities at night, such as the Chinese habit of eating midnight snacks, the shallower boundary layer that inhibited diffusion of pollutants and the lower temperature at night which helped semivolatile compounds from cooking emissions partition into particles, resulted in the higher peak concentration at nighttime than at noon (Guo et al., 2020).
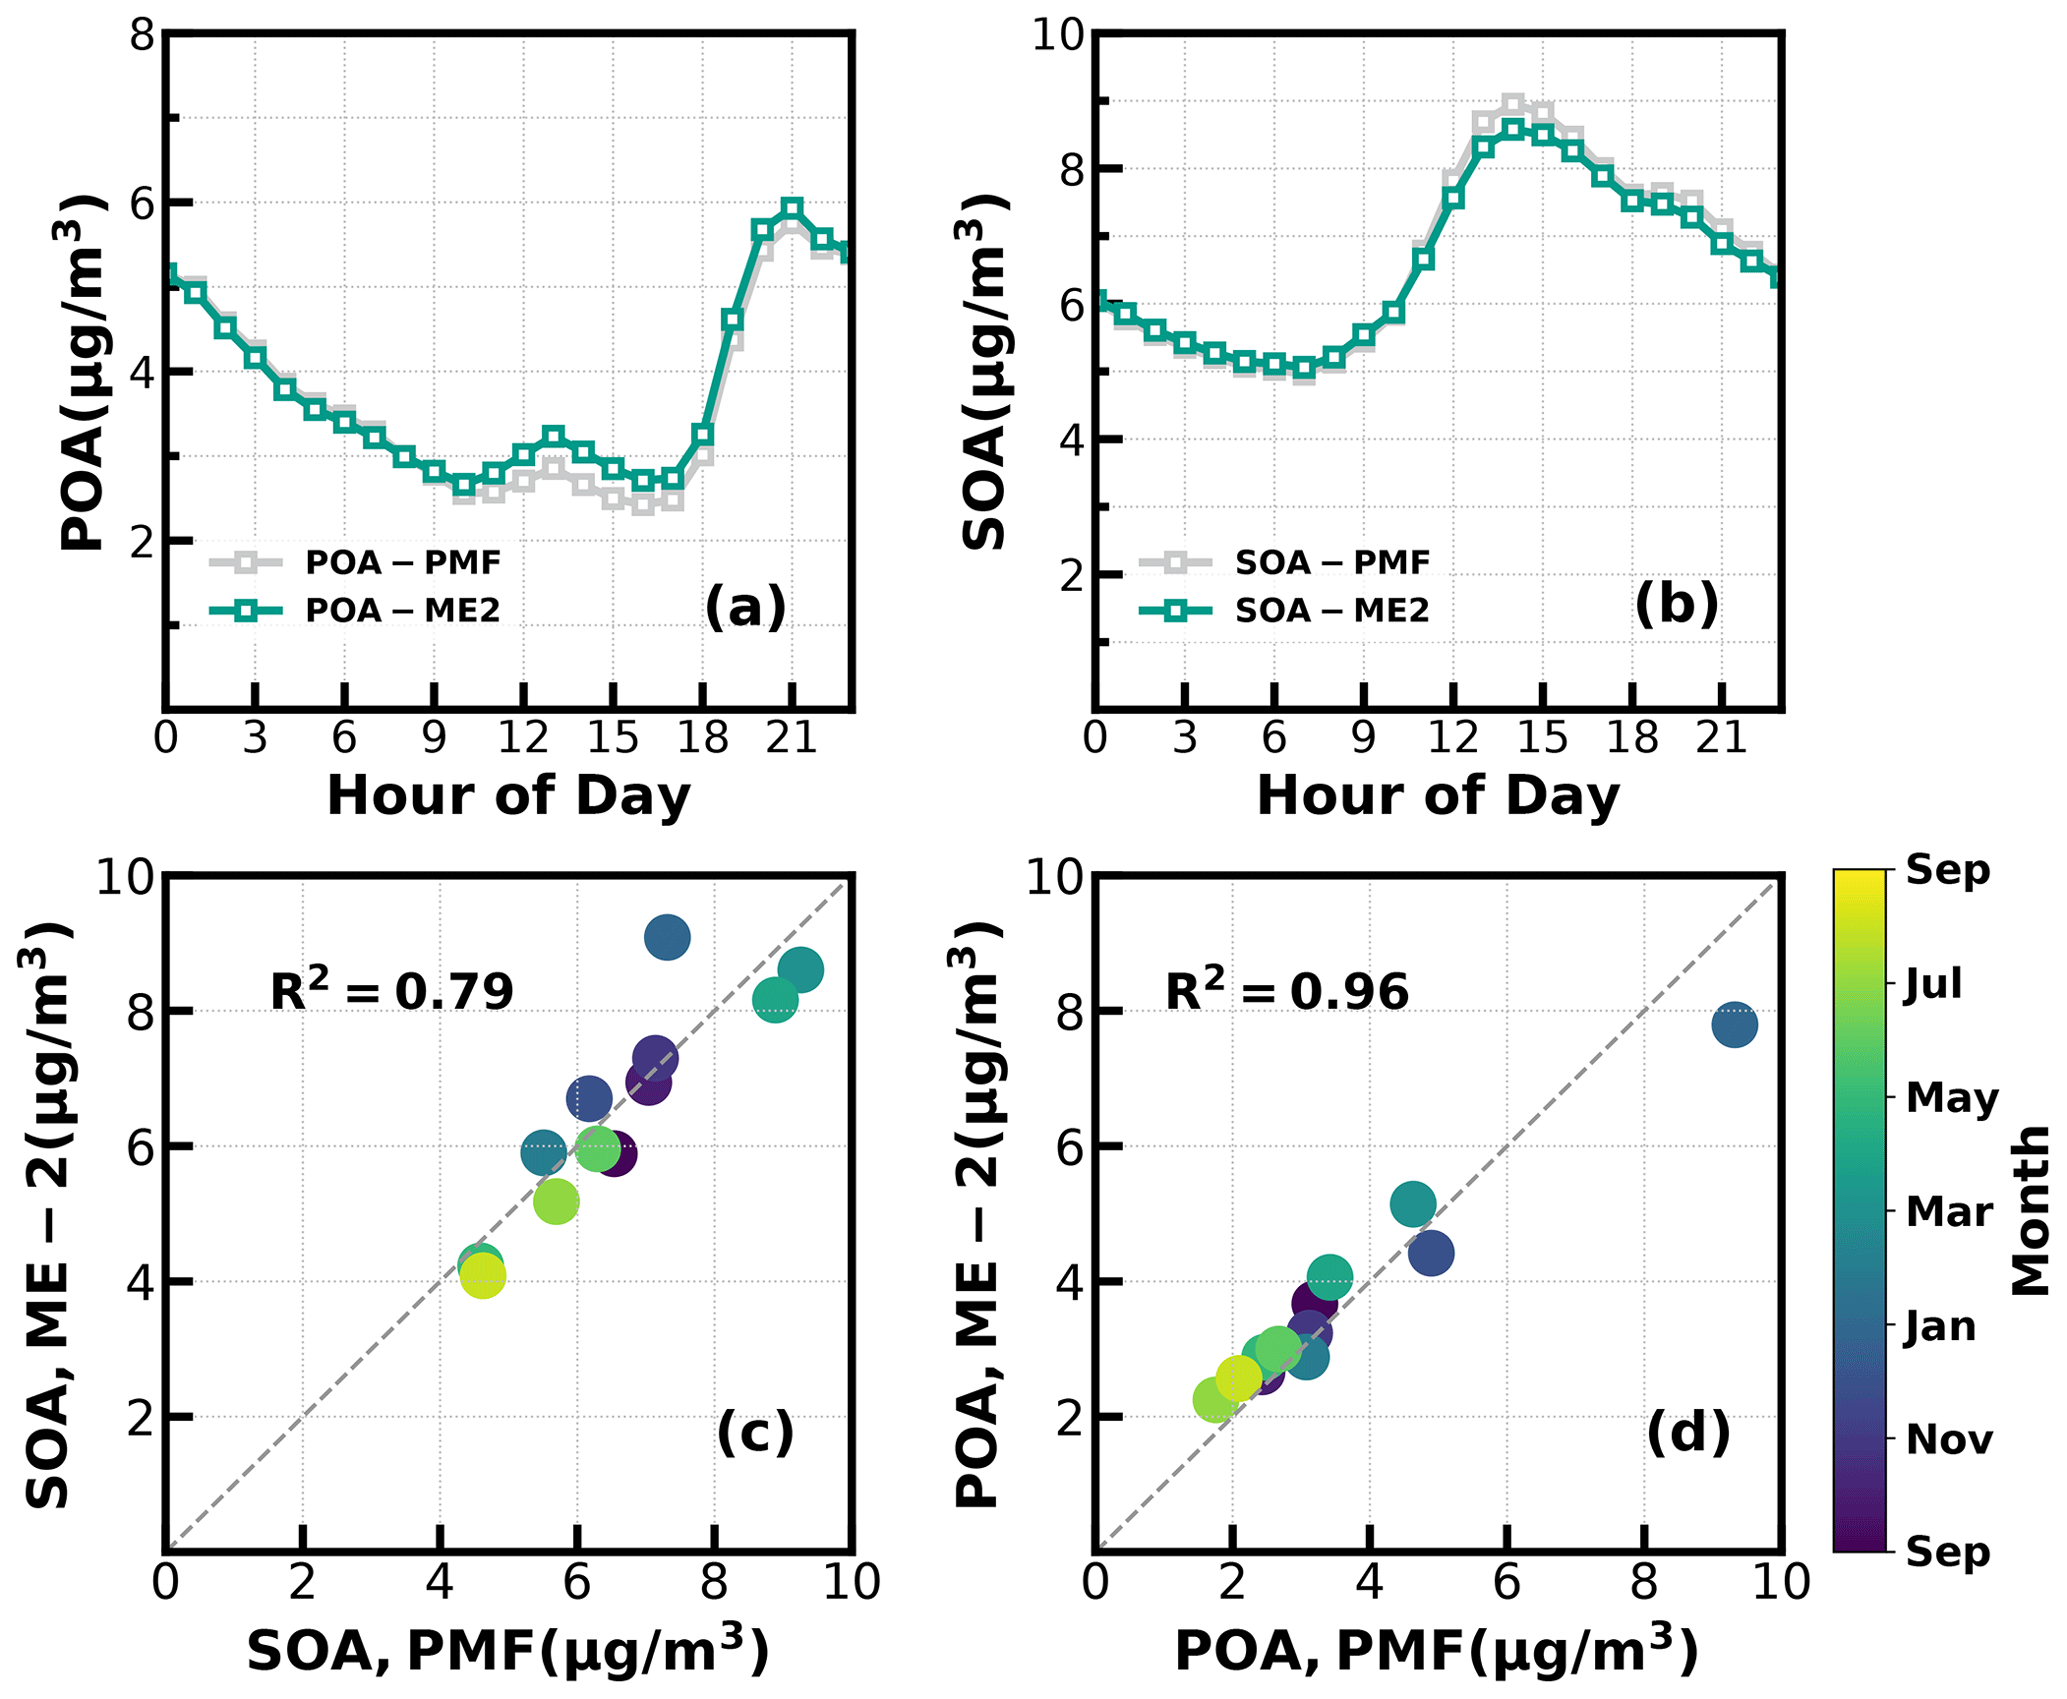
Figure 2(a, b) Diurnal variations of POA and SOA concentrations from ME-2 and PMF; (c, d) scatter plots between monthly average POA and SOA concentrations from ME-2 and PMF.
The mass spectrum of HOA (Fig. 1b) was characterized with the ( = 27, 41, 55, 69) and ( = 29, 43, 57, 71) ion species. The concentration of HOA had a good correlation with that of primary BC emission (R2 = 0.74) and also correlated well with that of NO2 (R2 = 0.58), indicating considerable impacts of traffic emissions on the HOA mass loading. As shown in Fig. 3, except for summer, HOA increased significantly after sunrise, especially in winter, but began to decrease in the late evening. HOA were significantly higher during nighttime than during daytime in all the seasons, especially in winter, but were not obvious in summer. HOA mass-concentration peaks around 20:00 LT were attributed to traffic emissions during the nocturnal rush hours. However, the continuously high concentrations of HOA after 20:00 until 02:00 LT of the next day might have resulted from heavy-duty vehicles with daytime traffic restrictions in Guangzhou (Guo et al., 2020; Qin et al., 2017).
Two OOA factors were characterized with a high O C ratio, LOOA with O C of 0.78 and MOOA with O C of 1.2, suggesting high oxidation degrees of SOA factors in the Guangzhou urban area, especially that of MOOA. MOOA and LOOA shared similar diurnal profiles regardless of seasons, with MOOA showing higher correlations with sulfate and LOOA showing higher correlations with nitrate. MOOA and LOOA increased together in fall from 09:00 LT until 14:00 LT, reaching maxima of 3.7 µg m−3 for MOOA and 5 µg m−3 for LOOA, followed by a gradual decrease in SOA concentrations and then remaining relatively flat. The diurnal profiles of SOA in spring and summer were relatively similar to those in fall; however, more remarkable decreases in SOA from afternoon to midnight were observed in spring and summer. This is because SOA sometimes increased after sunset in fall, which was even more prominent in winter, where LOOA and MOOA would first increase for a while after sunset and then begin to decrease. However, a weaker daytime SOA formation was observed in winter. Note that a aqSOA factor (called aqOOA in these references) was previously resolved using the aerosol mass spectrometer measurements (Sun et al., 2016; Zhao et al., 2019) or time-of-flight ACSM measurements (Lei et al., 2021), and the factor was resolved as aqSOA because of its high fraction of 29 (CHO+) and high correlation with sulfate. Both resolved SOA factors in this study showed relatively weak correlations with sulfate (Fig. 1) and, therefore, do not support the identification if they are formed through aqueous-phase reactions.
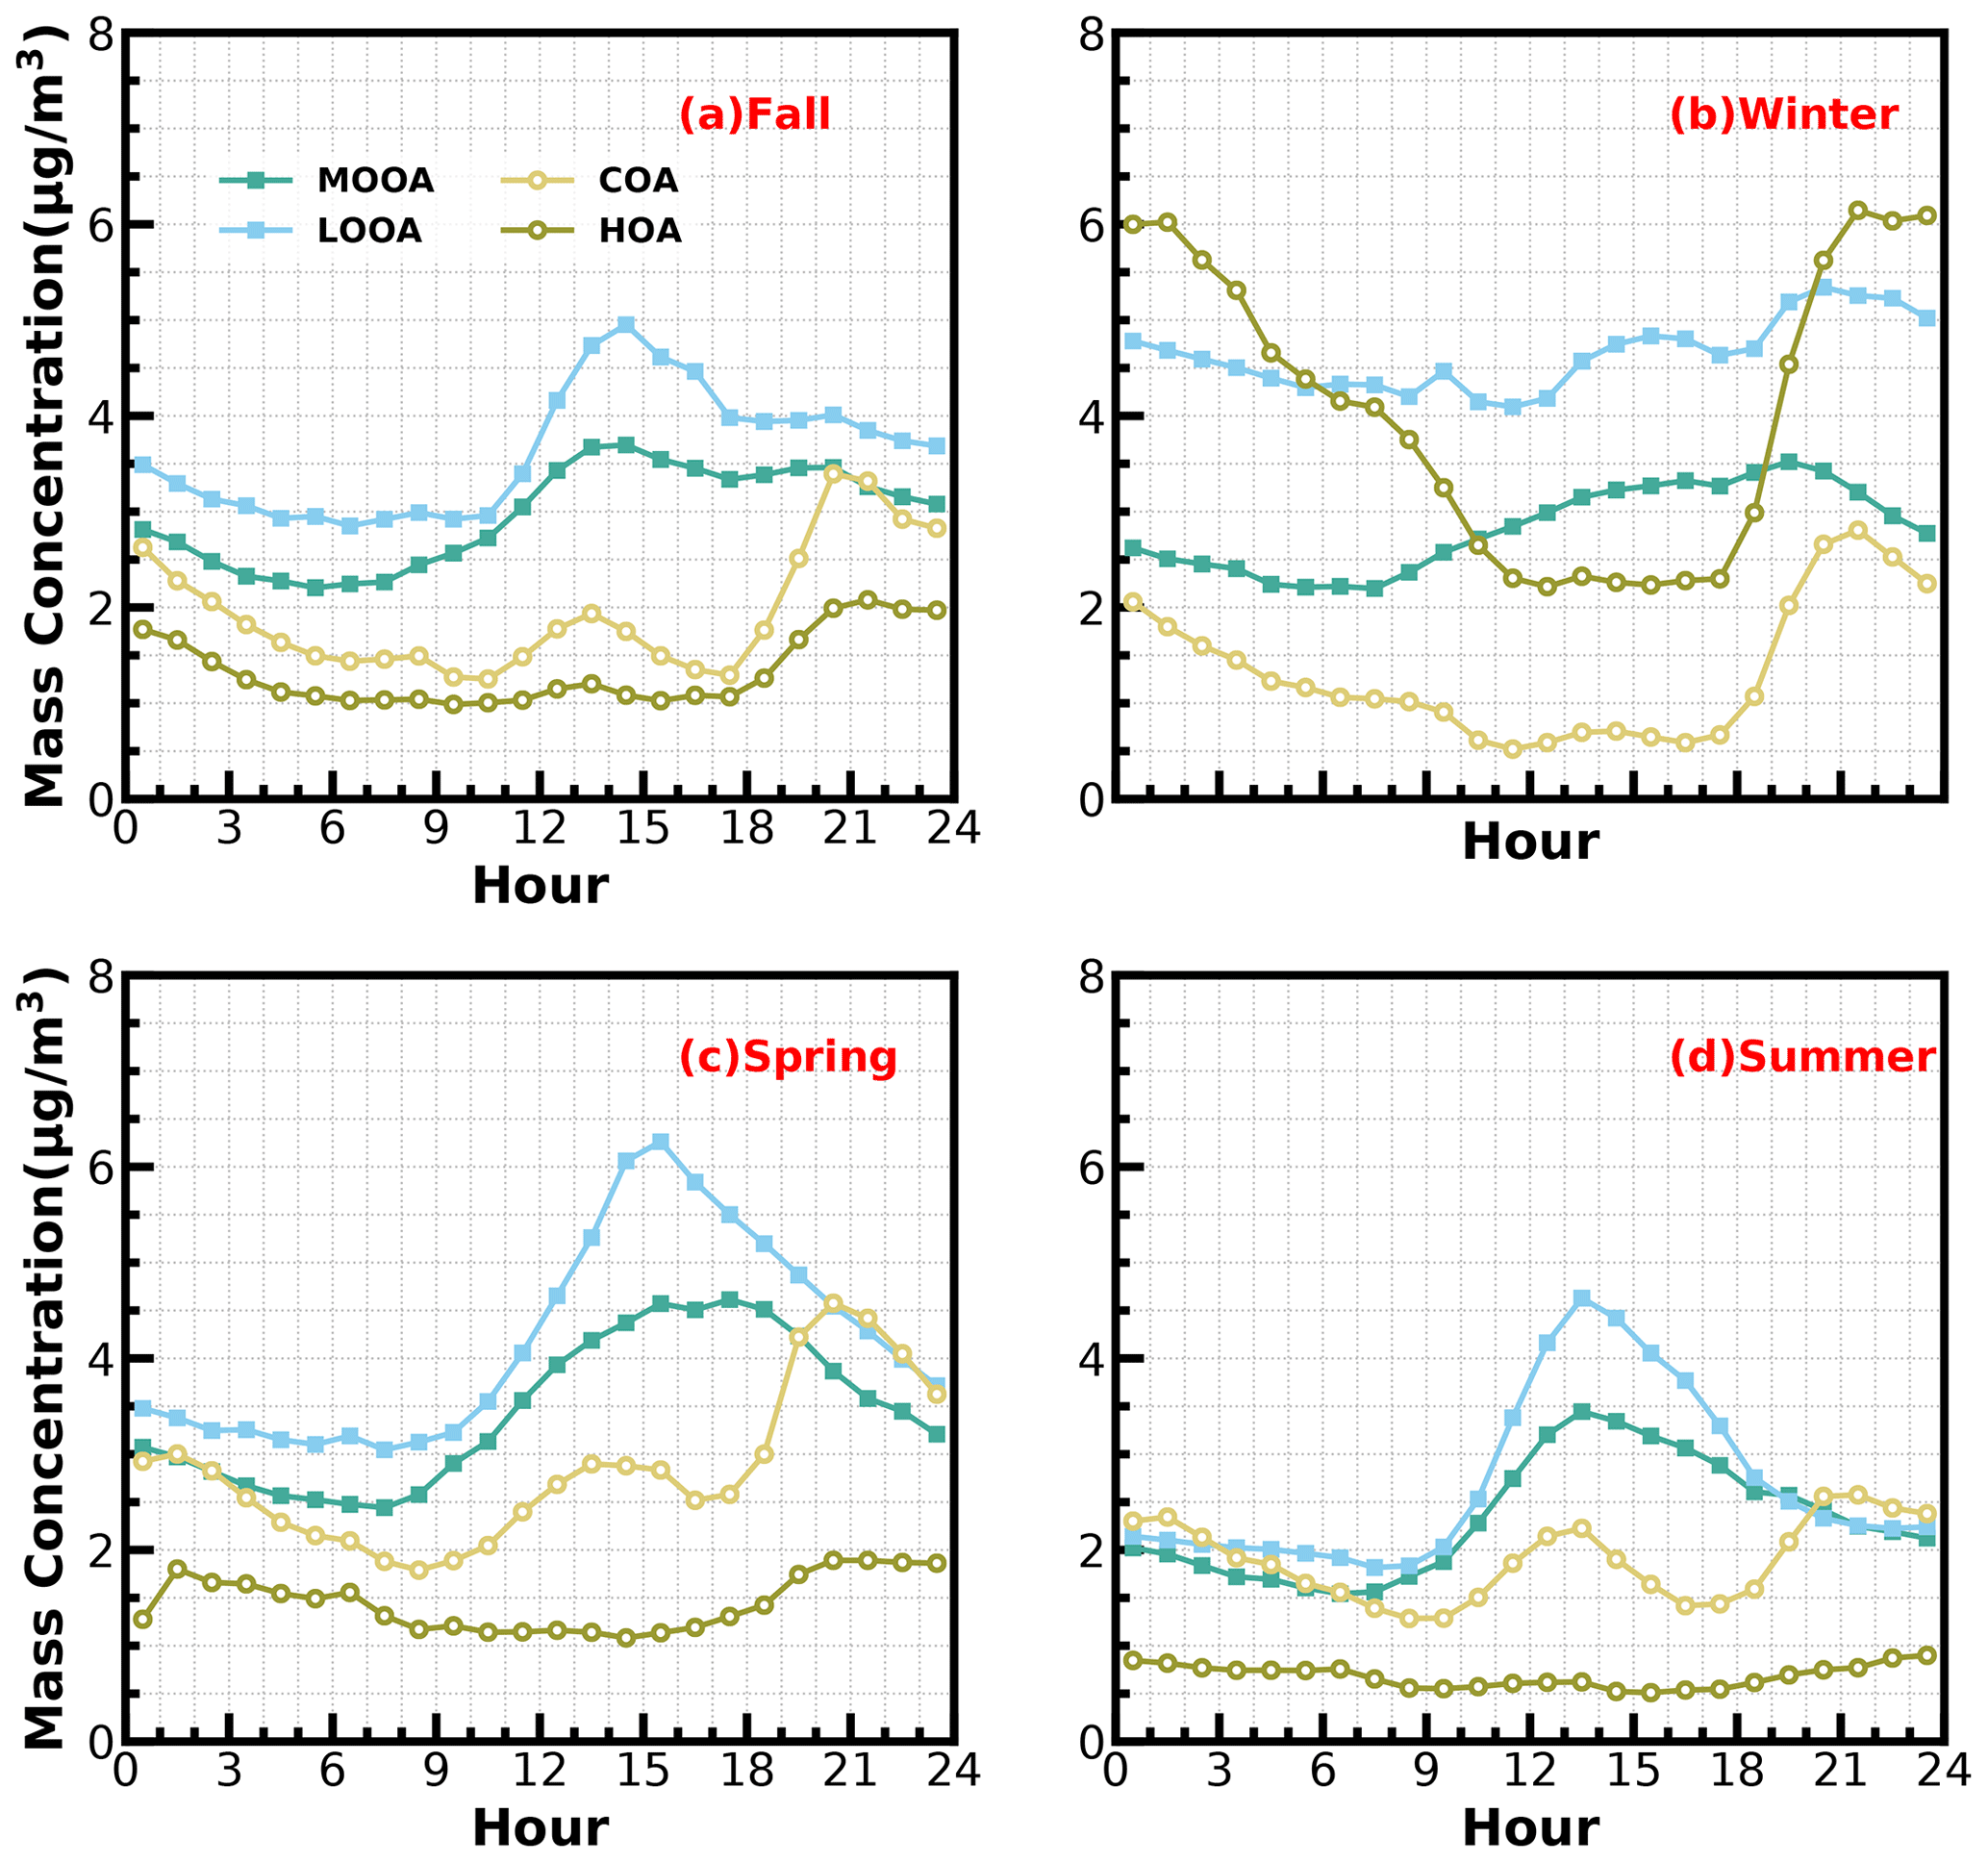
Figure 3Diurnal profiles of HOA, COA, LOOA and MOOA in spring (March to May), summer (June to August), fall (September to November) and winter (December to February).
3.1 The largest contribution of secondary organic aerosols in NR-PM1
Time series of the meteorological parameters (including RH, WS and WD), the mass concentrations of NR-PM1 and PM2.5, chemical compositions of NR-PM1, trace gases and four resolved OA factors are shown in Fig. S8. They show that emission source intensities and meteorological variables changed dramatically among the seasons. Hourly NR-PM1 mass concentrations ranged from near zero to 177 µg m−3, with an average of 21 µg m−3. From October to February, northerly winds prevailed, the average NR-PM1 was relatively higher than that from February to September (26 vs. 19 µg m−3), which was associated with a relatively lower boundary height during cold seasons, and northerly winds brought a polluted continental air mass. During the warm seasons of Guangzhou (March to September), southeasterly wind prevailed, which brought a cleaner air mass from the ocean, and the boundary-layer height was higher due to more surface heating. Monthly variations of PM2.5 are shown in Fig. 4a: PM2.5 in summer was lowest and around 16 µg m−3 from May to August, which was likely associated with the prevalence of rainy conditions in summer (Fig. S9) and a possibly higher boundary-layer height (Yang et al., 2013). January was the month with the highest PM2.5 mass concentrations, with an average of 49 µg m−3, which was consistent with the fact that winter usually experienced the worst air pollution due to the stagnant air conditions.
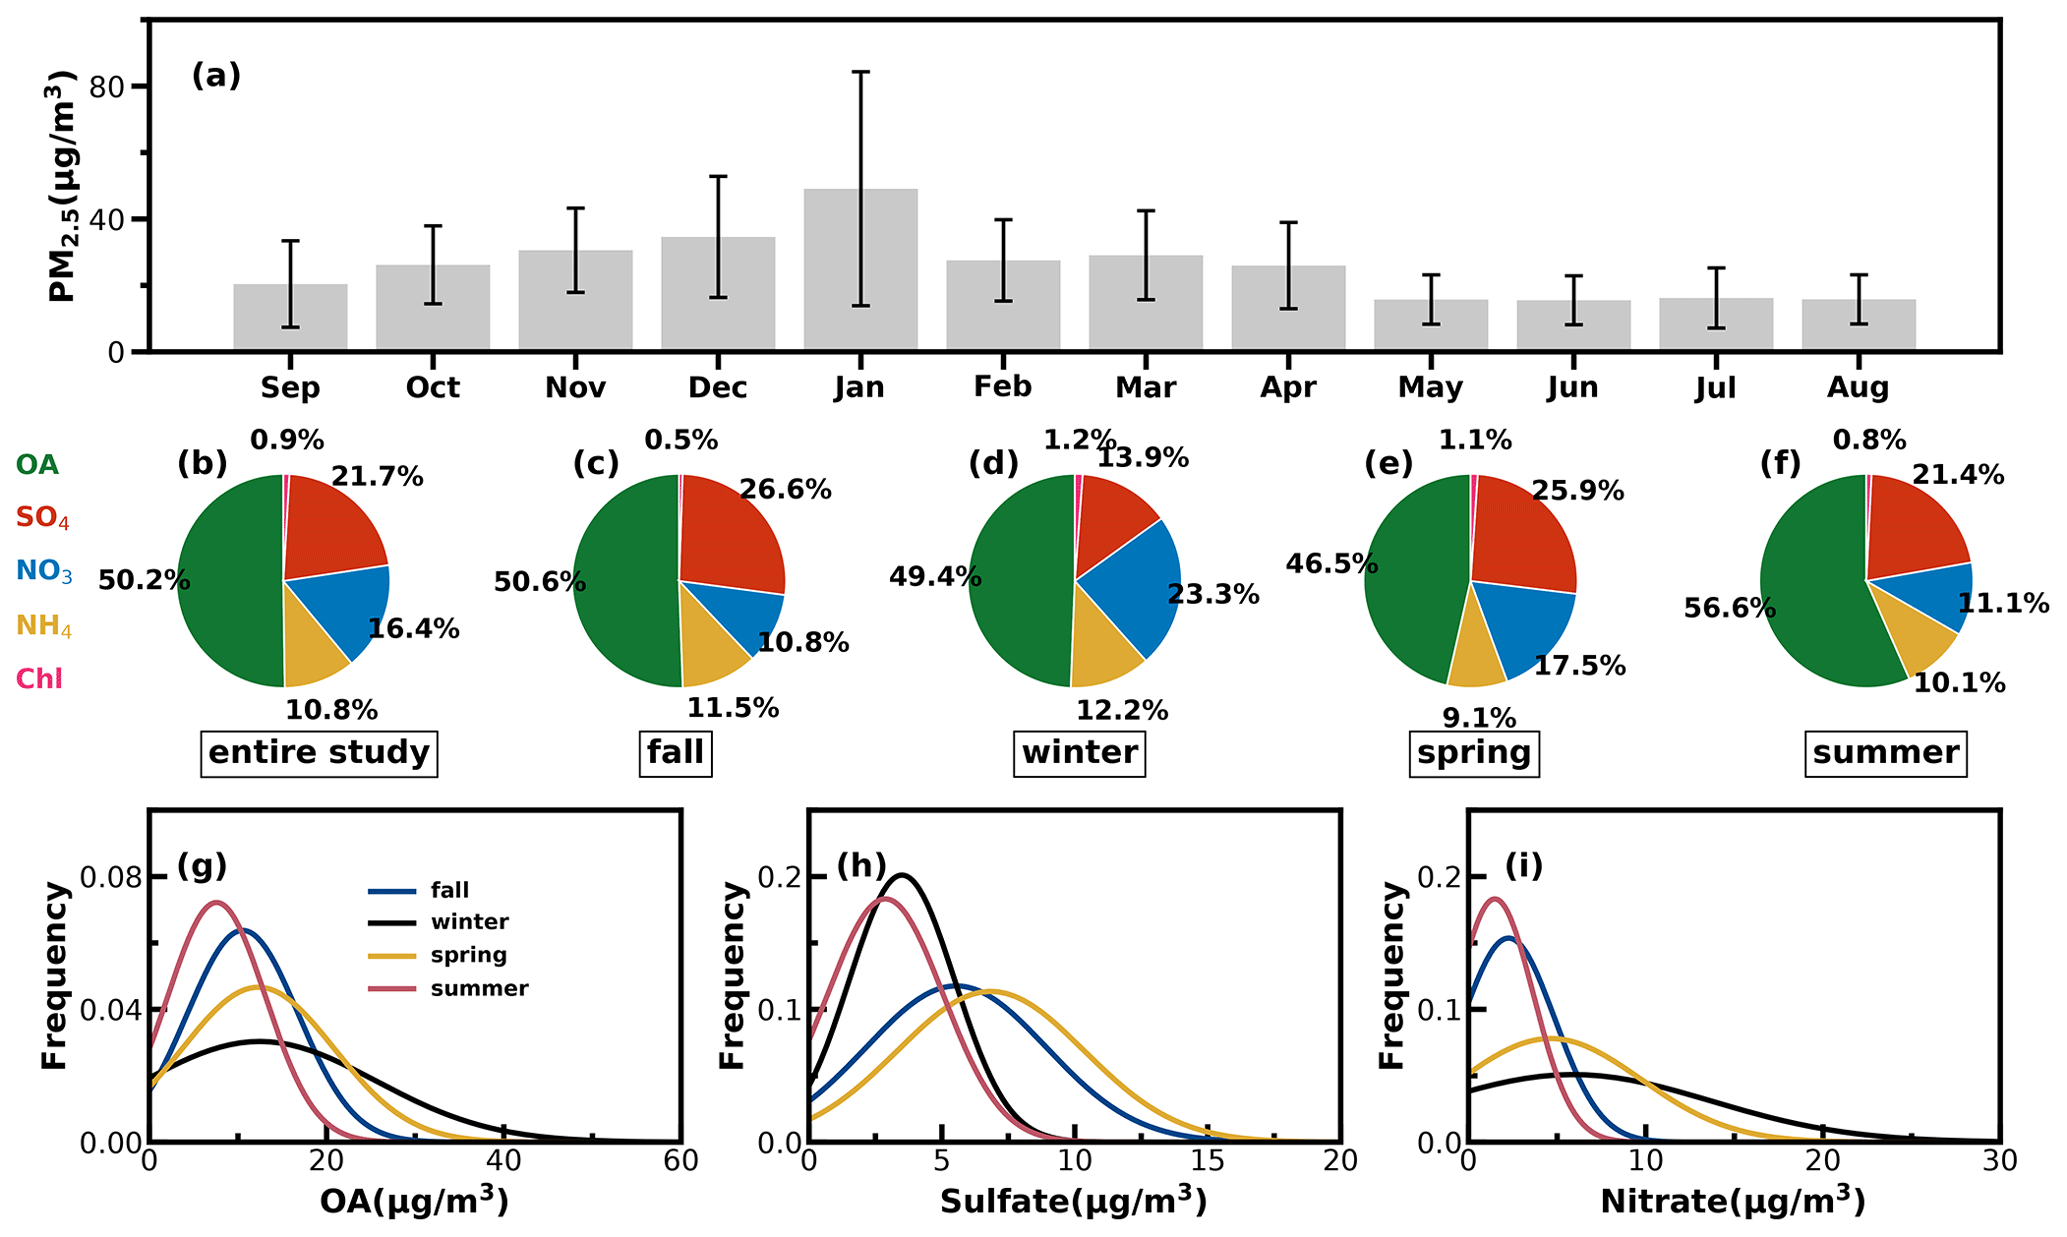
Figure 4(a) Monthly average PM2.5 mass concentrations from September 2020 to August 2021: (b–f) the average mass fractions of the chemical components in NR-PM1 of the entire year and different seasons; (g–i) probability distributions of OA, sulfate (SO4) and nitrate (NO3) in different seasons.
The average mass contributions of different components to NR-PM1 during the entire year and among different seasons are shown in Fig. 4b–f. On average, OA contributed about 50 % to NR-PM1, with the highest contribution in summer that reached near 57 % and the lowest contribution in spring of about 47 %. The second-largest contributor was sulfate, which on average contributed about 22 % and more than 20 % in spring, summer and fall. However, the contribution of nitrate to NR-PM1 (23 %) exceeded that of sulfate (14 %) and became the second major component after OA in winter, consistent with the results of Guo et al. (2020) for pollution periods in the winter of Guangzhou. The probability distributions of mass concentrations of OA, sulfate and nitrate are shown in Fig. 4g–i. Both OA and nitrate were distributed in wide ranges during winter and shared a similar shape of probability distribution, with OA increasing gradually from summer to winter and then decreasing in spring. Sulfate shared similar magnitudes in summer and winter and differed much from those in spring and fall, which had higher sulfate concentrations and varied in a wider range. Nitrate in summer and fall was relatively lower in summer and fall but had much higher concentrations in spring and winter.
As shown in Fig. 5a, average OA concentrations of different months ranged from about 7 to 17 µg m−3, with the peak in January and the lowest value in August, and the variations of OA mass concentration in winter and spring were much larger than those in summer and fall. Monthly variations of mass concentrations of the four resolved factors are shown in Fig. 5b–e, and contributions of the four OA factors to OA are shown in Fig. 5f. In general, HOA remained lower than 2 µg m−3 in most months; however, as the cold season approached from November, the monthly average OA increased substantially from about 2 µg m−3 to near 6 µg m−3. The much lower temperature and accumulation of favorable meteorological conditions likely resulted in the substantial increase in HOA. Compared with HOA, the seasonal variations of COA were less pronounced. The monthly average concentration of COA in the warm months (February to October) was higher than that in the cold months (October to January). The lowest monthly average concentration of COA was about 1 µg m−3, which occurred in February, when the contribution of COA to OA was near its lowest value of about 9 %. Overall, COA contributed about 19 % of OA during the whole year, which was close to that of HOA (18 %). However, the contributions of COA and HOA to total OA differ much among the seasons. The contributions of COA to OA were higher than that of HOA during the warm months and lower than that of HOA in the relatively cold months, especially in winter. These results highlight the significant contributions of POA to OA in the Guangzhou urban area; however, contributions of emission sources differed much among the cold and warm seasons.
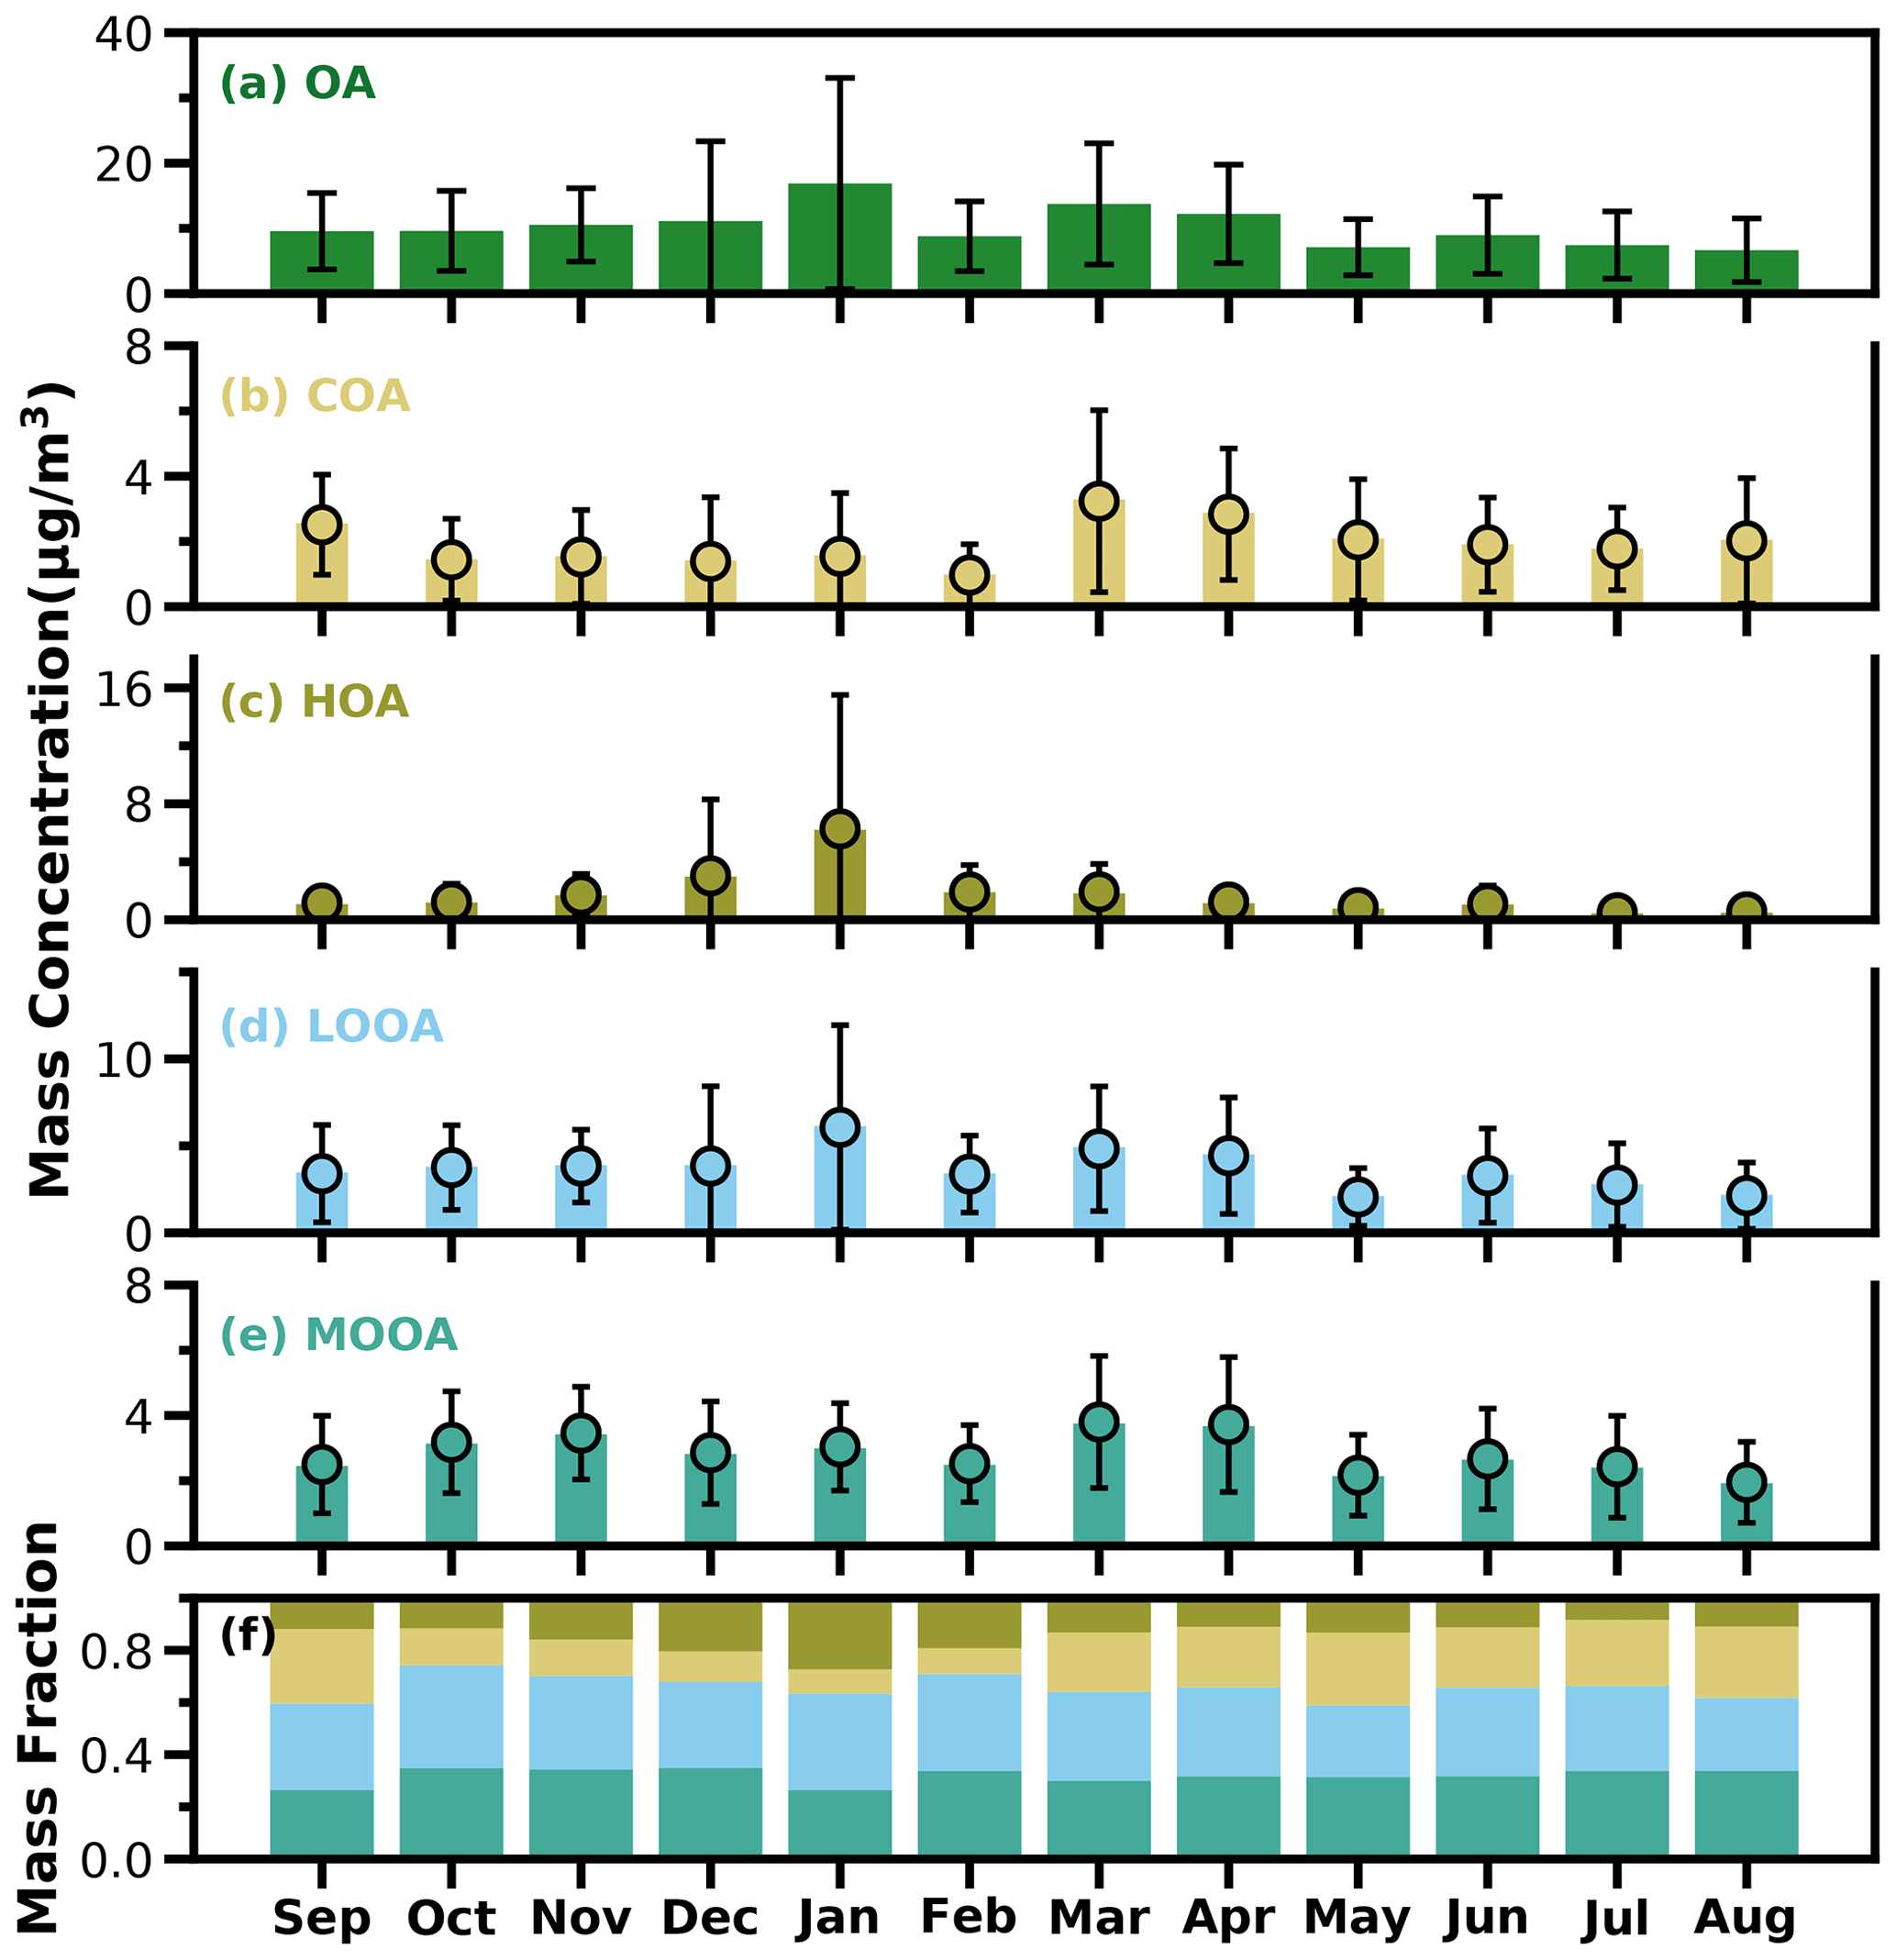
Figure 5The bar plots of monthly average mass concentrations of OA, COA, HOA, LOOA and MOOA from (a) to (e) and mass fractions of OA factors in OA (f).
SOA (MOOA + LOOA) contributed more than 60 % to OA in all the months, reached beyond 70 % in October and February, and made up on average 63 % of OA in the entire year. As shown in Fig. 5e–f, LOOA exhibited stronger seasonal variations than MOOA, with monthly average mass concentrations of LOOA varying between 2.6 and 6.1 µg m−3 and monthly average MOOA concentrations ranging from 2 to 3.8 µg m−3. The LOOA mass concentration peaked in the most polluted month of January, suggesting significant contributions of LOOA formation to severe haze pollution in winter. The contribution of LOOA to OA ranged from 27 % to 39 % with an average of 34 %, and the contribution of MOOA to OA ranged from 26 % to 35 % with an average of 32 %. Overall, the average mass concentration of SOA was about 1.7 times that of POA for the whole year, and SOA accounted for about 32 % of NR-PM1, which was higher than those of sulfate and nitrate, demonstrating the largest contribution of SOA to NR-PM1.
3.2 Significant contributions of secondary organic aerosols to haze formations in all the seasons
Investigations into contribution variations of aerosol compositions under different aerosol pollution levels are helpful for understanding mechanisms of haze formations, and results in the four seasons are presented in Fig. 6. The chemical composition of NR-PM1 under different pollution levels differs much among the seasons. In fall, as demonstrated by variations of mass concentrations of aerosol compositions under different pollution levels shown in Fig. 6, pollution conditions in fall were dominantly controlled by secondary formations of sulfate and SOA, and accumulation of primary aerosols and nitrate formation had relatively smaller impacts. With respect to mass-fraction variations, contributions of aerosol components differed much among different pollution levels. The fraction of OA decreased rapidly from 67 % to 50 % when the mass concentration of NR-PM1 gradually increased to 15 µg m−3, while the contribution of sulfate increased substantially from 17 % to 30 %, and the contribution of nitrate remained relatively stable at about 10 %. When NR-PM1 further increased, OA contribution remained relatively flat for NR-PM1 below about 50 µg m−3. Accordingly, the contribution of SO decreased to ∼ 18 %, and the contribution of nitrate substantially increased from ∼ 10 % to 21 %. After that, OA contribution decreased rapidly to about 40 % and then remained stable for NR-PM1 > 50 µg m−3. However, the contribution of sulfate began to increase, and the highest contribution could account for 30 %, while the contribution of nitrate began to decline gradually to 12 %. In addition, the SOA contributed dominantly to OA (> 60 %) for NR-PM1 > 15 µg m−3 and even reached near 70 % for NR-PM1 > 35 µg m−3, suggesting the dominant role of SOA in OA accumulations in haze events during fall.
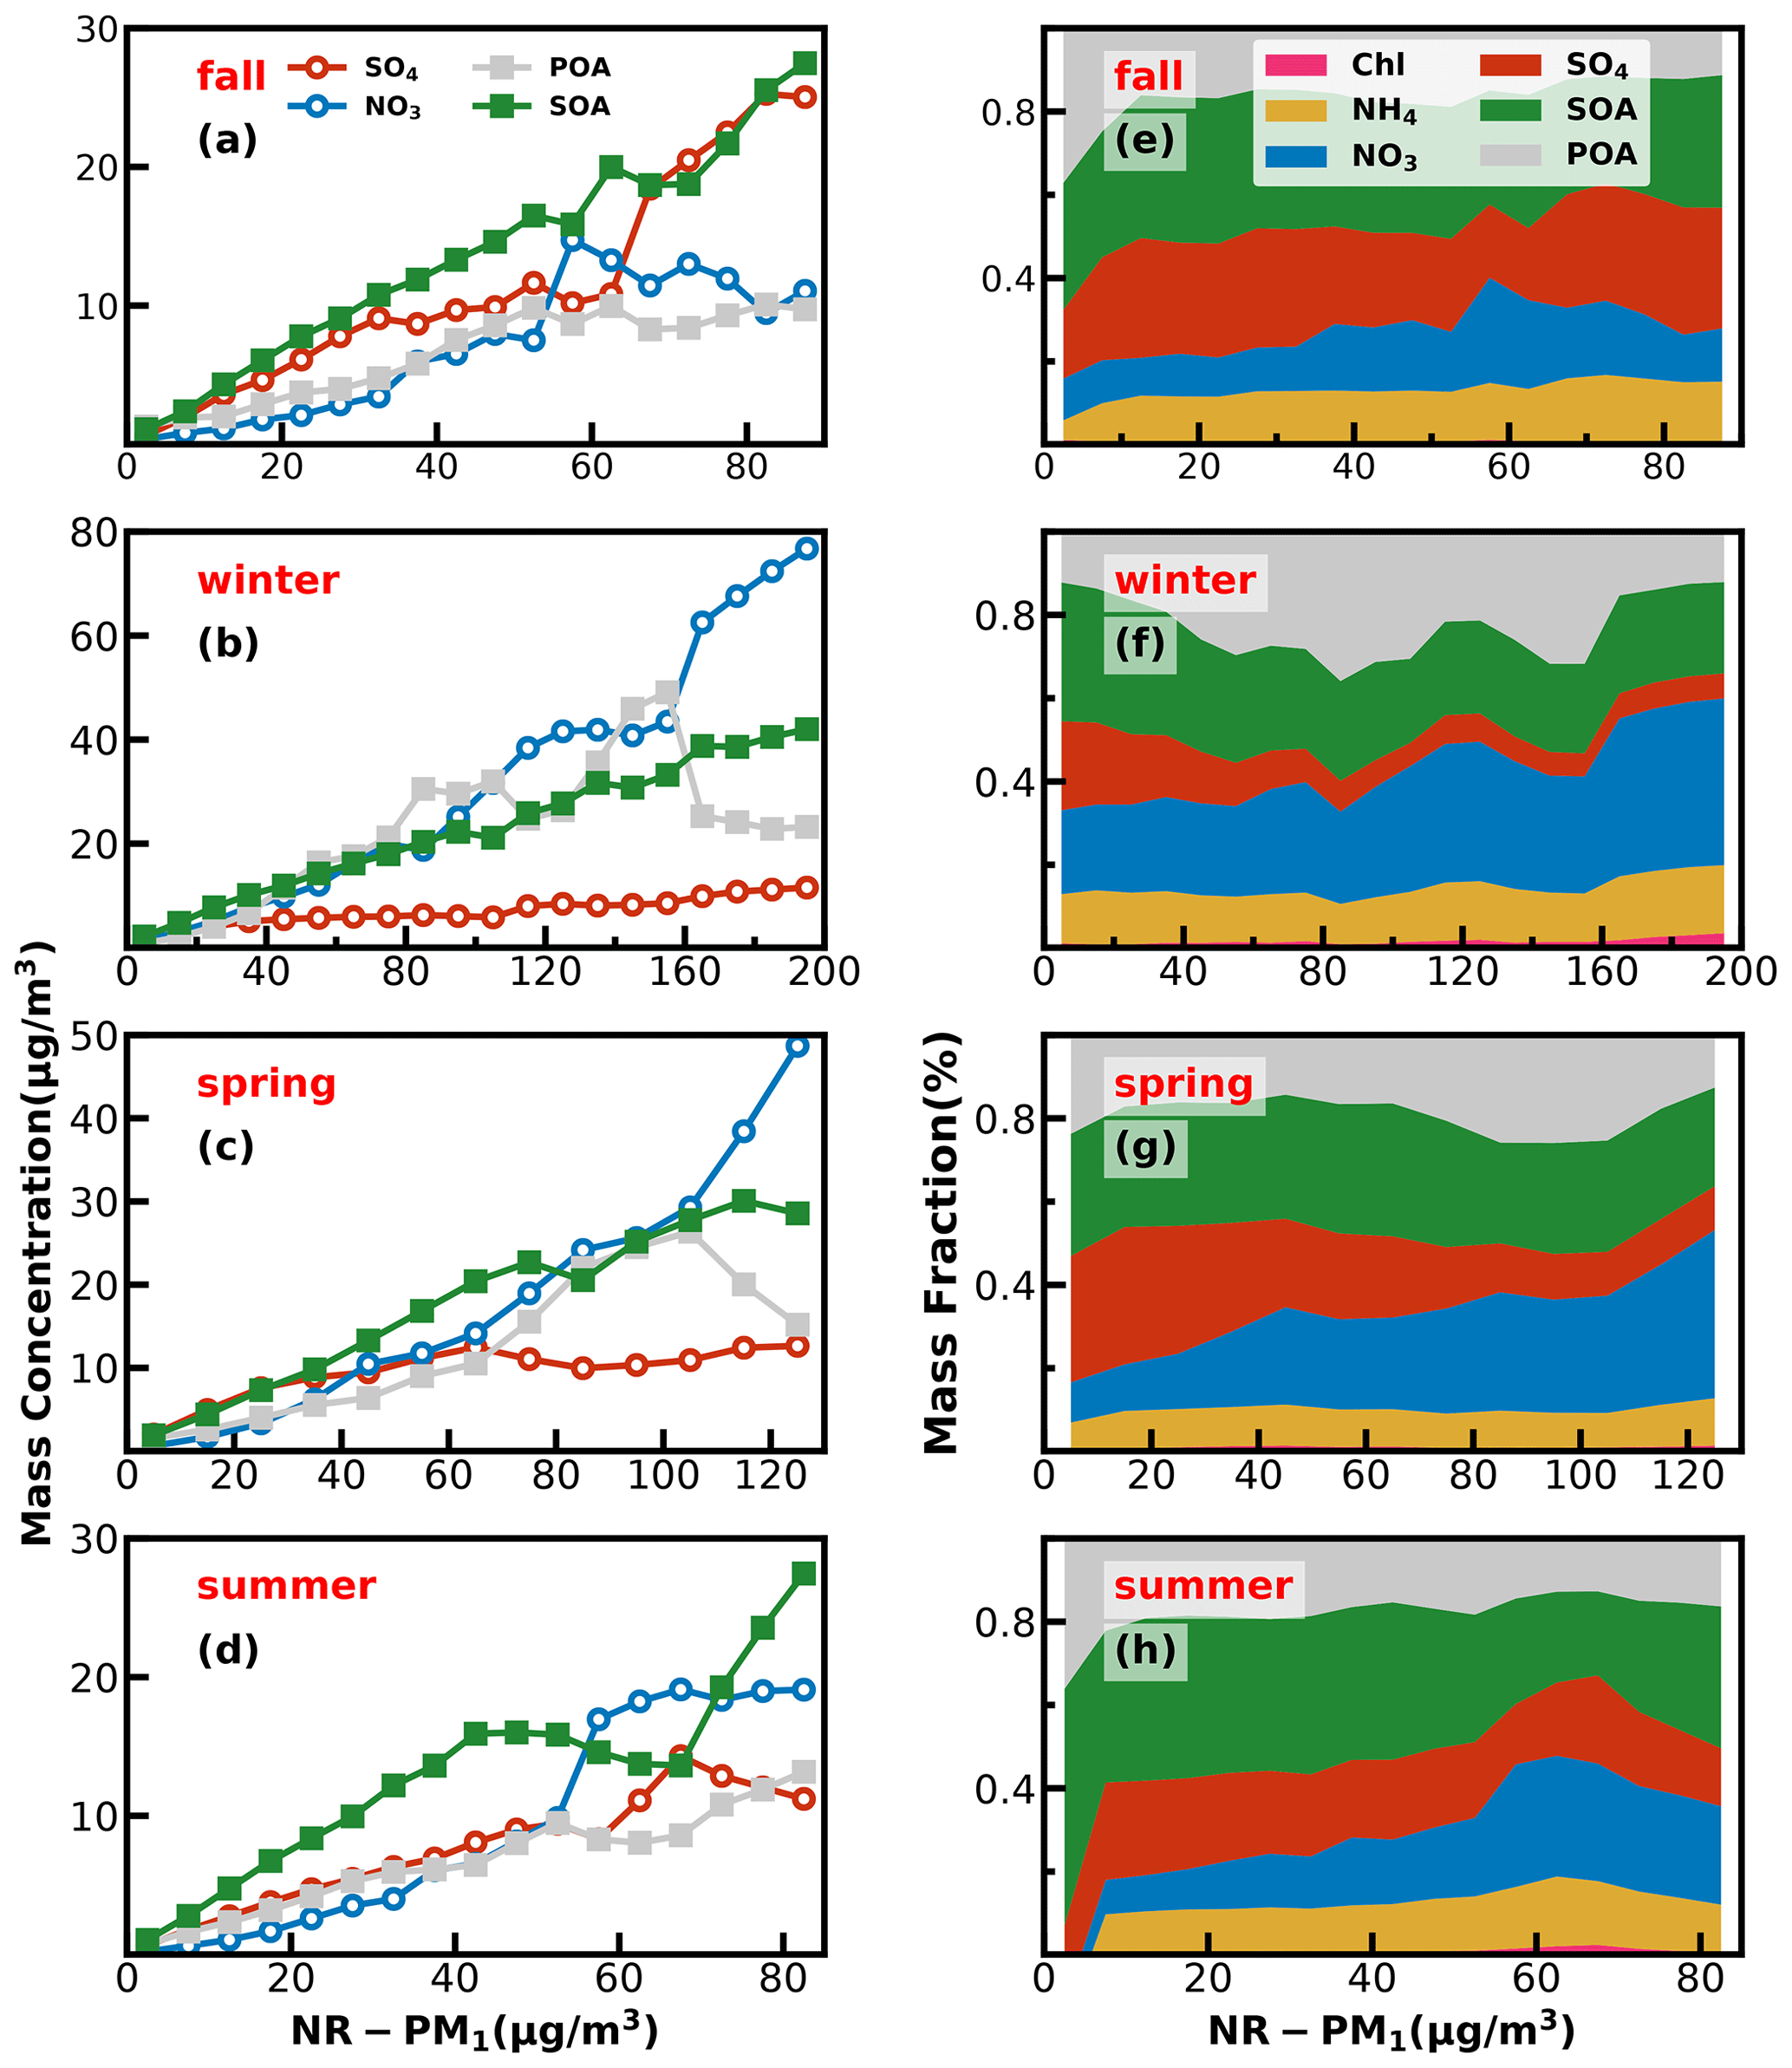
Figure 6Left panels (a–d) show absolute mass concentration variations of aerosol compositions under different NR-PM1 levels, and right panels (e–h) show mass fractions of chemical components as a function of NR-PM1.
In winter, haze formations are mostly associated with POA accumulations, SOA and nitrate formations, with nitrate formation playing the most important role, since it is also accompanied by ammonium formation, while sulfate formation was weak in winter. The fraction of OA increased gradually with the increase in NR-PM1 concentration for NR-PM1 < 90 µg m−3 and reached the maximum of 60 %, while the contribution of nitrate also showed a small increase from 21 % to 26 %. Under aggravating pollution, OA contribution fluctuated but showed a decreasing trend from 60 % to ∼ 40 %. Meanwhile, the nitrate contribution showed an increasing trend from 26 % to ∼ 40 %, which was similar to that of OA. Sulfate contribution decreased with the increase in NR-PM1 concentration for NR-PM1 < 100 µg m−3 and then remained at about 6 % as NR-PM1 increased. In addition, the POA contribution increased from about 25 % to 50 % for NR-PM1 < 100 µg m−3. Overall, the increase in nitrate, POA and SOA together resulted in severely polluted conditions in winter. The substantial contribution of POA to severe haze demonstrates that meteorological conditions unfavorable for the pollutant diffusion together with the substantial contributions of secondary nitrate and SOA formations have resulted in the most severe haze pollution among the years. HOA contribution to OA especially increased from 17 % to 52 % when NR-PM1 concentration was less than 140 µg m−3, suggesting the significant role of traffic emission accumulation during severe haze pollution, which was consistent with the results of Yao et al. (2020).
In spring, haze pollution was mostly associated with POA accumulation and secondary formations of nitrate and SOA, especially that of nitrate. The contribution of OA decreased from 51 % to 44 % as the NR-PM1 mass concentration increased when the NR-PM1 mass concentration was less than 50 µg m−3. When the mass concentration of NR-PM1 reached about 105 µg m−3, the fraction of OA reached a maximum of 55 % and then decreased to about 37 %. The most noticeable characteristic was the increase in the nitrate contribution (from 10 % to 40 %) and the decrease in the sulfate contribution (from 32 % to 10 %) as the NR-PM1 increased. In summer, secondary aerosol formations contributed dominantly to haze formations, and the POA contribution to NR-PM1 was about 20 % under most conditions. The overall contribution of OA gradually decreased from near 60 % to 35 % as the mass concentration of NR-PM1 increased for NR-PM1 concentration < 60 µg m−3, which was markedly different from those in other seasons but increased to 49 % as the NR-PM1 concentration increased further. The contribution of sulfate decreased from 25 % to 13 %, and the contribution of nitrate increased from 9.0 % to 31 % with the increase in NR-PM1 concentration for NR-PM1 concentration < 60 µg m−3, while the OA was dominated by SOA under most conditions (about 60 %).
Overall, haze-formation mechanisms differed much among distinct seasons. Sulfate was more significant than nitrate in fall, while nitrate was more significant than sulfate in spring and winter; however, SOA contributed significantly to haze formations in all the seasons. Note that seasonal variations of aerosol chemical compositions might differ much among years due to different meteorological conditions and emissions. For example, the evolution of sulfate during fall in this study (Fig. S10) has remarkably different accumulation characteristics from those observed in the fall of 2018 as shown in Fig. 1 of Chen et al. (2021a). However, our conclusions about SOA playing significant roles in haze formations in the Guangzhou urban area during all the seasons are consistent in the existing literature (Zhou et al., 2020).
3.3 Discussions of SOA-formation mechanisms
As shown in Fig. 3, both LOOA and MOOA mainly increased after sunrise, highlighting important roles of photochemistry in SOA formations. However, as demonstrated by Kuang et al. (2020), the daytime SOA formation could either be the result of gas-phase photochemistry and subsequent condensation (gasSOA) or the result of gas-phase VOC transformations with subsequent aqueous reactions (aqSOA). Since the PRD region especially is characterized by both active photochemistry due to strong solar radiation in subtropical regions and high relative humidity (annual average RH of ∼ 75 %), both photochemistry and aqueous-phase reactions might play significant roles in SOA formation, but this aspect was not explored before.
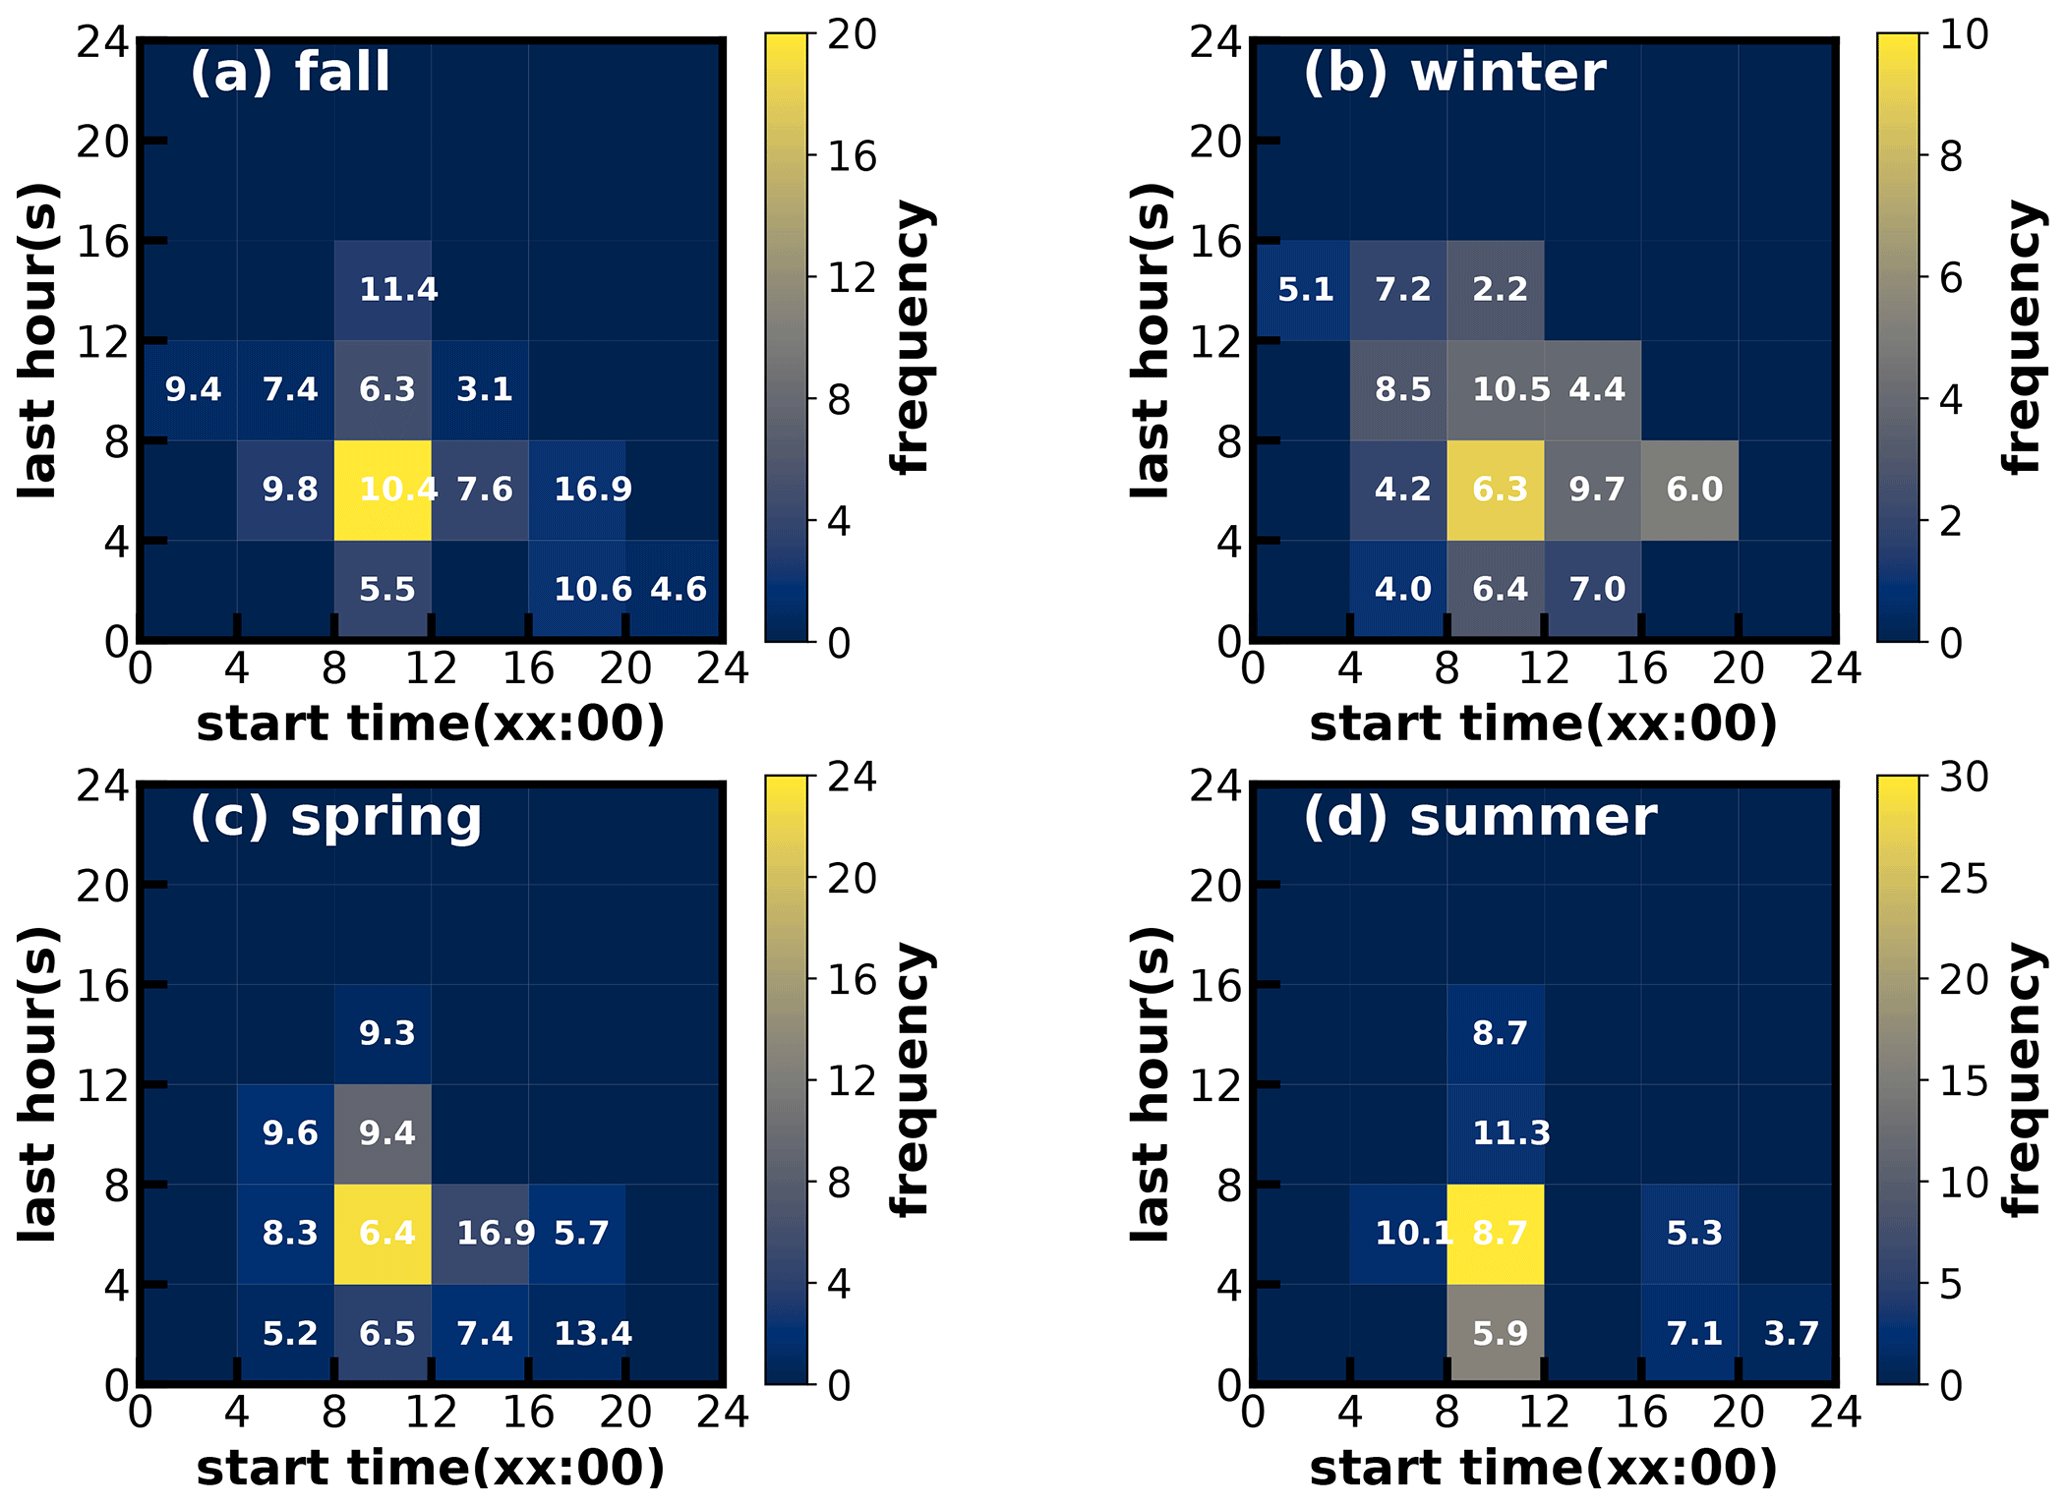
Figure 7Time–frequency diagrams of SOA increase events in (a) fall, (b) winter, (c) spring and (d) summer. The x axis represents the start time of SOA increase, and the y axis represents the lasting hours of SOA increase events. The color scales indicate the number of occurrences. The values in the grid are the average SOA concentration in the SOA increase case.
Considering the frequent co-increase in MOOA and LOOA, they were grouped together as SOA for further investigations of their formation. SOA-formation cases in the four seasons were identified, and the start time and lasting hours of their occurrences as well as the associated SOA levels are shown in Fig. 7. Note that the identification of SOA-formation cases has not considered the dilution effect of the lifting daytime boundary-layer height and was only based on the absolute mass-concentration variations. Therefore, this method has neglected some SOA-formation cases that were masked by evolutions of the boundary layer, and the identified cases represent active SOA-formation events that overcame dilution effects, which might be more suitable for further SOA-formation investigations due to strong SOA-formation signals. It shows that, in all the seasons, the SOA formation happened most frequently during daytime, starting in the morning and lasting about 4–8 h. In spring, summer and fall especially, the daytime SOA formation almost happened everyday (Figs. S5–S7), even if strong daytime boundary-layer evolutions could be expected in these seasons due to strong surface solar heating, and resulted in the afternoon SOA mass concentration peaks in these seasons (Fig. 3). However, the highest SOA concentrations did not appear in the seasons with the most frequent morning-to-afternoon increases. Taking SOA-formation cases in spring as an example, if the SOA increase started in the morning, more than 8 h duration will result in a significantly higher SOA concentration. These cases starting in the afternoon and lasting 4–8 h would result in the highest SOA concentration in spring. The SOA-formation cases starting in the morning, however, only lasting within 4 h, happened frequently in summer but less so in spring and fall, suggesting that the absolute SOA mass-concentration increase was more often stopped by strong boundary-layer mixing in summer, which was consistent with the solar-heating characteristics. The highest SOA in fall and winter were associated with the continuous increase in SOA after sunrise, suggesting that coordination of daytime and nighttime SOA formation together had resulted in the highest SOA concentrations in fall and winter.
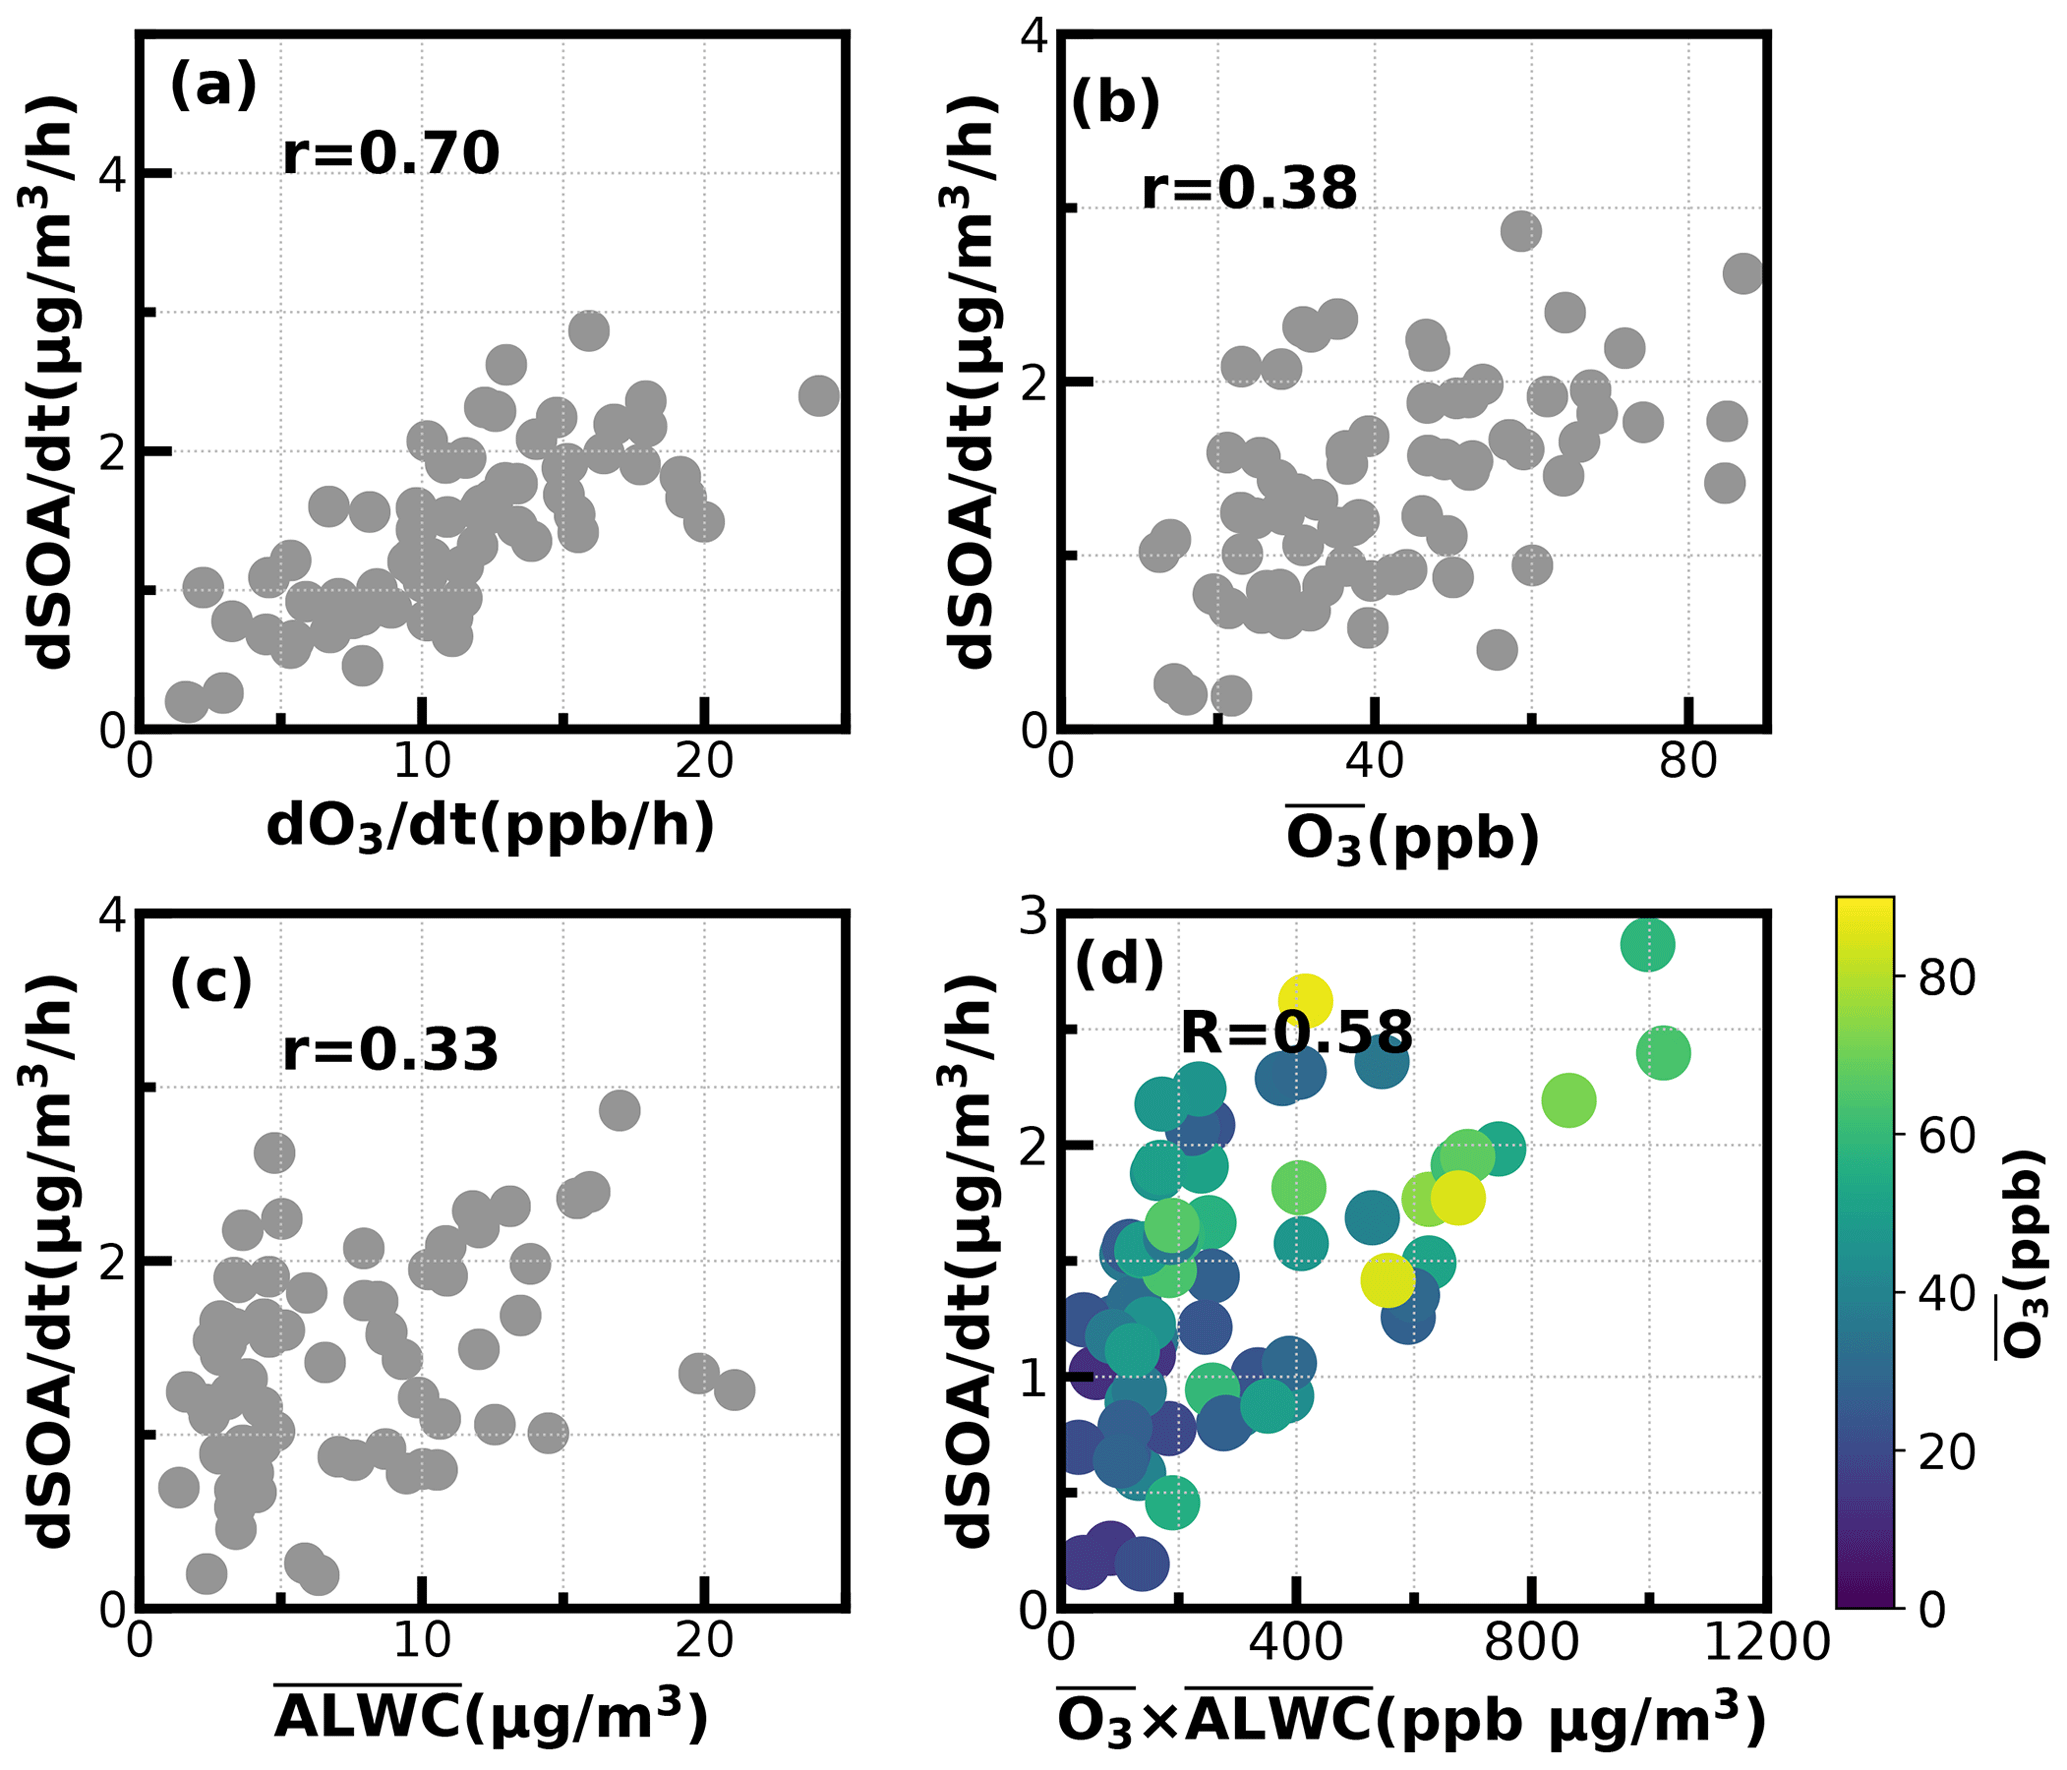
Figure 8Relationships between SOA daytime formation rates with the corresponding (a) O3 formation rate; (b) average O3; (c) average ALWC (µg m−3); (d) combination of averaged O3 and averaged ALWC.

Figure 9Average diurnal variations of (a) O3; (b) NO2; (c) CO; (d) ALWC; (e) nitrate; (f) sulfate; (g) MOOA; (h) LOOA; (i) RH for identified days with nighttime SOA increases.
To dig deeper into possible mechanisms behind the active daytime SOA formations throughout the year, we investigated relationships between SOA-formation rates and both O3 and ALWC for the most frequent morning-to-afternoon SOA increase cases. Without considering the dilution effect of a rising boundary layer, the daytime apparent growth rates of SOA varied from 0.2 to 4.4 µg m−3 h−1 (Fig. 8). Note that the SOA growth rates were calculated on the basis of observations of the first 4 h for each SOA increase case to reduce impacts of boundary-layer dilution effects. Some previous studies used variations of CO concentrations to partially correct for boundary-layer dilution effects; however, this method would fail at sites with strong CO emissions (Kuang et al., 2020). The SOA growth rates were highly correlated with O3 formation rates (r = 0.7) as shown in Fig. 8. However, this result only proved the important role of photochemistry in SOA formations. The apparent SOA growth rates showed a positive but much weaker correlation with the average O3 concentration during the period of SOA increase (r = 0.38), demonstrating that oxidant level was likely not the controlling factor in SOA formation, although O3 alone did not represent the variations of oxidation levels, and other sources such as HONO photolysis (Yu et al., 2022) also contribute to OH radicals and are typical oxidants in daytime photochemistry. To investigate the possible roles of aqueous reactions in SOA formation, the relationship between apparent SOA rates and the corresponding average ALWC were also investigated, and a positive but weak correlation was found (r = 0.33). More importantly, the correlation coefficient between apparent SOA growth rates and the variable of the average ALWC multiplied by the average O3 would be much higher (r = 0.58, Fig. 8d), suggesting that the coordination of gas-phase photochemistry and further aqueous reactions had likely resulted in the rapid daytime SOA formations.
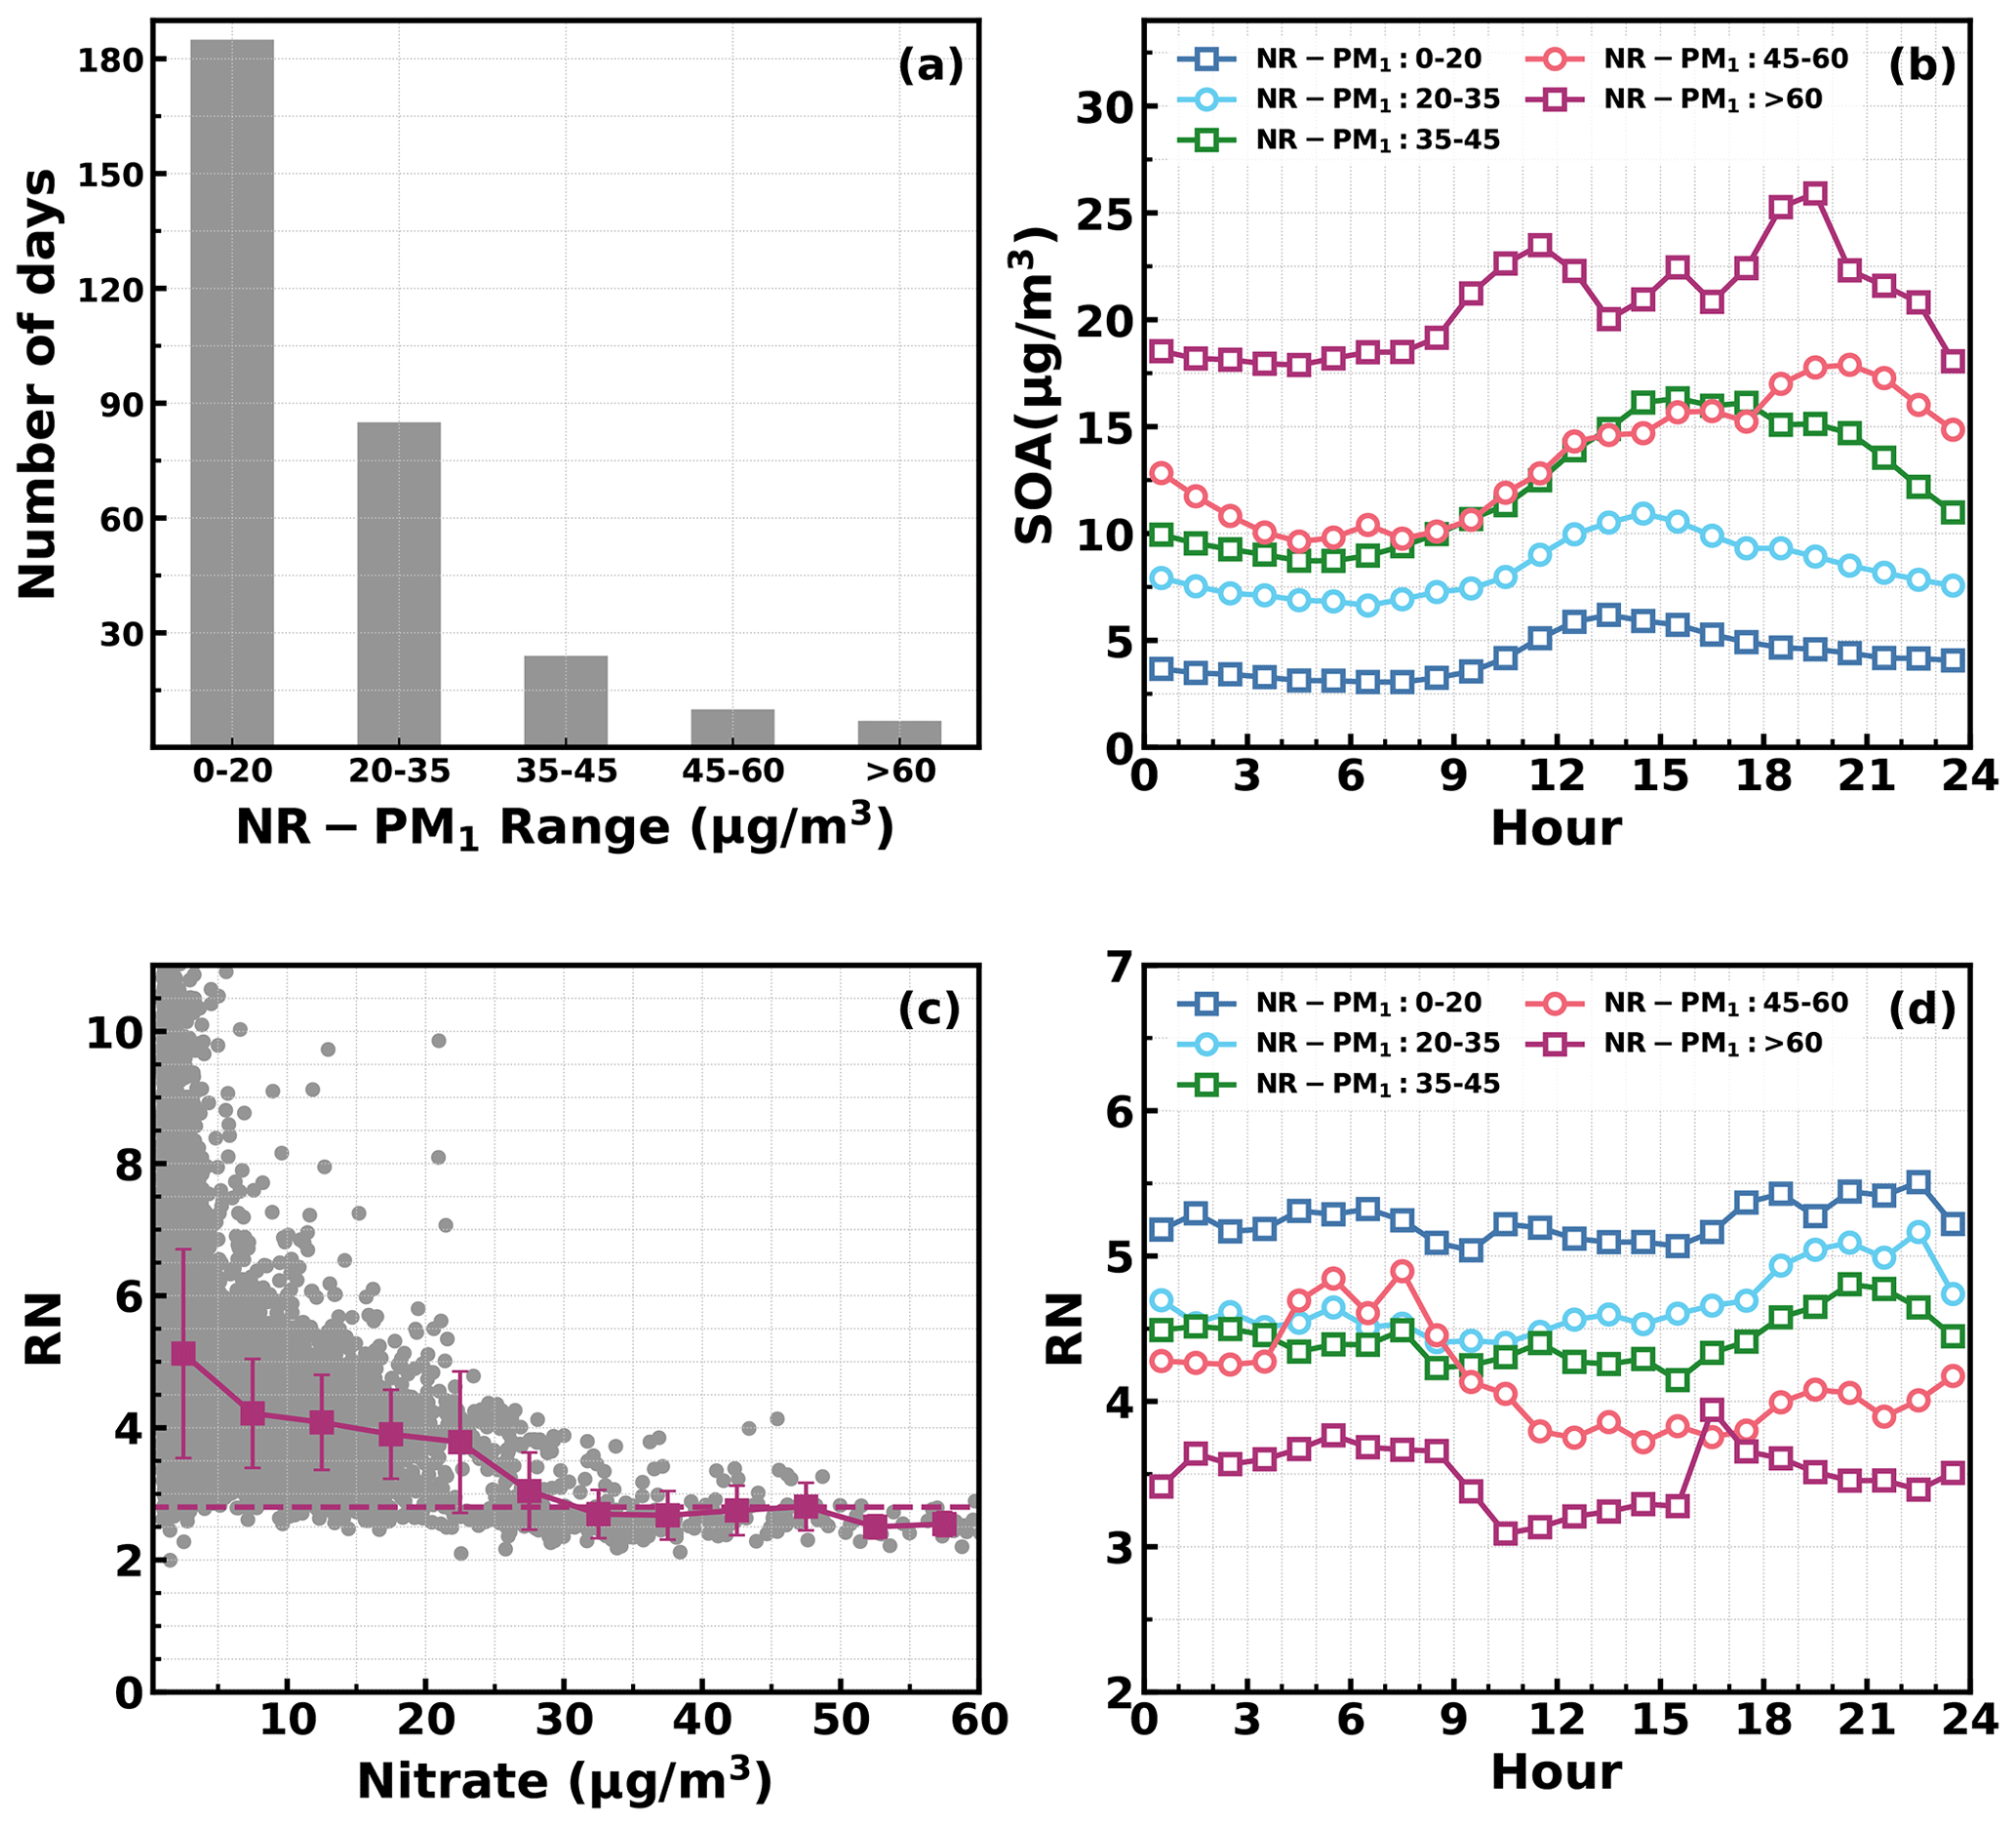
Figure 10(a) Number of days in different daily average NR_PM1 ranges. (b) Diurnal profiles of SOA in different NR_PM1 ranges. (c) Variations in NO+ NO (RN) as a function of measured nitrate: horizontal dashed line corresponds to an RN of 2.8, and red markers and bars represent averages and standard deviations. (d) Diurnal profiles of RN in different NR_PM1 ranges.
Besides the daytime SOA formation associated with photochemistry, dark transformations of VOCs that involve nighttime gas-phase and aqueous-phase reactions might also result in efficient SOA formations. As shown in Fig. 7, continuous increases in SOA were also frequently observed after sunset in spring (17 d), fall (18 d) and winter (20 d), with sporadic occurrences in summer, and the coordination of daytime and nighttime SOA formations together has resulted in the highest SOA concentrations in fall and winter which were associated with severe haze pollution as demonstrated above. Average diurnal profiles of O3, NO2, CO, RH, ALWC, nitrate, sulfate, LOOA and MOOA for cases with co-increases in LOOA and MOOA after 18:00 LT in different seasons are shown in Fig. 9. On average, SOA usually showed decreases during nighttime (Fig. 3) due to transport of air masses from cleaner suburban regions. The average wind speed was 1.7 m s−1 from 18:00 to 23:00 LT for identified nighttime SOA increase cases and was obviously lower than the corresponding average wind speed of 2.3 m s−1, suggesting that the more stagnant air mass tended to favor the nighttime SOA increases. However, the nighttime 5 h back trajectories shown in Fig. S11 demonstrated that the nighttime replacement of surrounding suburban cleaner air masses still prevailed; therefore, the continuous increases in SOA suggested that nighttime SOA formation occurred on a regional scale. The increases in LOOA and MOOA were accompanied by obvious nitrate formation in all the seasons as well as slight increases in sulfate, further indicating for the regional scale nighttime secondary aerosol formations during these nighttime SOA-formation events. Except for summer, a continuous increase in SOA from morning to nighttime confirmed that the coordination of daytime and nighttime SOA formations had contributed to haze formations. The number of days for daily average NR-PM1 ranges of 0–20, 20–35, 35–45, 45–60 and > 60 µg m−3 were 185, 85, 24, 10 and 7, respectively (Fig. 10a). All cases with a daily average NR-PM1 higher than 45 µg m−3 occurred in fall, winter and spring. The corresponding average diurnal variations of SOA for these relatively severe conditions shown in Fig. 10b confirmed further that the coordination of daytime and nighttime SOA formations had contributed to severe haze formations in the Guangzhou urban area.
The NO3 radical formed through the reaction between NO2 and O3 is the typical nighttime oxidant. Results of Rollins et al. (2012) and Kiendler-Scharr et al. (2016) revealed that NO3 oxidation of VOCs would contribute substantially to nighttime SOA increase. As shown in Fig. 9a, after sunset, the O3 concentration decreased quickly but remained substantially higher than zero, accompanied by remarkable increases in NO2 and nitrate. In the Guangzhou urban area, nitrate can either be formed through gas-phase oxidation of NO2 by OH which forms HNO3 and then condenses onto the aerosol phase or be formed through the hydrolysis of N2O5, which is formed through reactions between NO2 and NO3 radicals (Yang et al., 2022). The obvious co-increases in nitrate and SOA after sunset indicated that the decrease in O3 and increase in NO2 consumption had supplied the NO3 and N2O5 reaction chains, and the increase in ALWC favored the hydrolysis of N2O5. This was indirectly confirmed when, during winter, despite relatively high concentrations of O3 and NO2 after sunrise compared with the other seasons, nitrate formation was much less prominent due to a substantially lower ALWC associated with lower RH. However, the quick increase in SOA still occurred after sunset despite weak daytime SOA formation, suggesting that aqueous reactions might play minor roles in nighttime SOA formation that involve NO3 radicals in the Guangzhou urban area. The nighttime chemistry that involves NO3 radicals might contribute substantially to organic nitrate formation (Ng et al., 2008; Fry et al., 2009; Rollins et al., 2012), which would produce the same ions (NO+ and NO) with inorganic nitrate due to the fragmentation of nitrate functionality (-ONO2) under 70 eV electron ionization in the aerosol mass spectrometer measurements. However, organic nitrate has different fragmentation patterns from that of inorganic nitrate, and previous laboratory studies have shown that the RN = NO+ NO of organic nitrate is substantially higher than that of inorganic nitrate. Farmer et al. (2010) thus proposed that the RN variations can be used as an indicator of organic nitrate formations. The Q-ACSM measurements with unit mass resolution cannot provide accurate measurements of RN due to the resolution limitation (Allan et al., 2004), but the resolved RN related to measured nitrate might provide qualitative constraints on impacts of organic nitrates. The variations of resolved RN as a function of measured nitrate are shown in Fig. 10c, which shows that at high levels of nitrate where inorganic nitrate usually dominates (Xu et al., 2021), the RN approaches near 2.8, which was close to the inorganic nitrate RN reported in Xu et al. (2021) and located in the range of 1.1–3.5 of inorganic nitrate RN reported in the literature (Xu et al., 2015). Diurnal variations of RN under different pollution levels shown in Fig. 10d reveal a higher nighttime RN than daytime, and an obvious continuous increase in RN after sunset can be observed for relatively clean and polluted conditions (daily average NR-PM1 of 20–35 µg m−3 to NR-PM1 of 45–60 µg m−3), suggesting active nighttime organic nitrate formations, which confirmed the involvement of NO3 radicals in nighttime SOA formations.
In this study, we highlighted the significant roles of SOA in haze formations in the Guangzhou urban area during the entire year and pointed out that, for the most prominent and frequent daytime SOA formations all year round, both gas-phase photochemistry and aqueous reactions played significant roles. Therefore, daytime SOA formation was weak in winter when oxidant levels and RH were low, whereas prominent SOA formations were observed in fall, spring and summer on an almost daily basis. However, how gas-phase and aqueous-phase reactions have coordinated to promote the SOA formation and the different contributions of gasSOA and aqSOA to SOA formations under different meteorological conditions and VOC profiles in different seasons is not clear. In addition, our results suggested that the coordination of daytime and nighttime SOA formation together had resulted in the highest SOA concentrations in the Guangzhou urban area, thus contributing significantly to severe haze formation. The co-increases in nitrate and SOA after sunrise indicated the significant role of nighttime NO3 radical chemistry in promoting haze formations. However, our understanding of how nighttime chemistry evolved and contributed to secondary aerosol formations in different seasons is still highly insufficient in this region. Therefore, the precursors and formation pathways of daytime and nighttime SOA formations and how they coordinated to promote severe haze formations need further comprehensive investigations to make targeted emission-control strategies to continuously improve air quality in the PRD region. Also, the findings of this study have important implications for future investigations of SOA-formation mechanisms in urban areas of southern China that share similar emission sources and meteorological conditions.
All data needed are presented in the time series of the figures and Supplement figures. Raw datasets of this study are available from the correspondence author Li Liu (liul@gd121.cn) upon request.
The supplement related to this article is available online at: https://doi.org/10.5194/acp-23-5119-2023-supplement.
YK and LL designed the aerosol experiments. YK conceived and led this research. MZ and YK wrote the manuscript. MZ and LL conducted the long-term Q-ACSM measurements. MZ and YH performed the PMF analysis. HX, CY, YZ and FL helped maintain and calibrate the Q-ACSM. CL provided the meteorological datasets, and BL performed the AE33 measurements and data postprocessing. XD obtained funding for the continuous aerosol measurements. JT and WX provided insights into data analysis, and all the authors contributed to revisions of this paper.
The contact author has declared that none of the authors has any competing interests
Publisher’s note: Copernicus Publications remains neutral with regard to jurisdictional claims in published maps and institutional affiliations.
We want to thank Yao He for teaching us PMF and ME-2 techniques, although she is already in the co-authors list.
This work is supported by the Guangdong Provincial Key Research and Development Program (grant no. 2020B1111360003), the National Natural Science Foundation of China (grant nos. 42175083 and 42105092), the Guangdong Basic and Applied Basic Research Foundation (grant nos. 2019A1515110791 and 2019A1515011808), the National Key Research and Development Program of China (grant no. 2019YFCO214605), the Science and Technology Innovation Team Plan of the Guangdong Meteorological Bureau (grant no. GRMCTD202003) and the Special Fund Project for Science and Technology Innovation Strategy of Guangdong Province (grant no. 2019B121205004).
This paper was edited by Roya Bahreini and reviewed by Shaojie Song and one anonymous referee.
Allan, J. D., Delia, A. E., Coe, H., Bower, K. N., Alfarra, M. R., Jimenez, J. L., Middlebrook, A. M., Drewnick, F., Onasch, T. B., Canagaratna, M. R., Jayne, J. T., and Worsnop, D. R.: A generalised method for the extraction of chemically resolved mass spectra from Aerodyne aerosol mass spectrometer data, J. Aerosol Sci., 35, 909–922, https://doi.org/10.1016/j.jaerosci.2004.02.007, 2004.
Canagaratna, M. R., Jayne, J. T., Jimenez, J. L., Allan, J. D., Alfarra, M. R., Zhang, Q., Onasch, T. B., Drewnick, F., Coe, H., Middlebrook, A., Delia, A., Williams, L. R., Trimborn, A. M., Northway, M. J., DeCarlo, P. F., Kolb, C. E., Davidovits, P., and Worsnop, D. R.: Chemical and microphysical characterization of ambient aerosols with the aerodyne aerosol mass spectrometer, Mass Spectrom. Rev., 26, 185–222, https://doi.org/10.1002/mas.20115, 2007.
Canonaco, F., Crippa, M., Slowik, J. G., Baltensperger, U., and Prévôt, A. S. H.: SoFi, an IGOR-based interface for the efficient use of the generalized multilinear engine (ME-2) for the source apportionment: ME-2 application to aerosol mass spectrometer data, Atmos. Meas. Tech., 6, 3649–3661, https://doi.org/10.5194/amt-6-3649-2013, 2013.
Canonaco, F., Tobler, A., Chen, G., Sosedova, Y., Slowik, J. G., Bozzetti, C., Daellenbach, K. R., El Haddad, I., Crippa, M., Huang, R.-J., Furger, M., Baltensperger, U., and Prévôt, A. S. H.: A new method for long-term source apportionment with time-dependent factor profiles and uncertainty assessment using SoFi Pro: application to 1 year of organic aerosol data, Atmos. Meas. Tech., 14, 923–943, https://doi.org/10.5194/amt-14-923-2021, 2021.
Chen, W., Ye, Y., Hu, W., Zhou, H., Pan, T., Wang, Y., Song, W., Song, Q., Ye, C., Wang, C., Wang, B., Huang, S., Yuan, B., Zhu, M., Lian, X., Zhang, G., Bi, X., Jiang, F., Liu, J., Canonaco, F., Prevot, A. S. H., Shao, M., and Wang, X.: Real-Time Characterization of Aerosol Compositions, Sources, and Aging Processes in Guangzhou During PRIDE-GBA 2018 Campaign, J. Geophys. Res.-Atmos., 126, e2021JD035114, https://doi.org/10.1029/2021JD035114, 2021a.
Chen, W., Ye, Y. Q., Hu, W. W., Zhou, H. S., Pan, T. L., Wang, Y. K., Song, W., Song, Q. C., Ye, C. S., Wang, C. M., Wang, B. L., Huang, S., Yuan, B., Zhu, M., Lian, X. F., Zhang, G. H., Bi, X. H., Jiang, F., Liu, J. W., Canonaco, F., Prevot, A. S. H., Shao, M., and Wang, X. M.: Real-Time Characterization of Aerosol Compositions, Sources, and Aging Processes in Guangzhou During PRIDE-GBA 2018 Campaign, J. Geophys. Res.-Atmos., 126, e2021JDO35114, https://doi.org/10.1029/2021JD035114, 2021b.
Drinovec, L., Močnik, G., Zotter, P., Prévôt, A. S. H., Ruckstuhl, C., Coz, E., Rupakheti, M., Sciare, J., Müller, T., Wiedensohler, A., and Hansen, A. D. A.: The “dual-spot” Aethalometer: an improved measurement of aerosol black carbon with real-time loading compensation, Atmos. Meas. Tech., 8, 1965–1979, https://doi.org/10.5194/amt-8-1965-2015, 2015.
Ervens, B., Turpin, B. J., and Weber, R. J.: Secondary organic aerosol formation in cloud droplets and aqueous particles (aqSOA): a review of laboratory, field and model studies, Atmos. Chem. Phys., 11, 11069–11102, https://doi.org/10.5194/acp-11-11069-2011, 2011.
Farmer, D. K., Matsunaga, A., Docherty, K. S., Surratt, J. D., Seinfeld, J. H., Ziemann, P. J., and Jimenez, J. L.: Response of an aerosol mass spectrometer to organonitrates and organosulfates and implications for atmospheric chemistry, P. Natl. Acad. Sci. USA, 107, 6670–6675, https://doi.org/10.1073/pnas.0912340107, 2010.
Fry, J. L., Kiendler-Scharr, A., Rollins, A. W., Wooldridge, P. J., Brown, S. S., Fuchs, H., Dubé, W., Mensah, A., dal Maso, M., Tillmann, R., Dorn, H.-P., Brauers, T., and Cohen, R. C.: Organic nitrate and secondary organic aerosol yield from NO3 oxidation of β-pinene evaluated using a gas-phase kinetics/aerosol partitioning model, Atmos. Chem. Phys., 9, 1431–1449, https://doi.org/10.5194/acp-9-1431-2009, 2009.
Guo, H., Liu, J., Froyd, K. D., Roberts, J. M., Veres, P. R., Hayes, P. L., Jimenez, J. L., Nenes, A., and Weber, R. J.: Fine particle pH and gas–particle phase partitioning of inorganic species in Pasadena, California, during the 2010 CalNex campaign, Atmos. Chem. Phys., 17, 5703–5719, https://doi.org/10.5194/acp-17-5703-2017, 2017.
Guo, J., Zhou, S., Cai, M., Zhao, J., Song, W., Zhao, W., Hu, W., Sun, Y., He, Y., Yang, C., Xu, X., Zhang, Z., Cheng, P., Fan, Q., Hang, J., Fan, S., Wang, X., and Wang, X.: Characterization of submicron particles by time-of-flight aerosol chemical speciation monitor (ToF-ACSM) during wintertime: aerosol composition, sources, and chemical processes in Guangzhou, China, Atmos. Chem. Phys., 20, 7595–7615, https://doi.org/10.5194/acp-20-7595-2020, 2020.
He, L. Y., Huang, X. F., Xue, L., Hu, M., Lin, Y., Zheng, J., Zhang, R. Y., and Zhang, Y. H.: Submicron aerosol analysis and organic source apportionment in an urban atmosphere in Pearl River Delta of China using high-resolution aerosol mass spectrometry, J. Geophys. Res.-Atmos., 116, D12304, https://doi.org/10.1029/2010jd014566, 2011.
Huang, X., Ding, A., Gao, J., Zheng, B., Zhou, D., Qi, X., Tang, R., Wang, J., Ren, C., Nie, W., Chi, X., Xu, Z., Chen, L., Li, Y., Che, F., Pang, N., Wang, H., Tong, D., Qin, W., Cheng, W., Liu, W., Fu, Q., Liu, B., Chai, F., Davis, S. J., Zhang, Q., and He, K.: Enhanced secondary pollution offset reduction of primary emissions during COVID-19 lockdown in China, Natl. Sci. Rev., 8, nwaa137, https://doi.org/10.1093/nsr/nwaa137, 2021.
Huang, X.-F., He, L.-Y., Hu, M., Canagaratna, M. R., Kroll, J. H., Ng, N. L., Zhang, Y.-H., Lin, Y., Xue, L., Sun, T.-L., Liu, X.-G., Shao, M., Jayne, J. T., and Worsnop, D. R.: Characterization of submicron aerosols at a rural site in Pearl River Delta of China using an Aerodyne High-Resolution Aerosol Mass Spectrometer, Atmos. Chem. Phys., 11, 1865–1877, https://doi.org/10.5194/acp-11-1865-2011, 2011.
Jayne, J. T., Leard, D. C., Zhang, X. F., Davidovits, P., Smith, K. A., Kolb, C. E., and Worsnop, D. R.: Development of an aerosol mass spectrometer for size and composition analysis of submicron particles, Aerosol Sci. Tech., 33, 49–70, https://doi.org/10.1080/027868200410840, 2000.
Jimenez, J. L., Jayne, J. T., Shi, Q., Kolb, C. E., Worsnop, D. R., Yourshaw, I., Seinfeld, J. H., Flagan, R. C., Zhang, X. F., Smith, K. A., Morris, J. W., and Davidovits, P.: Ambient aerosol sampling using the Aerodyne Aerosol Mass Spectrometer, J. Geophys. Res.-Atmos., 108, 8425, https://doi.org/10.1029/2001jd001213, 2003.
Jimenez, J. L., Canagaratna, M. R., Donahue, N. M., Prevot, A. S. H., Zhang, Q., Kroll, J. H., DeCarlo, P. F., Allan, J. D., Coe, H., Ng, N. L., Aiken, A. C., Docherty, K. S., Ulbrich, I. M., Grieshop, A. P., Robinson, A. L., Duplissy, J., Smith, J. D., Wilson, K. R., Lanz, V. A., Hueglin, C., Sun, Y. L., Tian, J., Laaksonen, A., Raatikainen, T., Rautiainen, J., Vaattovaara, P., Ehn, M., Kulmala, M., Tomlinson, J. M., Collins, D. R., Cubison, M. J., Dunlea, J., Huffman, J. A., Onasch, T. B., Alfarra, M. R., Williams, P. I., Bower, K., Kondo, Y., Schneider, J., Drewnick, F., Borrmann, S., Weimer, S., Demerjian, K., Salcedo, D., Cottrell, L., Griffin, R., Takami, A., Miyoshi, T., Hatakeyama, S., Shimono, A., Sun, J. Y., Zhang, Y. M., Dzepina, K., Kimmel, J. R., Sueper, D., Jayne, J. T., Herndon, S. C., Trimborn, A. M., Williams, L. R., Wood, E. C., Middlebrook, A. M., Kolb, C. E., Baltensperger, U., and Worsnop, D. R.: Evolution of Organic Aerosols in the Atmosphere, Science, 326, 1525–1529, https://doi.org/10.1126/science.1180353, 2009.
Kiendler-Scharr, A., Mensah, A. A., Friese, E., Topping, D., Nemitz, E., Prevot, A. S. H., Äijälä, M., Allan, J., Canonaco, F., Canagaratna, M., Carbone, S., Crippa, M., Dall Osto, M., Day, D. A., De Carlo, P., Di Marco, C. F., Elbern, H., Eriksson, A., Freney, E., Hao, L., Herrmann, H., Hildebrandt, L., Hillamo, R., Jimenez, J. L., Laaksonen, A., McFiggans, G., Mohr, C., O'Dowd, C., Otjes, R., Ovadnevaite, J., Pandis, S. N., Poulain, L., Schlag, P., Sellegri, K., Swietlicki, E., Tiitta, P., Vermeulen, A., Wahner, A., Worsnop, D., and Wu, H.-C.: Ubiquity of organic nitrates from nighttime chemistry in the European submicron aerosol, Geophys. Res. Lett., 43, 7735–7744, https://doi.org/10.1002/2016gl069239, 2016.
Kuang, Y., He, Y., Xu, W., Yuan, B., Zhang, G., Ma, Z., Wu, C., Wang, C., Wang, S., Zhang, S., Tao, J., Ma, N., Su, H., Cheng, Y., Shao, M., and Sun, Y.: Photochemical Aqueous-Phase Reactions Induce Rapid Daytime Formation of Oxygenated Organic Aerosol on the North China Plain, Environ. Sci. Technol., 54, 3849–3860, https://doi.org/10.1021/acs.est.9b06836, 2020.
Lei, L., Sun, Y., Ouyang, B., Qiu, Y., Xie, C., Tang, G., Zhou, W., He, Y., Wang, Q., Cheng, X., Fu, P., and Wang, Z.: Vertical Distributions of Primary and Secondary Aerosols in Urban Boundary Layer: Insights into Sources, Chemistry, and Interaction with Meteorology, Environ. Sci. Technol., 55, 4542–4552, https://doi.org/10.1021/acs.est.1c00479, 2021.
Li, Y. J., Lee, B. P., Su, L., Fung, J. C. H., and Chan, C. K.: Seasonal characteristics of fine particulate matter (PM) based on high-resolution time-of-flight aerosol mass spectrometric (HR-ToF-AMS) measurements at the HKUST Supersite in Hong Kong, Atmos. Chem. Phys., 15, 37–53, https://doi.org/10.5194/acp-15-37-2015, 2015.
Li, Z., Lei, L., Li, Y., Chen, C., Wang, Q., Zhou, W., Sun, J., Xie, C., and Sun, Y.: Aerosol characterization in a city in central China plain and implications for emission control, J. Environ. Sci. (China), 104, 242–252, https://doi.org/10.1016/j.jes.2020.11.015, 2021.
Liu, L., Kuang, Y., Zhai, M., Xue, B., He, Y., Tao, J., Luo, B., Xu, W., Tao, J., Yin, C., Li, F., Xu, H., Deng, T., Deng, X., Tan, H., and Shao, M.: Strong light scattering of highly oxygenated organic aerosols impacts significantly on visibility degradation, Atmos. Chem. Phys., 22, 7713–7726, https://doi.org/10.5194/acp-22-7713-2022, 2022.
Middlebrook, A. M., Bahreini, R., Jimenez, J. L., and Canagaratna, M. R.: Evaluation of Composition-Dependent Collection Efficiencies for the Aerodyne Aerosol Mass Spectrometer using Field Data, Aerosol Sci. Tech., 46, 258–271, https://doi.org/10.1080/02786826.2011.620041, 2012.
Mohr, C., DeCarlo, P. F., Heringa, M. F., Chirico, R., Slowik, J. G., Richter, R., Reche, C., Alastuey, A., Querol, X., Seco, R., Peñuelas, J., Jiménez, J. L., Crippa, M., Zimmermann, R., Baltensperger, U., and Prévôt, A. S. H.: Identification and quantification of organic aerosol from cooking and other sources in Barcelona using aerosol mass spectrometer data, Atmos. Chem. Phys., 12, 1649–1665, https://doi.org/10.5194/acp-12-1649-2012, 2012.
Ng, N. L., Kwan, A. J., Surratt, J. D., Chan, A. W. H., Chhabra, P. S., Sorooshian, A., Pye, H. O. T., Crounse, J. D., Wennberg, P. O., Flagan, R. C., and Seinfeld, J. H.: Secondary organic aerosol (SOA) formation from reaction of isoprene with nitrate radicals (NO3), Atmos. Chem. Phys., 8, 4117–4140, https://doi.org/10.5194/acp-8-4117-2008, 2008.
Ng, N. L., Herndon, S. C., Trimborn, A., Canagaratna, M. R., Croteau, P. L., Onasch, T. B., Sueper, D., Worsnop, D. R., Zhang, Q., Sun, Y. L., and Jayne, J. T.: An Aerosol Chemical Speciation Monitor (ACSM) for Routine Monitoring of the Composition and Mass Concentrations of Ambient Aerosol, Aerosol Sci. Tech., 45, 780–794, https://doi.org/10.1080/02786826.2011.560211, 2011.
Paatero, P.: The Multilinear Engine – A Table-Driven, Least Squares Program for Solving Multilinear Problems, Including then-Way Parallel Factor Analysis Model, J. Comput. Graph. Stat., 8, 854–888, https://doi.org/10.1080/10618600.1999.10474853, 1999.
Qin, Y. M., Tan, H. B., Li, Y. J., Schurman, M. I., Li, F., Canonaco, F., Prévôt, A. S. H., and Chan, C. K.: Impacts of traffic emissions on atmospheric particulate nitrate and organics at a downwind site on the periphery of Guangzhou, China, Atmos. Chem. Phys., 17, 10245–10258, https://doi.org/10.5194/acp-17-10245-2017, 2017.
Rollins, A. W., Browne, E. C., Min, K. E., Pusede, S. E., Wooldridge, P. J., Gentner, D. R., Goldstein, A. H., Liu, S., Day, D. A., Russell, L. M., and Cohen, R. C.: Evidence for NOx Control over Nighttime SOA Formation, Science, 337, 1210, https://doi.org/10.1126/science.1221520, 2012.
Su, H., Cheng, Y., and Pöschl, U.: New Multiphase Chemical Processes Influencing Atmospheric Aerosols, Air Quality, and Climate in the Anthropocene, Accounts Chem. Res., 53, 2034–2043, https://doi.org/10.1021/acs.accounts.0c00246, 2020.
Sun, Y., Du, W., Fu, P., Wang, Q., Li, J., Ge, X., Zhang, Q., Zhu, C., Ren, L., Xu, W., Zhao, J., Han, T., Worsnop, D. R., and Wang, Z.: Primary and secondary aerosols in Beijing in winter: sources, variations and processes, Atmos. Chem. Phys., 16, 8309–8329, https://doi.org/10.5194/acp-16-8309-2016, 2016.
Sun, Y., Xu, W., Zhang, Q., Jiang, Q., Canonaco, F., Prévôt, A. S. H., Fu, P., Li, J., Jayne, J., Worsnop, D. R., and Wang, Z.: Source apportionment of organic aerosol from 2-year highly time-resolved measurements by an aerosol chemical speciation monitor in Beijing, China, Atmos. Chem. Phys., 18, 8469–8489, https://doi.org/10.5194/acp-18-8469-2018, 2018.
Sun, Y.-L., Zhang, Q., Schwab, J. J., Demerjian, K. L., Chen, W.-N., Bae, M.-S., Hung, H.-M., Hogrefe, O., Frank, B., Rattigan, O. V., and Lin, Y.-C.: Characterization of the sources and processes of organic and inorganic aerosols in New York city with a high-resolution time-of-flight aerosol mass apectrometer, Atmos. Chem. Phys., 11, 1581–1602, https://doi.org/10.5194/acp-11-1581-2011, 2011.
Sun, Y. L., Wang, Z. F., Dong, H. B., Yang, T., Li, J., Pan, X. L., Chen, P., and Jayne, J. T.: Characterization of summer organic and inorganic aerosols in Beijing, China with an Aerosol Chemical Speciation Monitor, Atmos. Environ., 51, 250–259, https://doi.org/10.1016/j.atmosenv.2012.01.013, 2012.
Sun, Y. L., Wang, Z. F., Fu, P. Q., Yang, T., Jiang, Q., Dong, H. B., Li, J., and Jia, J. J.: Aerosol composition, sources and processes during wintertime in Beijing, China, Atmos. Chem. Phys., 13, 4577–4592, https://doi.org/10.5194/acp-13-4577-2013, 2013.
Sun, Y. L., Wang, Z. F., Du, W., Zhang, Q., Wang, Q. Q., Fu, P. Q., Pan, X. L., Li, J., Jayne, J., and Worsnop, D. R.: Long-term real-time measurements of aerosol particle composition in Beijing, China: seasonal variations, meteorological effects, and source analysis, Atmos. Chem. Phys., 15, 10149–10165, https://doi.org/10.5194/acp-15-10149-2015, 2015.
Ulbrich, I. M., Canagaratna, M. R., Zhang, Q., Worsnop, D. R., and Jimenez, J. L.: Interpretation of organic components from Positive Matrix Factorization of aerosol mass spectrometric data, Atmos. Chem. Phys., 9, 2891–2918, https://doi.org/10.5194/acp-9-2891-2009, 2009.
Xu, L., Suresh, S., Guo, H., Weber, R. J., and Ng, N. L.: Aerosol characterization over the southeastern United States using high-resolution aerosol mass spectrometry: spatial and seasonal variation of aerosol composition and sources with a focus on organic nitrates, Atmos. Chem. Phys., 15, 7307–7336, https://doi.org/10.5194/acp-15-7307-2015, 2015.
Xu, W., Kuang, Y., Bian, Y., Liu, L., Li, F., Wang, Y., Xue, B., Luo, B., Huang, S., Yuan, B., Zhao, P., and Shao, M.: Current Challenges in Visibility Improvement in Southern China, Environ. Sci. Technol. Lett., 7, 395–401, https://doi.org/10.1021/acs.estlett.0c00274, 2020.
Xu, W., Takeuchi, M., Chen, C., Qiu, Y., Xie, C., Xu, W., Ma, N., Worsnop, D. R., Ng, N. L., and Sun, Y.: Estimation of particulate organic nitrates from thermodenuder–aerosol mass spectrometer measurements in the North China Plain, Atmos. Meas. Tech., 14, 3693–3705, https://doi.org/10.5194/amt-14-3693-2021, 2021.
Yang, D., Li, C., Lau, A. K. H., and Li, Y.: Long-term measurement of daytime atmospheric mixing layer height over Hong Kong, J. Geophys. Res., 118, 2422–2433, 2013.
Yang, S., Yuan, B., Peng, Y., Huang, S., Chen, W., Hu, W., Pei, C., Zhou, J., Parrish, D. D., Wang, W., He, X., Cheng, C., Li, X.-B., Yang, X., Song, Y., Wang, H., Qi, J., Wang, B., Wang, C., Wang, C., Wang, Z., Li, T., Zheng, E., Wang, S., Wu, C., Cai, M., Ye, C., Song, W., Cheng, P., Chen, D., Wang, X., Zhang, Z., Wang, X., Zheng, J., and Shao, M.: The formation and mitigation of nitrate pollution: comparison between urban and suburban environments, Atmos. Chem. Phys., 22, 4539–4556, https://doi.org/10.5194/acp-22-4539-2022, 2022.
Yao, T., Li, Y., Gao, J., Fung, J. C. H., Wang, S., Li, Y., Chan, C. K., and Lau, A. K. H.: Source apportionment of secondary organic aerosols in the Pearl River Delta region: Contribution from the oxidation of semi-volatile and intermediate volatility primary organic aerosols, Atmos. Environ., 222, 117111, https://doi.org/10.1016/j.atmosenv.2019.117111, 2020.
Yu, Y., Cheng, P., Li, H., Yang, W., Han, B., Song, W., Hu, W., Wang, X., Yuan, B., Shao, M., Huang, Z., Li, Z., Zheng, J., Wang, H., and Yu, X.: Budget of nitrous acid (HONO) at an urban site in the fall season of Guangzhou, China, Atmos. Chem. Phys., 22, 8951–8971, https://doi.org/10.5194/acp-22-8951-2022, 2022.
Zhang, Q., Jimenez, J. L., Canagaratna, M. R., Allan, J. D., Coe, H., Ulbrich, I., Alfarra, M. R., Takami, A., Middlebrook, A. M., Sun, Y. L., Dzepina, K., Dunlea, E., Docherty, K., DeCarlo, P. F., Salcedo, D., Onasch, T., Jayne, J. T., Miyoshi, T., Shimono, A., Hatakeyama, S., Takegawa, N., Kondo, Y., Schneider, J., Drewnick, F., Borrmann, S., Weimer, S., Demerjian, K., Williams, P., Bower, K., Bahreini, R., Cottrell, L., Griffin, R. J., Rautiainen, J., Sun, J. Y., Zhang, Y. M., and Worsnop, D. R.: Ubiquity and dominance of oxygenated species in organic aerosols in anthropogenically-influenced Northern Hemisphere midlatitudes, Geophys. Res. Lett., 34, L13801, https://doi.org/10.1029/2007GL029979, 2007.
Zhang, Q., Jimenez, J. L., Canagaratna, M. R., Ulbrich, I. M., Ng, N. L., Worsnop, D. R., and Sun, Y.: Understanding atmospheric organic aerosols via factor analysis of aerosol mass spectrometry: a review, Anal. Bioanal. Chem., 401, 3045–3067, https://doi.org/10.1007/s00216-011-5355-y, 2011.
Zhang, Y. J., Tang, L. L., Wang, Z., Yu, H. X., Sun, Y. L., Liu, D., Qin, W., Canonaco, F., Prévôt, A. S. H., Zhang, H. L., and Zhou, H. C.: Insights into characteristics, sources, and evolution of submicron aerosols during harvest seasons in the Yangtze River delta region, China, Atmos. Chem. Phys., 15, 1331–1349, https://doi.org/10.5194/acp-15-1331-2015, 2015.
Zhao, J., Qiu, Y., Zhou, W., Xu, W., Wang, J., Zhang, Y., Li, L., Xie, C., Wang, Q., Du, W., Worsnop, D. R., Canagaratna, M. R., Zhou, L., Ge, X., Fu, P., Li, J., Wang, Z., Donahue, N. M., and Sun, Y.: Organic Aerosol Processing During Winter Severe Haze Episodes in Beijing, J. Geophys. Res.-Atmos., 124, 10248–10263, https://doi.org/10.1029/2019JD030832, 2019.
Zhou, W., Xu, W., Kim, H., Zhang, Q., Fu, P., Worsnop, D. R., and Sun, Y.: A review of aerosol chemistry in Asia: insights from aerosol mass spectrometer measurements, Environ. Sci.-Proc. Imp., 22, 1616–1653, https://doi.org/10.1039/D0EM00212G, 2020.