the Creative Commons Attribution 4.0 License.
the Creative Commons Attribution 4.0 License.
 | 04 May 2023
Parameterization of size of organic and secondary inorganic aerosol for efficient representation of global aerosol optical properties
Randall V. Martin
Betty Croft
Shixian Zhai
Liam Bindle
Jeffrey R. Pierce
Rachel Y.-W. Chang
Bruce E. Anderson
Luke D. Ziemba
Johnathan W. Hair
Richard A. Ferrare
Chris A. Hostetler
Inderjeet Singh
Deepangsu Chatterjee
Jose L. Jimenez
Pedro Campuzano-Jost
Benjamin A. Nault
Jack E. Dibb
Joshua S. Schwarz
Andrew Weinheimer
Accurate representation of aerosol optical properties is essential for the modeling and remote sensing of atmospheric aerosols. Although aerosol optical properties are strongly dependent upon the aerosol size distribution, the use of detailed aerosol microphysics schemes in global atmospheric models is inhibited by associated computational demands. Computationally efficient parameterizations for aerosol size are needed. In this study, airborne measurements over the United States (DISCOVER-AQ) and South Korea (KORUS-AQ) are interpreted with a global chemical transport model (GEOS-Chem) to investigate the variation in aerosol size when organic matter (OM) and sulfate–nitrate–ammonium (SNA) are the dominant aerosol components. The airborne measurements exhibit a strong correlation (r=0.83) between dry aerosol size and the sum of OM and SNA mass concentration (MSNAOM). A global microphysical simulation (GEOS-Chem-TOMAS) indicates that MSNAOM and the ratio between the two components () are the major indicators for SNA and OM dry aerosol size. A parameterization of the dry effective radius (Reff) for SNA and OM aerosol is designed to represent the airborne measurements (R2=0.74; slope = 1.00) and the GEOS-Chem-TOMAS simulation (R2=0.72; slope = 0.81). When applied in the GEOS-Chem high-performance model, this parameterization improves the agreement between the simulated aerosol optical depth (AOD) and the ground-measured AOD from the Aerosol Robotic Network (AERONET; R2 from 0.68 to 0.73 and slope from 0.75 to 0.96). Thus, this parameterization offers a computationally efficient method to represent aerosol size dynamically.
- Article
(4679 KB) - Full-text XML
- BibTeX
- EndNote


Aerosol size has numerous effects on aerosol physical and chemical properties and further on atmospheric chemistry. Aerosol-size-dependent heterogeneous chemistry affects gaseous oxidants that in turn affect the production rates of aerosol components such as sulfate and secondary organic aerosol (Ervens et al., 2011; Estillore et al., 2016). Aerosol size also affects loss rates due to dry and wet deposition (Seinfeld and Pandis, 2016). Both direct and indirect aerosol radiative forcing are sensitive to aerosol size, as aerosol size affects the interaction between particles and radiation, and the water supersaturation ratio needed for a particle to be activated into a cloud droplet (Adams and Seinfeld, 2002; Faxvog and Roessler, 1978; Mishchenko et al., 2002; Emerson et al., 2020). The size dependence of aerosol extinction and scattering-phase function also affects the retrieval of aerosol properties from satellites (Levy et al., 2013; Kahn et al., 2005; Jin et al., 2023). Aerosol size affects the fraction of particles that deposit in the body when breathing in addition to the location within the body where they deposit (Hinds and Zhu, 1999). An appropriate representation of aerosol size is essential for modeling aerosol composition and optical properties (Kodros and Pierce, 2017), interpreting satellite data (Levy et al., 2013; Kahn et al., 2005), studying climate processes (Twomey, 2007; Kellogg, 1980), and moving from aerosol exposure towards health studies (Kodros et al., 2018).
The evolution of the aerosol size distribution is affected by various processes, such as nucleation, condensation, coagulation, and deposition. Nucleation events contribute to the number of particles in the nucleation mode (diameters less than about 10 nm) and thus tend to decrease the mean aerosol size for a population (Aalto et al., 2001). In polluted areas with high emission rates of aerosol precursors, the mean aerosol size tends to increase by condensation and coagulation (Sakamoto et al., 2016; Sun et al., 2011). Dry and wet aerosol deposition have strong size dependencies due to competing physical processes (Emerson et al., 2020; Ruijrok et al., 1995; Reutter et al., 2009). The aerosol size distribution can be simulated using aerosol microphysical schemes, such as the TwO-Moment Aerosol Sectional (TOMAS; Adams and Seinfeld, 2002) microphysics model, the advanced particle microphysics (APM; Yu and Luo, 2009) model, the Global Model of Aerosol Processes (GLOMAP; Mann et al., 2010), and the four-mode version of the Modal Aerosol Module (MAM4; Liu et al., 2016). These schemes have valuable prognostic capabilities; however, their computational cost has limited their use in chemistry climate models (CCMs) or chemical transport models (CTMs). For example, the wall clock time increases by about 2.5 times when APM is enabled in GEOS-Chem CTM relative to the bulk model (GCST et al., 2023). Only 3 of the 10 models that included aerosols, studied by the Atmospheric Chemistry and Climate Model Intercomparison Project (ACCMIP), include online size-resolved aerosol microphysics, reflecting its computational cost and complexity (Lamarque et al., 2013; Liu et al., 2012; Szopa et al., 2013; Kodros and Pierce, 2017).
Methods are needed to better represent aerosol size in CCMs or CTMs without a microphysics scheme (referred to as bulk models). These bulk models usually use prescribed relationships to obtain size-resolved aerosol properties (Croft et al., 2005; Karydis et al., 2011; Zhai et al., 2021), which may insufficiently represent the temporal and spatial variation (Kodros and Pierce, 2017). For example, in the GEOS-Chem (Goddard Earth Observing System coupled with chemistry) CTM, a fixed dry aerosol geometric mean radius (Rg) is assumed for organic matter (OM) and sulfate–nitrate–ammonium (SNA), which is based on analysis of long-term aerosol composition and scattering measurements provided by the IMPROVE network across the continental USA (Latimer and Martin, 2019). However, subsequent analysis by Zhai et al. (2021) found that this aerosol size underestimated the aerosol mass scattering efficiency and the aerosol extinction coefficients during an aircraft campaign over South Korea (KORUS-AQ). Thus, neglecting the aerosol microphysical processes that shape aerosol size distributions can be a significant source of uncertainty in aerosol optical properties in a CTM. A balance between computational cost and representativeness of aerosol size is needed. One option is to use models with size-resolved aerosol microphysics models to inform bulk models, such as was done for the parameterization of biomass burning aerosol size by Sakamoto et al. (2016).
Recent airborne measurements offer information to evaluate and improve the simulation of aerosol size. DISCOVER-AQ (Deriving Information on Surface conditions from Column and Vertically Resolved Observations Relevant to Air Quality) was a multi-year campaign over four USA cities that provides 3-D-resolved measurements of atmospheric gas composition, aerosol composition, size distribution, and optical properties (Choi et al., 2020; Sawamura et al., 2017; Chu et al., 2015). KORUS-AQ (the Korea–United States Air Quality Study) offers similar measurements in a different environment with higher aerosol mass loadings (Choi et al., 2020; Zhai et al., 2021; Nault et al., 2018; Jordan et al., 2020).
To study the global variation in aerosol size, we explore airborne measurements from DISCOVER-AQ and KORUS-AQ, in addition to output from the GEOS-Chem-TOMAS microphysics model. We focus on OM and SNA, which dominate fine aerosol composition in populated areas (Weagle et al., 2018; Geng et al., 2017; Meng et al., 2019; Van Donkelaar et al., 2019; Li et al., 2017). The driving factors for the variation in aerosol size are examined. A parameterization of aerosol size using these driving factors is proposed. This parameterization is then applied to a GEOS-Chem high-performance model bulk simulation for global aerosol optical depth (AOD), which is evaluated by ground-measured AOD from the Aerosol Robotic Network (AERONET).
2.1 Observations
2.1.1 Aircraft measurements
We examine airborne measurements from two NASA campaigns, DISCOVER-AQ and KORUS-AQ. DISCOVER-AQ includes four deployments in Maryland (MD), California (CA), Texas (TX), and Colorado (CO). KORUS-AQ is an international cooperative field study program conducted in South Korea (KO), sponsored by NASA and the South Korean government through the National Institute of Environmental Research. The year, date range, and altitude range of each deployment are given in Table 1.
Measurements used in this study include aerosol composition, ambient aerosol extinction, aerosol number size distribution, gas tracer species, and meteorological data. Measurement methods are listed in Table 2. Measured aerosol mass is converted from a standard to an ambient condition before analysis using ambient temperature and pressure. We use OM directly measured during KORUS-AQ. We use water-soluble organic carbon (OC) and a parameterized ratio between OM and OC (Philip et al., 2014) to calculate OM for DISCOVER-AQ. The parameterized OM is evaluated with KORUS-AQ data, and consistency is found overall (Fig. A1; Appendix A). For both campaigns, dust concentration is derived from Ca2+ and Na+, assuming that non-sea-salt Ca2+ accounts for 7.1 % of dust mass, as follows (Shah et al., 2020):
Sea salt is calculated from measured Na+, following previous studies (Remoundaki et al., 2013; Malm et al., 1994; Snider et al., 2016). The crustal component is removed by subtracting 10 % of the [Al3+] (Remoundaki et al., 2013). A 2.54 scalar is applied to [Na+]ss to account for [Cl−], as follows (Malm et al., 1994):
The effective radius (Reff; Hansen and Travis, 1974), defined as the area-weighted mean radius of a particle population, is used as a surrogate for aerosol size, as follows:
Measurement data are screened for dust influence by excluding data with the sum of SNA and OM (MSNAOM) < 4 × dust mass.
Table 1Temporal and spatial coverage of each aircraft deployment.
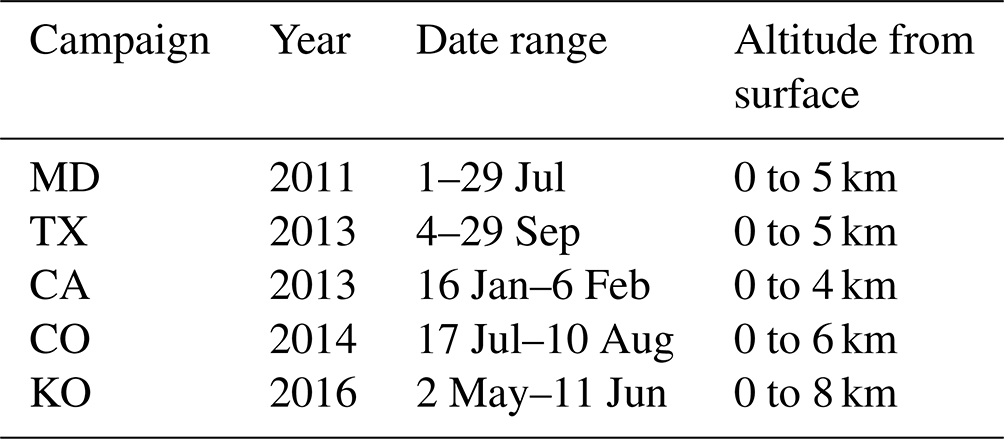
Table 2Aircraft observations used in this study∗.
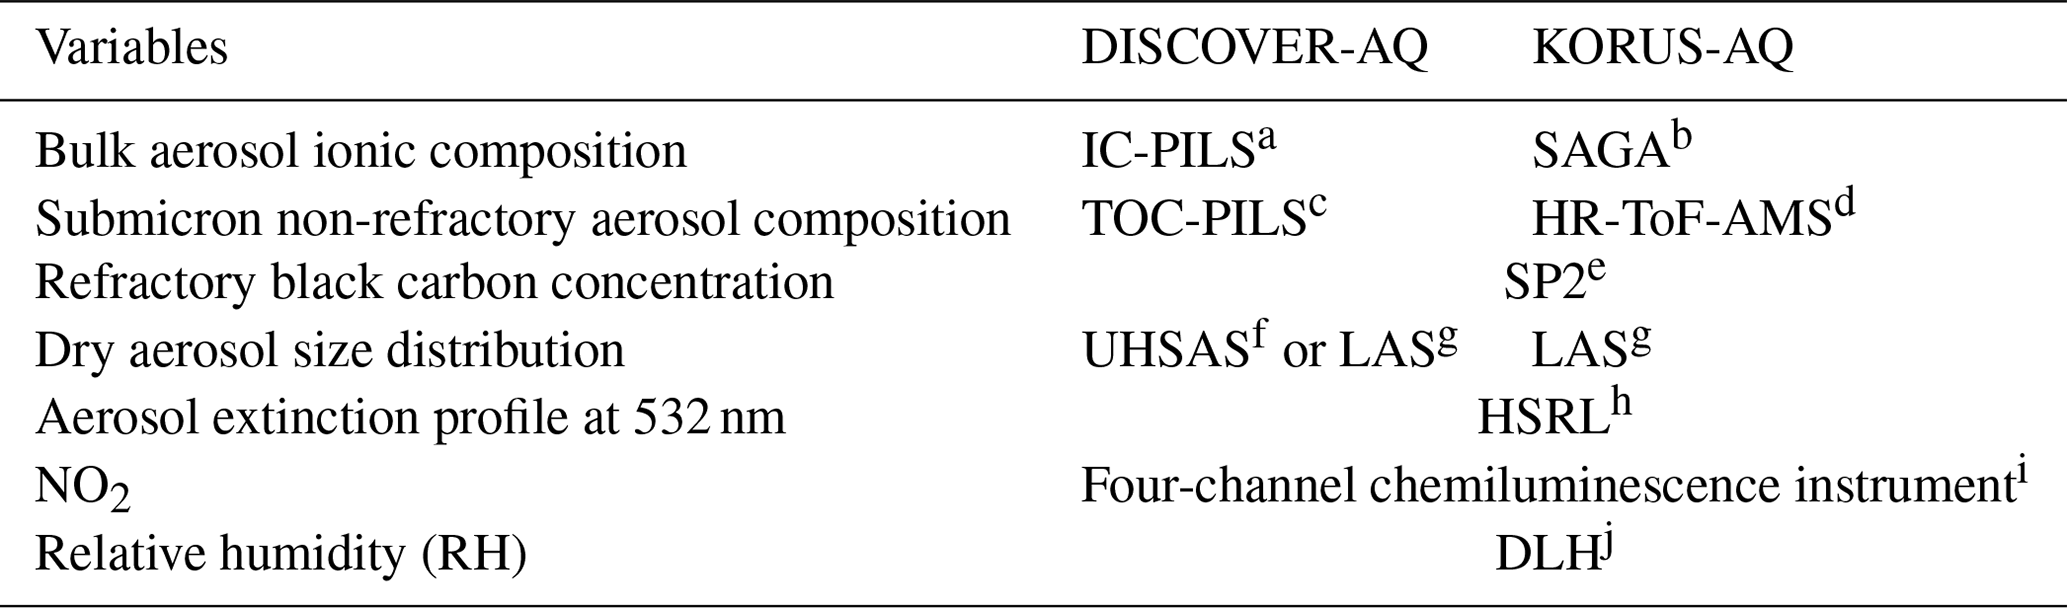
∗ Adapted from Zhai et al. (2021). a Ion chromatography particle-into-liquid sampler (PILS), with a 1.3 µm inlet cutoff aerodynamic diameter (Lee et al., 2003; Hayes et al., 2013). b Soluble Acidic Gases and Aerosol (SAGA) instrument (Dibb et al., 2003). The cutoff aerodynamic diameter of the inlet is around 4 µm (McNaughton et al., 2007). c Water-soluble organic carbon particle-into-liquid sampler, with a 1 µm inlet cutoff diameter at 1013.25 hPa (Sullivan et al., 2019; Timonen et al., 2010). d University of Colorado, Boulder, high-resolution time-of-flight aerosol mass spectrometer (HR-ToF-AMS) with a 1 µm inlet cutoff diameter (Nault et al., 2018; Guo et al., 2021; Canagaratna et al., 2007). e Single-particle soot photometer (SP2), measuring refractory black carbon with a volume equivalent diameter of 100–500 nm (Lamb et al., 2018; Schwarz et al., 2006). f Particles with mobility diameters between 60 to 1000 nm can be measured by ultra-high-sensitivity aerosol spectrometer (UHSAS), which illuminates particles with a laser and relates the single-particle light scattering intensity and count rate measured over a wide range of angles to the size-dependent particle concentration (Moore et al., 2021). Particles in the sample are dried to less than 20 % relative humidity (RH). g Particles between 100 to 5000 nm. measured by a laser aerosol spectrometer (LAS; TSI, model 3340). The principle of LAS is the same as that of UHSAS but with a different laser wavelength (1054 nm for the UHSAS and 633 nm for the LAS) and intensity (about 100 times higher for the UHSAS). These differences affect how the instrument sizes non-spherical or absorbing aerosols (Moore et al., 2021). Particles in the sample are dried to less than 20 % RH. h NASA Langley airborne High Spectral Resolution Lidar (HSRL; Hair et al., 2008). i National Center for Atmospheric Research (NCAR) four-channel chemiluminescence instrument (Weinheimer et al., 1993). j NASA Diode Laser Hygrometer (DLH; Podolske et al., 2003).
2.1.2 AERONET AOD
We use ground-based AOD observations to evaluate our parameterization and simulated AOD. The Aerosol Robotic Network (AERONET) is a worldwide network that provides long-term sun-photometer-measured AOD and is conventionally considered to be the ground truth for evaluating model-simulated (Zhai et al., 2021; Meng et al., 2021; Jin et al., 2023) or satellite-retrieved AOD (Levy et al., 2013; Wang et al., 2014a; Kahn et al., 2005; Lyapustin et al., 2018). We use the Version 3 Level 2 database, which includes an improved cloud-screening algorithm (Giles et al., 2019). AOD at 550 nm wavelength, interpolated based on the local Ångström exponent at 440 and 670 nm channels, is used in this study. For each site, we use data for the year 2017, excluding months with fewer than 20 d of measurements and excluding sites with fewer than 4 months of observations.
2.2 GEOS-Chem simulation
We interpret the aircraft observations with the GEOS-Chem chemical transport model (http://www.geos-chem.org, last access: 30 October 2022). GEOS-Chem is driven by offline meteorological data from the Goddard Earth Observing System (GEOS) of the NASA Global Modeling and Assimilation Office (Schubert et al., 1993). We use the high-performance implementation of GEOS-Chem (GCHP; Eastham et al., 2018; Bindle et al., 2021) to examine the effect of the variation in aerosol size on AOD. We also use the TOMAS microphysical scheme, coupled with the standard GEOS-Chem implementation (GEOS-Chem Classic), to explicitly resolve aerosol microphysics. The bulk and microphysics simulations share common emissions and chemical mechanisms. They are both conducted for the year 2017 and driven by the meteorological fields of the Modern-Era Retrospective Analysis for Research and Applications, version 2 (MERRA-2).
The GEOS-Chem aerosol simulation includes the sulfate–nitrate–ammonium system (Fountoukis and Nenes, 2007; Park, 2004), primary and secondary carbonaceous aerosols (Park et al., 2003; Wang et al., 2014b; Marais et al., 2016; Pye et al., 2010), sea salt (Jaeglé et al., 2011), and mineral dust (Fairlie et al., 2007). The primary emission data are from the Community Emissions Data System (CEDSGBD-MAPS; McDuffie et al., 2020). Dust emission inventories include updated natural dust emission (Meng et al., 2021), and anthropogenic fugitive, combustion, and industrial dust (AFCID; Philip et al., 2017). Resolution-dependent soil NOx, sea salt, biogenic volatile organic compounds (VOCs), and natural dust emissions are calculated offline at native meteorological resolution to produce consistent emissions across resolution (Weng et al., 2020; Meng et al., 2021). Biomass burning emissions use the Global Fire Emissions Database, version 4 (GFED4; van der Werf et al., 2017). We estimate organic matter (OM) from primary organic carbon using the same parameterizations as applied for DISCOVER-AQ (Philip et al., 2014; Canagaratna et al., 2015). Dry and wet deposition follows Amos et al. (2012), with a standard resistance-in-series dry deposition scheme (Wang et al., 1998). Wet deposition includes scavenging processes from convection and large-scale precipitation (Liu et al., 2001).
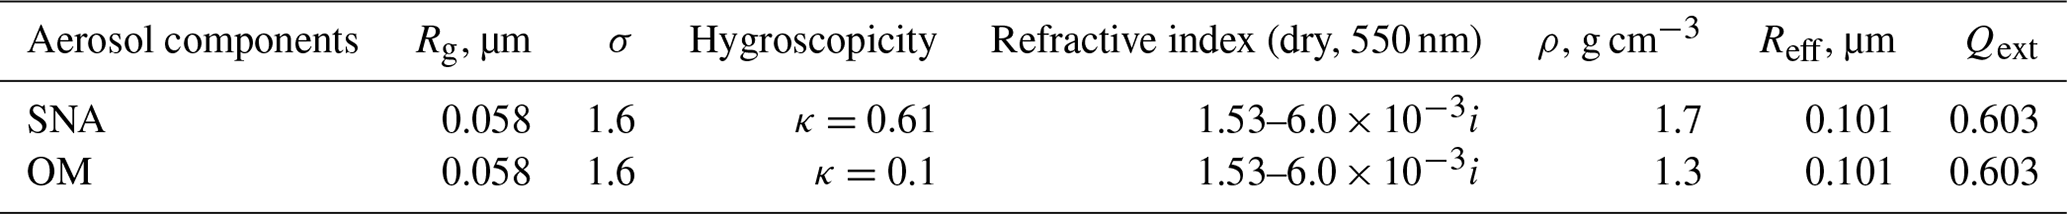
Global relative-humidity-dependent aerosol optical properties are based on the Global Aerosol Data Set (GADS; Köpke et al., 1997; Martin et al., 2003), with updates for SNA and OM (Latimer and Martin, 2019), mineral dust (Zhang et al., 2013), and absorbing brown carbon (Hammer et al., 2016). In the current GEOS-Chem model, the SNA and OM Reff, of particular interest here, are based on co-located measurements of aerosol scatter and mass from the IMPROVE network at USA national parks over the period 2000–2010, together with a κ-Kohler framework for aerosol hygroscopicity (Kreidenweis et al., 2008), as implemented by Latimer and Martin (2019). Aerosol extinction is calculated as the sum of extinction from each aerosol component, with aerosol optical properties listed in Table A1 (as described in Appendix A2).
A global GCHP simulation (Eastham et al., 2018) version 13.0.0 (https://doi.org/10.5281/zenodo.4618180) that includes advances in performance and usability (Martin et al., 2022), is conducted on a C90 cubed-sphere grid corresponding to a horizontal resolution of about 100 km, with a spin-up time of 1 month.
The TOMAS microphysics scheme, coupled with the GEOS-Chem simulation, conserves aerosol mass and tracks particles with diameters from approximately 1 nm to 10 µm (Adams and Seinfeld, 2002). Microphysical processes in TOMAS include nucleation, condensation, evaporation, coagulation, and wet and dry deposition (Adams and Seinfeld, 2002). Nucleation in TOMAS follows a ternary scheme (sulfuric acid, ammonia, and water) when ammonia mixing ratios are greater than 0.1 ppt (parts per trillion); otherwise, a binary nucleation scheme is used (Napari et al., 2002). The nucleation rate is scaled by 10−5 to better match the observations (Westervelt et al., 2013). The condensation and evaporation algorithm is based on a study from Tzivion et al. (1989), including the interaction with secondary organic aerosol (D'Andrea et al., 2013). Interstitial coagulation in clouds is also included (Pierce et al., 2015).
For each size bin, TOMAS tracks the mass and number of sulfate, sea salt, black carbon, OC, dust, and water. Primary sulfate emissions have two lognormal modes, namely 15 % of the mass with a number median diameter (NMD) of 10 nm and geometric standard deviation (σ) of 1.6 and the remainder with a NMD of 70 nm and σ of 2 (Adams and Seinfeld, 2003). The size of the emitted carbonaceous particles varies, depending on the source; those produced by fossil fuels have a NMD of 30 nm and σ of 2, while biofuel and biomass burning particles are emitted with a NMD of 100 nm and σ of 2 (Pierce et al., 2007). Meteorology and most of the emissions in GEOS-Chem-TOMAS follow the bulk simulation, except that online schemes are used for dust (Zender et al., 2003) and sea salt (Jaeglé et al., 2011).
The GEOS-Chem-TOMAS (version 13.2.1; https://doi.org/10.5281/zenodo.5500717) is used to provide insights into global-scale aerosol size variation and the driving factors. For computational feasibility, a 1-year global simulation is conducted with a horizontal resolution of 4∘ × 5∘ and 47 vertical layers from surface to 0.01 hPa. The spin-up time is 1 month. Aerosols are tracked in 15 size bins, with particle diameters ranging from about 3 nm to 10 µm. We also conducted a 2∘ × 2.5∘ simulation for October to evaluate the sensitivity of our conclusions to the resolution of the aerosol microphysics simulation.
We first examine the aircraft measurements for insight into the observed variation in aerosol size. Then we apply the size-resolved GEOS-Chem-TOMAS model to extend our analysis to the global scale and identify the driving factors of the aerosol size. We subsequently develop and test a parameterization of the aerosol size for use in bulk models.
3.1 Observed variation in aerosol size
Figure 1 shows the daily mean dry effective radius from DISCOVER-AQ and KORUS-AQ as a function of aerosol mass. Aerosol size, in terms of dry Reff, ranges from 90 to 179 nm for DISCOVER-AQ, which is generally smaller than for KORUS-AQ (ranging from 135 to 174 nm). MSNAOM from DISCOVER-AQ (1.4 to 27.4 µg m−3) is also generally less than that from KORUS-AQ (5.5 to 33.2 µg m−3). A strong correlation (r=0.83) between aerosol size and MSNAOM is evident. Reff from KORUS-AQ is less sensitive to MSNAOM (slope = 1.23) compared to DISCOVER-AQ (slope = 3.57). The relatively large particle size at low mass concentration during KORUS-AQ might reflect the influence of aged aerosol transported from upwind (Jordan et al., 2020; Zhai et al., 2021; Nault et al., 2018).
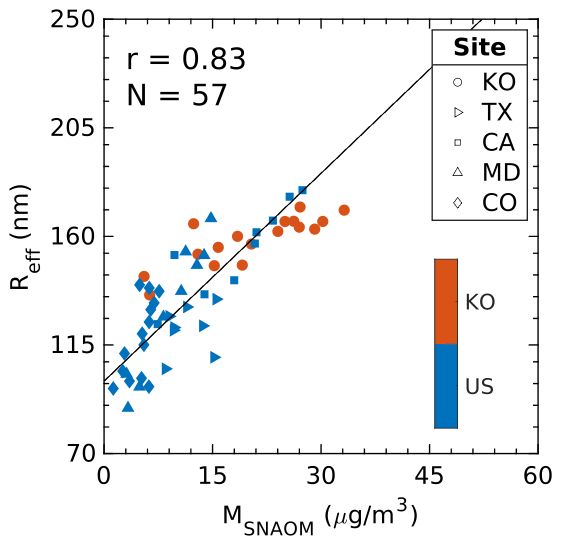
Figure 1Airborne measurements of dry effective radius (Reff) versus the sum of SNA and OM mass (MSNAOM) for DISCOVER-AQ (Maryland is abbreviated as MD, California as CA, Texas as TX, and Colorado as CO) and for KORUS-AQ (KO) campaigns. Each point represents a daily average for the entire flight profile. Only data with MSNAOM > 4 × dust mass are used.
The positive relationship between dry aerosol size and mass of SNA and OM reflects the roles of emission, condensation, and coagulation in simultaneously increasing aerosol size and mass. This general tendency is also observed by many other studies (e.g., Sakamoto et al., 2016; Rodríguez et al., 2007; Sun et al., 2012; Bahreini et al., 2003), despite variable aerosol sources and growth mechanisms. In cities, the joint increases in aerosol size and mass are usually attributable to anthropogenic emissions and condensation (Tian et al., 2019; Sun et al., 2011; Huang et al., 2013). In remote areas, biomass burning shifts the particle size distribution toward larger radii due to high emission rates and coagulation in plumes (Rissler et al., 2006; Ramnarine et al., 2019) that, for example, increase both aerosol size and mass from the wet season to the dry season in Amazonia (Rissler et al., 2006; Andreae et al., 2015). The positive relationship between aerosol size and mass suggests the possibility of using aerosol mass as a predictor of Reff.
We examine the ability of the GEOS-Chem bulk model to reproduce the observed extinction. The top panel of Fig. 2 compares the measured aerosol extinction profiles to calculated aerosol extinction profiles using default Reff. Details about the calculation are described in Appendix A2. Both measured and calculated extinction profiles exhibit increasing extinction toward the surface associated with increasing aerosol mass concentrations. However, biases are apparent for both DISCOVER-AQ and KORUS-AQ. The Reff values from KORUS-AQ shown in Fig. 1 have a mean value of 164 nm, larger than the value of 101 nm inferred by Latimer and Martin (2019), which was based on measurements of aerosol scatter and mass by the U.S. IMPROVE network. This bias was previously noted by Zhai et al. (2021). The mean Reff from DISCOVER-AQ of 138 nm is also larger than the inferred value. This likely reflects representativeness differences, since the DISCOVER-AQ deployments focused on major urban areas during months of high aerosol loadings, while the IMPROVE measurements were at national parks throughout the year. The middle panel shows the calculated extinction using the measured aerosol size distribution. Applying the measured aerosol size distribution addresses most discrepancies between the calculated and measured aerosol extinction profile for both KORUS-AQ and DISCOVER-AQ. The corresponding discrepancies in AOD estimation also significantly decreased (from 0.09 to 0.03 for DISCOVER-AQ and from 0.17 to 0.02 for KORUS-AQ). The reduced discrepancies support the conclusions from Zhai et al. (2021) that the GEOS-Chem aerosol size is underestimated for KORUS-AQ and motivates the parameterization of Reff for an efficient representation of the aerosol size for global-scale aerosol modeling.
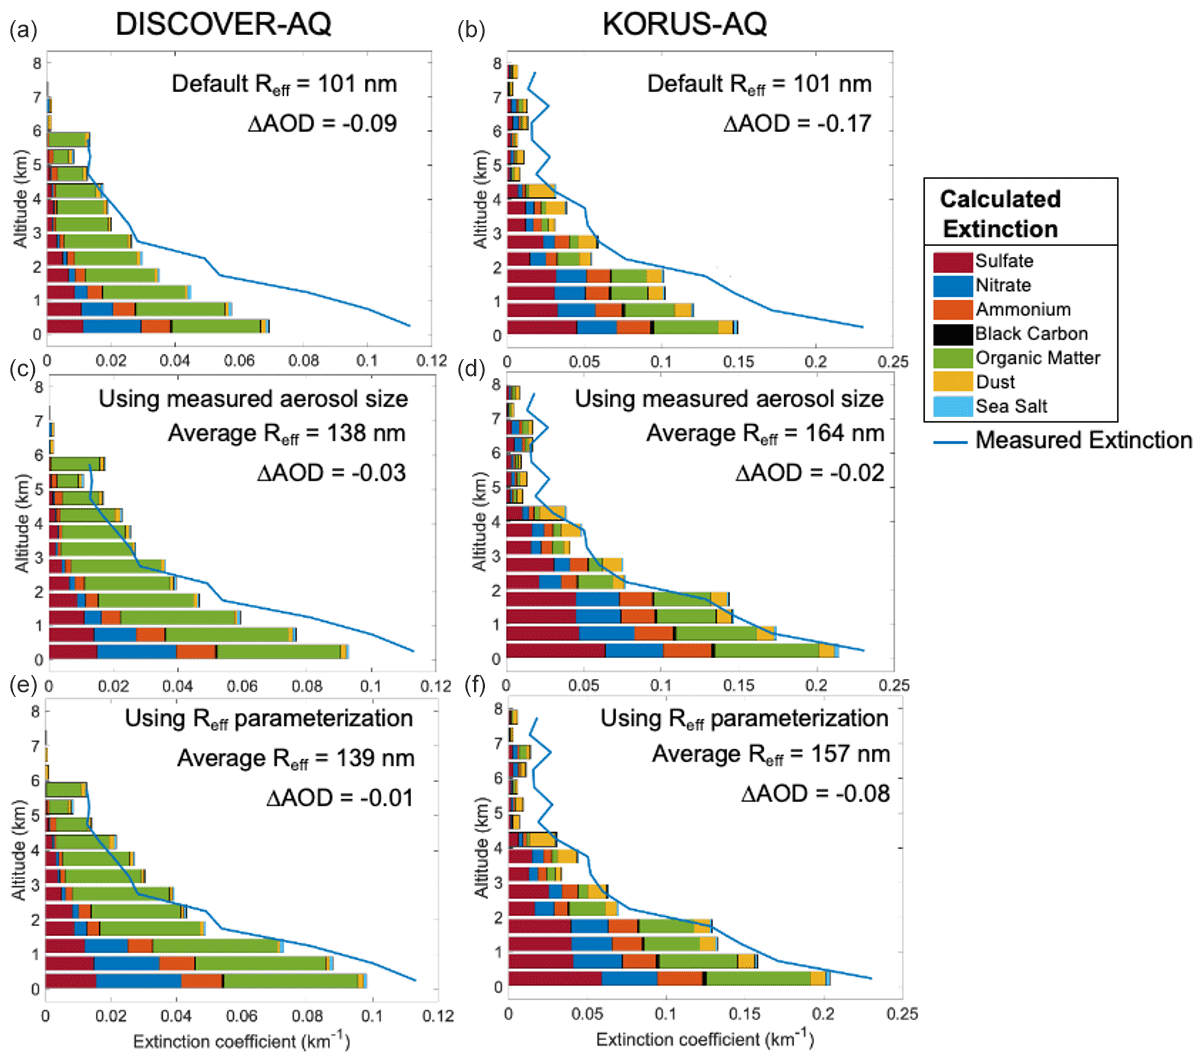
Figure 2Aerosol extinction profile for the DISCOVER-AQ and KORUS-AQ aircraft campaigns. Blue lines are the measured extinction profiles. Horizontal bars are calculated extinction using (a, b) default GEOS-Chem Reff, (c, d) measured Reff, and (e, f) parameterized Reff (described in Sect. 3.3), together with measured aerosol composition and relative humidity (RH). The aerosol extinction calculation is described in Appendix A.
3.2 Driving factors
Given the strong positive correlation of aerosol mass with aerosol size, we further examine this relationship globally using GEOS-Chem coupled with the TOMAS aerosol microphysics scheme. To focus on areas that are dominated by SNA and OM, we only include grid boxes with MSNAOM > 90 % of the aerosol mass. Inspection of the GEOS-Chem-TOMAS size distribution across continental regimes reveals a general tendency for the distribution to shift toward smaller sizes as Reff decreases and toward larger sizes as Reff increases, thus supporting the use of the single-summary statistic of Reff for aerosol size. The top panel of Fig. 3 shows the geographic distribution of annual mean surface layer dry Reff for grid boxes that meet the criterion. Among the areas of interest, biomass burning regions of central Africa, South America, and boreal forests of North America exhibit the highest surface Reff of about 180 nm. Industrial areas such as East Asia and South Asia also exhibit high Reff of about 130 nm, given an abundance of particle emissions and gaseous precursors. The lowest surface Reff of about 80 nm is found in North America, where aerosol mass concentrations are low.
The middle panel of Fig. 3 shows the simulated MSNAOM from GEOS-Chem-TOMAS. Enhanced MSNAOM concentrations of over 40 µg m−3 are apparent over East Asia and South Asia, reflecting intense anthropogenic emissions. Another MSNAOM hotspot can be seen in central Africa, driven by biomass burning during the dry season (van der Werf et al., 2017; McDuffie et al., 2021) and sometimes exacerbated by anthropogenic emissions (Ngo et al., 2019). Moving from North America to Europe and then to Asia (defined by boxes in the middle panel), MSNAOM concentrations exhibit a generally increasing tendency (mean values of 11, 17, and 25 µg m−3, respectively), consistent with the Reff tendency (mean values of 124, 133, and 136 nm, respectively) in the top panel and aligning with the relationship between aircraft measurements over the USA and South Korea.
However, in South America, where Reff is among the highest recorded level, MSNAOM is relatively low. This discrepancy motivates the search for other factors (such as aerosol composition) that are associated with aerosol size. In South America, aerosol mass is mostly from natural sources, particularly biomass burning during the dry seasons. Rg for a particle population from biomass burning ranges from 60 to 170 nm (Rissler et al., 2006; Reid et al., 2005; Janhäll et al., 2010), which is usually larger than that of primary sulfate aerosol (5 to 35 nm; Whitey, 1978; Plaza et al., 2011). Therefore, the relative abundance of OM in the total MSNAOM can serve as another predictor of Reff. The bottom panel of Fig. 3 shows the ratio between OM and SNA mass. In addition to the Amazon basin, the biomass burning regions of central Africa and boreal forests in Asia and North America all represent areas with high OM mass fractions, which contribute to their high Reff.
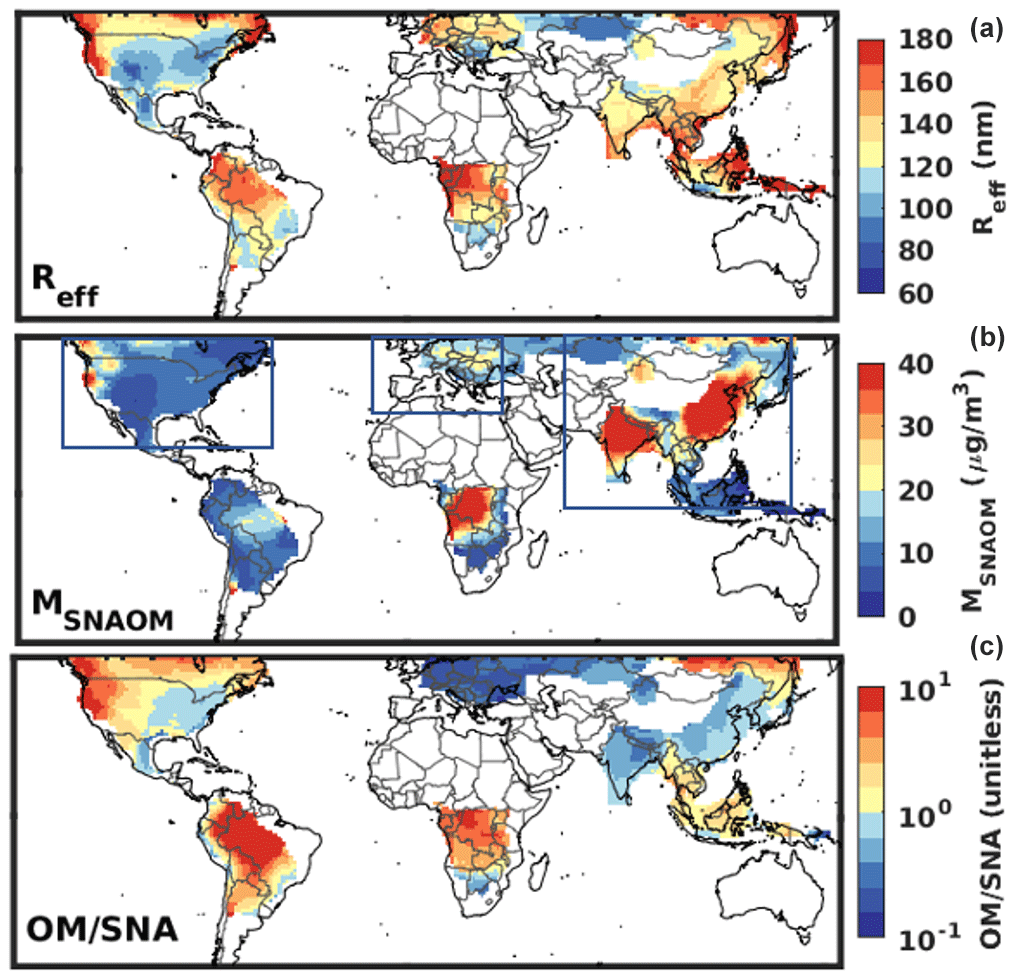
Figure 3Geographic distribution of GEOS-Chem-TOMAS-simulated annual mean surface layer aerosol properties. (a) Reff, when MSNAOM > 90 % of aerosol mass. (b) The sum of SNA and OM mass (MSNAOM). (c) .
3.3 Parameterization and evaluation
We use multiple linear regression (MLR) to derive a parameterization of dry Reff for SNA and OM as a function of MSNAOM and . We sample the GEOS-Chem-TOMAS simulation for locations dominated by MSNAOM (>90 %). We include all qualified data (8569 grid boxes) from the planetary boundary layer (PBL) to focus on this region, while randomly sampling 0.5 % of simulations in the free troposphere (217 772 grid boxes) to allow the influence of remote regions in the training set. The reason for focusing on the PBL is two-fold. First, the PBL generally has the highest aerosol loading that largely determines the columnar mass and AOD (Koffi et al., 2016; Zhai et al., 2021; Tian et al., 2019). Second, the PBL is the domain where most model–measurement differences exist (Fig. 2, top panel).
Taking the logarithm of Reff and the logarithm of the two predictors facilitates linear relationships for regression, which yields the initial parameterization, as follows:
where the units of Reff (units of nm), MSNAOM (units of µg m−3), and (unitless) are indicated here in parentheses. The Reff parameterization is driven primarily by the mass of SNA and OM, modulated by the ratio of OM to SNA. This equation represents the variation in Reff well during the aircraft campaigns, with an R2 of 0.74 (Fig. B1, top left; Appendix B). The slope below unity (0.90) likely reflects the effect of the coarse model resolution, which dilutes the particle or precursor concentration and in turn reduces the condensation and coagulation growth (AboEl-Fetouh et al., 2022; Ramnarine et al., 2019; Sakamoto et al., 2016). An adjustment to this parameterization to account for these effects and align the slope with the airborne measurements rather than the model results in a final parameterization, as follows:
Figure 4 shows the distribution of dry Reff based on GEOS-Chem-TOMAS and Eq. (5). Circles in Fig. 4 show the mean values of the sampled GEOS-Chem-TOMAS-simulated Reff as a function of simulated MSNAOM concentrations, ranging from 0.02 to 102 µg m−3, and , ranging from 0.13 to 55. Simulated Reff extends from 15 nm when both MSNAOM and are low (0.09 µg m−3 and 1.3, respectively), up to 282 nm when MSNAOM and are high (about 44 µg m−3 and 14, respectively). The background color indicates our parameterized Reff. A high degree of consistency exists between the parameterized Reff and simulated Reff, especially in the free troposphere, where large gradients in Reff exist, with an R2 of 0.72 overall for the troposphere and a slope of 0.81 (Fig. B1, bottom right). At the lower end of Reff, the agreement between simulation and the parameterization can also be found in Fig. B1, which shows that the small Reff values are reproduced by the parameterization. Despite the overall consistency, a few differences exist. When the aerosol mass concentration is high, the parameterization tends to yield a higher Reff than in the GEOS-Chem-TOMAS simulation, since the adjustment using aircraft measurements led to 11 % increase in Reff. At MSNAOM near 10 µg m−3 and near 10, the simulation indicates higher Reff than the parameterization, reflecting dilution downwind of biomass burning that reduces the aerosol mass concentration but has less influence on particle size in GEOS-Chem-TOMAS (Park et al., 2013; Rissler et al., 2006; Sakamoto et al., 2016). A 10 %–20 % underestimation in the parameterization at low reflects the advection and dilution downwind of urban areas and in the free troposphere (Yue et al., 2010; Asmi et al., 2011). Evaluation of our parameterization versus the GEOS-Chem-TOMAS simulation of 2∘ × 2.5∘ for October yields similar results but explains an additional 14 % of the variance in simulated Reff, providing additional evidence of the fidelity of the parameterization.
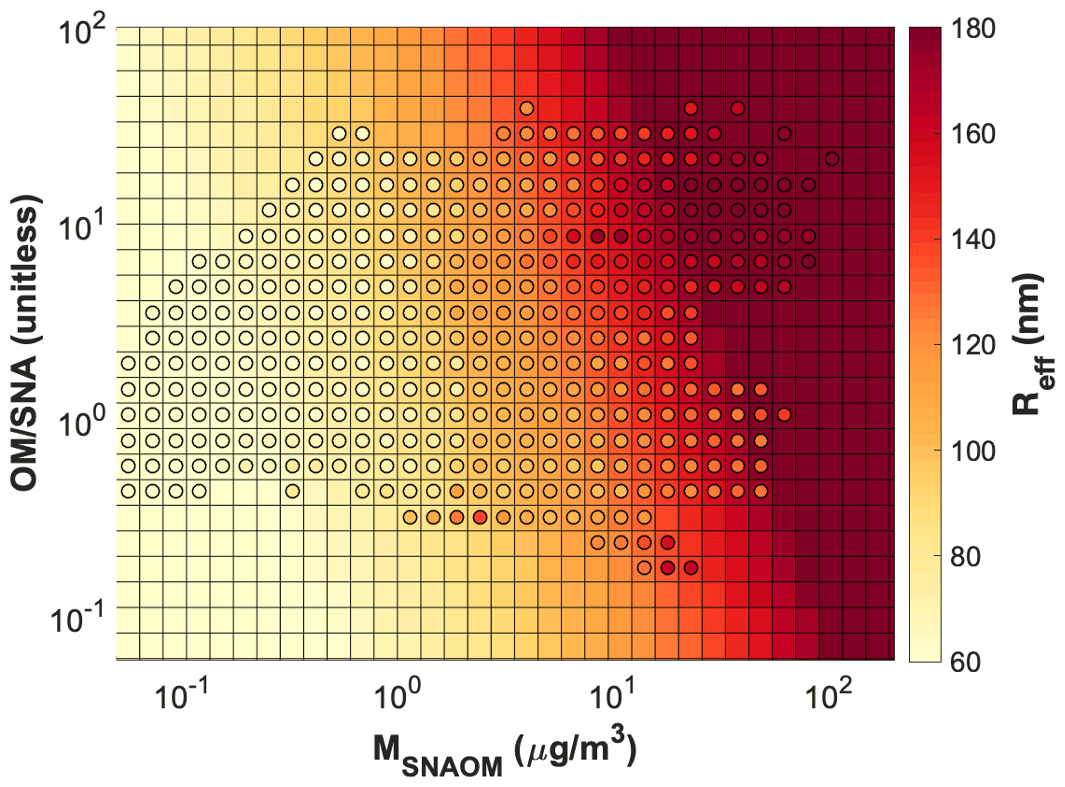
Figure 4Dry Reff as a function of MSNAOM and when SNA and OM are dominant (>90 %). Each circle represents the mean value of the GEOS-Chem-TOMAS-simulated Reff in each bin. The background color indicates the parameterized Reff.
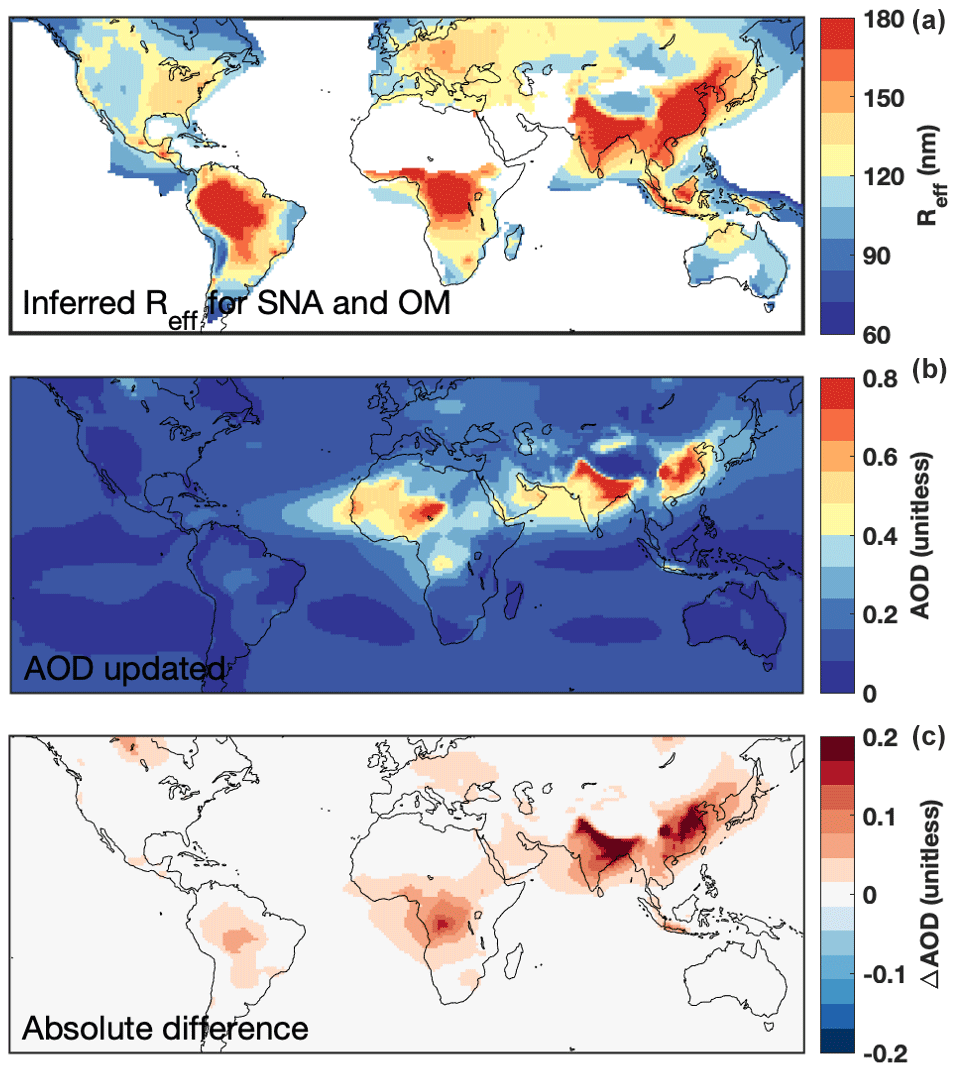
Figure 5(a) Surface dry Reff for SNA and OM calculated using Eq. (5) and GEOS-Chem bulk-model-simulated SNA and OM mass. Reff is shown when MSNAOM is greater than 80 % of the total aerosol mass. (b) The GEOS-Chem-simulated AOD using inferred Reff. (c) The absolute difference between the updated AOD and default AOD using dry Reff=101 nm.
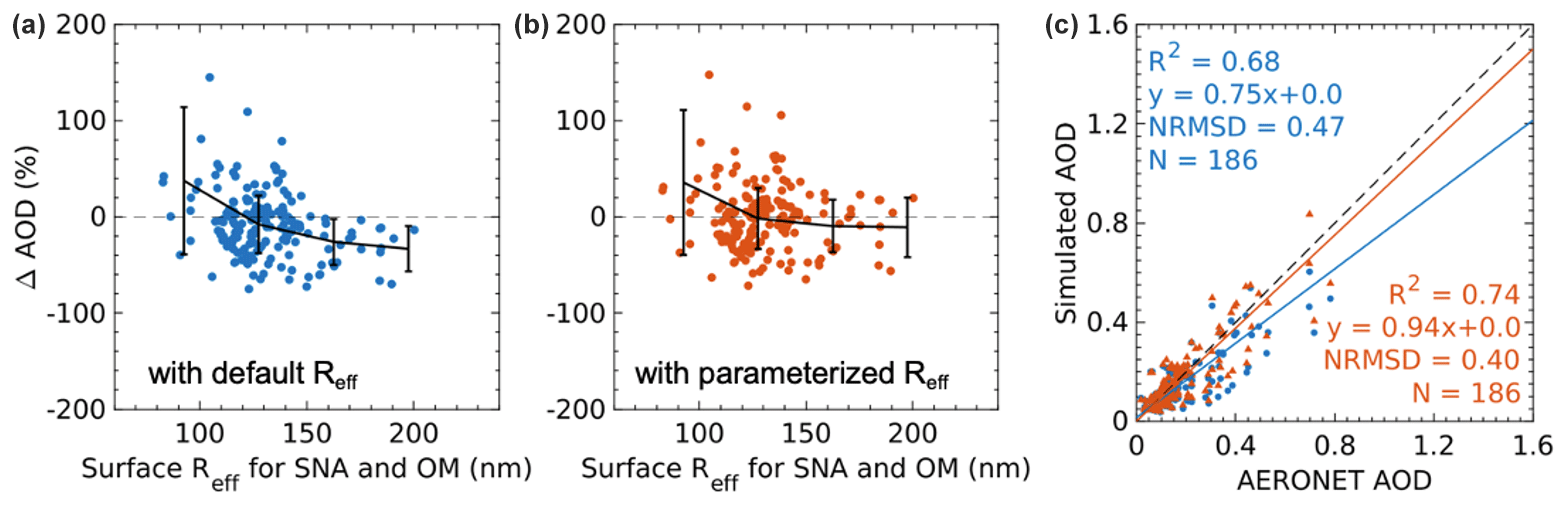
Figure 6(a, b) Percent increase in GEOS-Chem-simulated AOD minus AERONET AOD as a function of parameterized surface dry Reff for SNA and OM. Black lines represent the mean values of ΔAOD in each 35 nm bin; error bars represent the corresponding standard deviation. (c) Scatterplot of AERONET versus simulated AOD with the default Reff (blue dots, line, and text) and with the parameterized Reff (red dots, line, and text). The 1 : 1 line is dashed. NRMSD is the normalized root mean square deviation between the two datasets. N is the number of points in each dataset.
When applied to the airborne measurements, this parameterization only slightly overestimates the measured Reff from DISCOVER-AQ (139 nm vs. 138 nm) and slightly underestimates Reff from KORUS-AQ (157 nm vs. 164 nm). Discrepancies between the calculated and measured extinction from aircraft campaigns are largely reduced (Fig. 2, bottom panel), with AOD biases of 0.01 and 0.08 for DISCOVER-AQ and KORUS-AQ, respectively. Minor differences are still present in the aerosol extinction above 4 km for KORUS-AQ, but a physical explanation remains elusive, since the calculated extinction is biased, even if the measured aerosol size and composition are used because instrument uncertainties may play a role. Nonetheless, the effects on columnar AOD from these disagreements aloft are minor (<5 %).
We then apply Eq. (5) to a GEOS-Chem bulk simulation to calculate Reff and AOD. The top panel of Fig. 5 shows the annual mean dry Reff for surface SNA and OM aerosol. The parameterized Reff is usually higher than the default value of about 100 nm in GEOS-Chem over land and lower than that over the ocean, with a normalized root mean square deviation (NRMSD) of 43.8 %. The parameterized Reff is the highest in biomass burning regions in South America and central Africa, in addition to industrial regions in Asia, which is similar to the pattern found in the GEOS-Chem-TOMAS simulation. The parameterized Reff and its horizontal variation diminish with altitude (Fig. B2), with the mean Reff of 85 nm at the surface decreasing by 18.8 % to 69 nm at about 5 km. By design, the parameterization has little effect in regions and seasons where and when MSNAOM is not dominant, since the parameterization only affects Reff of SNA and OM.
The middle panel of Fig. 5 shows the simulated AOD, with the corresponding difference between the base simulation and the updated simulation in the bottom panel. To accommodate the parameterized Reff, a lookup table with a wide range of Reff (0.02 to 1.7 µm) and the corresponding extinction efficiencies for OM and SNA is created based on the Mie theory (Mishchenko et al., 2002, 1999). This update generally increases the aerosol mass scattering by increasing the mass extinction efficiency and, in turn, increasing AOD over regions with strong anthropogenic sources, such as East Asia (by 0.10 and 28.3 %) and South Asia (by 0.14 and 31.1 %). It also slightly increases AOD over regions influenced by wildfires, such as South America (by 0.02 and 19.7 %), central Africa (by 0.03 and 22.7 %), and the boreal forests in Europe (by 0.01 and 9.9 %). Most increases occur near the surface (Fig. B3), where the highest aerosol mass loading and mass extinction efficiency exist. The NRMSD between original and updated GEOS-Chem simulated AOD is 18.9 % globally and 25.6 % over continents.
Although Reff is only one of many processes affecting AOD, we evaluate the effect of the parameterization on the GEOS-Chem simulation of AOD to assess its implications. The left and middle panels of Fig. 6 show the discrepancy between GEOS-Chem-simulated AOD and AERONET AOD as a function of the parameterized surface Reff for SNA and OM. The simulation using the default Reff (Fig. 6, left panel) slightly overestimates AOD at sites with small parameterized Reff and underestimates AOD at sites with large parameterized Reff. The overestimates occur primarily in western Europe, where SNA and OM concentrations are low, while the underestimates happen mainly over industrial regions in East Asia, Southeast Asia, and biomass burning areas in South America and central Africa, where the SNA and OM mass loading are high (Fig. B4). The underestimates are mitigated when applying the parameterized Reff in GEOS-Chem (Fig. 6, middle panel), yielding increased consistency between the measured (AERONET) AOD and simulated AOD (Fig. 6, right; R2 change from 0.68 to 0.74; slope from 0.75 to 0.94).
Aerosol size strongly determines mass scattering efficiency, with implications for the calculation of aerosol optical properties. Prior work found that the global mean dry aerosol size used in a bulk-aerosol-model-induced low bias versus measured extinction in a region with a high aerosol loading (Zhai et al., 2021). We interpreted aircraft measurements from DISCOVER-AQ and KORUS-AQ with a chemical transport model (GEOS-Chem) to better understand the regional variation in aerosol size. The measurements had a strong positive correlation (r=0.83) between the aerosol size and the mass of sulfate–nitrate–ammonium (SNA) and organic matter (OM), reflecting the high condensation and coagulation rates where emissions of particles and the gaseous precursors are abundant, indicating the possibility of using aerosol mass as a predictor of aerosol size.
To gain a broader perspective of the global variation in aerosol size, we used the TOMAS microphysics package of the GEOS-Chem model to simulate the monthly mean aerosol mass, composition, and size distribution. We used an effective radius (Reff) as a surrogate for aerosol size and examined its relationship with aerosol mass and components where SNA and OM were dominant. We found that the sum of SNA and OM concentration, and the ratio between them, were the major predictors of Reff. We used GEOS-Chem-TOMAS model output to derive a parameterization of Reff, which reproduced Reff measured from the aircraft campaigns well (R2=0.74). When applied in the bulk GEOS-Chem high-performance model, the parameterization tended to increase the Reff of SNA and OM over regions with high concentrations of SNA and OM and decrease Reff elsewhere, relative to the standard model. This led to a global normalized root mean square deviation (NRMSD) of 43.8 % between the original and updated surface Reff. The parameterized Reff tended to increase the vertical gradient in the extinction relative to the standard model, due to the decrease in Reff with altitude. The NRMSD of global mean AOD between the original and updated simulations was 18.9 %, with the most significant regional AOD increase of 0.14 in South Asia, where aerosol mass loadings are high. This parameterization led to the improved consistency of GEOS-Chem-simulated AOD with AERONET AOD (R2 from 0.68 to 0.74; slope from 0.75 to 0.94) by increasing AOD at high Reff.
Overall, the simple parameterization of Reff derived in this study improved the accuracy in modeling aerosol optical properties without imposing an additional computational expense. Other chemical transport models and modeling of other size-related processes, such as heterogeneous chemistry, photolysis frequencies, and dry deposition, may also benefit from the parameterized Reff. Future work could include additional parameters to better summarize the aerosol size distribution (Nair et al., 2021; Sakamoto et al., 2016). Further developments in computational efficiency of aerosol microphysics models and more abundant measurements of aerosol size and optical properties would both offer opportunities for further advances.
A1 Application of spatially and temporally varying ratio
The top panel of Fig. A1 shows scatterplots of the estimated and measured and OM during the KORUS-AQ campaign. The estimation is obtained by applying a NO2-inferred (from Philip et al., 2014) to the OC measurement, with a subsequent correction factor of 1.09 (suggested by Canagaratna et al., 2015). Estimated OM is compared with the measured OM by AMS during the campaign. Overall consistency is evident between NO2-derived and measured . The agreement is better below 500 m than above (left panel; R2 = 0.62 vs. 0.33). The discrepancy at high altitudes is mainly due to the low NO2 (<0.2 ppbv, parts per billion by volume), where the Philip et al. (2014) equation is not applicable. An average ratio (2.1) is applied in this case. A high degree of consistency exists between the estimated OM and measured OM, with R2=0.99 and slope = 0.91 for data from all altitudes (right panel), thus supporting the use of estimated OM in our analyses. The bottom-left panel compares the vertical profile of the estimates and measurements, yielding overall consistency.
A2 Aerosol extinction calculation in GEOS-Chem
The extinction (Ext) of radiation by aerosols is represented as the sum of extinction due to each of the aerosol components using the following equation:
where subscript k indicates the property for the kth component. Reff is the effective radius, which is defined as the area-weighted mean radius. Qext is the area-weighted mean extinction efficiency. M is the aerosol mass loading per unit volume. ρ is the aerosol density. Aerosol optical depth (AOD) is the integral of aerosol extinction across the vertical domain.
For each component, the extinction is calculated for assumed lognormal size distribution, with a corresponding dry geometric mean radius Rg and geometric standard deviation σ, hygroscopicity, refractive index (RI), and density (ρ) for individual aerosol components, as listed in Table A1. Sulfate, nitrate, and ammonium are grouped into SNA for convenience. Reff and Qext are calculated using the Mie theory (Mishchenko et al., 1999, 2002), based on assumptions in aerosol size and RI. Hygroscopicity for SNA and OM is represented using a κ-Kohler hygroscopic growth scheme (Kreidenweis et al., 2008), as implemented by Latimer and Martin (2019).
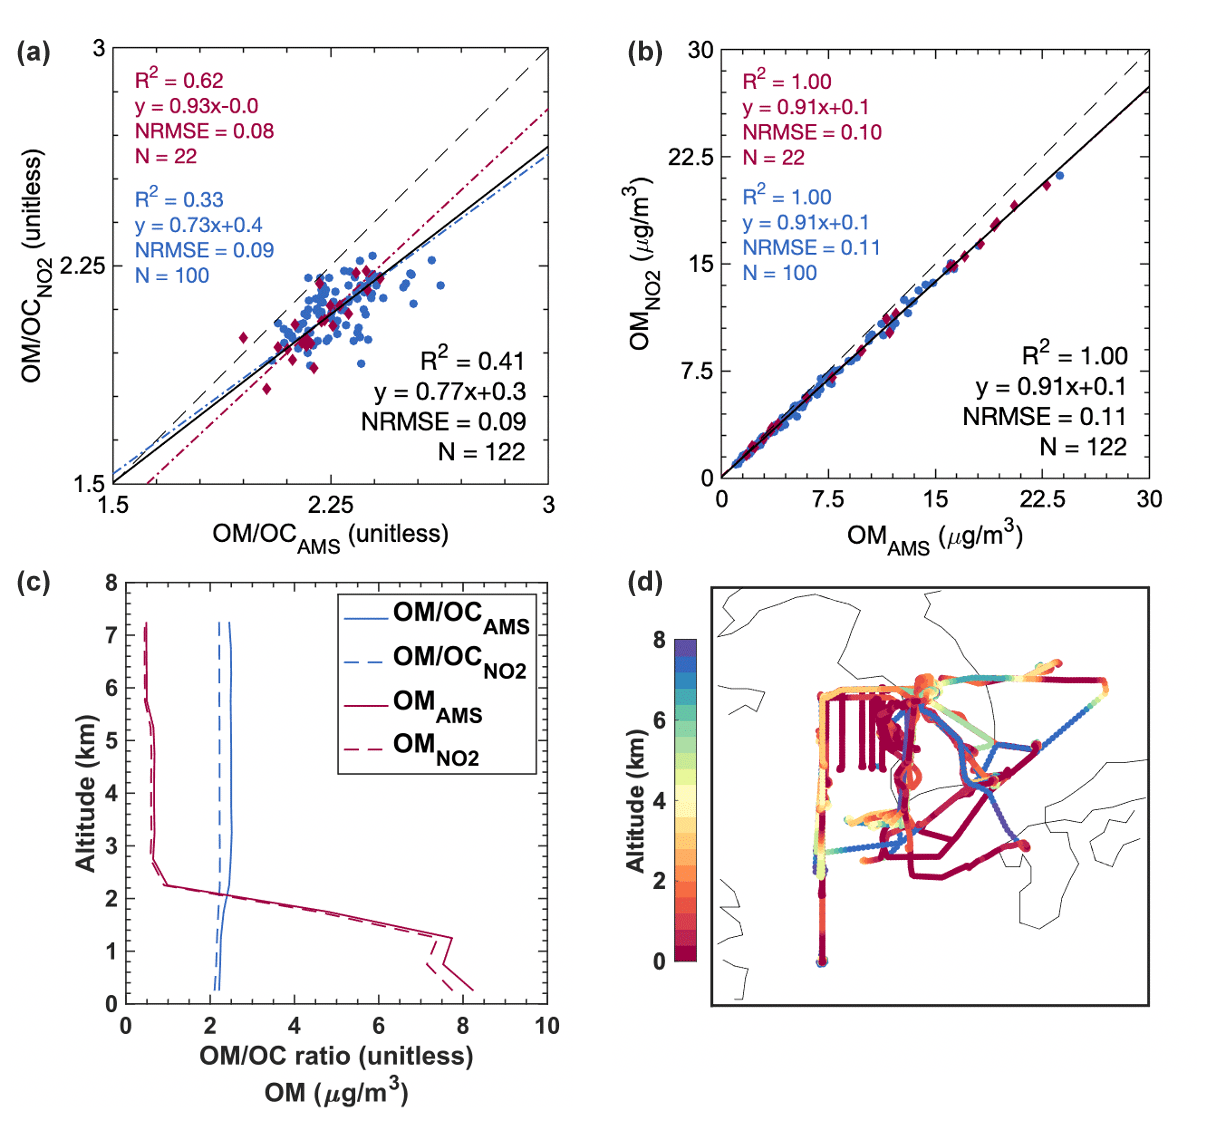
Figure A1Scatterplots of estimated and measured (a) and OM (b) during KORUS-AQ. Each point represents a mean value of the AMS measurement for a 1 h interval. Red diamonds, lines, and text represent data from 0–500 m altitude. Blue dots, lines, and text represent data above 500 m from the ground. Solid black lines and text represent the line of the best fit for all the data. The 1 : 1 line is dashed. NRMSD is the normalized root mean square deviation between the two datasets. N is the number of points in each dataset. (c) Mean values of and OM from measurements and estimations along the altitude. (d) Flight tracks during KORUS-AQ.
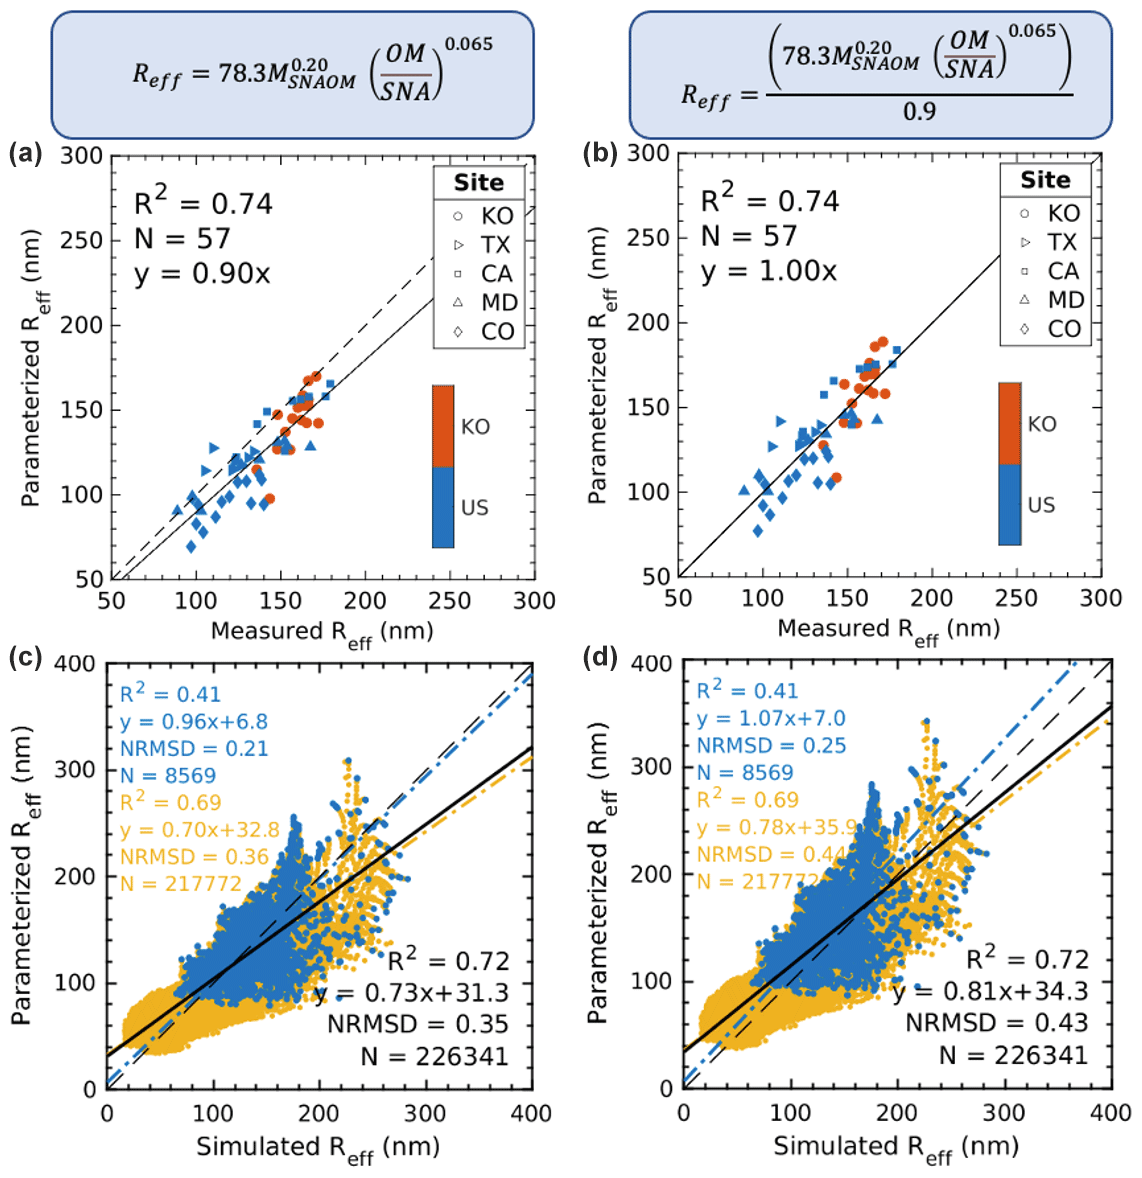
Figure B1(a, b) Scatterplot of parameterized Reff and measured Reff from DISCOVER-AQ and KORUS-AQ. Each point represents a daily mean measurement. (c, d) Scatterplot of parameterized Reff and GEOS-Chem-TOMAS-simulated Reff for the planetary boundary layer (blue dots, line, and text) and for the free troposphere (yellow dots, line, and text). Solid black lines and the text indicate the entire troposphere with the sum of SNA and OM > 90 % of aerosol mass. The 1 : 1 line is dashed. NRMSD is the normalized root mean square deviation between the two datasets. N is the number of points in each dataset. Panels (a) and (c) indicate the original parameterization from multiple linear regression. Panels (b) and (d) show the adjusted parameterization using aircraft measurements.
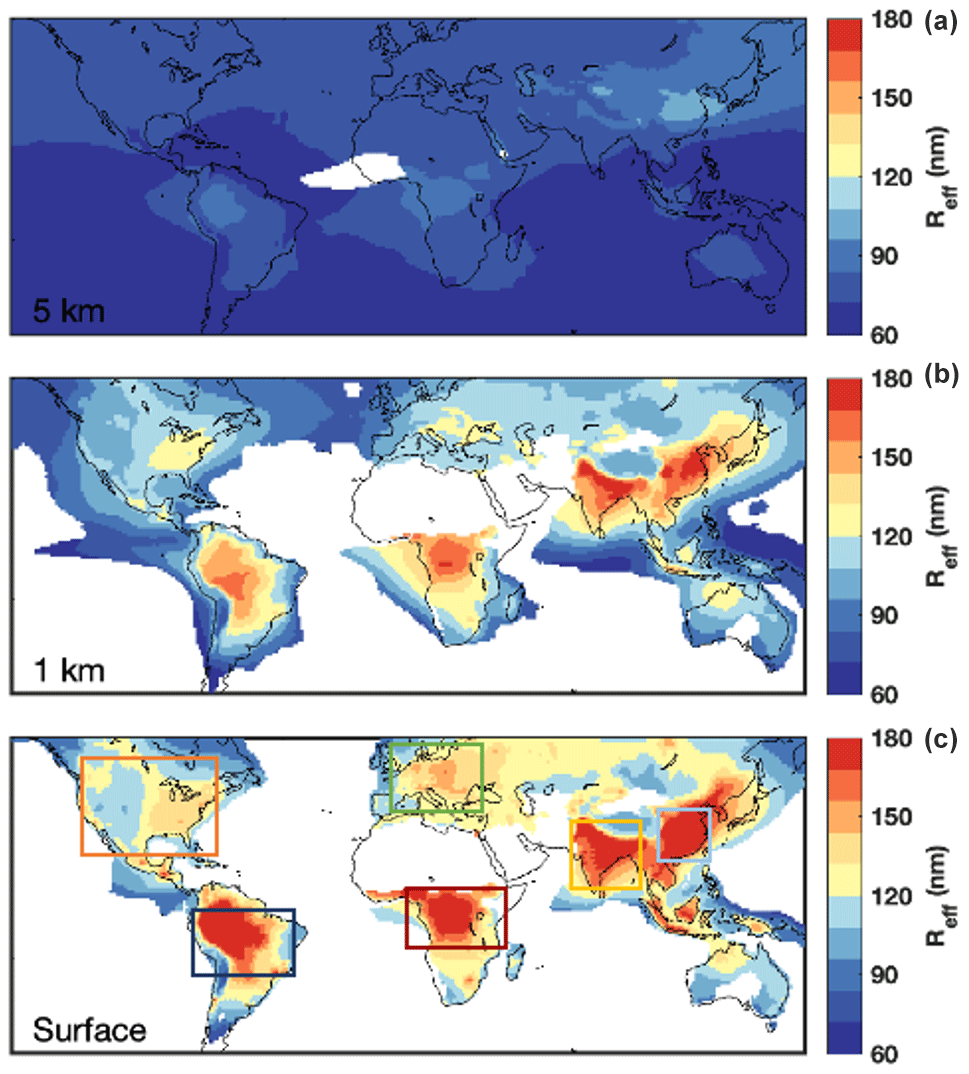
Figure B2Annual mean Reff for SNA and OM at (a) about 5 km, (b) about 1 km, and (c) surface, calculated using Eq. (5) and simulated SNA and OM mass from the GEOS-Chem bulk model. Reff is shown only if MSNAOM is greater than 80 % of the total aerosol mass. Boxes in panel (c) define the regions referred to in Fig. B3.
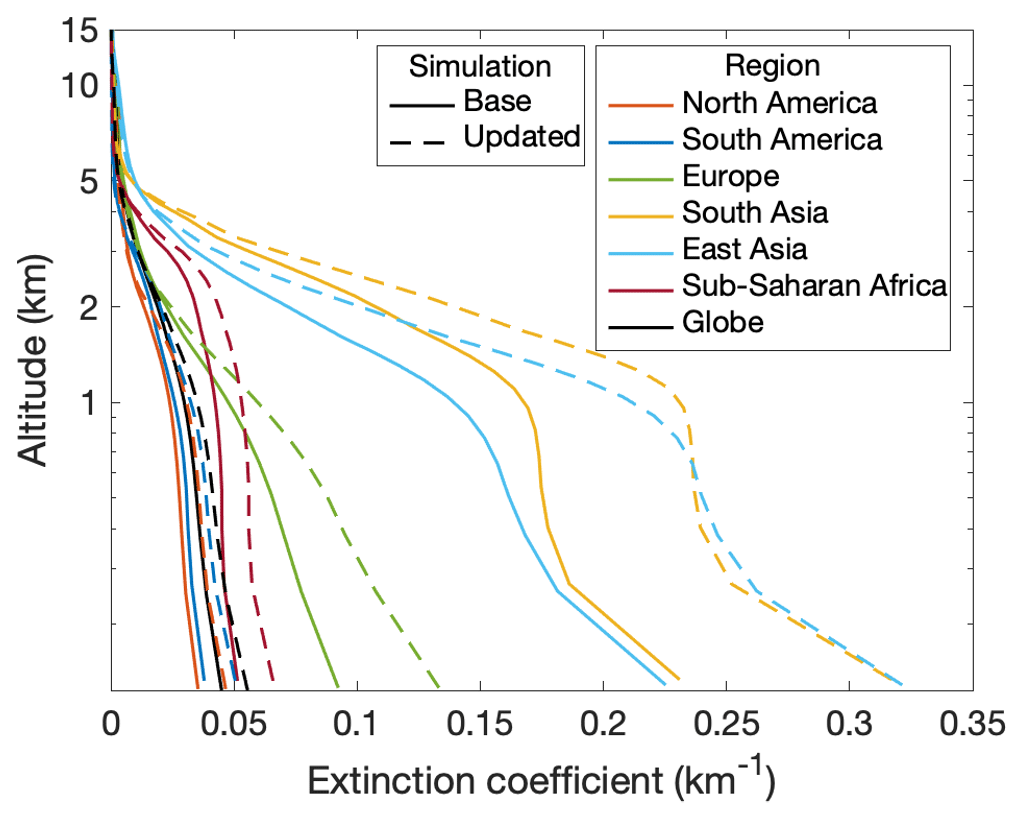
Figure B3Global and regional aerosol extinction coefficient simulated by GEOS-Chem bulk model with original Reff (solid lines) and parameterized Reff (dashed lines). Regions are defined by the boxes in Fig. B2.
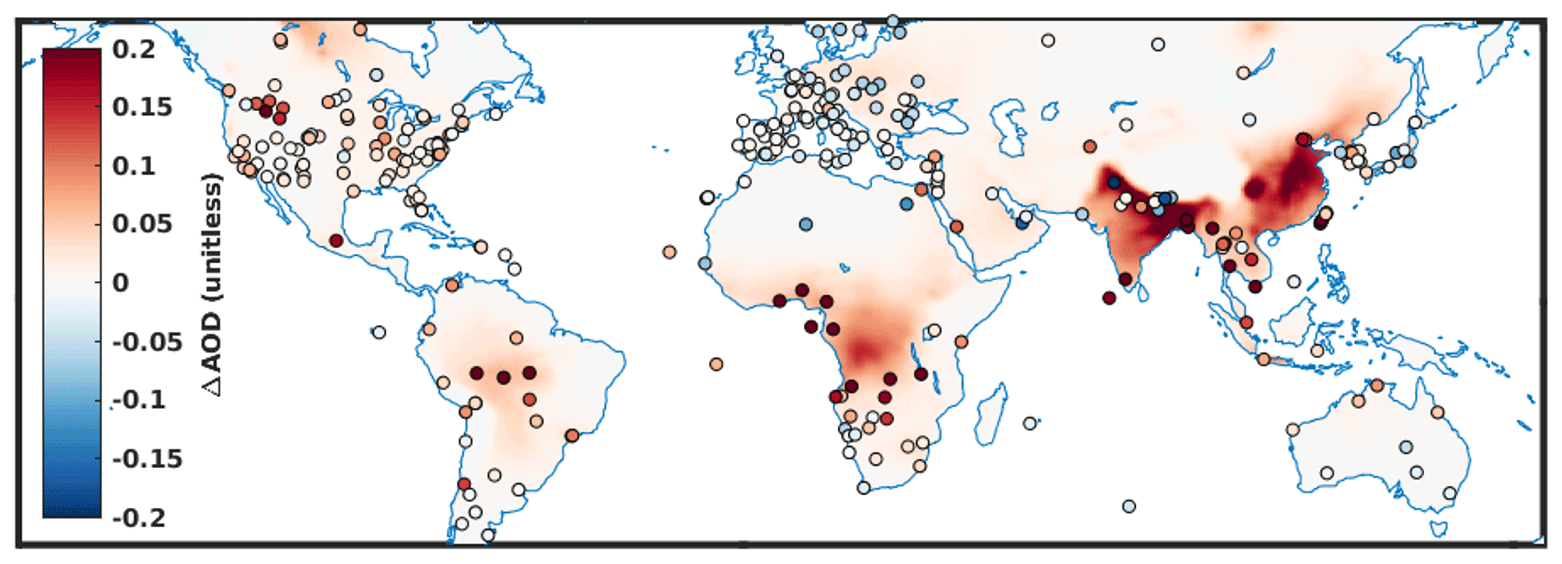
Figure B4Difference between AERONET AOD minus the default GEOS-Chem-simulated AOD (dots) and difference between the simulated AOD with the parameterized Reff minus AOD with default Reff (background).
AERONET data can be downloaded at https://aeronet.gsfc.nasa.gov/new_web/download_all_v3_aod.html (NASA, 2023a). Aircraft data obtained during DISCOVER-AQ are available at https://asdc.larc.nasa.gov/project/DISCOVER-AQ (NASA, 2023b). KORUS-AQ data can be found at https://doi.org/10.5067/Suborbital/KORUSAQ/DATA01 (NASA, 2023c).
HZ and RVM designed the study. HZ performed the data analysis and model simulations with contributions from BC, SZ, CL, LB, JRP, IS, DC, and RYWC. BEA, LDZ, JWH, RAF, CAH, JLJ, PCJ, JED, JSS, AW, and BAN contributed to KORUS-AQ and DISCOVER-AQ campaign measurements. HZ and RVM wrote the paper with input from all authors.
The contact author has declared that none of the authors has any competing interests.
Publisher’s note: Copernicus Publications remains neutral with regard to jurisdictional claims in published maps and institutional affiliations.
This work has been supported by NASA (grant no. 80NSSC21K1343). Jeffrey R. Pierce has been funded by the U.S. NSF Atmospheric Chemistry program (grant no. AGS-1950327). Jose L. Jimenez and Pedro Campuzano-Jost have been supported by NASA (grant no. 80NSSC21K1451 and NNX15AT96G). Benjamin A. Nault has been supported by NASA (grant no. 80NSSC22K0283). Jack E. Dibb has been supported by NASA (grant no. NNX15AT88G).
This paper was edited by Fangqun Yu and reviewed by two anonymous referees.
Aalto, P., Hämeri, K., Becker, E. D. O., Weber, R., Salm, J., Mäkelä, J. M., Hoell, C., O'Dowd, C. D., Karlsson, H., Hansson, H., Väkevä, M., Koponen, I. K., Buzorius, G., and Kulmala, M.: Physical characterization of aerosol particles during nucleation events, Tellus B, 53, 344–358, https://doi.org/10.3402/tellusb.v53i4.17127, 2001.
AboEl-Fetouh, Y., O'Neill, N. T., Kodros, J. K., Pierce, J. R., Lu, H., Ranjbar, K., and Xian, P.: Seasonal comparisons of GEOS-Chem-TOMAS (GCT) simulations with AERONET-inversion retrievals over sites in the North American and European Arctic, Atmos. Environ., 271, 118852, https://doi.org/10.1016/j.atmosenv.2021.118852, 2022.
Adams, P. J. and Seinfeld, J. H.: Predicting global aerosol size distributions in general circulation models, J. Geophys. Res.-Atmos., 107, AAC 4-1–AAC 4-23, https://doi.org/10.1029/2001JD001010, 2002.
Adams, P. J. and Seinfeld, J. H.: Disproportionate impact of particulate emissions on global cloud condensation nuclei concentrations, Geophys. Res. Lett., 30, 1–4, https://doi.org/10.1029/2002gl016303, 2003.
Amos, H. M., Jacob, D. J., Holmes, C. D., Fisher, J. A., Wang, Q., Yantosca, R. M., Corbitt, E. S., Galarneau, E., Rutter, A. P., Gustin, M. S., Steffen, A., Schauer, J. J., Graydon, J. A., Louis, V. L. St., Talbot, R. W., Edgerton, E. S., Zhang, Y., and Sunderland, E. M.: Gas-particle partitioning of atmospheric Hg(II) and its effect on global mercury deposition, Atmos. Chem. Phys., 12, 591–603, https://doi.org/10.5194/acp-12-591-2012, 2012.
Andreae, M. O., Acevedo, O. C., Araùjo, A., Artaxo, P., Barbosa, C. G. G., Barbosa, H. M. J., Brito, J., Carbone, S., Chi, X., Cintra, B. B. L., da Silva, N. F., Dias, N. L., Dias-Júnior, C. Q., Ditas, F., Ditz, R., Godoi, A. F. L., Godoi, R. H. M., Heimann, M., Hoffmann, T., Kesselmeier, J., Könemann, T., Krüger, M. L., Lavric, J. V., Manzi, A. O., Lopes, A. P., Martins, D. L., Mikhailov, E. F., Moran-Zuloaga, D., Nelson, B. W., Nölscher, A. C., Santos Nogueira, D., Piedade, M. T. F., Pöhlker, C., Pöschl, U., Quesada, C. A., Rizzo, L. V., Ro, C.-U., Ruckteschler, N., Sá, L. D. A., de Oliveira Sá, M., Sales, C. B., dos Santos, R. M. N., Saturno, J., Schöngart, J., Sörgel, M., de Souza, C. M., de Souza, R. A. F., Su, H., Targhetta, N., Tóta, J., Trebs, I., Trumbore, S., van Eijck, A., Walter, D., Wang, Z., Weber, B., Williams, J., Winderlich, J., Wittmann, F., Wolff, S., and Yáñez-Serrano, A. M.: The Amazon Tall Tower Observatory (ATTO): overview of pilot measurements on ecosystem ecology, meteorology, trace gases, and aerosols, Atmos. Chem. Phys., 15, 10723–10776, https://doi.org/10.5194/acp-15-10723-2015, 2015.
Asmi, A., Wiedensohler, A., Laj, P., Fjaeraa, A.-M., Sellegri, K., Birmili, W., Weingartner, E., Baltensperger, U., Zdimal, V., Zikova, N., Putaud, J.-P., Marinoni, A., Tunved, P., Hansson, H.-C., Fiebig, M., Kivekäs, N., Lihavainen, H., Asmi, E., Ulevicius, V., Aalto, P. P., Swietlicki, E., Kristensson, A., Mihalopoulos, N., Kalivitis, N., Kalapov, I., Kiss, G., de Leeuw, G., Henzing, B., Harrison, R. M., Beddows, D., O'Dowd, C., Jennings, S. G., Flentje, H., Weinhold, K., Meinhardt, F., Ries, L., and Kulmala, M.: Number size distributions and seasonality of submicron particles in Europe 2008–2009, Atmos. Chem. Phys., 11, 5505–5538, https://doi.org/10.5194/acp-11-5505-2011, 2011.
Bahreini, R., Jimenez, J. L., Wang, J., Flagan, R. C., Seinfeld, J. H., Jayne, J. T., and Worsnop, D. R.: Aircraft-based aerosol size and composition measurements during ACE-Asia using an Aerodyne aerosol mass spectrometer, J. Geophys. Res.-Atmos., 108, 8645, https://doi.org/10.1029/2002jd003226, 2003.
Bindle, L., Martin, R. V., Cooper, M. J., Lundgren, E. W., Eastham, S. D., Auer, B. M., Clune, T. L., Weng, H., Lin, J., Murray, L. T., Meng, J., Keller, C. A., Putman, W. M., Pawson, S., and Jacob, D. J.: Grid-stretching capability for the GEOS-Chem 13.0.0 atmospheric chemistry model, Geosci. Model Dev., 14, 5977–5997, https://doi.org/10.5194/gmd-14-5977-2021, 2021.
Canagaratna, M. R., Jayne, J. T., Jimenez, J. L., Allan, J. D., Alfarra, M. R., Zhang, Q., Onasch, T. B., Drewnick, F., Coe, H., and Middlebrook, A.: Chemical and microphysical characterization of ambient aerosols with the aerodyne aerosol mass spectrometer, Mass Spectrom. Rev., 26, 185–222, https://doi.org/10.1002/mas.20115, 2007.
Canagaratna, M. R., Jimenez, J. L., Kroll, J. H., Chen, Q., Kessler, S. H., Massoli, P., Hildebrandt Ruiz, L., Fortner, E., Williams, L. R., Wilson, K. R., Surratt, J. D., Donahue, N. M., Jayne, J. T., and Worsnop, D. R.: Elemental ratio measurements of organic compounds using aerosol mass spectrometry: characterization, improved calibration, and implications, Atmos. Chem. Phys., 15, 253–272, https://doi.org/10.5194/acp-15-253-2015, 2015.
Choi, S., Lamsal, L. N., Follette-Cook, M., Joiner, J., Krotkov, N. A., Swartz, W. H., Pickering, K. E., Loughner, C. P., Appel, W., Pfister, G., Saide, P. E., Cohen, R. C., Weinheimer, A. J., and Herman, J. R.: Assessment of NO2 observations during DISCOVER-AQ and KORUS-AQ field campaigns, Atmos. Meas. Tech., 13, 2523–2546, https://doi.org/10.5194/amt-13-2523-2020, 2020.
Chu, D. A., Ferrare, R., Szykman, J., Lewis, J., Scarino, A., Hains, J., Burton, S., Chen, G., Tsai, T., Hostetler, C., Hair, J., Holben, B., and Crawford, J.: Regional characteristics of the relationship between columnar AOD and surface PM2.5: Application of lidar aerosol extinction profiles over Baltimore-Washington Corridor during DISCOVER-AQ, Atmos Environ, 101, 338e349-349, https://doi.org/10.1016/j.atmosenv.2014.11.034, 2015.
Croft, B., Lohmann, U., and von Salzen, K.: Black carbon ageing in the Canadian Centre for Climate modelling and analysis atmospheric general circulation model, Atmos. Chem. Phys., 5, 1931–1949, https://doi.org/10.5194/acp-5-1931-2005, 2005.
D'Andrea, S. D., Häkkinen, S. A. K., Westervelt, D. M., Kuang, C., Levin, E. J. T., Kanawade, V. P., Leaitch, W. R., Spracklen, D. V., Riipinen, I., and Pierce, J. R.: Understanding global secondary organic aerosol amount and size-resolved condensational behavior, Atmos. Chem. Phys., 13, 11519–11534, https://doi.org/10.5194/acp-13-11519-2013, 2013.
Dibb, J. E., Talbot, R. W., Scheuer, E. M., Seid, G., Avery, M. A., and Singh, H. B.: Aerosol chemical composition in Asian continental outflow during the TRACE-P campaign: Comparison with PEM-West B, J. Geophys. Res.-Atmos., 108, 8815, https://doi.org/10.1029/2002jd003111, 2003.
Eastham, S. D., Long, M. S., Keller, C. A., Lundgren, E., Yantosca, R. M., Zhuang, J., Li, C., Lee, C. J., Yannetti, M., Auer, B. M., Clune, T. L., Kouatchou, J., Putman, W. M., Thompson, M. A., Trayanov, A. L., Molod, A. M., Martin, R. V., and Jacob, D. J.: GEOS-Chem High Performance (GCHP v11-02c): a next-generation implementation of the GEOS-Chem chemical transport model for massively parallel applications, Geosci. Model Dev., 11, 2941–2953, https://doi.org/10.5194/gmd-11-2941-2018, 2018.
Emerson, E. W., Hodshire, A. L., DeBolt, H. M., Bilsback, K. R., Pierce, J. R., McMeeking, G. R., and Farmer, D. K.: Revisiting particle dry deposition and its role in radiative effect estimates, P. Natl. Acad. Sci. USA, 117, 26076–26082, https://doi.org/10.1073/pnas.2014761117, 2020.
Ervens, B., Turpin, B. J., and Weber, R. J.: Secondary organic aerosol formation in cloud droplets and aqueous particles (aqSOA): a review of laboratory, field and model studies, Atmos. Chem. Phys., 11, 11069–11102, https://doi.org/10.5194/acp-11-11069-2011, 2011.
Estillore, A. D., Trueblood, J. V., and Grassian, V. H.: Atmospheric chemistry of bioaerosols: Heterogeneous and multiphase reactions with atmospheric oxidants and other trace gases, Chem. Sci., 7, 6604–6616, https://doi.org/10.1039/c6sc02353c, 2016.
Fairlie, D. T., Jacob, D. J., and Park, R. J.: The impact of transpacific transport of mineral dust in the United States, Atmos. Environ., 41, 1251–1266, https://doi.org/10.1016/j.atmosenv.2006.09.048, 2007.
Faxvog, F. R. and Roessler, D. M.: Carbon aerosol visibility vs particle size distribution, Appl. Optics, 17, 2612, https://doi.org/10.1364/ao.17.002612, 1978.
Fountoukis, C. and Nenes, A.: ISORROPIA II: a computationally efficient thermodynamic equilibrium model for K+-Ca2+-Mg2+--Na+---Cl−-H2O aerosols, Atmos. Chem. Phys., 7, 4639–4659, https://doi.org/10.5194/acp-7-4639-2007, 2007.
GCST, Yu, F., and Luo, G.: APM aerosol microphysics, http://wiki.seas.harvard.edu/geos-chem/index.php/APM_aerosol_microphysics, last access: 23 January 2023.
Geng, G., Zhang, Q., Tong, D., Li, M., Zheng, Y., Wang, S., and He, K.: Chemical composition of ambient PM2.5 over China and relationship to precursor emissions during 2005–2012, Atmos. Chem. Phys., 17, 9187–9203, https://doi.org/10.5194/acp-17-9187-2017, 2017.
Giles, D. M., Sinyuk, A., Sorokin, M. G., Schafer, J. S., Smirnov, A., Slutsker, I., Eck, T. F., Holben, B. N., Lewis, J. R., Campbell, J. R., Welton, E. J., Korkin, S. V., and Lyapustin, A. I.: Advancements in the Aerosol Robotic Network (AERONET) Version 3 database – automated near-real-time quality control algorithm with improved cloud screening for Sun photometer aerosol optical depth (AOD) measurements, Atmos. Meas. Tech., 12, 169–209, https://doi.org/10.5194/amt-12-169-2019, 2019.
Guo, H., Campuzano-Jost, P., Nault, B. A., Day, D. A., Schroder, J. C., Kim, D., Dibb, J. E., Dollner, M., Weinzierl, B., and Jimenez, J. L.: The importance of size ranges in aerosol instrument intercomparisons: a case study for the Atmospheric Tomography Mission, Atmos. Meas. Tech., 14, 3631–3655, https://doi.org/10.5194/amt-14-3631-2021, 2021.
Hair, J. W., Hostetler, C. A., Cook, A. L., Harper, D. B., Ferrare, R. A., Mack, T. L., Welch, W., Izquierdo, L. R., and Hovis, F. E.: Airborne High Spectral Resolution Lidar for profiling Aerosol optical properties, Appl. Optics, 47, 6734–6753, https://doi.org/10.1364/AO.47.006734, 2008.
Hammer, M. S., Martin, R. V., van Donkelaar, A., Buchard, V., Torres, O., Ridley, D. A., and Spurr, R. J. D.: Interpreting the ultraviolet aerosol index observed with the OMI satellite instrument to understand absorption by organic aerosols: implications for atmospheric oxidation and direct radiative effects, Atmos. Chem. Phys., 16, 2507–2523, https://doi.org/10.5194/acp-16-2507-2016, 2016.
Hansen, J. E. and Travis, L. D.: Light scattering in planetary atmospheres, Space Sci. Rev., 16, 527–610, https://doi.org/10.1007/BF00168069, 1974.
Hayes, P. L., Ortega, A. M., Cubison, M. J., Froyd, K. D., Zhao, Y., Cliff, S. S., Hu, W. W., Toohey, D. W., Flynn, J. H., Lefer, B. L., Grossberg, N., Alvarez, S., Rappenglück, B., Taylor, J. W., Allan, J. D., Holloway, J. S., Gilman, J. B., Kuster, W. C., De Gouw, J. A., Massoli, P., Zhang, X., Liu, J., Weber, R. J., Corrigan, A. L., Russell, L. M., Isaacman, G., Worton, D. R., Kreisberg, N. M., Goldstein, A. H., Thalman, R., Waxman, E. M., Volkamer, R., Lin, Y. H., Surratt, J. D., Kleindienst, T. E., Offenberg, J. H., Dusanter, S., Griffith, S., Stevens, P. S., Brioude, J., Angevine, W. M., and Jimenez, J. L.: Organic aerosol composition and sources in Pasadena, California, during the 2010 CalNex campaign, J. Geophys. Res.-Atmos., 118, 9233–9257, https://doi.org/10.1002/jgrd.50530, 2013.
Hinds, W. C. and Zhu, Y.: Aerosol technology: Properties, behavior, and measurement of airborne particles, 2nd Edn., Wiley, New York, ISBN 9781119494041, 1999.
Huang, Y., Li, L., Li, J., Wang, X., Chen, H., Chen, J., Yang, X., Gross, D. S., Wang, H., Qiao, L., and Chen, C.: A case study of the highly time-resolved evolution of aerosol chemical and optical properties in urban Shanghai, China, Atmos. Chem. Phys., 13, 3931–3944, https://doi.org/10.5194/acp-13-3931-2013, 2013.
Jaeglé, L., Quinn, P. K., Bates, T. S., Alexander, B., and Lin, J.-T.: Global distribution of sea salt aerosols: new constraints from in situ and remote sensing observations, Atmos. Chem. Phys., 11, 3137–3157, https://doi.org/10.5194/acp-11-3137-2011, 2011.
Janhäll, S., Andreae, M. O., and Pöschl, U.: Biomass burning aerosol emissions from vegetation fires: particle number and mass emission factors and size distributions, Atmos. Chem. Phys., 10, 1427–1439, https://doi.org/10.5194/acp-10-1427-2010, 2010.
Jin, J., Henzing, B., and Segers, A.: How aerosol size matters in aerosol optical depth (AOD) assimilation and the optimization using the Ångström exponent, Atmos. Chem. Phys., 23, 1641–1660, https://doi.org/10.5194/acp-23-1641-2023, 2023.
Jordan, C. E., Crawford, J. H., Beyersdorf, A. J., Eck, T. F., Halliday, H. S., Nault, B. A., Chang, L.-S., Park, J., Park, R., and Lee, G.: Investigation of factors controlling PM2.5 variability across the South Korean Peninsula during KORUS-AQ, Elementa, 8, 28, https://doi.org/10.1525/elementa.424, 2020.
Kahn, R. A., Gaitley, B. J., Martonchik, J. v., Diner, D. J., Crean, K. A., and Holben, B.: Multiangle Imaging Spectroradiometer (MISR) global aerosol optical depth validation based on 2 years of coincident Aerosol Robotic Network (AERONET) observations, J. Geophys. Res.-Atmos., 110, 1–16, https://doi.org/10.1029/2004JD004706, 2005.
Karydis, V. A., Kumar, P., Barahona, D., Sokolik, I. N., and Nenes, A.: On the effect of dust particles on global cloud condensation nuclei and cloud droplet number, J. Geophys. Res.-Atmos., 116, D23204, https://doi.org/10.1029/2011JD016283, 2011.
Kellogg, W. W.: Aerosols and Climate, Science, 183, 281–296, https://doi.org/10.1093/oso/9780198779308.003.0005, 1980.
Kodros, J. K. and Pierce, J. R.: Important global and regional differences in aerosol cloud-albedo effect estimates between simulations with and without prognostic aerosol microphysics, J. Geophys. Res., 122, 4003–4018, https://doi.org/10.1002/2016JD025886, 2017.
Kodros, J. K., Volckens, J., Jathar, S. H., and Pierce, J. R.: Ambient particulate matter size distributions drive regional and global variability in particle deposition in the respiratory tract, Geohealth, 2, 298–312, https://doi.org/10.1029/2018gh000145, 2018.
Koffi, B., Schulz, M., Bréon, F. M., Dentener, F., Steensen, B. M., Griesfeller, J., Winker, D., Balkanski, Y., Bauer, S. E., Bellouin, N., Berntsen, T., Bian, H., Chin, M., Diehl, T., Easter, R., Ghan, S., Hauglustaine, D. A., Iversen, T., Kirkevåg, A., Liu, X., Lohmann, U., Myhre, G., Rasch, P., Seland, Ø., Skeie, R. B., Steenrod, S. D., Stier, P., Tackett, J., Takemura, T., Tsigaridis, K., Vuolo, M. R., Yoon, J., and Zhang, K.: Evaluation of the aerosol vertical distribution in global aerosol models through comparison against CALIOP measurements: AeroCom phase II results, J. Geophys. Res., 121, 7254–7283, https://doi.org/10.1002/2015JD024639, 2016.
Köpke, P., Hess, M., Schult, I., and Shettle, E. P.: Global aerosol data set, Max-Planck-Institut für Meteorologie, Report No. 243, Hamburg, 1997.
Kreidenweis, S. M., Petters, M. D., and DeMott, P. J.: Single-parameter estimates of aerosol water content, Environ. Res. Lett., 3, 35002, https://doi.org/10.1088/1748-9326/3/3/035002, 2008.
Lamarque, J.-F., Shindell, D. T., Josse, B., Young, P. J., Cionni, I., Eyring, V., Bergmann, D., Cameron-Smith, P., Collins, W. J., Doherty, R., Dalsoren, S., Faluvegi, G., Folberth, G., Ghan, S. J., Horowitz, L. W., Lee, Y. H., MacKenzie, I. A., Nagashima, T., Naik, V., Plummer, D., Righi, M., Rumbold, S. T., Schulz, M., Skeie, R. B., Stevenson, D. S., Strode, S., Sudo, K., Szopa, S., Voulgarakis, A., and Zeng, G.: The Atmospheric Chemistry and Climate Model Intercomparison Project (ACCMIP): overview and description of models, simulations and climate diagnostics, Geosci. Model Dev., 6, 179–206, https://doi.org/10.5194/gmd-6-179-2013, 2013.
Lamb, K. D., Perring, A. E., Samset, B., Peterson, D., Davis, S., Anderson, B. E., Beyersdorf, A., Blake, D. R., Campuzano-Jost, P., Corr, C. A., Diskin, G. S., Kondo, Y., Moteki, N., Nault, B. A., Oh, J., Park, M., Pusede, S. E., Simpson, I. J., Thornhill, K. L., Wisthaler, A., and Schwarz, J. P.: Estimating Source Region Influences on Black Carbon Abundance, Microphysics, and Radiative Effect Observed Over South Korea, J. Geophys. Res.-Atmos., 123, 13527–13548, https://doi.org/10.1029/2018JD029257, 2018.
Latimer, R. N. C. and Martin, R. V.: Interpretation of measured aerosol mass scattering efficiency over North America using a chemical transport model, Atmos. Chem. Phys., 19, 2635–2653, https://doi.org/10.5194/acp-19-2635-2019, 2019.
Lee, Y. N., Weber, R., Ma, Y., Orsini, D., Maxwell-Meier, K., Blake, D., Meinardi, S., Sachse, G., Harward, C., Chen, T. Y., Thornton, D., Tu, F. H., and Bandy, A.: Airborne measurement of inorganic ionic components of fine aerosol particles using the particle-into-liquid sampler coupled to ion chromatography technique during ACE-Asia and TRACE-P, J. Geophys. Res.-Atmos., 108, 8646, https://doi.org/10.1029/2002jd003265, 2003.
Levy, R. C., Mattoo, S., Munchak, L. A., Remer, L. A., Sayer, A. M., Patadia, F., and Hsu, N. C.: The Collection 6 MODIS aerosol products over land and ocean, Atmos. Meas. Tech., 6, 2989–3034, https://doi.org/10.5194/amt-6-2989-2013, 2013.
Li, C., Martin, R. V, van Donkelaar, A., Boys, B. L., Hammer, M. S., Xu, J.-W., Marais, E. A., Reff, A., Strum, M., and Ridley, D. A.: Trends in chemical composition of global and regional population-weighted fine particulate matter estimated for 25 years, Environ. Sci. Technol., 51, 11185–11195, 2017.
Liu, H., Jacob, D. J., Bey, I., and Yantosca, R. M.: Constraints from 210Pb and 7Be on wet deposition and transport in a global three-dimensional chemical tracer model driven by assimilated meteorological fields, J. Geophys. Res.-Atmos., 106, 12109–12128, https://doi.org/10.1029/2000JD900839, 2001.
Liu, X., Easter, R. C., Ghan, S. J., Zaveri, R., Rasch, P., Shi, X., Lamarque, J.-F., Gettelman, A., Morrison, H., Vitt, F., Conley, A., Park, S., Neale, R., Hannay, C., Ekman, A. M. L., Hess, P., Mahowald, N., Collins, W., Iacono, M. J., Bretherton, C. S., Flanner, M. G., and Mitchell, D.: Toward a minimal representation of aerosols in climate models: description and evaluation in the Community Atmosphere Model CAM5, Geosci. Model Dev., 5, 709–739, https://doi.org/10.5194/gmd-5-709-2012, 2012.
Liu, X., Ma, P.-L., Wang, H., Tilmes, S., Singh, B., Easter, R. C., Ghan, S. J., and Rasch, P. J.: Description and evaluation of a new four-mode version of the Modal Aerosol Module (MAM4) within version 5.3 of the Community Atmosphere Model, Geosci. Model Dev., 9, 505–522, https://doi.org/10.5194/gmd-9-505-2016, 2016.
Lyapustin, A., Wang, Y., Korkin, S., and Huang, D.: MODIS Collection 6 MAIAC algorithm, Atmos. Meas. Tech., 11, 5741–5765, https://doi.org/10.5194/amt-11-5741-2018, 2018.
Malm, W. C., Sisler, J. F., Huffman, D., Eldred, R. A., and Cahill, T. A.: Spatial and seasonal trends in particle concentration and optical extinction in the United States, J. Geophys. Res., 99, 1347–1370, https://doi.org/10.1029/93JD02916, 1994.
Mann, G. W., Carslaw, K. S., Spracklen, D. V., Ridley, D. A., Manktelow, P. T., Chipperfield, M. P., Pickering, S. J., and Johnson, C. E.: Description and evaluation of GLOMAP-mode: a modal global aerosol microphysics model for the UKCA composition-climate model, Geosci. Model Dev., 3, 519–551, https://doi.org/10.5194/gmd-3-519-2010, 2010.
Marais, E. A., Jacob, D. J., Jimenez, J. L., Campuzano-Jost, P., Day, D. A., Hu, W., Krechmer, J., Zhu, L., Kim, P. S., Miller, C. C., Fisher, J. A., Travis, K., Yu, K., Hanisco, T. F., Wolfe, G. M., Arkinson, H. L., Pye, H. O. T., Froyd, K. D., Liao, J., and McNeill, V. F.: Aqueous-phase mechanism for secondary organic aerosol formation from isoprene: application to the southeast United States and co-benefit of SO2 emission controls, Atmos. Chem. Phys., 16, 1603–1618, https://doi.org/10.5194/acp-16-1603-2016, 2016.
Martin, R. V., Jacob, D. J., Yantosca, R. M., Chin, M., and Ginoux, P.: Global and regional decreases in tropospheric oxidants from photochemical effects of aerosols, J. Geophys. Res.-Atmos., 108, 4097, https://doi.org/10.1029/2002jd002622, 2003.
Martin, R. V., Eastham, S. D., Bindle, L., Lundgren, E. W., Clune, T. L., Keller, C. A., Downs, W., Zhang, D., Lucchesi, R. A., Sulprizio, M. P., Yantosca, R. M., Li, Y., Estrada, L., Putman, W. M., Auer, B. M., Trayanov, A. L., Pawson, S., and Jacob, D. J.: Improved advection, resolution, performance, and community access in the new generation (version 13) of the high-performance GEOS-Chem global atmospheric chemistry model (GCHP), Geosci. Model Dev., 15, 8731–8748, https://doi.org/10.5194/gmd-15-8731-2022, 2022.
McDuffie, E. E., Smith, S. J., O'Rourke, P., Tibrewal, K., Venkataraman, C., Marais, E. A., Zheng, B., Crippa, M., Brauer, M., and Martin, R. V.: A global anthropogenic emission inventory of atmospheric pollutants from sector- and fuel-specific sources (1970–2017): an application of the Community Emissions Data System (CEDS), Earth Syst. Sci. Data, 12, 3413–3442, https://doi.org/10.5194/essd-12-3413-2020, 2020.
McDuffie, E. E., Martin, R. V., Spadaro, J. V., Burnett, R., Smith, S. J., O'Rourke, P., Hammer, M. S., van Donkelaar, A., Bindle, L., Shah, V., Jaeglé, L., Luo, G., Yu, F., Adeniran, J. A., Lin, J., and Brauer, M.: Source sector and fuel contributions to ambient PM2.5 and attributable mortality across multiple spatial scales, Nat. Commun., 12, 1–12, https://doi.org/10.1038/s41467-021-23853-y, 2021.
McNaughton, C. S., Clarke, A. D., Howell, S. G., Pinkerton, M., Anderson, B., Thornhill, L., Hudgins, C., Winstead, E., Dibb, J. E., Scheuer, E., and Maring, H.: Results from the DC-8 inlet characterization experiment (DICE): Airborne versus surface sampling of mineral dust and sea salt aerosols, Aerosol Sci. Tech., 41, 136–159, https://doi.org/10.1080/02786820601118406, 2007.
Meng, J., Martin, R. V., Li, C., Van Donkelaar, A., Tzompa-Sosa, Z. A., Yue, X., Xu, J. W., Weagle, C. L., and Burnett, R. T.: Source Contributions to Ambient Fine Particulate Matter for Canada, Environ. Sci. Technol., 53, 10269–10278, https://doi.org/10.1021/acs.est.9b02461, 2019.
Meng, J., Martin, R. V., Ginoux, P., Hammer, M., Sulprizio, M. P., Ridley, D. A., and van Donkelaar, A.: Grid-independent high-resolution dust emissions (v1.0) for chemical transport models: application to GEOS-Chem (12.5.0), Geosci. Model Dev., 14, 4249–4260, https://doi.org/10.5194/gmd-14-4249-2021, 2021.
Mishchenko, M. I., Dlugach, J. M., Yanovitskij, E. G., and Zakharova, N. T.: Bidirectional reflectance of flat, optically thick particulate layers: An efficient radiative transfer solution and applications to snow and soil surfaces, J. Quant. Spectrosc. Ra., 63, 409–432, https://doi.org/10.1016/S0022-4073(99)00028-X, 1999.
Mishchenko, M. I., Travis, L. D., and Lacis, A. A.: Scattering, Absorption, and Emission of Light by Small Particles, Cambridge University Press, Cambridge, 1–486, ISBN 9780521782524, 2002.
Moore, R. H., Wiggins, E. B., Ahern, A. T., Zimmerman, S., Montgomery, L., Campuzano Jost, P., Robinson, C. E., Ziemba, L. D., Winstead, E. L., Anderson, B. E., Brock, C. A., Brown, M. D., Chen, G., Crosbie, E. C., Guo, H., Jimenez, J. L., Jordan, C. E., Lyu, M., Nault, B. A., Rothfuss, N. E., Sanchez, K. J., Schueneman, M., Shingler, T. J., Shook, M. A., Thornhill, K. L., Wagner, N. L., and Wang, J.: Sizing response of the Ultra-High Sensitivity Aerosol Spectrometer (UHSAS) and Laser Aerosol Spectrometer (LAS) to changes in submicron aerosol composition and refractive index, Atmos. Meas. Tech., 14, 4517–4542, https://doi.org/10.5194/amt-14-4517-2021, 2021.
Nair, A. A., Yu, F., Campuzano-Jost, P., DeMott, P. J., Levin, E. J. T., Jimenez, J. L., Peischl, J., Pollack, I. B., Fredrickson, C. D., and Beyersdorf, A. J.: Machine learning uncovers aerosol size information from chemistry and meteorology to quantify potential cloud-forming particles, Geophys. Res. Lett., 48, e2021GL094133, https://doi.org/10.1029/2021GL094133, 2021.
Napari, I., Noppel, M., Vehkamäki, H., and Kulmala, M.: Parametrization of ternary nucleation rates for H2SO4-NH3-H2O vapors, J. Geophys. Res.-Atmos., 107, AAC 6-1–AAC 6-6, https://doi.org/10.1029/2002JD002132, 2002.
NASA: Download All V3 AOD, AERONET [data set], https://aeronet.gsfc.nasa.gov/new_web/download_all_v3_aod.html, last access: 26 April 2023a.
NASA: Deriving Information on Surface Conditions from Column and Vertically Resolved Observations Relevant to Air Quality, EarthData [data set], https://asdc.larc.nasa.gov/project/DISCOVER-AQ, last access: 26 April 2023b.
NASA: Korea United States Air Quality Study, EarthData [data set], https://doi.org/10.5067/Suborbital/KORUSAQ/DATA01, last access: 26 April 2023c.
Nault, B. A., Campuzano-Jost, P., Day, D. A., Schroder, J. C., Anderson, B., Beyersdorf, A. J., Blake, D. R., Brune, W. H., Choi, Y., Corr, C. A., de Gouw, J. A., Dibb, J., DiGangi, J. P., Diskin, G. S., Fried, A., Huey, L. G., Kim, M. J., Knote, C. J., Lamb, K. D., Lee, T., Park, T., Pusede, S. E., Scheuer, E., Thornhill, K. L., Woo, J.-H., and Jimenez, J. L.: Secondary organic aerosol production from local emissions dominates the organic aerosol budget over Seoul, South Korea, during KORUS-AQ, Atmos. Chem. Phys., 18, 17769–17800, https://doi.org/10.5194/acp-18-17769-2018, 2018.
Ngo, N. S., Asseko, S. V. J., Ebanega, M. O., Allo'o Allo'o, S. M., and Hystad, P.: The relationship among PM2.5, traffic emissions, and socioeconomic status: Evidence from Gabon using low-cost, portable air quality monitors, Transport Res. D-Tr. E., 68, 2–9, https://doi.org/10.1016/j.trd.2018.01.029, 2019.
Park, R. J.: Natural and transboundary pollution influences on sulfate-nitrate-ammonium aerosols in the United States: Implications for policy, J. Geophys. Res., 109, D15204, https://doi.org/10.1029/2003jd004473, 2004.
Park, R. J., Jacob, D. J., Chin, M., and Martin, R. V.: Sources of carbonaceous aerosols over the United States and implications for natural visibility, J. Geophys. Res.-Atmos., 108, 4355, https://doi.org/10.1029/2002jd003190, 2003.
Park, S.-S., Sim, S. Y., Bae, M.-S., and Schauer, J. J.: Size distribution of water-soluble components in particulate matter emitted from biomass burning, Atmos. Environ., 73, 62–72, 2013.
Philip, S., Martin, R. V., Pierce, J. R., Jimenez, J. L., Zhang, Q., Canagaratna, M. R., Spracklen, D. V., Nowlan, C. R., Lamsal, L. N., Cooper, M. J., and Krotkov, N. A.: Spatially and seasonally resolved estimate of the ratio of organic mass to organic carbon, Atmos. Environ., 87, 34–40, https://doi.org/10.1016/j.atmosenv.2013.11.065, 2014.
Philip, S., Martin, R. V., Snider, G., Weagle, C. L., Van Donkelaar, A., Brauer, M., Henze, D. K., Klimont, Z., Venkataraman, C., Guttikunda, S. K., and Zhang, Q.: Anthropogenic fugitive, combustion and industrial dust is a significant, underrepresented fine particulate matter source in global atmospheric models, Environ. Res. Lett., 12, 044018, https://doi.org/10.1088/1748-9326/aa65a4, 2017.
Pierce, J. R., Chen, K., and Adams, P. J.: Contribution of primary carbonaceous aerosol to cloud condensation nuclei: processes and uncertainties evaluated with a global aerosol microphysics model, Atmos. Chem. Phys., 7, 5447–5466, https://doi.org/10.5194/acp-7-5447-2007, 2007.
Pierce, J. R., Croft, B., Kodros, J. K., D'Andrea, S. D., and Martin, R. V.: The importance of interstitial particle scavenging by cloud droplets in shaping the remote aerosol size distribution and global aerosol-climate effects, Atmos. Chem. Phys., 15, 6147–6158, https://doi.org/10.5194/acp-15-6147-2015, 2015.
Plaza, J., Pujadas, M., Gómez-Moreno, F. J., Sánchez, M., and Artíñano, B.: Mass size distributions of soluble sulfate, nitrate and ammonium in the Madrid urban aerosol, Atmos. Environ., 45, 4966–4976, 2011.
Podolske, J. R., Sachse, G. W., and Diskin, G. S.: Calibration and data retrieval algorithms for the NASA Langley/Ames Diode Laser Hygrometer for the NASA Transport and Chemical Evolution over the Pacific (TRACE-P) mission, J. Geophys. Res.-Atmos., 108, 8792, https://doi.org/10.1029/2002jd003156, 2003.
Pye, H. O. T., Chan, A. W. H., Barkley, M. P., and Seinfeld, J. H.: Global modeling of organic aerosol: the importance of reactive nitrogen (NOx and NO3), Atmos. Chem. Phys., 10, 11261–11276, https://doi.org/10.5194/acp-10-11261-2010, 2010.
Ramnarine, E., Kodros, J. K., Hodshire, A. L., Lonsdale, C. R., Alvarado, M. J., and Pierce, J. R.: Effects of near-source coagulation of biomass burning aerosols on global predictions of aerosol size distributions and implications for aerosol radiative effects, Atmos. Chem. Phys., 19, 6561–6577, https://doi.org/10.5194/acp-19-6561-2019, 2019.
Reid, J. S., Eck, T. F., Christopher, S. A., Koppmann, R., Dubovik, O., Eleuterio, D. P., Holben, B. N., Reid, E. A., and Zhang, J.: A review of biomass burning emissions part III: intensive optical properties of biomass burning particles, Atmos. Chem. Phys., 5, 827–849, https://doi.org/10.5194/acp-5-827-2005, 2005.
Remoundaki, E., Kassomenos, P., Mantas, E., Mihalopoulos, N., and Tsezos, M.: Composition and mass closure of PM2.5 in urban environment (Athens, Greece), Aerosol Air Qual. Res., 13, 72–82, https://doi.org/10.4209/aaqr.2012.03.0054, 2013.
Reutter, P., Su, H., Trentmann, J., Simmel, M., Rose, D., Gunthe, S. S., Wernli, H., Andreae, M. O., and Pöschl, U.: Aerosol- and updraft-limited regimes of cloud droplet formation: influence of particle number, size and hygroscopicity on the activation of cloud condensation nuclei (CCN), Atmos. Chem. Phys., 9, 7067–7080, https://doi.org/10.5194/acp-9-7067-2009, 2009.
Rissler, J., Vestin, A., Swietlicki, E., Fisch, G., Zhou, J., Artaxo, P., and Andreae, M. O.: Size distribution and hygroscopic properties of aerosol particles from dry-season biomass burning in Amazonia, Atmos. Chem. Phys., 6, 471–491, https://doi.org/10.5194/acp-6-471-2006, 2006.
Rodríguez, S., Van Dingenen, R., Putaud, J.-P., Dell'Acqua, A., Pey, J., Querol, X., Alastuey, A., Chenery, S., Ho, K.-F., Harrison, R., Tardivo, R., Scarnato, B., and Gemelli, V.: A study on the relationship between mass concentrations, chemistry and number size distribution of urban fine aerosols in Milan, Barcelona and London, Atmos. Chem. Phys., 7, 2217–2232, https://doi.org/10.5194/acp-7-2217-2007, 2007.
Ruijrok, W., Davidson, C. I., and Nicholson, K. W.: Dry deposition of particles, Tellus B, 47, 587–601, https://doi.org/10.1034/j.1600-0889.47.issue5.6.x, 1995.
Sakamoto, K. M., Laing, J. R., Stevens, R. G., Jaffe, D. A., and Pierce, J. R.: The evolution of biomass-burning aerosol size distributions due to coagulation: dependence on fire and meteorological details and parameterization, Atmos. Chem. Phys., 16, 7709–7724, https://doi.org/10.5194/acp-16-7709-2016, 2016.
Sawamura, P., Moore, R. H., Burton, S. P., Chemyakin, E., Müller, D., Kolgotin, A., Ferrare, R. A., Hostetler, C. A., Ziemba, L. D., Beyersdorf, A. J., and Anderson, B. E.: HSRL-2 aerosol optical measurements and microphysical retrievals vs. airborne in situ measurements during DISCOVER-AQ 2013: an intercomparison study, Atmos. Chem. Phys., 17, 7229–7243, https://doi.org/10.5194/acp-17-7229-2017, 2017.
Schubert, S. D., Rood, R. B., and Pfaendtner, J.: An Assimilated Dataset for Earth Science Applications, B. Am. Meteorol. Soc., 74, 2331–2342, https://doi.org/10.1175/1520-0477(1993)074<2331:AADFES>2.0.CO;2, 1993.
Schwarz, J. P., Gao, R. S., Fahey, D. W., Thomson, D. S., Watts, L. A., Wilson, J. C., Reeves, J. M., Darbeheshti, M., Baumgardner, D. G., and Kok, G. L.: Single-particle measurements of midlatitude black carbon and light-scattering aerosols from the boundary layer to the lower stratosphere, J. Geophys. Res.-Atmos., 111, D16207, https://doi.org/10.1029/2006JD007076, 2006.
Seinfeld, J. H. and Pandis, S. N.: Atmospheric Chemistry and Physics, 3rd Edn., John Wiley, New York, ISBN 978-1-118-94740-1, 2016.
Shah, V., Jacob, D. J., Moch, J. M., Wang, X., and Zhai, S.: Global modeling of cloud water acidity, precipitation acidity, and acid inputs to ecosystems, Atmos. Chem. Phys., 20, 12223–12245, https://doi.org/10.5194/acp-20-12223-2020, 2020.
Snider, G., Weagle, C. L., Murdymootoo, K. K., Ring, A., Ritchie, Y., Stone, E., Walsh, A., Akoshile, C., Anh, N. X., Balasubramanian, R., Brook, J., Qonitan, F. D., Dong, J., Griffith, D., He, K., Holben, B. N., Kahn, R., Lagrosas, N., Lestari, P., Ma, Z., Misra, A., Norford, L. K., Quel, E. J., Salam, A., Schichtel, B., Segev, L., Tripathi, S., Wang, C., Yu, C., Zhang, Q., Zhang, Y., Brauer, M., Cohen, A., Gibson, M. D., Liu, Y., Martins, J. V., Rudich, Y., and Martin, R. V.: Variation in global chemical composition of PM2.5: emerging results from SPARTAN, Atmos. Chem. Phys., 16, 9629–9653, https://doi.org/10.5194/acp-16-9629-2016, 2016.
Sullivan, A. P., Guo, H., Schroder, J. C., Campuzano-Jost, P., Jimenez, J. L., Campos, T., Shah, V., Jaeglé, L., Lee, B. H., Lopez-Hilfiker, F. D., Thornton, J. A., Brown, S. S., and Weber, R. J.: Biomass Burning Markers and Residential Burning in the WINTER Aircraft Campaign, J. Geophys. Res.-Atmos., 124, 1846–1861, https://doi.org/10.1029/2017JD028153, 2019.
Sun, J., Zhang, Q., Canagaratna, M. R., Zhang, Y., Ng, N. L., Sun, Y., Jayne, J. T., Zhang, X., Zhang, X., and Worsnop, D. R.: Corrigendum to “Highly time- and size-resolved characterization of submicron aerosol particles in Beijing using an Aerodyne Aerosol Mass Spectrometer” [Atmos. Environ. 44 (2010) 131–140], Atmos. Environ., 47, 570, https://doi.org/10.1016/j.atmosenv.2010.01.023, 2012.
Sun, Y. L., Zhang, Q., Schwab, J. J., Chen, W. N., Bae, M. S., Lin, Y. C., Hung, H. M., and Demerjian, K. L.: A case study of aerosol processing and evolution in summer in New York City, Atmos. Chem. Phys., 11, 12737–12750, https://doi.org/10.5194/acp-11-12737-2011, 2011.
Szopa, S., Balkanski, Y., Schulz, M., Bekki, S., Cugnet, D., Fortems-Cheiney, A., Turquety, S., Cozic, A., Déandreis, C., Hauglustaine, D., Idelkadi, A., Lathière, J., Lefevre, F., Marchand, M., Vuolo, R., Yan, N., and Dufresne, J. L.: Aerosol and ozone changes as forcing for climate evolution between 1850 and 2100, Clim. Dynam., 40, 2223–2250, https://doi.org/10.1007/s00382-012-1408-y, 2013.
Tian, P., Liu, D., Huang, M., Liu, Q., Zhao, D., Ran, L., Deng, Z., Wu, Y., Fu, S., Bi, K., Gao, Q., He, H., Xue, H., and Ding, D.: The evolution of an aerosol event observed from aircraft in Beijing: An insight into regional pollution transport, Atmos. Environ., 206, 11–20, https://doi.org/10.1016/j.atmosenv.2019.02.005, 2019.
Timonen, H., Aurela, M., Carbone, S., Saarnio, K., Saarikoski, S., Mäkelä, T., Kulmala, M., Kerminen, V.-M., Worsnop, D. R., and Hillamo, R.: High time-resolution chemical characterization of the water-soluble fraction of ambient aerosols with PILS-TOC-IC and AMS, Atmos. Meas. Tech., 3, 1063–1074, https://doi.org/10.5194/amt-3-1063-2010, 2010.
Twomey, S.: Pollution and the Planetary Albedo, Atmos. Environ., 41, 120–125, https://doi.org/10.1016/j.atmosenv.2007.10.062, 2007.
Tzivion, S., Feingold, G., and Levin, Z.: The evolution of raindrop spectra. Part II: Collisional collection/breakup and evaporation in a rainshaft, J. Atmos. Sci., 46, 3312–3328, https://doi.org/10.1175/1520-0469(1989)046<3312:TEORSP>2.0.CO;2, 1989
van der Werf, G. R., Randerson, J. T., Giglio, L., van Leeuwen, T. T., Chen, Y., Rogers, B. M., Mu, M., van Marle, M. J. E., Morton, D. C., Collatz, G. J., Yokelson, R. J., and Kasibhatla, P. S.: Global fire emissions estimates during 1997–2016, Earth Syst. Sci. Data, 9, 697–720, https://doi.org/10.5194/essd-9-697-2017, 2017.
Van Donkelaar, A., Martin, R. V., Li, C., and Burnett, R. T.: Regional Estimates of Chemical Composition of Fine Particulate Matter Using a Combined Geoscience-Statistical Method with Information from Satellites, Models, and Monitors, Environ. Sci. Technol., 53, 2595–2611, https://doi.org/10.1021/acs.est.8b06392, 2019.
Wang, J., Xu, X., Ding, S., Zeng, J., Spurr, R., Liu, X., Chance, K., and Mishchenko, M.: A numerical testbed for remote sensing of aerosols, and its demonstration for evaluating retrieval synergy from a geostationary satellite constellation of GEO-CAPE and GOES-R, J. Quant. Spectrosc. Ra., 146, 510–528, https://doi.org/10.1016/j.jqsrt.2014.03.020, 2014a.
Wang, Q., Jacob, D. J., Spackman, J. R., Perring, A. E., Schwarz, J. P., Moteki, N., Marais, E. A., Ge, C., Wang, J., and Barrett, S. R. H.: Global budget and radiative forcing of black carbon aerosol: Constraints from pole-to-pole (HIPPO) observations across the Pacific, J. Geophys. Res., 119, 195–206, https://doi.org/10.1002/2013JD020824, 2014b.
Wang, Y., Jacob, D. J., and Logan, J. A.: Global simulation of tropospheric O3-NOx-hydrocarbon chemistry – 1. Model formulation, J. Geophys. Res.-Atmos., 103, 10713–10725, https://doi.org/10.1029/98jd00158, 1998.
Weagle, C. L., Snider, G., Li, C., Van Donkelaar, A., Philip, S., Bissonnette, P., Burke, J., Jackson, J., Latimer, R., Stone, E., Abboud, I., Akoshile, C., Anh, N. X., Brook, J. R., Cohen, A., Dong, J., Gibson, M. D., Griffith, D., He, K. B., Holben, B. N., Kahn, R., Keller, C. A., Kim, J. S., Lagrosas, N., Lestari, P., Khian, Y. L., Liu, Y., Marais, E. A., Martins, J. V., Misra, A., Muliane, U., Pratiwi, R., Quel, E. J., Salam, A., Segev, L., Tripathi, S. N., Wang, C., Zhang, Q., Brauer, M., Rudich, Y., and Martin, R. V.: Global Sources of Fine Particulate Matter: Interpretation of PM2.5 Chemical Composition Observed by SPARTAN using a Global Chemical Transport Model, Environ. Sci. Technol., 52, 11670–11681, https://doi.org/10.1021/acs.est.8b01658, 2018.
Weinheimer, A. J., Walega, J. G., Ridley, B. A., Sachse, G. W., Anderson, B. E., and Collins Jr., J. E.: Stratospheric NOy measurements on the NASA DC-8 during AASE II, Geophys. Res. Lett., 20, 2563–2566, 1993.
Weng, H., Lin, J., Martin, R., Millet, D. B., Jaeglé, L., Ridley, D., Keller, C., Li, C., Du, M., and Meng, J.: Global high-resolution emissions of soil NOx, sea salt aerosols, and biogenic volatile organic compounds, Sci. Data, 7, 1–15, https://doi.org/10.1038/s41597-020-0488-5, 2020.
Westervelt, D. M., Pierce, J. R., Riipinen, I., Trivitayanurak, W., Hamed, A., Kulmala, M., Laaksonen, A., Decesari, S., and Adams, P. J.: Formation and growth of nucleated particles into cloud condensation nuclei: model–measurement comparison, Atmos. Chem. Phys., 13, 7645–7663, https://doi.org/10.5194/acp-13-7645-2013, 2013.
Whitey, K. T.: The physical characteristics of sulfur aerosols, in: Atmospheric Environment, Vol. 41, Elsevier, 25–49, https://doi.org/10.1016/j.atmosenv.2007.10.057, 1978.
Yu, F. and Luo, G.: Simulation of particle size distribution with a global aerosol model: contribution of nucleation to aerosol and CCN number concentrations, Atmos. Chem. Phys., 9, 7691–7710, https://doi.org/10.5194/acp-9-7691-2009, 2009.
Yue, D. L., Hu, M., Wu, Z. J., Guo, S., Wen, M. T., Nowak, A., Wehner, B., Wiedensohler, A., Takegawa, N., Kondo, Y., Wang, X. S., Li, Y. P., Zeng, L. M., and Zhang, Y. H.: Variation of particle number size distributions and chemical compositions at the urban and downwind regional sites in the Pearl River Delta during summertime pollution episodes, Atmos. Chem. Phys., 10, 9431–9439, https://doi.org/10.5194/acp-10-9431-2010, 2010.
Zender, C. S., Bian, H., and Newman, D.: Mineral Dust Entrainment and Deposition (DEAD) model: Description and 1990s dust climatology, J. Geophys. Res.-Atmos., 108, 4416, https://doi.org/10.1029/2002jd002775, 2003.
Zhai, S., Jacob, D. J., Brewer, J. F., Li, K., Moch, J. M., Kim, J., Lee, S., Lim, H., Lee, H. C., Kuk, S. K., Park, R. J., Jeong, J. I., Wang, X., Liu, P., Luo, G., Yu, F., Meng, J., Martin, R. V., Travis, K. R., Hair, J. W., Anderson, B. E., Dibb, J. E., Jimenez, J. L., Campuzano-Jost, P., Nault, B. A., Woo, J.-H., Kim, Y., Zhang, Q., and Liao, H.: Relating geostationary satellite measurements of aerosol optical depth (AOD) over East Asia to fine particulate matter (PM2.5): insights from the KORUS-AQ aircraft campaign and GEOS-Chem model simulations, Atmos. Chem. Phys., 21, 16775–16791, https://doi.org/10.5194/acp-21-16775-2021, 2021.
Zhang, L., Kok, J. F., Henze, D. K., Li, Q., and Zhao, C.: Improving simulations of fine dust surface concentrations over the western United States by optimizing the particle size distribution, Geophys. Res. Lett., 40, 3270–3275, https://doi.org/10.1002/grl.50591, 2013.