the Creative Commons Attribution 4.0 License.
the Creative Commons Attribution 4.0 License.
 | 12 Jan 2023
The effect of ash, water vapor, and heterogeneous chemistry on the evolution of a Pinatubo-size volcanic cloud
Mohamed Abdelkader
Georgiy Stenchikov
Andrea Pozzer
Holger Tost
Jos Lelieveld
We employ the ECHAM5/MESSy2 atmospheric chemistry general circulation model (EMAC) that incorporates calculations of gas-phase and heterogeneous chemistry coupled with the ozone cycle and aerosol formation, transport, and microphysics to calculate the 1991 Pinatubo volcanic cloud. We considered simultaneous injections of SO2, volcanic ash, and water vapor. We conducted multiple ensemble simulations with different injection configurations to test the evolution of SO2, , ash masses, stratospheric aerosol optical depth, surface area density (SAD), and the stratospheric temperature response against available observations. We found that the volcanic cloud evolution is sensitive to the altitude where volcanic debris is initially injected and the initial concentrations of the eruption products that affect radiative heating and lofting of the volcanic cloud. The numerical experiments with the injection of 12 Mt SO2, 75 Mt of volcanic ash, and 150 Mt of water vapor at 20 km show the best agreement with the observation aerosol optical depth and stratospheric temperature response. Volcanic water injected by eruptive jet and/or intruding through the tropopause accelerates SO2 oxidation. But the mass of volcanic water retained in the stratosphere is controlled by the stratospheric temperature at the injection level. For example, if volcanic materials are released in the cold point above the tropical tropopause, most of the injected water freezes and sediments as ice crystals. The water vapor directly injected into the volcanic cloud increases the mass and stratospheric aerosol optical depth by about 5 %. The coarse ash comprises 98 % of the ash injected mass. It sediments within a few days, but aged submicron ash could stay in the stratosphere for a few months providing SAD for heterogeneous chemistry. The presence of ash accelerates the SO2 oxidation by 10 %–20 % due to heterogeneous chemistry, radiative heating, lofting, and faster dispersion of volcanic debris. Ash aging affects its lifetime and optical properties, almost doubling the ash radiative heating. The 2.5-year simulations show that the stratospheric temperature anomalies forced by radiative heating of volcanic debris in our experiments with the 20 km injection height agree well with observations and reanalysis data. This indicates that the model captures the long-term evolution and climate effect of the Pinatubo volcanic cloud. The volcanic cloud's initial lofting, facilitated by ash particles' radiative heating, controls the oxidation rate of SO2. Ash accelerates the formation of the sulfate layer in the first 2 months after the eruption. We also found that the interactive calculations of OH and heterogeneous chemistry increase the volcanic cloud sensitivity to water vapor and ash injections. All those factors must be accounted for in modeling the impact of large-scale volcanic injections on climate and stratospheric chemistry.
- Article
(13689 KB) - Full-text XML
-
Supplement
(12326 KB) - BibTeX
- EndNote


Strong explosive volcanic eruptions are the major natural cause of climate variability on both global and regional scales (Robock, 2000). Volcanic explosions inject a mixture of SO2, volcanic ash, water vapor, halogens, and other tracers into the stratosphere. The injected volcanic materials scatter and absorb incoming solar and outgoing terrestrial radiation, warming the stratosphere and cooling the Earth's surface and the lower troposphere (Hansen et al., 1992; Stenchikov et al., 1998; Kirchner et al., 1999; Robock, 2000; Soden, 2002; Shindell et al., 2001). Stratospheric warming and tropospheric cooling caused by the radiative impact of volcanic aerosols yield to changes in atmospheric circulation (Stenchikov et al., 1998; Kirchner et al., 1999; Ramachandran et al., 2000), affect El Niño–Southern Oscillation (ENSO) (Predybaylo et al., 2017), and force a positive phase of the Arctic Oscillation (AO) (Graf et al., 1993; Kodera and Kuroda, 2000; Mao and Robock, 1998; Kodera and Kuroda, 2000; Stenchikov, 2002; Shindell, 2004; Stenchikov et al., 2006; Karpechko et al., 2010) causing boreal winter warming in middle and high latitudes over Eurasia and North America (Stenchikov et al., 2004; Thomas et al., 2009; Poberaj et al., 2011).
Recent research shows that the mechanisms of stratosphere–troposphere dynamic interaction are complex, and large simulation ensembles are required to detect and attribute dynamic responses reliably. Stenchikov et al. (2006), Driscoll et al. (2012), and Charlton-Perez et al. (2013) showed that the Intergovernmental Panel on Climate Change (IPCC) models have the problem of producing a stronger northern polar vortex in response to low-latitude volcanic eruptions. Conveying this signal to the surface is even more problematic. For example, Polvani et al. (2019) concluded that the positive AO phase after the Pinatubo eruption appeared only by chance. Toohey et al. (2014) further elaborated on the planetary-wave-based mechanism of winter warming after large low-latitude eruptions. Bittner et al. (2016) and Azoulay et al. (2021) showed that a stronger eruption could more reliably force a positive phase of the AO.
The eruption of Mount Pinatubo in the Philippines on 15 June 1991 had an explosivity index of VEI = 6 and caused the largest climate impact in the 20th century. It was also the largest eruption that affected a densely populated area. The observed global mean visible optical depth from the Pinatubo eruption reached 0.15. It was about 2 times higher than the second largest eruption in the 20th century: El Chichón in 1982 (Dutton and Christy, 1992). The 1991 Mt. Pinatubo eruption is also the best-observed explosive event with a detected significant climate impact. It has been documented by satellite instruments (McCormick, 1987; Long and Stowe, 1994), ground-based lidars and sun photometers (Antuna et al., 2002, 2003; Good and Pyle, 2004; Nagai et al., 2010; Dutton and Christy, 1992; Thomason, 1992) , and airborne aerosol counters (McCormick et al., 1995; Pueschel et al., 1994; Borrmann et al., 1995; Deshler, 2003). Mount Pinatubo produced about 5 km3 of magma. According to observations, three main volcanic explosions on 15 June 1991 spread volcanic ash and gases over an area of 300 000 km2
The SO2 mass emitted by the Mount Pinatubo eruption was estimated using the Stratospheric Aerosol and Gas Experiment (SAGE), the TIROS Operational Vertical Sounder (TOVS), and the Total Ozone Mapping Spectrometer (TOMS) retrievals (Guo et al., 2004a; Rose et al., 2006; Sheng et al., 2015; Krueger et al., 1995; Fisher et al., 2019). In addition to SO2, Pinatubo injected tens of megatons of water vapor and volcanic ash into the stratosphere (Guo et al., 2004a; Nedoluha et al., 1998; Joshi and Jones, 2009).
In the stratosphere, SO2 is oxidized by the OH radical to form sulfuric acid, which then binary-nucleates in the presence of water to form sulfate aerosol. The primary source of OH in the stratosphere is ozone photolysis by ultraviolet radiation. This reaction forms oxygen and atomic oxygen in the excitation state (O1d), which interacts with water vapor to form OH radicals. Thus, the SO2 oxidation is controlled by the abundance of OH, which depends on the concentration of stratospheric water vapor (Lovejoy et al., 1996). The co-injection of water vapor with SO2 accelerates the formation of sulfuric acid (LeGrande et al., 2016). The online calculation of OH is essential to correctly reproduce the dynamics of sulfate aerosol mass (Clyne et al., 2021; Stenchikov, 2021), and this has been neglected in some previous studies (Marshall et al., 2018; Niemeier et al., 2009; Oman et al., 2006).
The sulfuric acid resulting from SO2 oxidation nucleates to form long-lived submicron sulfate droplets interacting with solar and terrestrial radiation. The radiative effect and lifetime of sulfate aerosols depend on their size distribution, which is not definitively established. Therefore, different Pinatubo modeling studies report a wide range of visible (0.5–0.6 µm) stratospheric aerosol optical depth (SAOD) for the same amount of injected SO2. Brühl et al. (2015) obtained equatorial average SAOD = 0.38 compared to SAOD = 0.11 reported by LeGrande et al. (2016) for 17 Mt of injected SO2. Niemeier et al. (2021) and Stenchikov et al. (2021) obtained similar SAOD which is consistent with observations for 17 Mt of injected SO2. Dhomse et al. (2014), using a detailed aerosol microphysics model, found that in simulations of a Pinatubo-like eruption with 10 Mt of SO2 injection, SAOD matches observations better than that with larger SO2 emission. Mills et al. (2016) also reported that in their model a 10 Mt SO2 injection produces the best fit to Pinatubo observations, while Sheng et al. (2015) and Sukhodolov et al. (2018) found that SAOD in their experiments with the emission of the 14 Mt of SO2 best fits SAGE observations. Timmreck et al. (2018) conducted ensembles of simulations with perturbed parameters, including the mass of injected SO2 and the injection height of volcanic debris, to quantify the uncertainties in the radiative forcing of the 1991 Mt. Pinatubo eruption.
Volcanic ash (tephra) comprises silicate and volcanic glass with traces of gas bubbles (Kremser et al., 2016). Ash particles have a wide range of sizes from sub-micrometers to millimeters (Rose and Durant, 2009) and highly irregular shapes. Large ash particles with radii r > 1 µm sediment relatively quickly (Niemeier et al., 2021, 2009; Stenchikov et al., 2021) and are believed to contribute little in the long-term evolution of a volcanic cloud. Fine ash particles with r < 1 µm disperse over vast distances and can survive in the stratosphere for several months (Pueschel et al., 1994; Zhu et al., 2020; Russell et al., 1996; Vernier et al., 2016). Still, their radiative effect is small because of their relatively small mass. However, Stenchikov (2021) showed that although most ash mass sediments during the first week after an eruption, ash solar and infrared (IR) heating and chemical/microphysical interactions with sulfate particles could affect the volcanic cloud formation and its long-term evolution. Ash particles could be coated by sulfate, becoming chemically aged (Muser et al., 2020; Zhu et al., 2020). They also uptake SO2, thereby decreasing its abundance (Zhu et al., 2020). The coating and aging of ash particles increase their size, alter their optical properties, and increase their deposition velocities (Muser et al., 2020; Zhu et al., 2020). The enhanced ash sedimentation removes a portion of sulfate depending on the aging level. At the same time, stratospheric aerosol particles (ash and sulfate) provide surfaces for heterogeneous chemical reactions affecting stratospheric chemical composition (Muthers et al., 2015). Aerosol particles from volcanic eruptions increase the surface area density (SAD) and hence the rate of heterogeneous reactions involving ClONO2 and N2O5. This damps the NOx mixing ratios altering the OH stratospheric budget, which affects the rate of SO2 oxidation (Prather, 1992; Kilian et al., 2020).
Volcanic ash absorbs and scatters solar shortwave (SW) and terrestrial longwave (LW) radiation. This significantly impacts the dynamics and radiation budget of the atmosphere in the first few days after an eruption, causing rapid lifting of volcanic debris (Stenchikov et al., 2021; Niemeier et al., 2009). The models that calculate the evolution of volcanic clouds and their impact on climate assume various SO2 injection heights and initial plume composition (ash and water are often not injected), use different spatial–temporal resolutions, and treat ash–sulfate chemical interaction differently. The differences in physics and chemistry translate into the differences in volcanic cloud evolution and radiative effect.
Along with the SO2 mass, the injection height of volcanic debris is a critical parameter for correctly simulating the dispersion of a volcanic cloud, as it is associated with the wind field that transports the volcanic plume. Different modeling studies assume different injection heights. The results show that the oxidation rate of SO2 depends strongly on the injection height according to the availability of water vapor and OH radicals. Sheng et al. (2015) performed a sensitivity study for the initial mass and altitude of the injected SO2 for the Pinatubo eruption and showed that a mass of 17 Mt of SO2 gives the best agreement with the SAGE optical depth within a peak of the volcanic cloud between 18–21 km. The transient equilibrium height of the volcanic plume depends not only on the height of the initial injection but also on internal feedback mechanisms. Stenchikov et al. (2021) demonstrated that radiative heating by ash was lifting volcanic debris by 1 km d−1 during the first week following the 1991 Pinatubo eruption. Muser et al. (2020) reported the lifting of a volcanic plume of the Raikoke eruption, 1 order of magnitude smaller than the 1991 Pinatubo eruption. Volcanic debris injections cause significantly weaker lofting when their initial distribution is quasi-zonal, as in Brühl et al. (2015), than when it is localized, as in LeGrande et al. (2016). In addition to processes considered in Stenchikov et al. (2021), we here explicitly calculate ash chemical aging, stratospheric ozone chemistry, and aerosol microphysical processes, accounting for the hygroscopic growth of sulfate/ash particles. However, we do not account for the heating by SO2 because for the Pinatubo eruption, it is much weaker than radiative heating from ash and sulfate aerosols (Osipov et al., 2020, 2021; Stenchikov et al., 2021).
The underlying dynamic and chemical mechanisms of the large sensitivity of SAOD to the injection height have not been tested yet in a fully interactive model. The effects of injected “volcanic” water and chemical aging of volcanic ash on SO2 oxidation rate and removal are not studied within the models with comprehensive gaseous and heterogeneous chemistry and detailed microphysics. Here we use the EMAC model with multi-phase chemistry along with detailed aerosol microphysics to study the evolution of a Pinatubo-size volcanic cloud. We account for the entire range of dynamic, chemical, and microphysical complexity of the processes governing the development of volcanic cloud to address the following science questions:
-
How do the initial spatial distribution and height of injected volcanic debris affect the evolution of a volcanic cloud?
-
What is the effect of heterogeneous chemistry on the SO2 oxidation rate within a volcanic cloud?
-
How does the co-injection of SO2, water vapor, and ash affect volcanic cloud evolution?
-
How does the aging of co-injected ash affect volcanic cloud development?
To constrain the simulations and evaluate the model results, we use the SAGE data set with partially filled gaps compiled by Stratospheric Processes And their Role in Climate (SPARC) and published in the Assessment of Stratospheric Aerosol Properties (ASAP) report (Thomason and Peter, 2006). This data set provides the aerosol effective radius and aerosol extinction in UV, visible (0.525 µm), and near-IR (1.02 µm) wavelengths. The SAGE/ASAP SAOD is a zonal mean and assembled on a monthly basis. It is available from 70∘ S to 70∘ N with a 5∘ resolution in latitude from 1984 to 1999. We refer to these data as SAGE/ASAP SAOD or Reff. The SAGE observations of aerosol extinction contain multiple gaps in the initial stage of the volcanic cloud evolution because of the instrument's saturation (Thomason, 1992). The near-IR observations are of better quality than in the visible or ultraviolet (UV) range (Stenchikov et al., 1998). Therefore, to obtain the visible SAGE/ASAP SAOD, we scale near-IR SAOD using the Ångström exponent obtained from our simulations, similar to Stenchikov et al. (1998). We also use the Advanced Very High-Resolution Radiometer (AVHRR) SAOD at 0.63 µm (Long and Stowe, 1994). The AVHRR observations are collected over the oceans at 0.1∘ × 0.1∘ horizontal resolution for cloud-free conditions in daylight time. The AVHRR aerosol optical depth (AOD) is measured for the entire atmospheric column, including the troposphere. To obtain the AVHRR stratospheric AOD, we calculate the AVHRR AOD monthly climatology for the pre-Pinatubo period of 1985–1990 and subtract it from the total AOD for the Pinatubo period. Unfortunately, this can introduce uncertainty due to the high variability of tropospheric AOD. We refer to the visible SAOD obtained from the SAGE near-IR observations as the scaled SAGE/ASAP SAOD.
Krueger et al. (1995) estimated the mass of SO2 during the first 15 d after the 1991 Pinatubo eruption based on the Total Ozone Mapping Spectrometer (TOMS) observations. They concluded that the mass of the initially emitted SO2 was 15 ± 3 Mt. Guo et al. (2004a) later estimated the emitted mass of SO2 to be 14–20 Mt. Recent estimates reduce the initial SO2 mass to 12 Mt (Fisher et al., 2019). Estimates of SO2 mass using retrievals from the TIROS Optical Vertical Sounder/High-Resolution Infrared Radiation Sounder/2 (TOVS) on the Television Infrared Observation Satellite (TIROS) suggest that the initial SO2 mass was 19 ± 4 Mt (Guo et al., 2004a). However, the TOVS retrievals are less accurate than TOMS because they are affected by sulfate aerosol absorption in the IR range. mass has also been estimated using the High-Resolution Infrared Radiation Sounder/2 (HIRS/2) (Guo et al., 2004a). The estimated sulfate aerosol mass depends on the aerosol size distribution, which is not well known, and this adds uncertainties to the estimated mass.
Volcanic ash mass was estimated for the first few days after the Pinatubo eruption using the AVHRR and HIRS/2 observations (Guo et al., 2004b). HIRS/2 detected 80 Mt of fine ash in the atmosphere on the first day after the eruption. AVHRR ash retrievals evaluate the spectral contrast of radiance (aerosol index) to distinguish between absorbing aerosols, such as volcanic ash, and non-absorbing aerosols, such as sulfate. However, the retrieval algorithm does not consider particles smaller than 1 µm (Guo et al., 2004b).
We obtain the stratospheric temperature response to the 1991 Pinatubo eruption from the Modern-Era Retrospective analysis for Research and Applications (MERRA2) reanalysis data available on a 0.5∘ × 0.625∘ horizontal grid and 72 vertical levels from the surface to 0.01 hPa (Gelaro et al., 2017). To reproduce the effect of the 1991 Pinatubo eruption, MERRA2 assimilates observations from different satellite sensors such as TOVS and the Meteosat Second Generation (MSG) satellite as well as the Microwave Limb Sounder (MLS). The MERRA2 temperature fields are consistent with the observations reported by Labitzke and McCormick (1992). The reanalysis intercomparison S-RIR (Fujiwara et al., 2022) shows that the MERRA2 stratospheric temperature anomalies caused by the 1991 Pinatubo injection resemble the observations well, although the absolute stratospheric temperature is slightly underestimated. In this study, the MERRA2 temperature anomalies were calculated with respect to 1985–1990 climatology.
Here we employ the ECHAM5/MESSy2 atmospheric chemistry model, EMAC (Joeckel et al., 2005, 2006, 2010). EMAC is a modular model based on submodels that describe processes in the stratosphere, the middle atmosphere, and the troposphere, accounting for anthropogenic emissions and interactions with oceans and land (Joeckel et al., 2010). EMAC has been used to study impacts of volcanic stratospheric aerosols on climate and stratospheric circulation (Brühl et al., 2012, 2015; Bingen et al., 2017; Löffler et al., 2016; Kilian et al., 2020) as well as dust aging and dust–air pollution interactions in the troposphere (Abdelkader et al., 2015, 2017; Klingmüller et al., 2019, 2020).
Klingmüller et al. (2014)Pozzer et al. (2006)Roeckner et al. (2006)Tost et al. (2006b, 2010)Tost et al. (2006b)Kerkweg et al. (2006a)Pringle et al. (2010)Landgraf and Crutzen (1998)Sander et al. (2014, 2019)Tost et al. (2007)Sander et al. (2011)Kerkweg et al. (2006b)Kerkweg et al. (2006b)Roeckner et al. (2006)Joeckel et al. (2006)Tost et al. (2006a)Kerkweg et al. (2006a)Kerkweg et al. (2006b)Joeckel et al. (2006)Table 1List of EMAC submodels used in this study. A complete list of all EMAC submodels can be found in Joeckel et al. (2010).
The Modular Earth Submodel System (MESSy) links the various submodels. The submodels comprise AEROPT, CLOUD, CONVECT, CVTRANS, DDEP, GMXE, JVAL, LNOX, MECCA, OFFEMIS, ONEMIS, RAD4ALL, SCAV, SEDI, TNUDGE, and TROPOP. Table 1 shows the submodels used in this study indicating their functionality, while the detailed description of all EMAC submodels can be found in Joeckel et al. (2010). We configure EMAC using MESSy version 2.52 with the fifth-generation European Centre Hamburg Atmospheric general circulation Model version 5.3.02, ECHAM5 (Roeckner et al., 2006), and employ the same chemistry and aerosol microphysics setup as in Brühl et al. (2012, 2015). For vertical approximation, we use 90 sigma hybrid levels from the Earth surface up to 0.01 hPa and a T42 spectral approximation horizontally corresponding to 2.8∘ grid spacing at the Equator both in longitude and latitude. Varying monthly sea surface temperature and sea ice are prescribed from the AMIPII data set (Taylor et al., 2000).
We apply the quasi-biennial oscillation (QBO) submodel to capture the observed phase of QBO and account for its effect on the stratospheric circulation, similar to Stenchikov et al. (2004). No other constraints are imposed on the model dynamics.
The emission inventory comprises the sources of greenhouse gases, NOx, CO, non-methane volatile organic compounds (NMVOSs), NH3, SO2, black carbon (BC), and organic carbon (OC). We also account for the background emission of CFCs, halogens, and halons. The emissions are monthly means and geographically distributed according to the 2009 Emissions Database for Global Atmospheric Research version 4 (EDGAR4) emission inventory and the Global Fire Emissions Database (GFED) version 3 (van der Werf et al., 2010). We account for the dimethylsulfide (DMS) and carbonyl sulfide (OCS) emissions similarly to Brühl et al. (2015). We employ 230 gas-phase chemical reactions, 76 photolytic reactions, and 12 heterogeneous reactions for 159 species to calculate atmospheric composition. The photolysis rates are calculated within the model for the spectral range of 178.6 nm ≤ λ ≤ 752.5 nm accounting for gaseous absorption (O3 and O2), Rayleigh scattering, absorption, and scattering by aerosols and clouds (Landgraf and Crutzen, 1998; Sander et al., 2011). In this setup, the photolysis rates are not coupled to volcanic aerosol. The model calculates the instantaneous radiative forcing using double radiation calls, with and without aerosols. Aerosol microphysics and chemistry are called every model time step, while the radiation submodel is called every third time step.
3.1 Stratospheric sulfate chemistry
Volcanic sulfate results from the oxidation of SO2 by OH in the presence of water vapor. OH is produced by ozone photolysis by UV radiation with wavelengths of less than 0.242 µm. This reaction forms O2 and excited oxygen O(1d). The excited oxygen radical interacts with water to form the hydroxyl radical OH, which oxidizes SO2 in two steps to form sulfate. At the first step, OH oxidizes SO2 to form SO3 and HO2. At the second step, SO3 interacts with water molecules to form sulfuric acid (Seinfeld and Pandis, 2006). The rate of reaction depends on the concentration of water molecules that are also the reactants (Burkholder et al., 2015). Therefore, higher water vapor concentration significantly increases the formation rate of sulfuric acid. New sulfate particles are generated by the binary nucleation of sulfuric acid and water molecules. Thus, the formation of sulfate particles in a volcanic cloud depends strongly on water vapor concentration. The models that do not parameterize nucleation explicitly are less sensitive to the abundance of water vapor in a volcanic cloud than those that do (LeGrande et al., 2016).
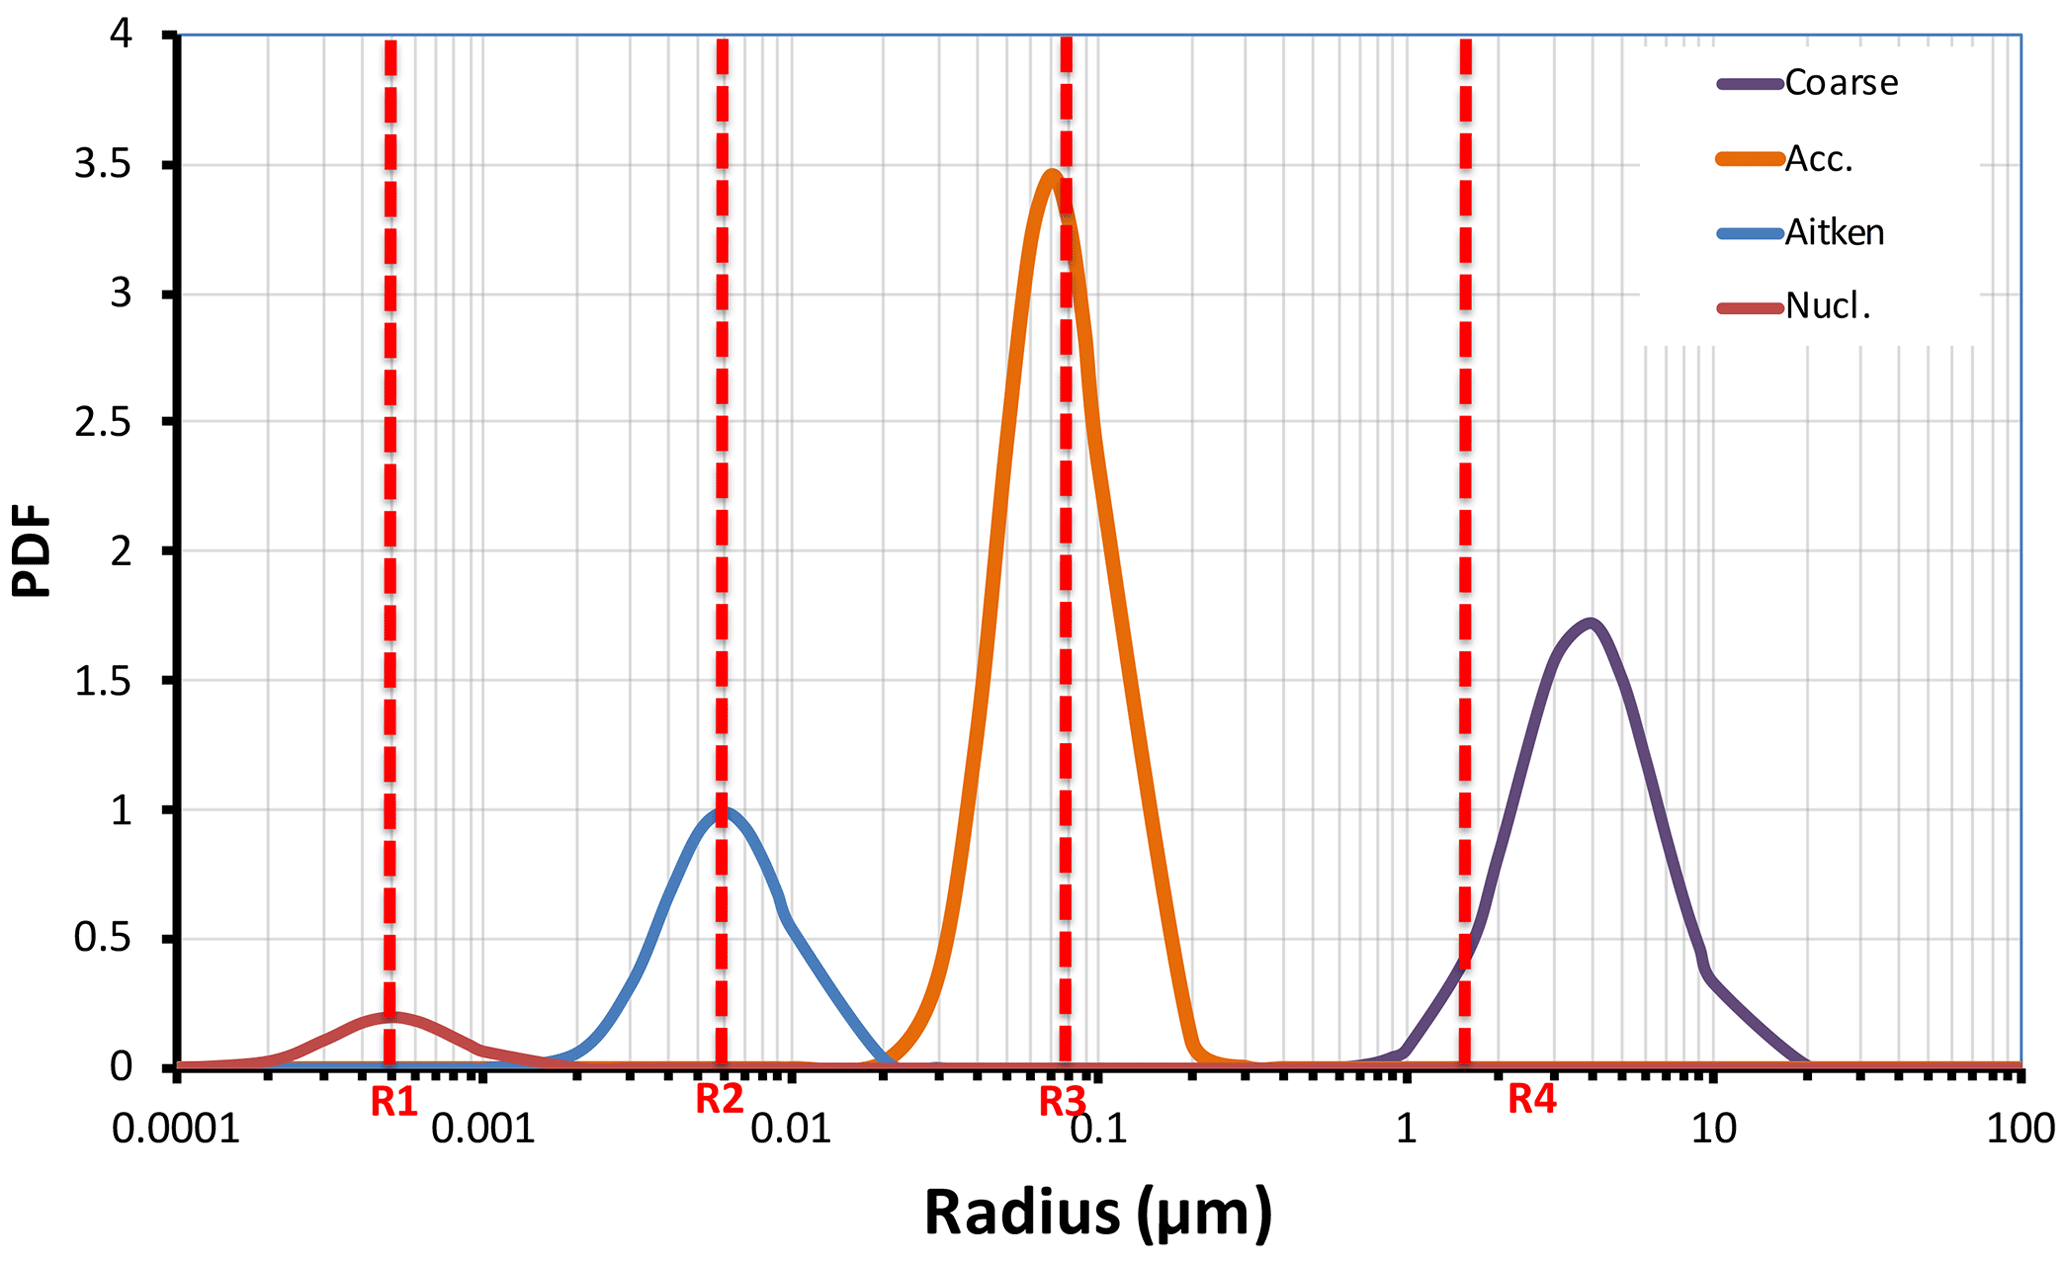
Figure 1Schematic representation of the initial size distribution of aerosol modes in EMAC (nucleation, Aitken, accumulation, and coarse). The threshold radii R1, R2, R3, and R4 control particle exchange between the modes. Initially 1.5 Mt of volcanic ash was injected in accumulation mode and 73.5 Mt in coarse mode.
3.2 Aerosol microphysics
The aerosol setup in EMAC has been described in detail in Pringle et al. (2010), Tost et al. (2010), de Meij et al. (2012), Pozzer et al. (2012), Brühl et al. (2015), and Abdelkader et al. (2015, 2017). We use the aerosol microphysics submodel GMXe (Pringle et al., 2010), coupled to the gas–aerosol partitioning scheme ISORROPIA-II (Fountoukis and Nenes, 2007) and heterogeneous chemistry schemes (Sander et al., 2005, 2011, 2019). Aerosol size distributions in the model are approximated by seven lognormal modes: four soluble modes (nucleation, Aitken, accumulation, coarse) and three insoluble modes (Aitken, accumulation, coarse). In our simulations, sulfate particles are represented by soluble modes, while ash is initially considered insoluble until it ages; i.e., five monolayers of sulfate particles coat the ash particle. The modes' median radii change in time during aerosol microphysical transformations, but the widths of the modes remain fixed. The median radii for the three insoluble modes and dry cores of the four soluble modes initially are equal to 0.0015, 0.025, 0.25, and 2.5 µm for nucleation, Aitken, accumulation, and coarse modes, respectively. The geometric standard deviations of the lognormal distributions for the above modes are 1.59, 1.59, 1.49, and 1.70, respectively (Brühl et al., 2015).
Aerosols in soluble modes evolve by uptake or loss of water and molecules and coagulation. The hygroscopic growth of ash is only allowed in a soluble mode (Abdelkader et al., 2015). The mass of large or fine aerosol particles in the size distribution tails is assigned to a corresponding neighboring mode when the mode's median radius reaches a certain threshold. The aerosol modes and the thresholds are schematically shown in Fig. 1. In our simulations, we choose threshold radii equal to 0.0005, 0.006, 0.07, and 1.6 µm for the nucleation, Aitken, accumulation, and coarse modes, respectively, as in Brühl et al. (2015).
3.3 Volcanic ash – model implementation
We introduced a new “ash” tracer to account for volcanic ash in the EMAC setting. We assume the ash density to be 2400 kg m−3. Ash is similar to mineral dust, comprising mainly silicates (SiO2). Therefore, for calculating chemical aging, we assume that ash particles have the same water uptake and accommodation coefficients as dust particles (Abdelkader et al., 2015).
In our simulations, high-density ash particles sediment faster than pumice assumed in Zhu et al. (2020). Zhu et al. (2020) considered that the Kelud eruption emitted 100 times less volcanic material than the 1991 Pinatubo eruption; therefore, even the long-lived pumice ash produced negligible radiative heating. Stenchikov et al. (2021) showed that applying the assumption about long-lived pumice ash for the larger volcanic explosions like the 1991 Pinatubo eruption could cause unrealistic overheating of the stratosphere. Volcanic ash is removed from the stratosphere mainly by gravitational sedimentation. Sedimentation parameterization in EMAC utilizes the Walcek scheme (Walcek, 2000; Kerkweg et al., 2006a). Ash scavenging in the troposphere is implemented in EMAC by Tost et al. (2006a) and is fully coupled with aerosol and gas-phase chemistry.
For a complete representation of chemical aging, we use a comprehensive chemistry scheme that enables the production of the primary inorganic acids which contribute to the chemical aging of ash particles (Metzger et al., 2016).
Ash particles scatter and absorb solar and terrestrial radiation. To calculate their optical properties we choose the volcanic ash's complex refractive index according to Pollack et al. (1973), Vogel et al. (2017), and Stenchikov et al. (2021). For visible wavelengths, the ash refractive index RI = 1.53 + 0.004i. Ash is more absorbing at UV, near-IR, and IR wavelengths than at visible ones. Table S1 in the Supplement shows the volcanic ash refractive index as a function of wavelength. Figure S8 shows the refractive indices used in the EMAC model for different aerosols as a function of wavelength.
3.4 Aerosol radiative effect
We use the AEROPT submodel to calculate extinction, single-scattering albedo, and asymmetry parameter, the aerosol optical properties required for the radiative transfer calculations. It is assumed that different types of aerosols are mixed internally so that the refractive index of the mixture is calculated from the volume fractions of the aerosol components. The sensitivity to this assumption is discussed in detail by Klingmüller et al. (2014). The optical properties are calculated for each aerosol mode independently. The RAD submodel calculates radiative transfer (Roeckner and Coauthors, 2003). The Fouquart and Bonnel (1980) scheme is used for calculating shortwave radiation, while longwave radiation is calculated using a rapid radiative transfer model (RRTM) (Iacono et al., 2008). Scattering of the IR radiation by aerosols is neglected. RAD accounts for shortwave and longwave absorption of water vapor, clouds, O3, CH4, N2O, CO2, CFCs, and aerosols. Table 2 shows the shortwave and longwave bands used in the radiative transfer calculations in EMAC. For comparison with observations, we consider the first two SW bands in Table 2 as visible and near-IR.
Table 2Shortwave and longwave bands used in the radiation transfer calculations.
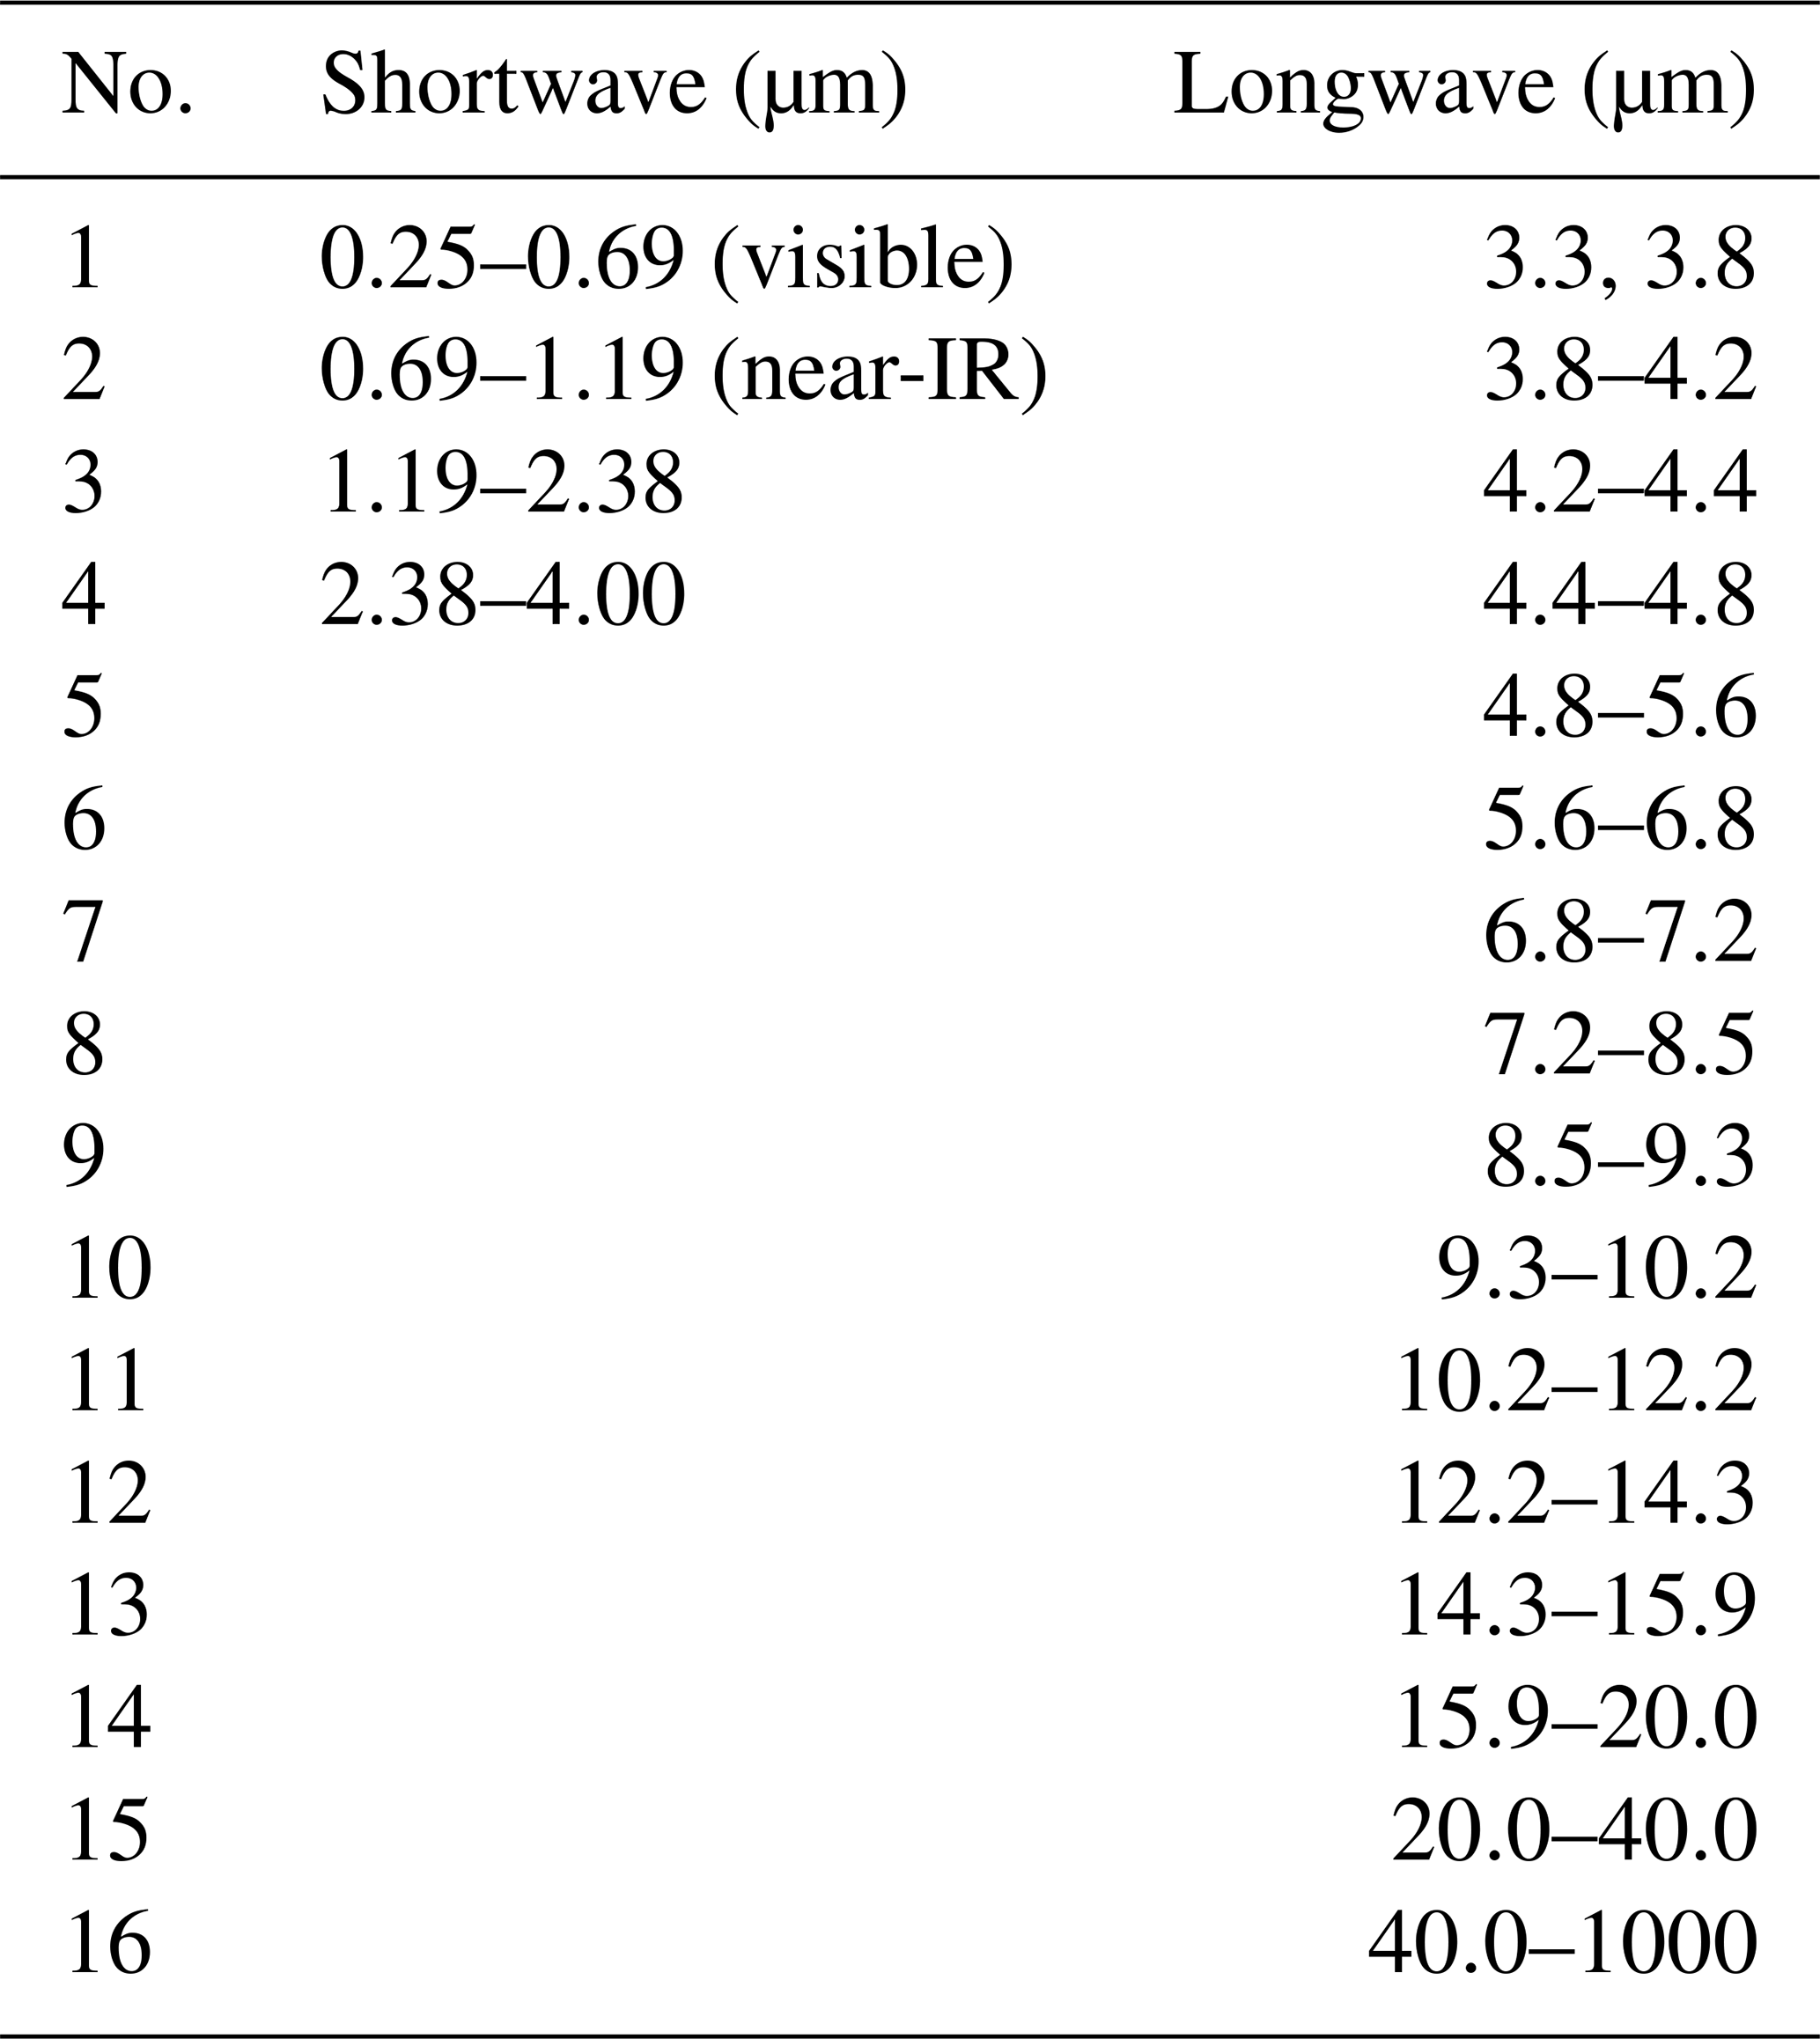
Table 3Description of experiments. The experiments are labeled according to the initial injection size and constituents of the injected plume. All experiment, the “1 × 1” format represents injection in one grid box, 3s10 represents zonal injection with 10 grid points in the latitude direction, the letter “s” denotes that only SO2 was injected (dry injection), the letter “w” denotes that SO2 and water vapor were injected (wet injection), and the va0 injection of volcanic ash with no aging and va1 is the aging case. For the 1w1,va0, and va1 experiments, 15 and 150 Mt of water vapor are injected. Each has five ensemble members.

1 One grid box: 280 km × 280 km with a thickness of 1 km at 17 and 20 km altitude and 0.5 km at 25 km altitude. 2 Ten grid boxes in latitude and 10 grid boxes in height (5km thickness).
Table 4List of the studies that simulated interactive chemistry for the Pinatubo case and the injected SO2 height, maximum AOD, and the time (in months) for the maximum AOD.
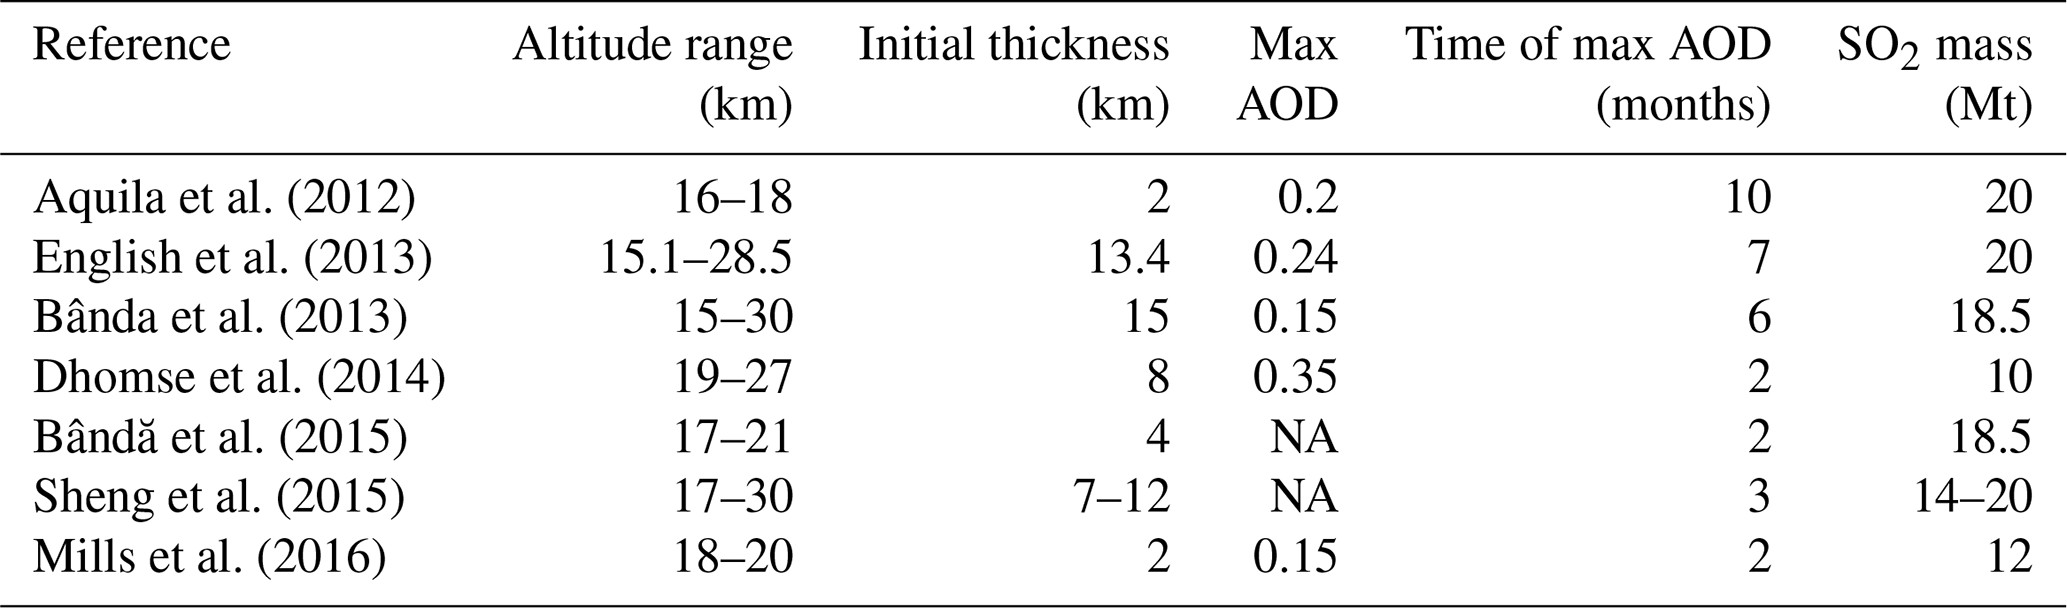
NA: not available.
Table 3 shows the complete set of numerical experiments conducted in this study. The control experiment (ctrl) describes the state of the atmosphere from 1990 to 2000, assuming there were no volcanic eruptions. In the perturbed simulations (with the injection of volcanic aerosols), we emit 17 Mt of sulfur dioxide as in Stenchikov et al. (2021), except in one experiment, specifically marked and used to study sensitivity to SO2 emission mass. The perturbed simulations were calculated from 1 June 1991 to 31 December 1994 with a 1-year spin-up not included in the analysis.
Along with SO2, we consider co-injections of water vapor and ash. For ash, we adopt the same initial size distribution as in Niemeier et al. (2009) and Stenchikov et al. (2021). We redistribute the total emitted fine ash mass of 75 Mt (Guo et al., 2004b) between two insoluble modes: accumulation and coarse (Fig. 1). The accumulation mode comprises 1.5 Mt of ash, and the coarse mode comprises 73.5 Mt of ash. Despite its small mass, ash in the accumulation mode is important since it has a much longer lifetime than ash in the coarse mode. We use the standard EMAC IMPORT and OFFEMIS submodels to initialize the SO2, water vapor, and ash tracers (Kerkweg et al., 2006b). Section 1 in the Supplement explains the implementation of SO2, water vapor, and volcanic ash injection mechanisms in EMAC.
In the main set of experiments, we release volcanic products in the specified model grid box centered on the altitude of 17, 20, or 25 km at the geographical coordinates of Mt. Pinatubo (15.1429 ∘N, 120.3496 ∘E) with the precalculated emission rates (in ) during 24 h. We call it a one-grid-box emission scheme (see Table 3 for details). In the 1s1-17km, 1s1-20km, and 1s1-25km experiments, we assume that only SO2 is injected at 17, 20, and 25 km, respectively. In the 1w1-20km experiment we release SO2 and water vapor at 20 km. The va0 experiments employ the same settings as 1w1 but assume injection of 75 Mt of ash. The va0 experiments do not account for the chemical aging of ash. The va1 experiments are similar to va0 but account for ash aging. In experiment 3s10-25km we inject SO2 in the 3000 km wide latitude belt centered on the latitude of the eruption mimicking the setting in Brühl et al. (2015). The injected layer is 10 boxes thick (from 22.5 to 27.5km) and is centered on the altitude of 25 km. When this is not ambiguous, we refer to the clusters of experiments with the same physics using a generic name without specifying injection altitudes, such as 1s1, 1w1, va0, and va1. Experiments 1s1 are used to study the sensitivity to the height of the injection of volcanic SO2. The 1w1 experiments with 150 Mt and 15 Mt injected water allows us to quantify the sensitivity to the mass of injected water vapor. Experiments va0 and va1 are designed to quantify the effect of ash and ash aging. Experiment va1-20km-12Mt is designed to study the sensitivity to the amount of injected SO2.
To reduce the effect of internal model variability in each experiment, we calculate five ensemble members using different atmospheric initial conditions. The analysis in this study is performed and presented for the ensemble means. We show the “ensemble” variability for the selected variables.
First, we compare the model results with observations, focusing on spatial–temporal distributions of SO2, , and other related chemicals. We also test the simulated stratospheric AOD (SAOD), which defines volcanic radiative effect, and the stratospheric temperature response, which measures volcanic climate impact against available observations. In addition, we compare the surface area density (SAD) that controls heterogeneous chemistry within the volcanic cloud and aerosol effective radius (Reff), which characterizes aerosol size distribution (see Figs. 2–5). The spatially averaged Reff is calculated as a ratio of the third M3m and the second M2m moments of each aerosol mode m integrated over the entire domain (Eqs. 1 and 2). The effective radii for individual modes and for the entire aerosol size distribution are given by Eqs. (3) and (4), respectively.
where Nm is the number density for aerosol mode m, Rm is the median radius, and σm is the width of the aerosol mode m. Nmodes is the number of aerosol modes.
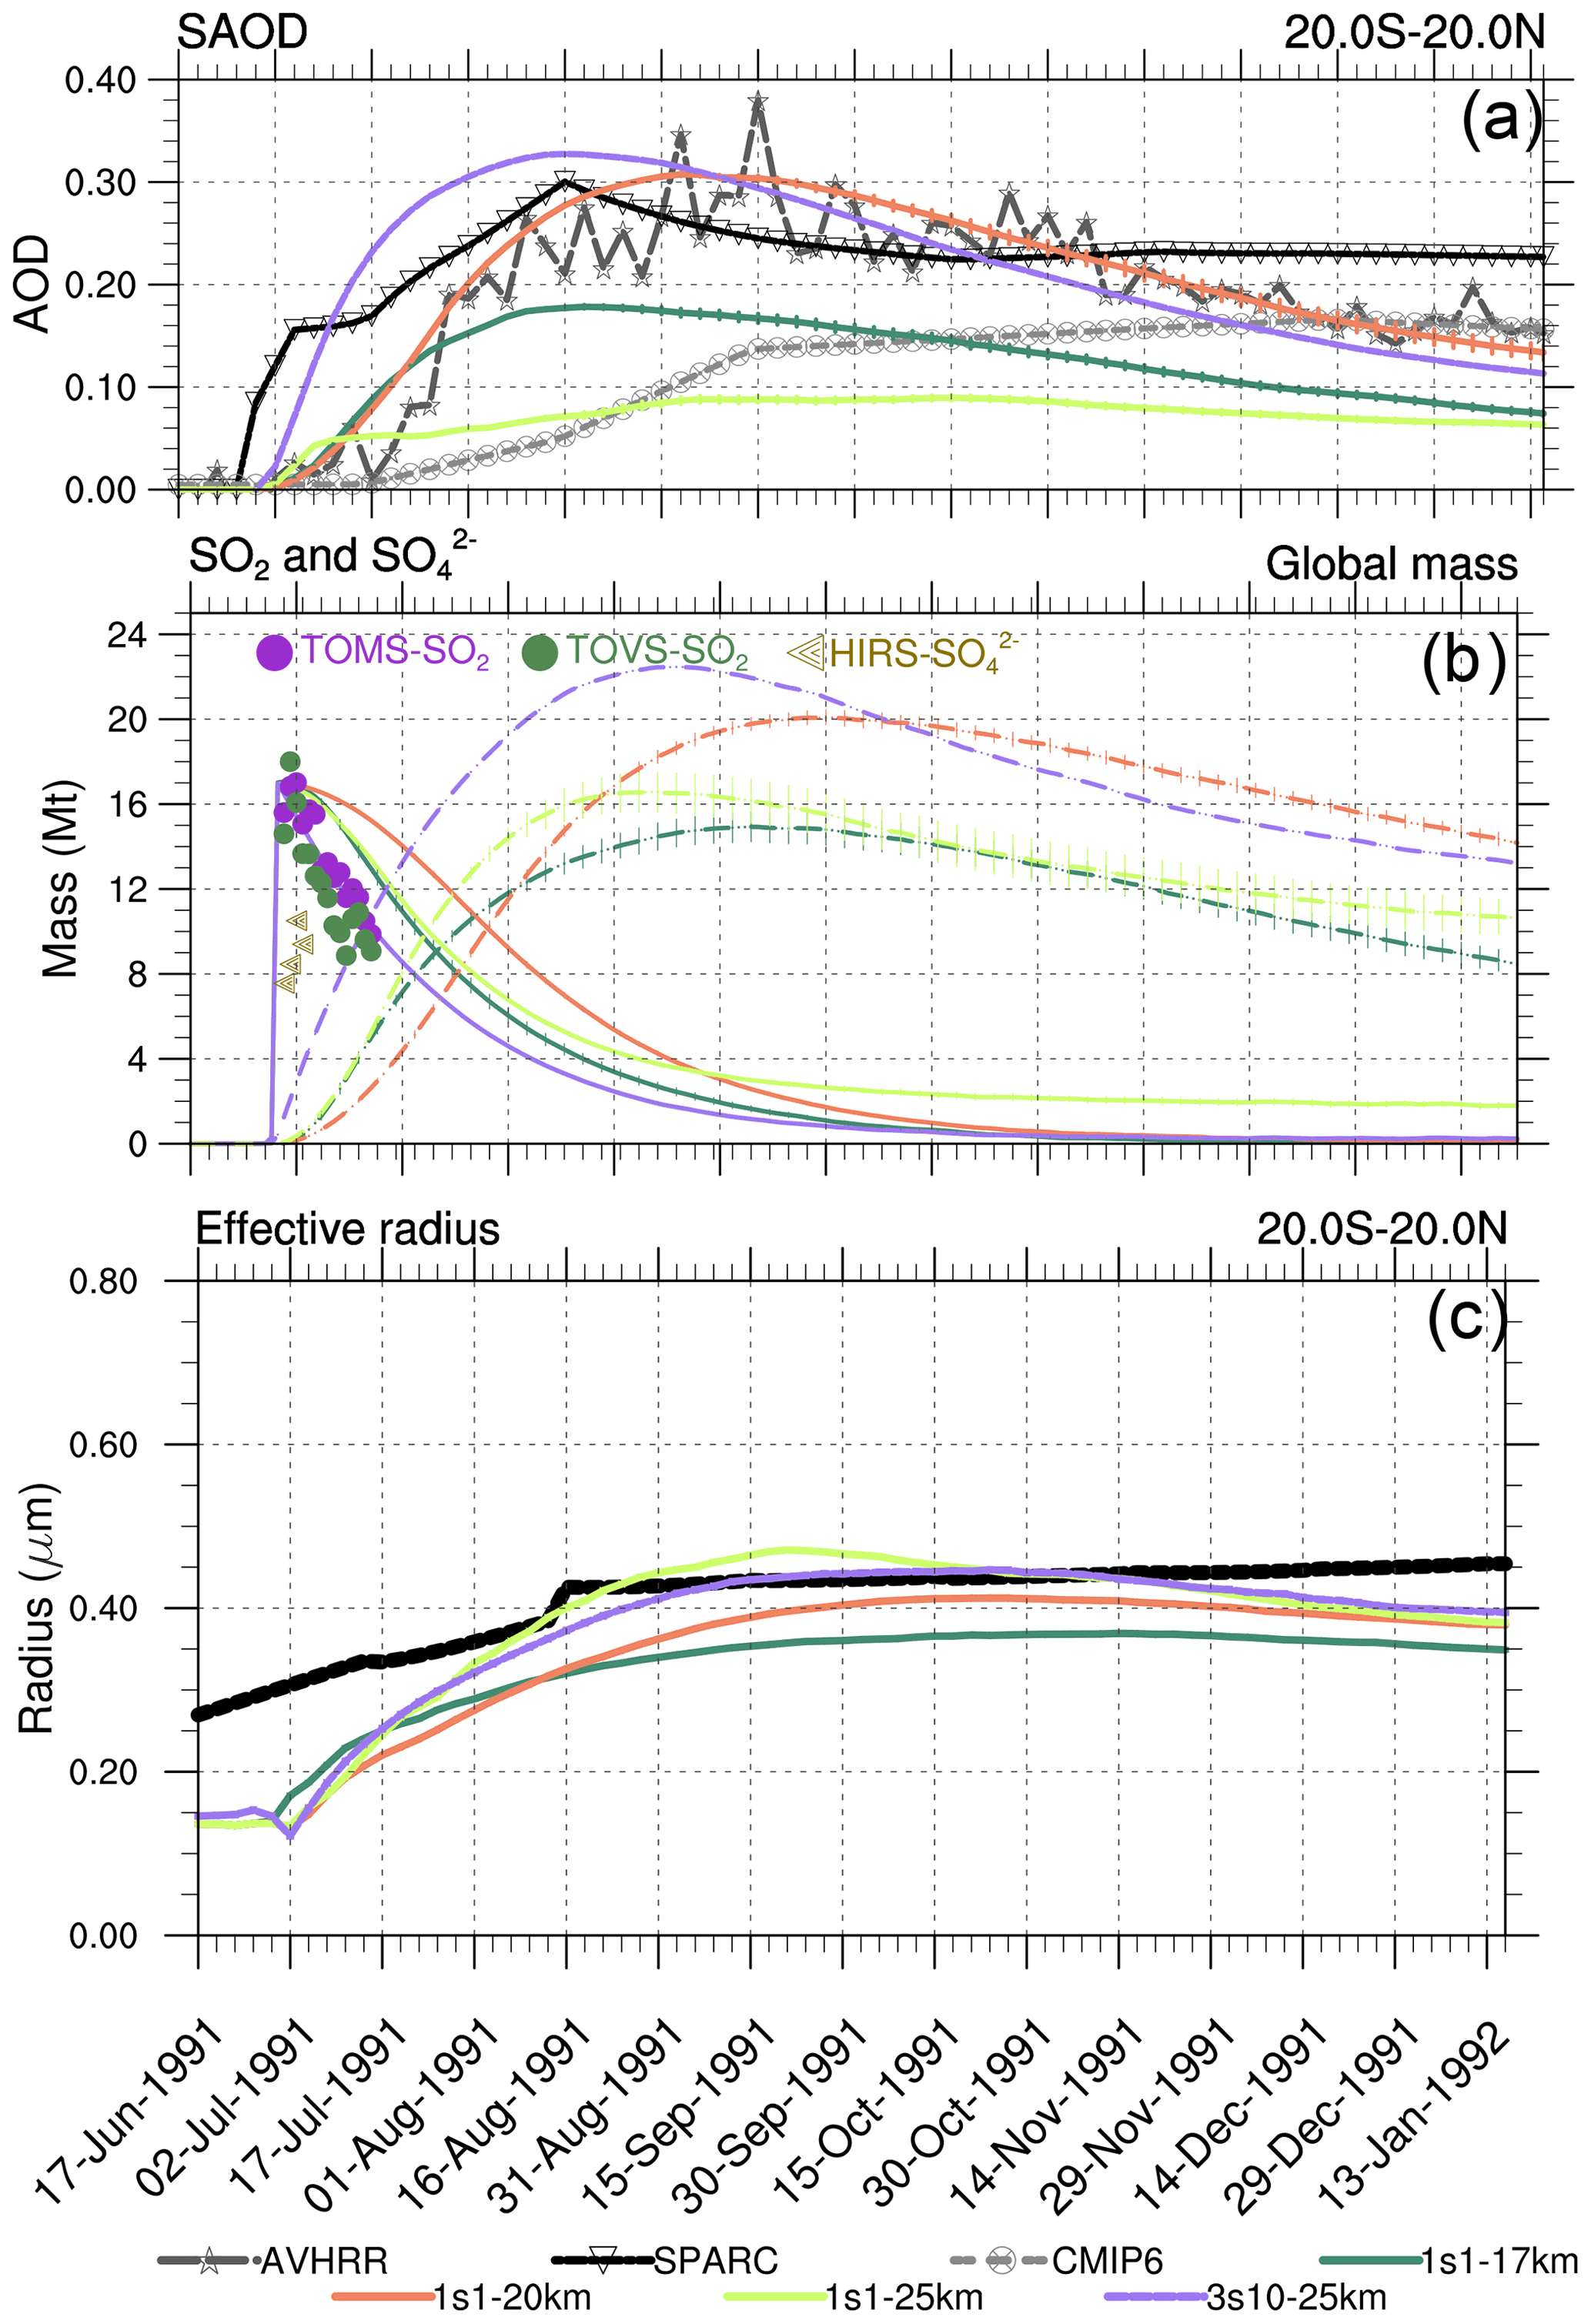
Figure 2(a) The 20∘ S–20∘ N equatorial average visible SAOD (0.55 µm) from the 1s1 experiment with the 17, 20, and 25 km emission heights, AVHRR 0.630 µm, scaled visible SAGE/ASAP, and 0.525 µm CMIP6. (b) SO2 (solid lines) and (dashed lines) globally integrated masses calculated using output from the 1s1 experiment with 17, 20, and 25 km emission heights; the observed Guo et al. (2004b) SO2 and masses are shown by markers. (c) Equatorial average effective radius from 1s1 experiment with 17, 20, and 25 km emission height, and SAGE/ASAP (“Stratospheric processes and their role in climate” published in the Assessment of Stratospheric Aerosol Properties) retrievals (solid black). Error bars represent 1σ from the ensemble mean.
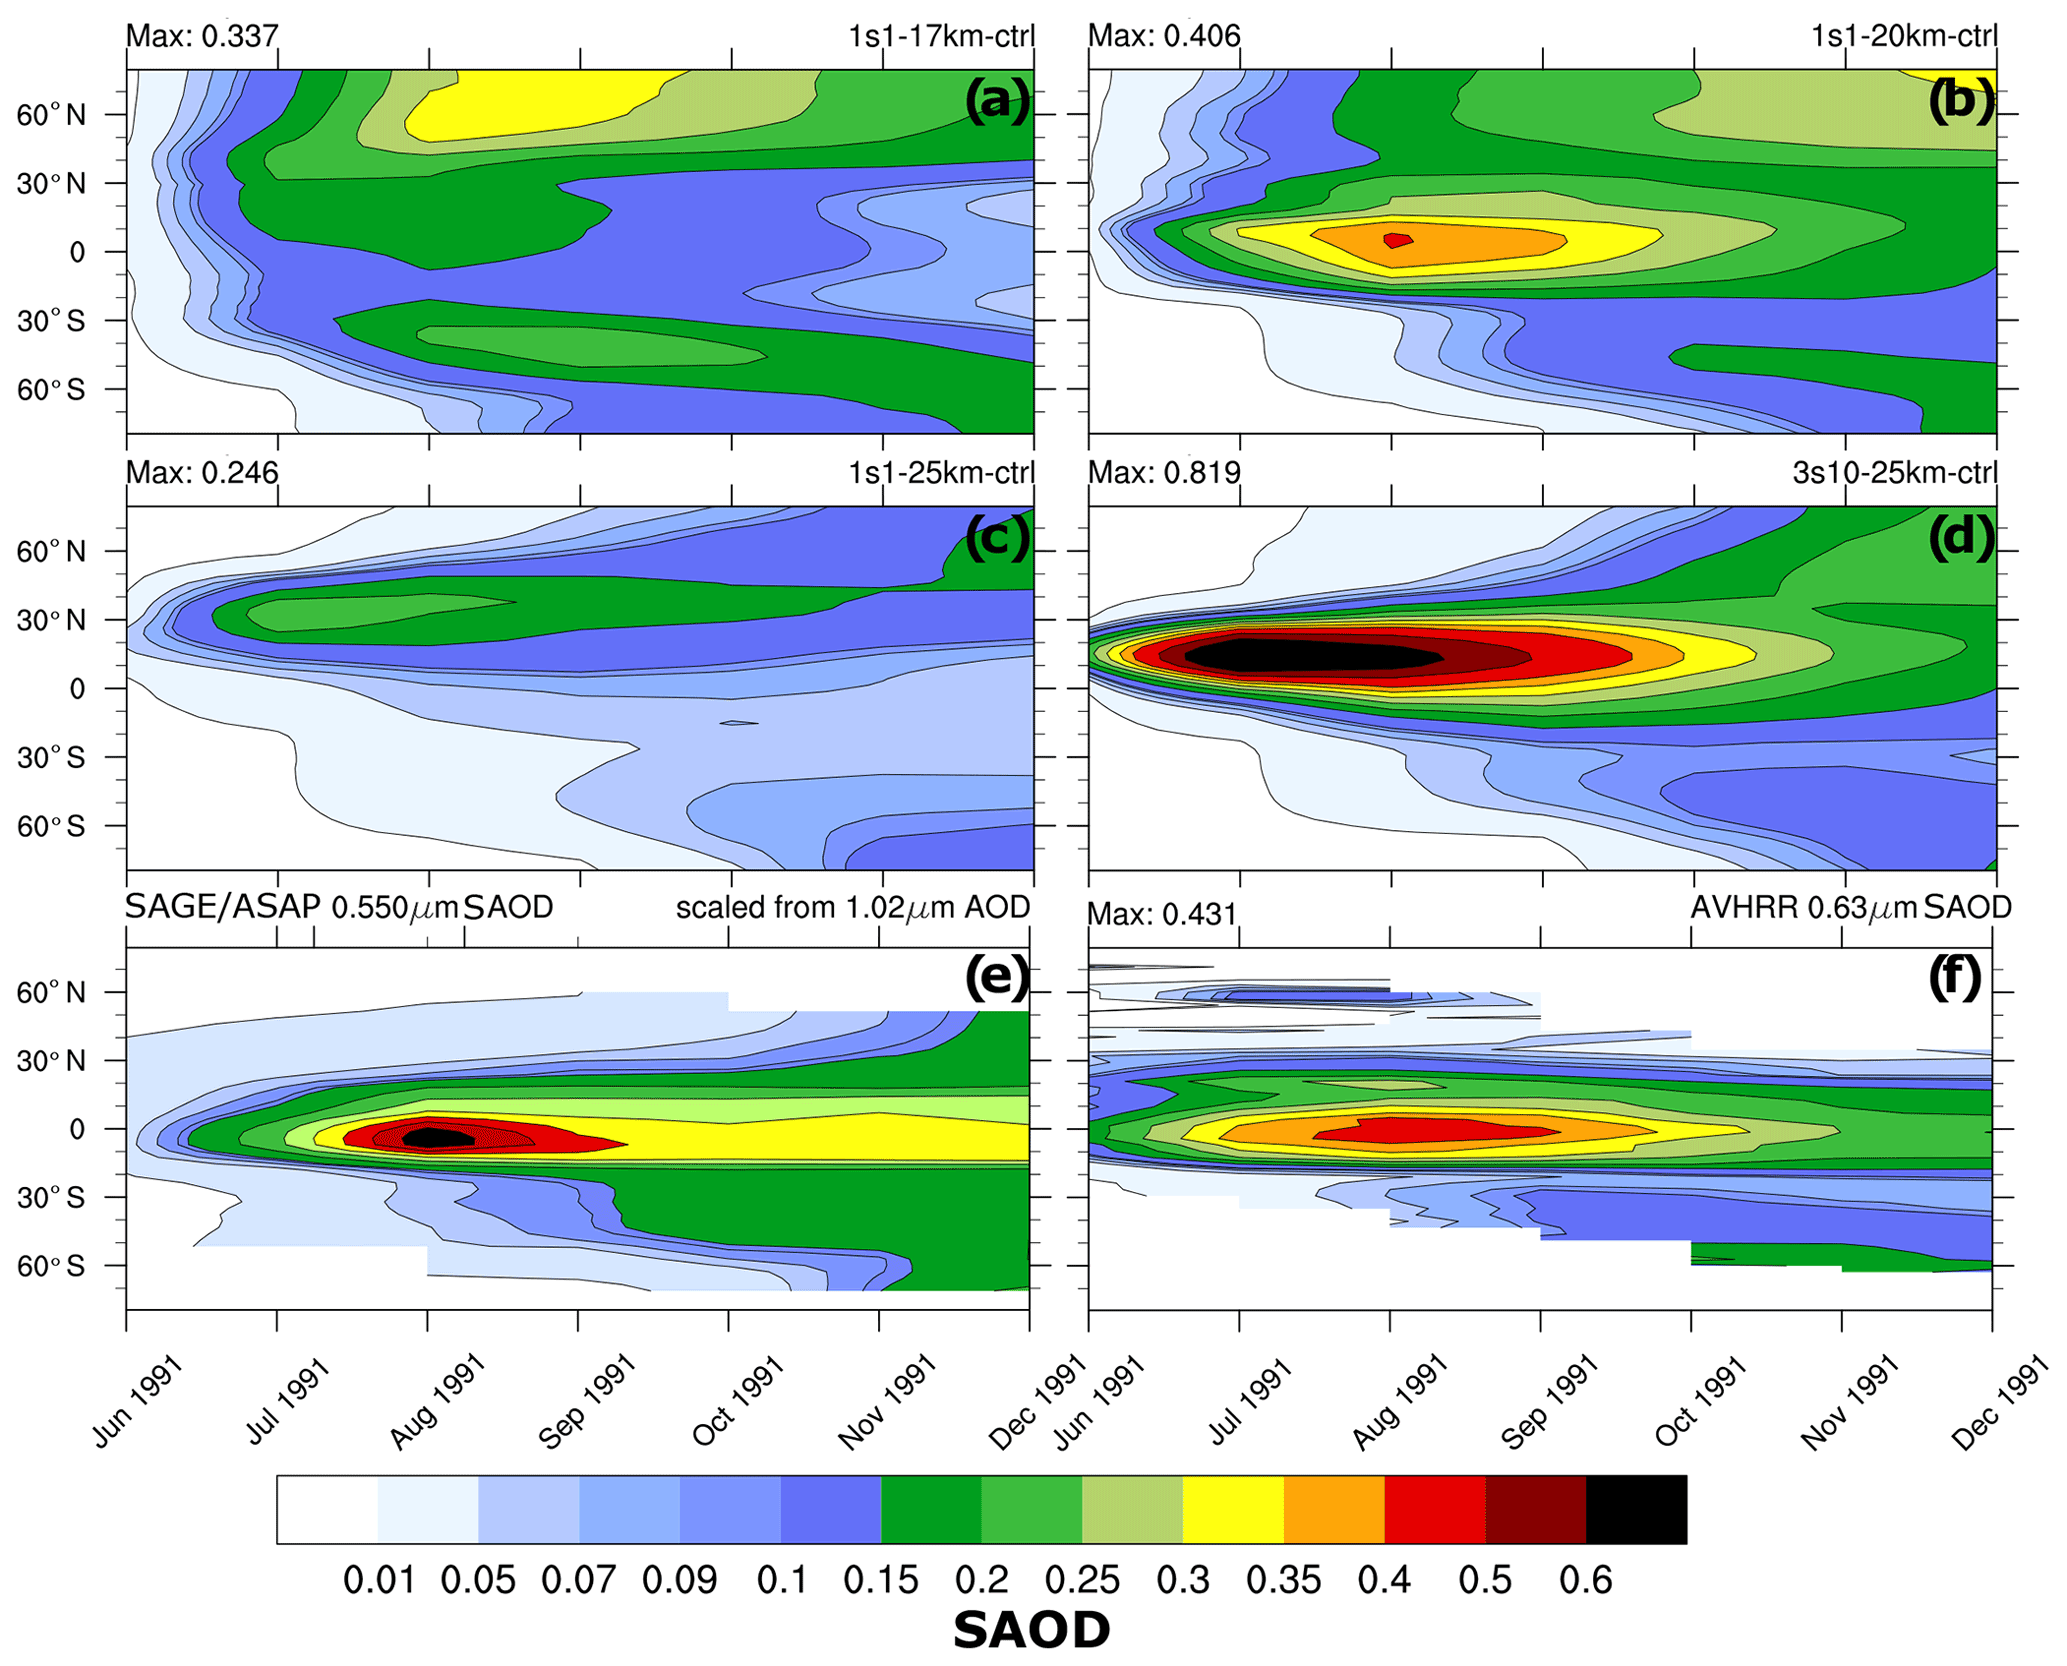
Figure 3Zonally average visible SAOD (0.55 µm) as a function of latitude and time: (a) 1s1-17km, (b) 1s1-20km, (c) 1s1-25km, (d) 3s10-25km, (e) scaled visible SAGE/ASAP, and (f) 0.630 µm AVHRR (Advanced Very High-Resolution Radiometer).
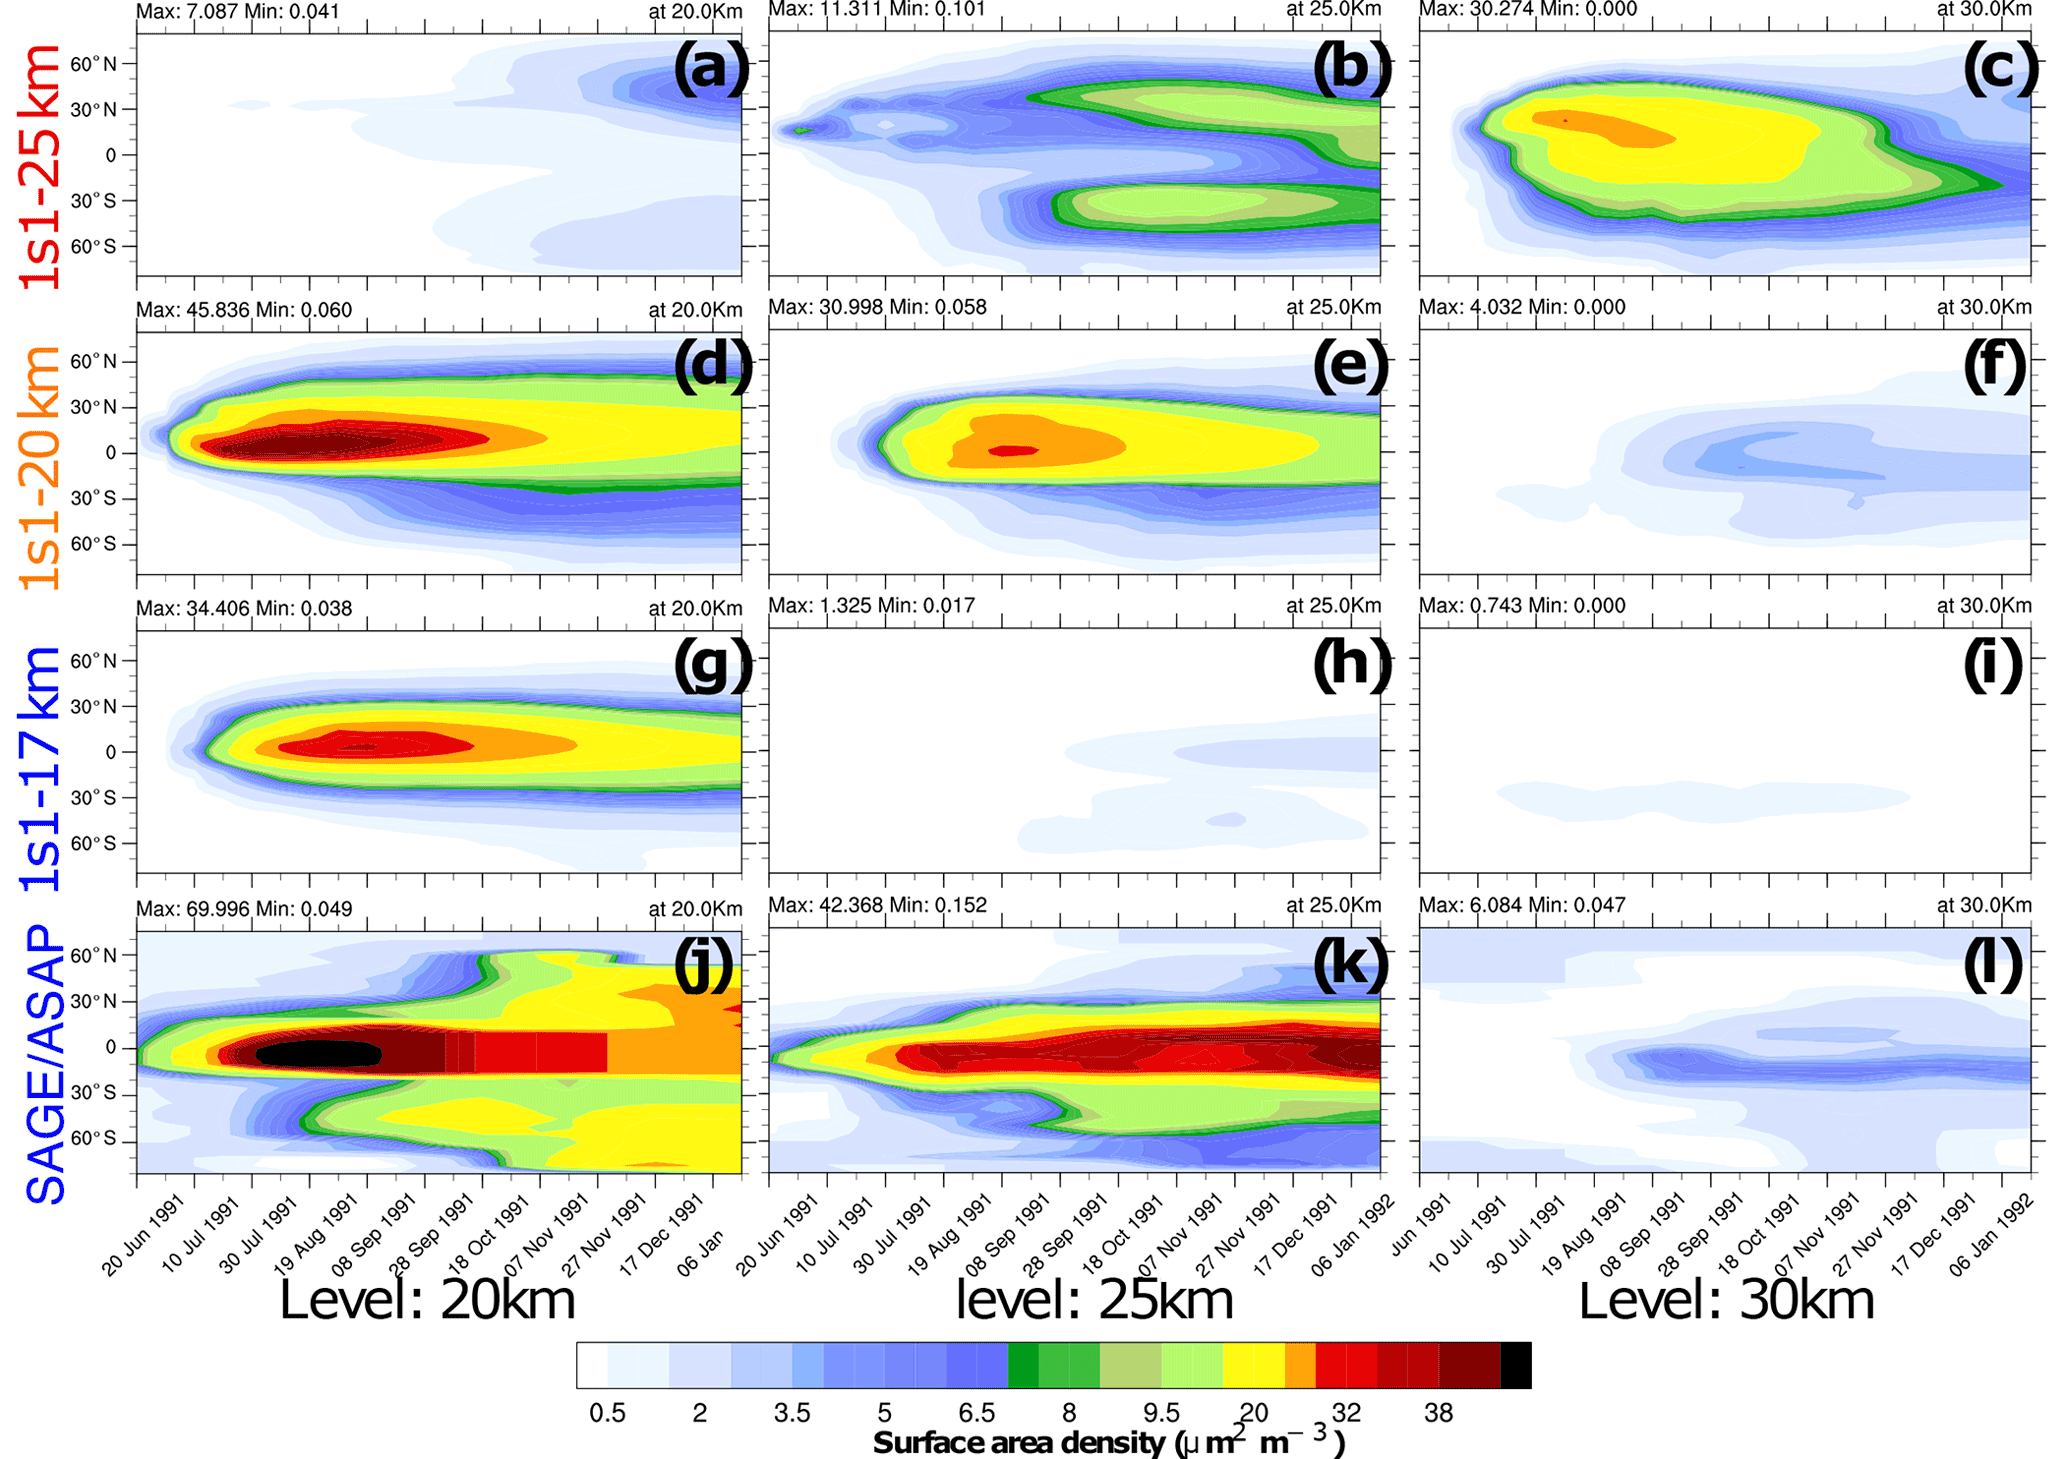
Figure 4Zonally average surface area density (SAD, ) as a function of latitude and time at 20 km (a, d ,g and j), 25 km (b, e, h and k), and 30 km (c, f, i and l). The experiments are as follows: (a–c) 1s1-25km, (d–f) 1s1-20km, (g–i) 1s1-17km, and observed (j–l) SAGE/ASAP.
Figures 2–4 compare various parameters in 3s10-25km and 1s1 experiments with the different injection heights with the AVHRR and SAGE/ASAP observations. The AVHRR zonal mean visible SAOD is largely consistent in spatial–temporal behavior with the scaled SAGE/ASAP SAOD (Fig. 3). The original SAGE/ASAP visible SAOD is almost half of the AVHRR SAOD because the SAGE II sensor was saturated during the first few weeks after the eruption. Therefore data at the initial stage of eruption are sparse. The AVHRR sensed the entire atmospheric column, including the troposphere, the effect of which could be estimated only approximately (Thomason, 1992; Russell et al., 1996; Kremser et al., 2016). The consistency between the scaled SAGE/ASAP and AVHRR visible SAODs lessens in the late fall of 1991 when scaled SAGE/ASAP SAOD begins overestimating AVHRR SAOD. Discrepancies between different data sets are discussed in Bingen et al. (2004). Despite sparse observations at the initial stage of volcanic cloud development, SAGE/ASAP is the only global satellite observation that recorded the vertical structure of the Pinatubo cloud. For example, Fig. 4 demonstrates aerosol SAD at different altitudes as reported by SAGE/ASAP and simulated in the model.
Below we study the sensitivity of volcanic cloud evolution to all the main factors: injection height, amount of injected water, injection of ash, and ash aging. We start from sensitivity to injection height using the simplest 1s1 experiments with SO2 only injections. The cloud height is essential because it defines the wind field that drives the dispersion of volcanic debris. The O3 and water vapor mixing ratios, which affect chemical reactions and aerosol microphysics within the plume, are also height dependent.
5.1 Sensitivity to injection height
Figure 2a–c compare the observed and simulated SAOD, SO2 and masses and Reff in the 1s1 experiments with different injection heights. The altitudes where volcanic debris resides depend not only on the initial injection height but on upward stratospheric motion and lofting driven by radiative heating of volcanic debris (Stenchikov, 2021; Niemeier et al., 2009; Kinnison et al., 1994; Aquila et al., 2012). The latter process and the rate of chemical transformations within a volcanic cloud are sensitive to the initial concentrations of optically and chemically active materials within a fresh volcanic cloud, i.e., in terms of our simulation settings, to the volume that a cloud initially occupies.
Experiment 3s10-25km assumes a zonally uniform SO2 release at 25 km altitude within a latitude belt centered on the latitude of the eruption (15.1429∘ N). In experiment 1s1-25km, we release SO2 centered on the same height as in the 3s10-25km experiment but within one model grid box at the geographic coordinates of the Pinatubo eruption (15.1429∘ N, 120.3496∘ E). This causes initially higher SO2 concentrations compared to the 3s10-25km experiment. The eruptive materials are released with a constant mass emission rate and spread for more than 1000 km during the 24 h of emission. Despite SO2 having been released at the same altitude, these two experiments exhibit remarkable differences in the globally averaged SAODs (see Fig. 2a), masses (Fig. 2b), and spatial distributions of SAOD and SAD (Figs. 3 and 4). To understand the mechanism of the strong sensitivity of the volcanic cloud evolution to its initial stage, we test the 3s10-25km experiment and the one-grid-cell 1s1 experiments with the 17, 20, and 25 km injection heights against observations.
5.1.1 SAOD
Contrary to the 1s1-25km experiment, the visible tropical SAOD in experiment 1s1-20km compares well with SAOD from the scaled SAGE/ASAP and AVHRR observations (Fig. 2a). The visible SAOD from the Sixth Coupled Model Intercomparison Project (CMIP6) (Eyring et al., 2016; Zanchettin et al., 2016) mimics the original visible SAGE/ASAP SAOD, develops slowly, and is half of the scaled SAGE/ASAP and AVHRR.
The equatorial average (20∘ S–20∘ N) SAOD in 1s1-17km is half the size of the 1s1-20km and 3s10-25km SAODs. The 1s1-25km SAOD is even smaller (Fig. 2a). All SAODs except that in the 1s1-25km experiment are bigger than the CMIP6 SAOD. The SAOD in the 3s10-25m experiment grows faster than the SAOD in the 1s1 experiments, reaching 0.33 in August 1991. At a given chemical composition of sulfate aerosol particles, the transient SAOD depends both on the mass, i.e., the rate of oxidation of SO2 to , and on aerosol size distribution, i.e., Reff. The smaller sulfate aerosol particles have a bigger collective cross-section per unit mass than larger ones. So a bigger mass of large sulfate particles might have a smaller SAOD than a smaller mass of smaller sulfate particles. This must be considered when evaluating the mass of and the sulfate aerosol SAOD in observations and model experiments.
5.1.2 Oxidation of SO2
Figure 2b shows the globally integrated SO2 and masses in the 3s10-25km and 1s1 experiments with the different emission heights as functions of time. The SO2 mass in the 1s1-20km experiment decreases more slowly than in all other experiments. The mass in the 3s10-25km grows faster than in the other experiments in Fig. 2b. This is because the SO2 oxidation rate depends on the abundance of OH radicals. The OH production depends on O3 concentration and incoming UV radiation. Because in the 3s10-25km experiment, SO2 is distributed zonally over the entire latitude belt, its concentration in a volcanic cloud is lower than in all one-grid-box injection experiments. Hence, the SO2 oxidation is more efficient in the 3s10-25km experiment than in the 1s1 runs because initially, there are more OH radicals available per SO2 molecule in the latitude belt than in the one grid box. All 1s1 experiments underestimate mass in the first few days in comparison with the available observations (Fig. 2b). The presence of in a fresh volcanic plume detected in observations is puzzling as the models do not account for the physical mechanisms that could produce it in such a short time. To explain this discrepancy, Guo et al. (2004a) suggested that 1–2 Mt of was injected at the initial stage of the eruption. However, we do not account for the initial release in this study.
5.1.3 Spatial–temporal evolution of SAOD and SAD
The spatial–temporal patterns of visible SAOD in the 1s1-20km experiment compare well with AVHRR and scaled SAGE/ASAP observations (Fig. 3). However, the poleward aerosol transport in the model is too fast. This is a known deficiency of global models, which simulate too transparent subtropical barriers due to coarse spatial resolution (Oman et al., 2006). The 1s1-25km visible SAOD is smaller than the scaled SAGE/ASAP and AVHRR SAODs and exhibits a qualitatively incorrect evolution of the volcanic cloud, which moves too far north, similar to that reported by Stenchikov et al. (2021) for volcanic injection at 24 km altitude. The 3s10-25km SAOD has a realistic spatial–temporal structure but substantially overestimates observed SAODs. SAOD in the 1s1-17km experiment (Fig. 3) exhibits faster poleward transport than in the 1s1-20km run due to more vigorous wave activity at lower altitudes in the stratosphere. In this experiment, the equatorial aerosol reservoir dissipates too quickly because of its proximity to the tropopause and intensive poleward transport.
Figure 4 compares the SAD in the 1s1-17km, 1s1-20km, and 1s1-25km experiments with the SAGE/ASAP observations (Thomason et al., 1997). SAD facilitates heterogeneous reactions in the volcanic cloud. Both sulfate aerosols and volcanic ash contribute to SAD, but in 1s1 experiments, we only account for sulfate aerosol surfaces. Therefore, the simulated SAD is expected to be smaller than the observed one, especially at the very beginning after the eruption. Only the 1s1-20km experiment shows SAD distributions consistent with observations at all three levels: 20, 25, and 30 km. In the 1s1-17km experiment the model underestimates SAD at 25 and 30 km. In the 1s1-25km experiment, the volcanic cloud climbs unrealistically high to 30 km and above. At that height, sulfate droplets tend to evaporate. The sulfuric acid photolyzes back to SO2, which reaches the mesosphere (Rinsland et al., 1995).
5.1.4 Aerosol size distribution
Figure 2c compares Reff from SAGE/ASAP averaged over the tropical belt, the 3S10-25km, and the 1s1 experiments with the 17, 20, and 25 km injection heights. In the control case, the model Reff = 0.14 µm is lower than the observed unperturbed value of 0.17–0.19 µm (Russell et al., 1993), as the model underestimates the effect of anthropogenic sulfur emissions on the stratospheric Junge layer (Marandino et al., 2013; Brühl et al., 2015).
SAGE-II observations suggest that aerosol extinction increases, and its maximum shifts from 0.385 to 0.525 µm soon after the Pinatubo eruption, indicating the sudden increase in sizes of aerosol particles (Thomason, 1992; Thomason and Peter, 2006; Kremser et al., 2016). The observed effective radius increases from the background level to about 0.5 µm in 6 months (Russell et al., 1996).
In Fig. 2c, Reff in the 1s1-20km experiment increases gradually, reaching maximum Reff = 0.4 µm in September of 1991, and then decreases due to the settling of larger particles. In the 1s1-25km experiment, Reff is the largest among all experiments. Reff in this experiment initially grows faster than in all other runs, reaching maximum Reff = 0.45 µm in August of 1991, and then decreases, merging with all other experiments in December of 1991. In the 1s1-17km experiment, Reff is the smallest compared to other experiments, as it loses SO2 mass through the tropopause. When testing our simulated Reff against observations, we have to mention that the SAGE/ASAP Reff is quite uncertain (Ansmann et al., 1997).
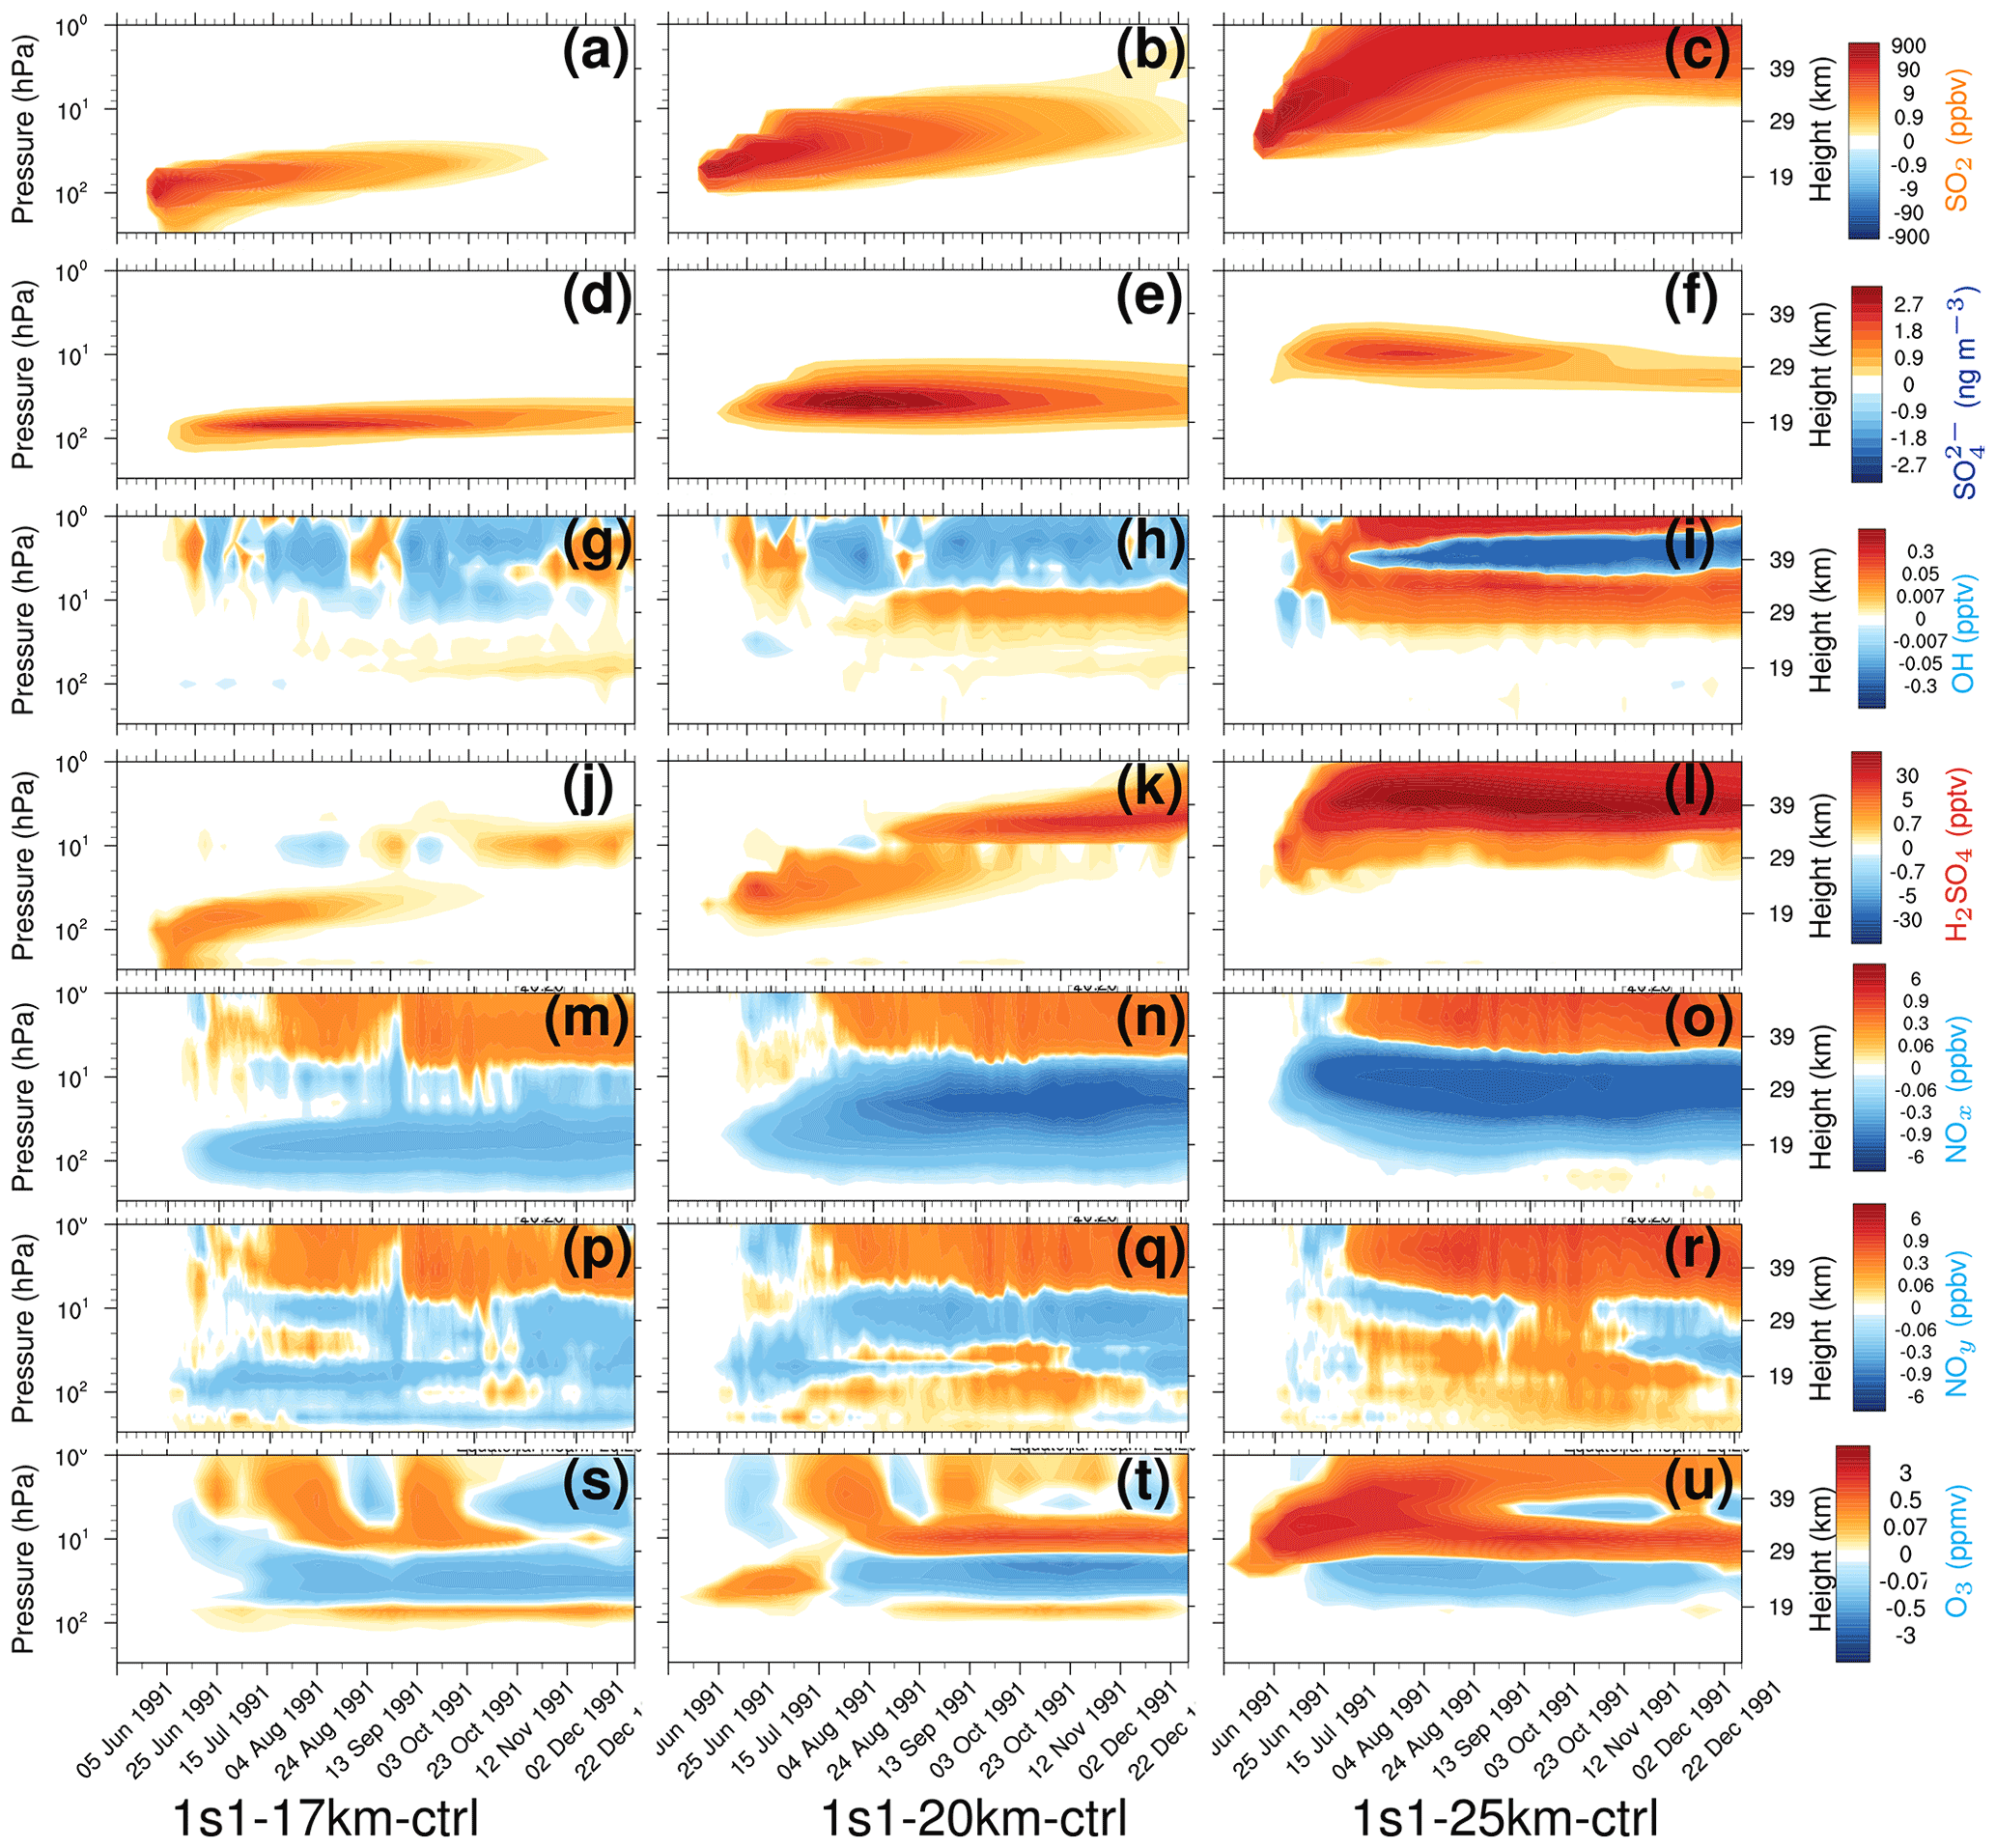
Figure 5Perturbations (with respect to control) of 20∘ S–20∘ N equatorial average chemical constituents as a function of pressure (from 300 to 1 hPa) and time in 1s1-17km (a, d, g, j, m, p, and s), 1s1-20km (b, e, h, k, n, q, and t), and 1s1-25km (c, f, i, l, o, r, and u). (a–c) SO2 (ppbv); (d–f) (ng m−3); (g–i) OH (pptv); (j–l) H2SO4 (pptv); (m–o) NOx (ppbv); (p–r) NOy (ppbv), NOx = (NO + NO2), NOy = (NOx + NO3 + HNO3 + 2 × N2O5 + HONO + HNO4 + ClONO2 + BrONO2); (s–u) O3 (ppmv).
5.1.5 Impact on chemical composition
Figure 5 shows vertical cross-sections of the mixing ratios or concentrations of SO2, , OH, H2SO4, NOx, NOy, O3 in the 1s1 experiments with the 17, 20, and 25 km injection heights averaged over the equatorial belt (20∘ S–20∘ N). We do not account for the SO2 radiative effect (Stenchikov, 2021), and there is no ash injection in these experiments. Therefore, only sulfate aerosols cause heating and lofting of the volcanic cloud. Before a significant amount of develops, lifting is caused by regional upward motion in the Brewer–Dobson (B–D) circulation, which EMAC captures. The SO2 and clouds separate due to gravitational settling of sulfate aerosols (Fig. 5a–f). This initiates multi-layer distributions of all other tracers. Stratospheric vertical uplift is getting stronger at higher altitudes (at least in EMAC). This is seen well in the 1s1-25km run in comparison with the 1s1-17km and 1s1-20km runs (see Fig. 5a–c).
The volcanic cloud in the 1s1-25km experiment rises to 30 km, significantly higher than in all other experiments. The SO2 oxidation rate slows down as the temperature rises. Therefore, the mass is smaller than in the other experiments. In addition, in the 1s1-25km experiment, Reff is higher than in other experiments. This factor tends to lower the SAOD since larger particles in the 1s1-25km experiment are less optically efficient per unit mass and have a lower lifetime with respect to gravitational settling. Therefore, SAOD and SAD in this experiment are smaller than in the other experiments in Figs. 2 and 4, respectively.
The experiments with different emission heights generate different SAOD (Fig. 2) and SAD (Fig. 4). This partially results from different SO2 oxidation rates defined by the abundance of OH radicals at different altitudes. Three weeks after the eruption, OH is reduced around the injection height because of stratospheric water consumption by the oxidation of SO2 in all three experiments in Fig. 5g–i. OH remains depleted above the cloud, where the SO2 mixing ratio is high. The change in OH is generally the largest in the 1s1-25km experiment. The increase in H2SO4 is more pronounced in the 1s1-25km experiment (Fig. 5j–l). Initially, the H2SO4 increases at the emission level. This is seen until November of 1991. Then a secondary plume of H2SO4 is formed at a higher altitude, above 29 km. Oxidation of volcanic SO2 in the stratosphere also perturbs the Chapman cycle and reduces the ozone mixing ratio in the stratosphere (Fig. 5s–u).
We account for 12 heterogeneous reactions. Heterogeneous reactions on aerosols explain the re-partitioning between NOx and the reactive nitrogen reservoir NOy. Following Danilin et al. (1999), we evaluate the effect of heterogeneous chemistry by the abundance of NOx (NO + NO2) and total inorganic nitrogen, NOy (NOx + NO3 + HNO3 + 2 × N2O5 + HONO + HNO4 + ClONO2 + BrONO2). In addition, the heterogeneous chemistry might be influenced by the halogen reactions by chlorine and bromine activation. However, we do not account for the volcanic halogen injections in this study; therefore, their impact might be minor. Here, the main pathway in this transformation is the oxidation of NOx to form N2O5, which interacts with water vapor to form HNO3. N2O5 can also interact with halogens on the surface of aerosols (sulfate or ash). The heterogeneous reaction of N2O5 and water on the surface of aerosols effectively depletes NO2 from the active reaction system depending on SAD (Fig. 4). During the daytime, HNO3 can photo-dissolve and form OH, interacting with NOx to form N2O5 and then HNO3, while at nighttime, the formation of HNO3 is one-way via oxidation of NOx and N2O5. N2O5 can decompose back to NO3 and NO2 either photochemically or thermally, depending on the overhead column of ozone. As altitude increases, temperature increases, and the production rate of HNO3 increases. The limiting factors in the heterogeneous formation of HNO3 are that of NO2, O3 column, and SAD (Seinfeld and Pandis, 2006).
Figure 5m–r show the strong dependence of NOx and NOy on injection height within the aerosol cloud. The NOx mixing ratio decreases, and the NOy mixing ratio increases, along with the increase in the injection height. The changes in NOx and NOy affect the ozone cycle (Seinfeld and Pandis, 2006). The dependence of the background ozone concentrations on altitude adds to the sensitivity of the cloud evolution to injection height. Furthermore, the modified ozone concentration (Fig. 5s–u) feeds back to the OH production and hence the SO2 oxidation rate. For the 1s1-17km experiment, the depletion of NOx (Fig. 5m) is lower than for the 25 km injection (Fig. 5 o), while the production of NOy at the 25 km (Fig. 5r) injection is higher than for the 17 km experiment (Fig. 5 p). At a higher altitude, the ozone concentration and SAD (Fig. 4c) is higher, and hence the formation of HNO3 is higher for the 1s1-25km experiment (see Fig. S9 in the Supplement). Although the change in NOy for 1s1 experiments at 17, 20, and 25 km injection is insignificant (see Fig. S9b in the Supplement), the heterogeneous transformation from N2O5 to HNO3 is efficient. The transformation is enhanced (Fig. S9b–d in the Supplement) by the injection of ash particles due to the additional SAD and heating by ash and the associated stronger lofting of the volcanic plume.
Along with the chemical processes, the interaction of volcanic debris with the tropopause and the stratopause adds to the sensitivity of the mass to the height of the injection. In the 17 km injection height experiment, the cloud loses part of the mass through the tropopause, but in the 25 km injection height experiment, part of the sulfur is transported to the mesosphere and gets lost for immediate sulfate formation. It descends to the stratosphere again in high latitudes in winter. The volcanic debris injected at 20 km stabilizes in the middle of the stratosphere. Hence, in this case, the volcanic cloud is less affected by interaction with the tropopause and stratopause.
5.2 Water vapor intrusion
As expected, warming the tropical tropopause layer by radiative heating of volcanic debris facilitates the cross-tropopause troposphere-to-stratosphere transport of water vapor (Oltmans and Hofmann, 1995; Nedoluha et al., 1998; Joshi and Jones, 2009). The presence of extra water vapor in the stratosphere intensifies OH production and accelerates SO2 oxidation (LeGrande et al., 2016).
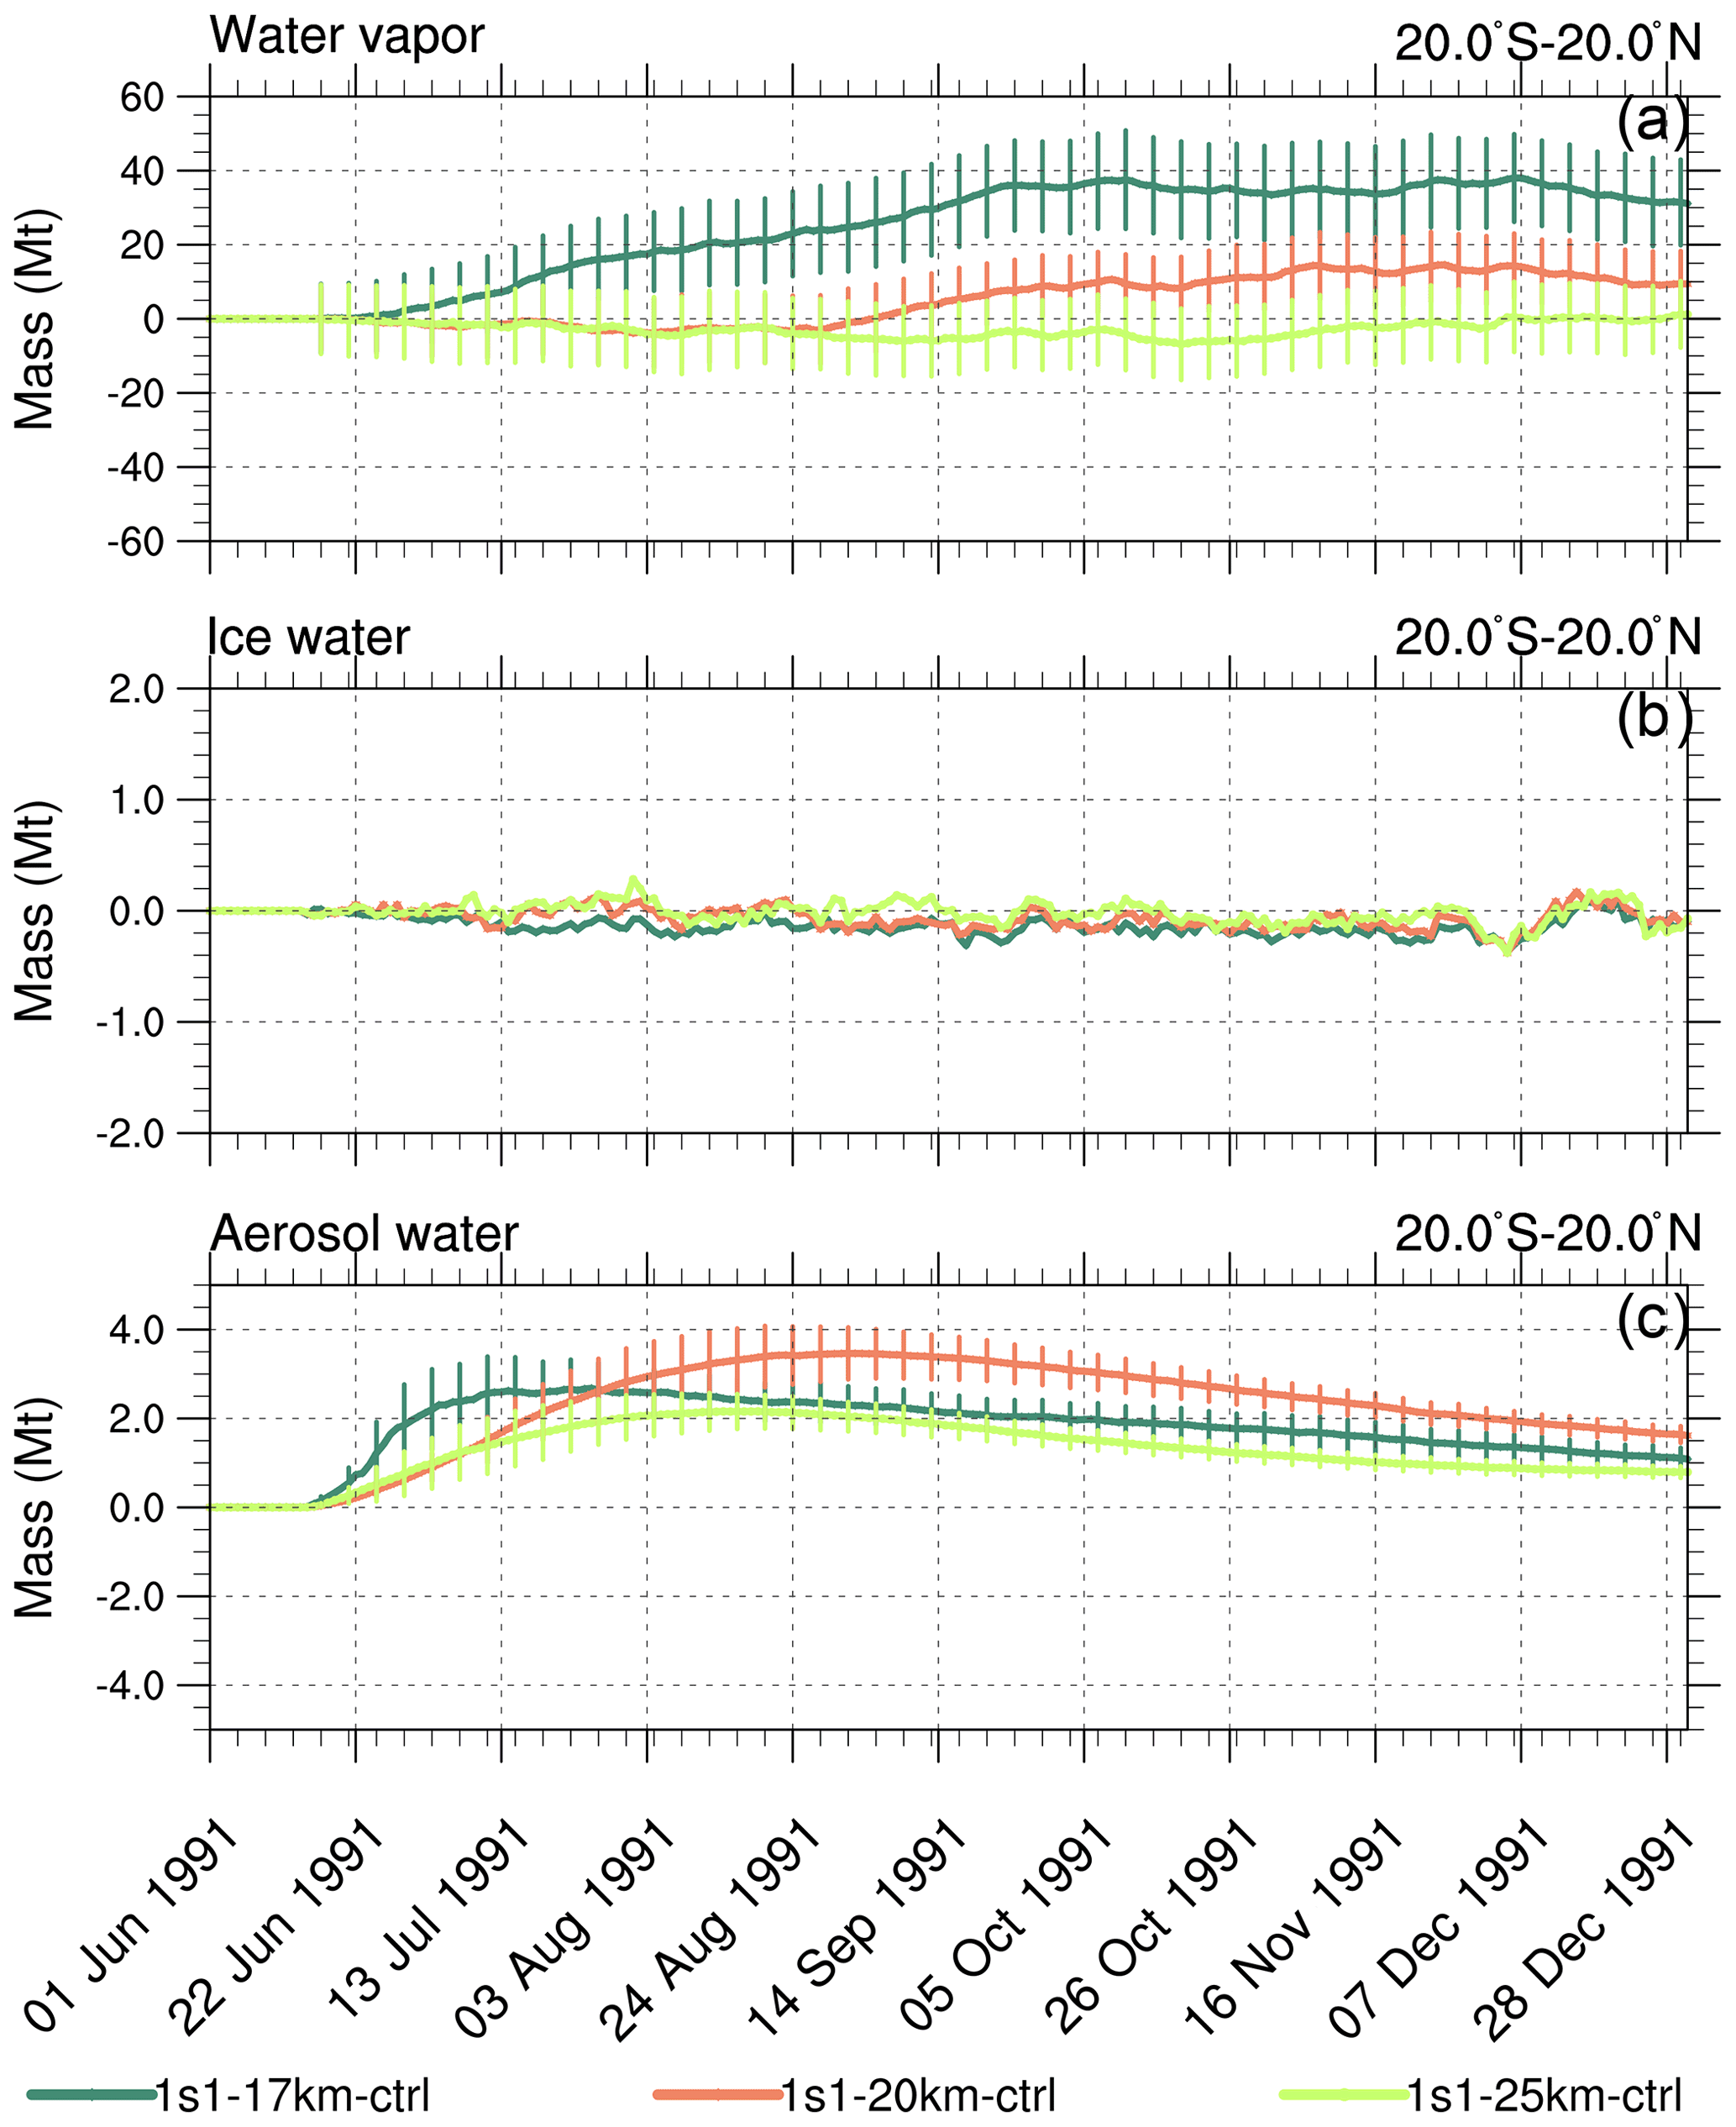
Figure 6Perturbations (with respect to control) of 20∘ S–20∘ N stratospheric (above 100 hPa) integrated masses (Mt) in the 1s1 experiments with injection heights 17, 20, and 25 km, as a function of time. (a) Water vapor; (b) ice; (c) aerosol water. Error bars represent 1σ from the ensemble mean.
For the 1s1-17km experiment, the stratospheric (i.e., above 100 hPa) water vapor mass integrated over the tropical belt increases by about 30 Mt (Fig. 6a). However, an increase in water vapor just above the tropopause does not affect volcanic cloud evolution much because the bulk of this water vapor is well below the altitude where the core of the volcanic cloud resides. Cross-tropopause water transport decreases as injection height increases. For example, the 1s1-25km experiment shows no cross-tropopause water transport. Three weeks after the injection, the aerosol water associated with sulfate aerosols in the 1s1-17km experiment (Fig. 6c) is higher than in other experiments because, in the 1s1-17km experiment, the volcanic cloud is closer to the tropopause than in the other experiments. In the 1s1-20km run, the mass of continues increasing during August and September 1991 (Fig. 2b), and the associated aerosol water also increases to 3.5 Mt as shown in Fig. 6c. Little ice is accumulated in the stratosphere in all experiments (Fig. 6b) since it is quickly removed by gravitational sedimentation. In the 1s1-20km experiment liquid water mass peaks at 3 Mt, in the 1s1-17km at 2 Mt, and in 1s1-25km at 1 Mt (Fig. 6d).
5.3 Volcanic water injection
Water vapor injected into the stratosphere with a volcanic plume could directly affect the initial evolution of a volcanic cloud since it is concentrated within it. Most of this water is brought by the entrainment of tropospheric water in an explosive jet or co-ignimbrite convective updrafts; nevertheless, the term volcanic water is used here. A wide range (75–150 Mt) of volcanic water vapor injection for the Pinatubo eruption was reported (Joshi and Jones, 2009; Nedoluha et al., 1998). However, the amount of volcanic water retained in the stratosphere depends on the injection height. Almost all water vapor injected at a low temperature just above the tropopause forms ice and quickly sediments (Stenchikov et al., 2021). A larger fraction of water vapor injected at higher altitudes, with higher stratospheric temperatures, could remain in the stratosphere. To test the sensitivity of volcanic clouds to the amount of volcanic water, we conduct the 1w1 simulations injecting simultaneously SO2 and different amounts of water vapor.
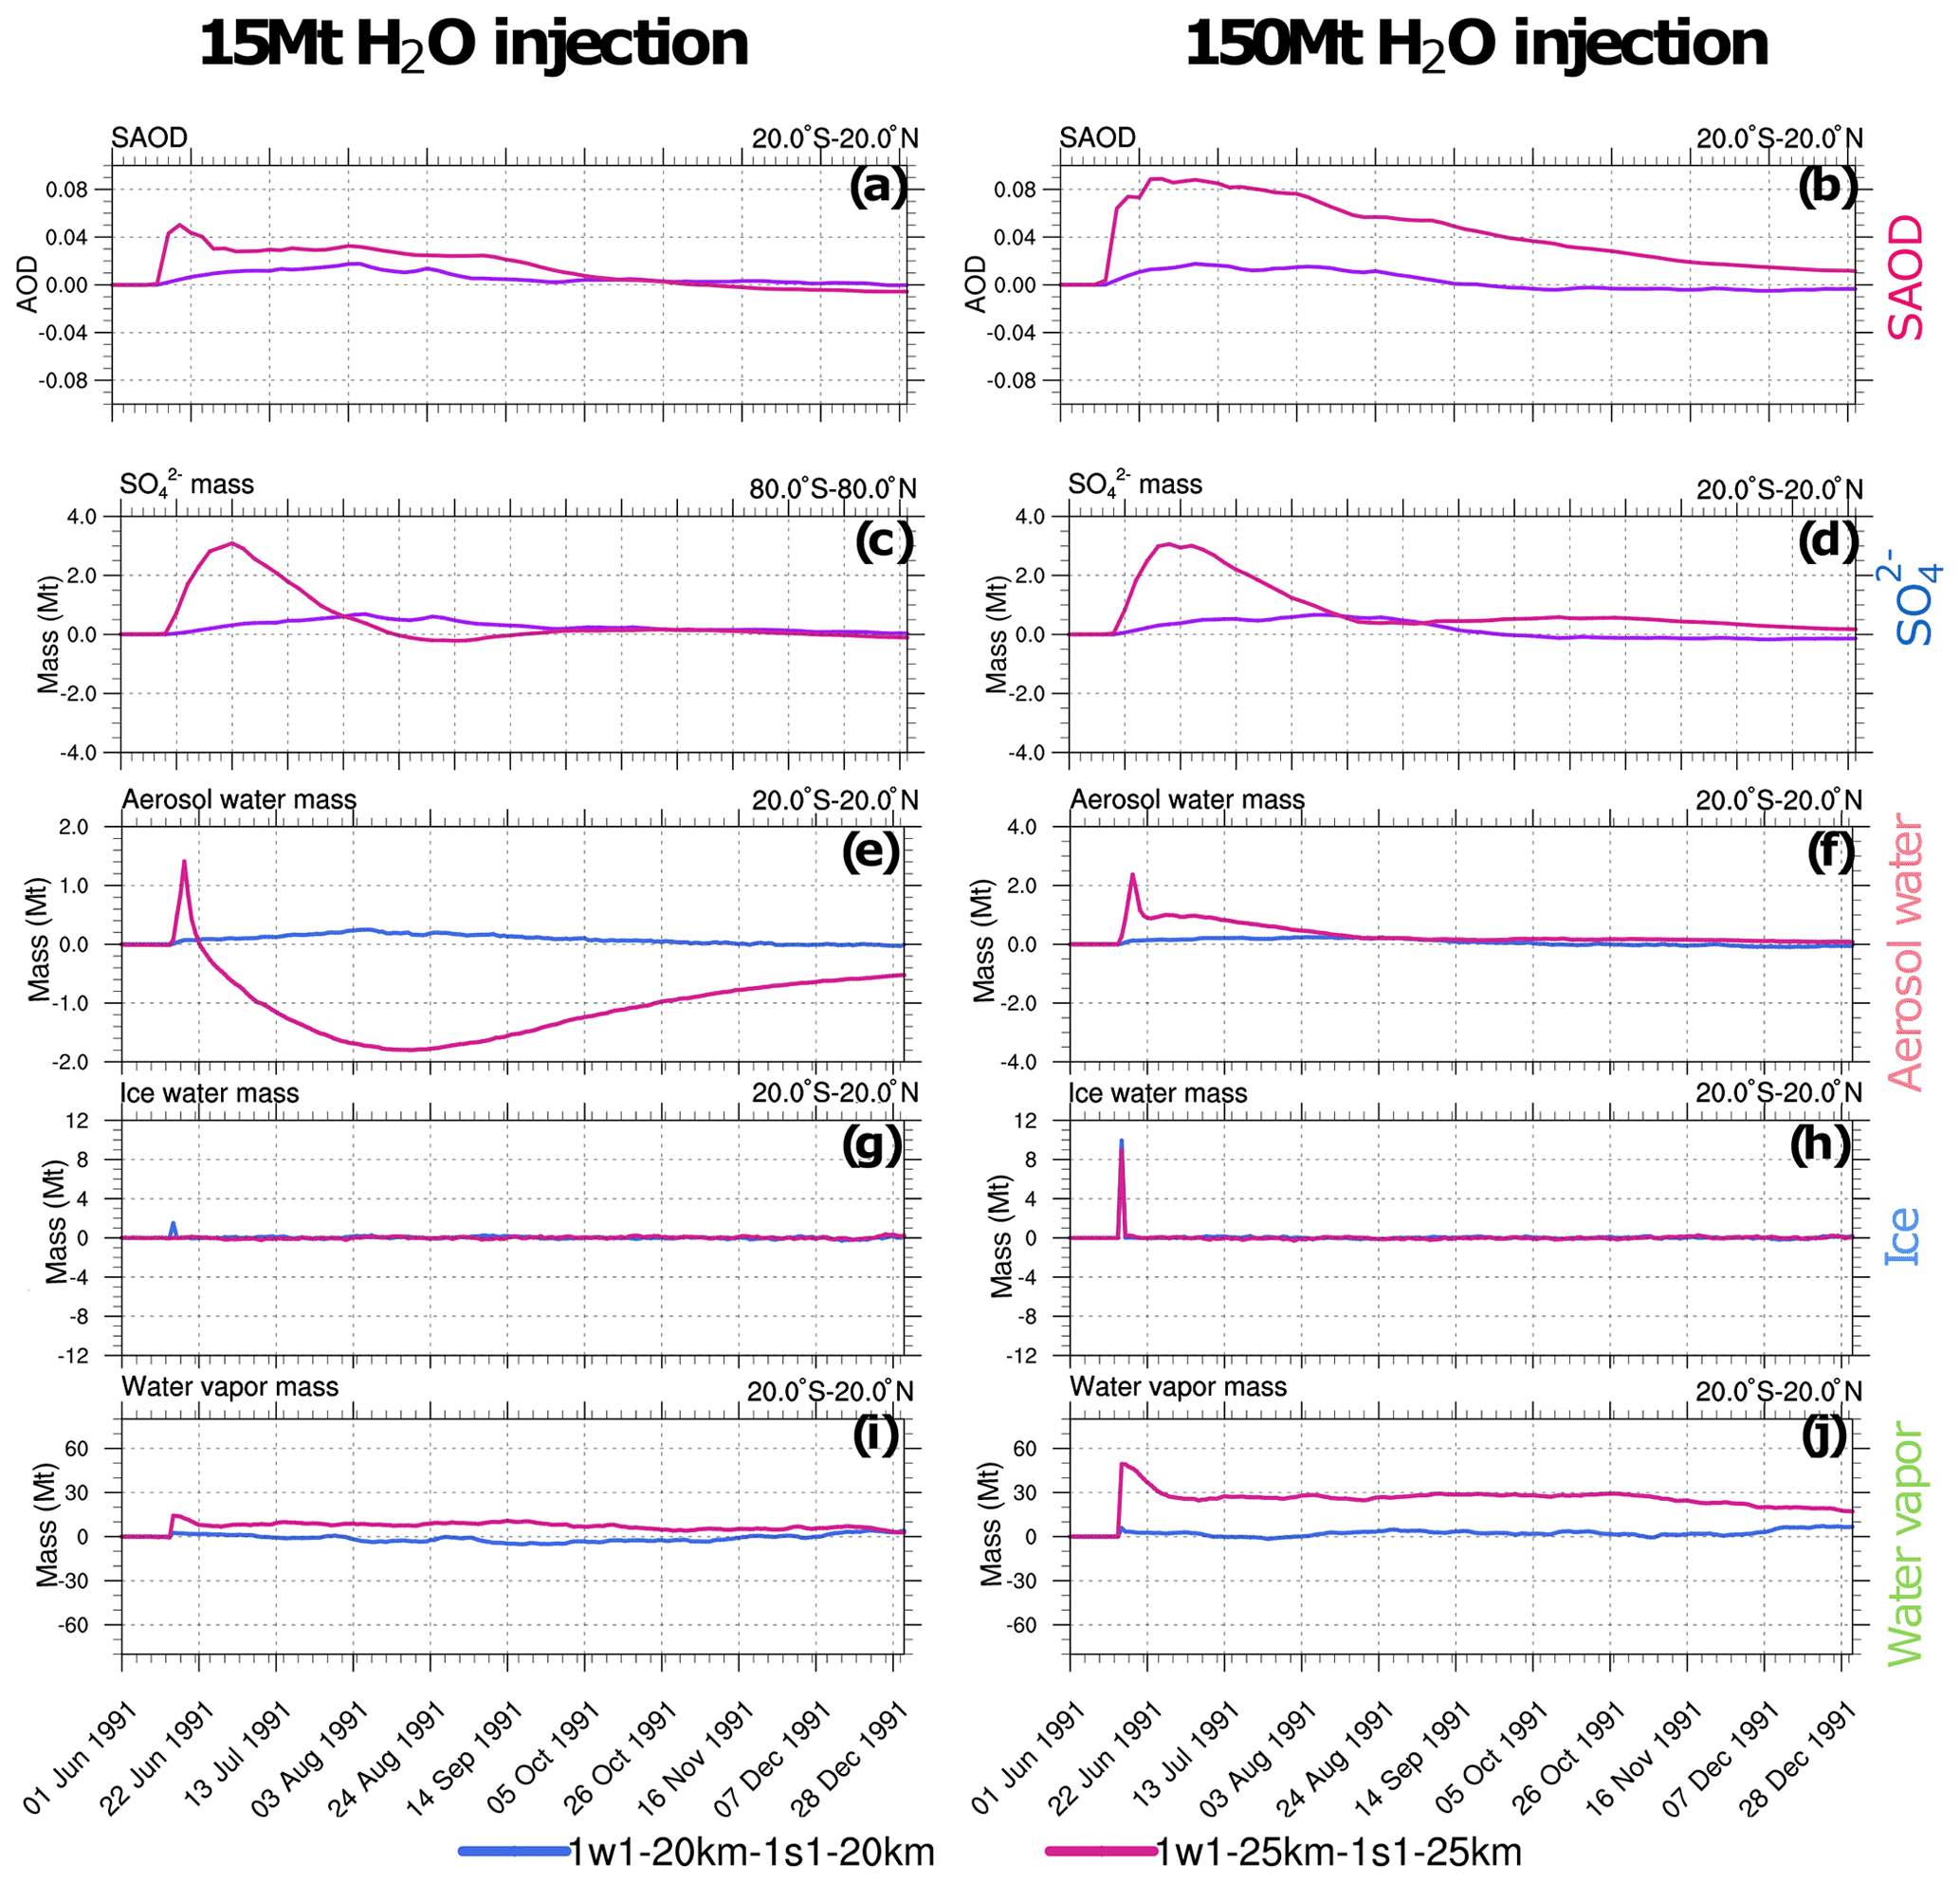
Figure 7Perturbations (with respect to control) of 20∘ S–20∘ N stratospheric (above 100 hPa) SAOD and integrated masses (Mt) in the 1w1-20km and 1w1-25km experiments with respect to, correspondingly, 1s1-20km and 1s1-25km experiments as a function of time. Left column (a, c, e, g and i): 1w1 experiments with 15 Mt of volcanic water vapor injection. Right column (b, d, f, h and j): 1w1 experiments with 150 Mt water vapor injection. (a, b) SAOD; (c, d) ; (e, f) aerosol water; (g, h) ice; (i, j) water vapor.
Figure 7 compares the time series of the equatorial SAODs and changes in the globally integrated masses of sulfate and water species in the stratosphere (above 100 hPa) in the 1w1 experiments, with the simultaneous injection of SO2 and 15 or 150 Mt of volcanic water vapor at 20 and 25 km with the corresponding 1s1 experiments (see Table 3). Water species comprise water vapor, ice, and aerosol water. The aerosol water accumulates in sulfate and ash particles.
The effect of volcanic water on the generation of the mass and SAOD depends on the amount of water vapor retained in the stratosphere after the eruption. The sensitivity of SAOD and mass to the injected volcanic water vapor is higher in the 1w1-25km experiment compared to the 1s1-20km experiment (Fig. 7c and d). The increase in sulfate mass results from the acceleration of SO2 oxidation facilitated by the higher water vapor concentration (Seinfeld and Pandis, 2006). The sensitivity to the amount of water vapor in the experiments with the 20 km injection altitude is weaker than in the experiments with the 25 km injection height because most of the water vapor injected at 20 km condenses and deposits from the stratosphere since the temperature at 20 km is lower than at 25 km (Fig. 7i).
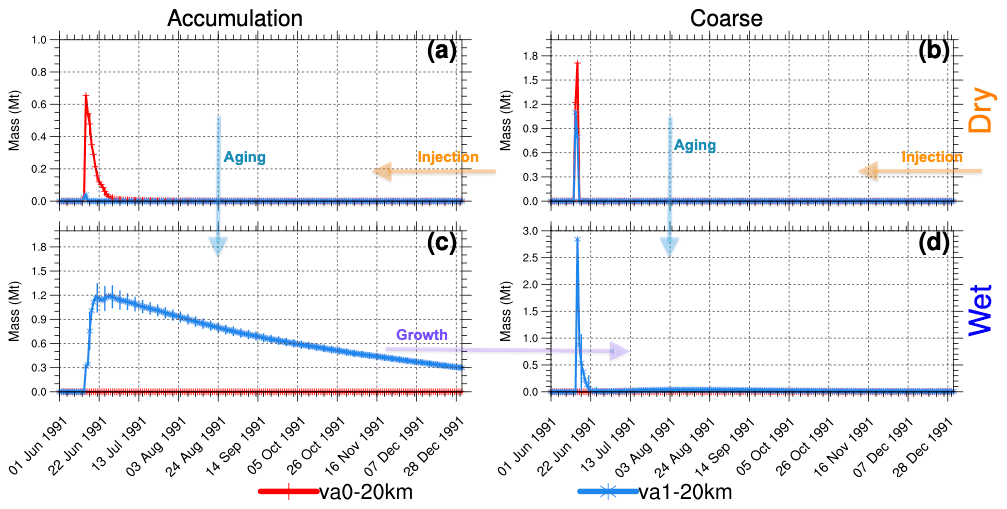
Figure 8Globally integrated stratospheric volcanic ash mass (Mt) above 70 hPa as a function of time in the va0-20km and va1-20km experiments. (a) Dry accumulation mode. (b) Dry coarse mode. (c) Wet accumulation mode. (d) Wet coarse mode. Error bars represent 1σ from the ensemble mean.
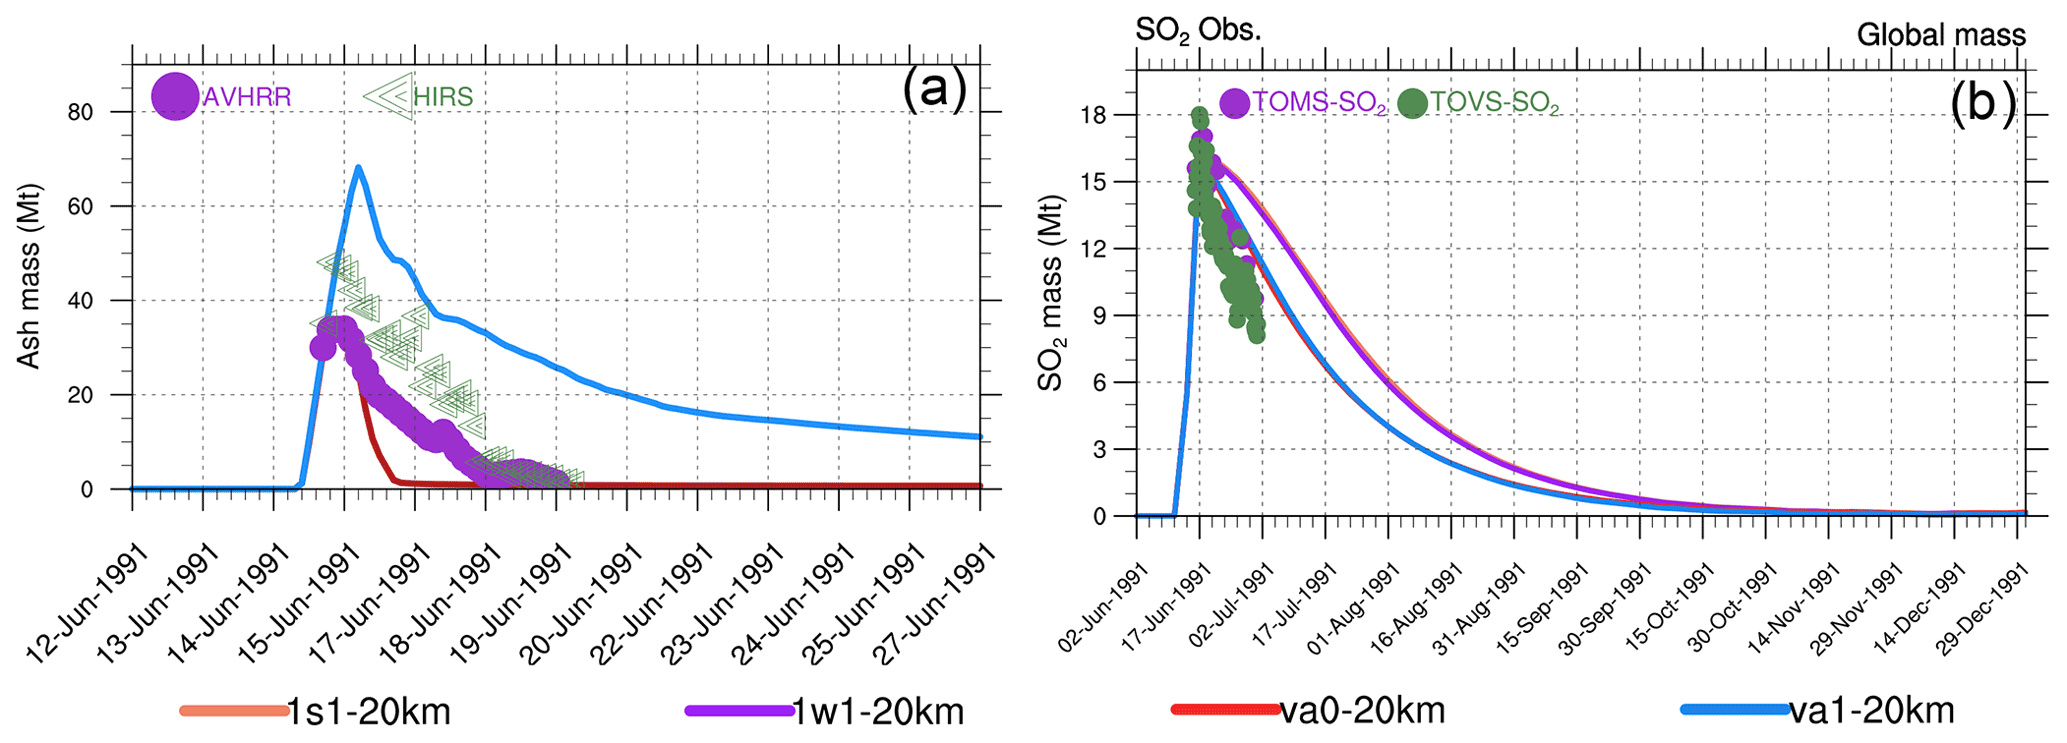
Figure 9Globally integrated stratospheric masses (Mt) as a function of time. (a) Volcanic ash in va0-20km, va1-20km as well as in AVHRR, and HIRS (High-Resolution Infrared Radiation Sounder) retrievals (Guo et al., 2004b). (b) SO2 in the 1s1-20km, 1w1-20km, va0-20km, and va1-20km experiments as well as in TOMS (Total Ozone Mapping Spectrometer) and TOVS (TIROS Operational Vertical Sounder) observations.
5.4 Volcanic ash injection
In the va0 and va1 experiments, we inject 75 Mt of ash together with SO2 and water vapor. The va1 experiment accounts for ash aging, but the va0 does not. In both experiments, we assume that volcanic ash is initially hydrophobic. Therefore, we inject it into the insoluble (dry) accumulation and coarse modes (Figs. 1 and 8). In the va1 experiments, volcanic ash ages quickly, populating the soluble (wet) modes (Fig. 8c and d), while ash particles in the va0 experiments remain in the dry modes (accumulation and coarse). In the va1 experiments, ash particles increase in size due to the aging and associated water and uptake, which tends to transfer particles from the accumulation to the coarse mode.
In the va0 experiments, ash in the coarse mode (see Fig. 8b) sediments from the stratosphere for 2 d, but ash particles in the accumulation mode remain in the stratosphere for 1 week (Fig. 8a). In the va1 experiments, the ash mass in the wet modes increases quickly due to dry-to-wet particle conversion shown by the arrow in Fig. 8. The aging of ash particles slows the decrease in ash mass in both accumulation and coarse modes.
In the experiments with a 25 km injection height, it takes longer for ash to reach the tropopause and leave the stratosphere than in the experiments with the 20 km injection height. For instance, after the first day of injection, 60 Mt of insoluble coarse ash remains in the stratosphere (not shown) for the va0 experiment with 25 km injection height compared to 1.7 Mt when ash is injected at 20 km (see Fig. 8b).
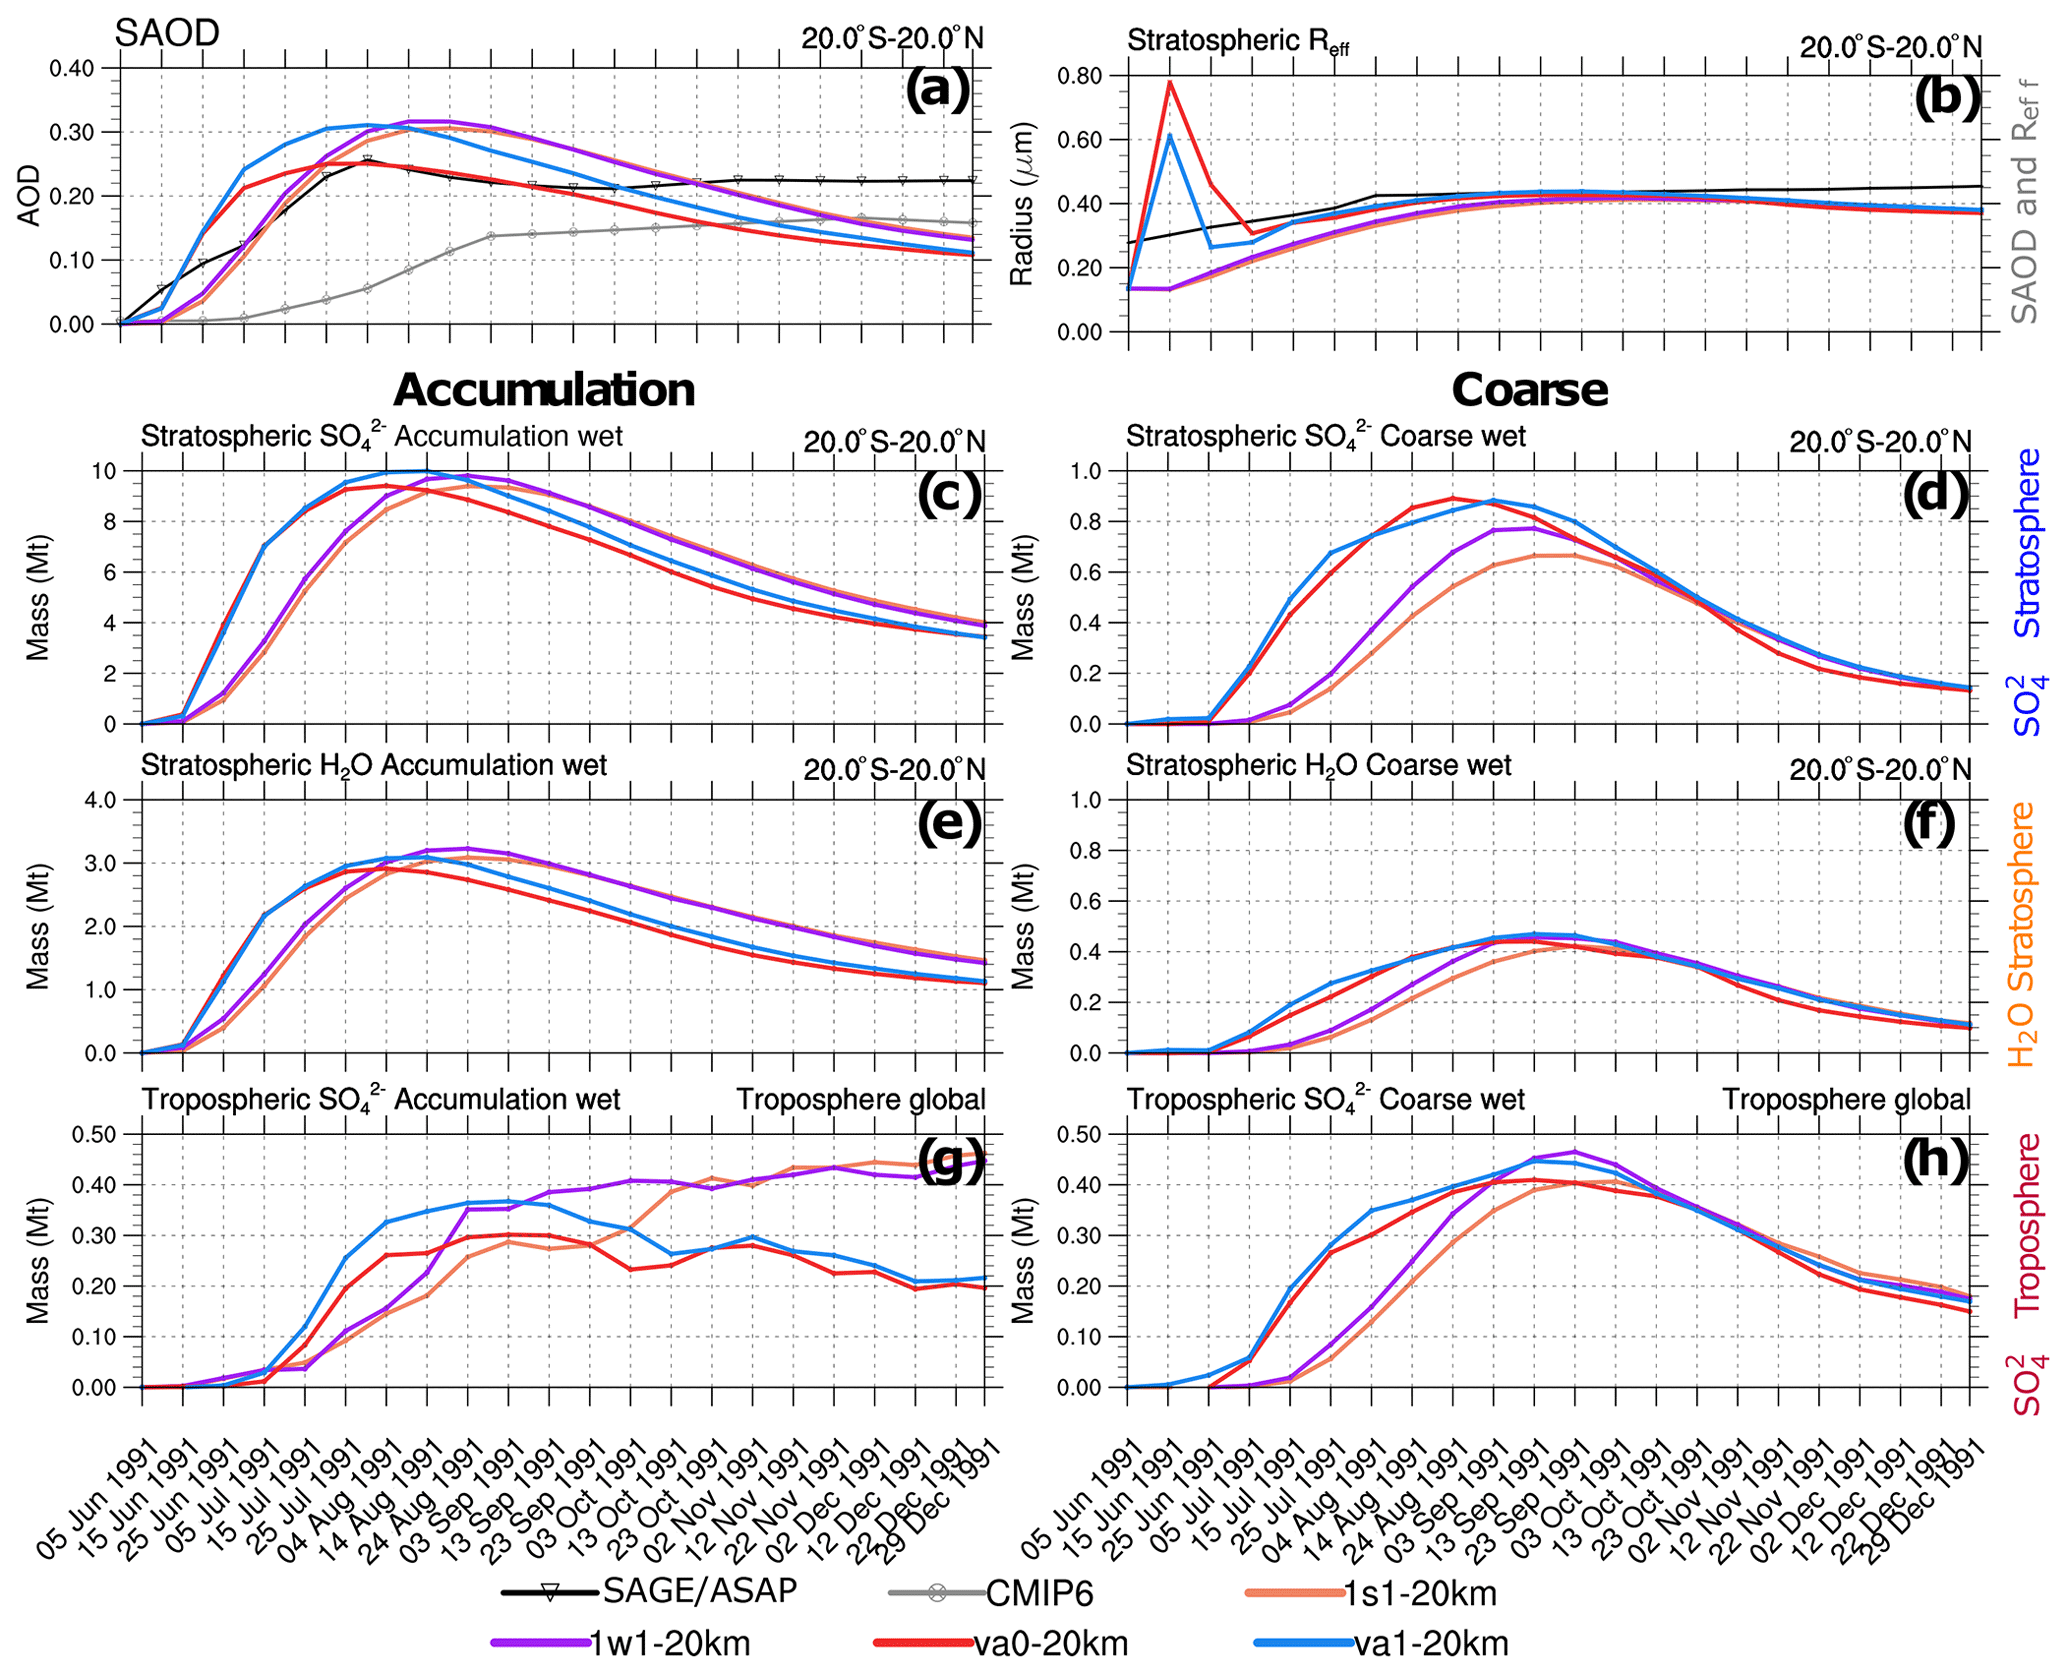
Figure 10Visible SAOD (0.55 µm), aerosol effective radius, Reff above 100 hPa, and integrated masses (Mt) simulated in the 1s1-20km, 1w1-20km, va0-20km, and va1-20km experiments as a function of time. (a) Simulated, as well as observed AVHRR, scaled SAGE/ASAP, and CMIP6 20∘ S–20∘ N SAODs. (b) Simulated stratospheric (above 100 hPa) Reff as well as that observed in SAGE/ASAP in 20∘ S–20∘ N. (c) Stratospheric in accumulation mode in 20∘ S–20∘ N. (d) Stratospheric in coarse mode in 20∘ S–20∘ N. (e) Stratospheric aerosol water in accumulation mode in 20∘ S–20∘ N. (f) Stratospheric aerosol water in coarse mode in 20∘ S–20∘ N. (e) Tropospheric (below 100 hPa) in accumulation mode integrated globally. (f) Tropospheric in coarse mode integrated globally.
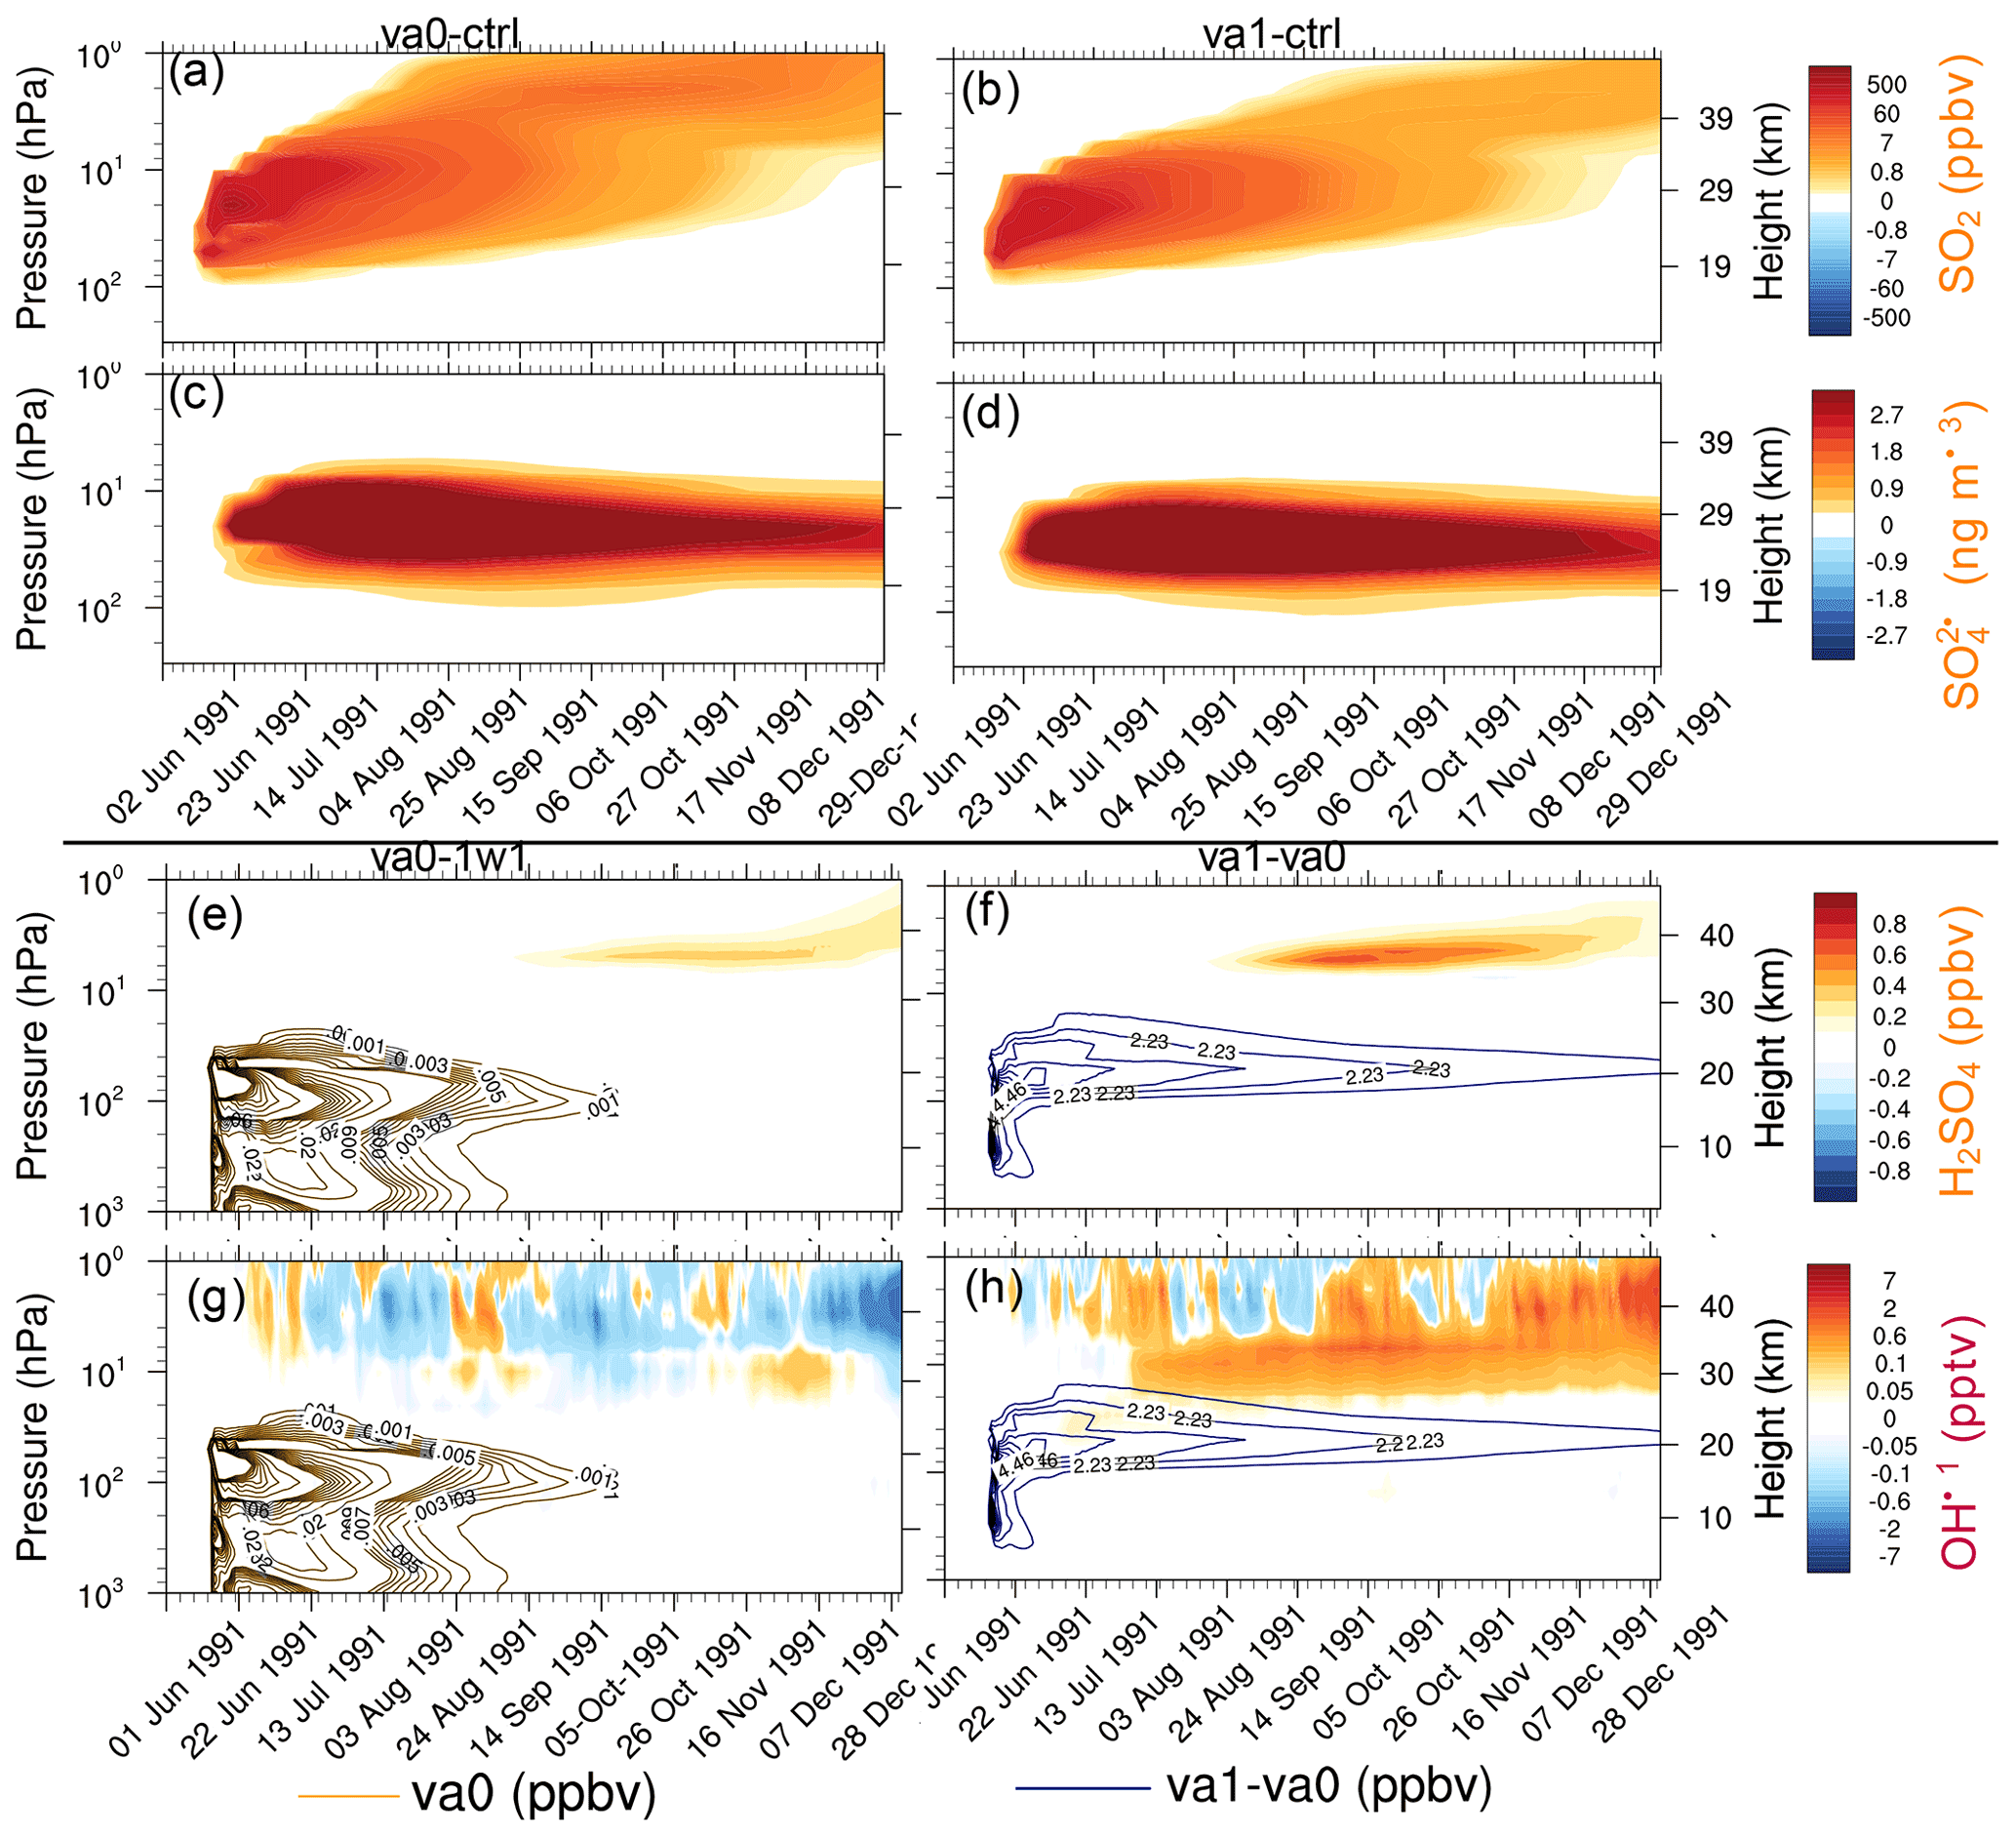
Figure 11The 20∘ S–20∘ N average perturbations of chemical constituents as a function of pressure and time in va0-20km and va1-20km experiments. (a) SO2 in va0-ctr (ppbv). (b) SO2 in va1-ctr (ppbv). (c) in va0-ctr (ng m−3). (d) in va1-ctr (ng m−3). (e) H2SO4 in va0-1w1 (ppbv). (f) H2SO4 in va1-va0 (ppbv). (g) OH in va0-1w1 (pptv). (h) OH in va1-va0 (pptv). The contour lines show the accumulation mode ash mixing ratio (ppbv); orange contour lines for va0 and blue contour lines for va1-va0 in (e–h).
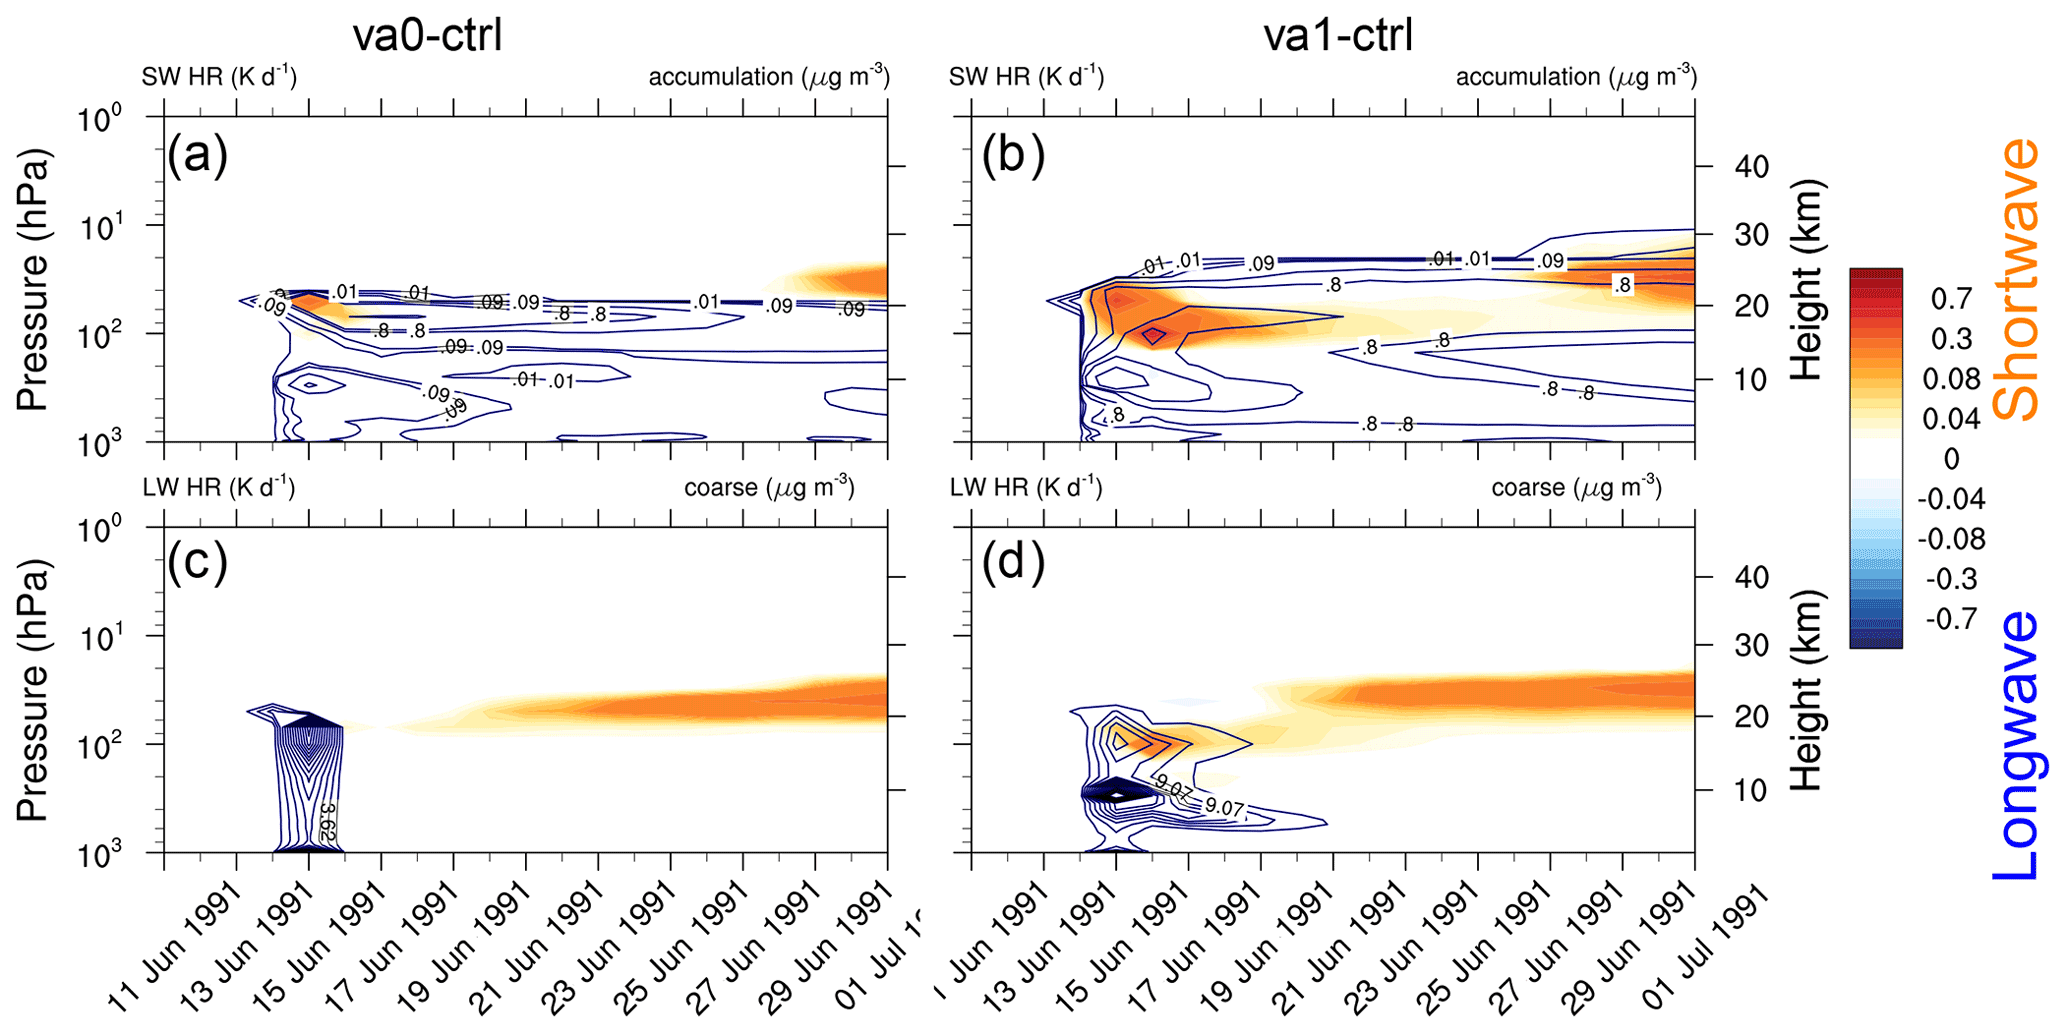
Figure 12Shortwave heating rate (K d−1) averaged over the tropical belt (20∘ S–20∘ N) shown as a function of time and height overlaid by contours of volcanic ash mass concentration (accumulation mode) for (a) va0-20km and (b) va1-20km experiments. Longwave heating rate (K d−1) for (c) va0-20km, and (d) va1-20km experiments, both overlaid by contours of volcanic ash mass concentration (coarse mode). All heating rates are calculated by a double call of the radiation routines.
Figure 9a shows the evolution of the stratospheric ash masses in the va0 and va1 experiments compared to the AVHRR and HIRS/2 retrievals (Guo et al., 2004b). In the va1 experiment, the model ash mass is higher than in the AVHRR and HIRS/2 observations, while in the va0 experiment, the ash mass is underestimated compared with observations. However, the uncertainties in the AVHRR-derived ash mass are ± 53 % (Gu et al., 2003) and ± 85 % in HIRS retrievals (Yu and Rose, 2000). The larger ash mass in the va1 experiment (compared to va0) on the first day after the eruption causes stronger heating and lofting of ash in the va1 experiment than in va0, which prolongs its lifetime in the stratosphere (Fig. 12).
The injection of volcanic ash significantly increases the stratospheric optical depth and Reff during the few days after the eruption. This is shown in Fig. 10a and b, which compare the time series of SAOD and the effective radius averaged within 20∘ S–20∘ N latitude belt above 100 hPa in the 1s1-20km, 1w1-20km, va0-20km, and va1-20km experiments, with available observations. The AVHRR and scaled SAGE/ASAP SAODs are consistent for 4–5 months after the eruption. The CMIP6 SAOD appears to be half the size when compared to them. During the 4–5 months following the eruption, the simulated SAOD (Fig. 10a) is slightly larger than in observations but decreases more quickly than in observations later on in all experiments except va0-20km. The SAODs in the va1-20km and va0-20km experiments grow more rapidly during the first 2 months than in the 1s1-20km and 1w1-20km experiments (Fig. 10a). The effective radii in the va1 and va0 experiments spike to about 0.6–0.8 µm during the first week after the eruption, when a significant amount of ash is present in the volcanic cloud.
Figure 10c and d show the evolution of the mass in the coarse and accumulation modes integrated over the 20∘ S–20∘ N latitude belt. In the va0 and va1 experiments, the stratospheric sulfate mass increases more rapidly than in the 1w1 and 1s1 experiments. This is consistent with SAOD in Fig. 10a and with the more rapid depletion of SO2 mass in Fig. 9b, which demonstrates a better agreement with SO2 mass observations. We relate the faster SO2 oxidation in the va0 and va1 experiments to the effect of heterogeneous reactions on ash particles and more intensive volcanic cloud dispersion facilitated by ash radiative heating.
Two months after the eruption, in the 1s1 and 1w1 experiments, the sulfate mass in accumulation and coarse modes reaches maximums of 9 and 0.7 Mt, respectively. Thus, the sulfate formation rate increases in the va1 and va0 experiments compared to experiments without ash in both accumulation and coarse modes. The mass reaches the maximum 2 weeks earlier in experiments with ash than in experiments without ash (Fig. 10c and d).
The aerosol water mass increases when sulfate mass increases, both in the accumulation and the coarse modes (Fig. 10e and f). A sulfate mass of 9 Mt is associated with an aerosol water mass of 3 Mt in the accumulation mode (Fig. 10c and e). This is consistent with the 75 % sulfuric acid solution assumed by Stenchikov et al. (1998). For the coarse mode, the aerosol water mass of 0.5 Mt is associated with roughly 0.8 Mt of sulfate (Fig. 10d and f). Both sulfate and wet ash particles accumulate aerosol water. In the long run, due to the shorter lifetime of ash particles, aerosol water is mainly retained in sulfate aerosols. Figure 10g and h show mass in the coarse and accumulation modes in the troposphere (integrated below 100 hPa) globally for the same experiments. The tropospheric mass of volcanic origin comprises sedimented from the stratosphere. Because of the rapid wet removal, little sulfate (not exceeding 0.4 Mt in each mode) is accumulated in the troposphere both in accumulation and coarse modes. This is more than 1 order of magnitude less than the mass in the stratosphere. More sulfate mass sediments into the troposphere in the va0 and va1 experiments than in the 1s1 and 1w1 runs (Fig. 10e) because in the va1 and va0 experiments, the stratospheric sulfate mass is larger than in the 1s1 and 1w1 experiments.
5.5 Ash aging
Ash particles provide surface areas, enhancing the heterogeneous reactions and leading to significant changes in stratospheric chemistry (Danilin et al., 1999). Ash SAD is especially important in the first week after the eruption when a few sulfate aerosols form. Figure 11a–d show the 20∘ S–20∘ N mean SO2 mixing ratio and concentration as a function of time and height for the va0-20km and va1-20km experiments. Ash radiative heating causes lofting of the SO2 plume by about 1 km d−1 in both experiments, similar to that found in Stenchikov et al. (2021), although ash in our simulations is more absorbing than in Stenchikov et al. (2021).
In both cases, the cloud is below 35 km, but SO2 reaches the stratopause. Therefore some SO2 penetrates the mesosphere. This effect is more significant in the va0 experiment because of slower SO2 oxidation compared with the va1 experiment. The enhanced mixing ratio of SO2 in the mesosphere above 45 km was detected in ATMOS observations (Rinsland et al., 1995) and simulated by Brühl et al. (2015) after the 1991 Pinatubo eruption.
Figure 11e and g show the changes in mixing ratio of H2SO4, and OH concentrations in the va0-20km experiment with respect to 1w1-20km, demonstrating the effect of ash injection. Figure 11f and h show changes in the same characteristics, except in the va1-20km experiment with respect to the va0-20km experiment to demonstrate the effect of aging. If aging is turned on, H2SO4 condenses on volcanic ash, decreasing sulfuric acid concentration. At the same time, ash facilitates heterogeneous reactions. Moreover, the stratospheric water vapor mass is larger for the va1 experiment than va0 because of the more substantial heating (longwave and shortwave) in the va1 experiment (Fig. 11b and c). The more significant heating of the va1 experiment increases the tropospheric water vapor transport into the stratosphere. As a result, the stratospheric water vapor mass in va1 is 15 Mt higher than in va0 after 4 months of the eruption. The increased stratospheric water vapor facilitates OH formation (11h). The combined effect of ash radiative heating, aging, and heterogeneous chemistry in our setting resulted in an increase in sulfuric acid and sulfate mass by about 10 %–20 %, compared to those experiments without ash injections.
Figure 12 shows the shortwave and longwave heating rates averaged over the tropical belt (20∘ S–20∘ N) caused by volcanic cloud for the va0-20km (panels a and c) and va1-20km (panels b and d) experiments, as a function of time and height. The contour lines show the ash concentrations for the accumulation (panels a and b) and coarse (panels c and d) modes. Both experiments have two distinguished periods of increased radiative heating (Fig. 12a and b). The first time the heating peaks just after the eruption and the second time 10 d later. The first peak is associated with ash absorption and the second with sulfate aerosol absorption. In both cases the SW heating by sulfate peaks at 25 km (see Fig. 11a and b). The average ash SW heating rates is about 0.4 K d−1 in experiment va1-20km and 0.15 K d−1 – in experiment va0-20km (Fig. 12a and b). The IR radiation cools the top of the volcanic cloud during the first few days after the eruption. Still, the absorption of upward IR radiation heats the bottom of the volcanic cloud. Heating caused by the absorption of IR radiation by sulfate aerosols is seen in about 10 d when enough is generated. Figure 12d shows that in the va1-20km experiment, the longwave heating rate reaches 0.2 K d−1. Radiative heating in the va0-20km experiment is weaker than in the va1-20km experiment (Fig. 12c). Thus, aging significantly enhances the radiative effect of ash for about 1 week after the eruption.
5.6 Long-term climate response to volcanic forcing
In Sect. 5.1, we showed that the model demonstrates strong SAOD sensitivity to the injection height during the first 6 months after the eruption. We also found that the spatial–temporal SAOD development in simulations with the volcanic emission of 17 Mt SO2 at 20 km best fits the observations 6 months after the eruption, but SAOD is overestimated. Here we further test the volcanic cloud evolution and stratospheric temperature response for the post-Pinatubo period of 2.5 years against observations. We take advantage of the fact that the climate response provides another constraint on SAOD (Stenchikov et al., 1998; Kirchner et al., 1999). We also quantify the sensitivity of volcanic cloud evolution to the amount of injected SO2 considering the 12 Mt SO2 emission at 20 km height.
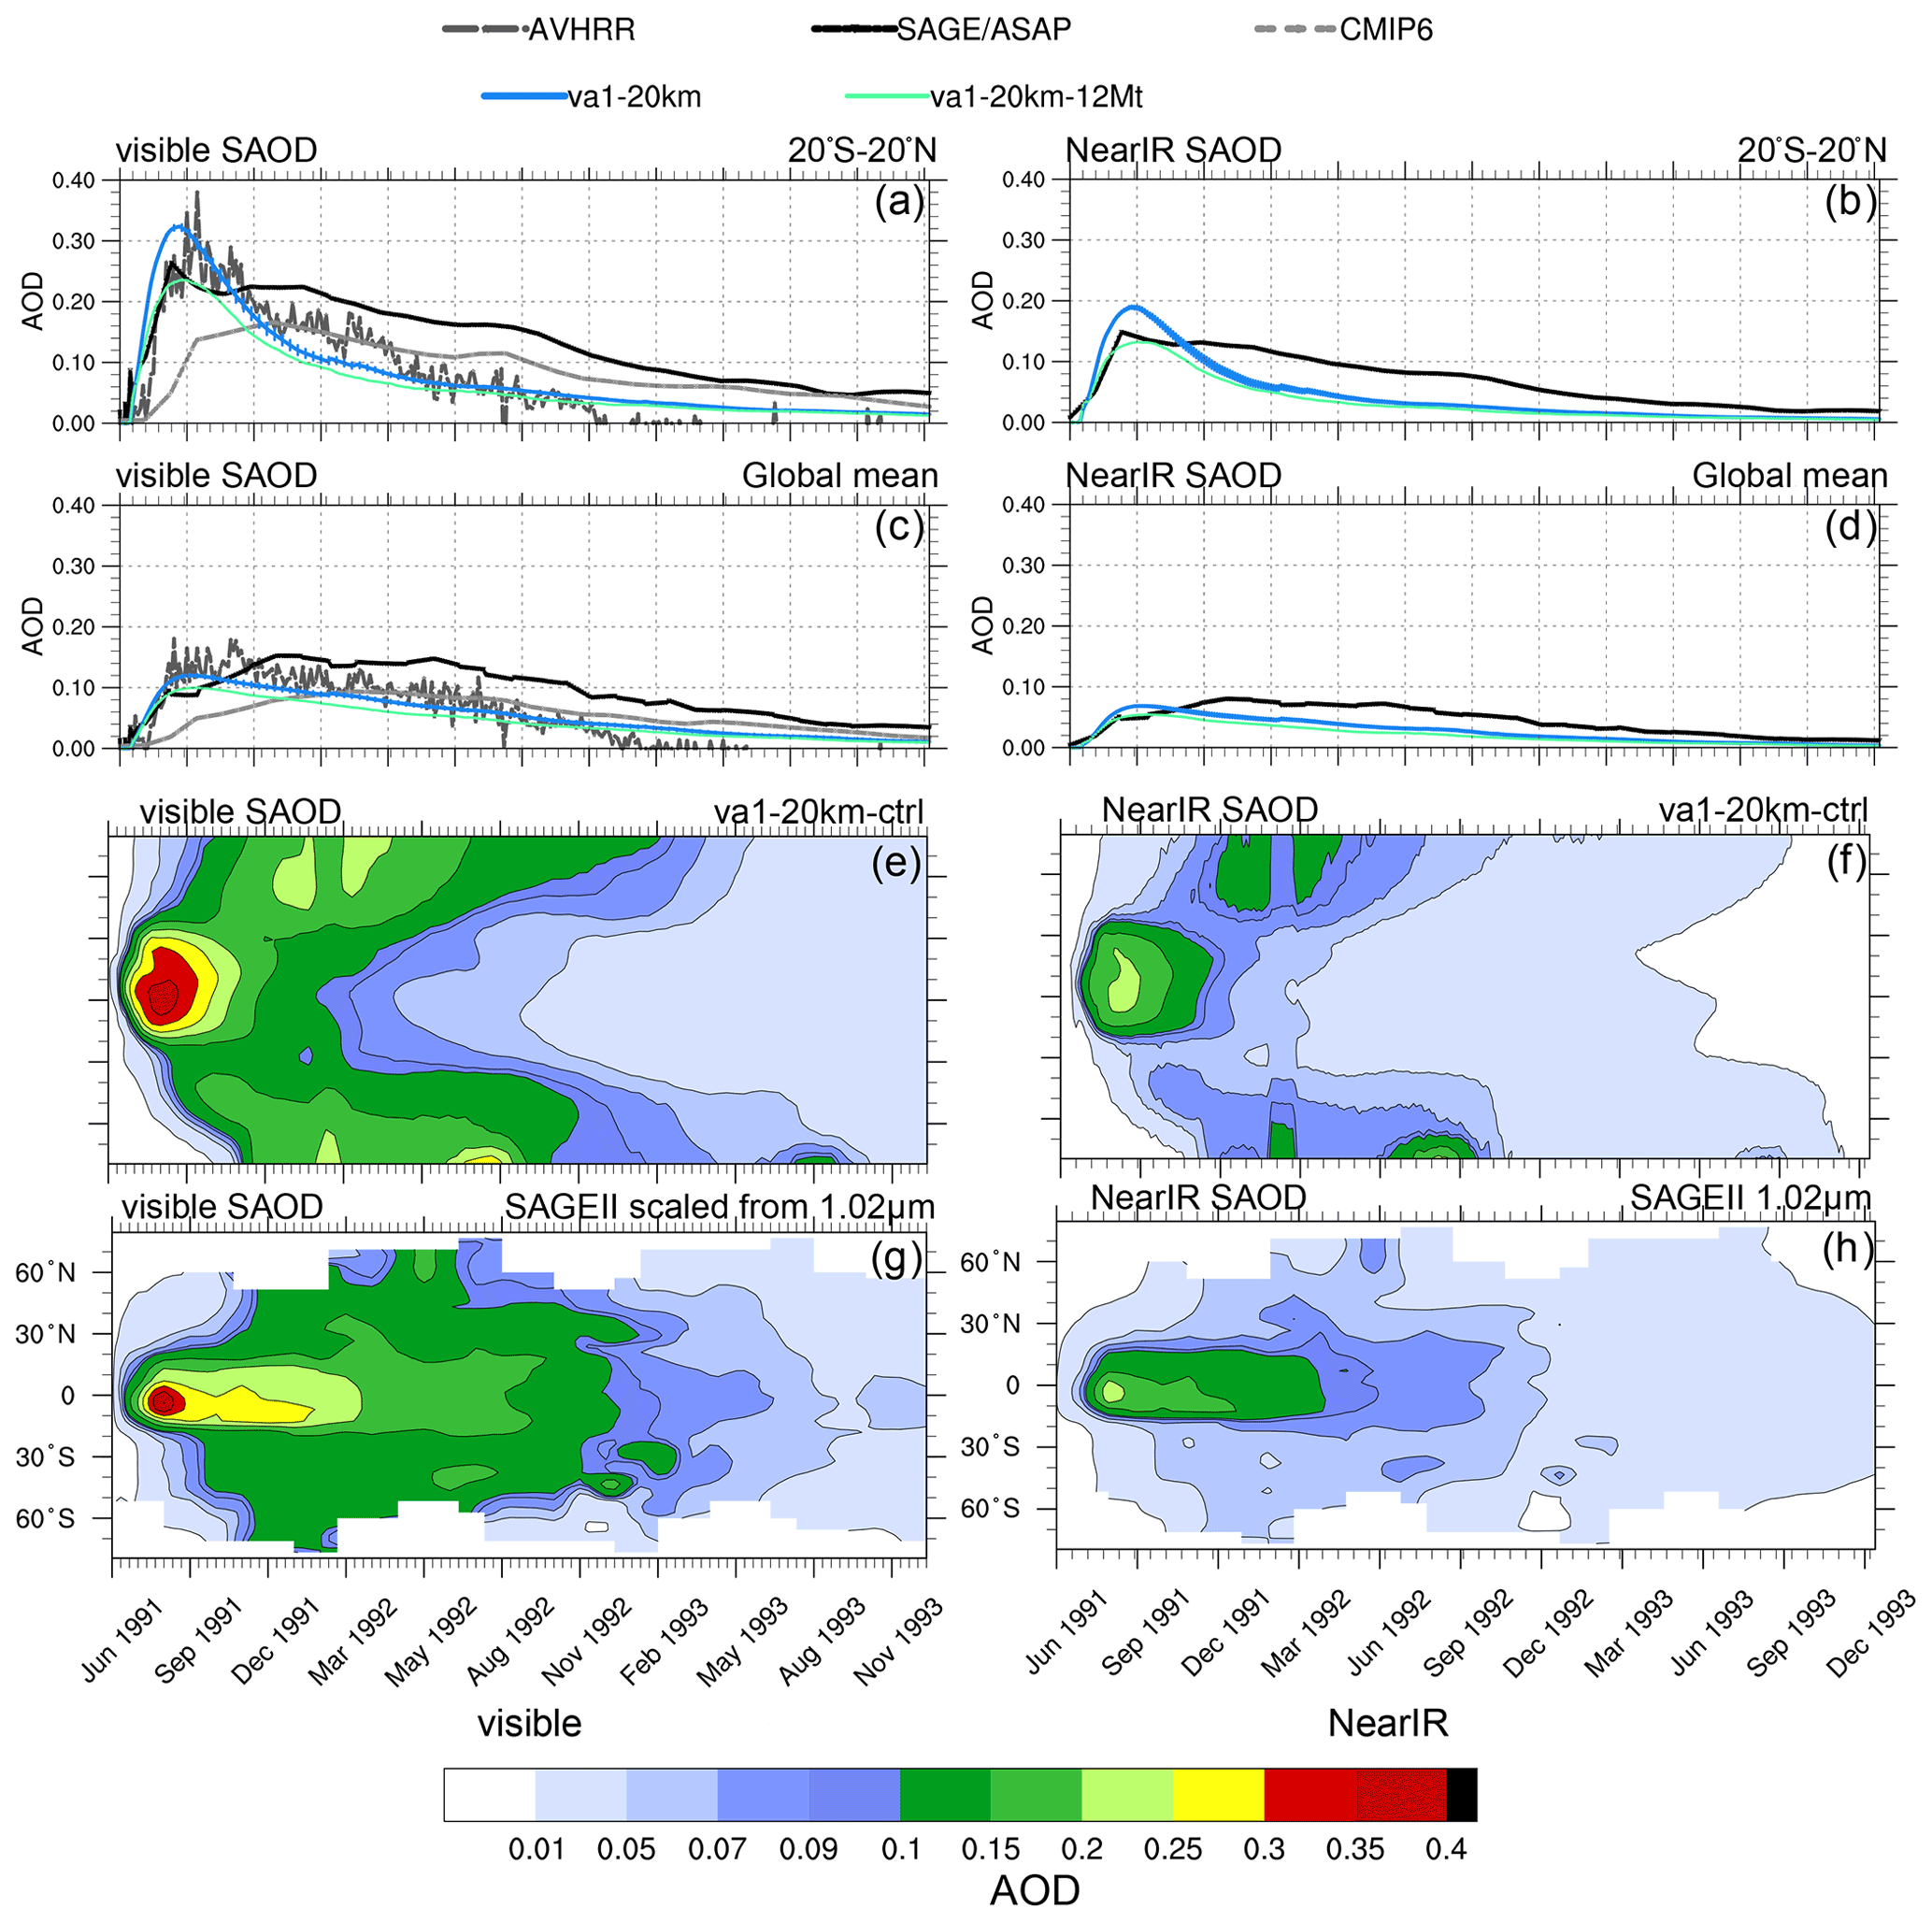
Figure 13Visible and near-IR SAODs in the va1-20km and va1-20km-12Mt experiments as well as in AVHRR, scaled SAGE/ASAP, and CMIP6. (a) Visible 20∘ S–20∘ N SAODs as a function of time, (b) near-IR 20∘ S–20∘ N SAODs as a function of time, (c) visible globally averaged SAODs as a function of time, (d) near-IR globally averaged SAODs as a function of time, (e) simulated visible zonally average SAOD in va1-20km as a function of time and latitude, (f) simulated near-IR zonally average SAOD in va1-20km as a function of time and latitude, (g) SAGE/ASAP scaled visible zonally average SAOD as a function of time and latitude, and (h) SAGE/ASAP near-IR zonally average SAOD as a function of time and latitude. Error bars represent 1σ from the ensemble mean.
Figure 13 compares the post-eruption evolution of SAODs (visible and near-IR) and mass in the va1 experiments with the 20 km injection height and the 17 Mt and 12 Mt SO2 emission with the observations from CMIP6, AVHRR, and SAGE/ASAP (scaled visible and original near-IR) SAODs for 2.5 years. In the va1-20km experiment with the 17 Mt SO2 injection, the simulated SAOD overestimated the AVHRR and scaled SAGE/ASAP SAODs both in the visible and near-IR range (Fig. 14a–d) in July–August 1991. In the experiment with the 12 Mt SO2 emission, the SAOD reduces and fits the observations in visible and near-IR range. It is important that the initial rate of development of visible and near-IR SAODs is similar in the model and observations both in the tropics and globally. It suggests that, at the stage when the aerosol cloud is still confined to the tropics, the model captures the SO2 oxidation process and development quite well.
Starting from September 1991, the excessive speed of the poleward transport of aerosols in the model causes a faster decrease in SAOD in the simulations (both in the tropics and globally) than in the observations (Fig. 13e–h). This is because sulfate aerosols are mainly deposited in the midlatitude storm tracks through tropopause faults and in the polar regions in the downward branch of B–D circulation (Gao et al., 2007). The faster poleward aerosol transport facilitates both these processes.

Figure 14Atmospheric temperature anomalies (K) for the post-Pinatubo period with respect to the 1990–2000 climatology from the va1-20km (a, b), va1-20km-12Mt (c, d), and MERRA-2 reanalysis (e, f). Panels (a, c, e) depict zonally average anomalies at the 50 hPa pressure level as a function of time and latitude, and (b, d, f) depict globally (70∘ S–70∘ N) averaged anomalies as a function of time and height/pressure.
We further evaluate the long-term model stratospheric temperature response to test the consistency of va1 simulations with observations. Figure 14 shows the temperature anomalies in the 1s1, va1-20km, and va1-20km-12Mt experiments and MERRA2 reanalysis. Figure 14a, c, and e depict the Hovmöller diagrams of zonal mean temperature anomaly at 50 hPa, and Fig. 14b, d, and f are the global mean (70∘ S–70∘ N) temperature anomaly as a function of height (or pressure) and time. All experiments in Fig. 14 resemble the spatial–temporal structure of the stratospheric temperature response well. They reproduce stratospheric volcanic heating in the first year after the eruption and the additional heating associated with the change in the QBO phase in 1993.
In the va1-20km-12Mt experiment, the SAOD is about 30 % lower than in va1-20km, causing lower radiative heating. In the va1-20km experiment, the peak of temperature response reaches 4 K at 50 hPa. In the va1-20km-12Mt experiment, the temperature peak is about 2.5 K (Fig. 14a and c), which better agrees with observations (Labitzke and McCormick, 1992) and the MERRA2 reanalysis (Fig. 14e). Figure 14b, d, and f show a peak temperature anomaly at 30 hPa in the model simulations and the reanalysis. Again, the temperature response in the va1-20km-12Mt experiment fits the MERRA2 temperature anomalies better than the va1-20km experiment (Fig. 14b, d, and f). Thus, reducing the injected SO2 mass to 12 Mt shows a better agreement with the observations (Labitzke and McCormick, 1992), and the MERRA2 temperature anomalies, resulting in more realistic heating at 50 hPa in both the tropics and the subtropics.
In this study, we use the EMAC model with well-developed stratospheric chemistry (including heterogeneous chemistry) and detailed aerosol microphysics to explore the evolution of the volcanic cloud from the 1991 Pinatubo eruption, the largest and best-observed volcanic event in the 20th century. We tested the model results with observations of volcanic clouds and their radiative effect. We conducted ensemble simulations to study the volcanic cloud sensitivity to the injection height and the initial volume where volcanic materials were released (one grid box versus a latitude belt), as well as considering the effects of the co-injection of water vapor, ash, and ash aging on the formation of the volcanic cloud.
The model simulations with 20 km injection height exhibit the best agreement of the spatial–temporal evolution of SAOD with the AVHRR SAOD and SAGE/ASAP SAOD and SAD. In the 20 km injection experiments, the volcanic cloud is lifted to a height of 25 km by radiative heating, while in the experiments with volcanic material injection at 25 km, the volcanic cloud overshoots the 30 km level. The vertical distribution of SAOD and SAD in the observations and the model experiments with the 20 km injection height shows that the aerosol cloud stabilizes in the middle of the stratosphere at 25 km. In the experiments with the 17 and 25 km injection heights, the volcanic cloud interacts with the tropopause and the stratopause, respectively, causing some aerosol mass to escape from the stratosphere. The stratospheric oxidation capacity and wind fields are different at different altitudes, strengthening the sensitivity to the injection height. In the experiments with the zonally uniform SO2 injection in a latitude belt at the height of 25 km, lofting is weak, so the volcanic cloud remains at the same altitude. The SAOD in the tropical belt in this experiment is overestimated due to the higher oxidation rate.
Because of the coarse spatial resolution (T42L90), similar to other global models, EMAC simulates too fast aerosol poleward transport with too quick an escape of the volcanic materials from the tropical stratosphere, accelerating the loss of the aerosol mass to deposition at the poles, in tropopause folds, and storm tracks.
The increase in water vapor in the stratosphere leads to the rise in the oxidation rate of SO2 to . The water vapor could be brought into the stratosphere by an eruptive jet, co-ignimbrite convection, and/or intruded through the tropopause heated by the absorption of solar and IR radiation by volcanic debris. The cross-tropopause water vapor intrusion does not affect the volcanic cloud evolution much, as most of the water penetrating through the tropopause accumulates below the volcanic cloud. The water vapor directly injected into the volcanic cloud in the 1s1-20km experiment increases the mass and SAOD by about 5 %. The sensitivity of the mass to the amount of injected water in the experiment with the 20 km injection height is low because most of the water vapor freezes and is quickly removed from the stratosphere in agreement with Stenchikov et al. (2021). So the masses of the remaining stratospheric water vapor in the 1w1-20km experiments with 15 and 150 Mt of water vapor injections do not differ much. A significant acceleration of SO2 oxidation due to the injection of water vapor (LeGrande et al., 2016) is only reproduced in the experiments with the 25 km injection height when a significant mass of injected water vapor is retained in the stratosphere.
Our experiments' simulated mass of ash is within the AVHRR and HIRS estimates, but observations themselves are uncertain. Volcanic ash provides SAD for heterogeneous chemistry. This is most important during the first few weeks after the eruption when ash is still abundant but sulfate aerosol is not yet developed. The simultaneous injection of water vapor and non-aging ash in the va0-20km experiment increases the maximum SAOD and mass by 10 %.
In the va1-20km experiment, ash particles in the accumulation and coarse modes are entirely aged within 1 d after the injection. Aging increases the mass of ash particles. They continue uptaking water and molecules until removed by transport or sedimentation. The coarse ash particles deposit within 1 week, while it takes 6 months to reduce the mass of the ash accumulation mode from 1.2 to 0.3 Mt. Overall, aging increases the SAOD by 20 % and the mass by 10 %. Aging increases the radiative effect of ash both in SW and IR. The injections of volcanic water vapor and ash significantly accelerate the formation of the sulfate aerosols during the first 2 months after the eruption in the va1-20km and va0-20km experiments.
The simulated maximum SAOD and stratospheric temperature anomalies in the va1-20km-12Mt experiment with the 12 Mt SO2 injection closely resemble the temperature anomalies obtained from the reanalysis both in latitude and height. The inclusion of volcanic ash adds to the radiative heating of the volcanic debris during the first week after the eruption in agreement with Stenchikov et al. (2021), showing that the initial local heating results in the lofting of the aerosol cloud. Our simulations show that the interactive calculations of OH and heterogeneous chemistry increase the volcanic cloud sensitivity to water vapor and ash injections and have to be accounted for in simulations of volcanic impacts on climate and stratospheric chemistry.
The EMAC code modifications, including all initialization data sets and selected simulation results, are available at the KAUST repository site at https://repository.kaust.edu.sa/handle/10754/675509, last access: 7 December 2022, https://doi.org/10.25781/KAUST-0W317 (Abdelkader et al., 2022).
The supplement related to this article is available online at: https://doi.org/10.5194/acp-23-471-2023-supplement.
MA performed the calculations and prepared all the figures. MA and GS wrote the paper. GS planned the analysis and calculations, led the discussion, and reviewed and improved the paper. AP, HT, and JL advised on EMAC modifications, discussed the results, and reviewed and improved the paper.
At least one of the (co-)authors is a member of the editorial board of Atmospheric Chemistry and Physics. The peer-review process was guided by an independent editor, and the authors also have no other competing interests to declare.
Publisher's note: Copernicus Publications remains neutral with regard to jurisdictional claims in published maps and institutional affiliations.
This article is part of the special issue “The Modular Earth Submodel System (MESSy) (ACP/GMD inter-journal SI)”. It is not associated with a conference.
The research reported in this publication was supported by funding from the King Abdullah University of Science and Technology (KAUST). For computer time, this research used the resources of the Supercomputing Laboratory at KAUST. We are thankful to Christoph Brühl for the valuable discussion and help in EMAC settings and to Linda and Mark Everett for proofreading this paper. Holger Tost acknowledges support from the Carl-Zeiss foundation.
This research has been supported by the KAUST Competitive Research Grant (URF/1/2180-01-01) Combined Radiative and Air Quality Effects of Anthropogenic Air Pollution and Dust over the Arabian Peninsula, the KAUST Base Research Grant (BAS/1/1309-01-01), and the Deutsche Forschungsgemeinschaft (DFG, German Research Foundation) TRR 301-Project-ID 428312742.
This paper was edited by Zhanqing Li and reviewed by two anonymous referees.
Abdelkader, M., Metzger, S., Mamouri, R. E., Astitha, M., Barrie, L., Levin, Z., and Lelieveld, J.: Dust–air pollution dynamics over the eastern Mediterranean, Atmos. Chem. Phys., 15, 9173–9189, https://doi.org/10.5194/acp-15-9173-2015, 2015. a, b, c, d
Abdelkader, M., Metzger, S., Steil, B., Klingmüller, K., Tost, H., Pozzer, A., Stenchikov, G., Barrie, L., and Lelieveld, J.: Sensitivity of transatlantic dust transport to chemical aging and related atmospheric processes, Atmos. Chem. Phys., 17, 3799–3821, https://doi.org/10.5194/acp-17-3799-2017, 2017. a, b
Abdelkader, M., Stenchikov, G., Brühl, C., Pozzer, A., Tost, H., and Lelieveld, J.: The effect of ash aging and heterogeneous chemistry on evolution of a Pinatubo-size volcanic cloud, KAUST Research Repository [data set], https://doi.org/10.25781/KAUST-0W317, 2022. a
Ansmann, A., Mattis, I., Wandinger, U., Wagner, F., Reichardt, J., and Deshler, T.: Evolution of the Pinatubo Aerosol: Raman Lidar Observations of Particle Optical Depth, Effective Radius, Mass, and Surface Area over Central Europe at 53.4∘N, J. Atmos. Sci., 54, 2630–2641, https://doi.org/10.1175/1520-0469(1997)054<2630:EOTPAR>2.0.CO;2, 1997. a
Antuna, J. C., Robock, A., Stenchikov, G. L., Thomason, L. W., and Barnes, J. E.: Lidar validation of SAGE II aerosol measurements after the 1991 Mount Pinatubo eruption, J. Geophys. Res.-Atmos., 107, 4194, https://doi.org/10.1029/2001JD001441, 2002. a
Antuna, J. C., Robock, A., Stenchikov, G., Zhou, J., David, C., Barnes, J., and Thomason, L.: Spatial and temporal variability of the stratospheric aerosol cloud produced by the 1991 Mount Pinatubo eruption, J. Geophys. Res.-Atmos., 108, 4624, https://doi.org/10.1029/2003JD003722, 2003. a
Aquila, V., Oman, L. D., Stolarski, R. S., Colarco, P. R., and Newman, P. A.: Dispersion of the volcanic sulfate cloud from a Mount Pinatubo–like eruption, J. Geophys. Res.-Atmos., 117, D06216, https://doi.org/10.1029/2011JD016968, 2012. a, b
Azoulay, A., Schmidt, H., and Timmreck, C.: The Arctic Polar Vortex Response to Volcanic Forcing of Different Strengths, J. Geophys. Res.-Atmos., 126, e2020JD034450, https://doi.org/10.1029/2020JD034450, 2021. a
Bândă, N., Krol, M., van Weele, M., van Noije, T., and Röckmann, T.: Analysis of global methane changes after the 1991 Pinatubo volcanic eruption, Atmos. Chem. Phys., 13, 2267–2281, https://doi.org/10.5194/acp-13-2267-2013, 2013. a
Bândă, N., Krol, M., Noije, T. v., Weele, M. v., Williams, J. E., Sager, P. L., Niemeier, U., Thomason, L., and Röckmann, T.: The effect of stratospheric sulfur from Mount Pinatubo on tropospheric oxidizing capacity and methane, J. Geophys. Res.-Atmos., 120, 1202–1220, https://doi.org/10.1002/2014JD022137, 2015. a
Bingen, C., Fussen, D., and Vanhellemont, F.: A global climatology of stratospheric aerosol size distribution parameters derived from SAGE II data over the period 1984–2000: 2. Reference data, J. Geophys. Res.-Atmos., 109, D06202, https://doi.org/10.1029/2003JD003511, 2004. a
Bingen, C., Robert, C. E., Stebel, K., Brühl, C., Schallock, J., Vanhellemont, F., Mateshvili, N., Höpfner, M., Trickl, T., Barnes, J. E., Jumelet, J., Vernier, J.-P., Popp, T., de Leeuw, G., and Pinnock, S.: Stratospheric aerosol data records for the climate change initiative: Development, validation and application to chemistry-climate modelling, Remote Sens. Environ., 203, 296–321, https://doi.org/10.1016/j.rse.2017.06.002, 2017. a
Bittner, M., Schmidt, H., Timmreck, C., and Sienz, F.: Using a large ensemble of simulations to assess the Northern Hemisphere stratospheric dynamical response to tropical volcanic eruptions and its uncertainty: LARGE ENSEMBLES FOR VOLCANIC ERUPTIONS, Geophys. Res. Lett., 43, 9324–9332, https://doi.org/10.1002/2016GL070587, 2016. a
Borrmann, S., Dye, J. E., Baumgardner, D., Proffitt, M. H., Margitan, J. J., Wilson, J. C., Jonsson, H. H., Brock, C. A., Loewenstein, M., Podolske, J. R., and Ferry, G. V.: Aerosols as dynamical tracers in the lower stratosphere: Ozone versus aerosol correlation after the Mount Pinatubo eruption, J. Geophys. Res.-Atmos., 100, 11147–11156, https://doi.org/10.1029/95JD00016, publisher: John Wiley & Sons, Ltd, 1995. a
Brühl, C., Lelieveld, J., Crutzen, P. J., and Tost, H.: The role of carbonyl sulphide as a source of stratospheric sulphate aerosol and its impact on climate, Atmos. Chem. Phys., 12, 1239–1253, https://doi.org/10.5194/acp-12-1239-2012, 2012. a, b
Brühl, C., Lelieveld, J., Tost, H., Höpfner, M., and Glatthor, N.: Stratospheric sulfur and its implications for radiative forcing simulated by the chemistry climate model EMAC, J. Geophys. Res.-Atmos., 120, 2103–2118, https://doi.org/10.1002/2014JD022430, 2015. a, b, c, d, e, f, g, h, i, j, k
Burkholder, J. B., Sander, S. P., Abbatt, J. P. D., Barker, J. R., Huie, R. E., Kolb, C. E., Kurylo, M. J., Orkin, V. L., Wilmouth, D. M., and Wine, P. H.: Chemical kinetics and photochemical data for use in atmospheric studies: evaluation number 18, Tech. Rep. JPL Pub 15-10, Jet Propulsion Laboratory, Pasadena, CA, National Aeronautics and Space Administration, https://trs.jpl.nasa.gov/bitstream/handle/2014/45510/JPL%20Pu b%2015-10.pdf?sequence=1&isAllowed=y (last access: 7 December 2022), 2015. a
Charlton-Perez, A. J., Baldwin, M. P., Birner, T., Black, R. X., Butler, A. H., Calvo, N., Davis, N. A., Gerber, E. P., Gillett, N., Hardiman, S., Kim, J., Krüger, K., Lee, Y.-Y., Manzini, E., McDaniel, B. A., Polvani, L., Reichler, T., Shaw, T. A., Sigmond, M., Son, S.-W., Toohey, M., Wilcox, L., Yoden, S., Christiansen, B., Lott, F., Shindell, D., Yukimoto, S., and Watanabe, S.: On the lack of stratospheric dynamical variability in low-top versions of the CMIP5 models: STRATOSPHERE IN CMIP5 MODELS, J. Geophys. Res.-Atmos., 118, 2494–2505, https://doi.org/10.1002/jgrd.50125, 2013. a
Clyne, M., Lamarque, J.-F., Mills, M. J., Khodri, M., Ball, W., Bekki, S., Dhomse, S. S., Lebas, N., Mann, G., Marshall, L., Niemeier, U., Poulain, V., Robock, A., Rozanov, E., Schmidt, A., Stenke, A., Sukhodolov, T., Timmreck, C., Toohey, M., Tummon, F., Zanchettin, D., Zhu, Y., and Toon, O. B.: Model physics and chemistry causing intermodel disagreement within the VolMIP-Tambora Interactive Stratospheric Aerosol ensemble, Atmos. Chem. Phys., 21, 3317–3343, https://doi.org/10.5194/acp-21-3317-2021, 2021. a
Danilin, M. Y., Rodriguez, J. M., Hu, W., Ko, M. K. W., Weisenstein, D. K., Kumer, J. B., Mergenthaler, J. L., Russell, J. M., Koike, M., Yue, G. K., Jones, N. B., and Johnston, P. V.: Nitrogen species in the post-Pinatubo stratosphere: Model analysis utilizing UARS measurements, J. Geophys. Res.-Atmos., 104, 8247–8262, https://doi.org/10.1029/1999JD900024, 1999. a, b
de Meij, A., Pozzer, A., Pringle, K., Tost, H., and Lelieveld, J.: EMAC model evaluation and analysis of atmospheric aerosol properties and distribution with a focus on the Mediterranean region, Atmos. Res., 114–115, 38–69, https://doi.org/10.1016/j.atmosres.2012.05.014, 2012. a
Deshler, T.: Thirty years of in situ stratospheric aerosol size distribution measurements from Laramie, Wyoming (41∘N), using balloon-borne instruments, J. Geophys. Research, 108, 4167, https://doi.org/10.1029/2002JD002514, 2003. a
Dhomse, S. S., Emmerson, K. M., Mann, G. W., Bellouin, N., Carslaw, K. S., Chipperfield, M. P., Hommel, R., Abraham, N. L., Telford, P., Braesicke, P., Dalvi, M., Johnson, C. E., O'Connor, F., Morgenstern, O., Pyle, J. A., Deshler, T., Zawodny, J. M., and Thomason, L. W.: Aerosol microphysics simulations of the Mt. Pinatubo eruption with the UM-UKCA composition-climate model, Atmos. Chem. Phys., 14, 11221–11246, https://doi.org/10.5194/acp-14-11221-2014, 2014. a, b
Dhomse, S. S., Mann, G. W., Antuña Marrero, J. C., Shallcross, S. E., Chipperfield, M. P., Carslaw, K. S., Marshall, L., Abraham, N. L., and Johnson, C. E.: Evaluating the simulated radiative forcings, aerosol properties, and stratospheric warmings from the 1963 Mt Agung, 1982 El Chichón, and 1991 Mt Pinatubo volcanic aerosol clouds, Atmos. Chem. Phys., 20, 13627–13654, https://doi.org/10.5194/acp-20-13627-2020, 2020.
Driscoll, S., Bozzo, A., Gray, L. J., Robock, A., and Stenchikov, G.: Coupled Model Intercomparison Project 5 (CMIP5) simulations of climate following volcanic eruptions, J. Geophys. Res.-Atmos., 117, D17105, https://doi.org/10.1029/2012JD017607, 2012. a
Dutton, E. G. and Christy, J. R.: Solar radiative forcing at selected locations and evidence for global lower tropospheric cooling following the eruptions of El Chichón and Pinatubo, Geophys. Res. Lett., 19, 2313–2316, https://doi.org/10.1029/92GL02495, 1992. a, b
English, J. M., Toon, O. B., and Mills, M. J.: Microphysical simulations of large volcanic eruptions: Pinatubo and Toba, J. Geophys. Res.-Atmos., 118, 1880–1895, https://doi.org/10.1002/jgrd.50196, 2013. a
Eyring, V., Bony, S., Meehl, G. A., Senior, C. A., Stevens, B., Stouffer, R. J., and Taylor, K. E.: Overview of the Coupled Model Intercomparison Project Phase 6 (CMIP6) experimental design and organization, Geosci. Model Dev., 9, 1937–1958, https://doi.org/10.5194/gmd-9-1937-2016, 2016. a
Fisher, B. L., Krotkov, N. A., Bhartia, P. K., Li, C., Carn, S. A., Hughes, E., and Leonard, P. J. T.: A new discrete wavelength backscattered ultraviolet algorithm for consistent volcanic SO2 retrievals from multiple satellite missions, Atmos. Meas. Tech., 12, 5137–5153, https://doi.org/10.5194/amt-12-5137-2019, 2019. a, b
Fountoukis, C. and Nenes, A.: ISORROPIA II: a computationally efficient thermodynamic equilibrium model for K+–Ca2+–Mg2+––Na+–––Cl−–H2O aerosols, Atmos. Chem. Phys., 7, 4639–4659, https://doi.org/10.5194/acp-7-4639-2007, 2007. a
Fouquart, Y. and Bonnel, B.: Computations of solar heating of the earth's atmosphere: a new parameterization, Beitrage zur Physik der Atmosphare, 53, 35–62, 1980. a
Fujiwara, M., Gloria L. Manney, Lesley J. Gray, and onathon S. Wright: SPARC Reanalysis Intercomparison Project (S-RIP) Final Report, Tech. Rep. SPARC Report No. 10, WCRP-6/2021, Deutsches Zentrum für Luft- und Raumfahrt, Institute of Atmospheric Physics, https://doi.org/10.17874/800dee57d13, 2022. a
Gao, C., Oman, L., Robock, A., and Stenchikov, G. L.: Atmospheric volcanic loading derived from bipolar ice cores: Accounting for the spatial distribution of volcanic deposition, J. Geophys. Research, 112, D09109, https://doi.org/10.1029/2006JD007461, 2007. a
Gelaro, R., McCarty, W., Suárez, M. J., Todling, R., Molod, A., Takacs, L., Randles, C. A., Darmenov, A., Bosilovich, M. G., Reichle, R., Wargan, K., Coy, L., Cullather, R., Draper, C., Akella, S., Buchard, V., Conaty, A., da Silva, A. M., Gu, W., Kim, G.-K., Koster, R., Lucchesi, R., Merkova, D., Nielsen, J. E., Partyka, G., Pawson, S., Putman, W., Rienecker, M., Schubert, S. D., Sienkiewicz, M., and Zhao, B.: The Modern-Era Retrospective Analysis for Research and Applications, Version 2 (MERRA-2), J. Climate, 30, 5419–5454, https://doi.org/10.1175/JCLI-D-16-0758.1, 2017. a
Good, P. and Pyle, J.: Refinements in the use of equivalent latitude for assimilating sporadic inhomogeneous stratospheric tracer observations, 1: Detecting transport of Pinatubo aerosol across a strong vortex edge, Atmos. Chem. Phys., 4, 1823–1836, https://doi.org/10.5194/acp-4-1823-2004, 2004. a
Graft, H.-F., Kirchner, I., Robock, A., and Schult, I.: Pinatubo eruption winter climate effects: model versus observations, Clim. Dynam., 9, 81–93, https://doi.org/10.1007/BF00210011, 1993. a
Gu, Y., Rose, W. I., and Bluth, G. J. S.: Retrieval of mass and sizes of particles in sandstorms using two MODIS IR bands: A case study of April 7, 2001 sandstorm in China, Geophys. Res. Lett., 30, 1805, https://doi.org/10.1029/2003GL017405, 2003. a
Guo, S., Bluth, G. J. S., Rose, W. I., Watson, I. M., and Prata, A. J.: Re-evaluation of SO2 release of the 15 June 1991 Pinatubo eruption using ultraviolet and infrared satellite sensors, Geochem. Geophy. Geosy., 5, Q04001, https://doi.org/10.1029/2003GC000654, 2004a. a, b, c, d, e, f
Guo, S., Rose, W. I., Bluth, G. J. S., and Watson, I. M.: Particles in the great Pinatubo volcanic cloud of June 1991: The role of ice: JUNE 1991 PINATUBO VOLCANIC CLOUDS, Geochem. Geophy. Geosy., 5, Q05003, https://doi.org/10.1029/2003GC000655, 2004b. a, b, c, d, e, f
Hansen, J., Lacis, A., Ruedy, R., and Sato, M.: Potential climate impact of Mount Pinatubo eruption, Geophys. Res. Lett., 19, 215–218, https://doi.org/10.1029/91GL02788, 1992. a
Iacono, M. J., Delamere, J. S., Mlawer, E. J., Shephard, M. W., Clough, S. A., and Collins, W. D.: Radiative forcing by long-lived greenhouse gases: Calculations with the AER radiative transfer models, J. Geophys. Research, 113, D13103, https://doi.org/10.1029/2008JD009944, 2008. a
Jöckel, P., Sander, R., Kerkweg, A., Tost, H., and Lelieveld, J.: Technical Note: The Modular Earth Submodel System (MESSy) – a new approach towards Earth System Modeling, Atmos. Chem. Phys., 5, 433–444, https://doi.org/10.5194/acp-5-433-2005, 2005. a
Jöckel, P., Tost, H., Pozzer, A., Brühl, C., Buchholz, J., Ganzeveld, L., Hoor, P., Kerkweg, A., Lawrence, M. G., Sander, R., Steil, B., Stiller, G., Tanarhte, M., Taraborrelli, D., van Aardenne, J., and Lelieveld, J.: The atmospheric chemistry general circulation model ECHAM5/MESSy1: consistent simulation of ozone from the surface to the mesosphere, Atmos. Chem. Phys., 6, 5067–5104, https://doi.org/10.5194/acp-6-5067-2006, 2006. a, b, c
Jöckel, P., Kerkweg, A., Pozzer, A., Sander, R., Tost, H., Riede, H., Baumgaertner, A., Gromov, S., and Kern, B.: Development cycle 2 of the Modular Earth Submodel System (MESSy2), Geosci. Model Dev., 3, 717–752, https://doi.org/10.5194/gmd-3-717-2010, 2010. a, b, c, d
Joshi, M. M. and Jones, G. S.: The climatic effects of the direct injection of water vapour into the stratosphere by large volcanic eruptions, Atmos. Chem. Phys., 9, 6109–6118, https://doi.org/10.5194/acp-9-6109-2009, 2009. a, b, c
Karpechko, A. Y., Gillett, N. P., Dall'Amico, M., and Gray, L. J.: Southern Hemisphere atmospheric circulation response to the El Chichon and Pinatubo eruptions in coupled climate models, Q. J. Roy. Meteor. Soc., 136, 1813–1822, https://doi.org/10.1002/qj.683, 2010. a
Kerkweg, A., Buchholz, J., Ganzeveld, L., Pozzer, A., Tost, H., and Jöckel, P.: Technical Note: An implementation of the dry removal processes DRY DEPosition and SEDImentation in the Modular Earth Submodel System (MESSy), Atmos. Chem. Phys., 6, 4617–4632, https://doi.org/10.5194/acp-6-4617-2006, 2006a. a, b, c
Kerkweg, A., Sander, R., Tost, H., and Jöckel, P.: Technical note: Implementation of prescribed (OFFLEM), calculated (ONLEM), and pseudo-emissions (TNUDGE) of chemical species in the Modular Earth Submodel System (MESSy), Atmos. Chem. Phys., 6, 3603–3609, https://doi.org/10.5194/acp-6-3603-2006, 2006b. a, b, c, d
Kilian, M., Brinkop, S., and Jöckel, P.: Impact of the eruption of Mt Pinatubo on the chemical composition of the stratosphere, Atmos. Chem. Phys., 20, 11697–11715, https://doi.org/10.5194/acp-20-11697-2020, 2020. a, b
Kinnison, D. E., Grant, K. E., Connell, P. S., Rotman, D. A., and Wuebbles, D. J.: The chemical and radiative effects of the Mount Pinatubo eruption, J. Geophys. Res.-Atmos., 99, 25705–25731, https://doi.org/10.1029/94JD02318, 1994. a
Kirchner, I., Stenchikov, G. L., Graf, H.-F., Robock, A., and Antuña, J. C.: Climate model simulation of winter warming and summer cooling following the 1991 Mount Pinatubo volcanic eruption, J. Geophys. Res.-Atmos., 104, 19039–19055, https://doi.org/10.1029/1999JD900213, 1999. a, b, c
Klingmüller, K., Steil, B., Brühl, C., Tost, H., and Lelieveld, J.: Sensitivity of aerosol radiative effects to different mixing assumptions in the AEROPT 1.0 submodel of the EMAC atmospheric-chemistry–climate model, Geosci. Model Dev., 7, 2503–2516, https://doi.org/10.5194/gmd-7-2503-2014, 2014. a, b
Klingmüller, K., Lelieveld, J., Karydis, V. A., and Stenchikov, G. L.: Direct radiative effect of dust–pollution interactions, Atmos. Chem. Phys., 19, 7397–7408, https://doi.org/10.5194/acp-19-7397-2019, 2019. a
Klingmüller, K., Karydis, V. A., Bacer, S., Stenchikov, G. L., and Lelieveld, J.: Weaker cooling by aerosols due to dust–pollution interactions, Atmos. Chem. Phys., 20, 15285–15295, https://doi.org/10.5194/acp-20-15285-2020, 2020. a
Kodera, K. and Kuroda, Y.: Tropospheric and stratospheric aspects of the Arctic oscillation, Geophys. Res. Lett., 27, 3349–3352, https://doi.org/10.1029/2000GL012017, 2000. a
Kremser, S., Thomason, L. W., von Hobe, M., Hermann, M., Deshler, T., Timmreck, C., Toohey, M., Stenke, A., Schwarz, J. P., Weigel, R., Fueglistaler, S., Prata, F. J., Vernier, J.-P., Schlager, H., Barnes, J. E., Antuña-Marrero, J.-C., Fairlie, D., Palm, M., Mahieu, E., Notholt, J., Rex, M., Bingen, C., Vanhellemont, F., Bourassa, A., Plane, J. M. C., Klocke, D., Carn, S. A., Clarisse, L., Trickl, T., Neely, R., James, A. D., Rieger, L., Wilson, J. C., and Meland, B.: Stratospheric aerosol-Observations, processes, and impact on climate: Stratospheric Aerosol, Rev. Geophys., 54, 278–335, https://doi.org/10.1002/2015RG000511, 2016. a, b, c
Krueger, A. J., Walter, L. S., Bhartia, P. K., Schnetzler, C. C., Krotkov, N. A., Sprod, I., and Bluth, G. J. S.: Volcanic sulfur dioxide measurements from the total ozone mapping spectrometer instruments, J. Geophys. Res.-Atmos., 100, 14057–14076, https://doi.org/10.1029/95JD01222, 1995. a, b
Labitzke, K. and McCormick, M. P.: Stratospheric temperature increases due to Pinatubo aerosols, Geophys. Res. Lett., 19, 207–210, https://doi.org/10.1029/91GL02940, 1992. a, b, c
Landgraf, J. and Crutzen, P. J.: An Efficient Method for Online Calculations of Photolysis and Heating Rates, J. Atmos. Sci., 55, 863–878, https://doi.org/10.1175/1520-0469(1998)055<0863:AEMFOC>2.0.CO;2, 1998. a, b
LeGrande, A. N., Tsigaridis, K., and Bauer, S. E.: Role of atmospheric chemistry in the climate impacts of stratospheric volcanic injections, Nat. Geosci., 9, 652–655, https://doi.org/10.1038/ngeo2771, 2016. a, b, c, d, e, f
Löffler, M., Brinkop, S., and Jöckel, P.: Impact of major volcanic eruptions on stratospheric water vapour, Atmos. Chem. Phys., 16, 6547–6562, https://doi.org/10.5194/acp-16-6547-2016, 2016. a
Long, C. S. and Stowe, L. L.: using the NOAA/AVHRR to study stratospheric aerosol optical thicknesses following the Mt. Pinatubo Eruption, Geophys. Res. Lett., 21, 2215–2218, https://doi.org/10.1029/94GL01322, 1994. a, b
Lovejoy, E. R., Hanson, D. R., and Huey, L. G.: Kinetics and Products of the Gas-Phase Reaction of SO3 with Water, J. Phys. Chem., 100, 19911–19916, https://doi.org/10.1021/jp962414d, 1996. a
Mao, J. and Robock, A.: Surface Air Temperature Simulations by AMIP General Circulation Models: Volcanic and ENSO Signals and Systematic Errors, J. Climate, 11, 1538–1552, https://doi.org/10.1175/1520-0442(1998)011<1538:SATSBA>2.0.CO;2, 1998. a
Marandino, C. A., Tegtmeier, S., Krüger, K., Zindler, C., Atlas, E. L., Moore, F., and Bange, H. W.: Dimethylsulphide (DMS) emissions from the western Pacific Ocean: a potential marine source for stratospheric sulphur?, Atmos. Chem. Phys., 13, 8427–8437, https://doi.org/10.5194/acp-13-8427-2013, 2013. a
Marshall, L., Schmidt, A., Toohey, M., Carslaw, K. S., Mann, G. W., Sigl, M., Khodri, M., Timmreck, C., Zanchettin, D., Ball, W. T., Bekki, S., Brooke, J. S. A., Dhomse, S., Johnson, C., Lamarque, J.-F., LeGrande, A. N., Mills, M. J., Niemeier, U., Pope, J. O., Poulain, V., Robock, A., Rozanov, E., Stenke, A., Sukhodolov, T., Tilmes, S., Tsigaridis, K., and Tummon, F.: Multi-model comparison of the volcanic sulfate deposition from the 1815 eruption of Mt. Tambora, Atmos. Chem. Phys., 18, 2307–2328, https://doi.org/10.5194/acp-18-2307-2018, 2018. a
McCormick, M. P.: Sage II: An overview, Adv. Space Res., 7, 219–226, https://doi.org/10.1016/0273-1177(87)90151-7, 1987. a
McCormick, M. P., Thomason, L. W., and Trepte, C. R.: Atmospheric effects of the Mt Pinatubo eruption, Nature, 373, 399, https://doi.org/10.1038/373399a0, 1995. a
Metzger, S., Steil, B., Abdelkader, M., Klingmüller, K., Xu, L., Penner, J. E., Fountoukis, C., Nenes, A., and Lelieveld, J.: Aerosol water parameterisation: a single parameter framework, Atmos. Chem. Phys., 16, 7213–7237, https://doi.org/10.5194/acp-16-7213-2016, 2016. a
Mills, M. J., Schmidt, A., Easter, R., Solomon, S., Kinnison, D. E., Ghan, S. J., Neely, R. R., Marsh, D. R., Conley, A., Bardeen, C. G., and Gettelman, A.: Global volcanic aerosol properties derived from emissions, 1990–2014, using CESM1(WACCM), J. Geophys. Res.-Atmos., 121, 2015JD024290, https://doi.org/10.1002/2015JD024290, 2016. a, b
Mills, M. J., Richter, J. H., Tilmes, S., Kravitz, B., MacMartin, D. G., Glanville, A. A., Tribbia, J. J., Lamarque, J.-F., Vitt, F., Schmidt, A., Gettelman, A., Hannay, C., Bacmeister, J. T., and Kinnison, D. E.: Radiative and Chemical Response to Interactive Stratospheric Sulfate Aerosols in Fully Coupled CESM1(WACCM), J. Geophys. Res.-Atmos., 122, 13061–13078, https://doi.org/10.1002/2017JD027006, 2017.
Muser, L. O., Hoshyaripour, G. A., Bruckert, J., Horváth, Á., Malinina, E., Wallis, S., Prata, F. J., Rozanov, A., von Savigny, C., Vogel, H., and Vogel, B.: Particle aging and aerosol–radiation interaction affect volcanic plume dispersion: evidence from the Raikoke 2019 eruption, Atmos. Chem. Phys., 20, 15015–15036, https://doi.org/10.5194/acp-20-15015-2020, 2020. a, b, c
Muthers, S., Arfeuille, F., Raible, C. C., and Rozanov, E.: The impacts of volcanic aerosol on stratospheric ozone and the Northern Hemisphere polar vortex: separating radiative-dynamical changes from direct effects due to enhanced aerosol heterogeneous chemistry, Atmos. Chem. Phys., 15, 11461–11476, https://doi.org/10.5194/acp-15-11461-2015, 2015. a
Nagai, T., Liley, B., Sakai, T., Shibata, T., and Uchino, O.: Post-Pinatubo Evolution and Subsequent Trend of the Stratospheric Aerosol Layer Observed by Mid-Latitude Lidars in Both Hemispheres, Sola, 6, 69–72, https://doi.org/10.2151/sola.2010-018, 2010. a
Nedoluha, G. E., Bevilacqua, R. M., Gomez, R. M., Siskind, D. E., Hicks, B. C., Russell, J. M., and Connor, B. J.: Increases in middle atmospheric water vapor as observed by the Halogen Occultation Experiment and the ground-based Water Vapor Millimeter-Wave Spectrometer from 1991 to 1997, J. Geophys. Res.-Atmos., 103, 3531–3543, https://doi.org/10.1029/97JD03282, 1998. a, b, c
Niemeier, U., Timmreck, C., Graf, H.-F., Kinne, S., Rast, S., and Self, S.: Initial fate of fine ash and sulfur from large volcanic eruptions, Atmos. Chem. Phys., 9, 9043–9057, https://doi.org/10.5194/acp-9-9043-2009, 2009. a, b, c, d, e
Niemeier, U., Riede, F., and Timmreck, C.: Simulation of ash clouds after a Laacher See-type eruption, Clim. Past, 17, 633–652, https://doi.org/10.5194/cp-17-633-2021, 2021. a, b
Oltmans, S. J. and Hofmann, D. J.: Increase in lower-stratospheric water vapour at a mid-latitude Northern Hemisphere site from 1981 to 1994, Nature, 374, 146–149, https://doi.org/10.1038/374146a0, 1995. a
Oman, L., Robock, A., Stenchikov, G. L., Thordarson, T., Koch, D., Shindell, D. T., and Gao, C.: Modeling the distribution of the volcanic aerosol cloud from the 1783–1784 Laki eruption, J. Geophys. Res.-Atmos., 111, D12209, https://doi.org/10.1029/2005JD006899, 2006. a
Osipov, S., Stenchikov, G., Tsigaridis, K., LeGrande, A. N., and Bauer, S. E.: The Role of the SO Radiative Effect in Sustaining the Volcanic Winter and Soothing the Toba Impact on Climate, J. Geophys. Res.-Atmos., 125, e2019JD031726, https://doi.org/10.1029/2019JD031726, 2020. a
Osipov, S., Stenchikov, G., Tsigaridis, K., LeGrande, A. N., Bauer, S. E., Fnais, M., and Lelieveld, J.: The Toba supervolcano eruption caused severe tropical stratospheric ozone depletion, Communications Earth & Environment, 2, 71, https://doi.org/10.1038/s43247-021-00141-7, 2021. a
Poberaj, C. S., Staehelin, J., and Brunner, D.: Missing Stratospheric Ozone Decrease at Southern Hemisphere Middle Latitudes after Mt. Pinatubo: A Dynamical Perspective, J. Atmos. Sci., 68, 1922–1945, https://doi.org/10.1175/JAS-D-10-05004.1, 2011. a
Pollack, J. B., Toon, O. B., and Khare, B. N.: Optical properties of some terrestrial rocks and glasses, Icarus, 19, 372–389, https://doi.org/10.1016/0019-1035(73)90115-2, 1973. a
Polvani, L. M., Banerjee, A., and Schmidt, A.: Northern Hemisphere continental winter warming following the 1991 Mt. Pinatubo eruption: reconciling models and observations, Atmos. Chem. Phys., 19, 6351–6366, https://doi.org/10.5194/acp-19-6351-2019, 2019. a
Pozzer, A., Jöckel, P., Sander, R., Williams, J., Ganzeveld, L., and Lelieveld, J.: Technical Note: The MESSy-submodel AIRSEA calculating the air-sea exchange of chemical species, Atmos. Chem. Phys., 6, 5435–5444, https://doi.org/10.5194/acp-6-5435-2006, 2006. a
Pozzer, A., de Meij, A., Pringle, K. J., Tost, H., Doering, U. M., van Aardenne, J., and Lelieveld, J.: Distributions and regional budgets of aerosols and their precursors simulated with the EMAC chemistry-climate model, Atmos. Chem. Phys., 12, 961–987, https://doi.org/10.5194/acp-12-961-2012, 2012. a
Prather, M.: Catastrophic loss of stratospheric ozone in dense volcanic clouds, J. Geophys. Res.-Atmos., 97, 10187–10191, https://doi.org/10.1029/92JD00845, 1992. a
Predybaylo, E., Stenchikov, G. L., Wittenberg, A. T., and Zeng, F.: Impacts of a Pinatubo-size volcanic eruption on ENSO: VOLCANIC IMPACTS ON ENSO, J. Geophys. Res.-Atmos., 122, 925–947, https://doi.org/10.1002/2016JD025796, 2017. a
Pringle, K. J., Tost, H., Message, S., Steil, B., Giannadaki, D., Nenes, A., Fountoukis, C., Stier, P., Vignati, E., and Lelieveld, J.: Description and evaluation of GMXe: a new aerosol submodel for global simulations (v1), Geosci. Model Dev., 3, 391–412, https://doi.org/10.5194/gmd-3-391-2010, 2010. a, b, c
Pueschel, R. F., Russell, P. B., Allen, D. A., Ferry, G. V., Snetsinger, K. G., Livingston, J. M., and Verma, S.: Physical and optical properties of the Pinatubo volcanic aerosol: Aircraft observations with impactors and a Sun-tracking photometer, J. Geophys. Res.-Atmos., 99, 12915–12922, https://doi.org/10.1029/94JD00621, 1994. a, b
Ramachandran, S., Ramaswamy, V., Stenchikov, G. L., and Robock, A.: Radiative impact of the Mount Pinatubo volcanic eruption: Lower stratospheric response, J. Geophys. Res.-Atmos., 105, 24409–24429, https://doi.org/10.1029/2000JD900355, 2000. a
Rinsland, C. P., Gunson, M. R., Ko, M. K. W., Weisenstein, D. W., Zander, R., Abrams, M. C., Goldman, A., Sze, N. D., and Yue, G. K.: H2SO4 photolysis: A source of sulfur dioxide in the upper stratosphere, Geophys. Res. Lett., 22, 1109–1112, https://doi.org/10.1029/95GL00917, 1995. a, b
Robock, A.: Volcanic eruptions and climate, Rev. Geophys., 38, 191–219, https://doi.org/10.1029/1998RG000054, 2000. a, b
Roeckner, E., Bäuml, G., Bonaventura, L., Brokopf, R., Esch, M., Giorgetta, M., Hagemann, S., Kirchner, I., Kornblueh, L., Manzini, E., Rhodin, A., Schlese, U., Schulzweida, U., and Tompkins, A.: The atmospheric general circulation model ECHAM5. Part I: Model description. Max Planck Institute for Meteorology, Tech. Rep. 349, MPI for Meteorology, Hamburg, Germany, https://pure.mpg.de/rest/items/item_995269_6/component/file_3192562/content (last access: 12 December 2022), 2003. a
Roeckner, E., Brokopf, R., Esch, M., Giorgetta, M., Hagemann, S., Kornblueh, L., Manzini, E., Schlese, U., and Schulzweida, U.: Sensitivity of Simulated Climate to Horizontal and Vertical Resolution in the ECHAM5 Atmosphere Model, J. Climate, 19, 3771–3791, https://doi.org/10.1175/JCLI3824.1, 2006. a, b, c
Rose, W. I. and Durant, A. J.: Fine ash content of explosive eruptions, J. Volcanol. Geoth. Res., 186, 32–39, https://doi.org/10.1016/j.jvolgeores.2009.01.010, 2009. a
Rose, W. I., Millard, G. A., Mather, T. A., Hunton, D. E., Anderson, B., Oppenheimer, C., Thornton, B. F., Gerlach, T. M., Viggiano, A. A., Kondo, Y., Miller, T. M., and Ballenthin, J. O.: Atmospheric chemistry of a 33–34 hour old volcanic cloud from Hekla Volcano (Iceland): Insights from direct sampling and the application of chemical box modeling, J. Geophys. Res.-Atmos., 111, D20206, https://doi.org/10.1029/2005JD006872, 2006. a
Russell, P. B., Livingston, J. M., Dutton, E. G., Pueschel, R. F., Reagan, J. A., DeFoor, T. E., Box, M. A., Allen, D., Pilewskie, P., Herman, B. M., Kinne, S. A., and Hofmann, D. J.: Pinatubo and pre-Pinatubo optical-depth spectra: Mauna Loa measurements, comparisons, inferred particle size distributions, radiative effects, and relationship to lidar data, J. Geophys. Res.-Atmos., 98, 22969–22985, https://doi.org/10.1029/93JD02308, 1993. a
Russell, P. B., Livingston, J. M., Pueschel, R. F., Bauman, J. J., Pollack, J. B., Brooks, S. L., Hamill, P., Thomason, L. W., Stowe, L. L., Deshler, T., Dutton, E. G., and Bergstrom, R. W.: Global to microscale evolution of the Pinatubo volcanic aerosol derived from diverse measurements and analyses, J. Geophys. Res.-Atmos., 101, 18745–18763, https://doi.org/10.1029/96JD01162, 1996. a, b, c
Sander, R., Kerkweg, A., Jöckel, P., and Lelieveld, J.: Technical note: The new comprehensive atmospheric chemistry module MECCA, Atmos. Chem. Phys., 5, 445–450, https://doi.org/10.5194/acp-5-445-2005, 2005. a
Sander, R., Baumgaertner, A., Gromov, S., Harder, H., Jöckel, P., Kerkweg, A., Kubistin, D., Regelin, E., Riede, H., Sandu, A., Taraborrelli, D., Tost, H., and Xie, Z.-Q.: The atmospheric chemistry box model CAABA/MECCA-3.0, Geosci. Model Dev., 4, 373–380, https://doi.org/10.5194/gmd-4-373-2011, 2011. a, b, c
Sander, R., Jöckel, P., Kirner, O., Kunert, A. T., Landgraf, J., and Pozzer, A.: The photolysis module JVAL-14, compatible with the MESSy standard, and the JVal PreProcessor (JVPP), Geosci. Model Dev., 7, 2653–2662, https://doi.org/10.5194/gmd-7-2653-2014, 2014. a
Sander, R., Baumgaertner, A., Cabrera-Perez, D., Frank, F., Gromov, S., Grooß, J.-U., Harder, H., Huijnen, V., Jöckel, P., Karydis, V. A., Niemeyer, K. E., Pozzer, A., Riede, H., Schultz, M. G., Taraborrelli, D., and Tauer, S.: The community atmospheric chemistry box model CAABA/MECCA-4.0, Geosci. Model Dev., 12, 1365–1385, https://doi.org/10.5194/gmd-12-1365-2019, 2019. a, b
Seinfeld, J. H. and Pandis, S. N.: Atmospheric chemistry and physics: from air pollution to climate change, J. Wiley, Hoboken, NJ, ISBN 978-0-471-72018-8, 2006. a, b, c, d
Sheng, J.-X., Weisenstein, D. K., Luo, B.-P., Rozanov, E., Arfeuille, F., and Peter, T.: A perturbed parameter model ensemble to investigate Mt. Pinatubo's 1991 initial sulfur mass emission, Atmos. Chem. Phys., 15, 11501–11512, https://doi.org/10.5194/acp-15-11501-2015, 2015. a, b, c, d
Shindell, D. T.: Dynamic winter climate response to large tropical volcanic eruptions since 1600, J. Geophys. Research, 109, D05104, https://doi.org/10.1029/2003JD004151, 2004. a
Shindell, D. T., Schmidt, G. A., Miller, R. L., and Rind, D.: Northern hemisphere winter climate response to greenhouse gas, ozone, solar, and volcanic forcing, J. Geophys. Res.-Atmos., 106, 7193–7210, https://doi.org/10.1029/2000JD900547, 2001. a
Soden, B. J.: Global Cooling After the Eruption of Mount Pinatubo: A Test of Climate Feedback by Water Vapor, Science, 296, 727–730, https://doi.org/10.1126/science.296.5568.727, 2002. a
Stenchikov, G.: Arctic Oscillation response to the 1991 Mount Pinatubo eruption: Effects of volcanic aerosols and ozone depletion, J. Geophys. Research, 107, 4803, https://doi.org/10.1029/2002JD002090, 2002. a
Stenchikov, G.: The role of volcanic activity in climate and global changes, in: Climate Change, edited by: Letcher, T. M., Elsevier, https://doi.org/10.1016/B978-0-12-821575-3.00029-3, pp. 607–643, 2021. a, b, c, d
Stenchikov, G., Kirchner, I., Robock, A., Graf, H.-F., Antuña, J. C., Grainger, R. G., Lambert, A., and Thomason, L.: Radiative forcing from the 1991 Mount Pinatubo volcanic eruption, J. Geophys. Res.-Atmos., 103, 13837–13857, https://doi.org/10.1029/98JD00693, 1998. a, b, c, d, e, f
Stenchikov, G., Hamilton, K., Robock, A., Ramaswamy, V., and Schwarzkopf, M. D.: Arctic oscillation response to the 1991 Pinatubo eruption in the SKYHI general circulation model with a realistic quasi-biennial oscillation, J. Geophys. Res.-Atmos., 109, D03112, https://doi.org/10.1029/2003JD003699, 2004. a, b
Stenchikov, G., Hamilton, K., Stouffer, R. J., Robock, A., Ramaswamy, V., Santer, B., and Graf, H.-F.: Arctic Oscillation response to volcanic eruptions in the IPCC AR4 climate models, J. Geophys. Research, 111, D07107, https://doi.org/10.1029/2005JD006286, 2006. a, b
Stenchikov, G., Ukhov, A., Osipov, S., Ahmadov, R., Grell, G., Cady-Pereira, K., Mlawer, E., and Iacono, M.: How does a Pinatubo-size Volcanic Cloud Reach the Middle Stratosphere?, J. Geophys. Res.-Atmos., 126, e2020JD033829, https://doi.org/10.1029/2020JD033829, 2021. a, b, c, d, e, f, g, h, i, j, k, l, m, n, o, p
Sukhodolov, T., Sheng, J.-X., Feinberg, A., Luo, B.-P., Peter, T., Revell, L., Stenke, A., Weisenstein, D. K., and Rozanov, E.: Stratospheric aerosol evolution after Pinatubo simulated with a coupled size-resolved aerosol–chemistry–climate model, SOCOL-AERv1.0, Geosci. Model Dev., 11, 2633–2647, https://doi.org/10.5194/gmd-11-2633-2018, 2018. a
Taylor, K., Williamson, D., and Zwiers, F.: The Sea Surface Temperature And Sea-Ice Concentration Boundary Conditions For AMIP II Simulations, Tech. Rep. 60, National Center for Atmospheric Research, Boulder, CO, USA, 2000. a
Thomas, M. A., Giorgetta, M. A., Timmreck, C., Graf, H.-F., and Stenchikov, G.: Simulation of the climate impact of Mt. Pinatubo eruption using ECHAM5-Part 2: Sensitivity to the phase of the QBO and ENSO, Atmospheric Chemistry and Physics, 9, 3001–3009, 2009. a
Thomason, L. W.: Observations of a new SAGE II aerosol extinction mode following the eruption of Mt. Pinatubo, Geophys. Res. Lett., 19, 2179–2182, https://doi.org/10.1029/92GL02185, 1992. a, b, c, d
Thomason, L. W. and Peter, T.: SPARC Assessment of Stratospheric Aerosol Properties (ASAP), Tech. rep., SPARC Office, http://www.sparc-climate.org/publications/sparc-reports/ (last access: 12 December 2022), 2006. a, b
Thomason, L. W., Poole, L. R., and Deshler, T.: A global climatology of stratospheric aerosol surface area density deduced from Stratospheric Aerosol and Gas Experiment II measurements: 1984–1994, J. Geophys. Res.-Atmos., 102, 8967–8976, https://doi.org/10.1029/96JD02962, 1997. a
Timmreck, C., Mann, G. W., Aquila, V., Hommel, R., Lee, L. A., Schmidt, A., Brühl, C., Carn, S., Chin, M., Dhomse, S. S., Diehl, T., English, J. M., Mills, M. J., Neely, R., Sheng, J., Toohey, M., and Weisenstein, D.: The Interactive Stratospheric Aerosol Model Intercomparison Project (ISA-MIP): motivation and experimental design, Geosci. Model Dev., 11, 2581–2608, https://doi.org/10.5194/gmd-11-2581-2018, 2018. a
Toohey, M., Krüger, K., Bittner, M., Timmreck, C., and Schmidt, H.: The impact of volcanic aerosol on the Northern Hemisphere stratospheric polar vortex: mechanisms and sensitivity to forcing structure, Atmos. Chem. Phys., 14, 13063–13079, https://doi.org/10.5194/acp-14-13063-2014, 2014. a
Tost, H., Jöckel, P., Kerkweg, A., Sander, R., and Lelieveld, J.: Technical note: A new comprehensive SCAVenging submodel for global atmospheric chemistry modelling, Atmos. Chem. Phys., 6, 565–574, https://doi.org/10.5194/acp-6-565-2006, 2006a. a, b
Tost, H., Jöckel, P., and Lelieveld, J.: Influence of different convection parameterisations in a GCM, Atmos. Chem. Phys., 6, 5475–5493, https://doi.org/10.5194/acp-6-5475-2006, 2006b. a, b
Tost, H., Jöckel, P., and Lelieveld, J.: Lightning and convection parameterisations – uncertainties in global modelling, Atmos. Chem. Phys., 7, 4553–4568, https://doi.org/10.5194/acp-7-4553-2007, 2007. a
Tost, H., Lawrence, M. G., Brühl, C., Jöckel, P., The GABRIEL Team, and The SCOUT-O3-DARWIN/ACTIVE Team: Uncertainties in atmospheric chemistry modelling due to convection parameterisations and subsequent scavenging, Atmos. Chem. Phys., 10, 1931–1951, https://doi.org/10.5194/acp-10-1931-2010, 2010. a, b
van der Werf, G. R., Randerson, J. T., Giglio, L., Collatz, G. J., Mu, M., Kasibhatla, P. S., Morton, D. C., DeFries, R. S., Jin, Y., and van Leeuwen, T. T.: Global fire emissions and the contribution of deforestation, savanna, forest, agricultural, and peat fires (1997–2009), Atmos. Chem. Phys., 10, 11707–11735, https://doi.org/10.5194/acp-10-11707-2010, 2010. a
Vernier, J.-P., Fairlie, T. D., Deshler, T., Natarajan, M., Knepp, T., Foster, K., Wienhold, F. G., Bedka, K. M., Thomason, L., and Trepte, C.: In situ and space-based observations of the Kelud volcanic plume: The persistence of ash in the lower stratosphere, J. Geophys. Res.-Atmos., 121, 11104–11118, https://doi.org/10.1002/2016JD025344, 2016. a
Vogel, A., Diplas, S., Durant, A. J., Azar, A. S., Sunding, M. F., Rose, W. I., Sytchkova, A., Bonadonna, C., Krüger, K., and Stohl, A.: Reference data set of volcanic ash physicochemical and optical properties, J. Geophys. Res.-Atmos., 122, 9485–9514, https://doi.org/10.1002/2016JD026328, 2017. a
Walcek, C. J.: Minor flux adjustment near mixing ratio extremes for simplified yet highly accurate monotonic calculation of tracer advection, J. Geophys. Res.-Atmos., 105, 9335–9348, https://doi.org/10.1029/1999JD901142, 2000. a
Yu, T. and Rose, W. I.: Retrieval of Sulfate and Silicate Ash Masses in Young (1 to 4 Days Old) Eruption Clouds Using Multiband Infrared HIRS/2 Data, in: Remote Sensing of Active Volcanism, edited by: Mouginis-Mark, P. J., Crisp, J. A., and Fink, J. H., American Geophysical Union (AGU), Washington D. C., https://doi.org/10.1029/GM116p0087, 87–100, 2000. a
Zanchettin, D., Khodri, M., Timmreck, C., Toohey, M., Schmidt, A., Gerber, E. P., Hegerl, G., Robock, A., Pausata, F. S. R., Ball, W. T., Bauer, S. E., Bekki, S., Dhomse, S. S., LeGrande, A. N., Mann, G. W., Marshall, L., Mills, M., Marchand, M., Niemeier, U., Poulain, V., Rozanov, E., Rubino, A., Stenke, A., Tsigaridis, K., and Tummon, F.: The Model Intercomparison Project on the climatic response to Volcanic forcing (VolMIP): experimental design and forcing input data for CMIP6, Geosci. Model Dev., 9, 2701–2719, https://doi.org/10.5194/gmd-9-2701-2016, 2016. a
Zhu, Y., Toon, O. B., Jensen, E. J., Bardeen, C. G., Mills, M. J., Tolbert, M. A., Yu, P., and Woods, S.: Persisting volcanic ash particles impact stratospheric SO2 lifetime and aerosol optical properties, Nat. Commun., 11, 4526, https://doi.org/10.1038/s41467-020-18352-5, 2020. a, b, c, d, e, f