the Creative Commons Attribution 4.0 License.
the Creative Commons Attribution 4.0 License.
 | 20 Apr 2023
Measurement report: Rapid changes of chemical characteristics and health risks for highly time resolved trace elements in PM2.5 in a typical industrial city in response to stringent clean air actions
Rui Li
Yining Gao
Yubao Chen
Meng Peng
Weidong Zhao
Gehui Wang
Jiming Hao
Atmospheric trace metals entail significant damages in human health and ecosystem safety, and thus a series of clean air actions have been implemented to decrease the ambient element concentrations. Unfortunately, the impact of these emission control measures on element concentrations in fine particles remains poorly understood. In our study, the random forest (RF) model was applied to distinguish the effects of emission and meteorology to trace elements in PM2.5 in a typical industrial city named Tangshan based on a 3-year (2017–2020) hourly field observation. The result suggested that the clean air actions have facilitated the dramatic decreases of the deweathered concentrations of Ga, Co, Pb, Zn, and As by 72 %, 67 %, 62 %, 59 %, and 54 %, respectively. It is attributable to the strict implementation of “coal to gas” strategies and optimisation of industrial structure and layout. However, the deweathered levels of Ca (8.3 %), Cr (18.5 %), and Fe (23 %) only displayed minor decreases, indicating that the emission control measures for ferrous metal smelting and vehicle emission were not very effective. The positive matrix factorisation (PMF) results suggested that the contribution ratios of biomass burning, non-ferrous metal smelting, coal combustion, ferrous metal smelting, heavy oil combustion, and traffic-related dust changed from 33 %, 11 %, 15 %, 13 %, 3 %, and 25 % to 33 %, 8 %, 8 %, 13 %, 4 %, and 33 %, respectively. To date, no significant non-carcinogenic and carcinogenic risks were observed for all of the elements, while both of As and Pb still showed relatively high health damages. It was proposed to further cut down the combustion-related emissions (e.g. As and Pb) because it showed the highest marginal health benefits. Besides this, the control of traffic-related emissions might be a key abatement strategy to facilitate the reduction of elements in fine particles.
- Article
(2647 KB) - Full-text XML
-
Supplement
(2720 KB) - BibTeX
- EndNote


Along with rapid economic development and accelerated urbanisation, the energy consumption and output of various industrial products worldwide displayed persistent increases, thereby leading to massive emissions of elements especially trace metals into the atmosphere (Tian et al., 2015; Zhu et al., 2020). These elements injected into the atmosphere could pose great threat to the terrestrial and aquatic ecosystem via dry/wet deposition and then endanger human health through the physicochemical transfer and bioaccumulation in food chains (Fernandez et al., 2000; Harmens et al., 2010; Storelli, 2008). For instance, some toxic trace metals including cadmium (Cd), lead (Pb), and mercury (Hg) were often regarded as human carcinogens even in trace amounts (Micheline et al., 2019; Olujimi et al., 2015). Besides this, the excessive accumulation of some biological essential elements such as copper (Cu), iron (Fe), and zinc (Zn) could initiate activation of inflammatory cascades in tissues and the induction of biochemical synthesis pathways by catalysing the generation of reactive oxygen species (ROS) (Alies et al., 2013; Lopez-Cruz et al., 2016; Saffari et al., 2014), though minor enrichment of these elements was beneficial to human health and plant growth (Oldani et al., 2017). Apart from the health impacts, some transition metals (e.g. Ni and Zn) could catalyse some chemical reactions such as particle-phase sulfate generation and heterogeneous production and removal of gas-phase hydrogen oxide radicals (HOx) to aggravate haze formation (Clements et al., 2013; Guo et al., 2014). Therefore, it is highly imperative to recognise the pollution status of elements in the atmosphere, to identify the major sources, and then to propose effective control measures to alleviate their negative effects on air pollution and human health especially in some developing countries.
In the past decades, hundreds of studies investigated the pollution levels of elements and revealed their sources in various study regions including urban (Das et al., 2018; Duan and Tan, 2013; Lyu et al., 2017; Grivas et al., 2018; Clements et al., 2014), marine (Shi et al., 2015; Witt et al., 2006), and mountainous (Kang et al., 2016) areas. Most of these studies used filter sampling (one sample or two samples each day) coupled with offline analysis using inductively coupled plasma mass spectrometry (ICP-MS) or inductively coupled plasma-atomic emission spectrometry (ICP-AES) to determine the element concentrations in the atmosphere (Ao et al., 2019; Lin et al., 2016). Although these studies have obtained much valuable information about the occurrence levels and key sources of ambient elements, the low-time-resolution data cannot accurately reflect the dynamic transformation and evolution of ambient elements. It was well-known that atmospheric emissions, transport, and deposition significantly relied on rapidly evolving meteorological conditions (Holden et al., 2016; Rasmussen, 1998), and thus the offline samples inevitably ignored the impacts of environmental shifts with rapid temporality on the atmospheric element concentrations. Moreover, most of current source apportionment studies employed receptor models (positive matrix factorisation; PMF) to determine the potential sources of elements (Jeong et al., 2016; Lyu et al., 2017), and the accuracy of these models was strongly dependent on the sample size and time resolution (R. Liu et al., 2018). In this regard, the highly time resolved observation of atmospheric elements provided an unprecedented opportunity to characterise the occurrence levels, identify their major sources, and assess the health impacts.
To date, only a few studies applied the high-resolution devices to capture the hourly variability of ambient elements. Prati et al. (2000) firstly used particle-induced X-ray emission (PIXE) measurements to measure hourly trace elements in Genoa in Italy. Following this work, D'Alessandro et al. (2003) and Dall'Osto et al. (2013) also employed the same technique to determine the trace metals in Italian towns and Barcelona, respectively. Later on, Jeong et al. (2016) used the Xact metals monitor to reveal the temporal variability of atmospheric elements in Toronto, Canada, in summer and winter during 2013–2014. Recently, the Xact metals monitor has begun to be employed in China due to the higher accuracy and convenience. Chang et al. (2018) firstly used the online multi-element analyser to achieve a 1-year near-real-time observation of ambient elements in China and found that traffic, non-ferrous metal smelting, and coal combustion were major sources of atmospheric trace metals. Afterwards, Cui et al. (2019) applied the analyser to monitor atmospheric elements during a full year and demonstrated that dust, industry, and biomass burning were the dominant sources of most trace elements in Beijing, accounting for 36 %, 10.7 %, and 27 % of total PM2.5 concentration, respectively. Up to date, continuous hourly element observation was only performed for less than 1 year in most of the previous studies, and the long-term temporal variability of absolute concentrations and key pollution sources of atmospheric elements cannot be fully revealed.
Since 2013, the Chinese government proposed a strict Air Pollution Prevention and Control Action Plan (the Action Plan; see page 2 of the Supplement) across China, and the emissions of multiple gaseous pollutants showed significant decreases (Ma et al., 2019; Li et al., 2021a). In turn, the absolute concentrations and health effects of air pollutants also experienced rapid changes due to these stringent control measures. Zhang et al. (2019) reported that the population-weighted annual mean PM2.5 concentration decreased from 62 to 42 µg m−3 during 2013–2017 and reduced PM2.5-attributable premature deaths by 0.4 million due to the impact of the Action Plan. Shortly after that, Geng et al. (2019) estimated that the population-weighted mean concentrations of SO, NO, and NH in PM2.5 decreased from 11.1, 13.8, and 7.4 µg m−3 to 6.7, 13.1, and 5.8 µg m−3, respectively, during the same period. Nevertheless, the impact of the Action Plan on trace elements in fine particles still remained poorly understood. In particular, the knowledge about the variation of source apportionment and health risks for trace elements response to the Action Plan was extremely limited. Moreover, most of the previous studies only utilised the original concentrations to analyse the impact of the clean air policy (He et al., 2021; Xiao et al., 2020). It was well-known that the pollutant concentrations in the atmosphere were affected by meteorology and anthropogenic emissions simultaneously (Li et al., 2021b), and the use of original element concentrations alone cannot assess the unique contribution of emission reduction to the air pollutants. Thus, it is urgently needed to remove the effect of meteorology and accurately capture the independent influence of the Action Plan on the chemical characteristics, source apportionment, and health risks of trace elements. Such knowledge is critical to design effective air pollution mitigation strategies in the near future.
As a heavily industrialised city located in the North China Plain (NCP), Tangshan possesses many energy-intensive industries including coal-fired power plants, non-ferrous smelting industries, textiles, building materials, chemical engineering, and paper-making industries (Ren et al., 2011). Intensifying industrial development and urbanisation aggravated local air quality. Previous studies performed in Tangshan focused on the trace metals in soils and dusts (Cui et al., 2020; Song, 2011), whereas no study analysed the long-term and high-resolution variabilities of atmospheric elements. Since 2013, many emission control measures such as the establishment of desulfurisation and denitration facilities for the coal-fired power sector have been strictly implemented in Tangshan (Ma et al., 2019). Especially after 2017, the coal to gas project has started to be implemented in Tangshan, and the energy structure underwent significant change (Wang et al., 2020). In response to substantial pollution control policies, the chemical compositions and major sources of trace elements might show corresponding change. Here, we conducted a near-real-time measurement of atmospheric elements in PM2.5 using an Xact multi-metals analyser in Tangshan, China, during September 2017 to August 2020. The primary objectives of our study were to (1) determine the occurrence levels of elements in PM2.5 of Tangshan, (2) to analyse the seasonal and intraweek variations of atmospheric elements and to distinguish the separate contributions of emission and meteorology to these species, (3) to quantify the changes of major sources for atmospheric elements during this period, and (4) to assess the changes of health risks in response to these pollution control measures.
2.1 Sampling site
The sampling site (39.66∘ N, 118.18∘ E) is situated on the rooftop (∼ 20 m above the ground) of a building in the urban district of Tangshan, and no high buildings are spread around within 100 m range. The sampling site is close to some major roads including the Airport Road, Huayan North Road, and Changhong Road. A large number of commercial streets and a recreation facility surround the site. Although no big industrial point source was closely adjacent to the sampling site, many potential pollution sources were located more than 15 km away from the site. For instance, the Beihu industrial region is located about 15 km in the eastern direction of the site. Some large iron steel industries and non-ferrous/ferrous smelting industries were located on the north of sampling site (more than 30 km). Besides this, most of the large petrochemical industries, coal-fired power plants, and shipping industries focus on the Caofeidian and Haigang developing zones, both of which were located about 50 km in the south area of the sampling site. The detailed location is depicted in Fig. 1.
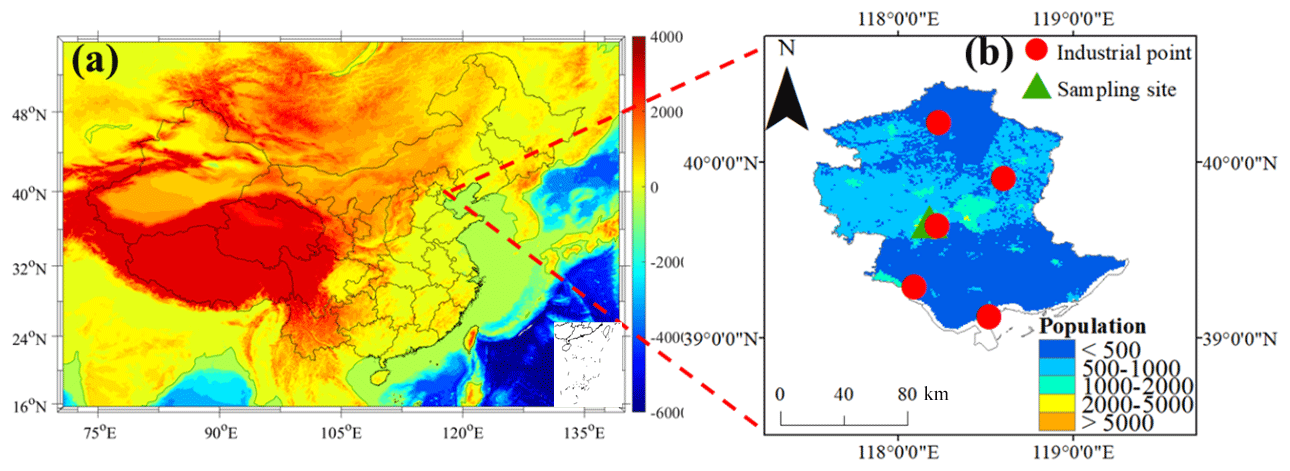
Figure 1Topographic map of China indicating the location of Tangshan (a), the sampling site (b), and some major industrial points (b). The population distribution of Tangshan is also depicted in (b).
2.2 Instrumentation
Hourly mass concentrations of 22 elements, including Ag, As, Au, Ca, Co, Cu, Cd, Cr, Fe, Ga, Hg, K, Mn, Ni, Pb, Pd, Sb, Se, Sn, Tl, V, and Zn in PM2.5 were determined continuously by an online multi-element analyser (Model Xact 625; Cooper Environment Service, USA) (Table S1 in the Supplement). The sample air is drawn through a small spot on the tape where the PM2.5 was collected at a flow rate of 16.7 L min−1 during September 2017–August 2020. An internal Pd pod is utilised as an internal standard to determine the stability of the instrument. Tl was removed from the datasets because over 95 % of their concentrations were below the limit of detection (LOD) (Table S2). Au, Cd, Sn, and Sb were also excluded from the datasets because over 50 % of the concentrations for these metals were below the LOD. To validate the reliability of the online multi-element analyser, many previous studies used the filter sampling coupled with ICP-MS and ICP-AES to determine the daily concentrations of elements and confirmed that the online device showed good agreement with the filter sampling (Furger et al., 2017; Tianxue et al., 2006). Hourly averaged meteorological parameters including air temperature (T), relative humidity (RH), air pressure (P), wind direction (WD), and wind speed (WS) during the sampling period were measured by a weather station with sonic anemometer (150WX; Airmar, Milford, NH, USA). The hourly mass concentration of PM2.5 was determined by a particulate monitor (Thermo, FH62C-14). The routine procedures, including the daily zero or standard calibration, span and range check, station environmental control, and staff certification, followed the Technical Guideline of Automatic Stations of Ambient Air Quality in Tangshan based on the national specification HJ/T193-2005, which was revised based on the technical guidance established by the US Environmental Protection Agency (EPA). Quality assurance and quality control (QA/QC) for the Xact measurements was implemented throughout the sampling period. The internal Pd upscale value was recorded after the daily programmed test for the instrument.
2.3 Deweathered model development
The concentrations of air pollutants were affected by meteorological parameters and emissions simultaneously. In order to separate the contributions of emissions, the impacts of meteorological conditions must be eliminated. In this study, a typical machine-learning model named random forest (RF) approach was applied to distinguish the effects of emissions and meteorological conditions (Chen et al., 2018). All trace elements in PM2.5 were treated as the dependent variables. The time predictors (year, day of year (DOY), day of week (DOW), hour of day (HOY)) and meteorological factors including air temperature (T), relative humidity (RH), wind speed (WS), wind direction (WD), and air pressure (P) were regarded as the predictors (Fig. S1). The original dataset was randomly classified into a training dataset (80 % of input dataset) for developing the RF model, and the remaining one was treated as the test dataset. After the building of the RF model, the deweathered technique was employed to predict the concentrations of trace elements at a specific time point. The deweathered element concentrations served as the concentrations contributed by emission alone. The differences between the original element concentrations and the deweathered element concentrations were regarded as the concentrations contributed by meteorology. Many statistical indicators including R2 value, root mean square error (RMSE), and mean absolute error (MAE) were regarded as the major indicators to evaluate the RF modelling accuracy. The RF model with the five-fold cross-validation R2 value less than 0.5 was considered to be an unconvincing result and cannot reflect the impacts of emission and meteorology on air pollutants accurately because more than 50 % variability of the training model cannot be appropriately explained. After the model evaluation, only the trace elements with the cross-validation R2 values larger than 0.5 were selected to estimate the respective contributions of emission and meteorology to the total element concentrations.
2.4 PMF model
As a typical receptor model applied to source apportionment, the PMF 5.0 version was used to identify the major origins of the atmospheric elements and to determine the contribution ratio of each source to these elements (Norris et al., 2014). The objective of PMF is to solve the issues of chemical mass balance between the measured concentration of each element and its source contributions by decomposing the input matrix into factor contributions and factor profiles. The detailed equation is shown in Eq. (1). Besides this, the contribution of each source for an individual element must be non-negative because no sample has a negative source contribution. In brief, the basic principle of PMF is to calculate the least object function Q when the gik must be a positive definite matrix based on Eq. (2) (Paatero and Tapper, 1994; Reff et al., 2007).
where xij and eij denote the concentration and uncertainty of the jth element, respectively. gik represents the contribution ratio of the kth source to the ith sample, fkj represents the ratio of the jth element in the kth source, and eij indicates the residual of the jth element in the ith sample. The uncertainties associated with factor profiles were evaluated using three error calculation methods including the bootstrap (BS) method, displacement (DISP) analysis, and the combination method of DISP and BS (BS-DISP). For the BS method, 100 runs were performed, and the result has been believed to be valid since all of the factors showed a mapping of above 90 %. DISP analysis also confirmed that the solution was considered to be stable because the observed drop in the Q value was less than 0.1 % and no factor swap occurred. For the BS-DISP analysis, the solution has been verified to be useful because the observed drop in the Q value was less than 0.5 %. Furthermore, both of the results from BS and BS-DISP did not suggest any asymmetry or rotational ambiguity for all of the factors (Manousakas et al., 2017; Taghvaee et al., 2018).
2.5 Health risk assessment of trace metals in PM2.5
As a typical industrial city, Tangshan possesses a large number of residents and poor air quality. Therefore, the residents in Tangshan might suffer from severe exposure risks of trace metals. In our work, the carcinogenic and non-carcinogenic risks of trace metals in PM2.5 were evaluated based on some statistical thresholds proposed by the International Agency for Research on Cancer (IARC). Based on the criterion of the IARC, As, Ni, Cr, and Pb were considered to be carcinogenic to humans.
The carcinogenic and non-carcinogenic risks induced by metal exposure for adults and children were evaluated based on the carcinogenic risks (CRs) and hazard quotient (HQ). The formulas for calculating daily intake of trace metals (ADD), CR, and HQ are as follows:
where C (mg m−3) denotes the concentration of the corresponding trace metal in PM2.5, InhR is the respiratory rate (m3 d−1), EF represents the annual exposure frequency (d yr−1), ED is the exposure duration (year), BW is the average body weight (kg), AT denotes the average exposure time (d), ADD means the daily intake (mg kg−1 d−1) of trace metals, RfD represents the reference dose (mg kg−1 d−1), calculated with reference concentrations, and CSF is the cancer slope factor (kg d mg−1). The potential non-carcinogenic risk of the trace metal might be high when HQ is above 1.0, whereas the health risk is not obvious when HQ is below 1.0. The carcinogenic risk of each trace metal is evaluated based on whether CR is higher than 10−4.
3.1 Occurrence levels and interannual variations of original element concentrations
The total mass concentrations of 16 elements in PM2.5 of Tangshan varied between 230 to 20 000 ng m−3, with the average value (± standard deviation) of 3100 ± 900 ng m−3. The total element concentrations in Tangshan accounted for 5.7 % of the total mass concentrations of PM2.5, which was slightly higher than those in Beijing (4.7 %) and Qingdao (4.0 %) and significantly higher than that in Shanghai (1.80 %) (Chang et al., 2018; Cui et al., 2019). As depicted in Fig. 2, the average concentrations (± standard deviation) of these elements followed the order of K (1400 ± 950 ng m−3) > Fe (880 ± 590 ng m−3) > Ca (330 ± 270 ng m−3) > Zn (320 ± 160 ng m−3) > Pb (58 ± 36 ng m−3) > Mn (54 ± 32 ng m−3) > Cu (22 ± 19 ng m−3) > As (15.3 ± 11.0 ng m−3) > Se (6.5 ± 5.3 ng m−3) > V (4.0 ± 3.6 ng m−3) > Cr (2.8 ± 2.2 ng m−3) > Ag (2.8 ± 2.1 ng m−3) > Ni (2.2 ± 1.8 ng m−3) > Hg (1.5 ± 0.8 ng m−3) > Ga (0.9 ± 0.7 ng m−3) > Co (0.7 ± 0.2 ng m−3). Among all of these elements, K, Fe, Zn, and Ca were the most abundant species, accounting for 95 % of the total elements in PM2.5. The remaining element concentrations only accounted for less than 6 % of the total element concentrations, which was similar to previous studies (Chang et al., 2018; Cui et al., 2019). Nearly all of the trace elements in Tangshan, Beijing, Qingdao, and Shanghai were significantly lower than those in Zibo during 2006–2007 (Table S3). It suggested that the trace elements in China experienced marked decreases in the past decades (Zhang et al., 2018). Compared with some cities in some developed countries, all of the trace element concentrations were significantly higher than those in London and Toronto. Moreover, the concentrations of K, Ca, V, Cr, Mn, and Fe in Tangshan were higher than those in Venice, Italy.
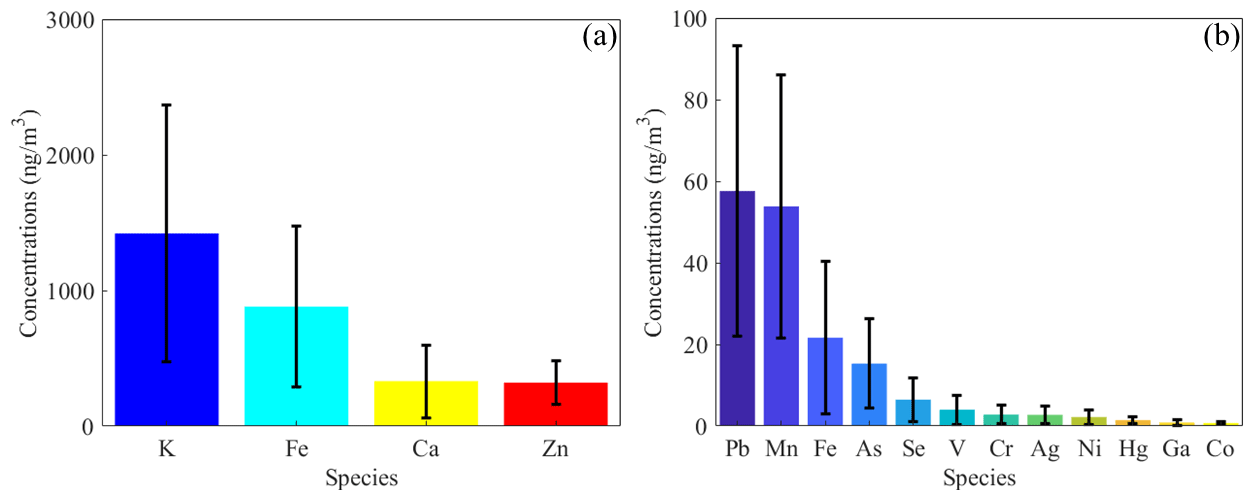
Figure 2Bar chart of the concentrations of 16 trace elements including K, Fe, Ca, Zn, Pb, Mn, Fe, As, Se, V, Cr, Ag, Ni, Hg, Ga, and Co. The bars and black lines represent mean values and associated standard deviations, respectively.
Due to the higher exposure risk and great threat to human health, it is necessary to compare the trace metal concentrations with the risk threshold proposed by many organisations or countries. As shown in Table 1, we have collected many risk thresholds in different countries and found that the Hg (1.5 ± 0.8 ng m−3), Ni (2.2 ± 1.8 ng m−3), and Pb concentrations (58 ± 36 ng m−3) in Tangshan were significantly lower than the thresholds of the Chinese Ambient Air Quality Standard (CAAQS) (Hg of 50 ng m−3), World Health Organization (WHO) (Hg of 1000 ng m−3, Ni of 25 ng m−3, and Pb of 1000 ng m−3), European Union (EU) (Ni of 20 ng m−3), and the United States (Pb of 150 ng m−3). However, both of the As (15 ± 11 ng m−3) and Cr concentrations (2.8 ± 2.2 ng m−3) in PM2.5 of Tangshan were much higher than the standard values of the CAAQS (As of 6.0 ng m−3 and Cr of 0.03 ng m−3), WHO (As of 6.6 ng m−3 and Cr of 0.25 ng m−3), and EU (As of 6.0 ng m−3).
Table 1Comparison of the element concentrations in PM2.5 of Tangshan and the standard values for these elements in World Health Organization (WHO), China, Europe, and the United States (unit – ng m−3).
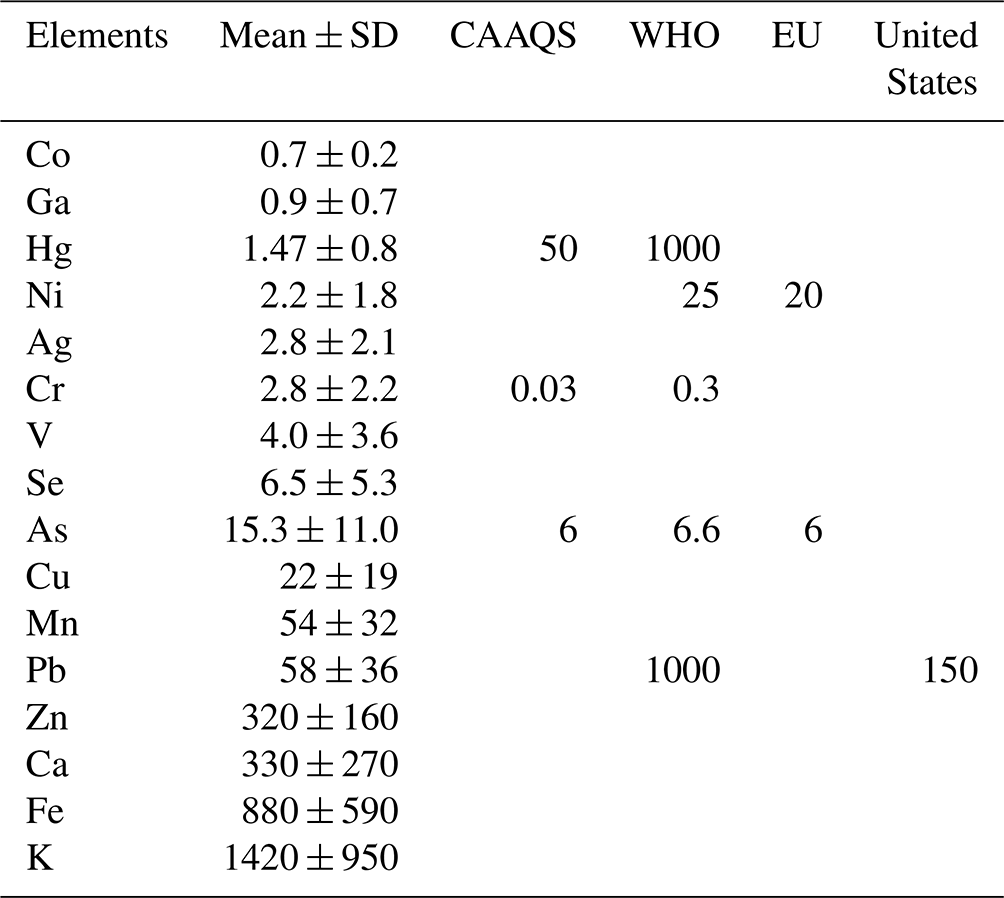
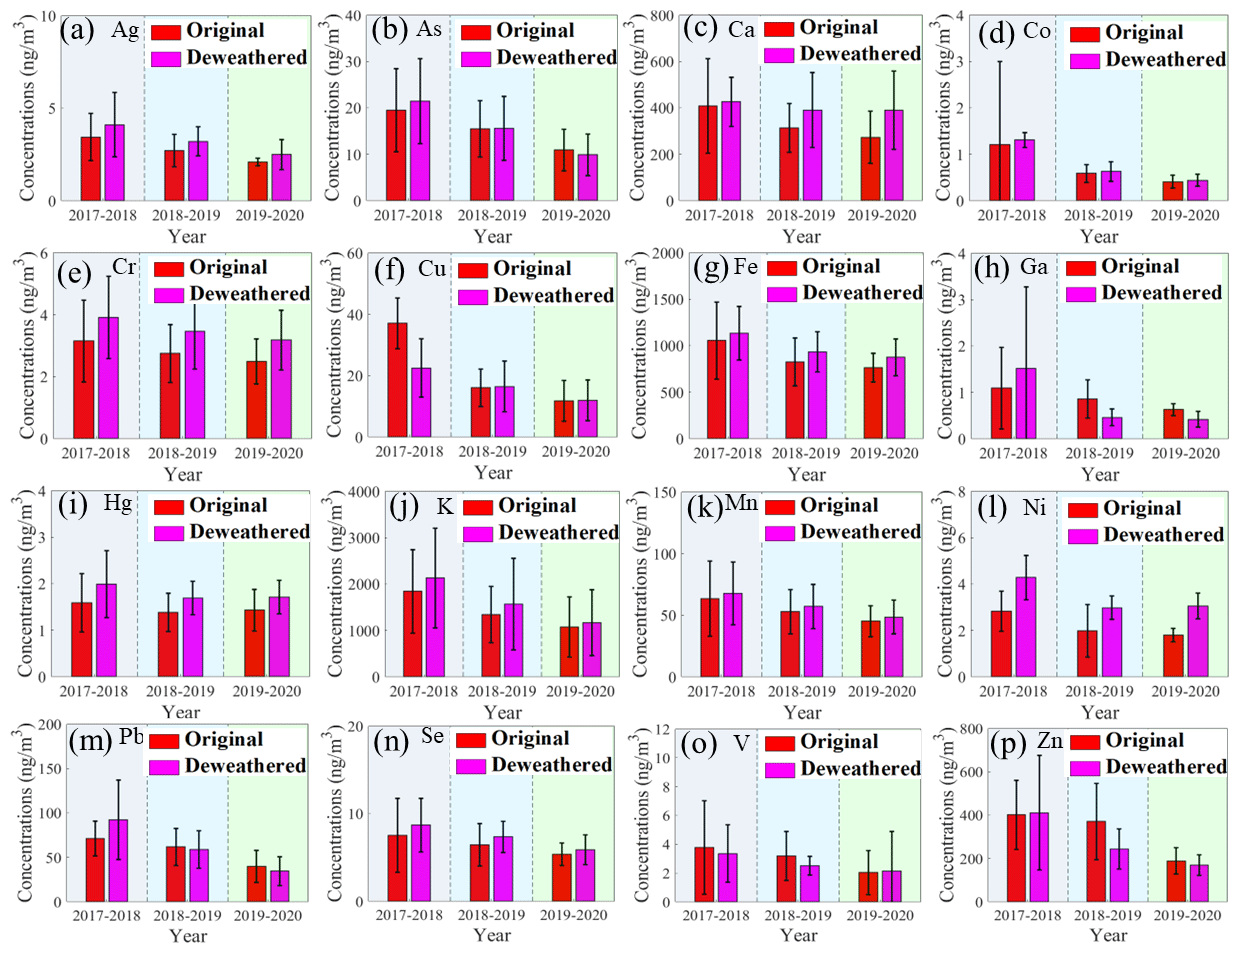
Figure 3Interannual variations of the original (red) and deweathered (manganese purple) element concentrations (ng m−3) in PM2.5 in Tangshan. The dark nattier blue and nattier yellow backgrounds represent the species during 2017–2018 (from September in 2017 to August in 2018), 2018–2019 (from September in 2018 to August in 2019), and 2019–2020 (from September in 2019 to August in 2020). The bars and black lines represent mean values and associated standard deviations, respectively.
The interannual variation of the original concentrations of the trace elements in PM2.5 are depicted in Figs. 3 and S2–S3. The original concentrations of all the trace elements exhibited decreasing trends. The Cu, Co, Zn, Pb, As, and Ga concentrations showed dramatic decreases from 37 to 12 ng m−3 (68 %), 1.21 to 0.4 ng m−3 (66 %), 400 to 190 ng m−3 (53 %), 71 to 40 ng m−3 (44 %), 20 to 11 ng m−3 (44 %), and 1.09 to 0.6 ng m−3 (42 %), respectively. Following these species, the K (40 %), Ag (39 %), V (39 %), Ni (36 %), Ca (33 %), Mn (29 %), Se (29 %), Fe (27 %), and Cr (21 %) concentrations showed moderate decreasing ratios. The observed Hg level exhibited the lowest decreasing ratio from 1.59 to 1.43 ng m−3 (9.9 %).
3.2 Impact of emission reduction on trace element concentrations
Although the original concentrations of the trace elements could be utilised to analyse the impact of the clean air policy, the role of emission reduction on the element concentration might not be clearly clarified because the meteorological factors were also important variables affecting the air quality. In order to accurately reflect the response of the element concentrations to the emission reduction alone during 2017–2020, the meteorological conditions were eliminated by the RF model in our study. Based on the results in Fig. S4, the RF models for all of the species showed better performance because their R2 values were higher than 0.50, and the slopes of all of the fitting curves were also close to the R2 values. The result suggested that the separation of meteorology and emission of trace elements based on the RF model was reliable. During 2017-2020, the deweathered concentrations of Ga, Co, Pb, Zn, and As showed rapid decreases from 1.52 to 0.4 ng m−3 (72 %), 1.31 to 0.4 ng m−3 (67 %), 92 to 35 ng m−3 (62 %), 410 to 170 ng m−3 (59 %), and 21 to 10 ng m−3 (54 %), respectively (Fig. 3). It was well-known that As, Co, and Pb were typical marker elements for coal combustion, and “coal-to-gas” and “coal-to-electricity” strategies have been widely performed in Tangshan (Fang et al., 2020; Li et al., 2017). Wang et al. (2020) have estimated that these effective control measures have contributed to around 60 % of the total PM2.5 reductions. Meanwhile, the upgrading and optimisation of the industrial structure/layout and the shutdown of high-pollution industries were also strictly implemented in Tangshan, and thus led to the dramatic decreases of Ga and Zn concentrations because Ga and Zn were common forms of non-ferrous metal smelting (Tian et al., 2015). In contrast, the deweathered Ca level displayed the lowest decrease ratio (8.3 %) from 2017 to 2020, indicating that clean air actions cannot significantly reduce fugitive emissions. In addition, the deweathered Fe (23 %) and Cr (18.5 %) also suffered from relatively low decrease ratios. It was well documented that Fe and Cr originated from metallurgical industry such as steel production and ferrous metal smelting (Tian et al., 2015), and the slight decreases of the deweathered Fe and Cr levels during the sampling period suggested that the emission control measures for ferrous metal smelting should be strengthened in the future.
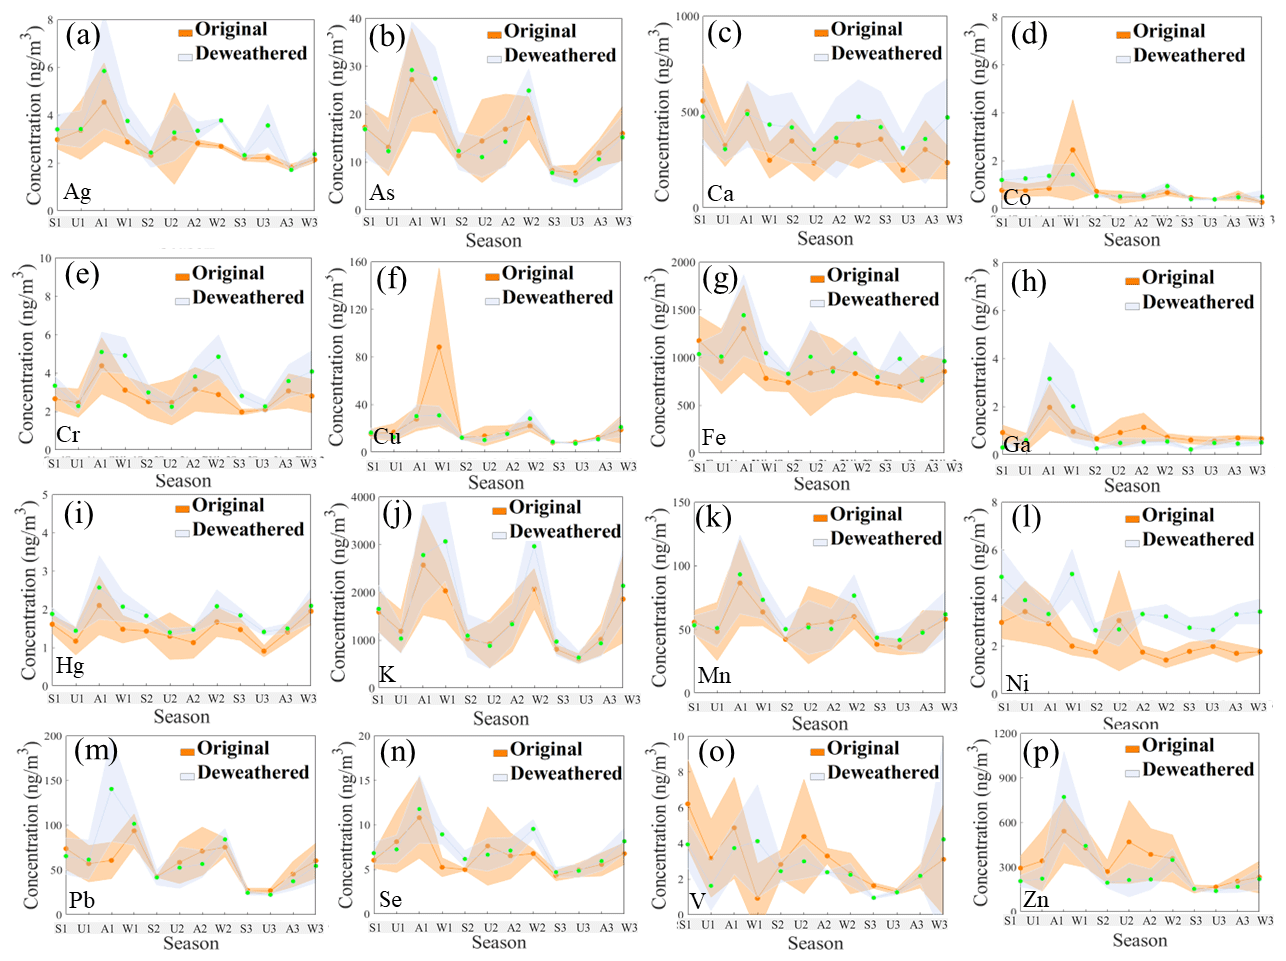
Figure 4Original (red and orange) and deweathered (green and blue) element concentrations (ng m−3) in PM2.5 in Tangshan in four seasons during 2017–2018, 2018–2019, and 2019–2020. S1, U1, A1, and W1 represent the spring, summer, autumn, and winter during 2017–2018. S2, U2, A2, and W2 denote the spring, summer, autumn, and winter during 2018–2019. S3, U3, A3, and W3 are the spring, summer, autumn, and winter during 2019–2020. The points and shaded areas represent mean values and associated standard deviations, respectively.
In addition, the decreasing ratios of the deweathered concentrations for each species displayed different seasonal characteristics. The deweathered concentrations of some elements related to industrial activities (e.g. Ga, Zn, and Cr) showed rapid decreases in autumn and winter compared with other seasons during 2017–2020 (Fig. 4), indicating that the optimisation of the industrial layout and shutdown of outdated industries were effective to decrease these element emissions especially in the high-pollution season. Some elements derived from biomass burning including K (66 %) and Se (50 %) also exhibited the most dramatic decreasing ratios in autumn. It was assumed that enhanced crop residual burning occurred frequently during the autumn harvest season. Ke et al. (2019) confirmed that the number of fire spots in October–November was even higher than that in June, and the burned area in the harvest season was highest during 2013–2017. However, the control on open biomass burning has been implemented strictly in recent years, largely reducing the K and Se emissions in autumn. It should be noted that the deweathered Pb (46 %), Co (65 %), and As (45 %) concentrations in winter did not display high decreasing ratios, though the annual mean deweathered Pb, Co, and As levels experienced dramatic decreases. The result revealed that it was still difficult to reduce the Pb, Co, and As emissions during the heating season because increased coal consumption for domestic heating largely offsets the contributions of emission control measures (Zhu et al., 2018, 2020).
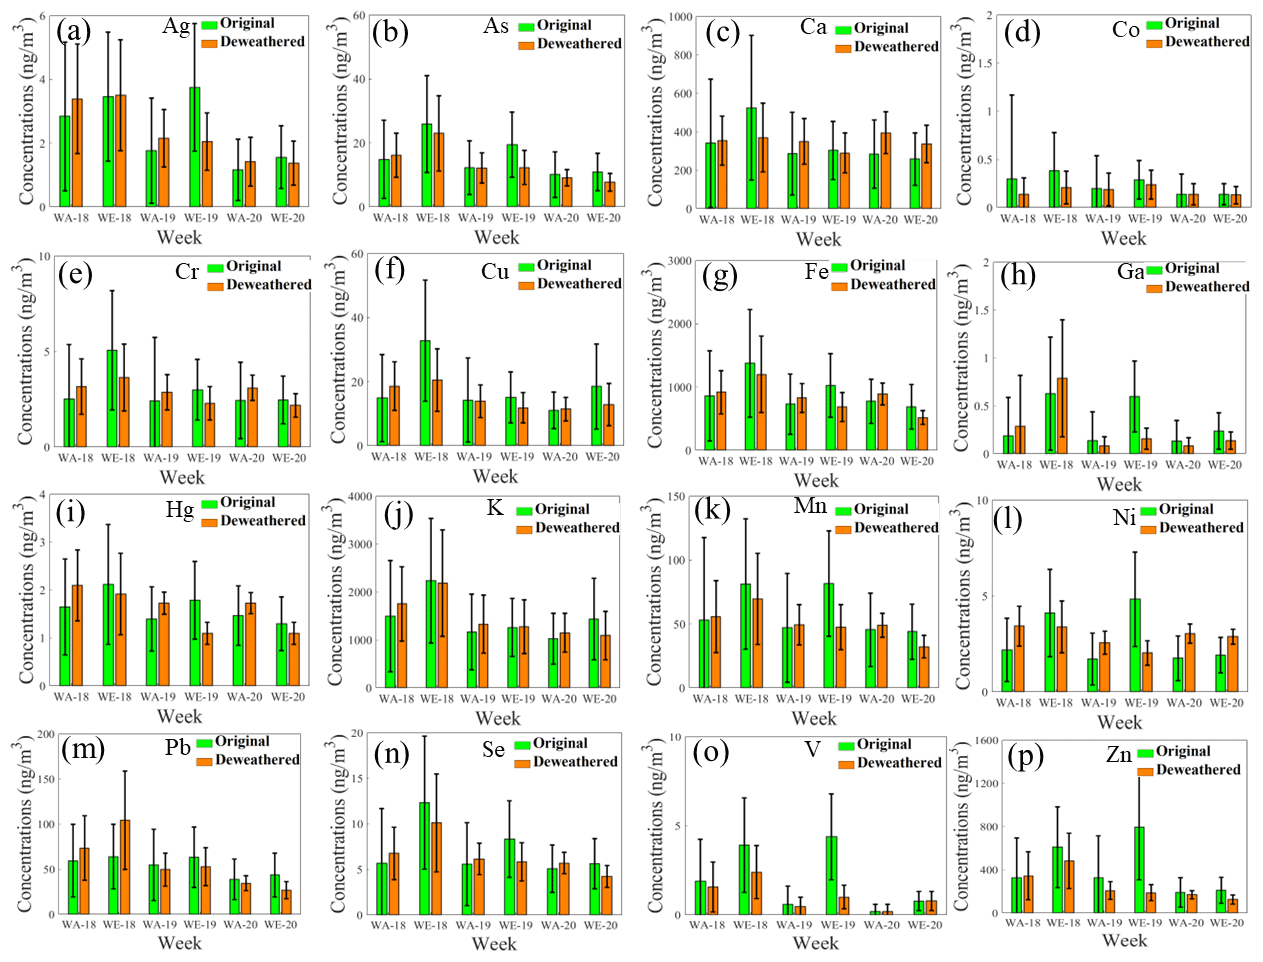
Figure 5Weekly variations of the original (green) and deweathered (orange) element concentrations (ng m−3) in PM2.5 in Tangshan. The green and dark backgrounds denote the error bars of the original and deweathered elements, respectively. The bars and black lines represent mean values and associated standard deviations, respectively.
Apart from the seasonal difference of each species, the decreasing ratios of these elements also suffered from distinctly intraweekly variations. The deweathered concentrations of most elements except Ca, Cu, Ni, and V exhibited higher decreasing ratios at the weekends than on the weekdays (Fig. 5). Cui et al. (2020) have demonstrated that the weaker supervision on industrial enterprises on weekends could lead to the higher concentrations of non-traffic elements such as K, As, Se, and Cr in some cities. Fortunately, grid monitoring has been widely performed in Tangshan recently (http://hbepb.hebei.gov.cn/hbhjt/xwzx/jicengfengcai/101624062321621.html, last access: 23 March 2023), and many low-cost sensors were installed at some energy-intensive industries, which could decrease the stealing emissions of some elements. Nonetheless, the decreasing ratios of Ca, Cu, V, and Ni did not show the regular intraweekly characteristics. In recent years, Tangshan adopted strict traffic management regulation, and the non-local light duty vehicles were restricted to driving inside the urban area 1 d per week based on the end number of the license plates (Westerdahl et al., 2009; Wu et al., 2011), whereas the restrictions were not valid at weekends (Liu et al., 2007). Theoretically, the traffic control should result in marked decreases of traffic-related element concentrations on weekdays compared with weekends. However, in our study, some traffic-related elements such as Ca and Cu did not show similar characteristics. Meanwhile, as the important tracer of vehicle emissions, the NOx concentration in Tangshan did not show a regular intraweekly pattern. It was supposed that the vehicle volume in Tangshan has increased from 2.0 to 2.4 million (http://tjj.hebei.gov.cn/, last access: 24 March 2023), which largely offset the benefits of traffic controls. The shipping-related elements including V and Ni also did not show regular intraweekly variation because no heavy metal emission control measures for shipping were performed.
3.3 The role of meteorology on the year-to-year variations of element concentrations
The difference between the original and the deweathered element concentrations could be regarded as the concentrations contributed by meteorological parameters. The positive impacts of meteorological parameters on the trace elements suggested that the meteorological conditions were unfavourable to the pollutant diffusion, while the negative impacts of meteorological indicators meant favourable conditions for trace elements. In our study, the roles of meteorological conditions on Ca (−25 %), V (−10 %), Cr (−2.5 %), Mn (−0.7 %), Fe (−4.6 %), Ni (−7.6 %), and Cu (−21 %) during 2017–2020 were negative (Fig. S5), while the roles of meteorological parameters on other elements were positive. The result suggested that those elements derived from vehicle emission (Ca, Cu, and Fe), ferrous metal smelting (Cr and Mn), and heavy oil combustion (V and Ni) were less sensitive to the emission reduction actions compared with other elements, and the meteorological conditions were much more beneficial to the diffusion of these elements. In order to further reveal the key meteorological factors for these elements, we used the RF model to calculate the variable importance of all of these meteorological parameters including P, RH, T, WD, and WS. The result suggested that Ca, Fe, and Cu were mainly influenced by T, whereas V, Ni, Cr, and Mn were often associated with WD and WS (Fig. 6). During the spring and summer in 2017–2020, the average air temperature decreased from 8.9 and 27 to 7.2 and 26 ∘C, respectively. The decreased air temperature led to a higher water content in the soil and a lower tendency of dust suspension, and it might decrease the concentrations of Ca, Fe, and Cu (Manju et al., 2018; Yang et al., 2017; Lyu et al., 2016). Although the annual average wind speed in Tangshan decreased from 1.70 to 1.45 m s−1, the mean wind speed from the south-eastern direction displayed a slight increase from 1.34 to 1.50 m s−1. Zhao et al. (2013) verified that V and Ni were usually emitted from heavy oil combustion of ocean-going ship engines. Many coastal ports and ferrous metal smelting industries were located on the south-eastern direction of the sampling site, and thus the enhanced WS might promote the dilution and dispersion of trace elements (Figs. S6–S8). As shown in Fig. S8, both V and Ni showed higher concentrations in the south-eastern part of Tangshan, and the concentrations displayed gradual decreases along the south-east–north-west transect, which also demonstrated that both of V and Ni in the sampling site could be derived from coastal shipping emission.
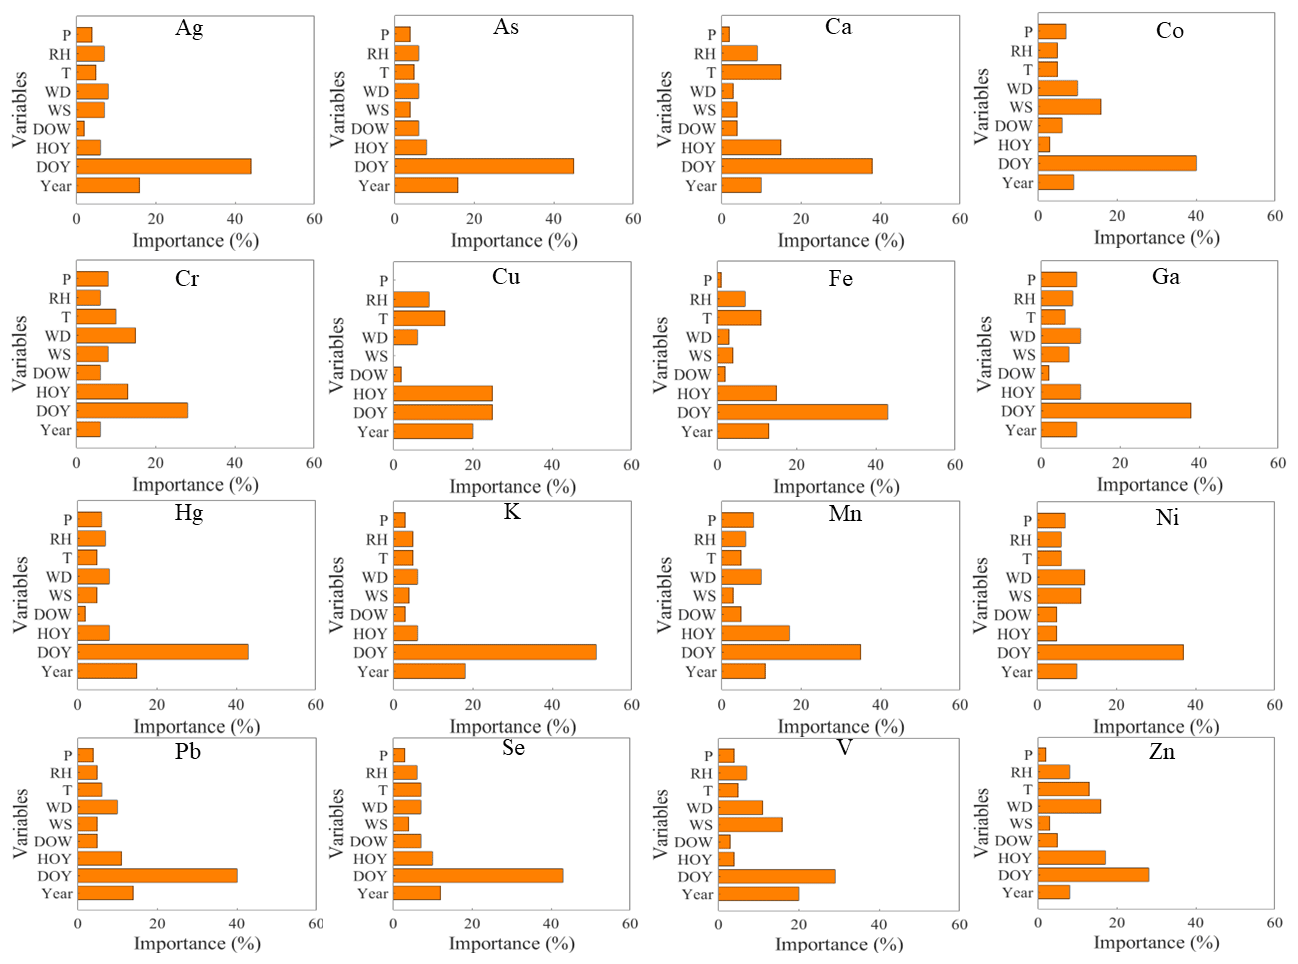
Figure 6Relative importance of the predictors for the prediction of trace elements. The columns in the figure represent the variable importance in the RF models for the trace elements. P, RH, T, WD, WS, DOW, HOY, DOY, and Year denote air pressure, relative humidity, air temperature, wind direction, wind speed, day of week, hour of day, day of year, and study year, respectively.
3.4 The impact of clean air policy on the source apportionment of the trace elements
Although the major sources of elements could be determined based on some important tracers (e.g. K and V), the contributions of the major sources to each element still remained unknown. Therefore, positive matrix factorisation (version PMF 5.0) was applied to identify more source information of the elements in PM2.5 during 2017–2020 based on the deweathered levels. After 20 runs, more than 26 000 samples were trained to determine the optimal six factors with the lowest values of Q (robust) and Q (true). The BS, DISP, and BS-DISP methods confirmed that the most reliable solution was obtained with six factors. Detailed information of the PMF analysis and error diagnostics is summarised in Tables S4–S6.
As shown in Fig. S9, the trace elements in PM2.5 during 2017–2020 showed similar characteristics. Factor 1 possesses high loadings of K (55 %) and Se (42 %). K and Se were often regarded as the major tracers of biomass burning. Due to the increasing usage of biomass fuels for domestic heating during the heating season, K and Se in PM2.5 of Tangshan showed higher values in winter, suggesting that these metals in fine particles could originate from the combustion of biomass fuels. Except for domestic heating, we found some episodes during the harvesting season in late summer (2500 and 11.2 ng m−3) and early autumn (2600 and 9.5 ng m−3) that also showed extremely high concentrations of K, which might be linked with local biomass burning (Chen et al., 2017). Based on the map of fire points and backward air masses trajectories (Figs. S6–S8), the metals released from biomass burning in the NCP could be transported to the sampling site by the dominant southerly wind, which further proved the impacts of biomass burning (Chen et al., 2017).
The abundant elements in factor 2 included Ag (53 %), Zn (51 %), and Cu (36 %). Owing to the higher temperatures during the roasting, sintering, and smelting processes for the extraction of Cu and Zn from ores, some metals such as Ag in non-ferrous metal ores could be vaporised as a byproduct and released into the flue gas (Pacyna and Pacyna, 2001; Wu et al., 2012). Therefore, factor 2 was interpreted as the non-ferrous metal smelting source.
Factor 3 was characterised by a large mass fraction of Co (81 %), Pb (61 %), Hg (57 %), and As (39 %). After the phase-out of leaded gasoline since 1980s, the contribution from coal combustion to Pb showed rapid increase and accounted for the major fraction of particulate Pb (Das et al., 2018). Meanwhile, Co and Hg were also treated as important byproducts released from coal burning, and the Co and Hg concentrations often increased significantly with the elevation of the burning temperature (Tang et al., 2018). Tian et al. (2015) estimated that 73 % of As, 56 % of Pb, and 47 % of Hg were found to be emitted from coal combustion in China. Coal consumption in South China was mainly driven by coal-fired power plants, while coal-based heating was the major sector for the coal consumption in the NCP. In our study, As, Co, and Pb showed higher concentrations in winter (heating season) (18.7, 0.9, and 76 ng m−3) compared with other seasons (14, 0.6, and 51 ng m−3). The markedly seasonal discrepancies of As, Co, and Pb strongly supported the impact of the coal combustion for domestic heating on the enhancement of As, Co, and Pb in the fine particles.
Factor 4 was distinguished by high loadings of Cr (78 %) and Mn (39 %), respectively. Cr and Mn mainly originated from the metallurgical industry such as steel production and ferrous metal smelting (J. Liu et al., 2018; Tian et al., 2015; Zhu et al., 2018). China was responsible for more than 49 % of the world steel production in 2017 (approximately 830 million tonnes), and 60 % of the large steel producers were located in China (Chang et al., 2018). Tangshan possesses many large steel production industries such as Tangshan Steel, Qian'an Steel, and Guofeng Steel. Besides this, some industries of Capital Steel have migrated into Tangshan (Li et al., 2019), which might increase the Cr and Mn emissions.
Factor 5 explained 10.1 % of the total species, and it was characterised by high loadings of V (88 %) and Ni (51 %). It was well documented that V was a key fingerprint of heavy oil combustion, which was generally emitted from shipping emissions and petrochemical refining (Shafer et al., 2012). Ni was widely utilised as a tracer of fuel oil combustion in industries (Zhu et al., 2018). Many oil-fired power plants were located in Tangshan for central heating (Yu et al., 2013). Based on the backward trajectory and wind direction (Figs. S6–S8), we found that high concentrations of V and Ni might be derived from the south-eastern air masses especially in summer and autumn, indicating the impacts of coastal port and petroleum refinery industry. In addition, the V and Ni concentrations displayed gradual decreases along the south-east–north-west transect, indicating that the potential sources were located in south-east Tangshan (Fig. S8). Gathering evidence suggested that the V Ni ratio in petroleum coke with a low-sulfur content and fuel oil usage ranged from 1 to 3 (Moreno et al., 2010). The annual mean ratios of V and Ni in our study reached 1.2 during the sampling period, which was in the range of this interval. The result also revealed that petrochemical refining and heavy oil combustion derived from coastal shipping emissions might be an important source of V and Ni in fine particles.
Factor 6 was characterised by high loadings of Ca (78 %), Cu (32 %), and Fe (33 %) and moderate loadings of Mn (31 %) and Zn (29 %). Some previous studies have demonstrated that Cu, Fe, and Zn were released from tyre and brake wear because they were the necessary materials for brake pads and the agents in brake linings (Dall'Osto et al., 2013; Hjortenkrans et al., 2007). Ca probably originated from the road fugitive dust because it was one of the most abundant elements in the upper soil (Alves et al., 2015; J. Liu et al., 2018). Moreover, we have found that Fe, Ca, and Zn displayed remarkably high values during the morning rush hours and a small peak during the sunset (Fig. S10), which was coincident to the diurnal variation of the traffic volume. Thus, factor 6 was identified as the traffic-related dust source.
Although six similar sources were revealed during 2017–2020, the contribution concentrations and ratios of these sources varied greatly in these years. As shown in Figs. 7 and 8, the contribution concentrations of biomass burning, non-ferrous metal smelting, coal combustion, and ferrous metal smelting to trace elements decreased from 1460, 480, 640, and 570 ng m−3 to 900, 230, 230, and 350 ng m−3, respectively. However, the contribution concentrations of heavy oil combustion and traffic-related dust displayed a slight increase during 2017–2019, while they decreased rapidly after 2019. The contribution concentrations for nearly all sources to the trace elements showed decreases during 2017–2020 because the total deweathered levels of trace elements experienced decreases in the past 3 years. However, the contribution ratios of these sources to the trace elements did not show similar characteristics. For instance, the contribution ratio of the traffic-related dust increased from 25 % to 33 %. In contrast, the contributions of non-ferrous metal smelting and coal combustion decreased from 11 % to 8 % and 15 % to 8 %, respectively. The contributions of ferrous metal smelting, heavy oil combustion, and biomass burning remained relatively stable during this period.
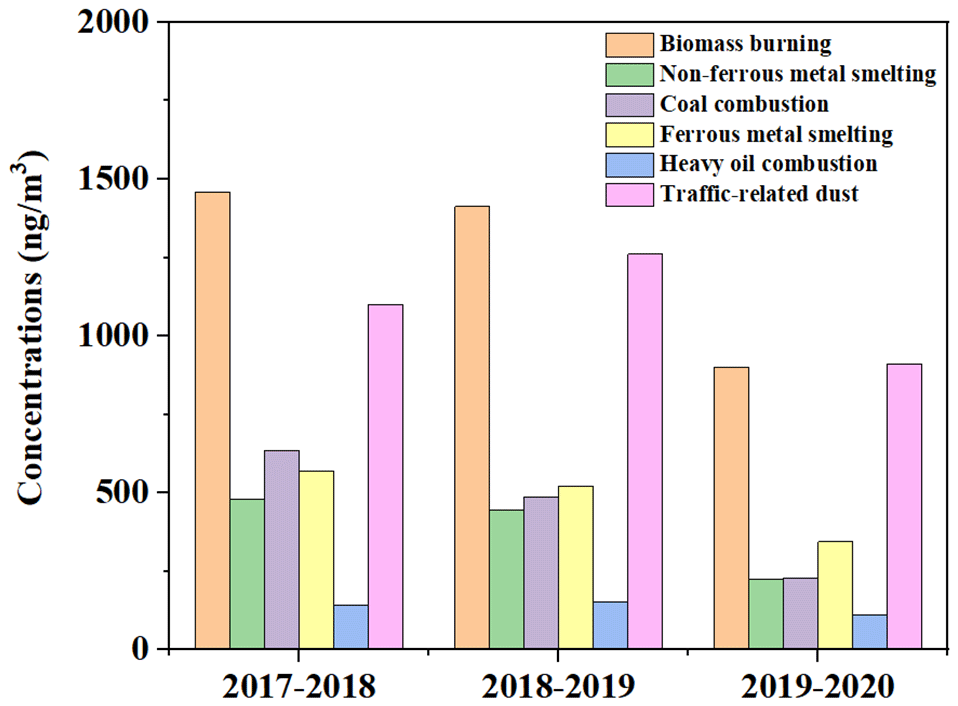
Figure 7Deweathered mean concentrations of trace elements derived from six sources in Tangshan during 2017–2020.
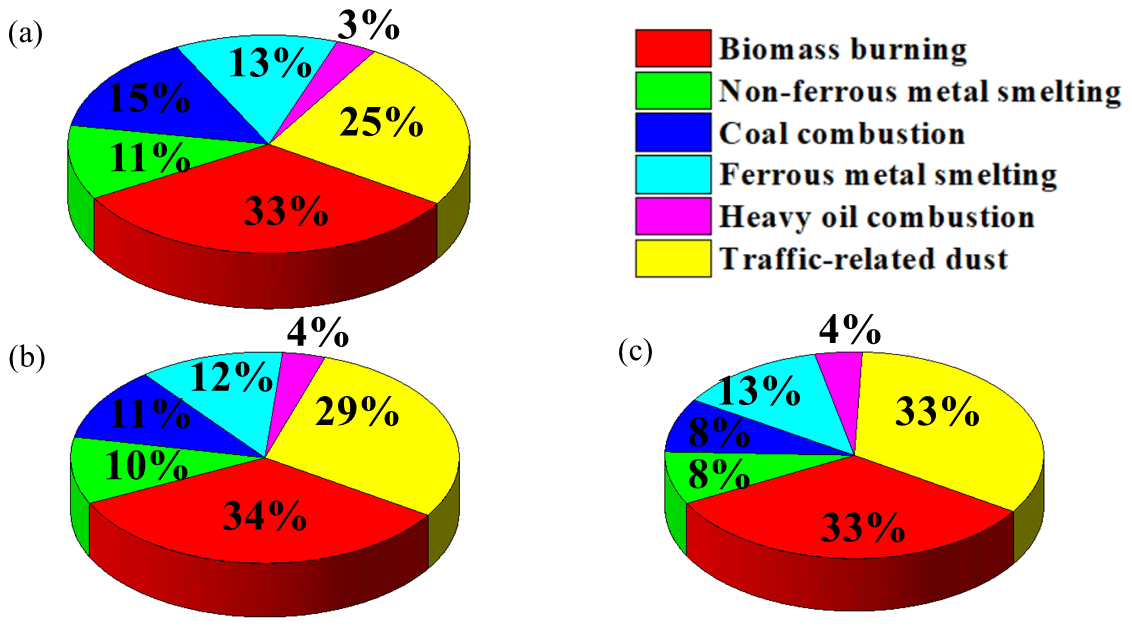
Figure 8Average contributions of the six sources to the deweathered concentrations of the elements in PM2.5 based on the PMF model. The red panel means biomass burning, the green panel denotes non-ferrous metal smelting, the blue one represents coal combustion, the cyan one is ferrous metal smelting, the pink one represents heavy oil combustion, and the yellow one denotes traffic-related dust. (a), (b), and (c) represent the source contributions during 2017–2018, 2018–2019, and 2019–2020, respectively.
Due to the strict implementation of the clean air policy, many outdated industrial capacities were shut down and cleaner technologies were implemented, which facilitated the production decreases of pig iron and coal-fired power plants (Ma et al., 2019). Hence, the contribution concentrations and ratios of non-ferrous metal smelting and coal combustion experienced dramatic decreases. Although open biomass burning has been strictly restricted in Tangshan (Chang et al., 2018), the contribution ratios of biomass burning to the trace elements in PM2.5 remained relatively stable, which might be attributable to the rapid decreases of the contributions derived from coal combustion and non-ferrous metal smelting. In addition, biofuel combustion was still widespread in some rural and suburb areas (Kamal et al., 2015; Li et al., 2020), which might offset the decreases in the contributions of open biomass burning. Although the contribution concentrations of traffic-related dust-to-trace elements also showed a slight decrease, the contribution ratios of traffic-related dust to some trace elements exhibited marked increases (8 %) during 2017–2020 because the contribution ratios of metal smelting and coal combustion displayed substantial decreases. The result also demonstrated that the implementation of the coal-to-gas project facilitated the decreases of trace element concentrations. In addition, the source variation trend also suggested that the formulation of many new quality standards for non-road diesel fuels cannot fully decrease the element emissions (Cui et al., 2017), and thus the control of traffic-related dust should be enhanced in the future.
3.5 Health risk assessment of trace metals in PM2.5
Although the trace metals only accounted for a minor fraction of the total mass concentration of PM2.5, it might pose a great threat to human health because most of these metals are bioavailable and non-degradable (Rai et al., 2019; Yi et al., 2011). Unfortunately, previous studies mainly used filter sampling techniques to determine the concentrations of trace metals and then assess their health risks (Cui et al., 2018; Huang et al., 2016). These low-resolution data might not accurately reflect the real health risks triggered by metal exposure. In our study, we employed online data to assess the health risks derived from metal exposure.
The health risks of trace metals could be classified into two types including carcinogenic and non-carcinogenic risk. Based on the major parameters summarised in Tables S7 and S8, we estimated both of the carcinogenic and non-carcinogenic risks of the major metals. To evaluate the impacts of emission control measures on the element concentrations, both the health risks based on the original element levels and the deweathered element concentrations were calculated. The mean CR values based on the original concentrations were in the order of Pb (2.3 × 10⁻⁶ (adult) and 1.4 × 10⁻⁶ (child)) > As (1.9 × 10⁻⁶ and 1.1 × 10⁻⁶) > Cr (0.11 × 10⁻⁶ and 0.07 × 10⁻⁶). The total CR values for adults and children reached 4.3 × 10⁻⁶ and 2.6 × 10⁻⁶ (Table 2), respectively. The total CR values were located in the range of the acceptable (10−6) and least stringent risk levels (10−4), which suggested that Tangshan suffered from a slight metal carcinogenic risk. Among all of these metals, Pb and As displayed the higher CR values. It was assumed that the coal combustion for domestic heating might be the dominant factor for the higher risks of Pb and As in Tangshan because both Pb and As in PM2.5 were mainly derived from coal combustion. With regard to the non-carcinogenic risks of the trace metals, the HQ of As (1.2 × 10⁻² and 2.9 × 10⁻²) and Pb (6.8 × 10⁻⁴ and 17 × 10−4) showed higher values compared with other elements. The result indicated that nearly all elements did not display potential non-carcinogenic risk because the HQ values of all the metals were less than one. The total HQ value of these metals was also lower than one, indicating that the trace elements in Tangshan did not show a significant non-carcinogenic risk.
Table 2Non-carcinogenic and carcinogenic risks (as fraction of 1) for the original element levels in PM2.5.
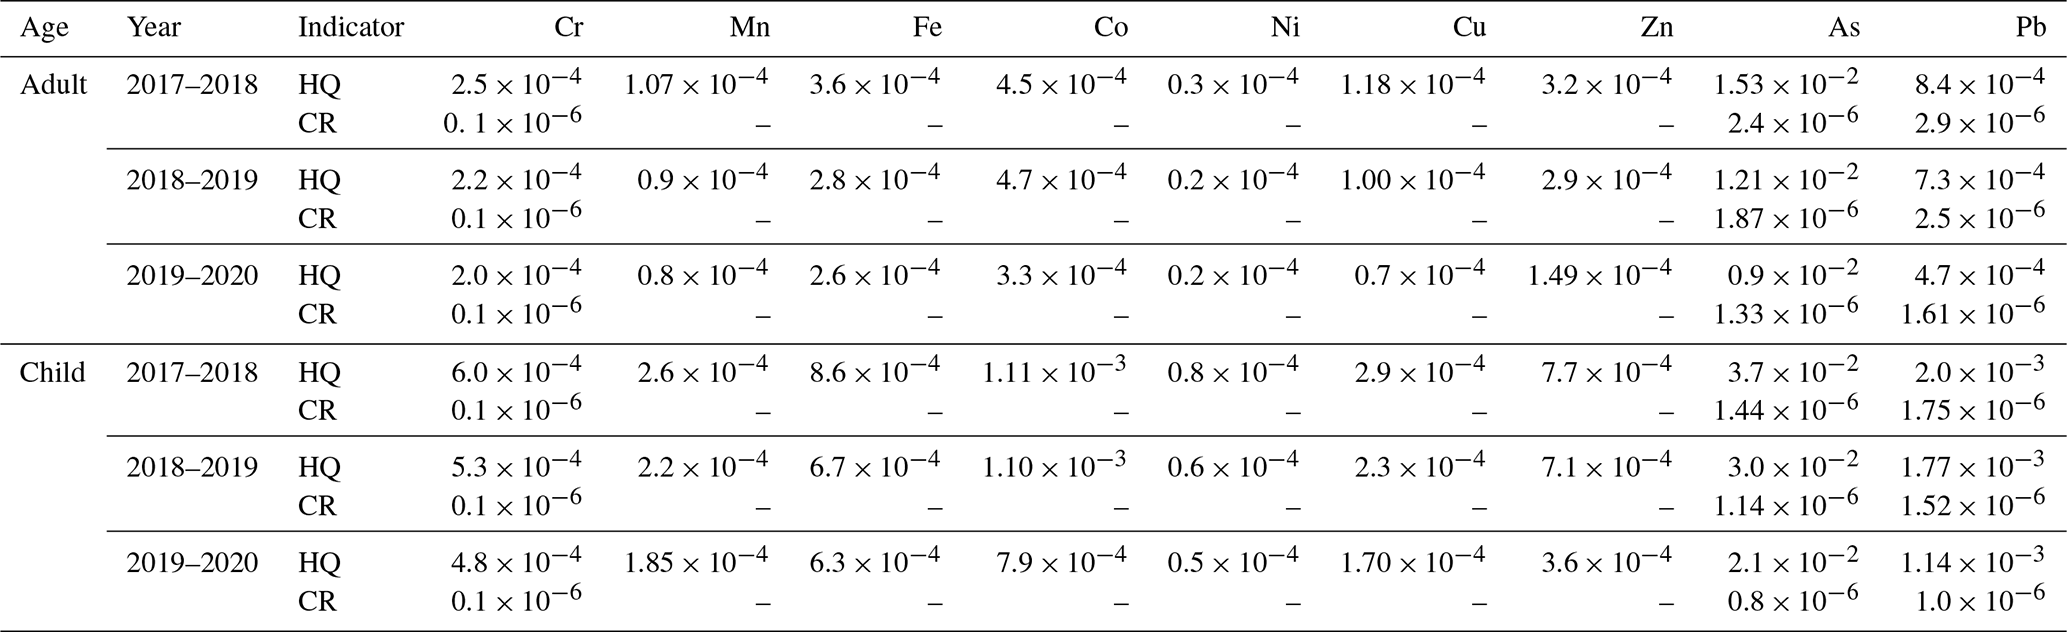
Table 3Non-carcinogenic and carcinogenic risks (as fraction of 1) for the deweathered element levels in PM2.5.
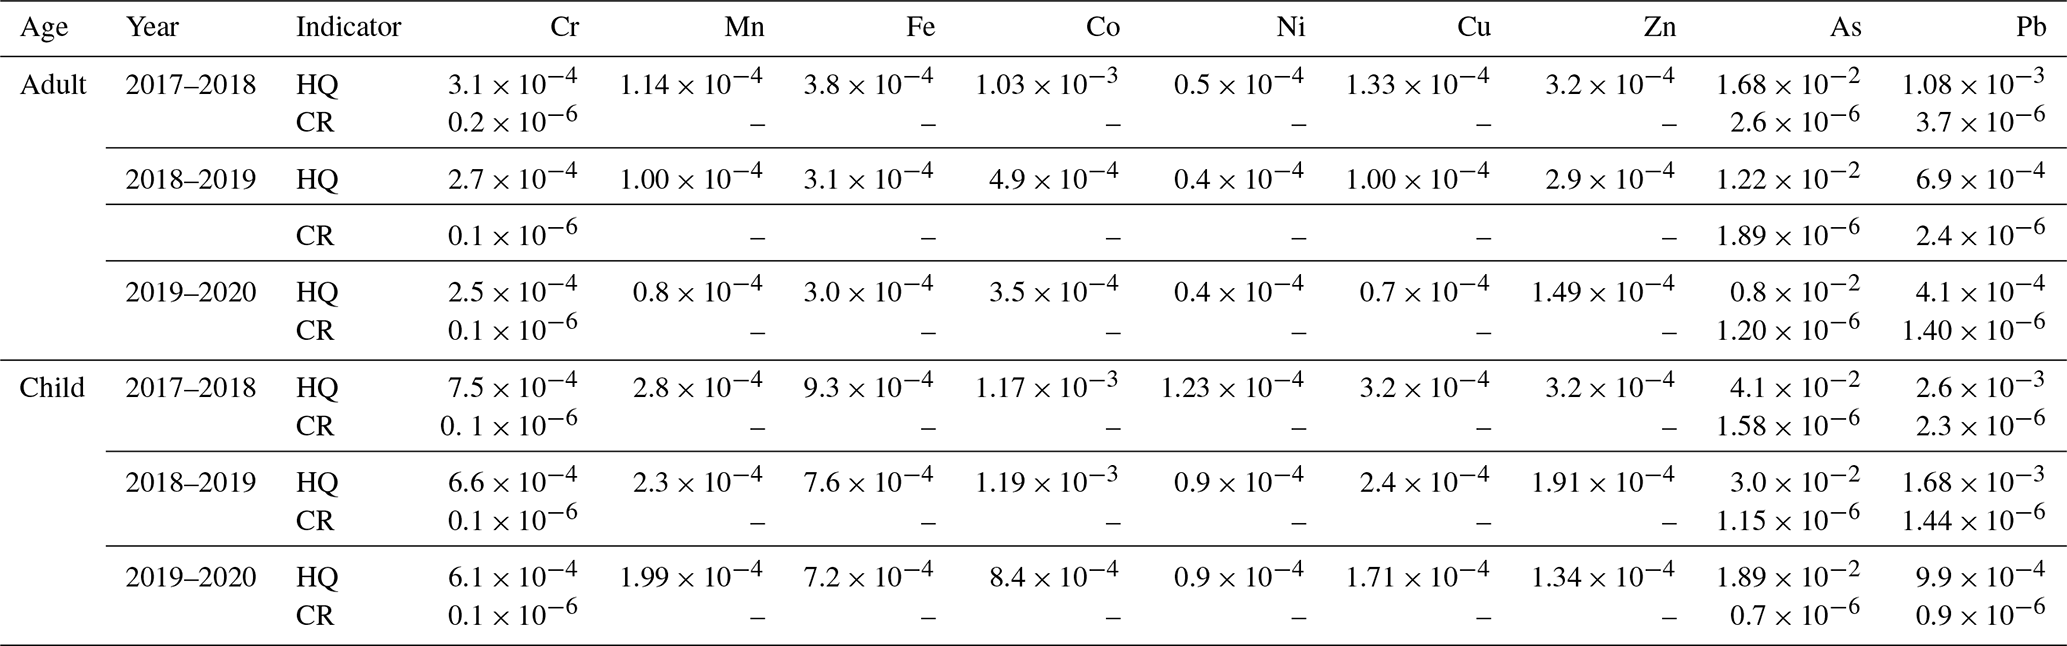
By removing the impact of the meteorological conditions, we can isolate the impact of the clean air policy on health risks associated with metal exposure alone. The decreased ratios of the CR values based on the deweathered As and Pb concentrations during 2017–2020 were 54 % and 62 %, respectively (Table 3). However, the decreased ratios of the CR values based on the original As and Pb levels only reached 44 %. The result suggested that the clean air policy in recent years significantly decreased the As and Pb emissions. Additionally, the decreased ratios of the HQ values for the original Cu (41 %) and Zn (53 %) were lower than those for the deweathered ones (Cu – 47 % and Zn – 59 %). Nevertheless, some other elements did not show similar characteristics. For instance, the decreased ratios of the HQ values for the original Cr (21 %) and Fe (27 %) were even slightly higher than those for the deweathered ones (Cr – 19 % and Fe – 23 %). It was assumed that the clean air policy in recent years facilitated the emission reduction of non-ferrous metal smelting and coal combustion efficiently. However, the concentrations of the elements derived from ferrous metal smelting and vehicle emission did not show marked decreases, which was in good agreement with the source apportionment result in Sect. 3.3. Thus, in future work, it is highly imperative to further reduce industrial/traffic-related emissions in order to alleviate potential health risks.
3.6 Limitations and uncertainties
It should be noted that our work is still subject to some limitations. At first, some elements such as Cr (0.5) and Ga (0.5) showed relatively lower CV R2 values, though they were generally higher than 0.5. These elements might show higher uncertainties during the meteorology normalisation compared with other elements such as Cu (0.85) and K (0.85). Besides this, few variables were applied to deweather the element concentrations, which might be responsible for the lower CV R2 value for some elements. Due to the lack of an available hourly emission inventory of each element, we only used the time variable to train the model. This method still suffered from some uncertainties, which should be improved by the establishment of near-time emission database.
Three-year continuous hourly observation of elements in PM2.5 was conducted in Tangshan during September 2017–August 2020. The effect of the clean air policy on the element concentrations in PM2.5 was quantified. The main conclusions were as follows:
-
The deweathered concentrations of Ga, Co, Pb, Zn, and As showed rapid decreases from 1.52 to 0.42 ng m−3 (72 %), 1.31 to 0.44 ng m−3 (67 %), 92 to 35 ng m−3 (62 %), 411 to 170 ng m−3 (59 %), and 21 to 10 ng m−3 (54 %), respectively. The clean air actions played an important role regarding the emission reduction of coal combustion and non-ferrous metal smelting.
-
The deweathered levels of Ca (8.3 %), Cr (19 %), and Fe (23 %) displayed relatively low decreases compared with other elements, indicating that the vehicle emission and ferrous smelting industries might not be sensitive to the air clean policy.
-
The deweathered levels of some elements related to industrial activities (e.g. Ga, Zn, and Cr) exhibited rapid decreases in autumn and winter compared with other seasons during 2017–2020, while the combustion-related elements such as Pb and As did not show high decreasing ratios in winter. The enhanced coal consumption during the heating season offsets the benefits derived from strict emission control measures.
-
Favourable meteorological conditions promoted the decreases of Ca (−25 %), V (−10 %), Cr (−2.6 %), Mn (−0.68 %), Fe (−4.6 %), Ni (−7.6 %), and Cu (−21 %) concentrations.
-
The contribution ratios of biomass burning, non-ferrous metal smelting, coal combustion, ferrous metal smelting, heavy oil combustion, and traffic-related dust changed from 33 %, 11 %, 15 %, 13 %, 3 %, and 25 % to 33 %, 8 %, 8 %, 13 %, 4 %, and 33 %, respectively.
-
All elements did not show significant non-carcinogenic and carcinogenic risks, while both As and Pb still displayed relatively high health damages.
Our study presented detailed information about the impact of clean air policy on the chemical compositions and source apportionment of trace elements in PM2.5 in Tangshan and provided new insights for the scientific community and policymakers. Many targeted measures could be undertaken to alleviate the air pollution and further to reduce avoided premature health risks. However, this study still suffered some limitations and more steps will be taken toward thoroughly addressing these problems. First of all, the PMF model still showed some uncertainties, and thus characterising the isotopic signatures of the elements is of great significance. In addition, a sunset OC EC analyser, a monitoring of aerosols and gases (MARGA) platform, and other online measurements should be collocated to probe into the synergistic effect of emission reduction and meteorology on air quality.
The boundary layer height dataset was obtained from the website of https://www.ecmwf.int/ (last access: 1 April 2023). The dataset is archived at https://doi.org/10.5281/zenodo.7031974 (Li, 2022).
The supplement related to this article is available online at: https://doi.org/10.5194/acp-23-4709-2023-supplement.
RL wrote the paper. RL, MP, WZ, and JH contributed to the conceptualisation of the study. RL, YG, YC, and MP conducted the research, and visualised the results. GW revised the paper.
The contact author has declared that none of the authors has any competing interests.
Publisher’s note: Copernicus Publications remains neutral with regard to jurisdictional claims in published maps and institutional affiliations.
This work was supported by the National Natural Science Foundation of China (42107113).
This research has been supported by the National Natural Science Foundation of China (grant no. 42107113).
This paper was edited by Willy Maenhaut and reviewed by two anonymous referees.
Alies, B., Sasaki, I., Proux, O., Sayen, S., Guillon, E., Faller, P., and Hureau, C.: Zn impacts Cu coordination to amyloid-β, the Alzheimer's peptide, but not the ROS production and the associated cell toxicity, Chem. Commun., 49, 1214–1216, 2013.
Alves, C. A., Gomes, J., Nunes, T., Duarte, M., Calvo, A. I., Custodio, D., Pio, C., Karanasiou, A., and Querol, X.: Size-segregated particulate matter and gaseous emissions from motor vehicles in a road tunnel, Atmos. Res., 153, 134–144, https://doi.org/10.1016/j.atmosres.2014.08.002, 2015.
Ao, M., Qiu, G., Zhang, C., Xu, X., Zhao, L., Feng, X., Qin, S., and Meng, B.: Atmospheric deposition of antimony in a typical mercury-antimony mining area, Shaanxi Province, Southwest China, Environ. Pollut., 245, 173–182, https://doi.org/10.1016/j.envpol.2018.10.125, 2019.
Chang, Y., Huang, K., Xie, M., Deng, C., Zou, Z., Liu, S., and Zhang, Y.: First long-term and near real-time measurement of trace elements in China's urban atmosphere: temporal variability, source apportionment and precipitation effect, Atmos. Chem. Phys., 18, 11793–11812, https://doi.org/10.5194/acp-18-11793-2018, 2018.
Chen, G. B., Li, S. S., Knibbs, L. D., Hamm, N. A. S., Cao, W., Li, T. T., Guo, J. P., Ren, H. Y., Abramson, M. J., and Guo, Y. M.: A machine learning method to estimate PM2.5 concentrations across China with remote sensing, meteorological and land use information, Sci. Total Environ., 636, 52–60, https://doi.org/10.1016/j.scitotenv.2018.04.251, 2018.
Chen, J., Li, C., Ristovski, Z., Milic, A., Gu, Y., Islam, M. S., Wang, S., Hao, J., Zhang, H., and He, C.: A review of biomass burning: Emissions and impacts on air quality, health and climate in China, Sci. Total Environ., 579, 1000–1034, https://doi.org/10.1016/j.scitotenv.2016.11.025, 2017.
Clements, A. L., Buzcuguven, B., Fraser, M. P., Kulkarni, P., and Chellam, S.: Role of particulate metals in heterogenous secondary sulfate formation, Atmos. Environ., 75, 233–240, https://doi.org/10.1016/j.atmosenv.2013.04.038, 2013.
Clements, N., Eav, J., Xie, M., Hannigan, M. P., Miller, S. L., Navidi, W., Peel, J. L., Schauer, J. J., Shafer, M. M., and Milford, J. B.: Concentrations and source insights for traceelements infine and coarse particulate matter, Atmos. Environ., 89, 373–381, https://doi.org/10.1016/j.atmosenv.2014.01.011, 2014.
Cui, L., Duo, B., Zhang, F., Li, C., Fu, H., and Chen, J.: Physiochemical characteristics of aerosol particles collected from the Jokhang Temple indoors and the implication to human exposure, Environ. Pollut., 236, 992–1003, https://doi.org/10.1016/j.envpol.2017.10.107, 2018.
Cui, M., Chen, Y., Feng, Y., Li, C., Zheng, J., Tian, C., Yan, C., and Zheng, M.: Measurement of PM and its chemical composition in real-world emissions from non-road and on-road diesel vehicles, Atmos. Chem. Phys., 17, 6779–6795, https://doi.org/10.5194/acp-17-6779-2017, 2017.
Cui, X., Wang, X., and Liu, B.: The characteristics of heavy metal pollution in surface dust in Tangshan, a heavily industrialized city in North China, and an assessment of associated health risks, J. Geochem. Explor., 210, 106432, https://doi.org/10.1016/j.gexplo.2019.106432, 2020.
Cui, Y., Ji, D., Chen, H., Gao, M., Maenhaut, W., He, J., and Wang, Y.: Characteristics and sources of hourly trace elements in airborne fine particles in urban Beijing, China, J. Geophys. Res.-Atmos., 124, 11595–11613, https://doi.org/10.1029/2019JD030881, 2019.
D'Alessandro, A., Lucarelli, F., Mandò, P. A., Marcazzan, G., Nava, S., Prati, P., Valli, G., Vecchi, R., and Zucchiatti, A.: Hourly elemental composition and sources identification of fine and coarse PM10 particulate matter in four Italian towns, J. Aerosol Sci., 34, 243–259, 2003.
Dall'Osto, M., Querol, X., Amato, F., Karanasiou, A., Lucarelli, F., Nava, S., Calzolai, G., and Chiari, M.: Hourly elemental concentrations in PM2.5 aerosols sampled simultaneously at urban background and road site during SAPUSS – diurnal variations and PMF receptor modelling, Atmos. Chem. Phys., 13, 4375–4392, https://doi.org/10.5194/acp-13-4375-2013, 2013.
Das, R., Mohtar, A. T. B. M., Rakshit, D., Shome, D., and Wang, X.: Sources of atmospheric lead (Pb) in and around an Indian megacity, Atmos. Environ., 193, 57–65, https://doi.org/10.1016/j.atmosenv.2018.08.062, 2018.
Duan, J. and Tan, J.: Atmospheric heavy metals and arsenic in China: situation, sources and control policies, Atmos. Environ., 74, 93–101, https://doi.org/10.1016/j.atmosenv.2013.03.031, 2013.
Fang, B., Zhang, L., Zeng, H., Liu, J., Yang, Z., Wang, H., Wang, Q., and Wang, M.: PM2.5-bound polycyclic aromatic hydrocarbons: sources and health risk during non-heating and heating periods (Tangshan, China), Int. J. Environ. Res. Public Health, 17, 483, https://doi.org/10.3390/ijerph17020483, 2020.
Fernandez, J. A., Rey, A., and Carballeira, A.: An extended study of heavy metal deposition in Galicia (NW Spain) based on moss analysis, Sci. Total Environ., 254, 31–44, https://doi.org/10.1016/s0048-9697(00)00431-9, 2000.
Furger, M., Minguillón, M. C., Yadav, V., Slowik, J. G., Hüglin, C., Fröhlich, R., Petterson, K., Baltensperger, U., and Prévôt, A. S. H.: Elemental composition of ambient aerosols measured with high temporal resolution using an online XRF spectrometer, Atmos. Meas. Tech., 10, 2061–2076, https://doi.org/10.5194/amt-10-2061-2017, 2017.
Geng, G., Xiao, Q., Zheng, Y., Tong, D., Zhang, Y., Zhang, X., Zhang, Q., He, K., and Liu, Y.: Impact of China's air pollution prevention and control action plan on PM2.5 chemical composition over eastern China, Sci. China Earth Sci., 62, 1872–1884, https://doi.org/10.1007/s11430-018-9353-x, 2019.
Grivas, G., Cheristanidis, S., Chaloulakou, A., Koutrakis, P., and Mihalopoulos, N.: Elemental composition and source apportionmentoffine and coarse particles at traffic and urban background locations in Athens, Greece, Aerosol Air Qual. Res., 18, 1642–1659, 2018.
Guo, J., Tilgner, A., Yeung, C., Wang, Z., Louie, P. K. K., Luk, C. W. Y., Xu, Z., Yuan, C., Gao, Y., and Poon, S.: Atmospheric peroxides in a polluted subtropical environment: seasonal variation, sources and sinks, and importance of heterogeneous processes, Environ. Sci. Technol., 48, 1443–1450, https://doi.org/10.1021/es403229x, 2014.
Harmens, H., Norris, D. A., Steinnes, E., Kubin, E., Piispanen, J., Alber, R., Aleksiayenak, Y., Blum, O., Coskun, M., and Dam, M.: Mosses as biomonitors of atmospheric heavy metal deposition: Spatial patterns and temporal trends in Europe, Environ. Pollut., 158, 3144–3156, https://doi.org/10.1016/j.envpol.2010.06.039, 2010.
He, Q., Zhang, M., Song, Y., and Huang, B.: Spatiotemporal assessment of PM2.5 concentrations and exposure in China from 2013 to 2017 using satellite-derived data, J. Cleaner Prod., 286, 124965, https://doi.org/10.1016/j.jclepro.2020.124965, 2021.
Hjortenkrans, D. S., Bergbäck, B. G., and Häggerud, A. V.: Metal emissions from brake linings and tires: case studies of Stockholm, Sweden 1995/1998 and 2005, Environ. Sci. Technol., 41, 5224–5230, https://doi.org/10.1021/es070198o, 2007.
Holden, P. A., Gardeatorresdey, J. L., Klaessig, F., Turco, R. F., Mortimer, M., Hundrinke, K., Hubal, E. A. C., Avery, D., Barcelo, D., and Behra, R.: Considerations of environmentally relevant test conditions for improved evaluation of ecological hazards of engineered nanomaterials, Environ. Sci. Technol., 50, 6124–6145, https://doi.org/10.1021/acs.est.6b00608, 2016.
Huang, C., Bao, L., Luo, P., Wang, Z., Li, S., and Zeng, E. Y.: Potential health risk for residents around a typical e-waste recycling zone via inhalation of size-fractionated particle-bound heavy metals, J. Hazard. Mater., 317, 449–456, https://doi.org/10.1016/j.jhazmat.2016.05.081, 2016.
Jeong, C.-H., Wang, J. M., and Evans, G. J.: Source Apportionment of Urban Particulate Matter using Hourly Resolved Trace Metals, Organics, and Inorganic Aerosol Components, Atmos. Chem. Phys. Discuss. [preprint], https://doi.org/10.5194/acp-2016-189, 2016.
Kamal, A., Cincinelli, A., Martellini, T., and Malik, R. N.: A review of PAH exposure from the combustion of biomass fuel and their less surveyed effect on the blood parameters, Environ. Sci. Pollut. Res., 22, 4076–4098, https://doi.org/10.1007/s11356-014-3748-0, 2015.
Kang, S., Chen, P., Li, C., Liu, B., and Cong, Z.: Atmospheric aerosol elements over the inland Tibetan Plateau: concentration, seasonality, and transport, Aerosol Air Qual. Res., 16, 789–800, 2016.
Ke, H. B., Gong, S. L., He, J. J., Zhou, C. H., Zhang, L., Zhou, Y. K.: Spatial and temporal distribution of open bio-mass burning in China from 2013 to 2017, Atmos. Environ., 210, 156–165, 2019.
Li, R.: Heavy metal, Zenodo [data set], https://doi.org/10.5281/zenodo.7031974, 2022.
Li, R., Fu, H., Cui, L., Li, J., Wu, Y., Meng, Y., Wang, Y., and Chen, J.: The spatiotemporal variation and key factors of SO2 in 336 cities across China, J. Cleaner Prod., 210, 602–611, https://doi.org/10.1016/j.jclepro.2018.11.062, 2019.
Li, R., Guo, J. P., Geng, G. N., Xiao, Q. Y., and Zhang, Q.: Satellite-derived long-term estimates of full-coverage PM1 concentrations across China based on a stacking decision tree model, Atmos. Environ., 255, 118448, https://doi.org/10.1016/j.atmosenv.2021.118448, 2021a.
Li, R., Zhao, Y., Fu, H., Chen, J., Peng, M., and Wang, C.: Substantial changes in gaseous pollutants and chemical compositions in fine particles in the North China Plain during the COVID-19 lockdown period: anthropogenic vs. meteorological influences, Atmos. Chem. Phys., 21, 8677–8692, https://doi.org/10.5194/acp-21-8677-2021, 2021b.
Li, Z., Jiang, J., Ma, Z., Fajardo, O. A., Deng, J., and Duan, L.: Influence of flue gas desulfurization (FGD) installations on emission characteristics of PM2.5 from coal-fired power plants equipped with selective catalytic reduction (SCR), Environ. Pollut., 230, 655–662, https://doi.org/10.1016/j.envpol.2017.06.103, 2017.
Li, Z., Wang, Y., Li, Z., Guo, S., and Hu, Y.: Levels and sources of PM2.5-associated pahs during and after the wheat harvest in a central rural area of the Beijing-Tianjin-Hebei (BTH) region, Aerosol Air Qual. Res., 20, 1070–1082, 2020.
Lin, Y., Hsu, S., Chou, C. C. K., Zhang, R., Wu, Y., Kao, S., Luo, L., Huang, C., Lin, S., and Huang, Y.: Wintertime haze deterioration in Beijing by industrial pollution deduced from trace metal fingerprints and enhanced health risk by heavy metals, Environ. Pollut., 208, 284–293, https://doi.org/10.1016/j.envpol.2015.07.044, 2016.
Liu, H., He, K., Wang, Q., Huo, H., Lents, J., Davis, N., Nikkila, N., Chen, C., Osses, M., and He, C.: Comparison of vehicle activity and emission inventory between Beijing and Shanghai, J. Air Waste Manage., 57, 1172–1177, https://doi.org/10.3155/1047-3289.57.10.1172, 2007.
Liu, J., Chen, Y., Chao, S., Cao, H., Zhang, A., and Yang, Y.: Emission control priority of PM2.5-bound heavy metals in different seasons: A comprehensive analysis from health risk perspective, Sci. Total Environ., 644, 20–30, https://doi.org/10.1016/j.scitotenv.2018.06.226, 2018.
Liu, R., Men, C., Yu, W., Xu, F., Wang, Q., and Shen, Z.: Uncertainty in positive matrix factorization solutions for PAHs in surface sediments of the Yangtze River Estuary in different seasons, Chemosphere, 191, 922–936, https://doi.org/10.1016/j.chemosphere.2017.10.070, 2018.
Lopez-Cruz, J., Crespo-Salvador, O., Fernandez-Crespo, E., Garcia-Agustin, P., and Gonzalez-Bosch, C.: Absence of Cu-Zn superoxide dismutase BCSOD1 reduces Botrytis cinerea virulence in Arabidopsis and tomato plants, revealing interplay among reactive oxygen species, callose and signaling pathways, Mol. Plant Pathol., 18, 16–31, 2016.
Lyu, X., Chen, N., Guo, H., Zeng, L., Zhang, W., Shen, F., Quan, J., and Wang, N.: Chemical characteristics and causes of airborne particulate pollution in warm seasons in Wuhan, central China, Atmos. Chem. Phys., 16, 10671–10687, https://doi.org/10.5194/acp-16-10671-2016, 2016.
Lyu, Y., Zhang, K., Chai, F., Cheng, T., Yang, Q., Zheng, Z., and Li, X.: Atmospheric size-resolved trace elements in a city affected by non-ferrous metal smelting: Indications of respiratory deposition and health risk, Environ. Pollut., 224, 559–571, https://doi.org/10.1016/j.envpol.2017.02.039, 2017.
Ma, Z., Liu, R., Liu, Y., and Bi, J.: Effects of air pollution control policies on PM2.5 pollution improvement in China from 2005 to 2017: a satellite-based perspective, Atmos. Chem. Phys., 19, 6861–6877, https://doi.org/10.5194/acp-19-6861-2019, 2019.
Manju, A., Kalaiselvi, K., Dhananjayan, V., Palanivel, M., Banupriya, G., Vidhya, M., Panjakumar, K., and Ravichandran, B.: Spatio-seasonal variation in ambient air pollutants and influence of meteorological factors in Coimbatore, Southern India, Air Qual. Atmos. Health, 11, 1179–1189, https://doi.org/10.1007/s11869-018-0617-x, 2018.
Manousakas, M., Papaefthymiou, H., Diapouli, E., Migliori, A., Karydas, A. G., Bogdanovic-Radovic, I., and Eleftheriadis, K.: Assessment of PM2.5 sources and their corresponding level of uncertainty in a coastal urban area using EPA PMF 5.0 enhanced diagnostics, Sci. Total Environ., 574, 155–164, 2017.
Micheline, G., Rachida, C., Celine, M., Gaby, K., Rachid, A., and Petru, J.: Levels of Pb, Cd, Hg and As in fishery products from the eastern Mediterranean and human health risk assessment due to their Consumption, Intern. J. Environ. Res., 13, 443–455, https://doi.org/10.1007/s41742-019-00185-w, 2019.
Moreno, T., Querol, X., Alastuey, A., La Rosa, J. D. D., La Campa, A. M. S. D., Minguillon, M., Pandolfi, M., Gonzalez-Castanedo, Y., Monfort, E., and Gibbons, W.: Variations in vanadium, nickel and lanthanoid element concentrations in urban air, Sci. Total Environ., 408, 4569–4579, https://doi.org/10.1016/j.scitotenv.2010.06.016, 2010.
Norris, G., Duvall, R., Brown, S., and Bai, S.: EPA positive matrix factorization (PMF) 5.0 fundamentals and user guide, U.S, Environmental Protection Agency Office of Research and Development, Washington, DC, 20460, (i-124, EPA/600/R-14/108, April), 2014.
Oldani, K. M., Mladenov, N., Williams, M., Campbell, C. M., and Lipson, D. A.: Seasonal patterns of dry deposition at a high-elevation site in the colorado rocky mountains, J. Geophys. Res.-Atmos., 122, 11183–11200, 2017.
Olujimi, O. O., Oputu, O., Fatoki, O. S., Opatoyinbo, O. E., Aroyewun, O. A., and Baruani, J.: Heavy metals speciation and human health risk assessment at an illegal gold mining site in Igun, Osun State, Nigeria, J. Health. Pollut., 5, 19–32, 2015.
Paatero, P. and Tapper, U.: Positive matrix factorization: A non-negative factor model with optimal utilization of error estimates of data values, Environmetrics, 5, 111–126, 1994.
Pacyna, J. M. and Pacyna, E. G.: An assessment of global and regional emissions of trace metals to the atmosphere from anthropogenic sources worldwide, Environ. Rev., 9, 269–298, 2001.
Prati, P., Zucchiatti, A., Lucarelli, F., and Mandò, P. A.: Source apportionment near a steel plant in Genoa (Italy) by continuous aerosol sampling and PIXE analysis, Atmos. Environ., 34, 3149–3157, 2000.
Rai, P. K., Lee, S. S., Zhang, M., Tsang, Y. F., and Kim, K.: Heavy metals in food crops: Health risks, fate, mechanisms, and management, Environ. Int., 125, 365–385, 2019.
Rasmussen, P. E.: Long-range atmospheric transport of trace metals: the need for geoscience perspectives, Environ. Earth Sci., 33, 96–108, 1998.
Reff, A., Eberly, S. I., and Bhave, P. V.: Receptor modeling of ambient particulate matter data using positive matrix factorization: review of existing methods, J. Air Waste Manage., 57, 146–154, 2007.
Ren, Z., Zhang, B., Lu, P., Li, C., Gao, L., and Zheng, M.: Characteristics of air pollution by polychlorinated dibenzo-p-dioxins and dibenzofurans in the typical industrial areas of Tangshan City, China, J. Environ. Sci.-China, 23, 228–235, 2011.
Saffari, A., Daher, N., Shafer, M. M., Schauer, J. J., and Sioutas, C.: Global perspective on the oxidative potential of airborne particulate matter: a synthesis of research findings, Environ. Sci. Technol., 48, 7576–7583, 2014.
Shafer, M. M., Toner, B. M., Overdier, J. T., Schauer, J. J., Fakra, S. C., Hu, S., Herner, J. D., and Ayala, A.: Chemical speciation of vanadium in particulate matter emitted from diesel vehicles and urban atmospheric aerosols, Environ. Sci. Technol., 46, 189–195, 2012.
Shi, G., Teng, J., Ma, H., Li, Y., and Sun, B.: Metals and metalloids in precipitation collected during CHINARE campaign from Shanghai, China, to Zhongshan Station, Antarctica: Spatial variability and source identification, Global Biogeochem. Cy., 29, 760–774, 2015.
Song, Z. F.: An assessment of the heavy metal pollution and potential ecological hazards in urban soil of Tangshan City, Geology in China, 38, 1379–1386, 2011.
Storelli, M. M.: Potential human health risks from metals (Hg, Cd, and Pb) and polychlorinated biphenyls (PCBs) via seafood consumption: estimation of target hazard quotients (THQs) and toxic equivalents (TEQs), Food Chem. Toxicol., 46, 2782–2788, 2008.
Taghvaee, S., Sowlat, M. H., Mousavi, A., Hassanvand, M. S., Yunesian, M., Naddafi, K., and Sioutas, C.: Source apportionment of ambient PM2.5 in two locations in central Tehran using the Positive Matrix Factorization (PMF) model, Sci. Total Environ., 628–629, 672–686, 2018.
Tang, Q., Sheng, W., Li, L., Zheng, L., Miao, C., and Sun, R.: Alteration behavior of mineral structure and hazardous elements during combustion of coal from a power plant at Huainan, Anhui, China, Environ. Pollut., 239, 768–776, 2018.
Tian, H. Z., Zhu, C. Y., Gao, J. J., Cheng, K., Hao, J. M., Wang, K., Hua, S. B., Wang, Y., and Zhou, J. R.: Quantitative assessment of atmospheric emissions of toxic heavy metals from anthropogenic sources in China: historical trend, spatial distribution, uncertainties, and control policies, Atmos. Chem. Phys., 15, 10127–10147, https://doi.org/10.5194/acp-15-10127-2015, 2015.
Tianxue, W., Yuesi, W., Shihyu, C., and Guangren, L.: On-line measurement of water-soluble ions in ambient particles, Adv. Atmos. Sci., 23, 586–592, 2006.
Wang, S., Su, H., Chen, C., Tao, W., Streets, D. G., Lu, Z., Zheng, B., Carmichael, G. R., Lelieveld, J., Pöschl, U., and Cheng, Y.: Natural gas shortages during the “coal-to-gas” transition in China have caused a large redistribution of air pollution in winter 2017, P. Natl. Acad. Sci. USA, 117, 31018–31025, 2020.
Westerdahl, D., Wang, X., Pan, X., and Zhang, K. M.: Characterization of on-road vehicle emission factors and microenvironmental air quality in Beijing, China, Atmos. Environ., 43, 697–705, https://doi.org/10.1016/j.atmosenv.2008.09.042, 2009.
Witt, M. L. I., Baker, A. R., and Jickells, T. D.: Atmospheric trace metals over the Atlantic and South Indian Oceans: Investigation of metal concentrations and lead isotope ratios in coastal and remote marine aerosols, Atmos. Environ., 40, 5435–5451, https://doi.org/10.1016/j.atmosenv.2006.04.041, 2006.
Wu, Q. R., Wang, S. X., Zhang, L., Song, J. X., Yang, H., and Meng, Y.: Update of mercury emissions from China's primary zinc, lead and copper smelters, 2000–2010, Atmos. Chem. Phys., 12, 11153–11163, https://doi.org/10.5194/acp-12-11153-2012, 2012.
Wu, Y., Wang, R., Zhou, Y., Lin, B., Fu, L., He, K., and Hao, J.: On-road vehicle emission control in beijing: past, present, and future, Environ. Sci. Technol., 45, 147–153, https://doi.org/10.1021/es1014289, 2011.
Xiao, Q., Geng, G., Liang, F., Wang, X., Lv, Z., Lei, Y., Huang, X., Zhang, Q., Liu, Y., and He, K.: Changes in spatial patterns of PM2.5 pollution in China 2000–2018: Impact of clean air policies, Environ. Int., 141, 105776, https://doi.org/10.1016/j.envint.2020.105776, 2020.
Yang, Q., Yuan, Q., Li, T., Shen, H., and Zhang, L.: The relationships between PM2.5 and meteorological factors in China: seasonal and regional variations, Int. J. Env. Res. Pub. He., 14, 1510, https://doi.org/10.3390/ijerph14121510, 2017.
Yi, Y., Yang, Z., and Zhang, S.: Ecological risk assessment of heavy metals in sediment and human health risk assessment of heavy metals in fishes in the middle and lower reaches of the Yangtze River basin, Environ. Pollut., 159, 2575–2585, https://doi.org/10.1016/j.envpol.2011.06.011, 2011.
Yu, L., Wang, G., Zhang, R., Zhang, L., Song, Y., Wu, B., Li, X., An, K., and Chu, J.: Characterization and source apportionment of pm2.5 in an urban environment in Beijing, Aerosol Air Qual. Res., 13, 574–583, https://doi.org/10.4209/aaqr.2012.07.0192, 2013.
Zhang, J., Zhou, X., Wang, Z., Yang, L., Wang, J., and Wang, W.: Trace elements in PM2.5 in Shandong Province: Source identification and health risk assessment, Sci. Total Environ., 621, 558–577, 2018.
Zhang, Q., Zheng, Y., Tong, D., Shao, M., Wang, S., Zhang, Y., Xu, X., Wang, J., He, H., Liu, W., Ding, Y., Lei, Y., Li, J., Wang, Z., Zhang, X., Wang, Y., Cheng, J., Liu, Y., Shi, Q., Yan, L., Geng, G., Hong, C., Li, M., Liu, F., Zheng, B., Cao, J., Ding, A., Gao, J., Fu, Q., Huo, J., Liu, B., Liu, Z., Yang, F., He, K., and Hao, J.: Drivers of improved PM2.5 air quality in China from 2013 to 2017, P. Natl. Acad. Sci. USA, 116, 24463–24469, https://doi.org/10.1073/pnas.1907956116, 2019.
Zhao, M., Zhang, Y., Ma, W., Fu, Q., Yang, X., Li, C., Zhou, B., Yu, Q., and Chen, L.: Characteristics and ship traffic source identification of air pollutants in China's largest port, Atmos. Environ., 64, 277–286, https://doi.org/10.1016/j.atmosenv.2012.10.007, 2013.
Zhu, C., Tian, H., Hao, Y., Gao, J., Hao, J., Wang, Y., Hua, S., Wang, K., and Liu, H.: A high-resolution emission inventory of anthropogenic trace elements in Beijing-Tianjin-Hebei (BTH) region of China, Atmos. Environ., 191, 452–462, https://doi.org/10.1016/j.atmosenv.2018.08.035, 2018.
Zhu, C., Tian, H., and Hao, J.: Global anthropogenic atmospheric emission inventory of twelve typical hazardous trace elements, 1995–2012, Atmos. Environ., 220, 117061, https://doi.org/10.1016/j.atmosenv.2019.117061, 2020.