the Creative Commons Attribution 4.0 License.
the Creative Commons Attribution 4.0 License.
 | 14 Apr 2023
Model-based insights into aerosol perturbation on pristine continental convective precipitation
Mengjiao Jiang
Yaoting Li
Weiji Hu
Yinshan Yang
The Tibetan Plateau (TP) is of great importance for weather and climate due to its role as a heat and water resource. Relatively clean aerosol conditions over the Plateau make the study on the aerosol–cloud–precipitation interactions in this pristine continental region distinctive. In order to investigate the impacts of aerosols on small-scale convection processes over the TP, a convective event with precipitation observed on 24 July 2014 in Naqu was selected to explore the influence of aerosols on the onset and intensity of precipitation. We use the Modern-Era Retrospective analysis for Research and Applications Version 2 (MERRA-2) reanalysis to derive the cloud condensation nuclei (CCN) number concentration, which can be regarded as the real-time background. These values are adopted to initialize the regional Weather Research Forecast (WRF) 4.0 meteorological model and to simulate the onset of convective events and the formation of precipitation. Four sets of experiments, named clean ( CCN), control (default setting), Tibetan Plateau (CCN calculated from MERRA-2 reanalysis), and polluted (10 times CCN), were adopted for our simulations. A detailed analysis of the microphysical processes shows that the conversion of cloud water into rain is enhanced by small increases in aerosol concentration, while it is suppressed by larger increases in concentration. However, the transformation of cloud water to graupel and the development of convective clouds are favored under a polluted situation. As a result, the onset of the precipitation is delayed and cold-rain intensity increases.
- Article
(3747 KB) - Full-text XML
- BibTeX
- EndNote


The role of aerosol particles on the formation of convective clouds and related precipitation remains a matter of extensive scientific investigations (Andreae et al., 2004; Fan et al., 2013; Freud and Rosenfeld, 2012; Li et al., 2011; Rosenfeld et al., 2008; Sun and Zhao, 2021; Tao et al., 2012; Zhao et al., 2020). Due to the complexity of the processes involved, the treatment of convective cloud formation in weather forecast models remains uncertain, especially for the regions with insufficient observational data (Ma et al., 2018). The Tibetan Plateau (TP) represents a clean region, in which the aerosol optical depth baseline value is comparable to that in the Arctic and remote ocean areas (Pokharel et al., 2019; Yang et al., 2021b). However, even though the TP is regarded as a pristine continent, it is occasionally perturbed by the intrusion of dust particles originating in the surrounding deserts and by black carbon particles produced by biomass burning in the regions of South Asia and part of Africa (Zhu et al., 2019; Zhao et al., 2020; Yang et al., 2021b). The analysis presented here in the climate-sensitive and environmentally fragile continental TP characterized by frequent convective events will hopefully be of interest for similar investigations to be conducted in other areas of the world, which is about the aerosol perturbations on a pristine continent.
The Tibetan Plateau, with an average elevation of more than 4000 m, covers approximately a quarter of the Chinese territory (Wu et al., 2007; Yao et al., 2012). It greatly influences weather and climate in East Asia and even globally due to its unique geographical location and topography-induced thermal and dynamical effects (Pokharel et al., 2019). The water vapor balance on the TP directly affects the water cycle over a large area of the plateau and the surrounding areas due to high sensible heat and low air density (Duan et al., 2012; Fu et al., 2006; Zhao et al., 2018). Convection on the Tibetan Plateau is characterized by high-frequency but low-intensity activity (Fu et al., 2006; Gao et al., 2016; Ye, 1981). Aerosols can act as cloud condensation nuclei (CCN) and ice nuclei (IN) that affect cloud microphysical processes and thermal and dynamical conditions (Intergovernmental Panel on Climate Change (IPCC), 2013; Redemann et al., 2021; Stevens et al., 2017; Yang et al., 2021a). Relatively clean conditions with low levels of background aerosols, frequent convection, and induced precipitation make the study of aerosols' impact on convective precipitation over the TP distinctive.
Aerosol observational sites over the TP are sparse. Ground-based observations include (1) the two stations of the Automated Aerosol Observation Network (AERONET) in Nam Co and Qomolangma (QOMS); (2) the stations of PM2.5 and PM10 concentrations from the China Air Quality Online Monitoring and Analysis Platform of the Ministry of Environmental Protection at the seven stations of Linzhi, Ali, Lhasa, Changdu, Naqu, Shannan, and Shigatse; and (3) the concentrations of PM1 at four stations from China Meteorological Administration (CMA) Atmosphere Watch Network (CAWNET) at Gongga, Lhasa, Xining, and Shangri-La. The monitoring of PM2.5 and PM10 on the TP were initiated in January 2013 at Lhasa, in January 2015 at Ali and Naqu, and in January 2017 at Changdu, Shannan, Shigatse, and Linzhi. The CMA recorded PM1 data at Gonga, Lhasa, and Shangri-La from January 2014, and at Xining starting in 2018. CMA used a GRIMM model 1.180 aerosol spectrometer with observations every 5 min at wavelengths ranging from 1 to 10 µm. A decade of measurements of aerosol optical properties at two AERONET stations, Nam Co and QOMS on the Tibetan Plateau, shows that aerosol optical depth (AOD) values were maximum in spring and minimum in autumn (Pokharel et al., 2019). Due to the anisotropic reflection of the unique geographical surface in TP, the satellite retrieval of aerosol properties is difficult (Zhao et al., 2020). The main aerosol types on the Tibetan Plateau were further identified as continental background, biomass burning, and dust (Pokharel et al., 2019; Yang et al., 2021b; Zhu et al., 2019; Zhao et al., 2020). Satellite observations from March to June indicate that aerosols are transported from South Asia to the region close to the Himalayas (Liu et al., 2008). In summer, aerosols from Northwest China and Central Asia are transported to the northern Tibetan Plateau (Huang et al., 2007). In general, aerosol conditions over the TP correspond mainly to a background situation. However, incoming pollution from South/East Asia under the influence of the summer monsoon can cause relatively high disturbances in the area of the Tibetan Plateau.
Among the studies conducted in development over the TP are the Third Tibetan Plateau Atmospheric Scientific Experiment (TIPEX-II and TIPEX-III), initiated jointly by the China Meteorological Administration (CMA), the Chinese Academy of Sciences (CAS), and the National Natural Scientific Foundation of China (NSFC) (Zhao et al., 2018), and the Third Pole Environment (TPE) Program, which was initially proposed and agreed upon by several participants from China, India, Germany, Japan, Italy, Nepal, the Netherlands, Norway, Pakistan, US, Canada, Tajikistan, and Switzerland (Yao et al., 2012). These studies highlighted the role of aerosol characteristics and related impact on cloud and precipitation in the TP in relation to weather and climate modification due to East Asia and South Asia anthropogenic emissions, dust mobilization in the Taklamakan Desert (Kang et al., 2019; Liu et al., 2019; Xu et al., 2015), and also in relation to further impacts on the weather system in the downstream regions, e.g., Yangtze Delta region, or/and Sichuan Basin (Lau and Kim, 2018; Liu et al., 2019, 2020; Zhao et al., 2018, 2020). It has been shown that cloud cover and radiation effects in pristine regions are particularly sensitive to aerosols (Garrett and Zhao, 2006). Further, aerosols on the Tibetan Plateau can affect weather and climate directly by absorbing and scattering solar radiation and indirectly by modifying the nature of the clouds. Using a cloud-resolving Weather Research and Forecasting (WRF) model, Zhou et al. (2017) found that the increase in the aerosol load over the plateau not only contributes to enhanced updrafts in clouds but also transports a larger number of ice phase particles to the upper troposphere. Based on satellite observations and the reanalysis of the dataset, Liu et al. (2019) studied the effect of aerosols on clouds over the Tibetan Plateau and the effect of dust-contaminated convective clouds on precipitation in downstream areas. They identified an effect of Taklamakan dust on convective clouds, which in turn causes heavy rainfall in downstream areas. However, one should highlight that there are still some uncertainties in the satellite retrievals. The findings of aerosol-related studies require situation-specific analyses, since the northern and southern parts of the Tibetan Plateau are characterized by different aerosol backgrounds and composition with different climate systems and meteorological conditions. Using the aerosol spectral radiative transfer model (SPRINTARS) and the non-hydrostatic icosahedral atmospheric model (NICAM), Liu et al. (2020) found that dust aerosol transported from the Taklamakan Desert delayed the onset of heavy rainfall in the northern Tibetan Plateau by 12 h through the indirect aerosol–cloud interaction and enhanced the precipitation in the northern region. Aerosols may also influence the Asian monsoon by affecting snow melting trends and TP surface temperature, which in turn affects precipitation (Lee et al., 2013). The role of aerosols in the teleconnections between the heat pump and the stronger convection and precipitation in the TP or downstream regions (Wu et al., 2016) also needs to be accounted for in the weather forecasting models (Liu et al., 2019; Zhao et al., 2020).
Although after decades of efforts, our awareness of Tibetan Plateau aerosols and related weather impact gradually increased, the confidence of current knowledge on aerosols over the TP still needs further observational evidence, more in-depth physical analysis, and model investigation. In order to gain understanding on the formation of small-scale convection and related precipitation, we analyze here a particular event that took place in Naqu (31.483∘ N, 92.067∘ E) on 24 July 2014. As observational data are sparse, we use the Modern-Era Retrospective analysis for Research and Applications Version 2 (MERRA-2) reanalysis to derive the cloud condensation nuclei, which can be regarded as the real-time background. These values are adopted to initialize the regional Weather Research Forecast (WRF) 4.0 meteorological model and to simulate the onset of convective events and the formation of precipitation. Vertical soundings provide data on the state of the background atmosphere. The purpose of the present study is to use available information in this region of the Tibetan Plateau to assess the dependence of the evolution of convective events on the pristine continent under different background atmospheric aerosol burden. Since data in the region of the Tibetan Plateau are sparse, the study relies heavily on model simulations, and the outcome should therefore be regarded as a preliminary and partial attempt to investigate a possible relationship between aerosol and convective precipitation in this region. This methodology could then be applied in other regions of the world with similar background environments.
The paper is organized as follows: Sect. 2 introduces the data and the methodology that are adopted in the study; it also describes the convection event under investigation and presents the experimental design for the numerical simulations. Section 3 compares the microphysical processes that characterize the different model experiments. Section 4 presents a summary and the conclusions.
2.1 Data
2.1.1 MERRA-2 data
MERRA-2, a long-term global reanalysis that assimilates space-based observations of aerosols (Randles et al., 2017), is an upgrade of the offline aerosol analysis data MERRAero based on the GOCART model (Chin et al., 2002). GOCART emission sources include aerosols and gases from biomass burning, fossil fuel combustion, natural emission sources (ocean, volcanic eruptions, dust), etc. (Chin et al., 2014). The bias-revised AOD is obtained from the observations by the Moderate Resolution Imaging Spectroradiometer (MODIS). Cloud-filtered Aerosol Robotic Network (AERONET) AOD data are used as input in a neural network to integrate MODIS radiances into the bias-corrected AOD. The MERRA-2 aerosol reanalysis data are additionally included in the NASA Earth Observing System (EOS), NOAA Polar Operational Environmental Satellites (POES), and ground-based observations (Randles et al., 2017). Note that uncertainties are incurred when satellite retrievals are used over the TP, due to the complicated reflection of the land surface (Yang et al., 2020; Zhao et al., 2020; Jiang et al., 2022). The dataset used in the present paper is the MERRA-2 aerosol mixing ratio data MERRA-2 inst3_3d_aer_Nv for 23 July 2014, with a spatial resolution of (longitude, latitude) on 72 vertical layers and with a temporal resolution of 3 h.
2.1.2 Precipitation and sounding data
The station–satellite combined hourly precipitation data (Shen et al., 2014) are provided by the China Meteorological Data Network National Meteorological Science Data Center, while the ground precipitation observations are obtained from the Naqu automatic station. Note that some unrealistic rainfall centers are depicted over western China due to the sparse automatic weather station network (Shen et al., 2014). The sounding data are taken from the China Meteorological Data Network National Meteorological Science Data Center (http://data.cma.cn, last access: 8 April 2023).
2.2 Method
2.2.1 The calculation for cloud condensation nuclei (CCN)
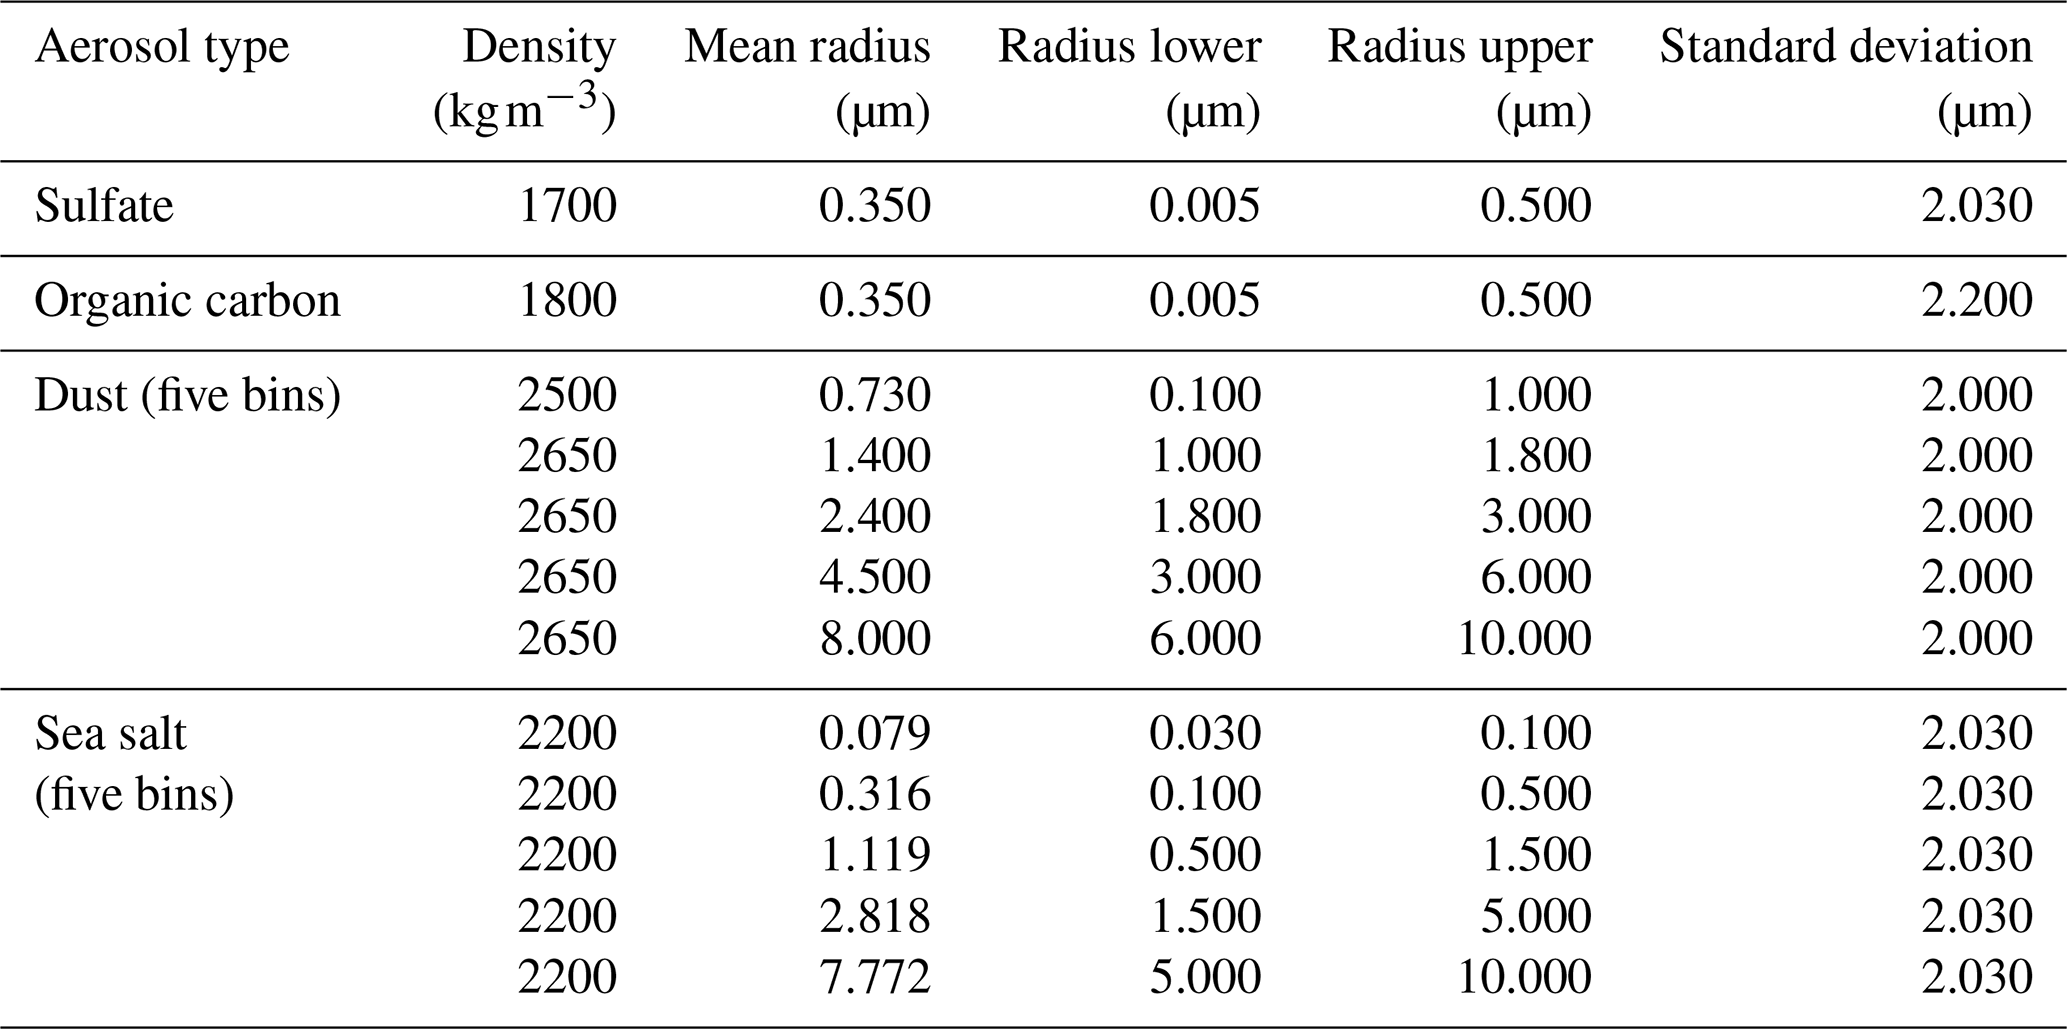
In the Thompson aerosol-aware scheme (Thompson and Eidhammer, 2014), the number concentration of cloud droplets is not fixed but is derived from a series of calculations and look-up tables of the CCN and IN input calculated from the mixing ratio of different aerosol species. This scheme takes into account the activation of cloud condensation nuclei to form cloud droplets. Further, the aerosol background mixing ratios are used to calculate the cloud droplet number concentration. The input MERRA-2 inst3_3d_aer_Nv data contain the following variables: mass mixing ratios of sea salt (SS; five bins), sulfate (SO4), organic carbon (OC), black carbon (BC), and dust (DU; five bins). The characteristic particle sizes, density parameters, and particle size ranges were obtained with reference to the aerosol radius distribution file of MERRA-2 (Chin et al., 2002). We assume that dust particles larger than 0.5 µm are ice-friendly aerosols and that all remaining aerosol species except black carbon are water-friendly aerosols. The aerosol number concentrations are calculated at the WRF preprocessing stage by assuming a log-normal distribution with characteristic diameter and geometric standard deviation in the concentration (Thompson and Eidhammer, 2014). Since the aerosol radius distribution file of MERRA-2 provides the particle size intervals for different bins of sea salt and dust particles, the integration of the probability density function is determined between the lower and the upper limits of the radius. The details of the aerosol parameters are shown in Table 1.
Table 1Aerosol particle radius, standard deviation, and density.
The total mass density calculation equation is derived by
where N is the number concentration (unit: # kg−1), r is the integral radius (unit: µm), σg is the geometric standard deviation (unit: µm), rg is the median radius (unit: µm), and ρ is the particle density (unit: kg m−3). The probability density integral for selected bin needs to be multiplied to the probability P in the corresponding bin, and it is calculated as
Since only dust aerosol particles with a radius greater than 0.5 µm are considered to be ice-friendly aerosols in the model, the percentage of particles with a radius greater than 0.5 µm of the total number of particles in the interval is also calculated after the number concentration is derived for the first dust bin. The number concentration of ice-friendly aerosol Ni and of water-friendly aerosol concentration Nw are calculated by Eqs. (3) and (4), respectively, as follows:
Here, Ndusti is the number concentration of dust aerosol particles for five specific bins, is the sulfate number concentration, NOC is the organic carbon number concentration, and Nssi is the number concentration of sea salt particles for five specific bins. The data are interpolated to the simulation area and finally written to the WRF Pre-Processing System (WPS).
2.2.2 Case selection
The typical convective precipitation event in Naqu, a city in the relatively flat plateau with a simple meadow surface, on 24 July 2014 is selected for simulation. A mesoscale precipitation event with a large-scale impact occurred in the central plateau, while the center of the precipitation area was concentrated in the southern part of the central plateau. The elevation of the central plateau ranges from 4600 to 5200 m. As shown in Fig. 1, Naqu is located at the northern edge of this precipitation, and the 24 h accumulated precipitation amount in Naqu reaches 5.8 mm. On 24 July, the hourly precipitation amount at 07:00 UTC at Naqu station reached 4.7 mm, which is of medium intensity.
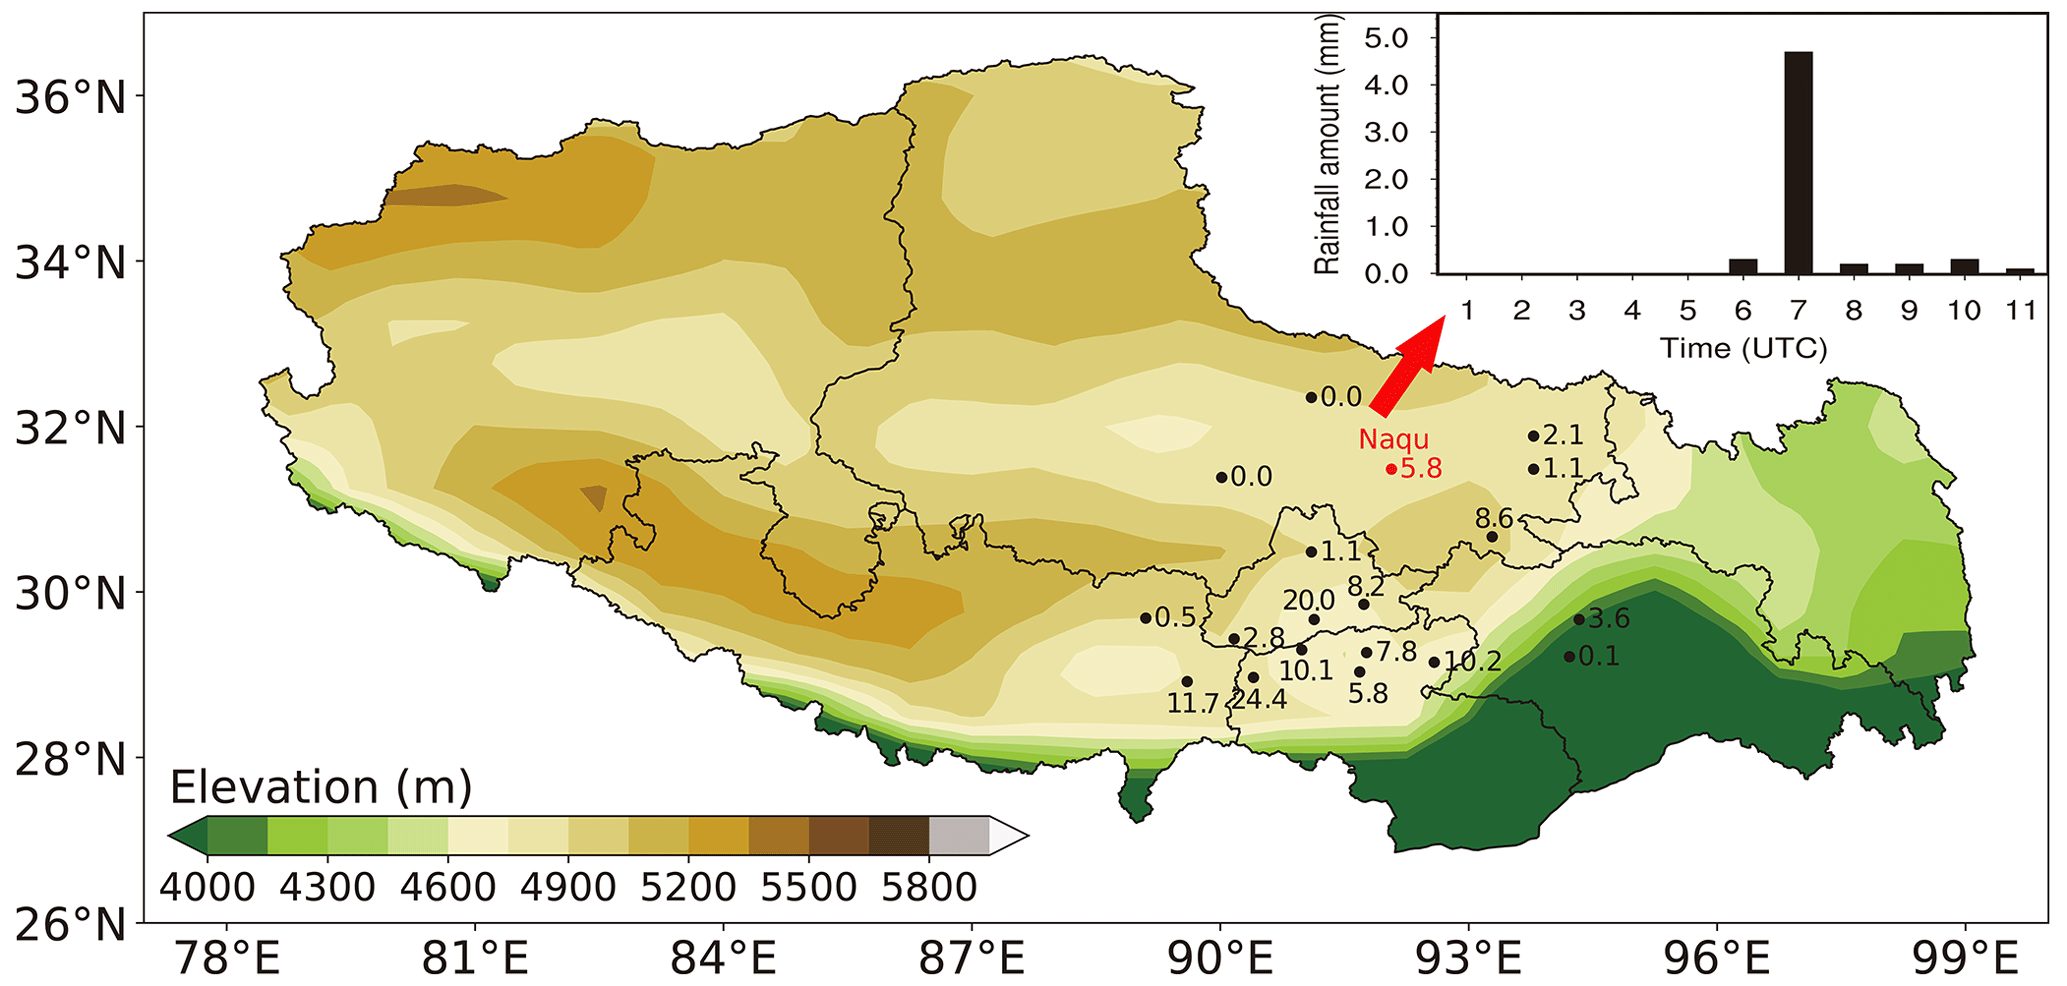
Figure 1Accumulated precipitation of 24 h in Tibet and the hourly precipitation in Naqu on 24 July 2014.
From the sounding data map at 00:00 UTC (08:00 Beijing time (BT)) on 24 July 2014 (Fig. 2a), the temperature dew point difference in Naqu (solid red line minus solid green line) was less than 4 ∘C, which means that a wet layer was formed between 400–500 hPa. A relatively dry area was present above 300 hPa, and the whole layer formed an “inverted trumpet” with a dry upper layer superimposed on a wet lower layer, which is conducive of producing an unstable development of convection. In Fig. 2b, which corresponds to 12:00 UTC (20:00 BT) on the same day, the relative humidity of the air in the upper troposphere increased significantly and the relative dry layer disappeared; the whole atmosphere was in a near-saturated state and gradually became stable. This suggests that the convection developed during 00:00 to 12:00 UTC on 24 July 2014.
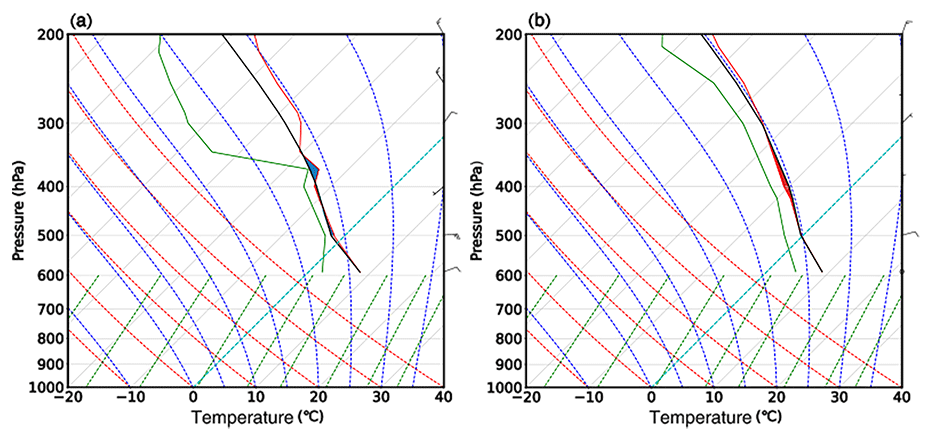
Figure 2T-log P sounding data from Naqu station at (a) 00:00 and (b) 12:00 UTC on 24 July 2014 (solid black line: temperature–pressure curve (laminar curve); solid green line: dew point pressure curve; solid red line: state curve; solid gray line (diagonal): isotherm; solid gray line (horizontal): isobaric line; dashed blue line: adiabatic wet line; dashed red line: adiabatic dry line; dashed green line: saturation mixing ratio; and dashed light blue line: 0 ∘C isotherm).
2.2.3 Model setup
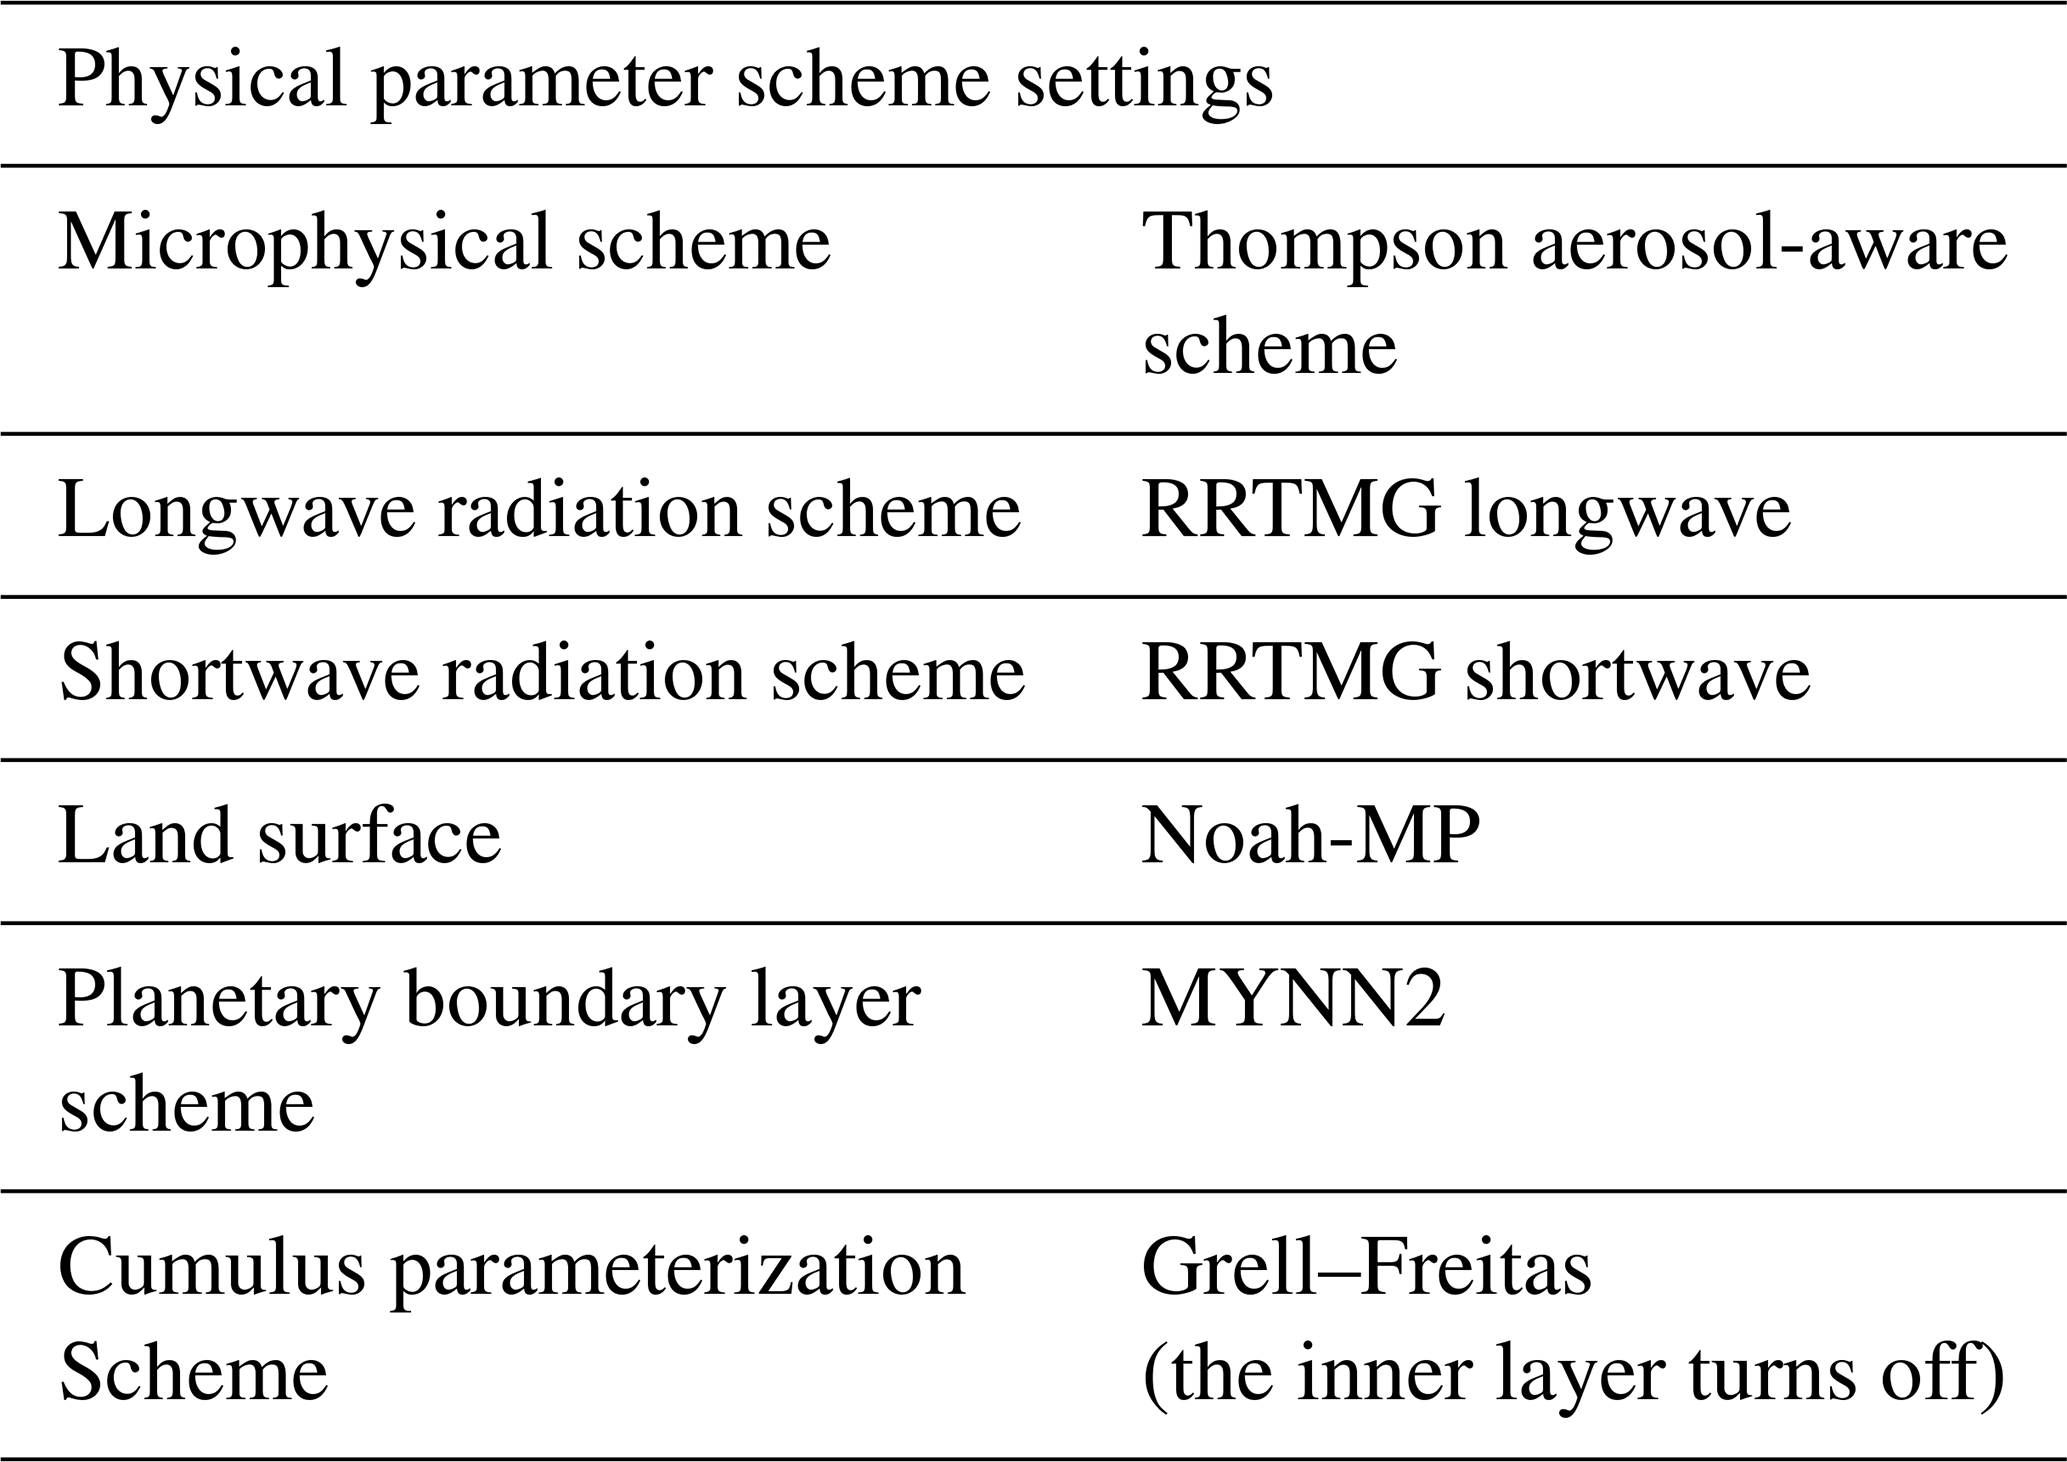
The Weather Research Forecast (WRF) model is one of the most commonly used meteorological research and numerical weather forecasting systems. It provides users with a wide choice of formulations for atmospheric processes and can run on a variety of computer platforms (http://www2.mmm.ucar.edu/wrf/users/, last access: 8 April 2023). The model version used in this paper is WRF 4.0, and the basic model settings are shown in Table 2. The integration of 24 h starts at 00:00 UTC on 24 July 2014. A triple nesting grid with spacing of 25, 5, and 1 km, respectively, and an integration step of 60 s for the outer layer is applied, as shown in Fig. 3. The precipitation in the area around Naqu (31.4–31.5∘ N, 92.0–92.1∘ E; area A) and the distribution of the aerosol number concentration in the area around Naqu (31–32∘ N, 91.5–92.5∘ E; area B) are examined in our detailed analysis.
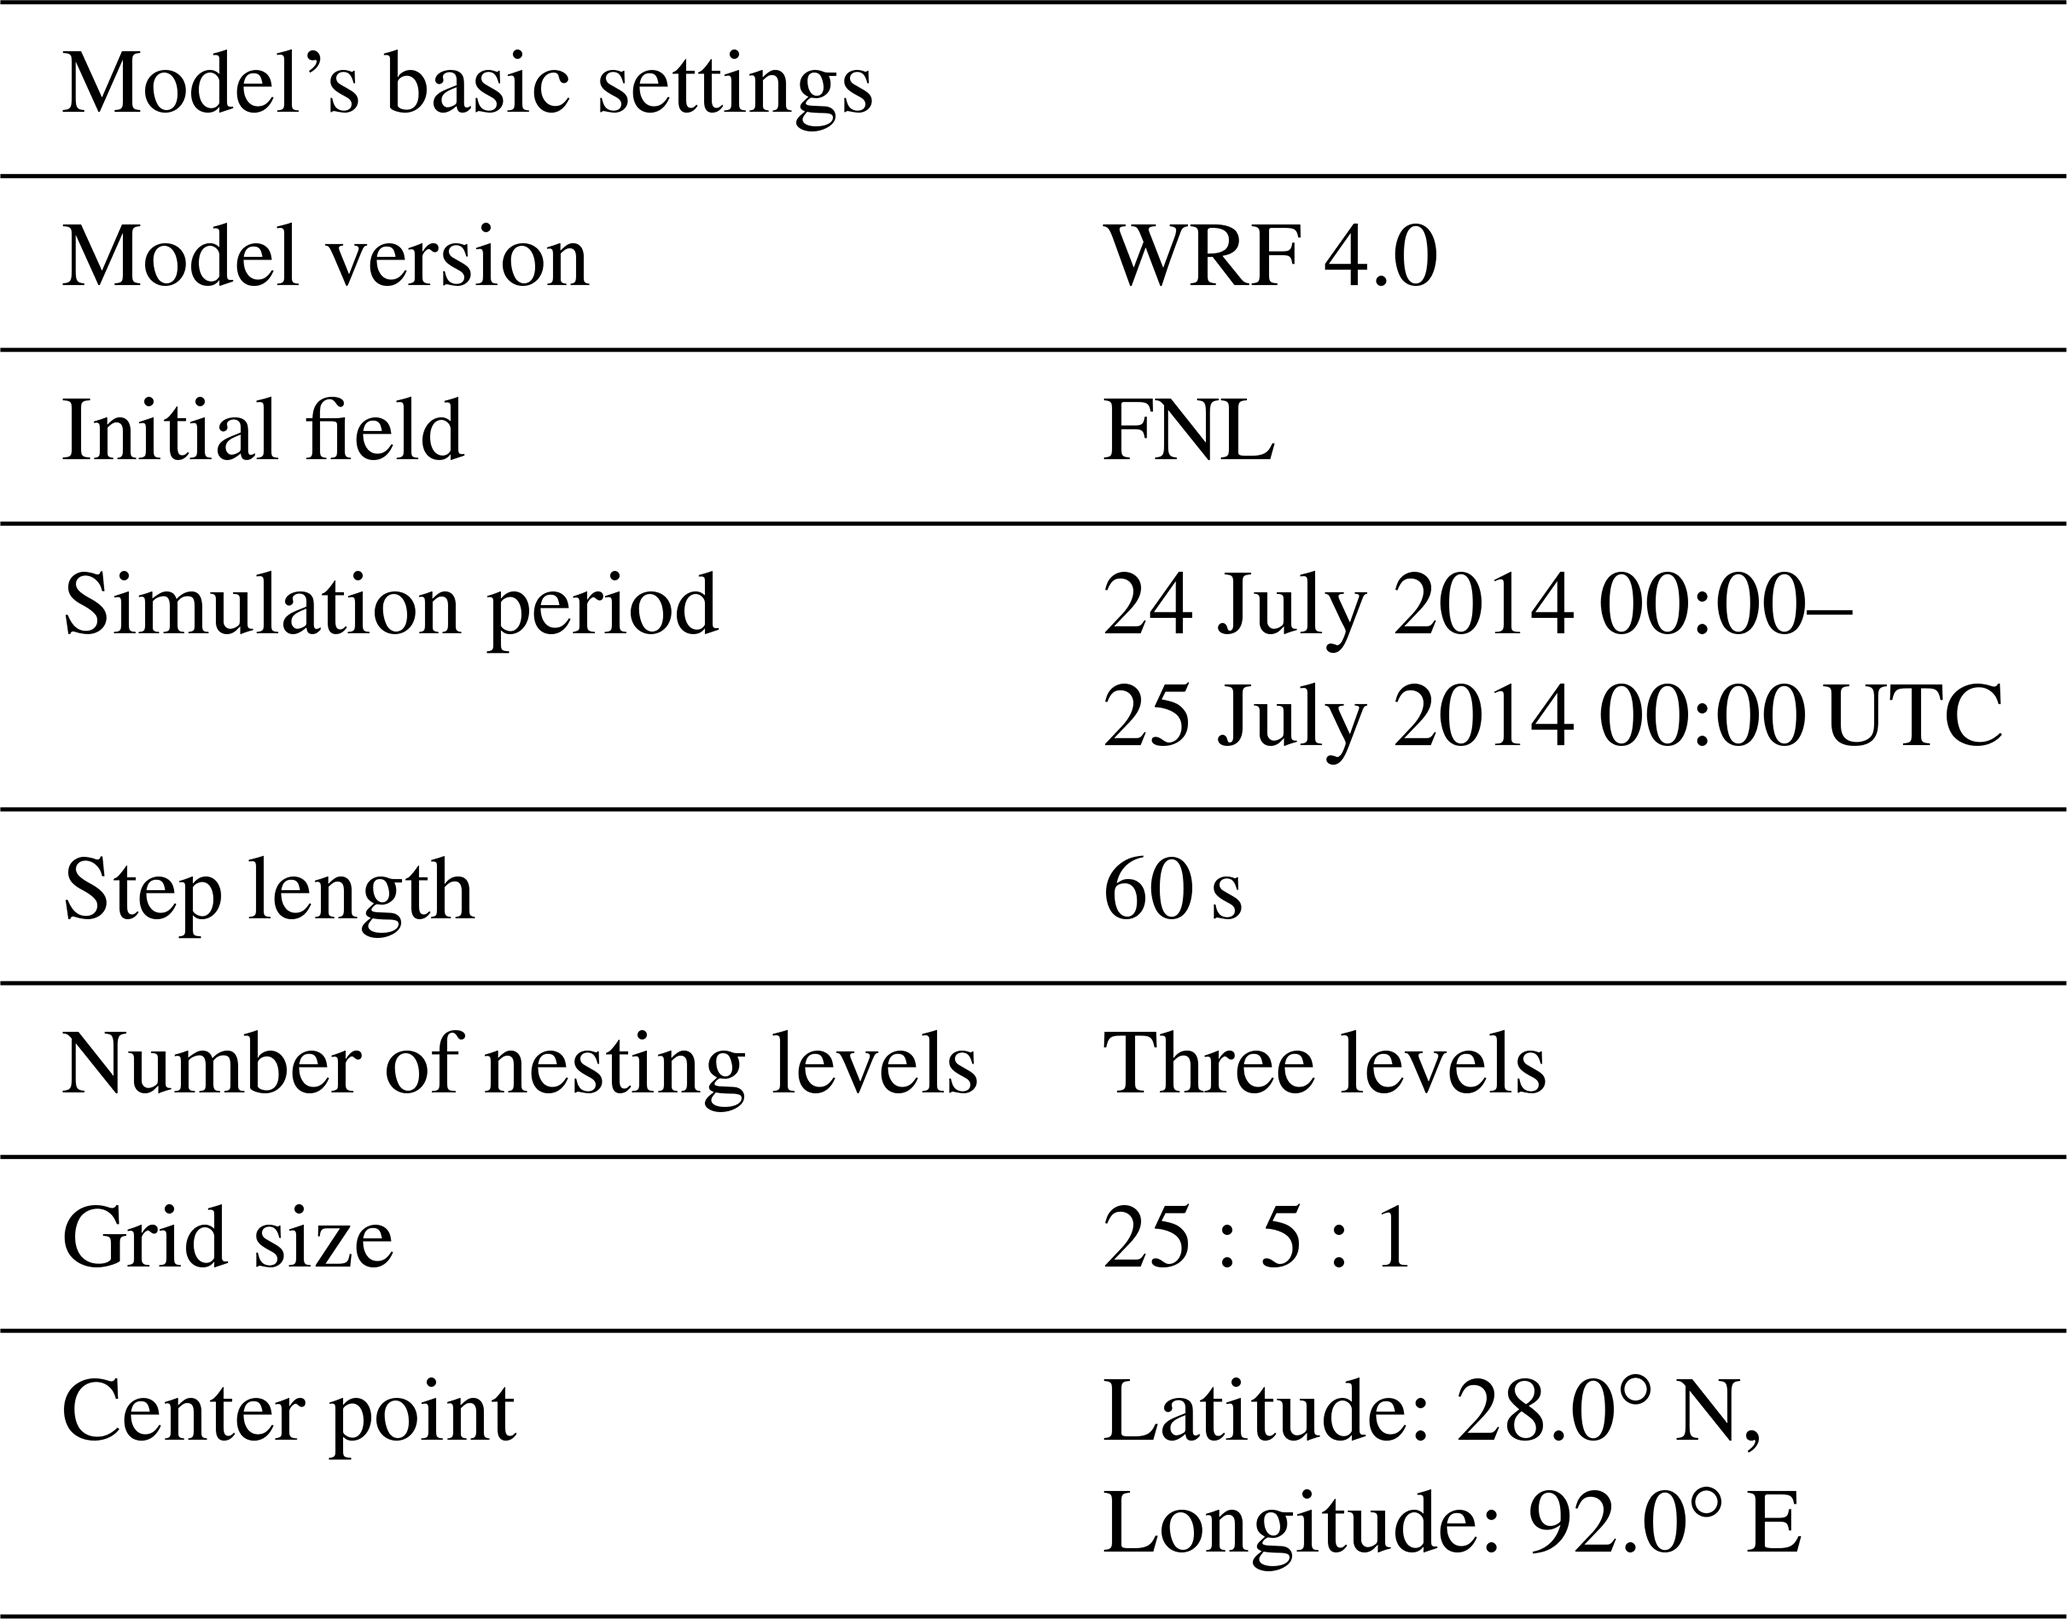
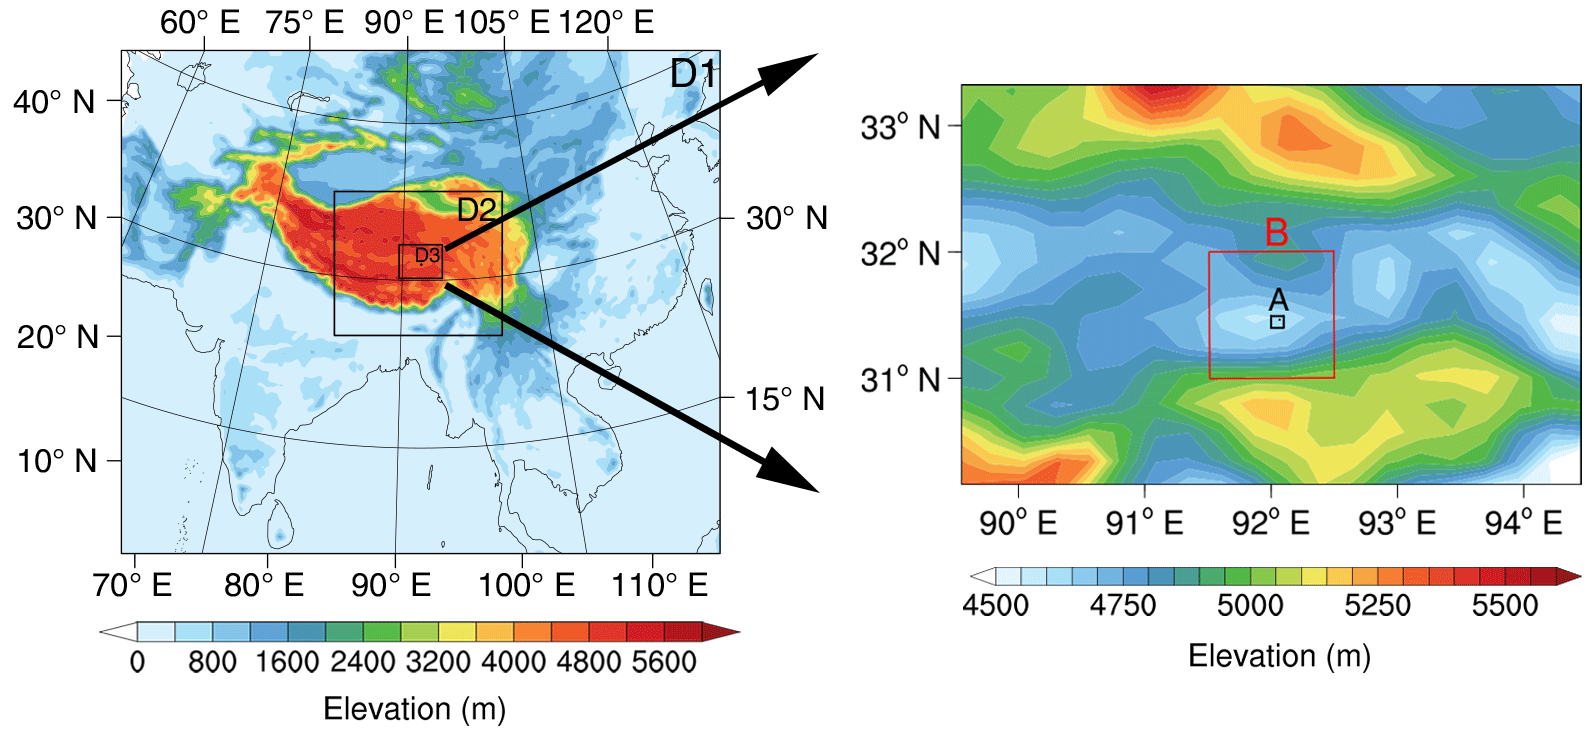
Figure 3Color-filled map of the height field for simulated region (area A is marked with black rectangle, and area B is marked with red rectangle).
The simulation uses the rapid radiative transfer model for general circulation models (RRTMG) longwave and shortwave radiation scheme (Iacono et al., 2008), the Mellor–Yamada–Janjic–Niino (MYNN) surface layer scheme (Dyer and Hicks, 1970), the MYNN 2.5 level turbulent kinetic energy (TKE)-based planetary boundary layer scheme (Nakanishi and Niino, 2009) and the Noah-MP land surface scheme (Niu et al., 2011). The Grell–Freitas cumulus convective parameterization scheme (Grell and Freitas, 2013) is adopted for the outer two grids, while the cumulus scheme is turned off in the inner grid. The physical parameter schemes are shown in Table 3. The microphysical scheme selected in this paper is the Thompson aerosol-aware scheme (Thompson and Eidhammer, 2014), in which the default is set as the control run (control), the clean and polluted schemes multiply the default cloud condensation nuclei number by and 10 times, respectively, and the TP uses the MERRA-2 aerosols on 23 July 2014. The experimental settings are described in Table 4.
3.1 Aerosol and cloud analysis
Figure 4 compares the spatial distribution of the vertically averaged water-friendly aerosol number concentration from (a) clean, (b) control, (c) TP, and (d) polluted cases at 00:00 UTC on 24 July 2014. It shows that, at the simulation start time, the number concentration of the water-friendly aerosols in TP simulation (Fig. 4c) is almost 2 times than that of default simulation (Fig. 4b), which can be regarded as slightly polluted situation. In this way, the dependence of the evolution of the convective event that took place in Naqu (31.483∘ N, 92.067∘ E) on 24 July 2014, is examined under different background atmospheric aerosol burden, which are almost , 1 time, 2 times, 10 times of the default CCN setting for clean, control, TP (slightly polluted), and polluted, respectively.
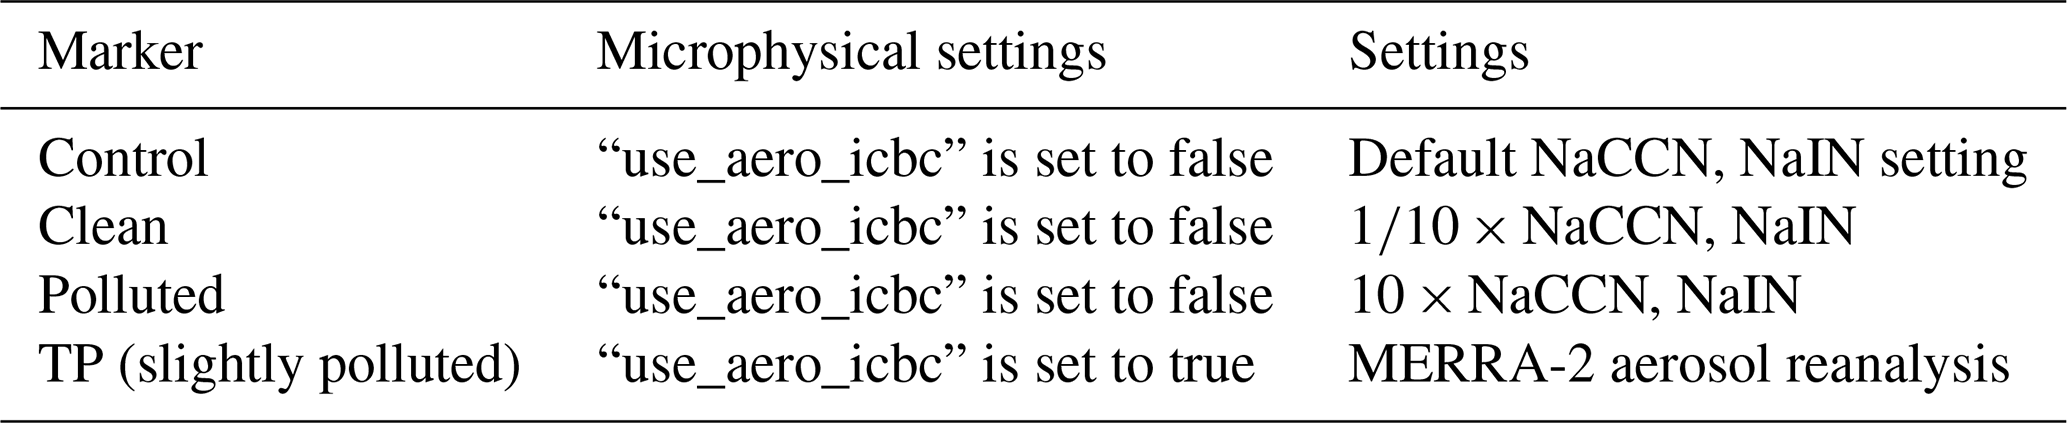
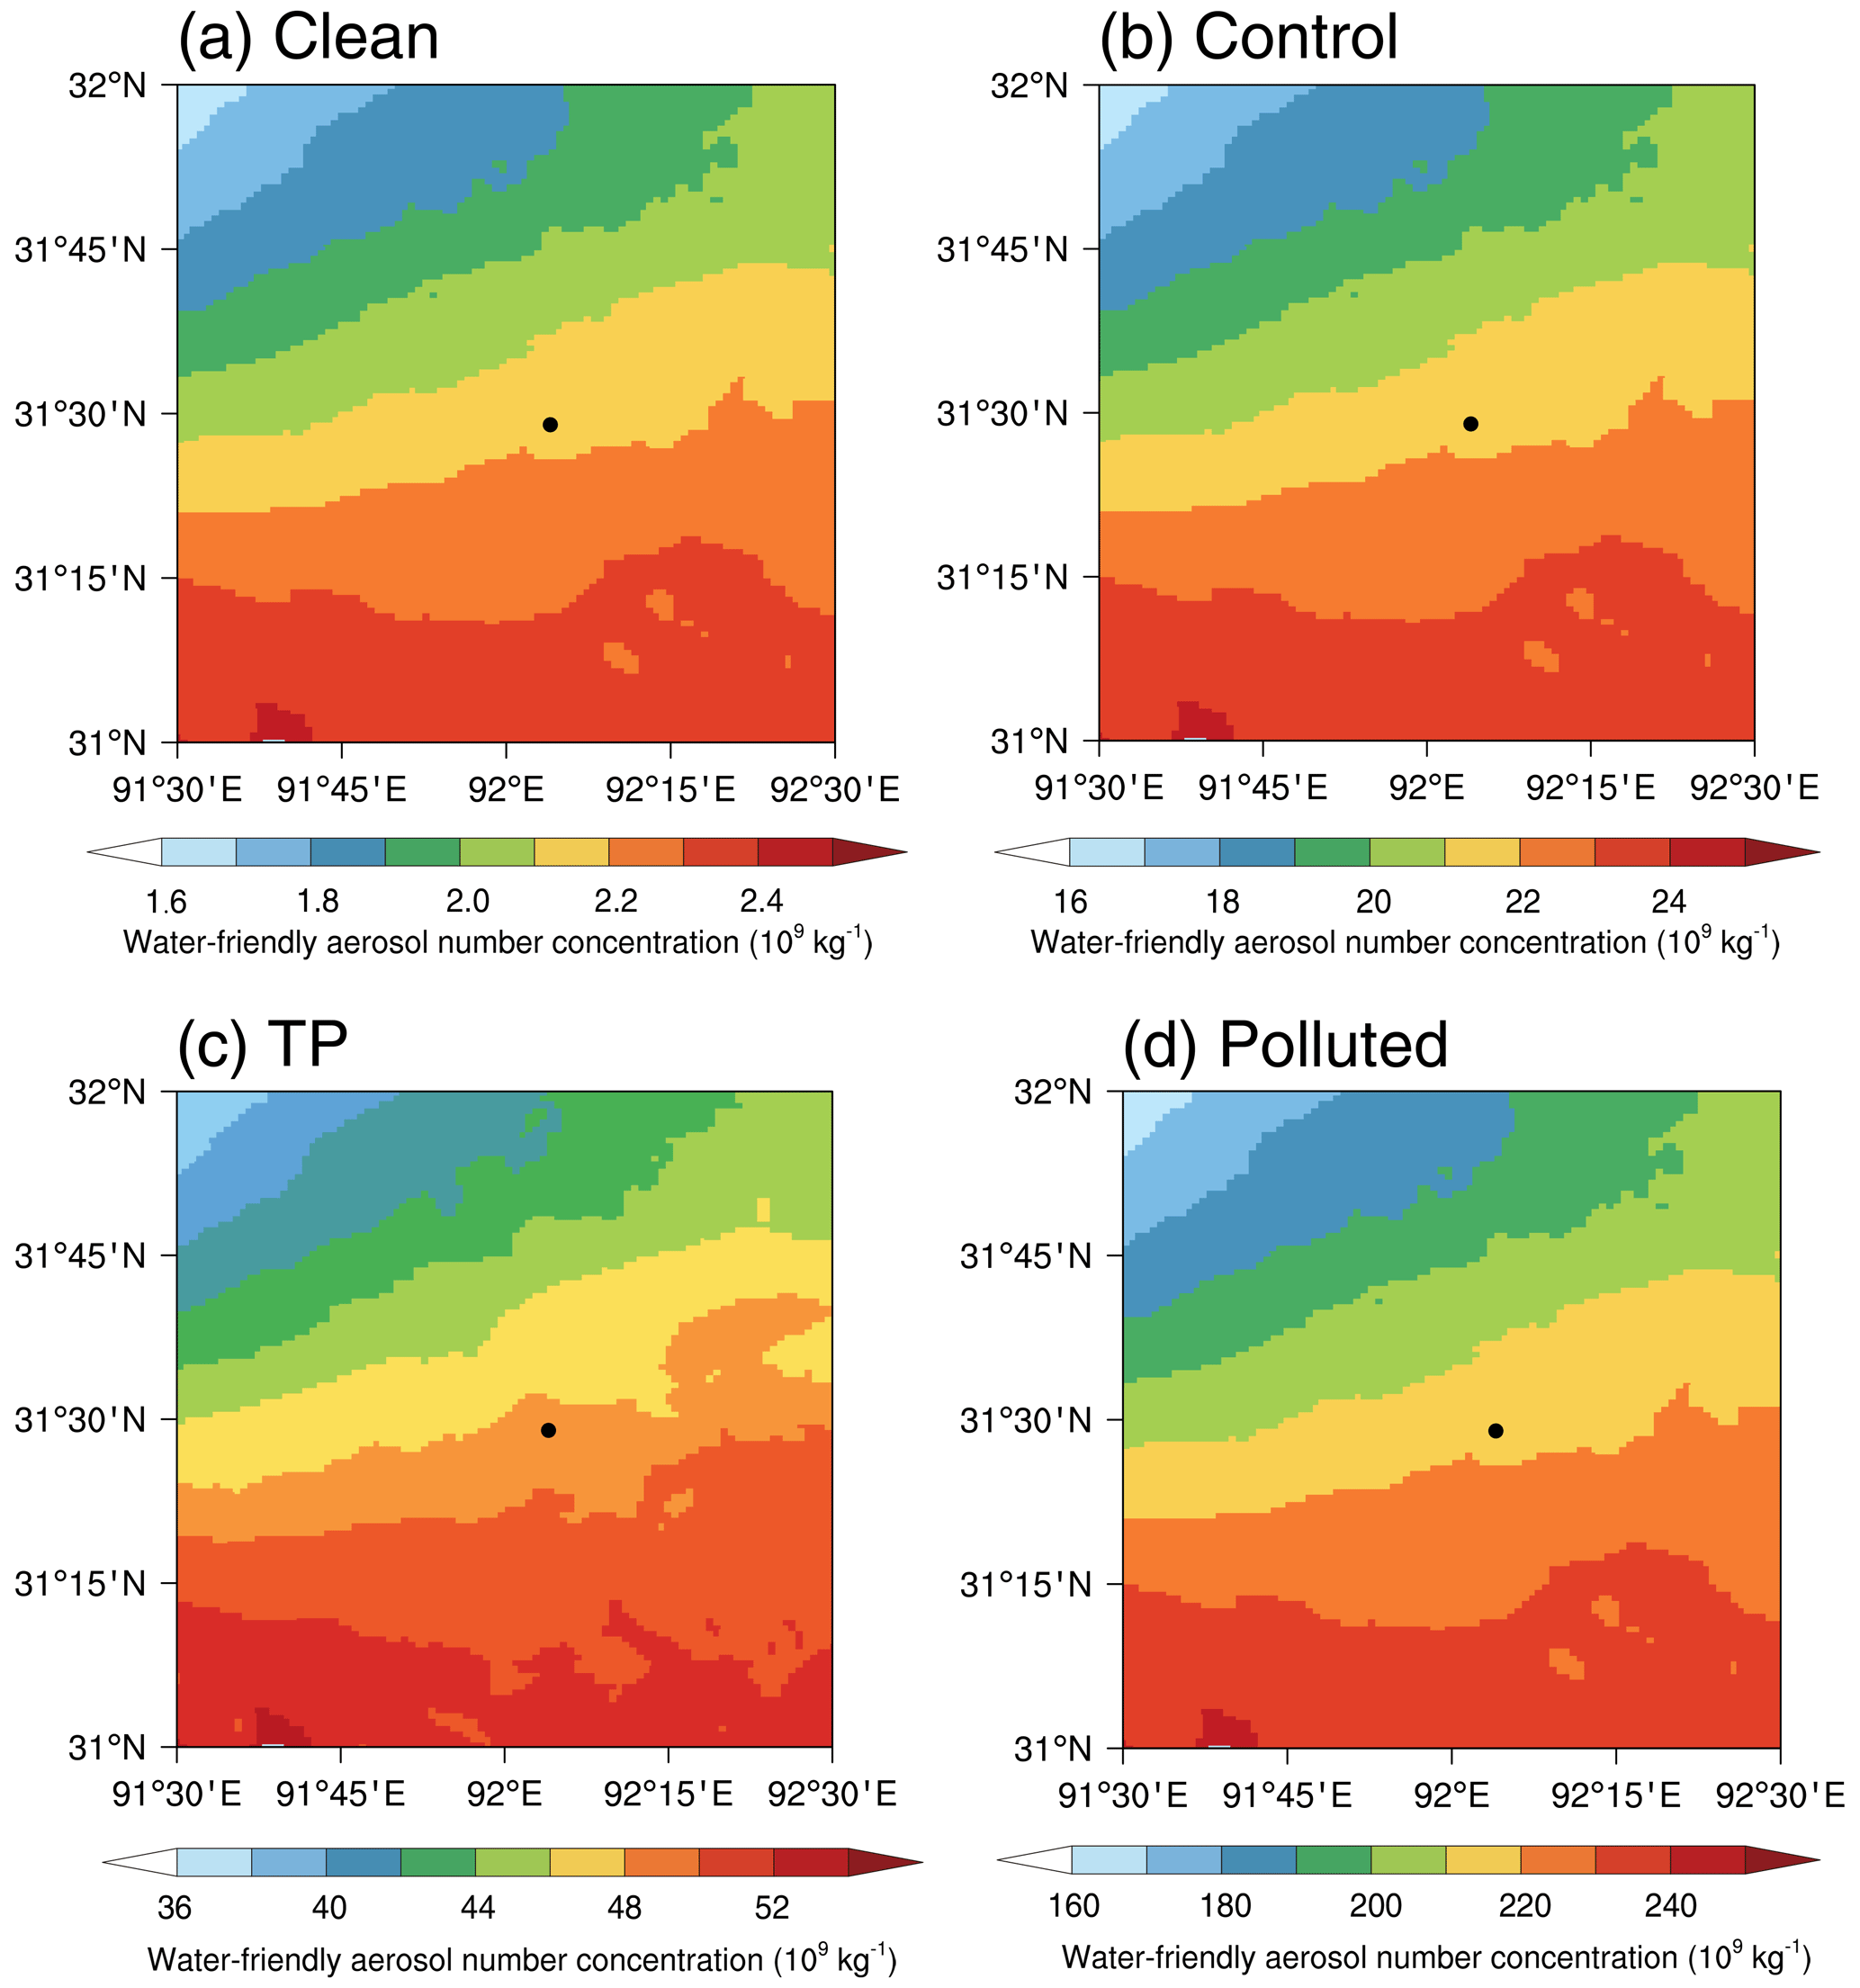
Figure 4Vertically averaged water-friendly aerosol number concentration from (a) clean, (b) control, (c) TP, and (d) polluted cases at 00:00 UTC on 24 July 2014 in the area around Naqu (31–32∘ N, 91.5–92.5∘ E; area B). The dot represents the position of Naqu.
Since the precipitation is interrupted at 11:00 UTC (Fig. 1), the analysis focuses on the vertical distribution of the hydrometeor categories from 00:00 to 11:00 UTC on 24 July 2014. The mean precipitation in the area surrounding Naqu (31.4–31.5∘ N, 92.0–92.1∘ E; area A) is selected for a time series analysis. Figure 5 shows that the precipitation starts at 06:00 and the hourly maximum precipitation occurs at 08:00 UTC. Afterwards, the precipitation intensity gradually decreases and ends up at 11:00 UTC. All four simulations show a decreasing precipitation rate occurring after 09:00 UTC. The maximum precipitation intensity is predicted to happen at 07:00 in the clean and TP simulations; it occurs at 08:00 and at 09:00 UTC in the control and the polluted simulations, respectively. The timing of the maximum precipitation rate is delayed, and the precipitation intensity is enhanced as air pollution heavily increases. Comparing the simulation results for clean and polluted conditions, we find that the time at which precipitation starts is later in polluted air than in a clean situation. However, the amount of precipitation was significantly enhanced. This suggests that an increase in atmospheric aerosol load leads to a delayed onset but an increased intensity of the precipitation.
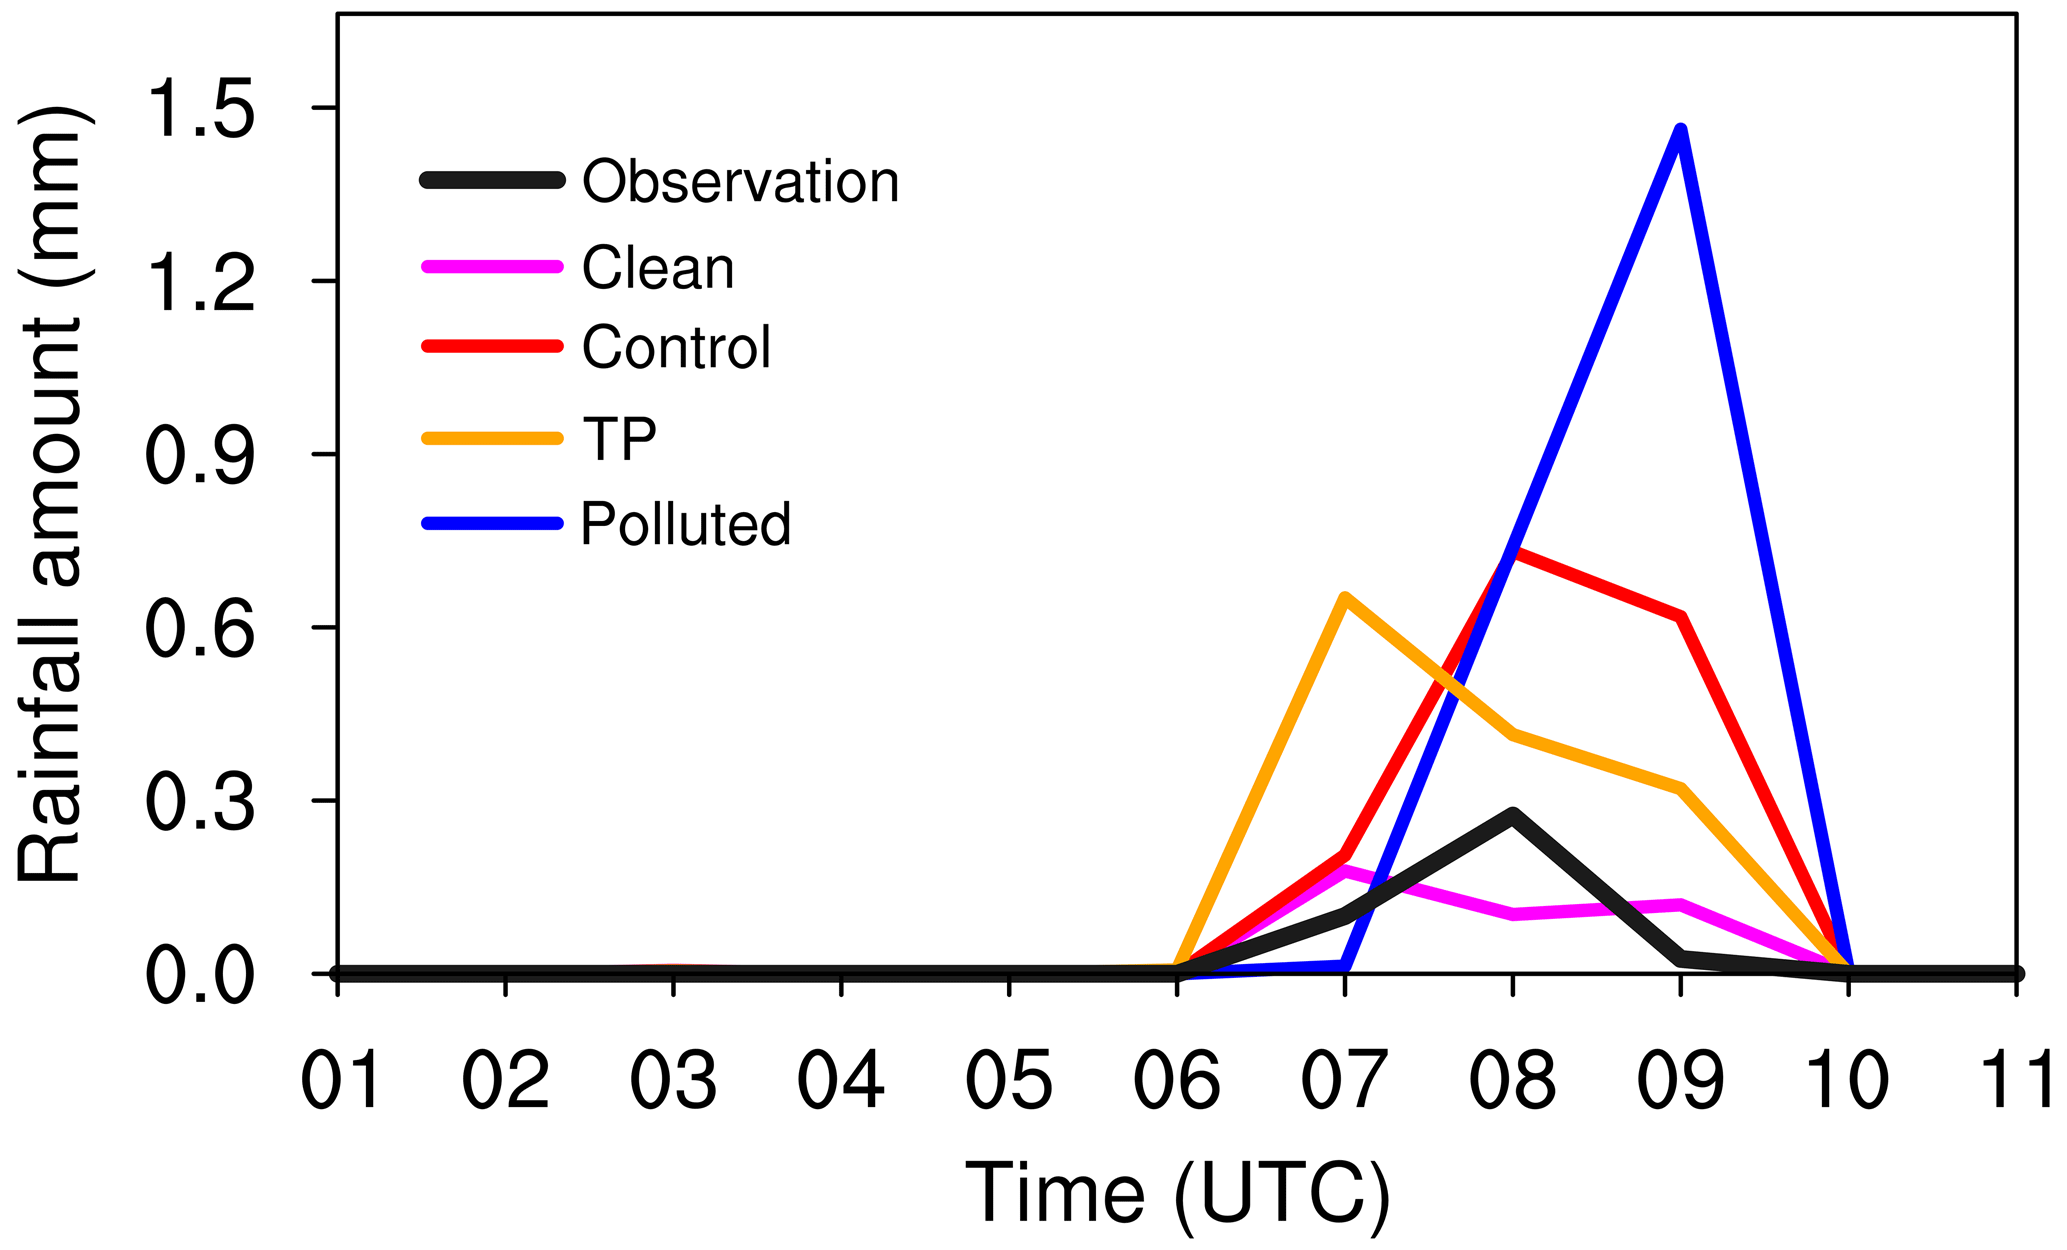
Figure 5Time series of hourly precipitation rate (mm) in area A (31.4–31.5∘ N, 92.0–92.1∘ E) from 00:00 to 11:00 UTC on 24 July 2014.
3.2 Hydrometeor categories and microphysical processes analysis
In order to analyze the influence of aerosols on water condensate at different heights, the time series of the vertical distribution of liquid phase water condensate and ice phase water condensate from clean, control, TP, and polluted are shown in Fig. 6a–d, respectively. Note that, compared to urban areas, the baseline aerosol burden in TP is pristine, and the clean simulation here represents an extremely clean condition. From 01:00 to 03:00 UTC, the liquid phase water condensate existed in all four simulated cases and were mainly distributed between the pressure levels of 350 and 450 hPa. During this time, no precipitation was produced or the amount of precipitation was small. The analysis of the vertically pointing Ka-band cloud radar observation at Naqu also shows that only scattered clouds existed at the height between 5 and 7 km before 05:00 UTC (Cheng et al., 2022).
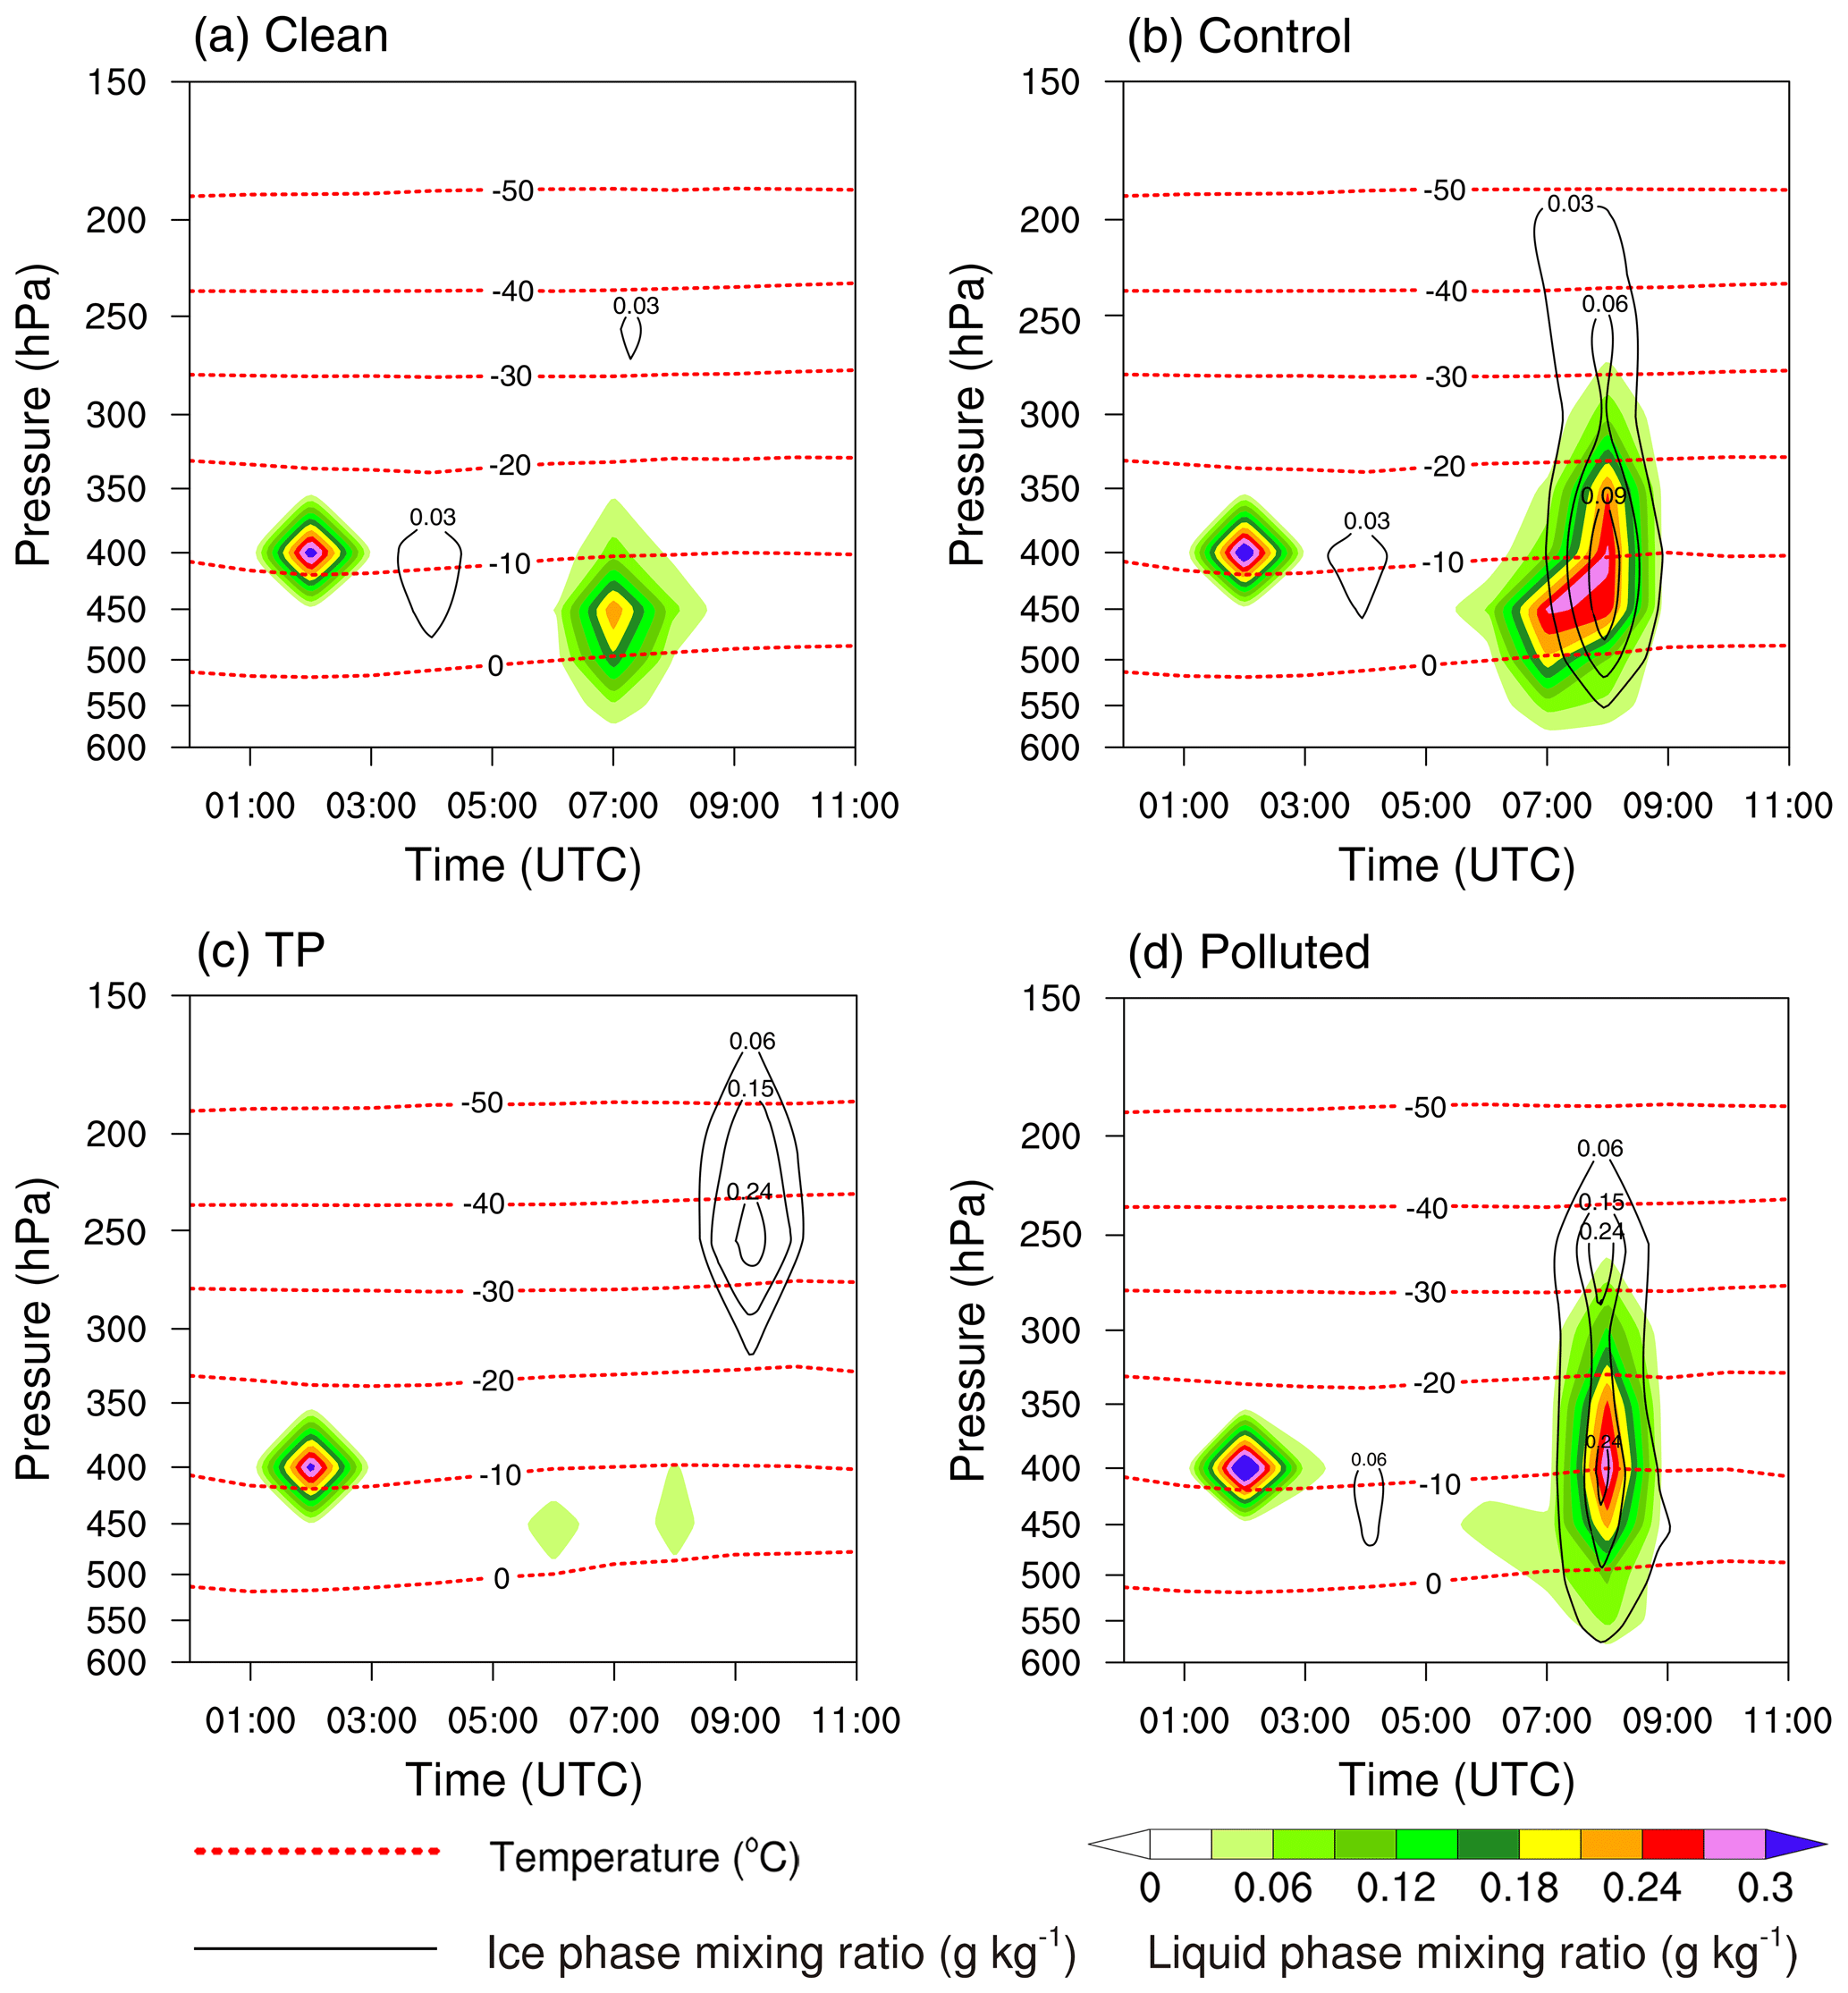
Figure 6Time series of the vertical distribution of the mean liquid phase and ice phase water condensate mixing ratio in (a) clean, (b) control, (c) TP, and (d) polluted simulations in area A (31.4–31.5∘ N, 92.0–92.1∘ E), in g kg−1, with dashed red lines as isotherms.
From 05:00 UTC, in the clean simulation (Fig. 6a), the liquid phase water condensate is mainly distributed in the lower layers and its abundance starts to increase, which indicates the warm-based convective cloud formed, while less ice phase water condensate is presented. Compared to the clean simulation, in the control scenario (Fig. 6b), the amount of liquid phase water condensate formed in the control case is higher and the maximum value is located at a higher altitude. At the same time, the ice phase water condensate increases. It indicates shifting from the clean to control scenario, the convective cloud invigorates and precipitation increases with increasing aerosol number concentration. In the TP simulation (Fig. 6c), in which the water-friendly aerosols background is 2 times of that in the control simulation (Fig. 6b) but not in the polluted simulation, the amount of liquid phase water condensate decreases sharply. This indicates the rain already started (Fig. 5). It also suggests that the precipitation intensity increases, and the precipitation starts earlier with the increase of aerosol loading when the atmosphere is slightly polluted. This may be explained by aerosol-limited environment and the higher coalescence efficiency due to the secondary droplet activation in convective clouds, especially in relatively clean areas (Efraim et al., 2022). In the polluted scenario (Fig. 6d), the liquid phase water condensate in the polluted case does not change substantially; however, the onset time is delayed. Under the polluted situation, the warm cloud precipitation does not occur easily, and the cloud development is more vigorous. As a result, the onset time of the precipitation is delayed. The ice phase water condensate increased substantially. In the polluted case, more ice phase water condensate is formed in both upper and lower layers (Fig. 6d), while in the TP case (Fig. 6c), there is more ice phase water condensate only in the upper layers. This suggests that, with the increase of aerosol loading, the ice cloud precipitation increases. As a result, the onset time of the precipitation is delayed, but the precipitation intensity increases. This is consistent with the impact of aerosols on convective precipitation as derived from observations in Southeast China (Jiang et al., 2016; Wu et al., 2016; Yang et al., 2018).
In order to analyze the evolution of microphysical quantities and processes, considering that precipitation mainly occurs between 06:00 and 11:00 UTC, various water condensate particles in area A are averaged during this period. Five water condensate mixing ratios obtained for cloud water, cloud ice, rain, snow, and graupel as a function of pressure for clean, control, TP, and polluted simulations are shown in Fig. 7a–d, respectively. At 150–300 hPa, snowfall occurs in all four scenarios, and the proportion of snowfall increases as pollution increases. At 300–500 hPa, compared with the clean simulation (Fig. 7a), the five water condensate mixing ratios increase with the increased aerosol burden in the control simulation (Fig. 7b). Compared with the control simulation (Fig. 7b), the mixing ratio of rain increases, while that of both cloud water and graupel decrease in the TP simulation (Fig. 7c). This suggests that, as aerosol loading increases, the conversion process of cloud water to rain invigorates. In the polluted scenario (Fig. 7d), the mixing ratios of cloud water, graupel, and snow are characterized by larger values than in the other three scenarios, while the mixing ratio of rain has the smallest value. It indicates that the conversion process of cloud water to rain is suppressed, but the conversion of cloud water to graupel is favored. At 500–600 hPa, which is near the surface, rainfall is dominant in the clean case (Fig. 7a), while graupel in addition to rainfall are visible in other simulations (Fig. 7b–d). This suggests that, with the increase of aerosol burden, the conversion process of cloud water to rain in clouds is suppressed, but the generation of ice phase particles is favored. The proportion of surface graupel to the total precipitation increases from 6.913 %, 7.833 %, 14.004 %, and 26.376 % in clean, control, TP, and polluted, respectively. It also indicates that the development of convective clouds is more vigorous under the polluted scenario.
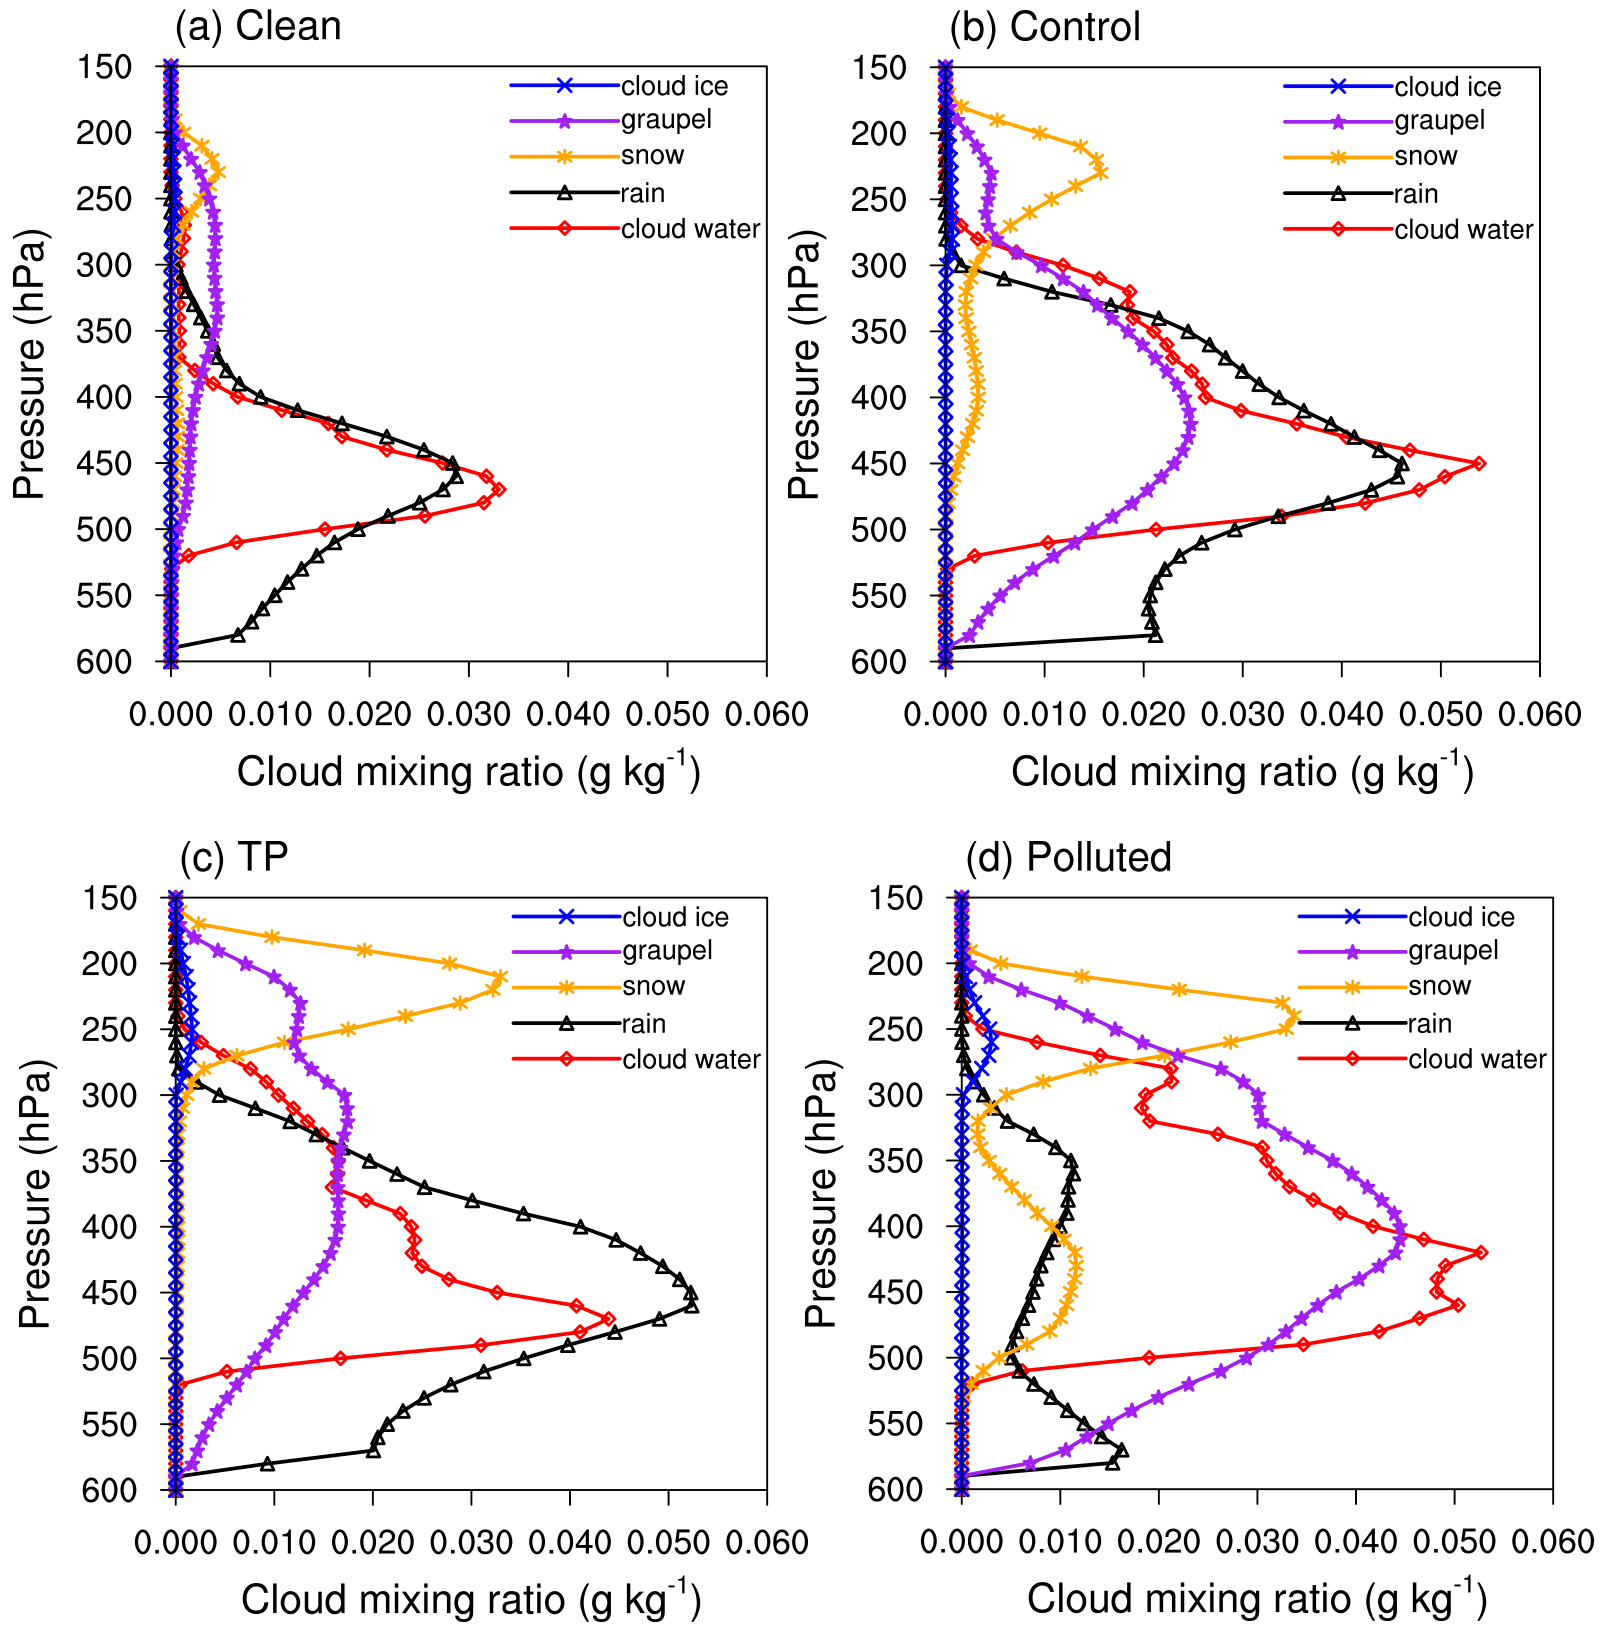
Figure 7Mean water condensate mixing ratio as a function of height for (a) clean, (b) control, (c) TP, and (d) polluted cases in area A (31.4–31.5∘ N, 92.0–92.1∘ E) from 06:00 to 11:00 UTC on 24 July 2014; units: g kg−1.
The vertical distributions of the number concentration of cloud water, rain, and snow for the four scenarios (which are not shown here) show similar results, which indicates the increase of aerosol number concentration tends to increase the cloud droplet number concentration, but tends to decrease the cloud droplet scale, suppresses the warm cloud rainfall, and invigorates cloud development (Fig. 8), producing more ice phase substances. The melting of ice phase particles increases the cold-rain precipitation, which delays the onset of the precipitation and increases precipitation intensity. It is consistent with the findings that in the polluted scenario the increase in aerosols suppresses the warm-rain process but enhances the growth of graupel and increases the cold rain (Rosenfeld and Woodley, 2000; Tao et al., 2012).
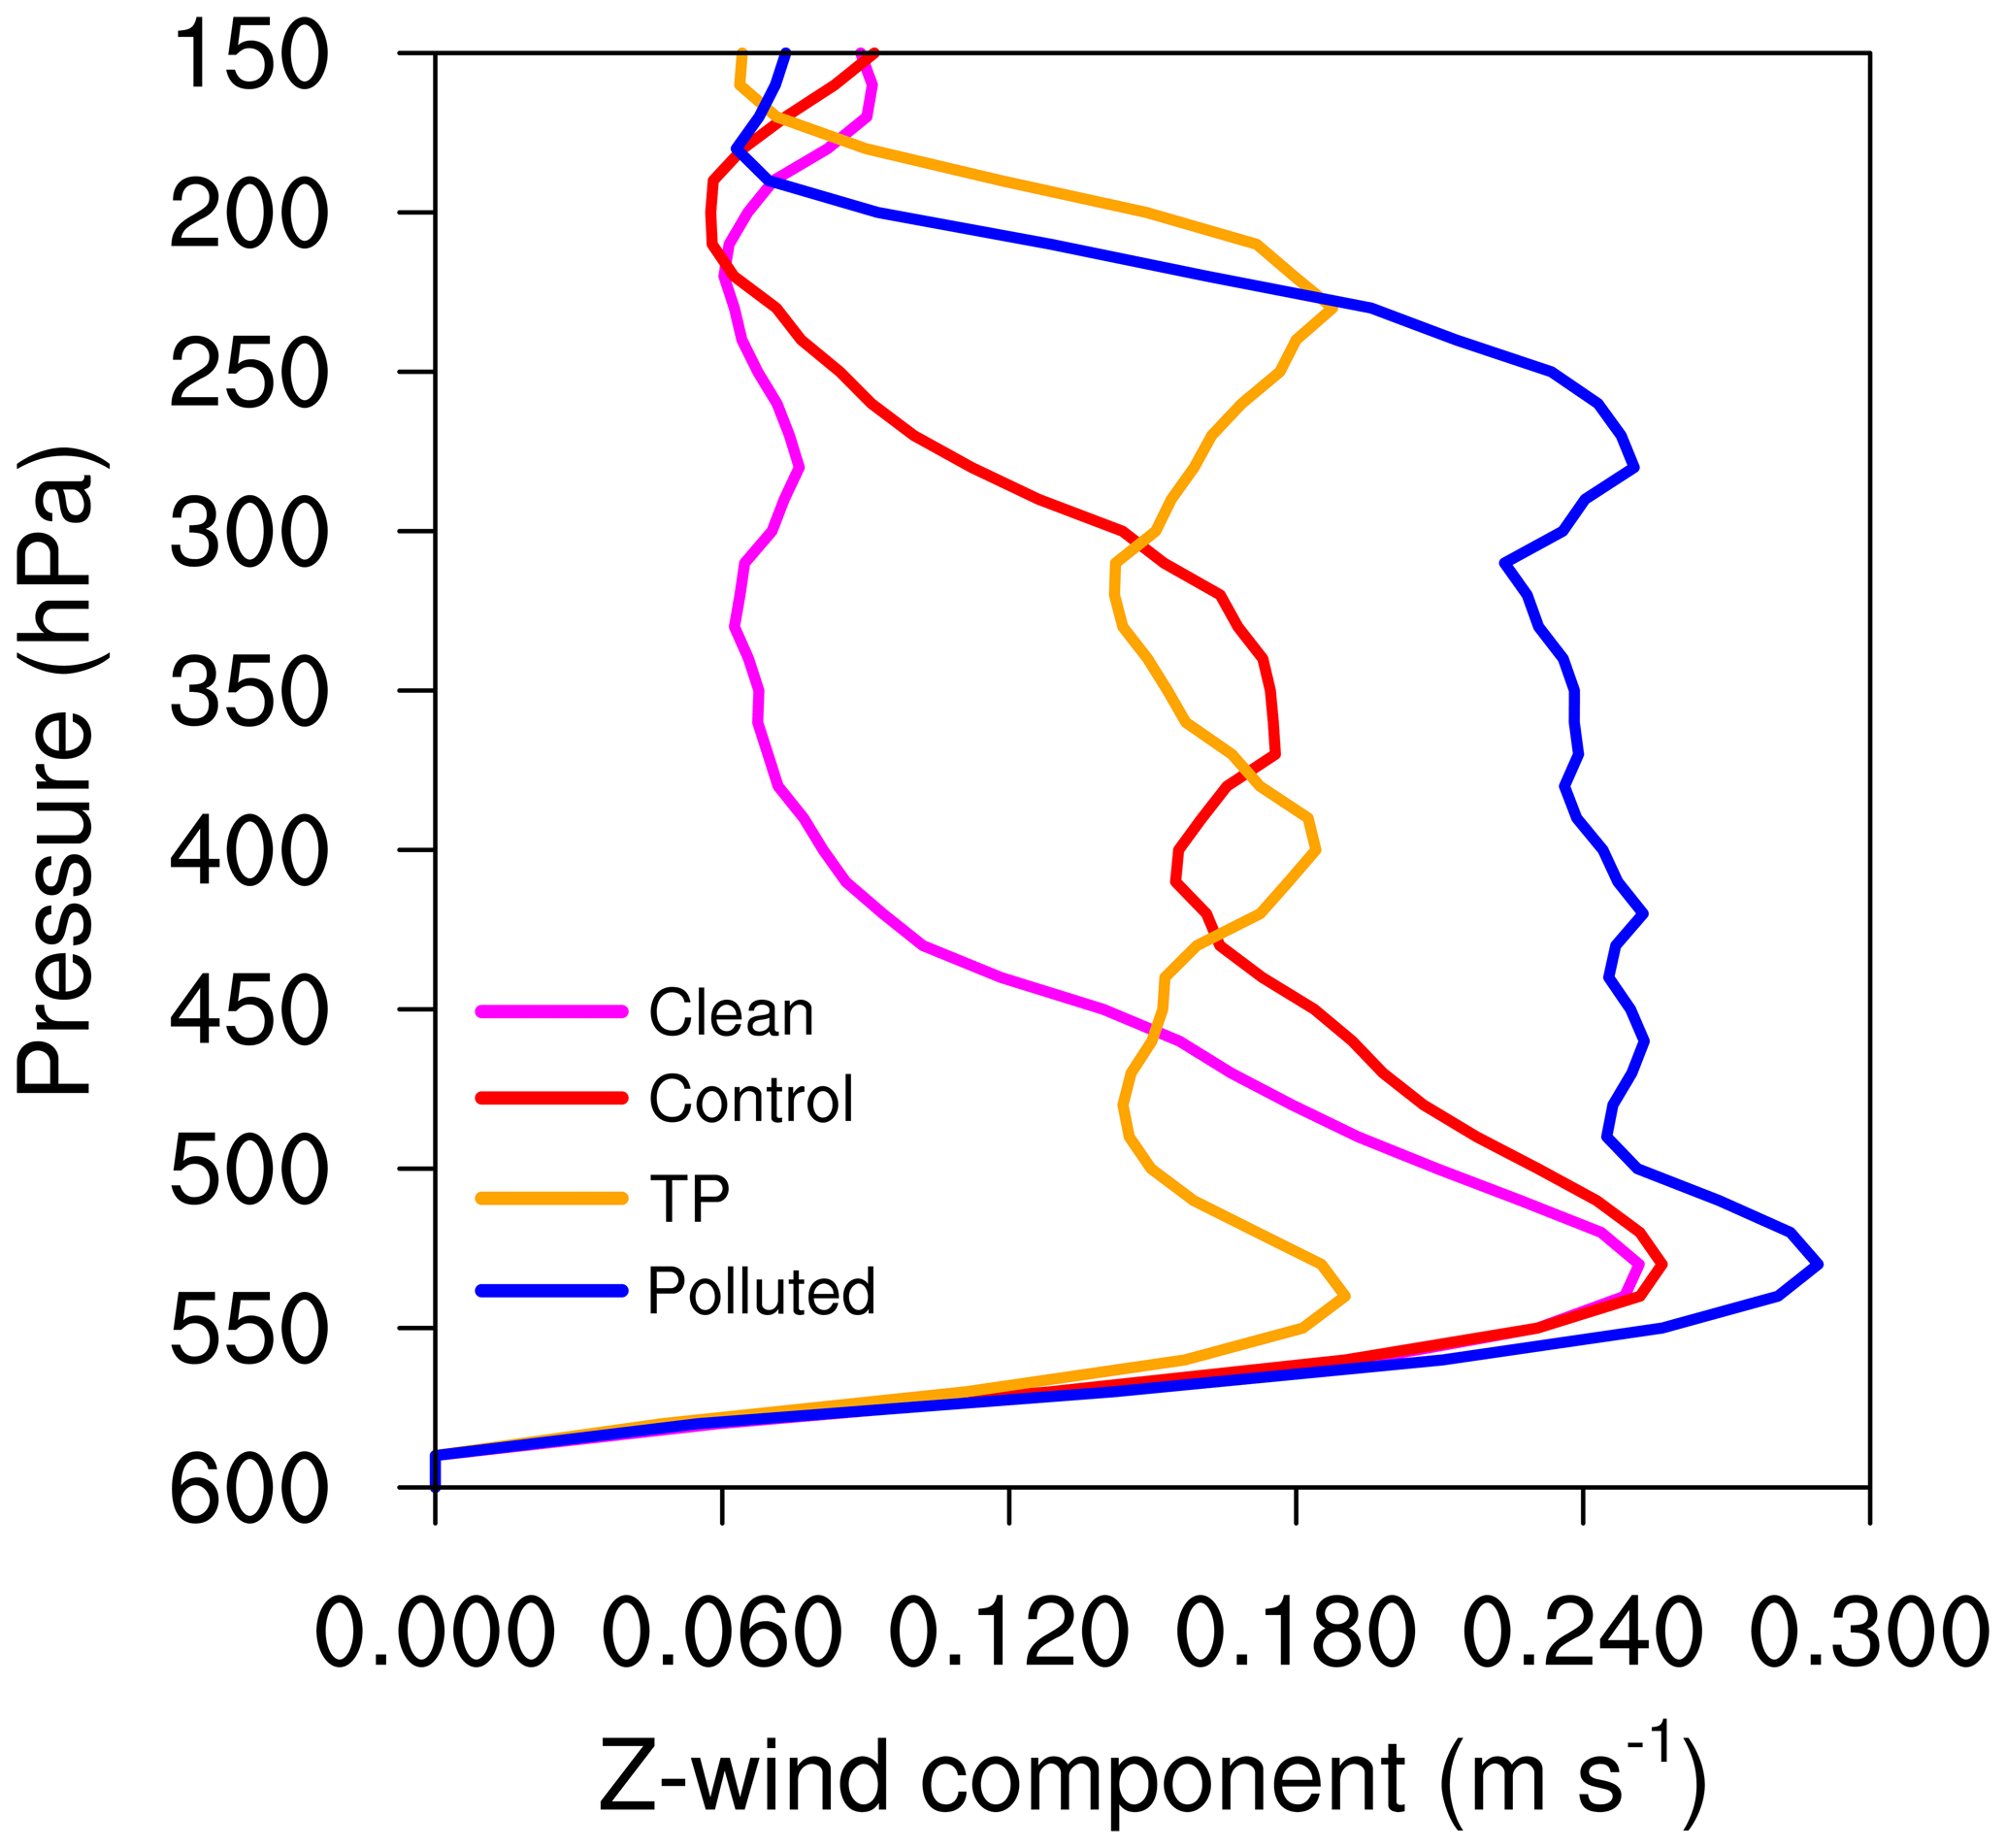
Figure 8Updrafts in clouds in area A (31.4–31.5∘ N, 92.0–92.1∘ E) averaged from 06:00 to 11:00 UTC on 24 July 2014, in units of m s−1.
Aerosol studies on the Tibetan Plateau are constrained by a small number of stations and observations and by a limited amount of satellite data. The aerosol optical thickness in this region is generally smaller than in other regions, with only a few cases exceeding 0.1, which also explains the low availability of aerosol satellite data in the region. Although the region can be considered as a region with a background aerosol situation, air masses transported by summer winds from South Asia can cause relatively strong local disturbances. The unique topography and the relatively pristine aerosol background levels above the Tibetan Plateau motivate us to explore the impact of aerosols on the formation of local convective precipitation events.
The Weather Research and Forecasting (WRF) model 4.0 version with Thompson aerosol-aware microphysical scheme was used to explore the influence of aerosols on convective precipitation processes. A specific convective precipitation event in Naqu in the central Tibetan Plateau that occurred on 24 July 2014 was selected in our study. Four sets of experiments, named clean ( CCN), control (default setting), Tibetan Plateau (CCN calculated from MERRA-2 reanalysis), and polluted (10 times CCN), were retained for our simulations. A detailed analysis of the microphysical processes shows that the conversion of cloud water into rain is enhanced by small increases in aerosol concentration, while it is suppressed by larger increases in concentration. At the same time, the generation of ice phase particles and the development of convective clouds are enhanced under the polluted situation. As a result, the onset of the precipitation is delayed; however, rainfall occurs with higher intensity.
Since the air in the plateau area is relatively clean, the response of precipitation could be sensitive to aerosol perturbation. However, the errors associated with the observations over the Tibetan Plateau are large and sensitive to convective precipitation during the initial phase of the event. Under such circumstances, our study has adopted a compromise approach to discuss the effect of aerosols on convective precipitation in the relatively clean highlands.
The treatment of aerosols in the model can be chosen according to the air quality situation at a particular time. If the air is clean, initial conditions for the simulated aerosol concentrations can be chosen to be close to the actual observations; in a polluted situation, the background field for the WRF simulation can be generated according to the real-time aerosol reanalysis method as described in the paper, especially before year 2015. More sustained and comprehensive observations over the Tibetan Plateau are a prerequisite for better understanding the aerosol impact on precipitation formation in this region. More factors, such as latent heat, sensible heat, surface topography, aerosol types, etc., should be carried out as comprehensive analysis in this region. At the same time, approaches to determine the measurement representation error (Asher et al., 2022) for model evaluation should be established in the pristine region.
The data used in this study can be accessed on request from the China Meteorological Data Network National Meteorological Science Data Center (http://data.cma.cn, last access: 8 April 2023) or downloaded from https://doi.org/10.5281/zenodo.7816832 (Jiang, 2023).
MJ: conceptualization, investigation, writing and editing, and funding acquisition. YL: visualization and editing. WH: investigation and simulation. YY: editing. GB: conceptualization, supervision, and editing. XZ: revision.
The contact author has declared that none of the authors has any competing interests.
Publisher's note: Copernicus Publications remains neutral with regard to jurisdictional claims in published maps and institutional affiliations.
This study was supported by the National Key Research and Development Program of China (2018YFC1505704), the National Natural Science Foundation of China (41905025), Chengdu University of Information Technology Research Fund (KYTZ202217), and the China Scholarship Council. We would like to thank the China Meteorological Data Network National Meteorological Science Data Center (http://data.cma.cn, last access: 8 April 2023), Wenhua Gao from the State Key Laboratory of Severe Weather, Chinese Academy of Meteorological Sciences, and Xiaolong Cheng from the Institute of Plateau Meteorology, China Meteorological Administration, Minhong Song, Xianyu Yang, and Xiaoling Zhang from Chengdu Plain Urban Meteorology and Environment Observation and Research Station of Sichuan Province and Chengdu University of Information Technology, for their suggestions that have benefited this study. We also greatly appreciate the valuable comments from the anonymous reviewers.
This research has been supported by the Ministry of Science and Technology of the People's Republic of China (grant no. 2018YFC1505704), the National Natural Science Foundation of China (grant no. 41905025), Chengdu University of Information Technology
Research Fund (grant no. KYTZ202217), and the China Scholarship Council.
The article processing charges for this open-access publication were covered by the Max Planck Society.
This paper was edited by Yuan Wang and reviewed by three anonymous referees.
Andreae, M. O., Rosenfeld, D., Artaxo, P., Costa, A. A., Frank, G. P., Longo, K. M., and Silva-Dias, M. A. F,: Smoking rain clouds over the Amazon, Science, 303, 1337–1342, https://doi.org/10.1126/science.1092779, 2004.
Asher, E., Thornberry, T., Fahey, D. W., McComiskey, A., Carslaw, K., Grunau, S., Chang, K. L., Telg, H., Chen, P., and Gao, R. S.: A Novel Network-Based Approach to Determining Measurement Representation Error for Model Evaluation of Aerosol Microphysical Properties, J. Geophys. Res.-Atmos., 127, e2021JD035485, https://doi.org/10.1029/2021JD035485, 2022.
Cheng, X., Shi, Y., and Gao, W.: A Study of One Local-Scale Convective Precipitation Event Over Central Tibetan Plateau with Large Eddy Simulations, Earth and Space Science, 9, e2021EA001870, https://doi.org/10.1029/2021EA001870, 2022.
Chin, M., Ginoux, P., Kinne, S., Torres, O., Holben, B. N., Duncan, B. N., Martin, R. V., Logan, J. A., Higurashi, A., and Nakajima, T.: Tropospheric aerosol optical thickness from the GOCART model and comparisons with satellite and Sun photometer measurements, J. Atmos. Sci., 59, 461–483, https://doi.org/10.1175/1520-0469(2002)059<0461:TAOTFT>2.0.CO;2, 2002.
Chin, M., Diehl, T., Tan, Q., Prospero, J. M., Kahn, R. A., Remer, L. A., Yu, H., Sayer, A. M., Bian, H., Geogdzhayev, I. V., Holben, B. N., Howell, S. G., Huebert, B. J., Hsu, N. C., Kim, D., Kucsera, T. L., Levy, R. C., Mishchenko, M. I., Pan, X., Quinn, P. K., Schuster, G. L., Streets, D. G., Strode, S. A., Torres, O., and Zhao, X.-P.: Multi-decadal aerosol variations from 1980 to 2009: a perspective from observations and a global model, Atmos. Chem. Phys., 14, 3657–3690, https://doi.org/10.5194/acp-14-3657-2014, 2014.
Duan, A., Wu, G., Liu, Y., Ma, Y., and Zhao, P.: Weather and climate effects of the Tibetan Plateau, Adv. Atmos. Sci., 29, 978–992, https://doi.org/10.1007/s00376-012-1220-y, 2012.
Dyer, A. and Hicks, B.: Flux-gradient relationships in the constant flux layer, Q. J. Roy. Meteor. Soc., 96, 715–721, https://doi.org/10.1002/qj.49709641012, 1970.
Efraim, A., Lauer, O., Rosenfeld, D., Braga, R. C., Franco, M.-A., Kremper, L. A., Zhu, Y., Pöschl, U., Pöhlker, C., Andreae, M. O., Artaxo, P., de Araújo, A. C., and Pöhlker, M. L.: Satellite-based detection of secondary droplet activation in convective clouds, J. Geophys. Res.-Atmos., 127, e2022JD036519, https://doi.org/10.1029/2022JD036519, 2022.
Fan, J., Leung, L. R., Rosenfeld, D., Chen, Q., Li, Z., Zhang, J., and Yan, H.: Microphysical effects determine macrophysical response for aerosol impacts on deep convective clouds, P. Natl. Acad. Sci. USA, 110, E4581–E4590, https://doi.org/10.1073/pnas.1316830110, 2013.
Freud, E. and Rosenfeld, D.: Linear relation between convective cloud drop number concentration and depth for rain initiation, J. Geophys. Res.-Atmos., 117, D02207, https://doi.org/10.1029/2011JD016457, 2012.
Fu, Y., Liu, G., Wu, G., Yu, R., Xu, Y., Wang, Y., Li, R., and Liu, Q.: Tower mast of precipitation over the central Tibetan Plateau summer, Geophys. Res. Lett., 33, L05802, https://doi.org/10.1029/2005GL024713, 2006.
Gao, W., Sui, C. H., Fan, J., Hu, Z., and Zhong, L.: A study of cloud microphysics and precipitation over the Tibetan Plateau by radar observations and cloud-resolving model simulations, J. Geophys. Res.-Atmos., 121, 13735–13752, https://doi.org/10.1002/2015JD024196, 2016.
Garrett, T. J. and Zhao, C.: Increased Arctic cloud longwave emissivity associated with pollution from mid-latitudes, Nature, 440, 787–789, https://doi.org/10.1038/nature04636, 2006.
Grell, G. A. and Freitas, S. R.: A scale and aerosol aware stochastic convective parameterization for weather and air quality modeling, Atmos. Chem. Phys., 14, 5233–5250, https://doi.org/10.5194/acp-14-5233-2014, 2014.
Huang, J., Minnis, P., Yi, Y., Tang, Q., Wang, X., Hu, Y., Liu, Z., Ayers, K., Trepte, C., and Winker, D.: Summer dust aerosols detected from CALIPSO over the Tibetan Plateau, Geophys. Res. Lett., 34, L18805, https://doi.org/10.1029/2007GL029938, 2007.
Iacono, M. J., Delamere, J. S., Mlawer, E. J., Shephard, M. W., Clough, S. A., and Collins, W. D.: Radiative forcing by long-lived greenhouse gases: Calculations with the AER radiative transfer models, J. Geophys. Res.-Atmos., 113, D13103, https://doi.org/10.1029/2008jd009944, 2008.
Intergovernmental Panel on Climate Change: Climate Change 2013: The Physical Science Basis, in: Contribution of Working Group I to the Fifth Assessment Report of the Intergovernmental Panel on Climate Change, edited by: Stocker, T. F., Qin, D., Plattner, G.-K., Tignor, M., Allen, S. K., Boschung, J., Nauels, A., Xia, Y., Bex, V., and Midgley, P. M., Cambridge Univ. Press, Cambridge, United Kingdom and New York, NY, USA, 1535 pp., ISBN 9781107415324, https://doi.org/10.1017/CBO9781107415324, 2013.
Jiang, M.: Precipitation and sounding data on 24 July 2014 in Naqu, Zenodo [data set], https://doi.org/10.5281/zenodo.7816832, 2023.
Jiang, M., Li, Z., Wan, B., and Cribb, M.: Impact of aerosols on precipitation from deep convective clouds in eastern China, J. Geophys. Res.-Atmos., 121, 9607–9620, https://doi.org/10.1002/2015JD024246, 2016.
Jiang, M., Chen, Z., Yang, Y., Ni, C., and Yang, Q.: Establishment of aerosol optical depth dataset in the Sichuan Basin by the random forest approach, Atmos. Pollut. Res., 13, 101394, https://doi.org/10.1016/j.apr.2022.101394, 2022.
Kang, S., Zhang, Q., Qian, Y., Ji, Z., Li, C., Cong, Z., Zhang, Y., Guo, J., Du, W., Huang, J., You, Q., Panday, A.-K., Rupakheti, M., Chen, D., Gustafsson, Ö., Thiemens, M.-H., and Qin, D.: Linking atmospheric pollution to cryospheric change in the Third Pole region: current progress and future prospects, Natl. Sci. Rev., 6, 796–809, https://doi.org/10.1093/nsr/nwz031, 2019.
Lau, W. and Kim, K.-M.: Impact of Snow Darkening by Deposition of Light-Absorbing Aerosols on Snow Cover in the Himalayas–Tibetan Plateau and Influence on the Asian Summer Monsoon: A Possible Mechanism for the Blanford Hypothesis, Atmosphere, 9, 438, https://doi.org/10.3390/atmos9110438, 2018.
Lee, W.-S., Bhawar, R. L., Kim, M.-K., and Sang, J.: Study of aerosol effect on accelerated snow melting over the Tibetan Plateau during boreal spring, Atmos. Environ., 75, 113–122, https://doi.org/10.1016/j.atmosenv.2013.04.004, 2013.
Li, Z., Niu, F., Fan, J., Liu, Y., Rosenfeld, D., and Ding, Y.: Long-term impacts of aerosols on the vertical development of clouds and precipitation, Nature Geosci., 4, 888–894, https://doi.org/10.1038/ngeo1313, 2011.
Liu, Y., Zhu, Q., Huang, J., Hua, S., and Jia, R.: Impact of dust-polluted convective clouds over the Tibetan Plateau on downstream precipitation, Atmos. Environ., 209, 67–77, https://doi.org/10.1016/j.atmosenv.2019.04.001, 2019.
Liu, Y., Zhu, Q., Hua, S., Alam, K., Dai, T., and Cheng, Y.: Tibetan Plateau driven impact of Taklimakan dust on northern rainfall, Atmos. Environ., 234, 117583, https://doi.org/10.1016/j.atmosenv.2020.117583, 2020.
Liu, Z., Liu, D., Huang, J., Vaughan, M., Uno, I., Sugimoto, N., Kittaka, C., Trepte, C., Wang, Z., Hostetler, C., and Winker, D.: Airborne dust distributions over the Tibetan Plateau and surrounding areas derived from the first year of CALIPSO lidar observations, Atmos. Chem. Phys., 8, 5045–5060, https://doi.org/10.5194/acp-8-5045-2008, 2008.
Ma, Z., Liu, Q., Zhao, C., Shen, X., Wang, Y., Jiang, J. H., Li, Z., and Yung, Y. : Application and evaluation of an explicit prognostic cloud-cover scheme in GRAPES global forecast system, J. Adv. Model. Earth Sy., 10, 652–667, https://doi.org/10.1002/2017MS001234, 2018.
Nakanishi, M. and Niino, H.: Development of an improved turbulence closure model for the atmospheric boundary layer, J. Meteor. Soc. Japan. Ser. II, 87, 895–912, https://doi.org//10.2151/jmsj.87.895, 2009.
Niu, G. Y., Yang, Z. L., Mitchell, K. E., Chen, F., Ek, M. B., Barlage, M., Kumar, A., Manning, K., Niyogi, D., and Rosero, E.: The community Noah land surface model with multiparameterization options (Noah-MP): 1. Model description and evaluation with local-scale measurements, J. Geophys. Res.-Atmos., 116, D12109, https://doi.org/10.1029/2010jd015139, 2011.
Pokharel, M., Guang, J., Liu, B., Kang, S., Ma, Y., Holben, B. N., Xia, X., Xin, J., Ram, K., and Rupakheti, D.: Aerosol properties over Tibetan Plateau from a decade of AERONET measurements: baseline, types, and influencing factors, J. Geophys. Res.-Atmos., 124, 13357–13374, https://doi.org/10.1029/2019JD031293, 2019.
Randles, C., Da Silva, A., Buchard, V., Colarco, P., Darmenov, A., Govindaraju, R., Smirnov, A., Holben, B., Ferrare, R., and Hair, J.: The MERRA-2 aerosol reanalysis, 1980 onward. Part I: System description and data assimilation evaluation, J. Climate, 30, 6823–6850, https://doi.org/10.1175/JCLI-D-16-0609.1, 2017.
Redemann, J., Wood, R., Zuidema, P., Doherty, S. J., Luna, B., LeBlanc, S. E., Diamond, M. S., Shinozuka, Y., Chang, I. Y., Ueyama, R., Pfister, L., Ryoo, J.-M., Dobracki, A. N., da Silva, A. M., Longo, K. M., Kacenelenbogen, M. S., Flynn, C. J., Pistone, K., Knox, N. M., Piketh, S. J., Haywood, J. M., Formenti, P., Mallet, M., Stier, P., Ackerman, A. S., Bauer, S. E., Fridlind, A. M., Carmichael, G. R., Saide, P. E., Ferrada, G. A., Howell, S. G., Freitag, S., Cairns, B., Holben, B. N., Knobelspiesse, K. D., Tanelli, S., L'Ecuyer, T. S., Dzambo, A. M., Sy, O. O., McFarquhar, G. M., Poellot, M. R., Gupta, S., O'Brien, J. R., Nenes, A., Kacarab, M., Wong, J. P. S., Small-Griswold, J. D., Thornhill, K. L., Noone, D., Podolske, J. R., Schmidt, K. S., Pilewskie, P., Chen, H., Cochrane, S. P., Sedlacek, A. J., Lang, T. J., Stith, E., Segal-Rozenhaimer, M., Ferrare, R. A., Burton, S. P., Hostetler, C. A., Diner, D. J., Seidel, F. C., Platnick, S. E., Myers, J. S., Meyer, K. G., Spangenberg, D. A., Maring, H., and Gao, L.: An overview of the ORACLES (ObseRvations of Aerosols above CLouds and their intEractionS) project: aerosol–cloud–radiation interactions in the southeast Atlantic basin, Atmos. Chem. Phys., 21, 1507–1563, https://doi.org/10.5194/acp-21-1507-2021, 2021.
Rosenfeld, D. and Woodley, W. L.: Deep convective clouds with sustained supercooled liquid water down to −37.5 ∘C, Nature, 405, 440–442, https://doi.org/10.1038/35013030, 2000.
Rosenfeld, D., Lohmann, U., Raga, G. B., O'Dowd, C. D., Kulmala, M., Fuzzi, S., Reissell, A., and Andreae, M. O.: Flood or drought: how do aerosols affect precipitation?, Science, 321, 1309–1313, https://doi.org/10.1126/science.1160606, 2008.
Shen, Y., Zhao, P., Pan, Y., and Yu, J.: A high spatiotemporal gauge-satellite merged precipitation analysis over China, J. Geophys. Res.-Atmos., 119, 3063–3075, https://doi.org/10.1002/2013JD020686, 2014.
Stevens, B., Fiedler, S., Kinne, S., Peters, K., Rast, S., Müsse, J., Smith, S. J., and Mauritsen, T.: MACv2-SP: a parameterization of anthropogenic aerosol optical properties and an associated Twomey effect for use in CMIP6, Geosci. Model Dev., 10, 433–452, https://doi.org/10.5194/gmd-10-433-2017, 2017.
Sun, Y. and Zhao, C.: Distinct impacts on precipitation by aerosol radiative effect over three different megacity regions of eastern China, Atmos. Chem. Phys., 21, 16555–16574, https://doi.org/10.5194/acp-21-16555-2021, 2021.
Tao, W. K., Chen, J. P., Li, Z., Wang, C., and Zhang, C.: Impact of aerosols on convective clouds and precipitation, Rev. Geophys., 50, RG2001, https://doi.org/10.1029/2011RG000369, 2012.
Thompson, G. and Eidhammer, T.: A study of aerosol impacts on clouds and precipitation development in a large winter cyclone, J. Atmos. Sci., 71, 3636–3658, https://doi.org/10.1175/JAS-D-13-0305.1, 2014.
Wu, G., Liu, Y., Zhang, Q., Duan, A., Wang, T., Wan, R., Liu, X., Li, W., Wang, Z., and Liang, X.: The influence of mechanical and thermal forcing by the Tibetan Plateau on Asian climate, J. Hydrometeorol., 8, 770–789, https://doi.org/10.1175/JHM609.1, 2007.
Wu, G., Li, Z., Fu, C., Zhang, X., Zhang, R., Zhou, T., Li, J., Li, J., Zhou, D., Wu, L., Zhou, L., He, B., and Huang, R.: Advances in studying interactions between aerosols and monsoon in China, Sci. China Earth Sci., 59, 1–16, https://doi.org/10.1007/s11430-015-5198-z, 2016.
Xu, C., Ma, Y. M., You, C., and Zhu, Z. K.: The regional distribution characteristics of aerosol optical depth over the Tibetan Plateau, Atmos. Chem. Phys., 15, 12065–12078, https://doi.org/10.5194/acp-15-12065-2015, 2015.
Yang, X., Zhou, L., Zhao, C., and Yang, J.: Impact of aerosols on tropical cyclone induced precipitation over the mainland of China, Climatic Change, 148, 173–185, https://doi.org/10.1007/s10584-018-2175-5, 2018.
Yang, X., Zhao, C., Luo, N., Zhao, W., Shi, W., and Yan, X.: Evaluation and Comparison of Himawari-8 L2 V1.0, V2.1 and MODIS C6.1 aerosol products over Asia and the oceania regions, Atmos. Environ., 220, 117068, https://doi.org/10.1016/j.atmosenv.2019.117068, 2020.
Yang, Y., Ni, C., Jiang, M., and Chen, Q.: Effects of aerosols on the atmospheric boundary layer temperature inversion over the Sichuan Basin, China, Atmos. Environ., 262, 118647, https://doi.org/10.1016/j.atmosenv.2021.118647, 2021a.
Yang, Y., Zhao, C., Wang, Q., Cong, Z., Yang, X., and Fan, H.: Aerosol characteristics at the three poles of the Earth as characterized by Cloud–Aerosol Lidar and Infrared Pathfinder Satellite Observations, Atmos. Chem. Phys., 21, 4849–4868, https://doi.org/10.5194/acp-21-4849-2021, 2021b.
Yao, T., Thompson, L. G., Mosbrugger, V., Zhang, F., Ma, Y., Luo, T., Xu, B., Yang, X., Joswiak, D. R., Wang, W., Joswiak, M. E., Devkota, L. P., Tayal, S., Jilani, R., and Fayziev, R.: Third pole environment (TPE), Environ. Dev., 3, 52–64, https://doi.org/10.1016/j.envdev.2012.04.002, 2012.
Ye, D.: Some characteristics of the summer circulation over the Qinghai–Xizang (Tibet) plateau and its neighborhood, B. Am. Meteorol. Soc., 62, 14–19, https://doi.org/10.1175/1520-0477(1981)062<0014:scotsc>2.0.co;2, 1981.
Zhao, C., Yang, Y., Fan, H., Huang, J., Fu, Y., Zhang, X., Kang, S., Cong, Z., Letu, H., and Menenti, M.: Aerosol characteristics and impacts on weather and climate over the Tibetan Plateau, Natl. Sci. Rev., 7, 492–495, https://doi.org/10.1093/nsr/nwz184, 2020.
Zhao, P., Xu, X., Chen, F., Guo, X., Zheng, X., Liu, L., Hong, Y., Li, Y., La, Z., and Peng, H.: The third atmospheric scientific experiment for understanding the earth–atmosphere coupled system over the Tibetan Plateau and its effects, B. Am. Meteorol. Soc., 99, 757–776, https://doi.org/10.1175/BAMS-D-16-0050.1, 2018.
Zhou, X., Bei, N., Liu, H., Cao, J., Xing, L., Lei, W., Molina, L. T., and Li, G.: Aerosol effects on the development of cumulus clouds over the Tibetan Plateau, Atmos. Chem. Phys., 17, 7423–7434, https://doi.org/10.5194/acp-17-7423-2017, 2017.
Zhu, J., Xia, X., Che, H., Wang, J., Cong, Z., Zhao, T., Kang, S., Zhang, X., Yu, X., and Zhang, Y.: Spatiotemporal variation of aerosol and potential long-range transport impact over the Tibetan Plateau, China, Atmos. Chem. Phys., 19, 14637–14656, https://doi.org/10.5194/acp-19-14637-2019, 2019.