the Creative Commons Attribution 4.0 License.
the Creative Commons Attribution 4.0 License.
 | 06 Apr 2023
Nitrate chemistry in the northeast US – Part 2: Oxygen isotopes reveal differences in particulate and gas-phase formation
Heejeong Kim
Wendell W. Walters
Claire Bekker
Lee T. Murray
Meredith G. Hastings
The northeastern US represents a mostly urban corridor impacted by high population and fossil fuel combustion emission density. This has led to historically degraded air quality and acid rain that has been a focus of regulatory-driven emissions reductions. Detailing the chemistry of atmospheric nitrate formation is critical for improving the model representation of atmospheric chemistry and air quality. The oxygen isotopic compositions of atmospheric nitrate are useful indicators in tracking nitrate formation pathways. Here, we measured oxygen isotope deltas (Δ(17O) and δ(18O)) for nitric acid (HNO3) and particulate nitrate (pNO3) from three US EPA Clean Air Status and Trends Network (CASTNET) sites in the northeastern US from December 2016 to 2018. The Δ(17O, HNO3) and δ(18O, HNO3) values ranged from 12.9 ‰ to 30.9 ‰ and from 46.9 ‰ to 82.1 ‰, and the Δ(17O, pNO3) and δ(18O, pNO3) ranged from 16.6 ‰ to 33.7 ‰ and from 43.6 ‰ to 85.3 ‰, respectively. There was distinct seasonality of δ(18O) and Δ(17O), with higher values observed during winter compared to during summer, suggesting a shift in O3 to HOx radical chemistry, as expected. Unexpectedly, there was a statistical difference in Δ(17O) between HNO3 and pNO3, with higher values observed for pNO3 (27.1 ± 3.8) ‰ relative to HNO3 (22.7 ± 3.6) ‰, and significant differences in the relationship between δ(18O) and Δ(17O). This difference suggests atmospheric nitrate phase-dependent oxidation chemistry that is not predicted in models. Based on the output from GEOS-Chem and both the δ(18O) and Δ(17O) observations, we quantify the production pathways of atmospheric nitrate. The model significantly overestimated the heterogeneous N2O5 hydrolysis production for both HNO3 and pNO3, a finding consistent with observed seasonal changes in δ(18O) and Δ(17O) of HNO3 and pNO3, though large uncertainties remain in the quantitative transfer of δ(18O) from major atmospheric oxidants. This comparison provides important insight into the role of oxidation chemistry in reconciling a commonly observed positive bias for modeled atmospheric nitrate concentrations in the northeastern US.
- Article
(11706 KB) - Full-text XML
- Companion paper
- BibTeX
- EndNote


Nitrogen oxides (NOx = NO + NO2) in the atmosphere have an important impact on air quality and human and ecosystem health (Galloway et al., 2004). NOx plays an important role in influencing the oxidizing efficiency of the atmosphere, including the production of ozone (O3), and leads to the formation of atmospheric nitrate (gas-phase nitric acid (HNO3) and nitrate in particulate form (pNO3; Crutzen, 1979). HNO3 and pNO3 are, in turn, important contributors to dry and wet N deposition. Nitrate is a key component of particulate matter (PM2.5), which has direct adverse effects on human respiration and climate change, and the deposition of N to ecosystems can contribute to soil acidification and eutrophication (Camargo and Alonso, 2006; Schlesinger, 2007; Tai et al., 2010). Thus, changes in the chemistry and chemical feedbacks associated with NOx have important implications for predicting air quality improvements and climatic responses.
The US Environmental Protection Agency (EPA) reported that NOx emissions decreased by 36 % in the United States from 2007 to 2015 due to effective regulations in response to the Clean Air Act and its amendments (US EPA, 2017; CASTNET, 2019; NEI, 2017; Shah et al., 2018). However, atmospheric pNO3 concentrations have responded sub-linearly to the dramatic NOx emission reductions, with only a 7.8 % pNO3 decrease over the same period in the northeastern US. Uncertainties in our understanding of NOx reductions and the production of atmospheric nitrate challenge our ability to make effective reductions in reactive nitrogen concentrations. Major factors influencing atmospheric nitrate production include oxidant availability, heterogeneous chemistry, gas-to-particle partitioning, and potential aerosol nitrate photolysis (Jaeglé et al., 2018; Shah et al., 2018; Kasibhatla et al., 2018).
Atmospheric nitrate concentrations have been simulated using various chemistry models to detail spatiotemporal variabilities between precursor NOx emissions and nitrate in the US, with somewhat limited success (Walker et al., 2012; Zhang et al., 2012). In particular, the concentrations of nitrate observed in the northeastern US tend to be overestimated in models (e.g., Heald et al., 2012; Zhang et al., 2012). The northeastern US is an important region to monitor due to its high population density, transport patterns, and the tendency for poor air quality (Sickles and Shadwick, 2015). Modeling studies suggest that biases revealed by comparison with observations could be due to uncertainties in NOx and gaseous ammonia (NH3) emission estimates, dry deposition removal rates, heterogeneous chemical production rates, and changing chemistry due to reductions in NOx and sulfur dioxide emissions (Heald et al., 2012; Holt et al., 2015; Shah et al., 2018).
The nitrate oxygen isotope deltas (Δ(17O) and δ(18O)) have been proven to provide observational constraints on the oxidation pathways that are responsible for the formation of atmospheric nitrate (Hastings et al., 2003; Michalski et al., 2003; Alexander et al., 2009). The isotopic composition is expressed as δ, which is a standardized notation and is quantified as δ = (). R is the ratio of the heavy isotope to the light isotope (e.g., ; ) in the sample and in internationally recognized isotopic reference material (Vienna Standard Mean Ocean Water), respectively. Several studies have suggested that the distinctive (Δ(17O) = δ(17O) − 0.52 × δ(18O)) and δ(18O) signatures of atmospheric oxidants such as O3, , H2O, and OH are incorporated into nitrate, tracking the oxidation chemistry of NOx (Hastings et al., 2003; Michalski et al., 2003; Savarino et al., 2007). Traditionally, the influence of O3 incorporation in nitrate has been quantitatively tracked using only Δ(17O) because of the unique mass-independent fractionation that results in O3 carrying excess δ(17O), yielding a transferrable Δ(17O) = (39 ± 2) ‰ (Thiemens, 2006; Vicars and Savarino, 2014). However, all other atmospheric oxidants contain expected mass-dependent signatures, such that all have a Δ(17O) value of approximately 0 ‰. The δ(18O) of atmospheric oxidants could provide further insights into nitrate production mechanisms, especially in cases where oxidants other than O3 are important, since it is distinctive for each oxidant (e.g., δ(18O, O3) = (126.3 ± 12) ‰; δ(18O, O2) = 23 ‰; δ(18O, OH) = −43 ‰; Michalski et al., 2012; Vicars and Savarino, 2014).
The northeastern US remains an important region to monitor due to air quality historically degraded by NOx emissions and negative atmospheric nitrate deposition impacts on sensitive ecosystems. Changes in oxidation chemistry and chemical feedbacks associated with nitrate production and deposition have important implications for predicting air quality improvements and for informing policy recommendations. In this study, using the Clean Air Status and Trends Network (CASTNET) samples, we explored spatiotemporal differences in HNO3 and pNO3 concentrations and production mechanisms in the northeastern US over 2 years. Based on these observations, we aimed to better constrain the mismatch in modeled predictions of atmospheric nitrate chemistry in the northeastern US. This is the first study to quantitatively evaluate the triple-oxygen-isotope composition from observations and model simulations in the northeastern US. The comparisons with the combination of Δ(17O) and δ(18O) values and with both gaseous and particle phases of nitrate provide a significant advance in our ability to probe the representation of oxidation chemistry in atmospheric chemistry models.
2.1 CASTNET samples
Atmospheric nitrate samples were collected by the US EPA at several locations of CASTNET sites in the northeastern US (Fig. 1). Three CASTNET sites were selected: Abington, CT (ABT147; 41.84∘ N, −72.01∘ W); Connecticut Hill, NY (CTH110; 42.40∘ N, −76.65∘ W); Woodstock, NH (WST109; 43.94∘ N, −71.70∘ W). The samples were collected weekly from 23 December 2016 to 28 December 2018 using a three-stage filter pack system. Based on EPA protocols, pNO3 was collected using a Teflon filter in the first stage of the filter pack, and gaseous HNO3 was collected using a Nylon filter in the second stage of the filter pack. We note that, due to the semi-volatile characteristic of ammonium nitrate, some pNO3 might volatilize as HNO3 and collect downstream of the filter pack, leading to negative biases for pNO3 and positive biases for HNO3 collection (Hering and Cass, 1999; Ashbaugh and Eldred, 2004).
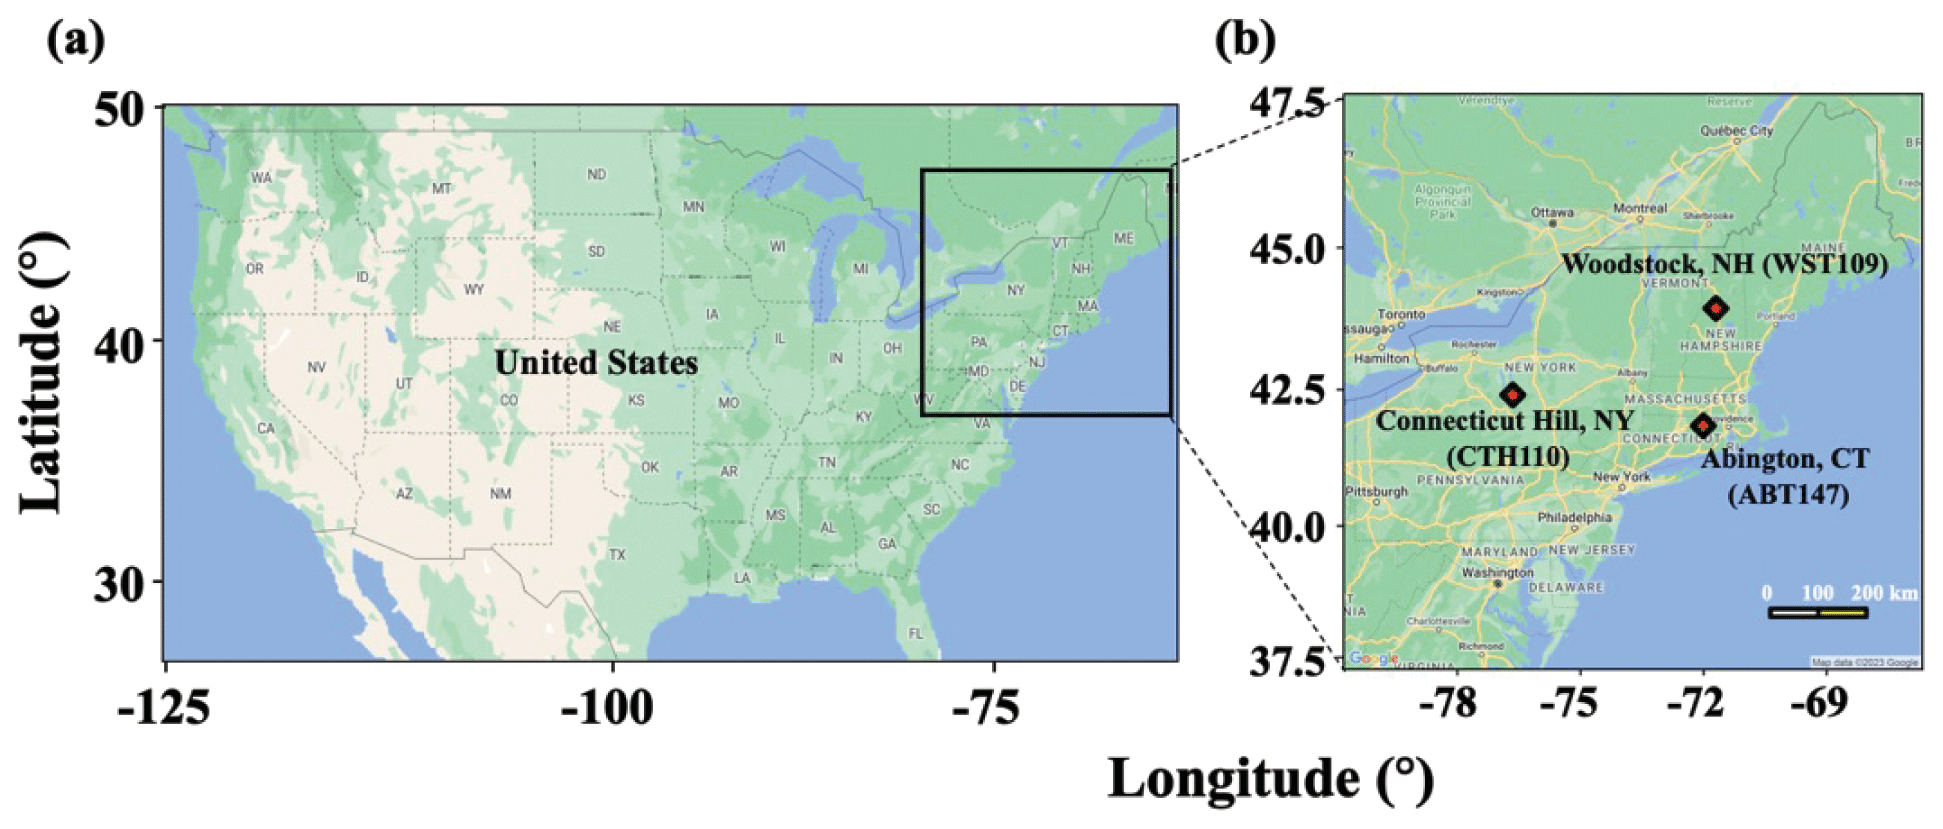
Figure 1Map of the United States (a) and selected CASTNET sites (b) for this study in the northeastern US. Major cities (urban areas), transportation routes, and CASTNET sites are also indicated in (b). The image was created using Google Earth (© 2023 Google).
2.2 Concentration and isotope analyses
Filters were extracted and measured for nitrate concentration using ion chromatography and then stored in the CASTNET laboratory at room temperature for up to 2 years. Extracted samples were shipped to Brown University in the summer of 2020. Nitrate concentrations were measured at Brown University to check for stability of nitrate using standard colorimetric methods (i.e., US EPA Method 353.2) on an automated discrete UV-Vis Analyzer (SmartChem Westco Scientific Instruments, Inc.). The limit of detection was 0.1 and 0.3 µM for nitrite and nitrate, respectively, and the pooled standard deviation of replicate quality control standards was better than 3 %. Overall, strong positive correlations were found between measured concentrations at Brown and reported CASTNET data for both HNO3 ( (R2=0.99); p<0.05) and pNO3 (.09 (R2=0.99); p<0.05) (Fig. 2); we, therefore, consider the samples to be representative of their original concentrations.
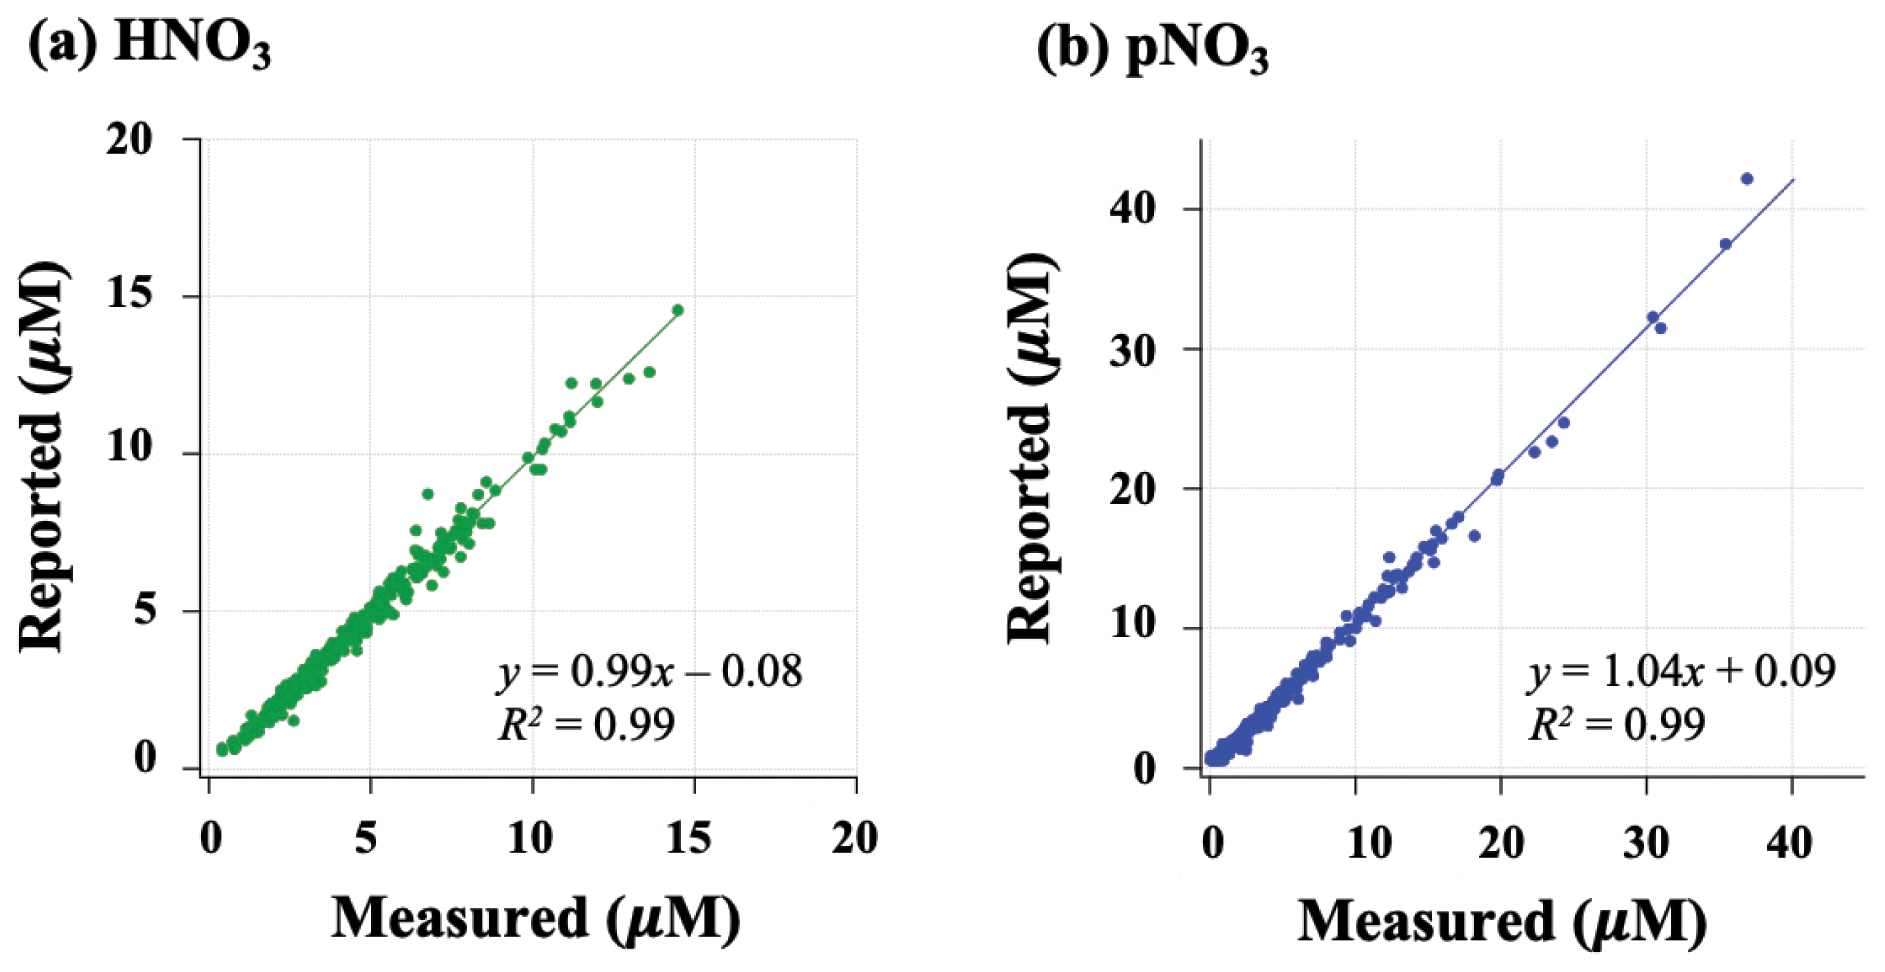
Figure 2Relationship of HNO3 (a) and pNO3 (b) filter extract concentrations reported by CASTNET and re-measured at Brown University.
The samples were collected once a week, and equal volumes of filter extract were combined for isotope analysis to produce monthly aggregates for HNO3 and pNO3, respectively. Oxygen (δ(18O) and Δ(17O)) stable isotopic compositions in HNO3 and pNO3 were analyzed utilizing the bacterial denitrifier method at Brown University (Sigman et al., 2001; Casciotti et al., 2002; Kaiser et al., 2007). Briefly, samples were injected into a buffer solution containing Pseudomonas aureofaciens, which lack the nitrous oxide (N2O) reductase enzyme, and sample nitrate was quantitatively reduced to N2O. For δ(18O) analysis, the generated N2O is injected into a Thermo-Finnigan Delta V Plus isotope ratio mass spectrometry (IRMS) with a modified GasBench system after flowing through an automated extraction and purification system. Determination of δ(18O) in N2O was conducted at an of 44, 45, and 46 and corrected using internationally recognized isotopic reference materials that included IAEA-NO-3 (25.6 ‰), USGS34 (−27.9 ‰), and USGS35 (57.5 ‰). The Δ(17O) was determined in a separate analysis. The bacteria-generated N2O was decomposed to N2 and O2 in a gold furnace heated to 770 ∘C and analyzed at 32, 33, and 34 to determine and ratios of the evolved O2. The and mass ratios were corrected using isotopic reference materials, USGS34 (−0.29 ‰) and USGS35 (21.6 ‰), and then Δ(17O) was determined from Δ(17O) = δ(17O) − 0.52 × δ(18O). Due to sample mass limitations, some samples were only analyzed for δ(18O). The number of samples that were not measured for Δ(17O) was 1 HNO3 sample from CTH110, 2 HNO3 samples from ABT147, 5 pNO3 samples from CTH110, and 16 pNO3 samples from WST109. The overall pooled standard deviations of isotopic reference materials and sample numbers were as followed: USGS34 (σ(δ(18O)) = 0.5 ‰ (n=21); σ(Δ(17O)) = 1 ‰ (n=26)); USGS35 (σ(δ(18O)) = 0.4 ‰ (n=27); σ(Δ(17O)) = 2 ‰ (n=26)), and IAEA-NO-3 (σ(δ(18O)) = 0.3 ‰ (n=23)).
2.3 GEOS-Chem modeling
The GEOS-Chem global model of atmospheric chemistry (Bey et al., 2001; Walker et al., 2012, 2019) was utilized to track the production of NO2 and HNO3 at the CASTNET sites and, further, to model the oxygen isotope deltas (e.g., δ(18O) and Δ(17O)) following a previous framework (Alexander et al., 2020). Following this framework, oxidation chemistry is tagged only for HNO3 production and is assumed to be the same for pNO3. We use version 13.2.1 (http://wiki.seas.harvard.edu/geos-chem/index.php/GEOS-Chem_13.2.1, last access: 2 September 2022) of the model driven by GEOS5-FP assimilated meteorology from the NASA Global Modeling and Assimilation Office (GMAO). A nested-grid (0.25∘ latitude × 0.3125∘ longitude horizontal resolution; ∼ 25 km) simulation was conducted over the northeastern United States (97–60∘ W, 35–60∘ N) in 2017 and 2018. Boundary conditions were from global simulations performed at 4∘ latitude × 5∘ longitude horizontal resolution for the same years after a 1-year initialization. Gas- and aerosol-phase chemistry was simulated using the default “fullchem” mechanism (Bates and Jacob, 2019; Wang et al., 2021). Inorganic gas and aerosol partitioning were conducted using version 2.2 of the ISORROPIA II thermodynamic equilibrium model (Fountoukis and Nenes, 2007).
All default anthropogenic emissions were applied, which is primarily version 2.0 of the Community Emissions Data System (Hoesly et al., 2018) as implemented by McDuffie et al. (2020). Natural emissions respond to local meteorology and include biogenic VOCs (volatile organic compounds) from terrestrial plants and the ocean (Millet et al., 2010; Guenther et al., 2012; Hu et al., 2015; Breider et al., 2017), NOx from lightning and soil microbial activity (Murray et al., 2012; Hudman et al., 2012), mineral dust (Ridley et al., 2012), and sea salt (Jaeglé et al., 2011; Huang and Jaeglé, 2017). Biomass burning emissions were monthly means from version 4.1s of the Global Fire Emissions Database (GFED4.1s; van der Werf et al., 2017). Wet deposition for water-soluble aerosols is described by Liu et al. (2001) and by Amos et al. (2012) for gases. Dry deposition is based on the resistance-in-series scheme of Wesely and Lesht (1989). Diagnostics were implemented to archive the total production and loss pathways of NOy, NOx, NO2, RONO2, HNO3, and pNO3, including the net flux of mass between HNO3 and pNO3 in ISORROPIA II. We evaluated model performance for simulating concentrations and isotope deltas (δ(18O) and Δ(17O)) using the normalized mean bias (B) metric (Eq. 1):
where is the modeled quantities, and is the observed quantities.
2.4 δ(18O) and Δ(17O) calculations based on model outputs
The oxygen isotope deltas (δ(18O) and Δ(17O)) of nitrate were calculated based on oxygen isotope mass balance using production rate outputs from the GEOS-Chem global 3-D model and compared with our observations. Expected δ(18O) and Δ(17O) ranges resulting from nitrate production pathways have been previously described and calculated using oxygen mass balance (Alexander et al., 2009, 2020; Michalski et al., 2003; Morin et al., 2011; Carter et al., 2021). Briefly, the δ(18O) and Δ(17O) of nitrate are determined by both NOx photochemical cycling and nitrate formation reactions (Alexander et al., 2009; Walters et al., 2018). During NOx photochemical cycling, the oxygen isotopic compositions of NOx are determined by the relative production rates of NO2 via reaction of NO with O3, peroxy and hydroperoxyl radicals, and halogen oxides (XO; BrO, ClO). The proportional contribution of O3 during NO oxidation is denoted as A and is calculated using
where k is the respective rate constant for NO oxidation via O3, XO, HO2, and RO2. The Δ(17O) value of the terminal oxygen atom in O3 (O) is assumed to be (39 ± 2) ‰ based on observations, while all other oxidants are assumed to be 0 ‰ (Vicars et al., 2012; Vicars and Savarino, 2014; Alexander et al., 2020); δ(18O) and Δ(17O) values of nitrate from each production pathway were then determined using O mass balance based on the O transfer from varying oxidants involved in its formation (Table 1).
Table 1Equations for δ(18O) and Δ(17O) calculations by different nitrate formation pathways.
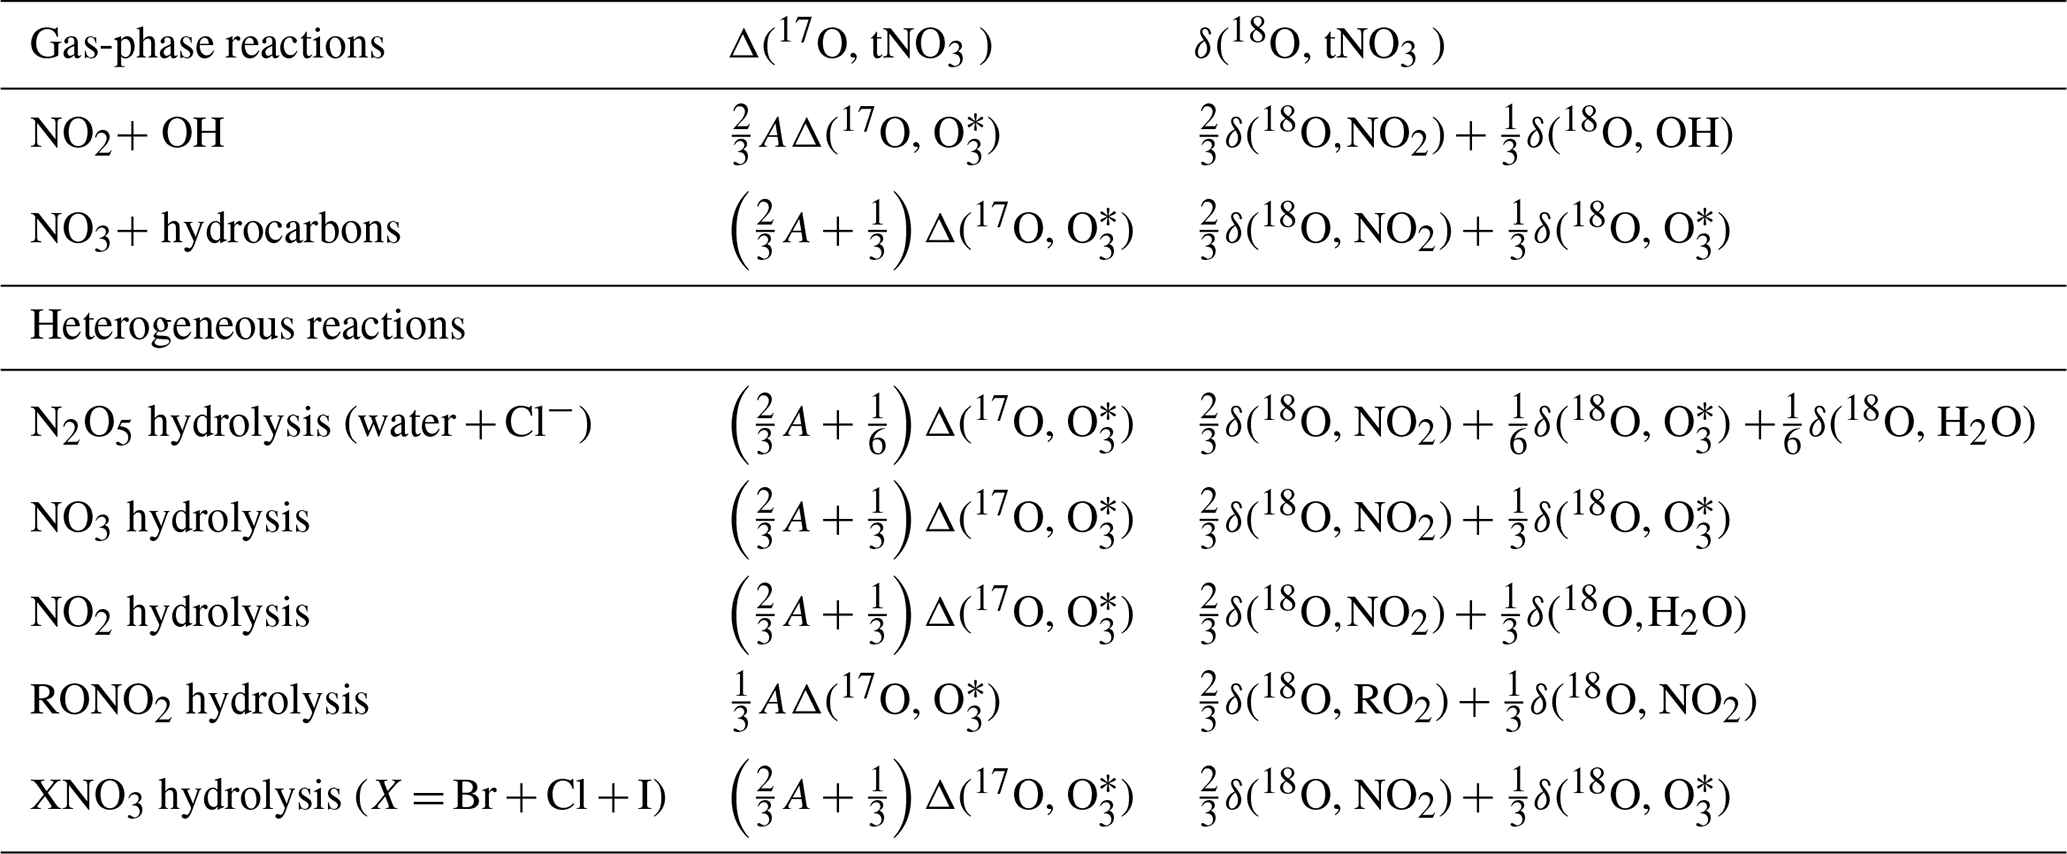
The GEOS-Chem global model has been previously used to quantify nitrate production pathways based on Δ(17O) (Alexander et al., 2009, 2020), but this has not been done for δ(18O). Using a similar framework as that for Δ(17O), we expect that δ(18O) of NO2 reflects isotopic signatures of both O3 and O2, as it has been assumed that the O isotopic composition of RO2 and HO2 is equal to O2 (Michalski et al., 2012; Walters et al., 2018). Accordingly, the values of δ(18O, NO2) can be predicted by the proportional contribution of O3 and both HO2 and RO2 during NOx cycling with their distinct δ(18O) values of O3 and O2 (Eq. 3; Table 1).
The δ(18O) values of O3 and O2 are adopted from previous studies that determined δ(18O, O) and δ(18O, O2) to be 126.3 ‰ and 23 ‰ (Vicars and Savarino, 2014; Kroopnick and Craig, 1972, respectively). For the calculation of δ(18O) of nitrate, the value of δ(18O) of H2O(l) is assumed to be −6 ‰, which is a typical mid-latitude value and represents water in the liquid phase incorporated into nitrate formation associated with heterogeneous reactions by N2O5 or NO2 hydrolysis (Michalski et al., 2012). The δ(18O) value of OH can be dependent on both O3 and H2O(g), as well as environmental conditions, since oxygen in OH can exchange with H2O(g) (Dubey et al. 1997). Fractionation factors associated with the O transfer into NOy products are unknown and therefore were not considered. The δ(18O) of H2O(g) was estimated based on the equilibrium between H2O(l) and H2O(g) with a temperature-dependent fractionation factor (1.0094 at 298 K); it is assumed that OH and H2O(g) exist in isotopic equilibrium, which has a theoretically determined fractionation factor (1.0371 at 298 K) and leads to an estimate of δ (18O, OH) of −43 ‰ (Michalski et al., 2012; Walters and Michalski, 2016). We note that the typical annual temperature for the northeast US is approximately 287 K, yielding a δ(18O, OH) of −45 ‰; for comparison purposes with prior publications, we utilize −43 ‰, which makes little difference in the quantitative results below. In the final step, δ(18O) or Δ(17O) of total atmospheric nitrate were calculated based on the monthly averaged production rates from GEOS-Chem and the seven major reactions that produce nitrate in the model (Table 1) to compare with observations.
3.1 Spatiotemporal variations of atmospheric nitrate concentration
Figure 3 shows the monthly averaged spatiotemporal variations of HNO3 and pNO3 mass concentration (denoted as γ). The observed (o) HNO3 concentrations (γo(HNO3)) ranged from 0.11 to 0.88 µg m−3, with a mean value of 0.46 µg m−3 across the three CASTNET sites. The observed pNO3 concentrations (γo(pNO3)) ranged from 0.04 to 2.01 µg m−3, with a mean value of 0.50 µg m−3, and showed clear seasonality at all three sites, with averaged higher values of (0.75 ± 0.52) µg m−3 in the cold season (October to March) and lower values of (0.25 ± 0.17) µg m−3 in the warm season (April to September), which were significantly different (p<0.01). On the other hand, γo(HNO3) was seasonally invariable with (0.42 ± 0.17) µg m−3 for the cold season and (0.50 ± 0.24) µg m−3 for the warm season, which were not statistically different (p>0.05). Averaged γo(HNO3) was generally lower than pNO3 across the sites, but the difference was statistically insignificant (p>0.05). Both γo(HNO3) and γo(pNO3) indicated spatial variability, with higher values at ABT147 and CTH110 than at the WST109 site. The mean annual γo(HNO3) and γo(pNO3) were (0.61 ± 0.15) µg m−3 and (0.66 ± 0.34) µg m−3 at ABT147, (0.55 ± 0.13) µg m−3 and (0.68 ± 0.58) µg m−3 at CTH110, and (0.22 ± 0.06) µg m−3 and (0.17 ± 0.13) µg m−3 at WST109, respectively.
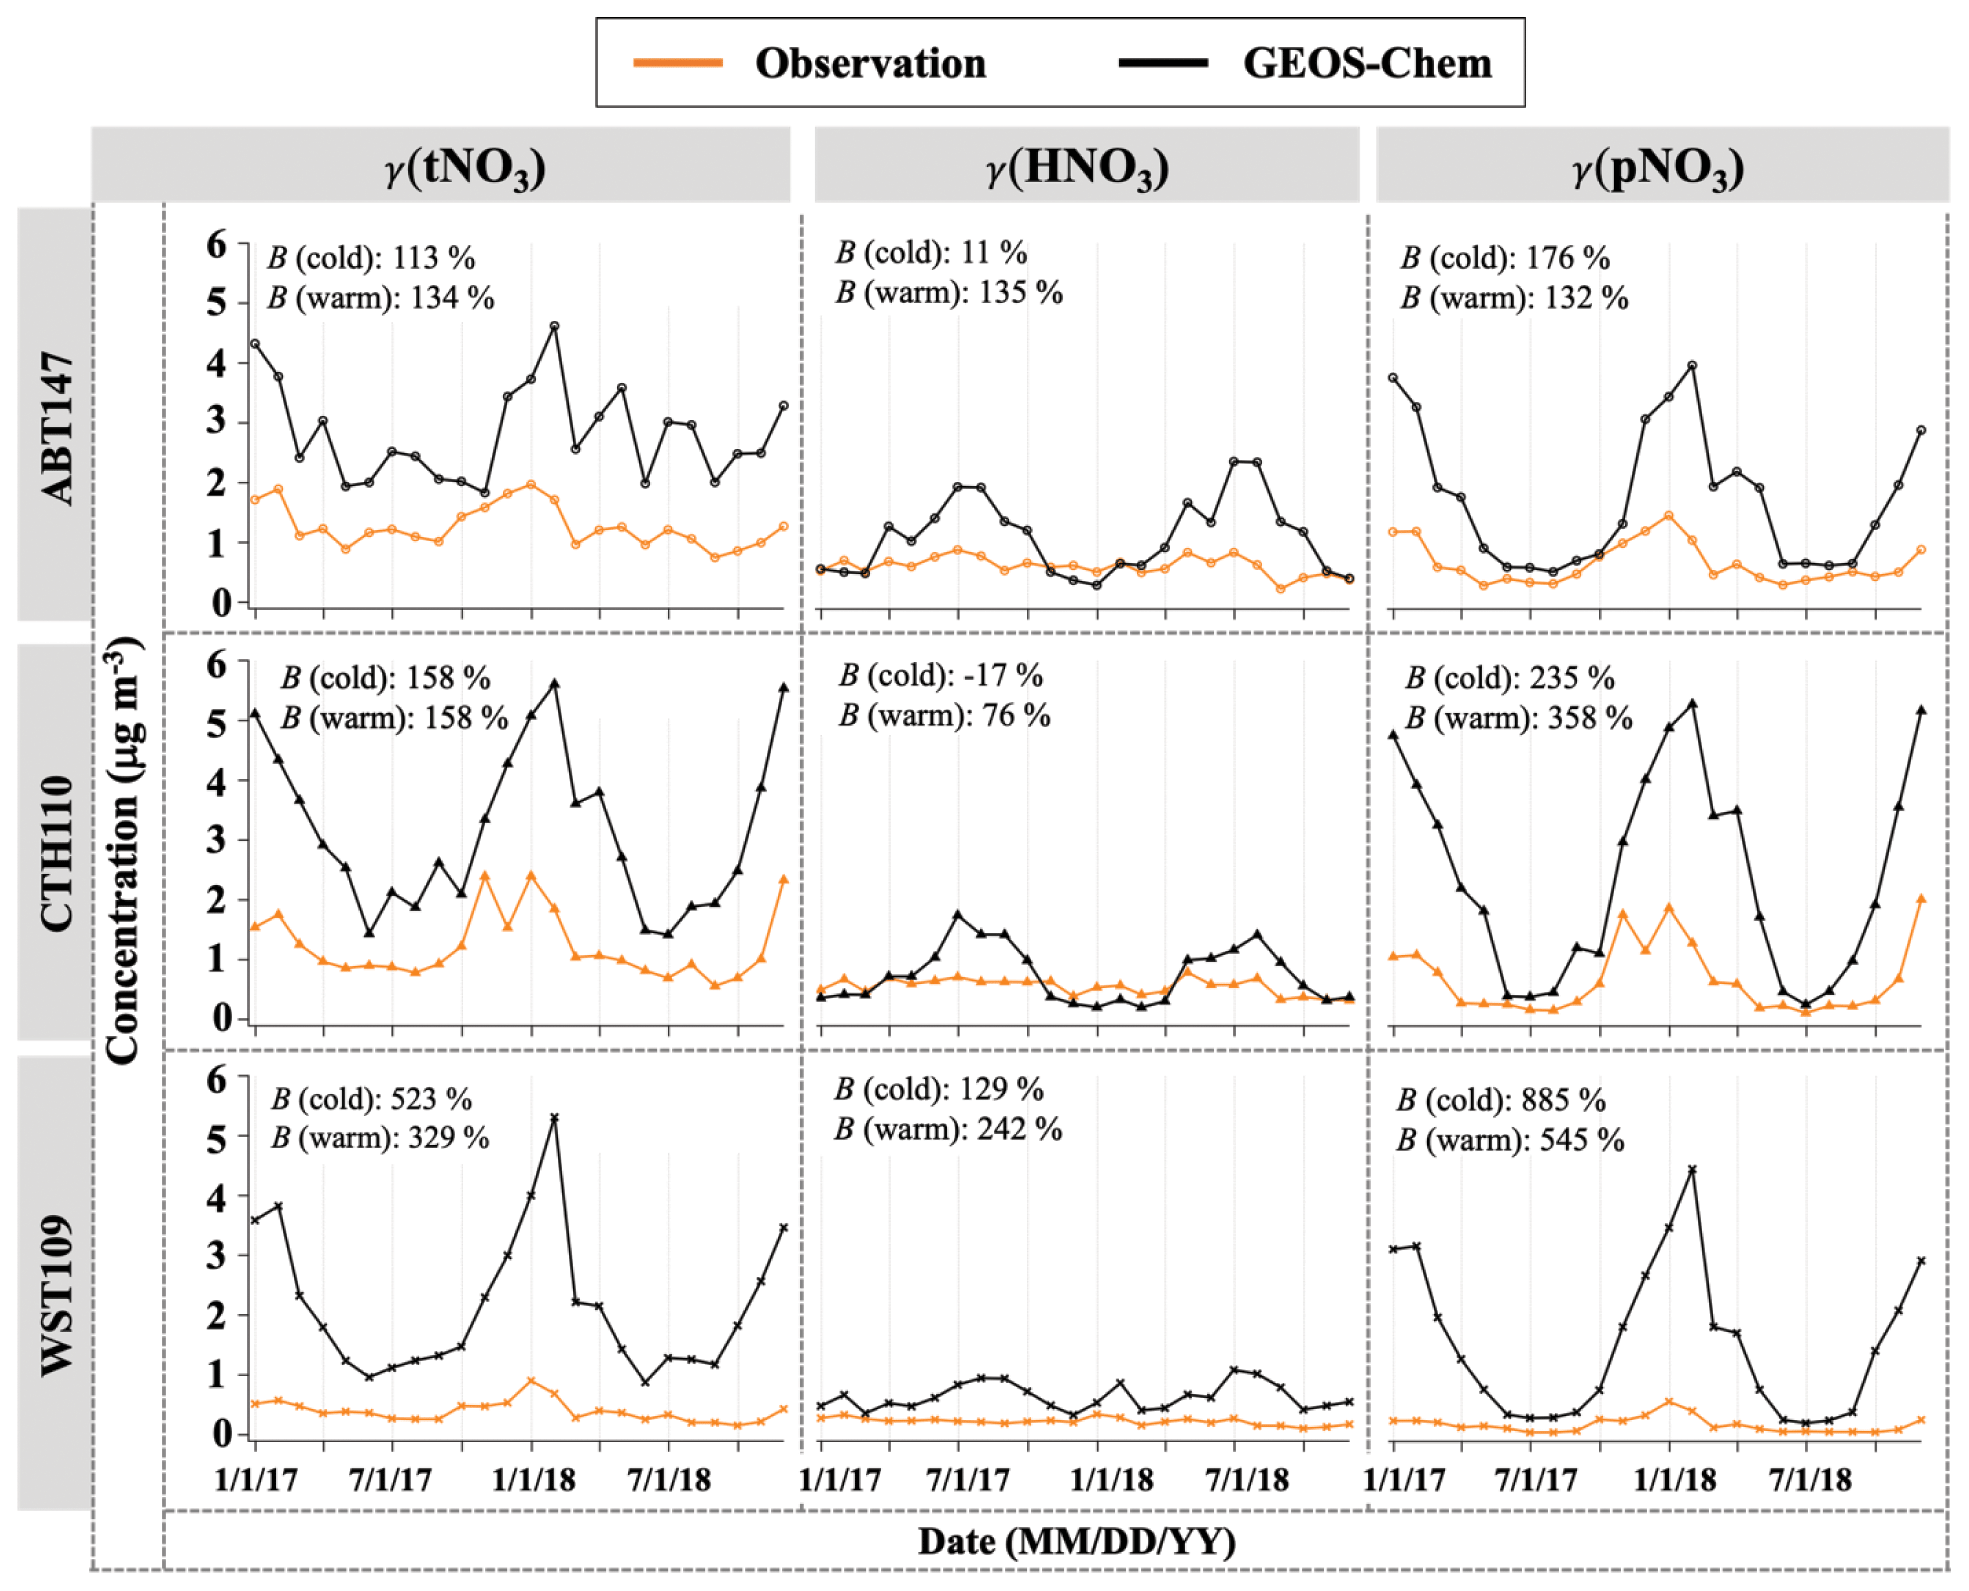
Figure 3Time series of monthly mean total nitrate, HNO3, and pNO3 concentrations (γ) observed and simulated at ABT147, CTH110, and WST109 CASTNET sites. B refers to the normalized mean bias for comparison of the model to observations (see Sect. 2.3 in Methods).
The modeled (m) HNO3 concentrations (γm(HNO3)) ranged from 0.20 to 2.36 µg m−3, with a mean value of 0.82 µg m−3, and modeled pNO3 concentrations (γm(pNO3)) ranged from 0.20 to 5.27 µg m−3, with a mean value of 1.89 µg m−3. Contrary to our observed data, no consistent spatial variability was observed for γm(HNO3) and γm(pNO3). The mean γm(HNO3) and γm(pNO3) were (1.09 ± 0.62) µg m−3 and (1.73 ± 1.13) µg m−3 at ABT147, (0.74 ± 0.46) µg m−3 and (2.42 ± 1.71) µg m−3 at CTH110, and (0.64 ± 0.22) µg m−3 and (1.52 ± 1.24) µg m−3 at WST109, respectively. However, there are significant seasonal model biases for the HNO3 and pNO3. The model significantly overestimates pNO3 during the winter (3–9 times) and overestimates HNO3 during the summer (2–3 times).
As stated above, there can be negative biases for pNO3 and positive biases for HNO3 collection, but these should be reduced by comparing the model to total atmospheric nitrate (tNO3 = HNO3 + pNO3). Still, the simulated tNO3 concentration (γm(tNO3)) with GEOS-Chem is notably overestimated relative to observations (γo(tNO3); B=182 %; Fig. 3). While the simulated pNO3 reproduced well the observed seasonality (high concentrations in the cold season and vice versa), it highly overestimated the concentrations for most of the year (B=276 %; Fig. 3). The simulated HNO3 did not capture the observed relative lack of seasonality, instead showing clear seasonality, with generally high concentrations in the warm season and low concentrations in the cold season. The lack of agreement between GEOS-Chem and nitrate observations is consistent with previously reported results in other studies (Heald et al., 2012; Zhang et al., 2012; Walker et al., 2012). Uncertainties in N2O5 hydrolysis rate, emission estimates, or dry and wet deposition removal rates have been suggested as possible causes for predicted nitrate biases. For instance, Luo et al. (2019, 2020) reported dramatic improvement of nitric acid and nitrate biases by updating wet scavenging parameterization in the GEOS-Chem model; however, this update leads to biases in oxidized-nitrogen wet deposition between model predictions and observations.
3.2 Oxygen isotopic compositions – oxidation chemistry and phase difference
The oxygen isotopic compositions in atmospheric nitrate are used to evaluate NOx oxidation chemistry and to assess seasonal changes in nitrate formation mechanisms. For the CASTNET sites, the Δ(17O, HNO3) and Δ(17O, pNO3) values ranged from 12.9 ‰ to 30.9 ‰ and from 16.6 ‰ to 33.7 ‰, with a mean value of (22.7 ± 3.6) ‰ and (27.1 ± 3.8) ‰, respectively (Fig. 4). The δ(18O, HNO3) and δ(18O, pNO3) values ranged from 46.9 ‰ to 82.1 ‰ and from 43.6 ‰ to 85.3 ‰, with a mean value of (68.1 ± 7.1) ‰ and (68.2 ± 8.3) ‰, respectively (Fig. 5). These observations are in the range of previously reported values in polluted mid-latitudes: δ(18O, HNO3) and δ(18O, pNO3) in CASTNET sites in Ohio, Pennsylvania, and New York from April 2004 to March 2005 ranged from 51.6 ‰ to 94.0 ‰ and from 45.2 ‰ to 92.7 ‰ (Elliott et al., 2009), respectively. They are also consistent with observations of polluted air masses in Canada from September 2010 to January 2014, which were from 62.4 ‰ to 81.7 ‰ for δ(18O, HNO3), from 19.3 ‰ to 29.0 ‰ for Δ(17O, HNO3), from 48.4 ‰ to 83.2 ‰ for δ(18O, pNO3), and from 13.8 ‰ to 30.5 ‰ for Δ(17O, pNO3) (Savard et al., 2018).
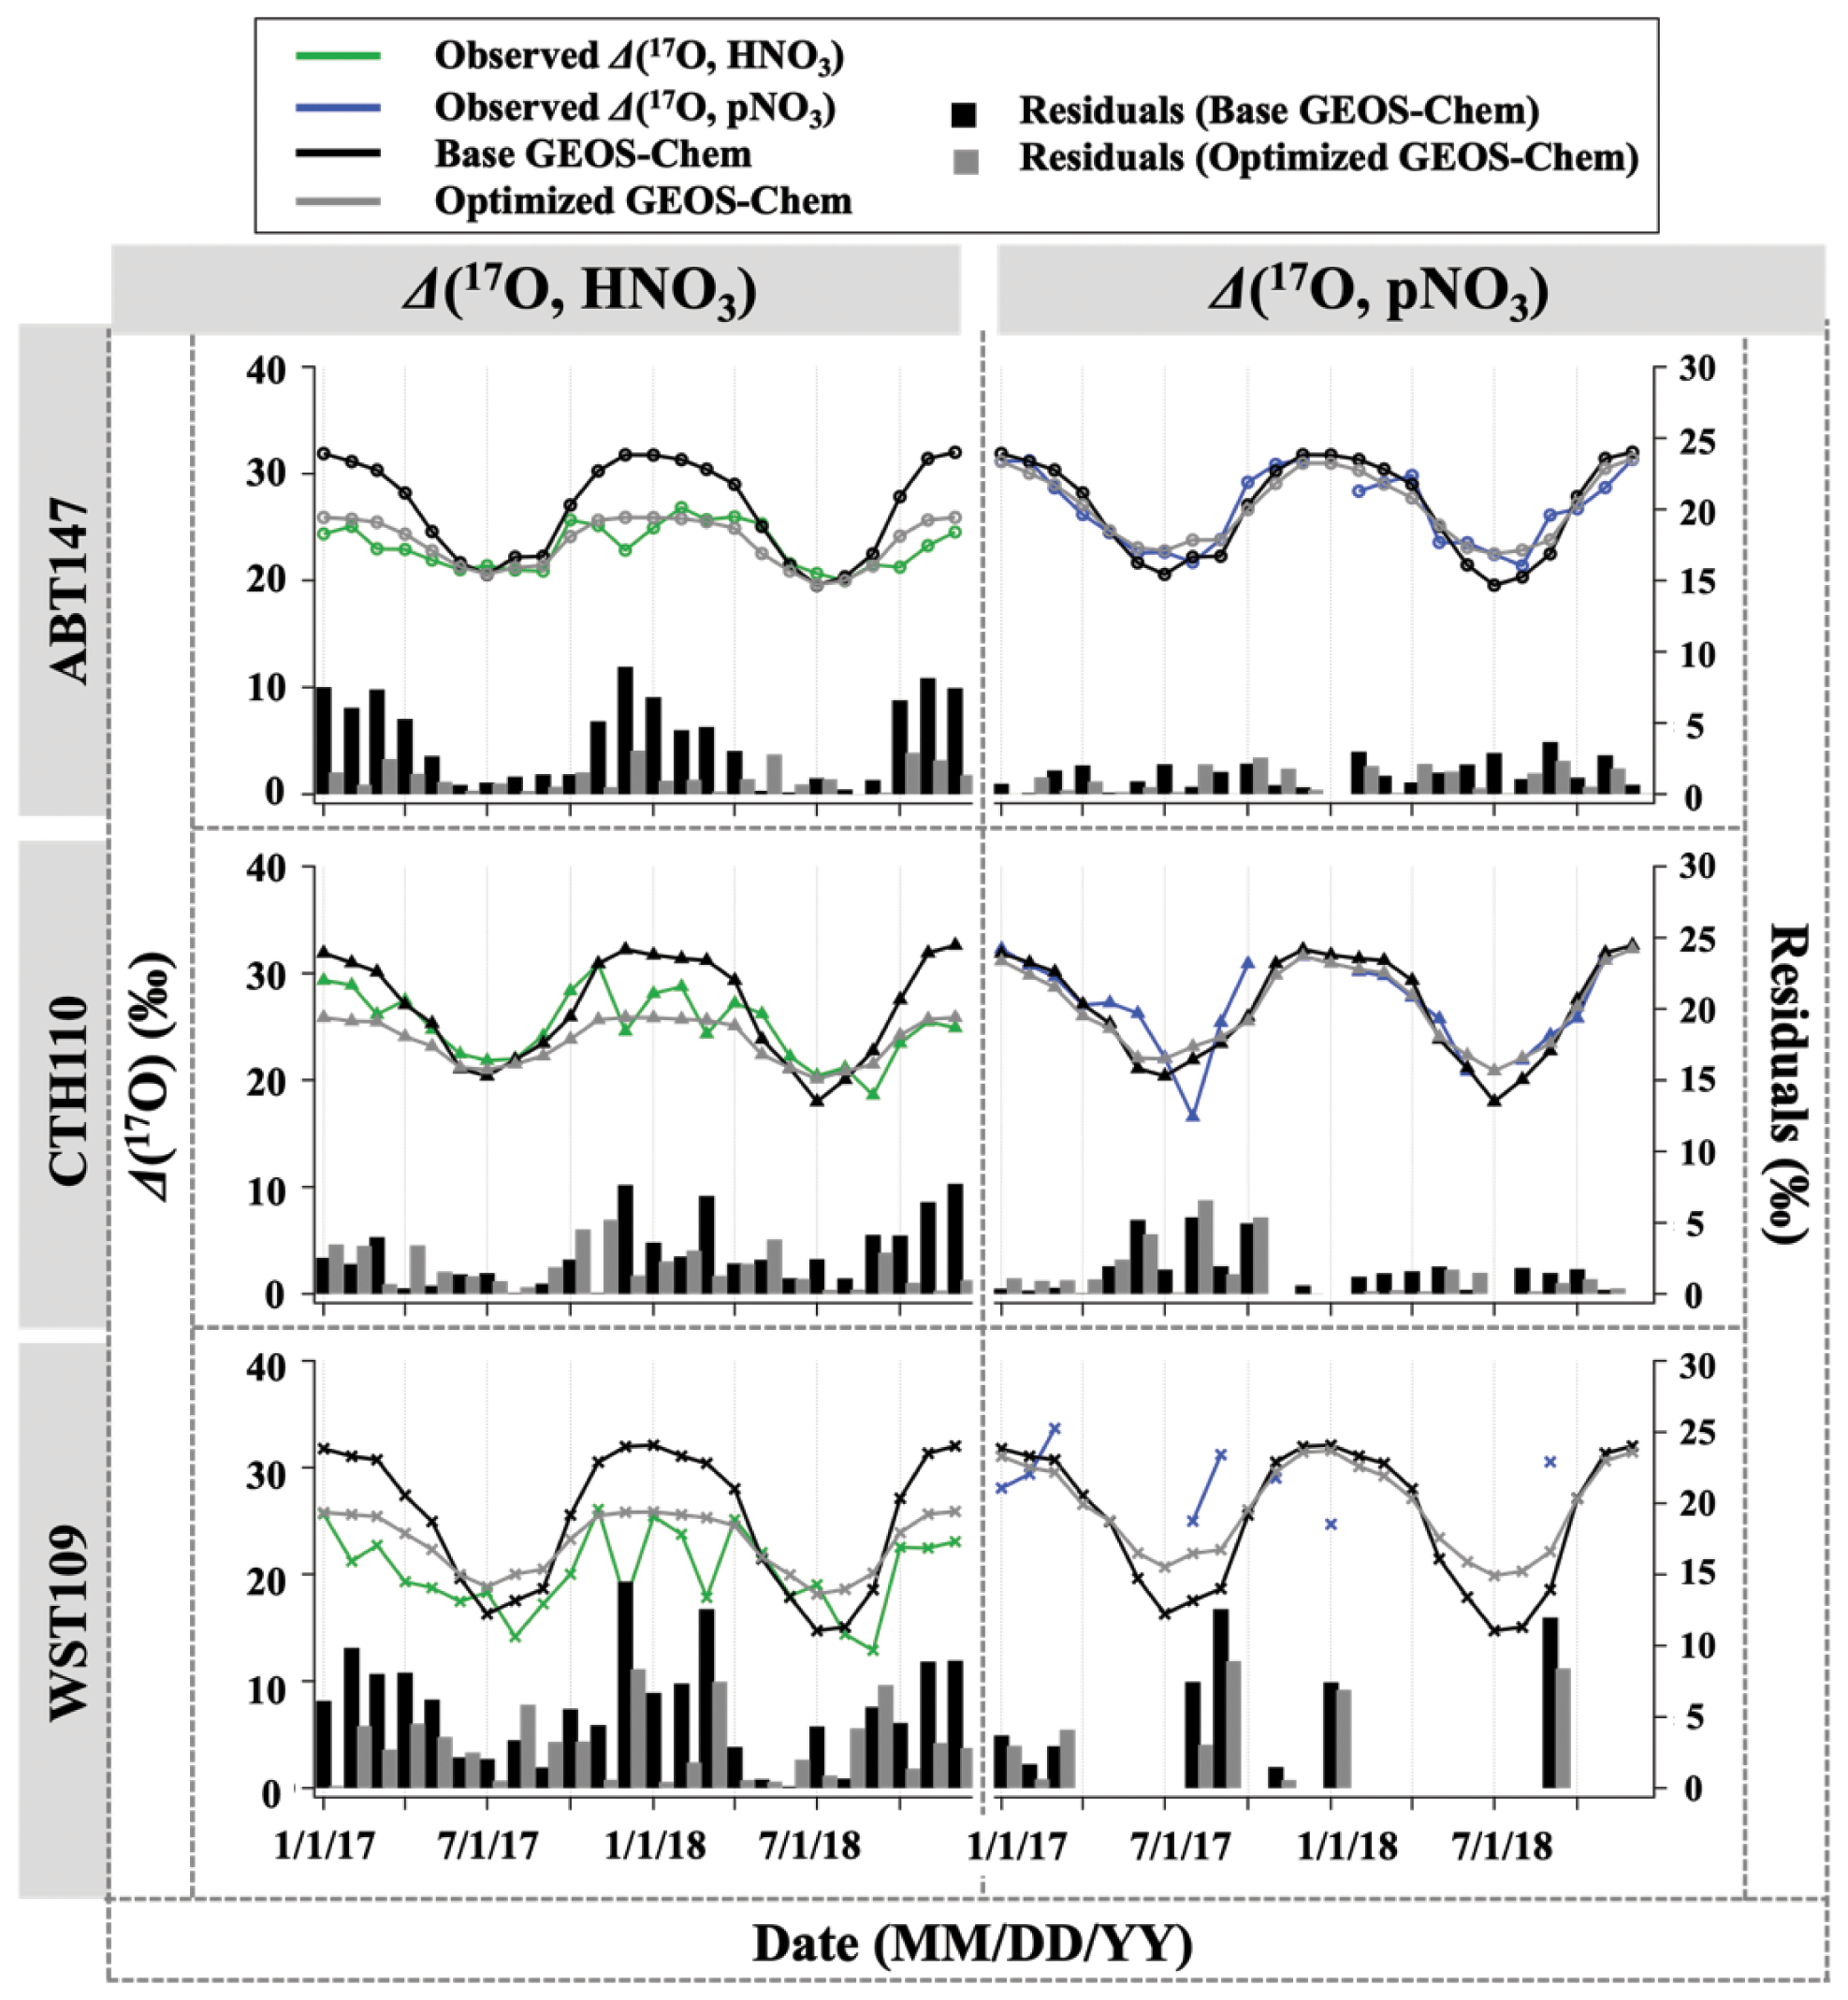
Figure 4Time series of the monthly mean for observed and calculated Δ(17O) for HNO3 and pNO3 over ABT147, CTH110, and WST109 CASTNET sites. Calculated Δ(17O) using base (black) and optimized (gray) GEOS-Chem are shown in the plot together. Bars indicate the residuals between calculation and observation.
Previous studies and modeling results have indicated that the seasonality of oxygen isotopic compositions in HNO3 and pNO3 is driven by a shift in oxidation chemistry (e.g., Hastings et al., 2003; Michalski et al., 2012; Alexander et al., 2009, 2020). Globally, the seasonality reflects a shift in O3 to HOx radical chemistry during winter to summer, respectively. Wintertime has higher NO + O3 branching ratios than summer, which has increased NO + . The high values of δ(18O) and Δ(17O) in HNO3 and pNO3 during the cold season are caused by the increased incorporation of O3 into the nitrate product through N2O5 heterogeneous hydrolysis on aerosols (Figs. 4 and 5). In contrast, the dominance of gas-phase production by the NO2 + OH reaction dilutes the isotopic influence of O3 during warm seasons, leading to the low values of δ(18O) and Δ(17O) in HNO3 and pNO3. Spatial variability is observed in δ(18O) and Δ(17O) of HNO3, with the highest values at CTH110 (δ(18O): (71.5 ± 5.6) ‰ (n=24) and Δ(17O): (25.0 ± 3.1) ‰ (n=23)) followed by ABT147 (δ(18O): (70.1 ± 4.8) ‰ (n=24) and Δ(17O): (23.1 ± 2.2) ‰ (n=24)) and then by WST109 (δ(18O): (62.8 ± 7.7) ‰ (n=24) and Δ(17O): (20.2 ± 3.7) ‰ (n=24)). However, δ(18O) and Δ(17O) of pNO3 were not significantly different across the stations: for ABT147 (δ(18O): (68.6 ± 7.1) ‰ (n=24) and Δ(17O): (26.4 ± 3.6) ‰ (n=22)); CTH110 (δ(18O): (69.1 ± 8.9) ‰ (n=24) and Δ(17O): (26.8 ± 4.1) ‰ (n=19)); and WST109 (δ(18O): (66.8 ± 8.7) ‰ (n=24) and Δ(17O): (29.4 ± 2.9) ‰ (n=10)).
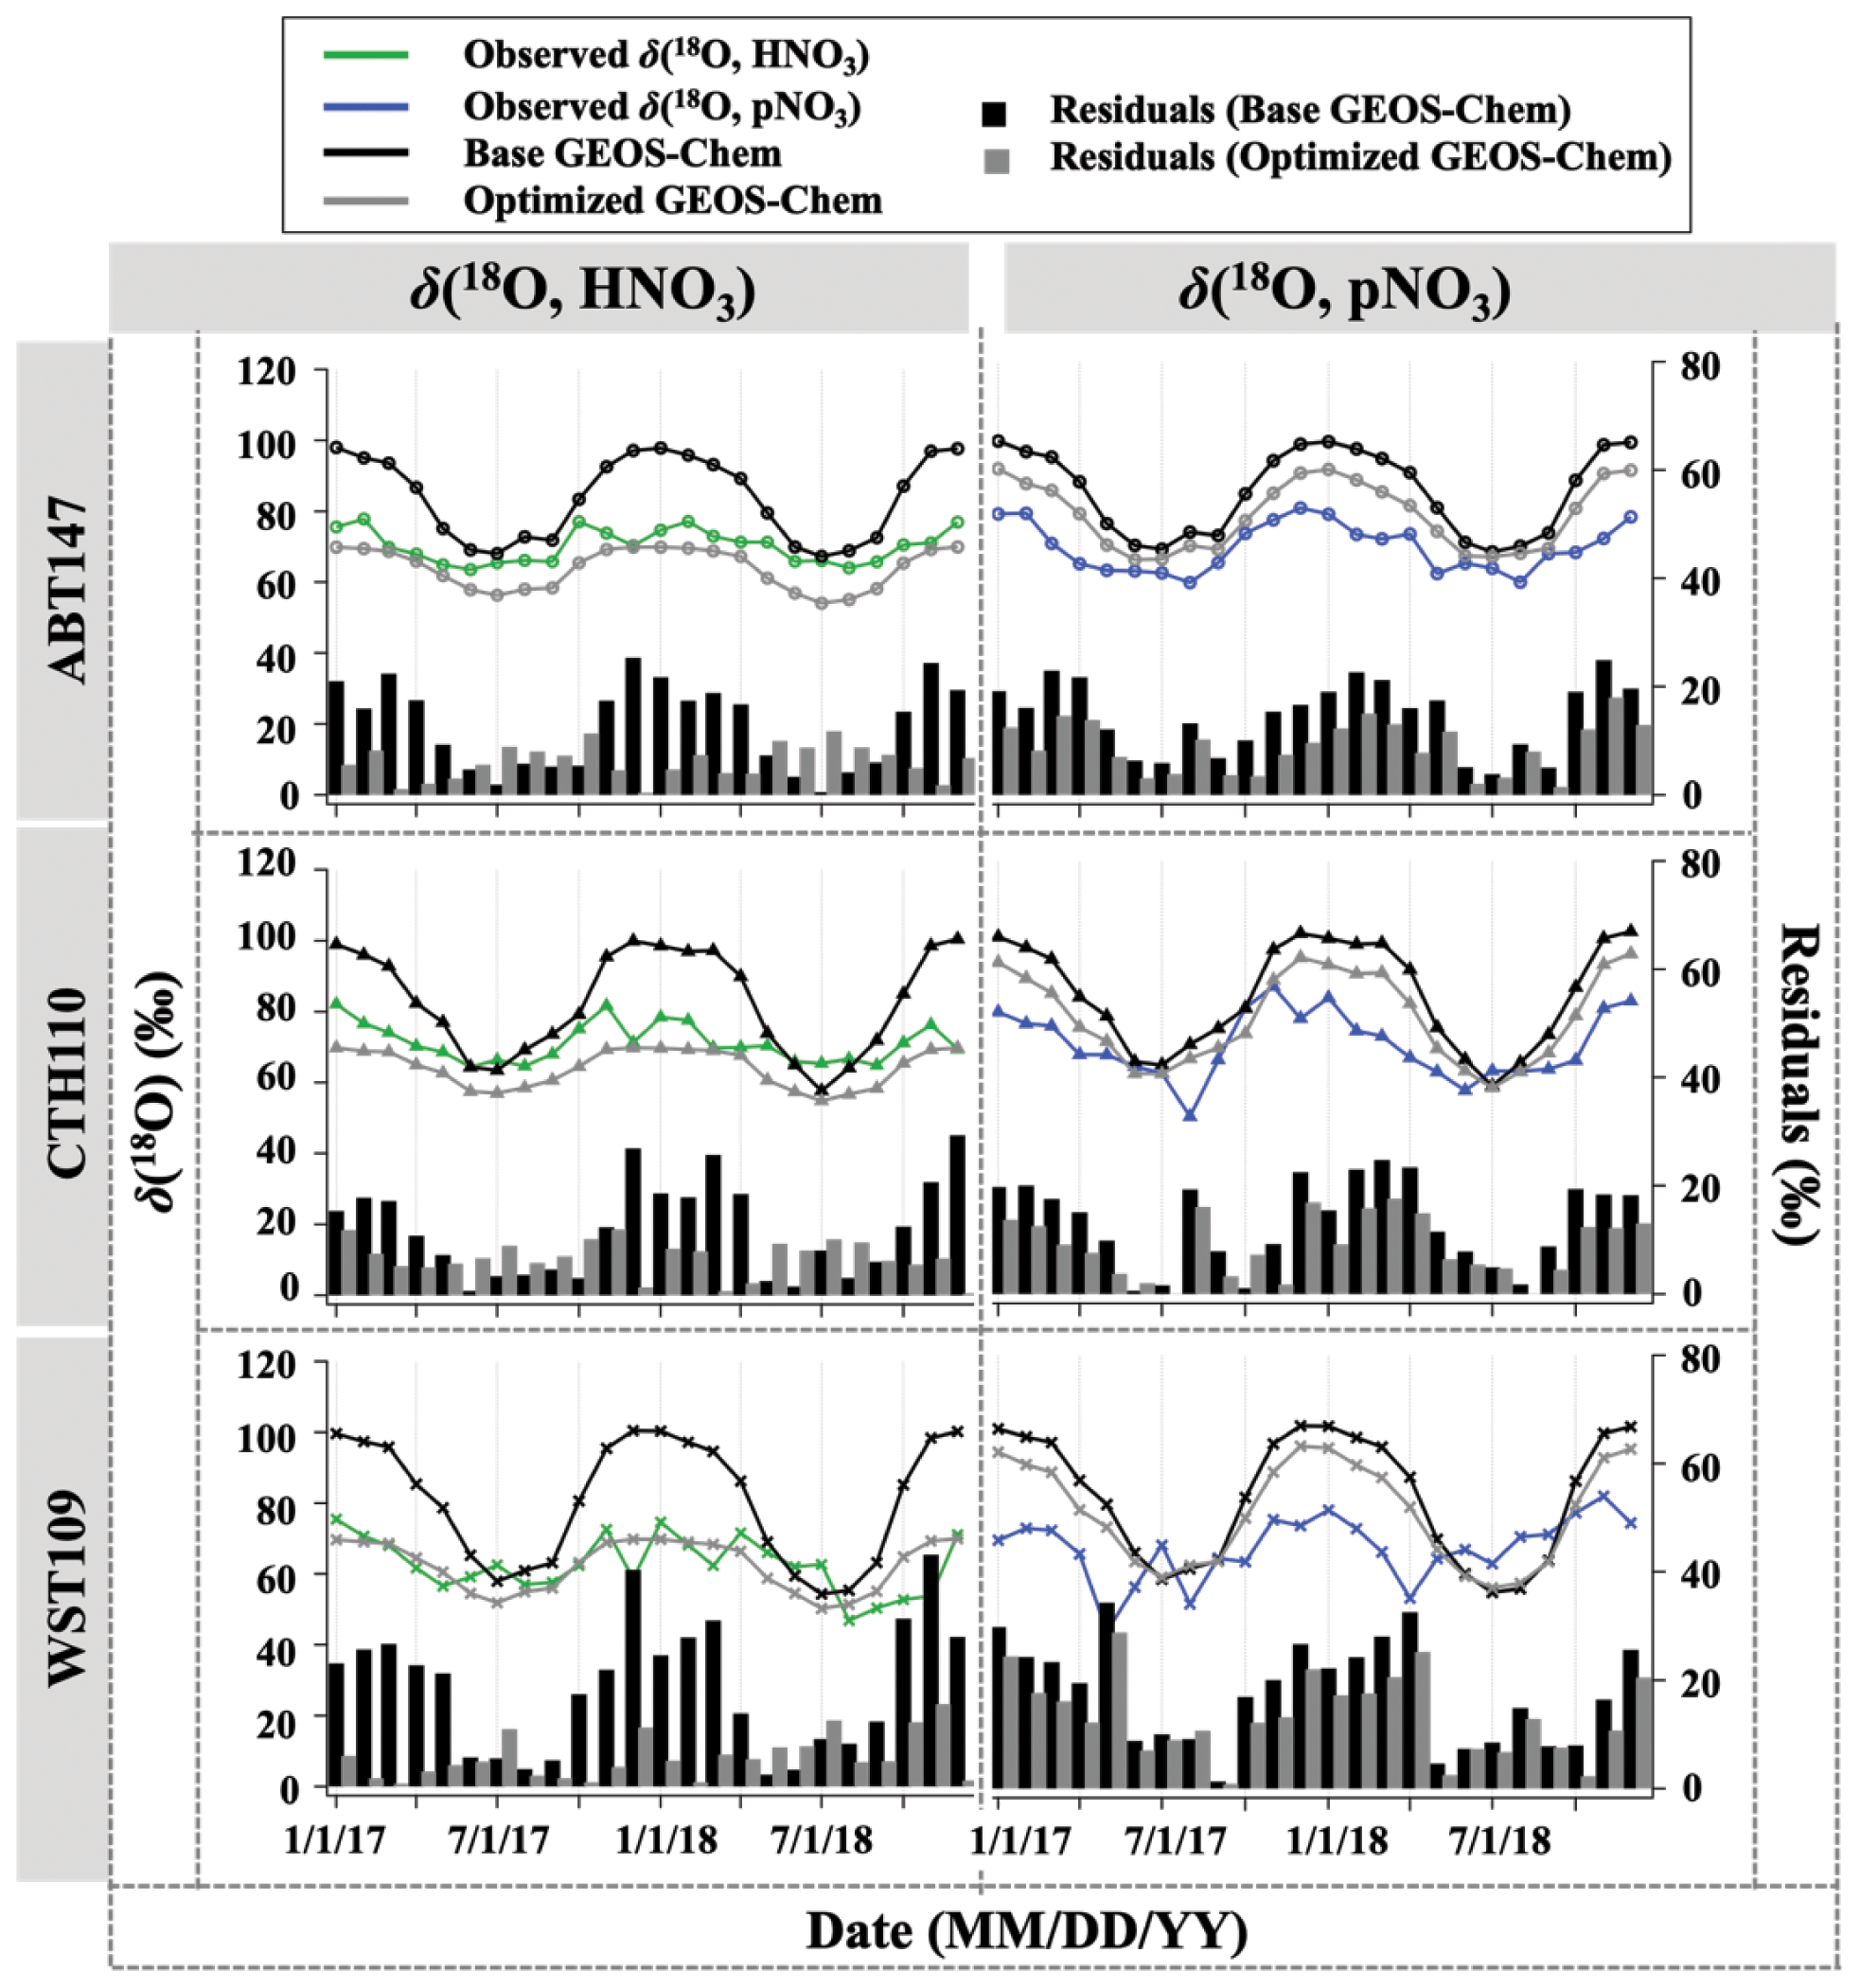
Figure 5Time series of the monthly mean for observed and calculated δ(18O) for HNO3 and pNO3 over ABT147, CTH110, and WST109 CASTNET sites. Calculated δ(18O) using base (black) and optimized (gray) GEOS-Chem are shown in the plot together. Bars indicate the residuals between calculation and observation.
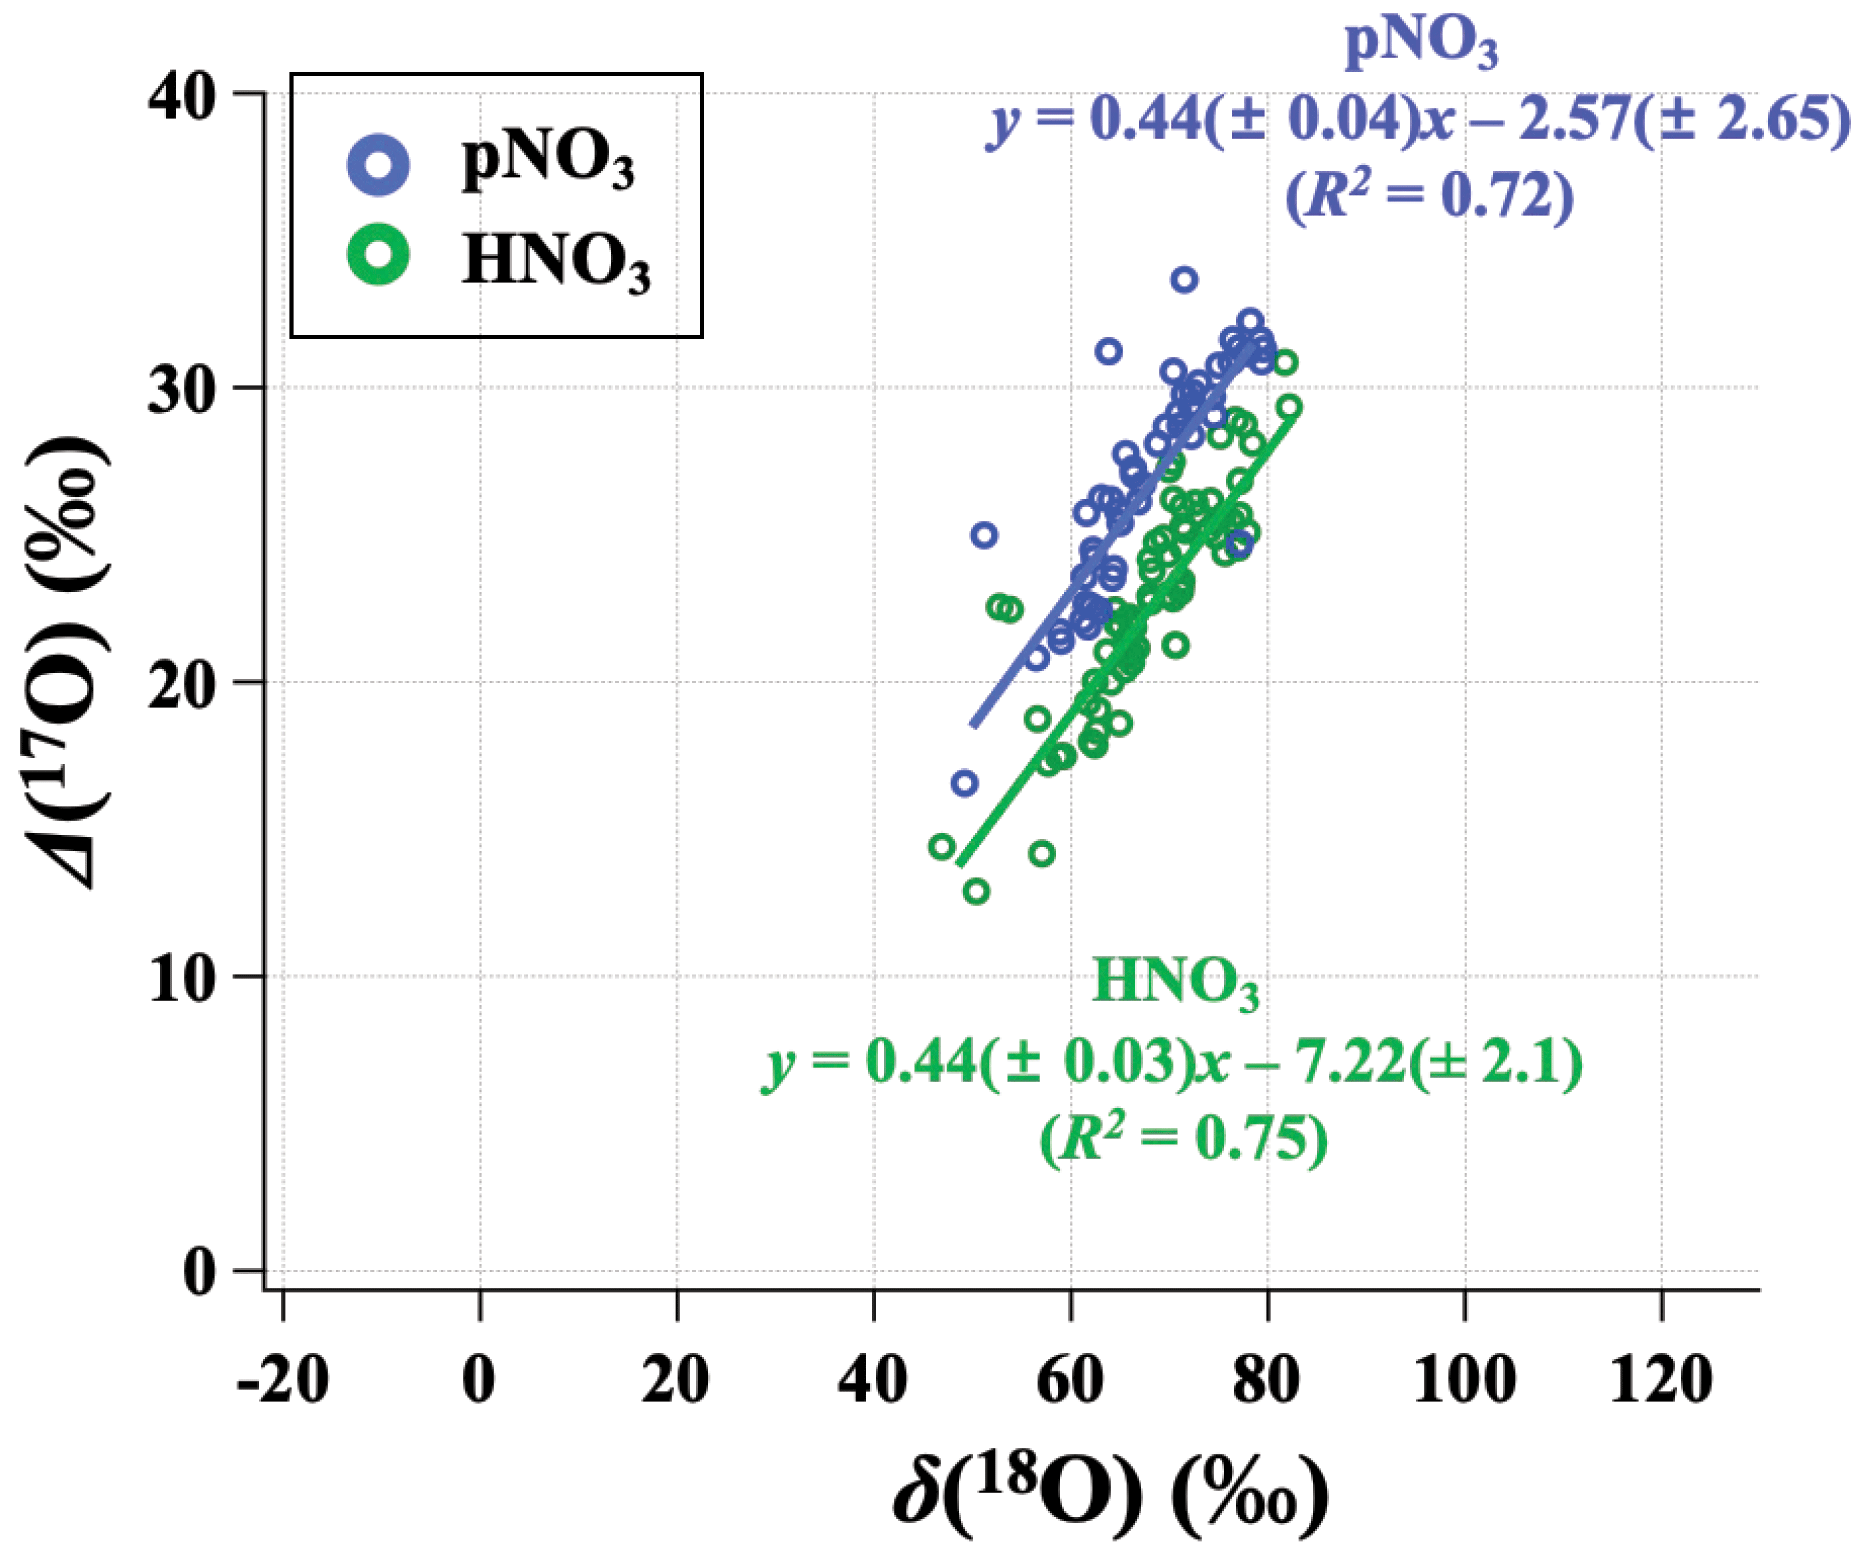
Figure 6Relationship between the monthly mean (δ(18O) and Δ(17O)) for observed HNO3 (green) and pNO3 (blue) across all CASTNET sites, with correlation coefficient (R2) and slope.
Our observations indicate a significant phase-dependent difference in oxidation chemistry between HNO3 and pNO3 that is unexpected (Fig. 6). Many modeled mechanisms of gas- and aqueous-phase chemistry produce HNO3, then HNO3 is partitioned into the aerosol phase based on thermodynamic equilibrium (i.e., NH4NO3(s) ⇌ HNO3(g) + NH3(g)) or coarse uptake. Conventional understanding would expect Δ(17O) of HNO3 and pNO3 to be the same (e.g., Alexander et al., 2020). However, observed Δ(17O, pNO3) tends to be significantly higher than Δ(17O, HNO3) (p<0.01 at ABT and CTH; p=0.088 at WST). The difference between Δ(17O, pNO3) and Δ(17O, HNO3) was larger in the cold season than in the warm season. For example, on average, Δ(17O, pNO3) was (5.1 ± 2.6) ‰ higher than Δ(17O, HNO3) during the cold months, while Δ(17O, pNO3) was (2.7 ± 4.7) ‰ higher than Δ(17O, HNO3) during warm months. This phase difference in Δ(17O) cannot be explained by potential sample biases caused by volatilization, which leads to mass-dependent fractionation. This difference might be related to the differences in particulate nitrate size-dependent production pathways. Previous studies of size-segregated Δ(17O, pNO3) indicated higher values for coarse pNO3 (aerodynamic diameter (Da) > 0.95 µm) relative to fine pNO3 (Da<0.95 µm); this was concluded to reflect the increased importance of heterogeneous N2O5 hydrolysis on coarse particles relative to fine particles (Vicars et al., 2013). The CASTNET pNO3 samples reflect total suspended particles (TSP) such that increased importance of N2O5 heterogeneous chemistry for coarse particulate nitrate formation could explain the higher Δ(17O, pNO3) values we observe relative to Δ(17O, HNO3).
Positive linear relationships between δ(18O) and Δ(17O) were observed for HNO3 and pNO3 across the CASTNET sites, with similar slopes but different oxygen isotopic signatures indicated by different intercepts (Fig. 6). For the relationship of δ(18O) and Δ(17O), the high-end member should result from O3, and the lower-end member depends on the isotopic signature of the atmospheric oxidants involved. The transferable δ(18O) signatures of atmospheric oxidants are not fully understood yet, reflecting a complex combination of atmospheric oxidant source signatures and isotope fractionation during reaction and incorporation into the nitrate end product. While ozone has a notably high Δ(17O) value ((39 ± 2) ‰; Vicars and Savarino, 2014), Δ(17O) values of other atmospheric oxidants such as , H2O, and OH are equal to or close to 0 ‰ (Michalski et al., 2012; Walters et al., 2019). Overall, our results suggest that more O3 is incorporated during the formation of pNO3 than HNO3. We further analyze the oxidation chemistry involved in atmospheric nitrate formation based on output from the GEOS-Chem chemical transport model.
3.3 Quantifying atmospheric nitrate oxidation chemistry using Δ(17O)
Observations of the oxygen isotopic composition were utilized to quantify the relative importance of different nitrate formation pathways and to assess model representation of the chemistry of nitrate formation. Using atmospheric nitrate production rates from the GEOS-Chem model (“base case”), Δ(17O) was calculated within a grid cell corresponding to our CASTNET sites and compared with observed Δ(17O, HNO3, pNO3) at each site (Fig. 4). We note that the previous Δ(17O) GEOS-Chem framework tags NO2 and HNO3 production and assumes that pNO3 production is similar to HNO3 production due to thermodynamic equilibrium. Thus, we compared the simulated Δ(17O, HNO3) from GEOS-Chem to our Δ(17O, HNO3) and Δ(17O, pNO3) observations. The averaged residuals over the collection period for each site were 3.9 ‰, 2.8 ‰, and 5.6 ‰ for Δ(17O, HNO3) and 1.5 ‰, 1.7 ‰, and 6.1 ‰ for Δ(17O, pNO3) at ABT147, CTH110, and WST109, respectively (Fig. 4). Calculated Δ(17O) based on GEOS-Chem output reproduced the observed temporal variations well (Fig. 4), although the model better captured the lower observed Δ(17O) during warmer months versus the higher values observed in the cooler months (Table 2). The GEOS-Chem model also does not capture observed spatial Δ(17O) variabilities. For instance, higher Δ(17O) values (especially for HNO3) were observed at CTH110 compared to at WST109, while no significant spatial Δ(17O) differences were predicted from GEOS-Chem. The model prediction was sensitive to the type of nitrate; the calculated Δ(17O) showed a better agreement with observed Δ(17O) of pNO3 (R2=0.48)) than Δ(17O) of HNO at all CASTNET sites ( % and 15 %, respectively; Fig. 7).
Table 2Summary of the residuals between observed and calculated oxygen isotope deltas by season using the base and optimized GEOS-Chem, respectively.
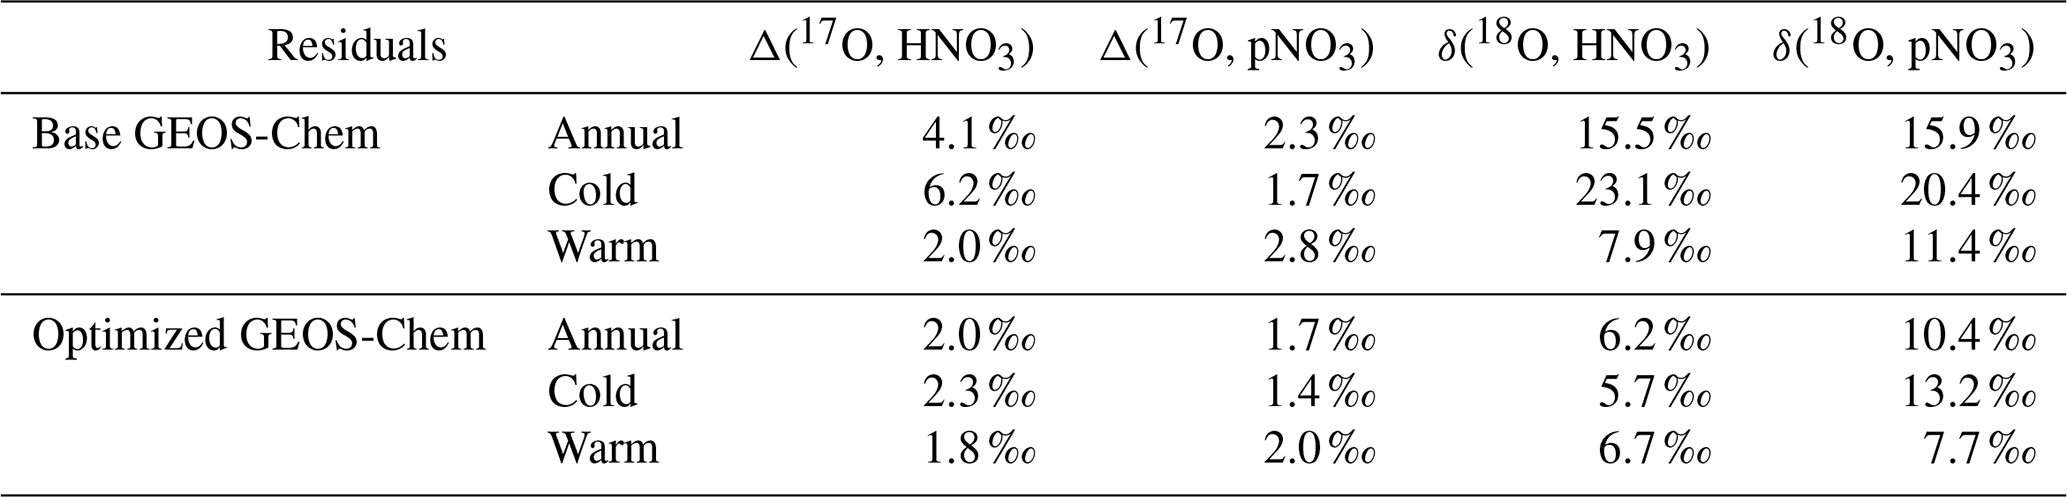
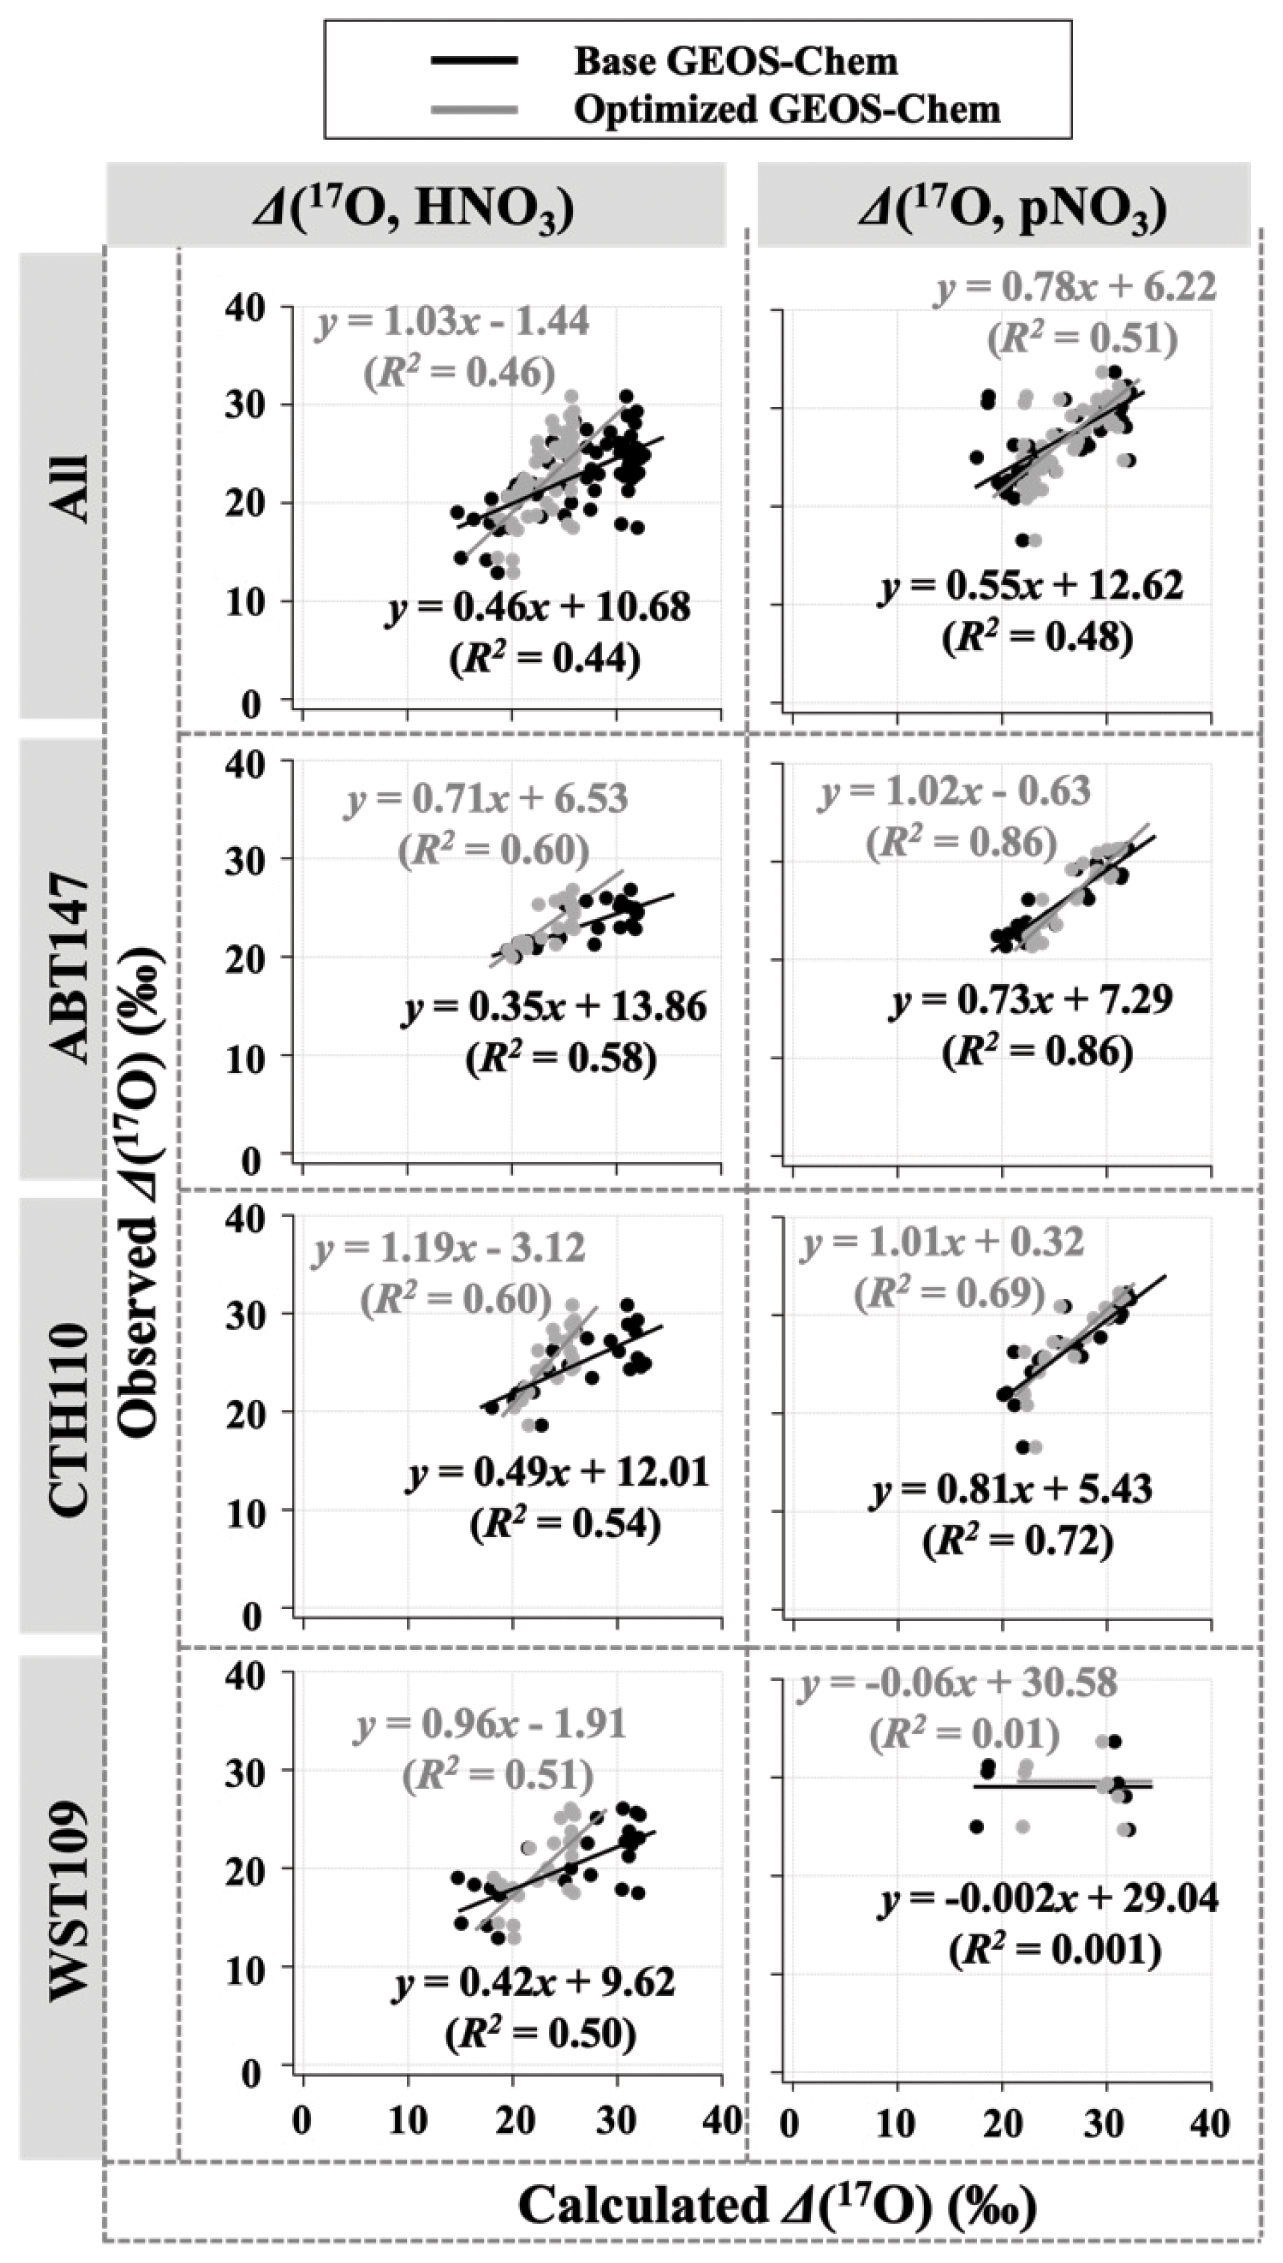
Figure 7Correlation between observed and calculated Δ(17O) for HNO3 and pNO3 using base GEOS-Chem (black) and optimized GEOS-Chem (gray) for each site.
Several studies have used Δ(17O) to quantify and/or constrain modeled chemical mechanisms. Here, GEOS-Chem nitrate production rates and thus calculated Δ(17O) were optimized to find the lowest residual sum of squares between the calculated and observed Δ(17O). This optimization algorithm constrains the relative rates of nitrate formation pathways simulated by GEOS-Chem. Additionally, the optimization was conducted for HNO3 and pNO3 separately. Calculated Δ(17O) from the base GEOS-Chem model was generally 1.15 times higher than observed Δ(17O, HNO3) and 0.98 times lower than Δ(17O, pNO3) across all CASTNET sites. After optimization, the residuals between observed and calculated Δ(17O) dramatically decreased (Fig. 4), especially in the cold season (Table 2). Moreover, the linear relationships had slopes much closer to the 1:1 line (i.e., from 0.46 to 1.03 for HNO3 and from 0.55 to 0.78 for pNO3; Fig. 7) than the base GEOS-Chem model across the three CASTNET sites (the relationships for each site before and after optimization are shown in Fig. 7). On a subannual basis, the Δ(17O) comparison for the cold season showed better improvement than the warm season, especially for Δ(17O, HNO3).
The dominant annual pathway for nitrate formation in the GEOS-Chem model (“base case”) was N2O5 hydrolysis, which accounts for 50 % (Fig. 8), followed by NO2 + OH (31 %) and RONO2 hydrolysis (13 %) across all CASTNET sites. Nitrate production via the reaction of XNO3 hydrolysis and NO3 + HC was small (< 1 %) at all sites. Strong seasonality in nitrate production was observed, as expected, with high portions of N2O5 hydrolysis in winter and NO2 + OH in summer (Fig. 8).
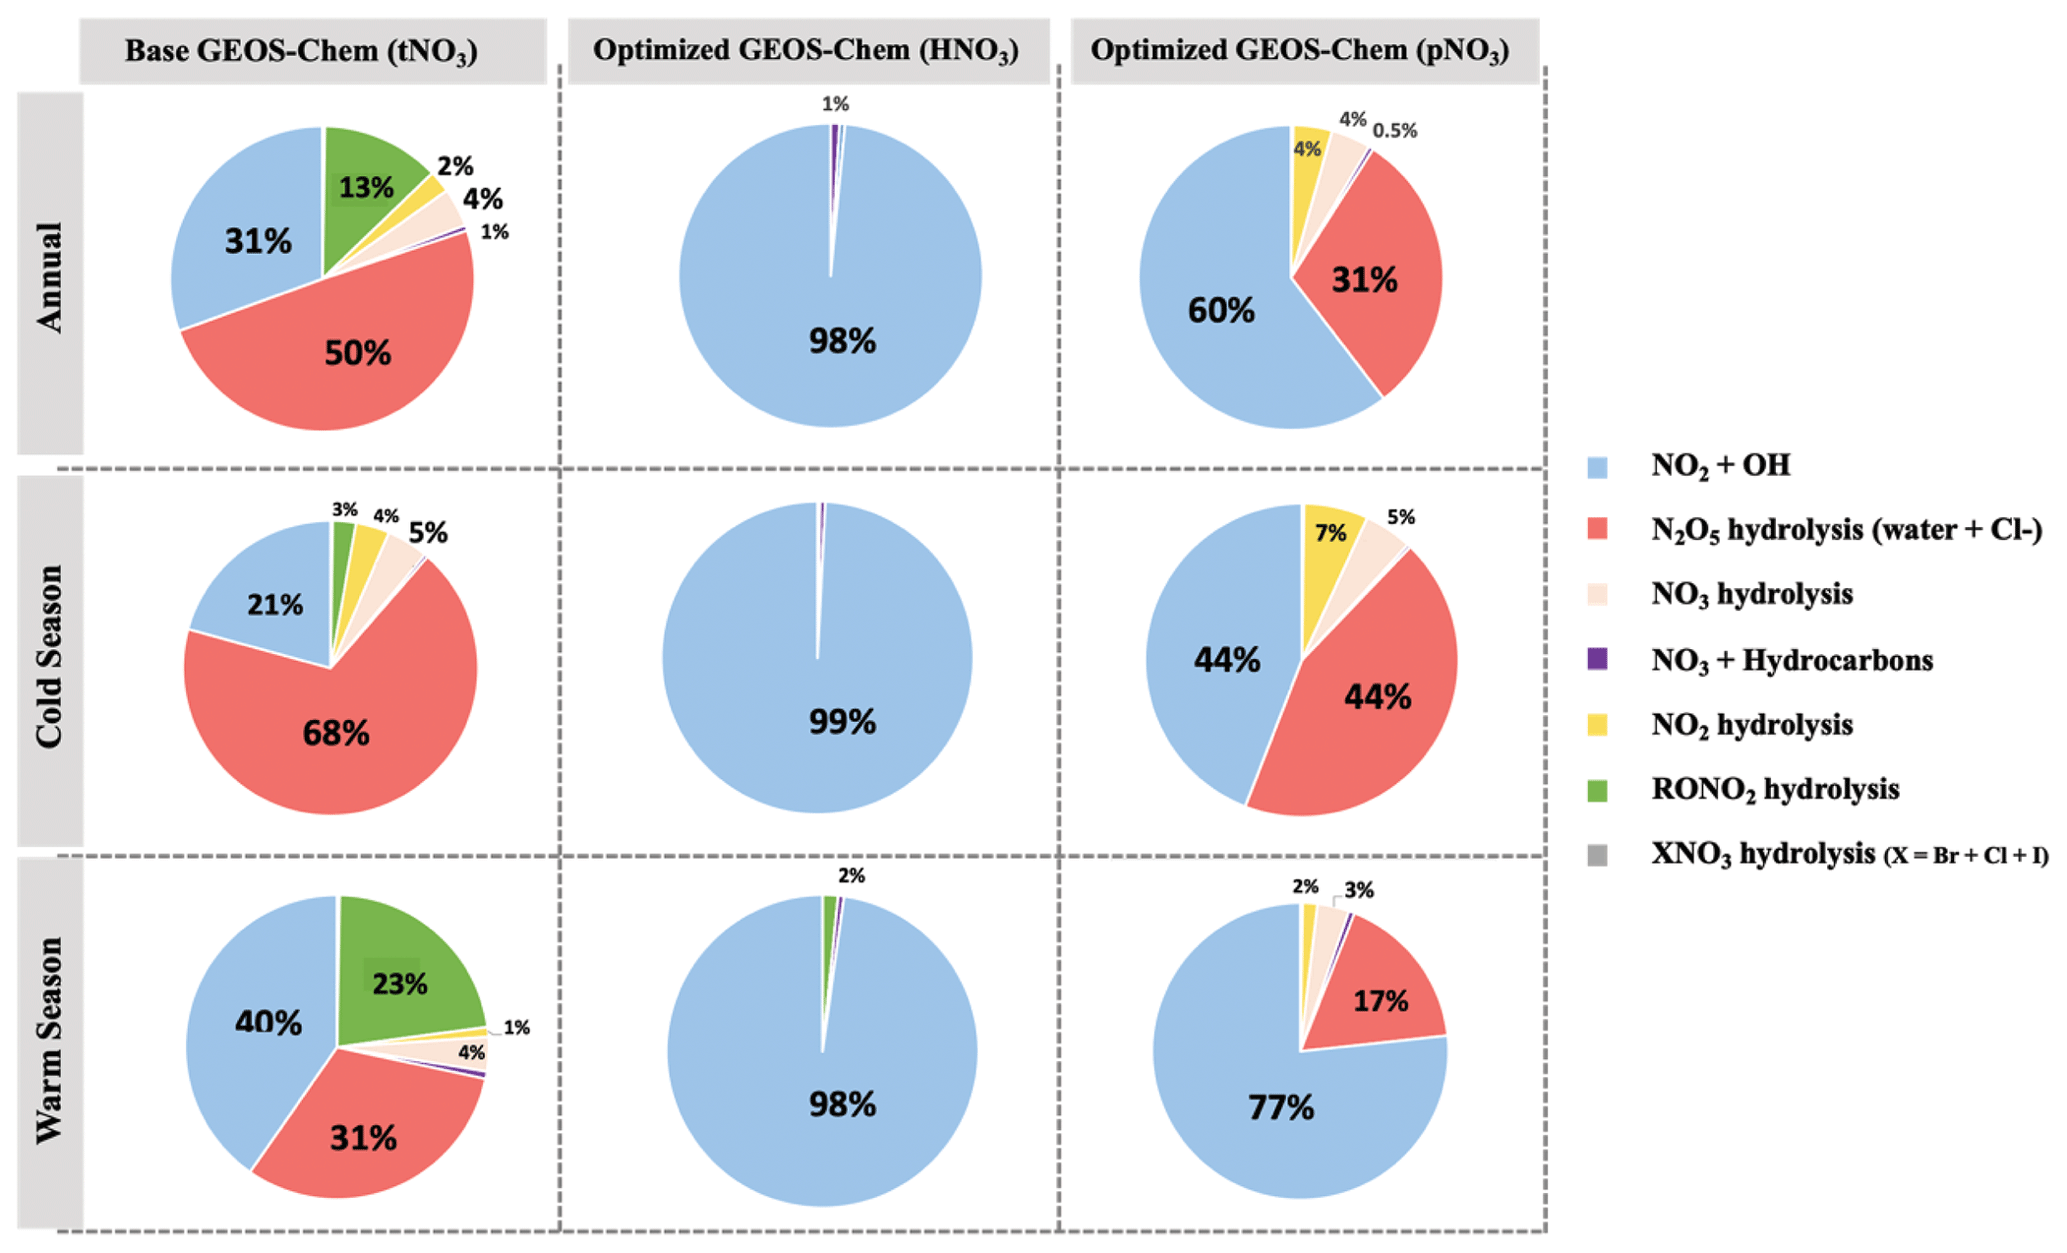
Figure 8Relative proportions for major nitrate production pathways by season from base GEOS-Chem output (HNO3 + pNO3), optimized GEOS-Chem for HNO3 production only, and optimized GEOS-Chem for pNO3 production only based on comparison with observations across the three CASTNET sites. Annual refers to the full 2-year record (December 2016–December 2018). The cold and warm seasons refer to October–March and April–September, respectively.
After optimization, the dominant pathway for nitrate formation in GEOS-Chem changed compared to the base case. For Δ(17O, pNO3), NO2 + OH (60 %) was the dominant pathway for nitrate formation in the optimized GEOS-Chem calculation, followed by N2O5 hydrolysis (31 %) and NO3 hydrolysis (4 %; Fig. 8). At the same time, Δ(17O, HNO3) was almost entirely driven by NO2 + OH reaction (98 %) in the optimized GEOS-Chem case (Fig. 8). The optimized GEOS-Chem calculations suggest that the fraction of nitrate produced by N2O5 hydrolysis was significantly overestimated in the GEOS-Chem base case. In the base case, N2O5 hydrolysis dominated nitrate production, especially in the cold season, with a fraction of over 68 % at all CASTNET sites (Fig. 8). This may also partly explain major nitrate concentration overestimates, particularly in the cold season.
3.4 Modeling δ(18O) of atmospheric nitrate
The GEOS-Chem model δ(18O) was also calculated in the same manner as Δ(17O) (Fig. 5). Unlike the calculated Δ(17O), calculated δ(18O) showed remarkably positive biases compared with measured δ(18O) of HNO3 (B=22 %) and pNO3 (B=21 %). The averaged residuals for δ(18O, HNO3) at each site were 13.9 ‰, 12.9 ‰, and 19.6 ‰, and for δ(18O, pNO3) they were 15.4 ‰, 14.2 ‰, and 18.2 ‰ at ABT147, CTH110, and WST109, respectively (Fig. 5, Table 2). Modeling the δ(18O) values of nitrate is more challenging than for Δ(17O) because not all oxidant δ(18O) values have been directly observed, and fractionation factors associated with the O transfer into NOy products are unknown. Uncertainty in δ(18O) values could be a major factor causing disagreement between observed and calculated δ(18O). Additionally, uncertainties in the gas-phase and aerosol scheme related to tNO3 production in GEOS-Chem could account for the discrepancy. Still, as with Δ(17O), the calculated δ(18O) showed far more disagreement with observations during cooler months than during warmer months (Table 2).
Newly optimized nitrate production in GEOS-Chem was also applied to δ(18O) calculation and compared with previous results. As with Δ(17O), a slope of the regression line between (optimized) calculated and observed δ(18O) became closer to 1 (i.e., from 0.30 to 0.74 for HNO3 and from 0.39 to 0.49 for pNO3; Fig. 9), and residuals improved at each site after the optimization (Fig. 5). Overall, the optimized GEOS-Chem δ(18O) calculation showed better agreement than the base GEOS-Chem model ( % for δ(18O, HNO3), and B=13 % for δ(18O, pNO3)). The most significant improvement, as shown by the residuals, is during the cold season.
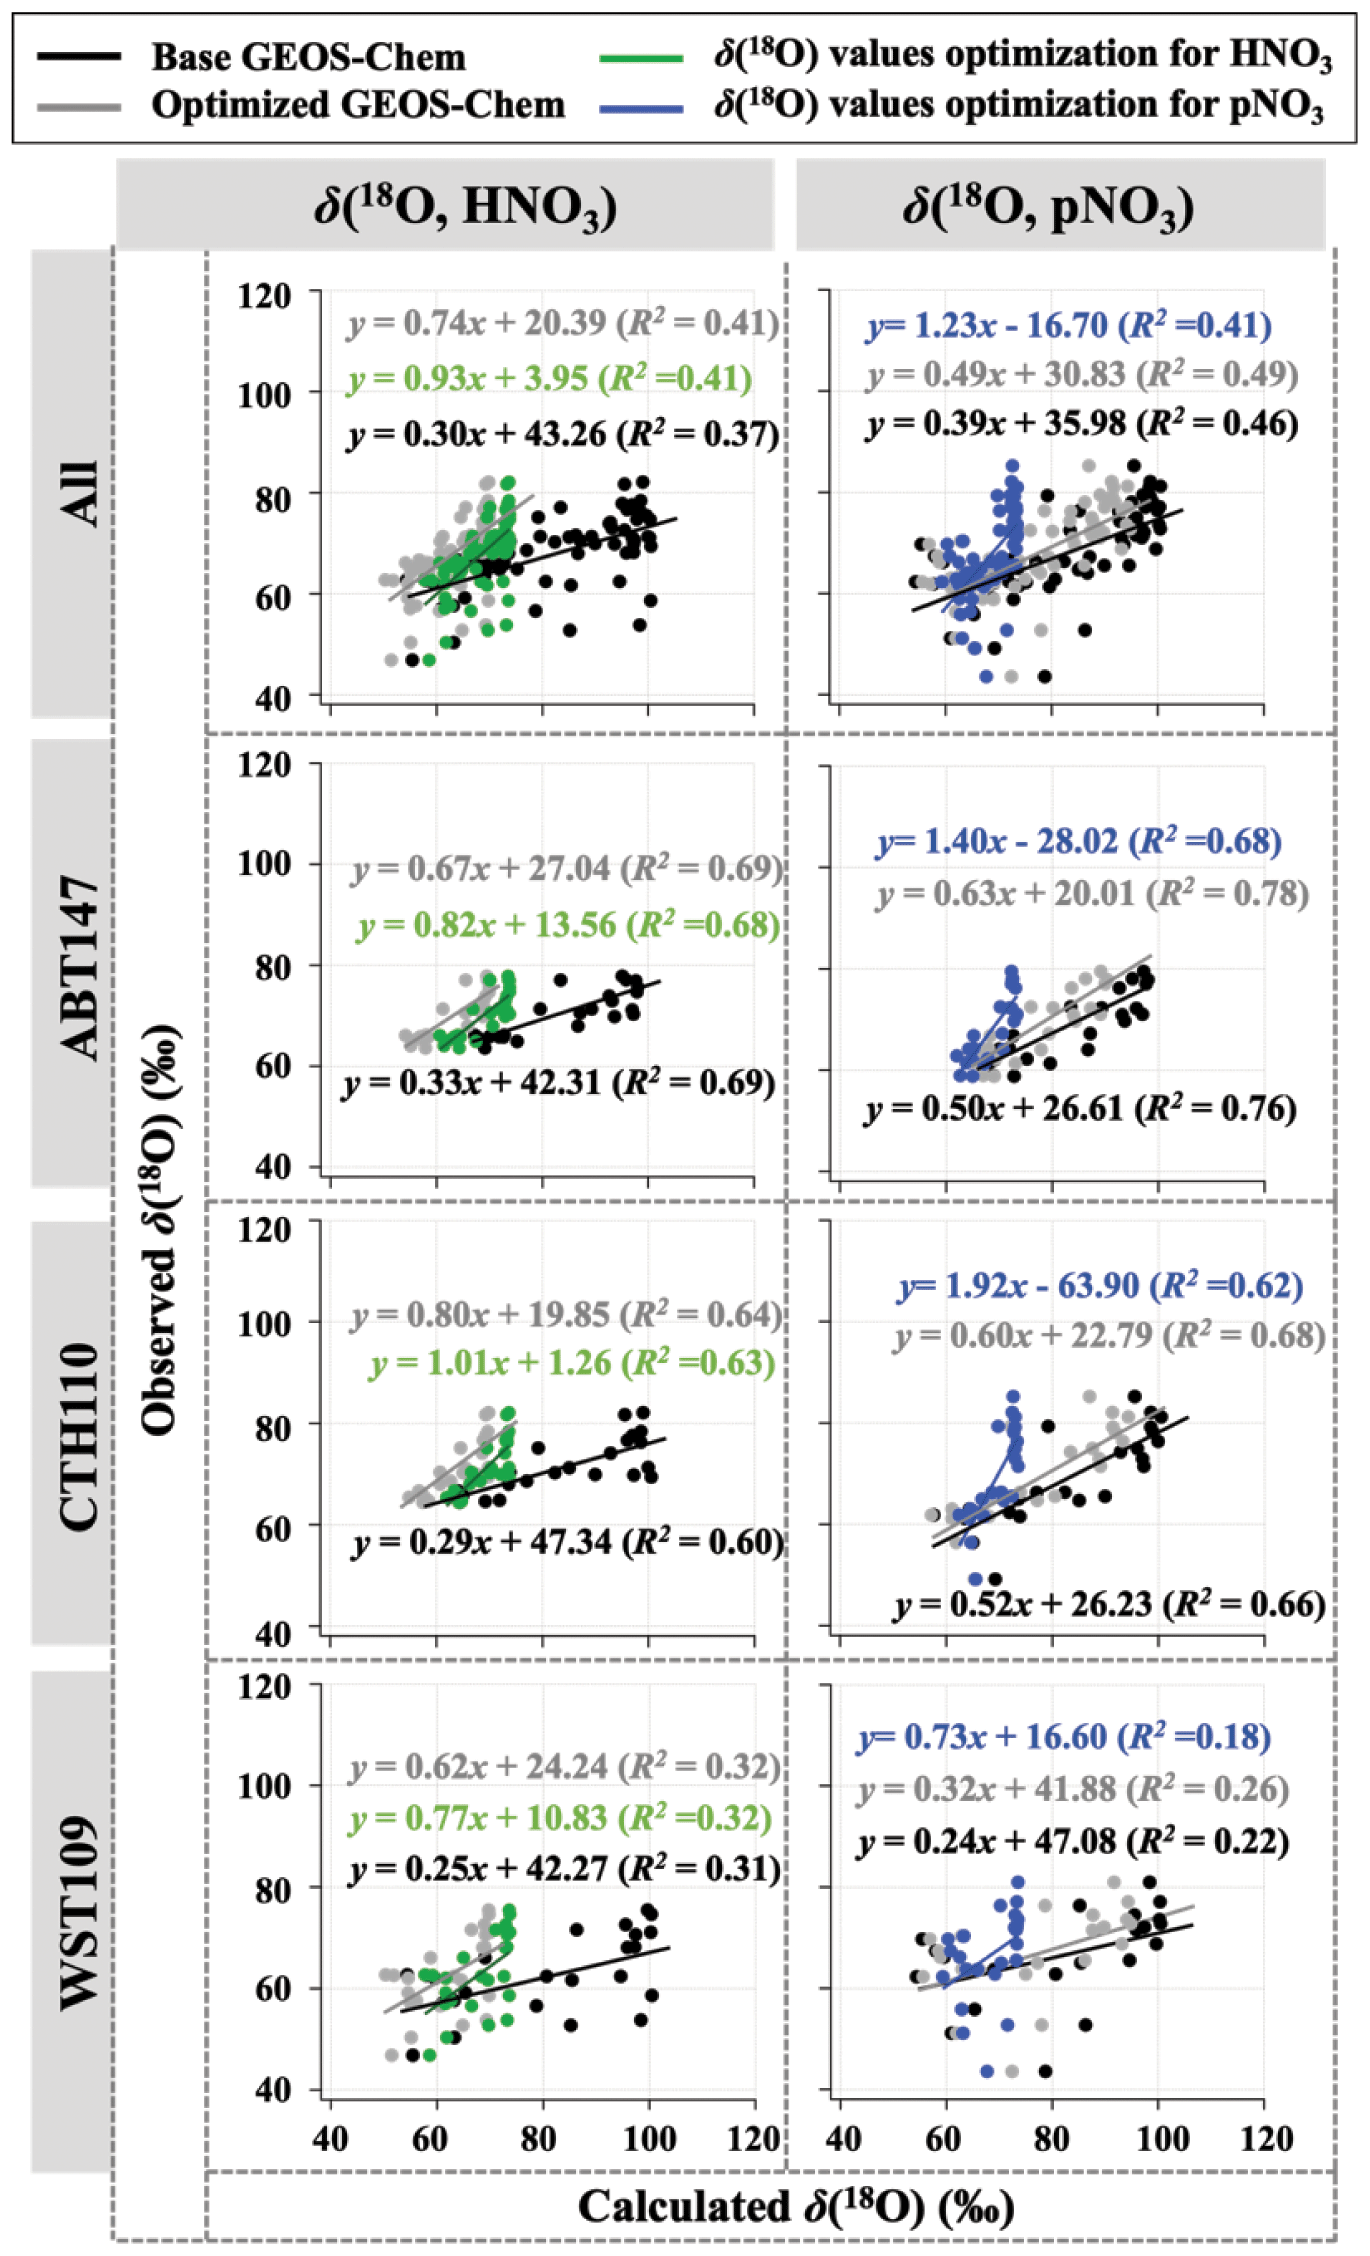
Figure 9Correlation between observed and calculated δ(18O) for HNO3 and pNO3 by each site. Calculated δ(18O) values using base GEOS-Chem, optimized GEOS-Chem, and optimized δ(18O) values indicated as black, gray, and green (for HNO3) or blue (for pNO3), respectively.
3.5 δ(18O) optimization of atmospheric oxidants
After optimization of relative nitrate production rates in GEOS-Chem based on Δ(17O), we applied the optimized chemical production to calculate δ(18O) but still observed discrepancy between observed and predicted δ(18O). The discrepancy could be related to variable and somewhat unconstrained δ(18O) values of atmospheric oxidants important for nitrate formation. To test this, the assumed (literature) δ(18O) values of oxidants were optimized by selecting the best linear fit between the observations and calculated δ(18O, HNO3, pNO3) (Fig. 10). After optimization for δ(18O) of oxidants, the discrepancy between observation and calculation was dramatically reduced (Fig. 9), with a decrease in B from 21 % to 1 %. The optimization predicted δ(18O) of H2O values similar to what was expected (−6.5 ‰ vs. −6.0 ‰); however, different values were predicted for δ(18O) of O2, OH, and O3 (Table 3). A typical mid-latitude value (−6 ‰) of δ(18O, H2O) was selected in this study. We note that the δ(18O, H2O) will vary seasonally; however, the calculated δ(18O) value of nitrate was insensitive to this value because of the relatively minor contribution of H2O to O atoms of atmospheric nitrate. For δ(18O) of O2, OH, and O3, it is possible that this reflects isotope effects associated with the incorporation of these oxidants during nitrate production rather than further issues with model chemistry, since the relative production rates here are constrained based on Δ(17O). The δ(18O, O2) was the best fit with calculated δ(18O) of nitrate values when assuming a value of 11.1 ‰ (vs. the well-known 23 ‰). Since atmospheric O2 is incorporated into nitrate via NO oxidation by HO2 and RO2 radicals, it was assumed that the δ(18O) value of RO2 and HO2 is equal to O2, such that this does not consider any potential isotope effects associated with HO2 and RO2 formation and reaction with NO. The optimized value of 11 ‰ reflects the O atom derived from reactions incorporated into NO2. Thus, our optimized value might suggest that singly substituted with 18O (e.g., R18O16O, H18O16O) reacts slower than the 16O isotopologues (e.g., R16O2 or H16O2).
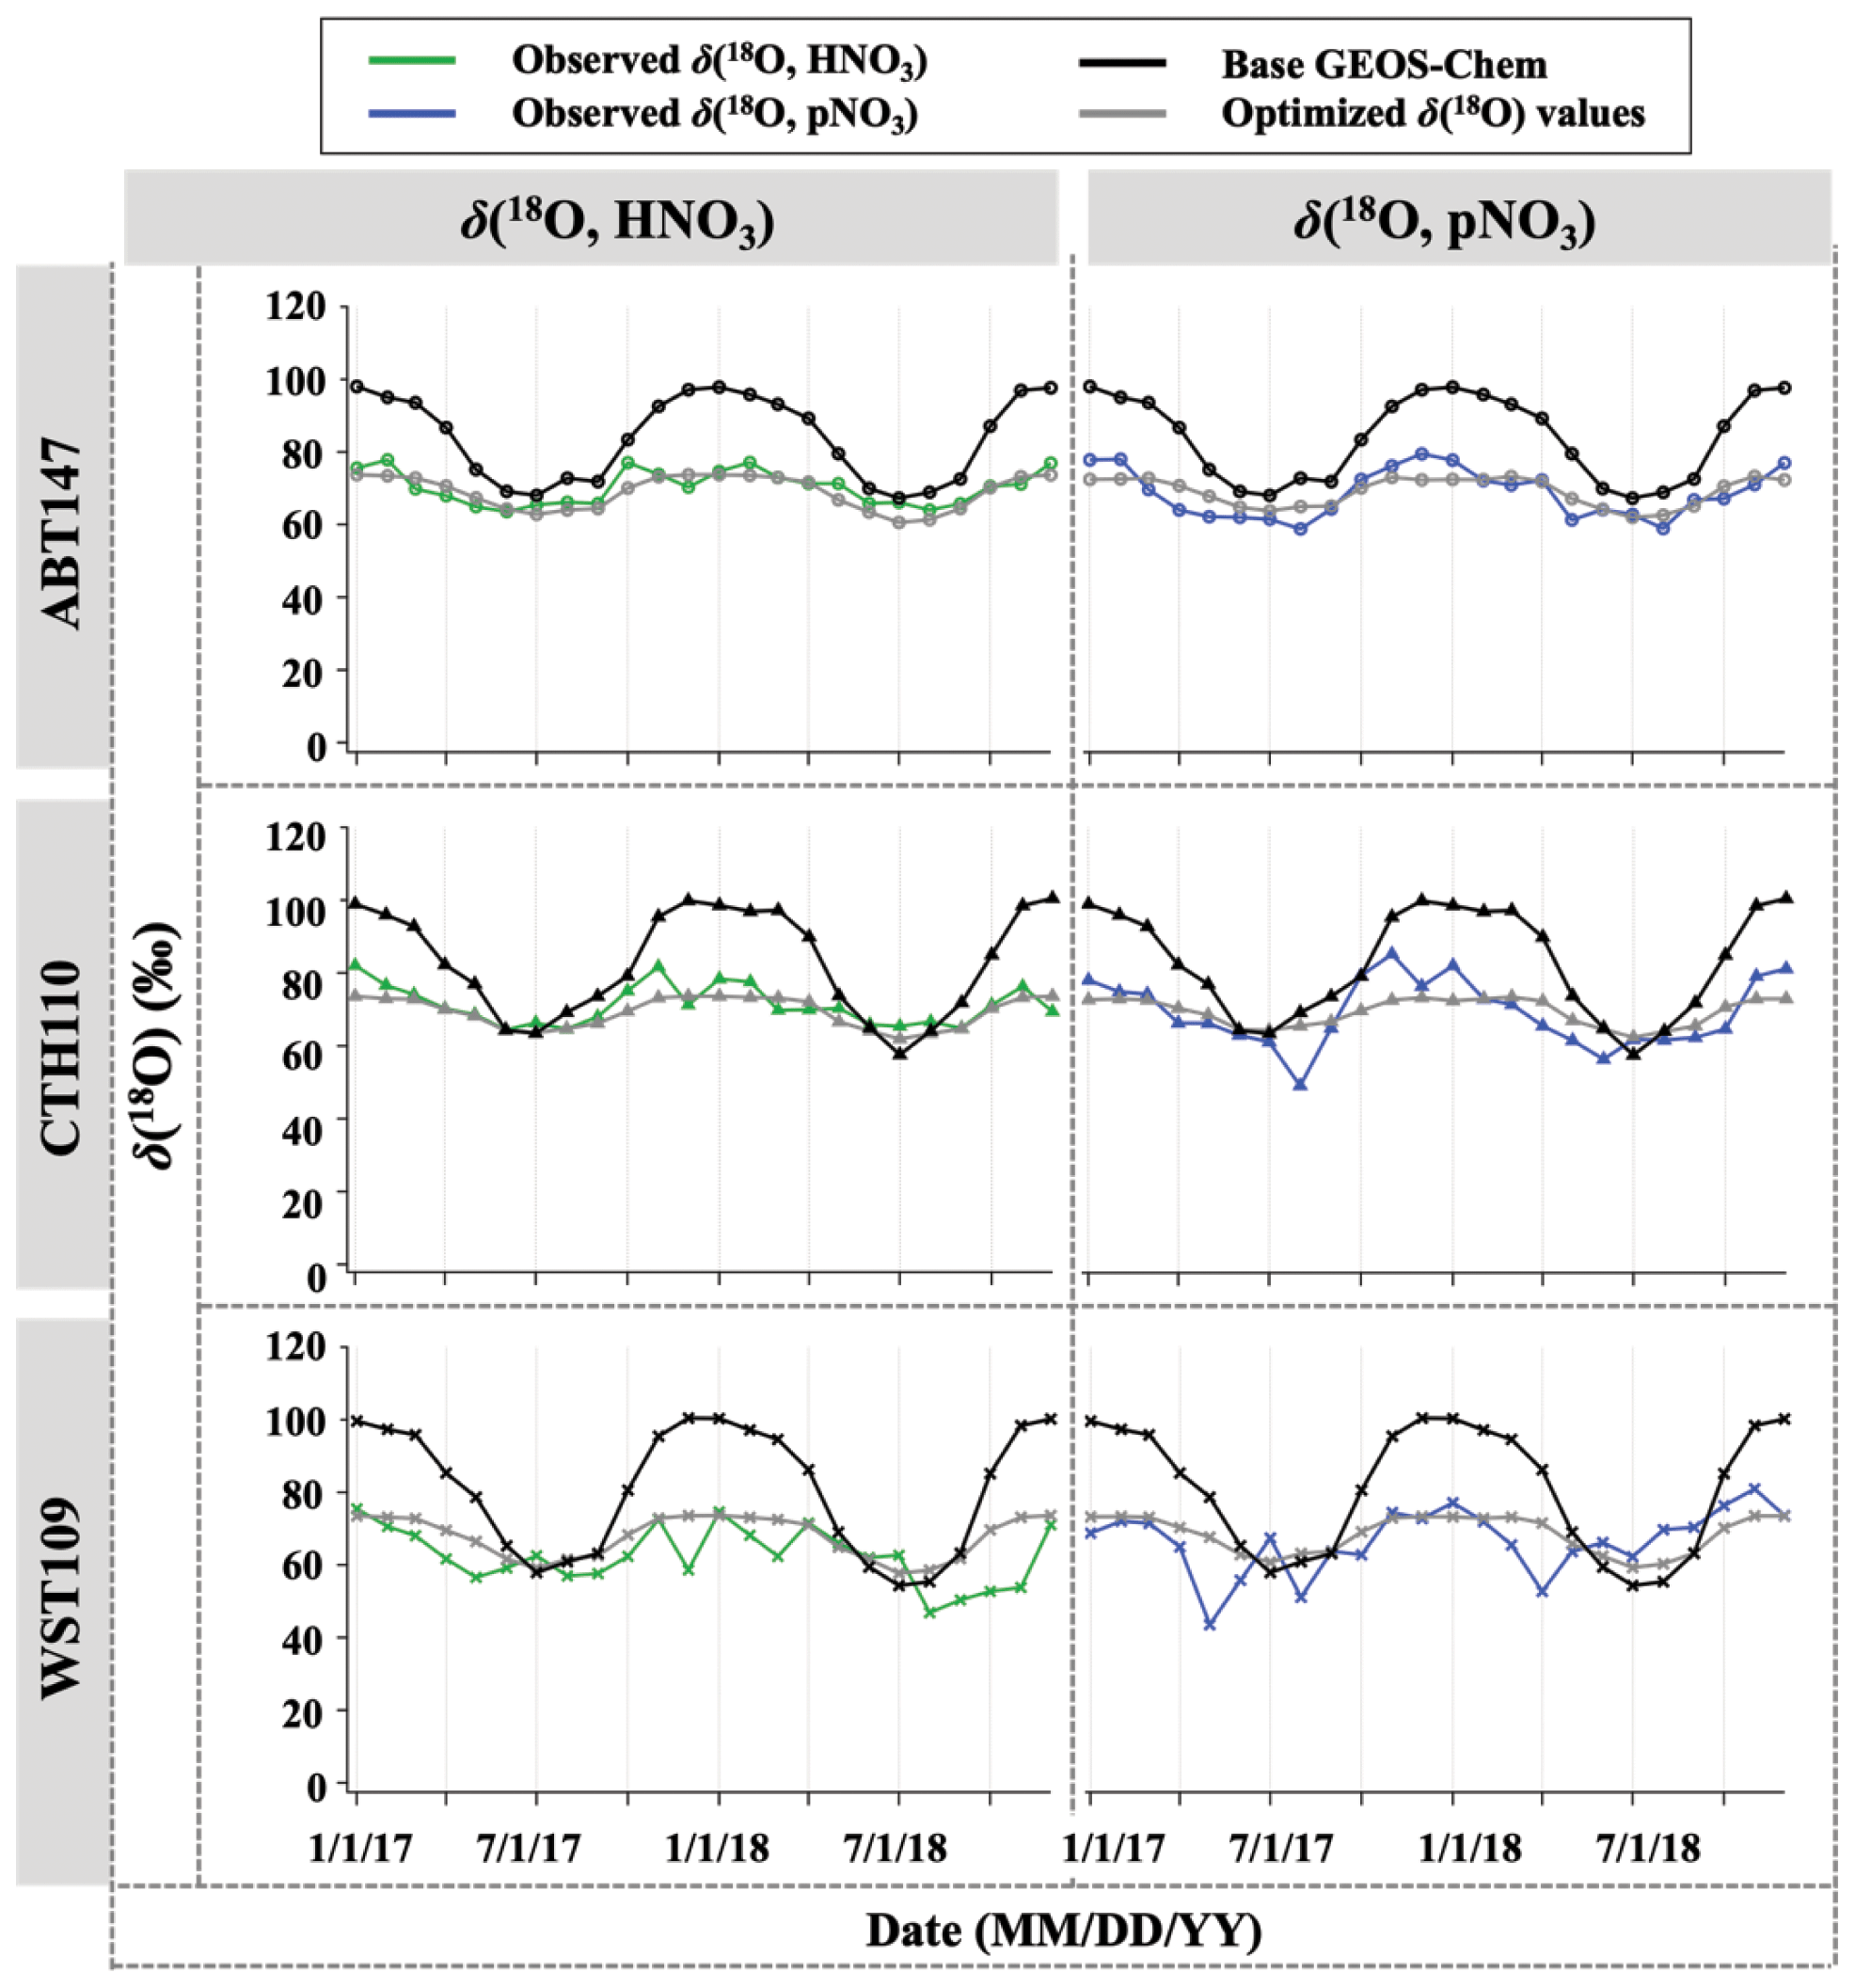
Figure 10Time series of observed and calculated δ(18O) for HNO3 and pNO3 for ABT147, CTH110, and WST109 sites. Calculated δ (18O) using base GEOS-Chem (black) and using optimized δ(18O) values (gray) are shown in the plot together.
Table 3δ(18O) values for each oxidant before and after optimization based on different scenarios.
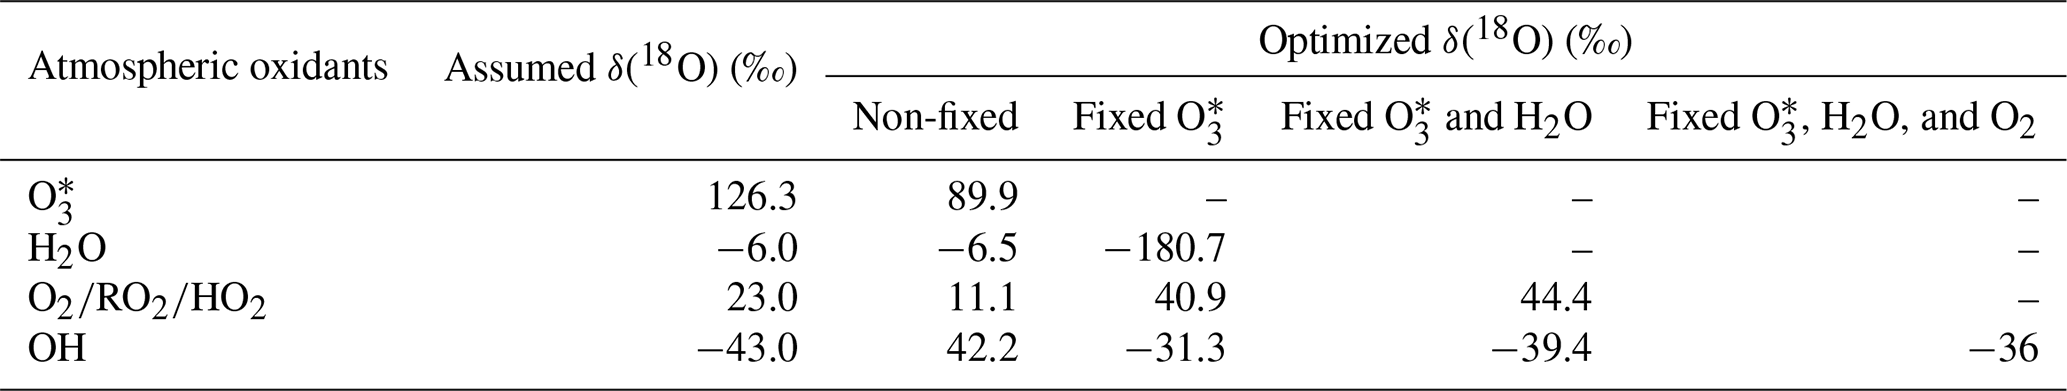
The observed δ(18O) of O3 and OH for the CASTNET samples were the best fit with calculated δ(18O) when assuming values of 89.9 ‰ for δ(18O, O3) and 42.2 ‰ for δ(18O, OH), respectively. In the previous section, we noted that NO2 + OH and N2O5 hydrolysis reactions were the dominant pathways for nitrate formation, indicating that OH and O3 play an important role in determining the δ(18O) value in nitrate. Indeed, optimizing δ(18O) values to find the best agreement between observation and calculation is largely dependent on δ(18O) values of O3 and OH (see also Table 3). The optimized δ(18O, O) value (89.9 ‰) was lower than the average reported δ(18O, O) ((∼ 126 ± 12) ‰; Vicars and Savarino, 2014), though the δ(18O, O3) is known to vary with temperature and pressure and could also potentially be fractionated during reactions (Brenninkmeijer et al., 2003). For example, Walters and Michalski (2016) calculated an isotopic enrichment factor near −20 ‰ associated with O3 transfer in its reaction with NO, which would lower the transferable δ(18O) of O3, consistent with our predictions. The isotope effect for NO + O3 reaction is the only one currently known; in other words, no other δ(18O) isotope effects associated with O3 reaction with NOy (e.g., NO2 + O3) have been calculated. Further, there is potential for equilibrium isotope effects between N2O5, NO2, and NO3 that could also impart a mass-dependent δ(18O) fractionation. While difficult to pinpoint the exact isotope effects occurring, our optimized value predicts an elevated δ(18O) value derived from O3 compared to the other oxidants, consistent with our expectation.
For δ(18O, OH), the optimized value dramatically increased compared to the initial assumed value (−43.0 ‰). The initial δ(18O, OH) value is based on several assumptions that may not be correct regarding isotope exchange with H2O(g). Additionally, Fang et al. (2021) suggested that δ(15N) of nitrate is largely controlled by an isotope effect in the NO2 + OH pathway, and it could be conceivable that δ(18O) may be affected by a similar isotope effect as well. Overall, the optimization of δ(18O, OH) is highly dependent on the δ(18O, O) (see Table 3), which makes sense given the proportional control of the NO2 + OH and N2O5 hydrolysis reactions. Despite the uncertainty in the transferrable δ(18O) from major oxidants, the comparisons between predicted and observed δ(18O) and Δ(17O) both suggest a larger relative importance of NO2 + OH chemistry than reflected in the model simulations. We note here that this finding is consistent with our companion study (Bekker et al., 2023) of δ(15N, HNO3) and δ(15N, pNO3) as well.
Overall, the observed differences in the oxygen isotopic composition of HNO3 and pNO3, the observed relationships of δ(18O) and Δ(17O) in the different nitrate phases, and the significant mismatch with the global model base case challenge our current representation of nitrate chemistry in atmospheric chemistry models. Generally, the GEOS-Chem Δ(17O) simulations were biased high relative to observations, indicating the over-incorporation of O3 during nitrate formation. The largest discrepancies in the model-observation comparisons, particularly for pNO3, occur in winter. Our optimized chemistry, constrained by the observed δ(18O) and Δ(17O), suggested that the heterogenous production of nitrate via N2O5 chemistry is currently significantly overestimated. While our focus is on the northeastern US, an area of important environmental change due to regulated emission reductions, this finding has implications for the global modeling of atmospheric nitrate and oxidation chemistry.
Using a combination of concentration and isotopic analyses, we evaluated atmospheric nitrate formation pathways in the northeastern US in 2017–2018. The GEOS-Chem model showed large positive biases for HNO3 and pNO3 concentrations, an important issue that is common in atmospheric chemistry models. The observed oxygen isotopic compositions (Δ(17O) and δ(18O)) revealed a more important relative role of NO2+OH chemistry and indicated that the model chemistry overpredicted heterogeneous hydrolysis of N2O5 for atmospheric nitrate in the northeastern US. We also observed nitrate-phase differences in Δ(17O) and δ(18O), which are not captured in current models. Further investigation of size-segregated nitrate chemistry is recommended to improve model prediction of nitrate formation.
Additionally, this finding has important implications for predicting oxidation chemistry in the atmosphere. For instance, the production of nitrate via heterogeneous hydrolysis of N2O5 represents a radical termination process, such that a much-reduced importance of this reaction could yield more radical chemistry with an impact on oxidant concentrations. Indeed, an important mechanism for converting NOx to atmospheric nitrate could affect control of the oxidizing efficiency, which directly influences the atmospheric oxidation budget and many atmospheric pollutants' (notably greenhouse gases') lifetimes in the atmosphere. Thus, better constraining their chemistries and feedbacks is crucial to understanding atmospheric nitrate production pathways and their connection to atmospheric oxidation chemistry.
Traditionally, Δ(17O) has been used to quantitatively assess nitrate production pathways. The use of δ(18O) as well can enhance our understanding of the oxidants contributing to nitrate formation, particularly for distinguishing oxidants that have similar Δ(17O) values (i.e., all are near 0 ‰ except ozone). However, our study also observed a discrepancy between observed and calculated δ(18O) values, even after accounting for an optimized chemical production based on Δ(17O). The best match of the observations suggests that the transferrable δ(18O) values of oxidants may vary more than is currently suggested in the literature. Improved constraints, particularly on the isotopic composition of OH and variability in δ(18O, O3), would add critical value to modeling and interpretation of major oxidation chemistry in the atmosphere.
Data presented in this article are available on the Harvard Dataverse at https://doi.org/10.7910/DVN/X6BB1I (Walters, 2022) and the US EPA CASTNET database (http://www.epa.gov/castnet, U.S. Environmental Protection Agency Clean Air Markets Division Clean Air Status and Trends Network, 2022).
HK, WWW, and MGH designed the varying aspects of the study. CB and WWW carried out the laboratory measurements. HK interpreted data, conducted statistical analysis, and analyzed model results. LTM contributed GEOS-Chem simulations. HK and WWW prepared the article with contributions from all co-authors.
The contact author has declared that none of the authors has any competing interests.
Publisher's note: Copernicus Publications remains neutral with regard to jurisdictional claims in published maps and institutional affiliations.
We thank Ruby Ho for sampling and laboratory assistance. We are grateful to the US EPA CASTNET program and staff for their cooperation in this study and their assistance with receiving archived samples for isotopic analysis.
This research has been supported by the National Science Foundation (AGS-2002750), Institute at Brown for Environment and Society Seed Grant, and Voss Environmental Fellowship from the Institute at Brown for Environment and Society.
This paper was edited by Jan Kaiser and reviewed by Pete D. Akers and one anonymous referee.
Alexander, B., Hastings, M. G., Allman, D. J., Dachs, J., Thornton, J. A., and Kunasek, S. A.: Quantifying atmospheric nitrate formation pathways based on a global model of the oxygen isotopic composition (Δ17O) of atmospheric nitrate, Atmos. Chem. Phys., 9, 5043–5056, https://doi.org/10.5194/acp-9-5043-2009, 2009.
Alexander, B., Sherwen, T., Holmes, C. D., Fisher, J. A., Chen, Q., Evans, M. J., and Kasibhatla, P.: Global inorganic nitrate production mechanisms: comparison of a global model with nitrate isotope observations, Atmos. Chem. Phys., 20, 3859–3877, https://doi.org/10.5194/acp-20-3859-2020, 2020.
Amos, H. M., Jacob, D. J., Holmes, C. D., Fisher, J. A., Wang, Q., Yantosca, R. M., Corbitt, E. S., Galarneau, E., Rutter, A. P., Gustin, M. S., Steffen, A., Schauer, J. J., Graydon, J. A., Louis, V. L. St., Talbot, R. W., Edgerton, E. S., Zhang, Y., and Sunderland, E. M.: Gas-particle partitioning of atmospheric Hg(II) and its effect on global mercury deposition, Atmos. Chem. Phys., 12, 591–603, https://doi.org/10.5194/acp-12-591-2012, 2012.
Ashbaugh, L. L. and Eldred, R. A.: Loss of Particle Nitrate from Teflon Sampling Filters: Effects on Measured Gravimetric Mass in California and in the IMPROVE Network, J. Air Waste Manage., 54, 93–104, https://doi.org/10.1080/10473289.2004.10470878, 2004.
Bates, K. H. and Jacob, D. J.: A new model mechanism for atmospheric oxidation of isoprene: global effects on oxidants, nitrogen oxides, organic products, and secondary organic aerosol, Atmos. Chem. Phys., 19, 9613–9640, https://doi.org/10.5194/acp-19-9613-2019, 2019.
Bekker, C., Walters, W. W., Murray, L. T., and Hastings, M. G.: Nitrate chemistry in the northeast US – Part 1: Nitrogen isotope seasonality tracks nitrate formation chemistry, Atmos. Chem. Phys., 23, 4185–4201, https://doi.org/10.5194/acp-23-4185-2023, 2023.
Bey, I., Jacob, D. J., Yantosca, R. M., Logan, J. A., Field, B. D., Fiore, A. M., Li, Q., Liu, H. Y., Mickley, L. J., and Schultz, M. G.: Global modeling of tropospheric chemistry with assimilated meteorology: Model description and evaluation, J. Geophys. Res.-Atmos., 106, 23073–23095, https://doi.org/10.1029/2001JD000807, 2001.
Breider, T. J., Mickley, L. J., Jacob, D. J., Ge, C., Wang, J., Payer Sulprizio, M., Croft, B., Ridley, D. A., McConnell, J. R., and Sharma, S.: Multidecadal trends in aerosol radiative forcing over the Arctic: Contribution of changes in anthropogenic aerosol to Arctic warming since 1980, J. Geophys. Res.-Atmos., 22, 3573–3594, https://doi.org/10.1002/2016JD025321, 2017.
Brenninkmeijer, C. A., Janssen, C., Kaiser, J., Röckmann, T., Rhee, T. S., and Assonov, S. S.: Isotope effects in the chemistry of atmospheric trace compounds, Chem. Rev., 103, 5125–5162, https://doi.org/10.1021/cr020644k, 2003.
Camargo, J. A. and Alonso, Á.: Ecological and toxicological effects of inorganic nitrogen pollution in aquatic ecosystems: a global assessment, Environ. Int., 32, 831–849, https://doi.org/10.1016/j.envint.2006.05.002, 2006.
Carter, T. (Tess) S., Joyce, E. E., and Hastings, M. G.: Quantifying Nitrate Formation Pathways in the Equatorial Pacific Atmosphere from the GEOTRACES Peru-Tahiti Transect, ACS Earth Space Chem., 5, 2638–2651, https://doi.org/10.1021/acsearthspacechem.1c00072, 2021.
Casciotti, K. L., Sigman, D. M., Hastings, M. G., Böhlke, J. K., and Hilkert, A.: Measurement of the oxygen isotopic composition of nitrate in seawater and freshwater using the denitrifier method, Anal. Chem., 74, 4905–4912, https://doi.org/10.1021/ac020113w, 2002.
CASTNET (Clean Air Status and Trends Network): Retrieved from the United States Environmental Protection Agency, https://www3.epa.gov/castnet/docs/CASTNET2019/AR2019-main.html#exectop (last access: 27 February 2023), 2019.
Crutzen, P. J.: The role of NO and NO2 in the chemistry of the troposphere and stratosphere, Annu. Rev. Earth Pl. Sc., 7, 443–472, https://doi.org/10.1146/annurev.ea.07.050179.002303, 1979.
Dubey, M. K., Mohrschladt, R., Donahue, N. M., and Anderson, J. G.: Isotope specific kinetics of hydroxyl radical (OH) with water (H2O): Testing models of reactivity and atmospheric fractionation, J. Phys. Chem. A, 101, 1494–1500, https://doi.org/10.1021/jp962332p, 1997.
Elliott, E. M., Kendall, C., Boyer, E. W., Burns, D. A., Lear, G. G., Golden, H. E., Harlin, K., Bytnerowicz, A., Butler, T. J., and Glatz, R.: Dual nitrate isotopes in dry deposition: Utility for partitioning NOx source contributions to landscape nitrogen deposition, J. Geophys. Res.-Biogeo., 114, G04020, https://doi.org/10.1029/2008JG000889, 2009.
Fang, H., Walters, W. W., Mase, D., and Michalski, G.: iNRACM: incorporating 15N into the Regional Atmospheric Chemistry Mechanism (RACM) for assessing the role photochemistry plays in controlling the isotopic composition of NOx, NOy, and atmospheric nitrate, Geosci. Model Dev., 14, 5001–5022, https://doi.org/10.5194/gmd-14-5001-2021, 2021.
Fountoukis, C. and Nenes, A.: ISORROPIA II: a computationally efficient thermodynamic equilibrium model for K+–Ca2+–Mg2+––Na+–––Cl−–H2O aerosols, Atmos. Chem. Phys., 7, 4639–4659, https://doi.org/10.5194/acp-7-4639-2007, 2007.
Galloway, J. N., Dentener, F. J., Capone, D. G., Boyer, E. W., Howarth, R. W., Seitzinger, S. P., Asner, G. P., Cleveland, C. C., Green, P. A., and Holland, E. A.: Nitrogen cycles: past, present, and future, Biogeochemistry, 70, 153–226, https://doi.org/10.1007/s10533-004-0370-0, 2004.
Guenther, A. B., Jiang, X., Heald, C. L., Sakulyanontvittaya, T., Duhl, T., Emmons, L. K., and Wang, X.: The Model of Emissions of Gases and Aerosols from Nature version 2.1 (MEGAN2.1): an extended and updated framework for modeling biogenic emissions, Geosci. Model Dev., 5, 1471–1492, https://doi.org/10.5194/gmd-5-1471-2012, 2012.
Hastings, M. G., Sigman, D. M., and Lipschultz, F.: Isotopic evidence for source changes of nitrate in rain at Bermuda, J. Geophys. Res.-Atmos., 108, 4790, https://doi.org/10.1029/2003JD003789, 2003.
Heald, C. L., Collett Jr., J. L., Lee, T., Benedict, K. B., Schwandner, F. M., Li, Y., Clarisse, L., Hurtmans, D. R., Van Damme, M., Clerbaux, C., Coheur, P.-F., Philip, S., Martin, R. V., and Pye, H. O. T.: Atmospheric ammonia and particulate inorganic nitrogen over the United States, Atmos. Chem. Phys., 12, 10295–10312, https://doi.org/10.5194/acp-12-10295-2012, 2012.
Hering, S. and Cass, G.: The magnitude of bias in the measurement of PM2.5 arising from volatilization of particulate nitrate from Teflon filters, J. Air Waste Manage., 49, 725–733, https://doi.org/10.1080/10473289.1999.10463843, 1999.
Hoesly, R. M., Smith, S. J., Feng, L., Klimont, Z., Janssens-Maenhout, G., Pitkanen, T., Seibert, J. J., Vu, L., Andres, R. J., Bolt, R. M., Bond, T. C., Dawidowski, L., Kholod, N., Kurokawa, J.-I., Li, M., Liu, L., Lu, Z., Moura, M. C. P., O'Rourke, P. R., and Zhang, Q.: Historical (1750–2014) anthropogenic emissions of reactive gases and aerosols from the Community Emissions Data System (CEDS), Geosci. Model Dev., 11, 369–408, https://doi.org/10.5194/gmd-11-369-2018, 2018.
Holt, J., Selin, N. E., and Solomon, S.: Changes in inorganic fine particulate matter sensitivities to precursors due to large-scale US emissions reductions, Environ. Sci. Technol., 49, 4834–4841, https://doi.org/10.1021/acs.est.5b00008, 2015.
Hu, L., Millet, D. B., Baasandorj, M., Griffis, T. J., Turner, P., Helmig, D., Curtis, A. J., and Hueber, J.: Isoprene emissions and impacts over an ecological transition region in the US Upper Midwest inferred from tall tower measurements, J. Geophys. Res.-Atmos., 120, 3553–3571, https://doi.org/10.1002/2014JD022732, 2015.
Huang, J. and Jaeglé, L.: Wintertime enhancements of sea salt aerosol in polar regions consistent with a sea ice source from blowing snow, Atmos. Chem. Phys., 17, 3699–3712, https://doi.org/10.5194/acp-17-3699-2017, 2017.
Hudman, R. C., Moore, N. E., Mebust, A. K., Martin, R. V., Russell, A. R., Valin, L. C., and Cohen, R. C.: Steps towards a mechanistic model of global soil nitric oxide emissions: implementation and space based-constraints, Atmos. Chem. Phys., 12, 7779–7795, https://doi.org/10.5194/acp-12-7779-2012, 2012.
Jaeglé, L., Quinn, P. K., Bates, T. S., Alexander, B., and Lin, J.-T.: Global distribution of sea salt aerosols: new constraints from in situ and remote sensing observations, Atmos. Chem. Phys., 11, 3137–3157, https://doi.org/10.5194/acp-11-3137-2011, 2011.
Jaeglé, L., Shah, V., Thornton, J. A., Lopez-Hilfiker, F. D., Lee, B. H., McDuffie, E. E., Fibiger, D., Brown, S. S., Veres, P., and Sparks, T. L.: Nitrogen oxides emissions, chemistry, deposition, and export over the Northeast United States during the WINTER aircraft campaign, J. Geophys. Res.-Atmos., 123, 12368–12393, https://doi.org/10.1029/2018JD029133, 2018.
Kaiser, J., Hastings, M. G., Houlton, B. Z., Röckmann, T., and Sigman, D. M.: Triple oxygen isotope analysis of nitrate using the denitrifier method and thermal decomposition of N2O, Anal. Chem., 79, 599–607, https://doi.org/10.1021/ac061022s, 2007.
Kasibhatla, P., Sherwen, T., Evans, M. J., Carpenter, L. J., Reed, C., Alexander, B., Chen, Q., Sulprizio, M. P., Lee, J. D., Read, K. A., Bloss, W., Crilley, L. R., Keene, W. C., Pszenny, A. A. P., and Hodzic, A.: Global impact of nitrate photolysis in sea-salt aerosol on NOx, OH, and O3 in the marine boundary layer, Atmos. Chem. Phys., 18, 11185–11203, https://doi.org/10.5194/acp-18-11185-2018, 2018.
Kroopnick, P. and Craig, H.: Atmospheric oxygen: isotopic composition and solubility fractionation, Science, 175, 54–55, https://doi.org/10.1126/science.175.4017.54, 1972.
Liu, H., Jacob, D. J., Bey, I., and Yantosca, R. M.: Constraints from 210Pb and 7Be on wet deposition and transport in a global three-dimensional chemical tracer model driven by assimilated meteorological fields, J. Geophys. Res.-Atmos., 106, 12109–12128, https://doi.org/10.1029/2000JD900839, 2001.
Luo, G., Yu, F., and Moch, J. M.: Further improvement of wet process treatments in GEOS-Chem v12.6.0: impact on global distributions of aerosols and aerosol precursors, Geosci. Model Dev., 13, 2879–2903, https://doi.org/10.5194/gmd-13-2879-2020, 2020.
Luo, G., Yu, F., and Schwab, J.: Revised treatment of wet scavenging processes dramatically improves GEOS-Chem 12.0.0 simulations of surface nitric acid, nitrate, and ammonium over the United States, Geosci. Model Dev., 12, 3439–3447, https://doi.org/10.5194/gmd-12-3439-2019, 2019.
McDuffie, E. E., Smith, S. J., O'Rourke, P., Tibrewal, K., Venkataraman, C., Marais, E. A., Zheng, B., Crippa, M., Brauer, M., and Martin, R. V.: A global anthropogenic emission inventory of atmospheric pollutants from sector- and fuel-specific sources (1970–2017): an application of the Community Emissions Data System (CEDS), Earth Syst. Sci. Data, 12, 3413–3442, https://doi.org/10.5194/essd-12-3413-2020, 2020.
Michalski, G., Bhattacharya, S. K., and Mase, D. F.: Oxygen isotope dynamics of atmospheric nitrate and its precursor molecules, in: Handbook of environmental isotope geochemistry, Springer, 613–635, https://doi.org/10.1007/978-3-642-10637-8_30, 2012.
Michalski, G., Scott, Z., Kabiling, M., and Thiemens, M. H.: First measurements and modeling of Δ17O in atmospheric nitrate, Geophys. Res. Lett., 30, 1870, https://doi.org/10.1029/2003GL017015, 2003.
Millet, D. B., Guenther, A., Siegel, D. A., Nelson, N. B., Singh, H. B., de Gouw, J. A., Warneke, C., Williams, J., Eerdekens, G., Sinha, V., Karl, T., Flocke, F., Apel, E., Riemer, D. D., Palmer, P. I., and Barkley, M.: Global atmospheric budget of acetaldehyde: 3-D model analysis and constraints from in-situ and satellite observations, Atmos. Chem. Phys., 10, 3405–3425, https://doi.org/10.5194/acp-10-3405-2010, 2010.
Morin, S., Sander, R., and Savarino, J.: Simulation of the diurnal variations of the oxygen isotope anomaly (Δ17O) of reactive atmospheric species, Atmos. Chem. Phys., 11, 3653–3671, https://doi.org/10.5194/acp-11-3653-2011, 2011.
Murray, L. T., Jacob, D. J., Logan, J. A., Hudman, R. C., and Koshak, W. J.: Optimized regional and interannual variability of lightning in a global chemical transport model constrained by LIS/OTD satellite data, J. Geophys. Res.-Atmos., 117, D20307, https://doi.org/10.1029/2012JD017934, 2012.
NEI (National Emissions Inventory): Retrieved from United States Environmental Protection Agency, https://www.epa.gov/air-emissions-inventories/national-emissions-inventory-nei (last access: 27 February 2023), 2017.
Ridley, D. A., Heald, C. L., and Ford, B.: North African dust export and deposition: A satellite and model perspective, J. Geophys. Res.-Atmos., 117, D02202, https://doi.org/10.1029/2011JD016794, 2012.
Savard, M. M., Cole, A. S., Vet, R., and Smirnoff, A.: The Δ17O and δ18O values of atmospheric nitrates simultaneously collected downwind of anthropogenic sources – implications for polluted air masses, Atmos. Chem. Phys., 18, 10373–10389, https://doi.org/10.5194/acp-18-10373-2018, 2018.
Savarino, J., Kaiser, J., Morin, S., Sigman, D. M., and Thiemens, M. H.: Nitrogen and oxygen isotopic constraints on the origin of atmospheric nitrate in coastal Antarctica, Atmos. Chem. Phys., 7, 1925–1945, https://doi.org/10.5194/acp-7-1925-2007, 2007.
Schlesinger, R. B.: The health impact of common inorganic components of fine particulate matter (PM2.5) in ambient air: a critical review, Inhal. Toxicol., 19, 811–832, https://doi.org/10.1080/08958370701402382, 2007.
Shah, V., Jaeglé, L., Thornton, J. A., Lopez-Hilfiker, F. D., Lee, B. H., Schroder, J. C., Campuzano-Jost, P., Jimenez, J. L., Guo, H., and Sullivan, A. P.: Chemical feedbacks weaken the wintertime response of particulate sulfate and nitrate to emissions reductions over the eastern United States, P. Natl. Acad. Sci. USA, 115, 8110–8115, https://doi.org/10.1073/pnas.1803295115, 2018.
Sickles II, J. E. and Shadwick, D. S.: Air quality and atmospheric deposition in the eastern US: 20 years of change, Atmos. Chem. Phys., 15, 173–197, https://doi.org/10.5194/acp-15-173-2015, 2015.
Sigman, D. M., Casciotti, K. L., Andreani, M., Barford, C., Galanter, M., and Böhlke, J. K.: A bacterial method for the nitrogen isotopic analysis of nitrate in seawater and freshwater, Anal. Chem., 73, 4145–4153, https://doi.org/10.1021/ac010088e, 2001.
Tai, A. P., Mickley, L. J., and Jacob, D. J.: Correlations between fine particulate matter (PM2.5) and meteorological variables in the United States: Implications for the sensitivity of PM2.5 to climate change, Atmos. Environ., 44, 3976–3984, https://doi.org/10.1016/j.atmosenv.2010.06.060, 2010.
Thiemens, M. H.: History and applications of mass-independent isotope effects, Annu. Rev. Earth Pl. Sc., 34, 217–262, https://doi.org/10.1146/annurev.earth.34.031405.125026, 2006.
U.S. Environmental Protection Agency Clean Air Markets Division Clean Air Status and Trends Network (CASTNET): Filter Pack Concentrations – Weekly, http://www.epa.gov/castnet, last access: 4 March 2022.
US EPA (Environmental Protection Agency): Our nation's air, https://gispub.epa.gov/air/trendsreport/ 2017 (last access: 27 February 2023), 2017.
van der Werf, G. R., Randerson, J. T., Giglio, L., van Leeuwen, T. T., Chen, Y., Rogers, B. M., Mu, M., van Marle, M. J. E., Morton, D. C., Collatz, G. J., Yokelson, R. J., and Kasibhatla, P. S.: Global fire emissions estimates during 1997–2016, Earth Syst. Sci. Data, 9, 697–720, https://doi.org/10.5194/essd-9-697-2017, 2017.
Vicars, W. C. and Savarino, J.: Quantitative constraints on the 17O-excess (Δ17O) signature of surface ozone: Ambient measurements from 50∘N to 50∘S using the nitrite-coated filter technique, Geochim. Cosmochim. Ac., 135, 270–287, https://doi.org/10.1016/j.gca.2014.03.023, 2014.
Vicars, W. C., Bhattacharya, S. K., Erbland, J., and Savarino, J.: Measurement of the 17O-excess (Δ17O) of tropospheric ozone using a nitrite-coated filter, Rapid Commun. Mass Spectrom., 26, 1219–1231, https://doi.org/10.1002/rcm.6218, 2012.
Vicars, W. C., Morin, S., Savarino, J., Wagner, N. L., Erbland, J., Vince, E., Martins, J. M. F., Lerner, B. M., Quinn, P. K., Coffman, D. J., and others: Spatial and diurnal variability in reactive nitrogen oxide chemistry as reflected in the isotopic composition of atmospheric nitrate: Results from the CalNex 2010 field study, J. Geophys. Res.-Atmos., 118, 10567–10588, https://doi.org/10.1002/jgrd.50680, 2013.
Walker, J. M., Philip, S., Martin, R. V., and Seinfeld, J. H.: Simulation of nitrate, sulfate, and ammonium aerosols over the United States, Atmos. Chem. Phys., 12, 11213–11227, https://doi.org/10.5194/acp-12-11213-2012, 2012.
Walker, J. T., Beachley, G., Amos, H. M., Baron, J. S., Bash, J., Baumgardner, R., Bell, M. D., Benedict, K. B., Chen, X., and Clow, D. W.: Toward the improvement of total nitrogen deposition budgets in the United States, Sci. Total Environ., 691, 1328–1352, https://doi.org/10.1016/j.scitotenv.2019.07.058, 2019.
Walters, W.: Data for, “Nitrate Chemistry in the Northeast US Part 1 & Part 2”, Harvard Dataverse V1 [data set], https://doi.org/10.7910/DVN/X6BB1I, 2022.
Walters, W. W. and Michalski, G.: Theoretical calculation of oxygen equilibrium isotope fractionation factors involving various NOy molecules, OH, and H2O and its implications for isotope variations in atmospheric nitrate, Geochim. Cosmochim. Ac., 191, 89–101, https://doi.org/10.1016/j.gca.2016.06.039, 2016.
Walters, W. W., Fang, H., and Michalski, G.: Summertime diurnal variations in the isotopic composition of atmospheric nitrogen dioxide at a small midwestern United States city, Atmos. Environ., 179, 1–11, https://doi.org/10.1016/j.atmosenv.2018.01.047, 2018.
Walters, W. W., Michalski, G., Böhlke, J. K., Alexander, B., Savarino, J., and Thiemens, M. H.: Assessing the seasonal dynamics of nitrate and sulfate aerosols at the South Pole utilizing stable isotopes, J. Geophys. Res.-Atmos., 124, 8161–8177, https://doi.org/10.1029/2019JD030517, 2019.
Wang, X., Jacob, D. J., Downs, W., Zhai, S., Zhu, L., Shah, V., Holmes, C. D., Sherwen, T., Alexander, B., Evans, M. J., Eastham, S. D., Neuman, J. A., Veres, P. R., Koenig, T. K., Volkamer, R., Huey, L. G., Bannan, T. J., Percival, C. J., Lee, B. H., and Thornton, J. A.: Global tropospheric halogen (Cl, Br, I) chemistry and its impact on oxidants, Atmos. Chem. Phys., 21, 13973–13996, https://doi.org/10.5194/acp-21-13973-2021, 2021.
Wesely, M. L. and Lesht, B. M.: Comparison of RADM dry deposition algorithms with a site-specific method for inferring dry deposition, Water Air Soil Pollut., 44, 273–293, https://doi.org/10.1007/BF00279259, 1989.
Zhang, L., Jacob, D. J., Knipping, E. M., Kumar, N., Munger, J. W., Carouge, C. C., van Donkelaar, A., Wang, Y. X., and Chen, D.: Nitrogen deposition to the United States: distribution, sources, and processes, Atmos. Chem. Phys., 12, 4539–4554, https://doi.org/10.5194/acp-12-4539-2012, 2012.