the Creative Commons Attribution 4.0 License.
the Creative Commons Attribution 4.0 License.
 | 17 Mar 2023
Real-time measurements of non-methane volatile organic compounds in the central Indo-Gangetic basin, Lucknow, India: source characterisation and their role in O3 and secondary organic aerosol formation
Vaishali Jain
Nidhi Tripathi
Mansi Gupta
Vishnu Murari
Sreenivas Gaddamidi
Ashutosh K. Shukla
Andre S. H. Prevot
Lucknow is the capital of India's largest state, Uttar Pradesh, one of South Asia's most polluted urban cities. Tropospheric photochemistry relies on non-methane volatile organic compounds (NMVOCs), which are ozone and secondary organic aerosol precursors. Using the proton-transfer reaction time-of-flight mass spectrometer (PTR-ToF-MS) at an urban background site in Lucknow, the chemical characterisation of NMVOCs was performed in real time from December 2020 to May 2021. About ∼ 173 NMVOCs from 31.018 to 197.216 were measured during the study period, including aromatics, non-aromatics, oxygenates, and nitrogen-containing compounds. The campaign daily mean concentrations of the NMVOCs were 125.5 ± 37.5 ppbv. The NMVOC daily average concentrations were about ∼ 30 % higher during the winter months (December–February) than in summer (March–May). The oxygenated volatile organic compounds and aromatics were the dominant VOC families, accounting for ∼ 57 %–80 % of the total NMVOC concentrations. Acetaldehyde, acetone, and acetic acid were the major NMVOC species, 5–15 times higher than the other species. An advanced multi-linear engine (ME-2) model was used to perform the NMVOC source apportionment using positive matrix factorisation (PMF). It resolves the five main sources contributing to these organic compounds in the atmosphere. They include traffic (23.5 %), two solid fuel combustion factors, SFC 1 (28.1 %) and SFC 2 (13.2 %), secondary volatile organic compounds (SVOCs) (18.6 %), and volatile chemical products (VCPs) (16.6 %). Aged and fresh emissions from solid fuel combustion (SFCs 1 and 2) were the dominant contributors to the total NMVOCs, and compounds related to these factors had a high secondary organic aerosol (SOA) formation potential. Interestingly, the traffic factor was the second-highest contributor to the total NMVOCs, and compounds related to this factor had a high ozone formation potential. Significant differences in the composition of the two solid fuel combustions indicate the influence of local emissions and transport of regional pollution to the city. The high temperature during summer leads to more volatilisation of oxygenated VOCs, related to the VCP factor. The study is the first attempt to highlight the sources of NMVOCs and their contribution to secondary pollutant (SOA and O3) formation in the city of Lucknow during winter and summer. The insights from the study would help various stakeholders to manage primary and secondary pollutants within the city.
- Article
(5870 KB) - Full-text XML
-
Supplement
(1587 KB) - BibTeX
- EndNote


Non-methane volatile organic compounds (NMVOCs) are carbon-containing gaseous compounds in the troposphere. NMVOCs can have significant effects (direct and indirect) on human health and the environment. These compounds have a half-life ranging from hours to months (Atkinson, 2000). Exposure (inhalation or direct contact) to high levels of NMVOCs can produce multiple chronic and acute health effects on humans, including nose, eye, throat, and liver irritation. NMVOCs like benzene, acrolein, and aromatic amines are carcinogens subject to long-term exposure (WHO, 2021; Balakrishnan et al., 2015). The NMVOCs in the atmosphere act as precursors of ozone (O3) and secondary organic aerosol (SOA) (Hallquist et al., 2009). They are oxidised by primary oxidant radicals such as hydroxyl radicals (OH), chlorine (Cl), and nitrate (NO3) in the presence of nitrogen oxides (NOx) and sunlight and can lead to the formation of ozone near the surface (Atkinson et al., 2004; Carter, 1994a) and also secondary oxygenated volatile organic compounds (OVOCs) (de Gouw et al., 2005). These OVOCs undergo further oxidation, gaining polar functional groups or oligomerising and becoming less volatile. When these compounds have sufficiently low vapour pressures, these products may condense to form a particle-phase secondary organic aerosol mass (Hallquist et al., 2009; Heald et al., 2008; Monks et al., 2009). The chemical composition of the parent compound, NOx concentrations, and relative concentrations of OH and chloride radicals during the day and NO3 during the night (Warneke et al., 2004) are factors that ultimately determine the fate of the formation of these aerosol products (Jang et al., 2002). At high NOx levels, VOCs degrade to form carbonyls, hydroxy carbonyls, organic nitrates, and peroxyacetyl nitrates (PANs). In contrast, low NOx conditions tend to produce fewer volatile compounds and organic peroxides after reaction with HO2 radicals and favour SOA production from OVOCs (Kroll et al., 2006; Ng et al., 2007; Hallquist et al., 2009; Xu et al., 2014).
The inherent complexity in the non-linear VOC–NOx–O3 relationship and the change in ozone levels as a function of VOCs and NOx are understood by ozone isopleths. When VOCs are relatively high and NOx is relatively low, ozone production is limited by NOx, which is considered a NOx-sensitive regime. Conversely, when VOCs are relatively low and NOx is high, ozone production is determined by the concentration of VOCs and is considered a VOC-sensitive regime (also known as a NOx-saturated regime) (Chameides et al., 1992). It is observed that the urban area of Delhi was frequently associated with VOC-sensitive chemical regimes (Sharma and Khare, 2017). The reduction in VOCs from anthropogenic emissions would reduce ozone levels more instead of reducing NOx levels. Sharma and Khare (2017) also simulated that reducing NOx by 50 % in Delhi would increase ground-level ozone production by about 10 %–50 %. In contrast, it is recommended that strategies control abatement measures for NMVOCs, which would effectively reduce tropospheric ozone production by 60 % more than abatement of ozone or particulate matter (PM2.5) alone. The build-up of surface ozone and SOA synergistically deteriorates the air quality and escalates harmful effects on humans and flora or fauna (Anenberg et al., 2018; Burnett et al., 2014; Pye et al., 2021). The increased PM2.5 concentrations and other pollutants lead to economic and recreational loss, deterioration in the health of citizens, an increase in morbidity and premature mortality risks, and biodiversity loss. Extreme haze events are one of the major challenges for Indian cities, being among the most air-polluted cities in the world. Despite their importance, the spatial and temporal variability of the concentrations of NMVOCs, which are precursors to secondary organic aerosols and ozone, remains unknown in most Indian cities.
Only a few studies have observed and reported the ambient NMVOC levels in Indian cities. These studies were mainly conducted in large Indian cities such as Delhi (Garg et al., 2019; Hoque et al., 2008; Srivastava et al., 2005; Tripathi et al., 2022), Mumbai (Srivastava et al., 2006), Kolkata (Majumdar et al., 2011; Chattopadhyay et al., 1997; Sahu et al., 2016; Tripathi and Sahu, 2020; Sahu et al., 2017), Udaipur (Tripathi et al., 2021; Yadav et al., 2019), and Mohali (Sinha et al., 2014). A previous study has presented the health risk assessments for ambient VOC levels in Kolkata (Chauhan et al., 2014; Majumdar (neé Som) et al., 2008). Most of these studies have examined only a few NMVOCs, mainly benzene, toluene, ethylbenzene, and xylene (BTEX), with less or no information related to their sources. Real-time characterisation and source apportionment studies for NMVOCs in India are limited to the national capital city of Delhi (L. Wang et al., 2020; Jain et al., 2022; Stewart et al., 2021c) and Mohali (Pallavi et al., 2019) across different seasons and sites. Traffic emissions and solid fuel combustion are observed to be major contributors in both cities. Significant contributions from secondary VOCs are found in Delhi, while solvent-based industries contributed to NMVOCs in Mohali. It is necessary to understand the different source profiles and source contributions to ambient NMVOCs in different cities. The atmospheric interactions with radicals and meteorology highly influence the concentrations of NMVOCs in the region. Recent source apportionment studies based on real-time measurements of non-refractory fine particulate matter using a high-resolution time-of-flight aerosol mass spectrometer (HR-ToF-AMS) identified various sources present at different sites in Delhi (Lalchandani et al., 2021; Shukla et al., 2021; Tobler et al., 2020). These studies emphasised that it is essential to understand the variance of sources between day and night and different seasons. The significant contributors to fine suspended particulate matter in the National Capital Region are the burning of crop residues in neighbouring states, open burning of waste, as well as the increased construction activities, industrial expansion, thermal power plants, number of vehicles (two-wheelers and cars), and residential fuel use that result from an ever-increasing population. In addition, recent studies based on real-time measurements of NMVOCs using a proton-transfer-reaction time-of-flight mass spectrometer (PTR-ToF-MS) in Delhi (L. Wang et al., 2020; Jain et al., 2022) and Mohali (Pallavi et al., 2019) emphasised the importance of source characterisation of NMVOCs simultaneously. Very few source apportionment studies highlighted the sources of NMVOCs present in other Asian cities (L. Wang et al., 2021; Tan et al., 2021; Fukusaki et al., 2021a; Sarkar et al., 2017; Hui et al., 2018). These studies highlighted that NMVOC sources have substantial value in checking the secondary aerosol formation and air quality.
The lack of identification of the sources and relative contributions of NMVOCs remains a challenging task for policy-driven measures. The development and evolution of strategies need an understanding of the seasonal and temporal variations and sources of NMVOCs. The reaction pathway is different for different NMVOCs and depends on the reaction rates of the species. Therefore, the ozone formation potential (OFP) of all NMVOCs is not the same. NMVOCs are categorised into distinct families based on their chemical structure and mass / charge () ratios. Some of these NMVOCs have lower OFPs than others and tend to form less ozone in the atmosphere. Understanding these OFPs in different chemical regimes would help identify families or species of NMVOCs of greater concern for surface ozone production control.
Here, in this study, a real-time instrument, a PTR-ToF-MS, is deployed for a period of 112 d (December–May) in the city of Lucknow to understand the contribution of long-range transport and local VOC emissions. Lucknow, also known as the “City of Nawabs”, is a city situated in the centre of the Indo-Gangetic basin region on the banks of the Gomati River. It is one of the fastest-growing cities and is now known for its manufacturing, commercial, and retail hubs. The exploding population due to increased migration from nearby towns and villages has widened the city boundaries. Currently, the city has two major Indian National Highways (NH24 and NH30) intersecting. The city has 125 petrol/diesel filling stations and seven designated industrial areas (Ministry of MSME, Government of India, 2018). The number of registered personal motor vehicles in the city as of 2017 was about ∼ 2 million (Government of India, 2019), which had been increasing at an average rate of 9 % every year since 2007. Besides this, 255 brick kilns operate within and around the city of Lucknow. Only ∼ 4.7 % of the area of the district is covered by forest area, with a population of ∼ 2.8 million (Census of India, 2011). The city has eight large-scale, public-sector undertakings, 11 medium-scale industries, and hundreds of micro, small, and medium enterprises (MSMEs) (Ministry of MSME, Government of India, 2018). Increased industrial and construction activities, unregulated energy and fuel consumption, unchecked vehicular pollution, and unsustainable urbanisation are major driving forces for poor air quality in Lucknow (Uttar Pradesh Pollution Control Board, 2019). The aerosol loadings in the city have been unprecedentedly high for the last 2 decades (Sharma et al., 2006; Markandeya et al., 2021; Lawrence and Fatima, 2014). The PM2.5 concentrations were found to be highest in the industrial area during winter compared to residential and commercial spaces (Pandey et al., 2012, 2013). Nevertheless, minimal work has been conducted to investigate air pollution and its health impacts in the city, most of which are focused on particulate pollution. To our knowledge, there are no reported measurements of NMVOCs over the city.
This study discusses the first-time-ever measurements of NMVOCs using a PTR-ToF-MS over the crucial site in the middle of the Indo-Gangetic basin (IGB). This study focuses on the relative contributions of the different sources of NMVOCs using positive matrix factorisation (PMF) and their associations with organic aerosols. Recently developed and extensively used receptor model PMF for source apportionment studies can identify physically relevant environment factors more robustly than other models (Paatero and Tapper, 1993, 1994). The present study also studied the influence of meteorological parameters such as temperature, relative humidity, and solar radiation on the diurnal and seasonal variation of NMVOCs. A specific goal of this study is to distinguish between primary emissions and secondary formation of NMVOCs. Moreover, the contribution of different sources of NMVOCs to ozone and secondary organic aerosol formation is also estimated. The key highlight of the study is its comprehensive coverage of about 173 species of NMVOCs in the city of Lucknow for two seasons. To our knowledge, 173 different species of NMVOCs have not been reported elsewhere in India. The insights from the results of the study would help the authorities channel the strategies for controlling NMVOCs and forming secondary pollutants (ozone and SOA).
2.1 Sampling site description
The sampling site ( N, E) is marked as a red triangle in Fig. 1. It is located in the city of Lucknow at a height of ∼ 12 m above the ground of the Uttar Pradesh Pollution Control Board (UPPCB) office building in Gomti Nagar. Residential buildings, office complexes, schools, big parks, and commercial spaces surround the sampling site. The industrial and manufacturing plants within and around the city are related to steel metal components and fabrication, automobile parts, chemical industries, and food and agro-based and handicraft sectors (chikankari, zardozi, bone craft). The industrial map of Lucknow and the nearby districts with major/mini-industrial areas, large-/medium-scale industries, sewage treatment plants, solvent-based industries, sugar mills, pharmaceutical industries, and power plants is also shown in Fig. 1. The measurements of NMVOCs were conducted using a PTR-ToF-MS (Ionicon Analytik GmbH) from 18 December 2020 to 5 May 2021, covering the winter and summer seasons. The study period is divided into two seasons according to the classification by the IMD (Indian Meteorological Department) as winter (December–February) and summer (March–May). The gaps in the sampling period from 3–8 January and 21 March–9 April were due to maintenance and calibration of the instrument. The average daily temperature was ∼ 28 ∘C over the whole study period in the city. The mean daily temperature during winters (December–February) was around ∼ 25 ± 2.5 ∘C and during summers (March–May) around 32 ± 3 ∘C. The relative humidity ranged from 64 ± 14 % during winters to 42 ± 11 % during summers. The comparison of temperature and relative humidity changes during both seasons are shown as box plots in Supplement Fig. S1. These values are based on the days when NMVOC measurements exist. The pre-dominant wind direction was south-south-east during the colder periods and south-west during the warmer periods, as shown in Supplement Fig. S1. The wind speed is relatively calmer during the winters than in the summers. All the instruments were placed inside a temperature-controlled laboratory during the campaign. Detailed descriptions of the instruments can be found in the subsequent sections.
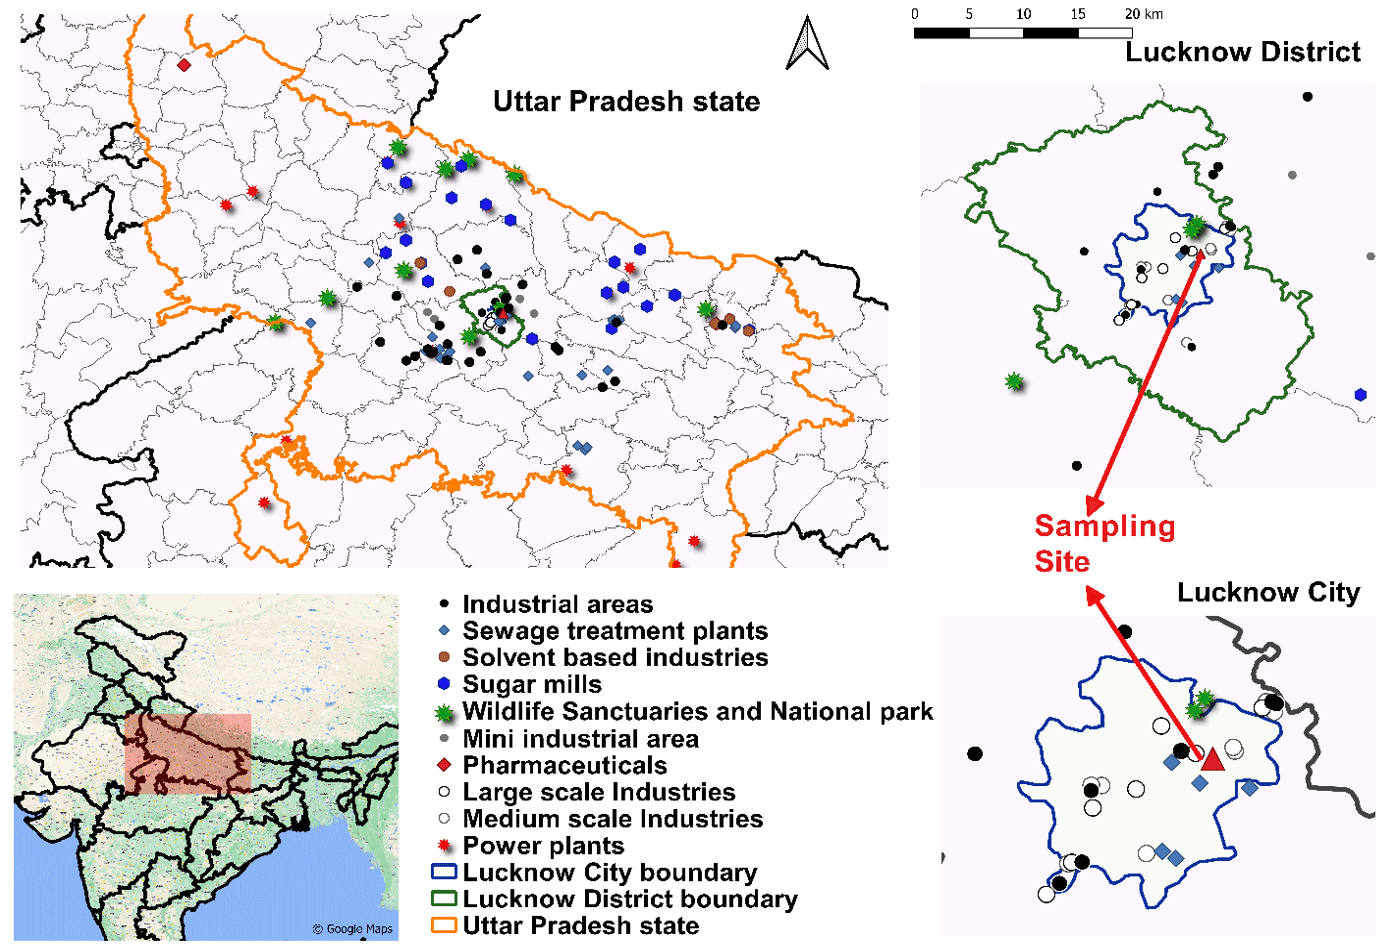
Figure 1Detailed map of (a) Uttar Pradesh, (b) Lucknow district and (c) the city of Lucknow with the highlighted sampling site and major potential point sources of NMVOCs.
2.2 PTR-ToF-MS measurements of NMVOCs
The PTR-ToF-MS is widely used for measuring NMVOCs with high mass resolution and sensitivity. A detailed description of the instrument can be found in other studies (Jordan et al., 2009; Graus et al., 2010; Tripathi and Sahu, 2020; Tripathi et al., 2022), while a brief description is given here. The PTR-ToF-MS is based on the chemical ionisation method, facilitated by proton-transfer reactions with hydronium (H3O+) ions as the primary reactant ion, which causes much less fragmentation of organic molecules in the sampled air. The natural components of air (nitrogen, oxygen, hydrogen, carbon dioxide, argon) have a lower proton affinity than water molecules. They thus do not react with H3O+, while most VOCs have a higher proton reactivity than water, facilitating non-dissociative proton transfer. These H3O+ ions are generated with high efficiency (∼ 99.5 %) through a hollow cathode discharge source, and then these reactant ions enter the adjacent drift tube section. The sampled air is also injected into the drift tube section, where proton-transfer reactions between hydronium ions [H3O+] and neutral VOCs [RiHj] occur to form protonated product VOC ions [RiHj+1] and water molecules [H2O] as shown in Eq. (1). These [RiHj+1] then enter the orthogonal acceleration reflectron time-of-flight mass spectrometer via a specially designed transfer lens system (Jordan et al., 2009).
The parameters of the drift tube of the instrument were maintained at 2.2–2.4 mb, 60 ∘C, 600 V, 130 Td for pressure, temperature, voltage, and electric field (, where E is the electric field strength and N is the gas number density), respectively, and operated with a time resolution of 30 s. Typically, these or similar values have been observed as most suitable for ambient air measurements of NMVOCs (Blake et al., 2004, 2009). During the study, the PTR-ToF-MS instrument's inlet was connected to a Teflon PFA (perfluoroalkoxy) tube (1.5 m in length) for drawing air samples at a flow rate of 60 mL min−1. The inner diameter of the tube was 0.75 mm, and the residence time of the air in the inlet was less than 1 s. The PTR-ToF-MS can identify hydrocarbons (HCs) and oxygenated VOCs at sub-ppb levels within 1 s (Graus et al., 2010; Müller et al., 2012). In this study, the PTR-ToF-MS measured 173 NMVOCs ( 31.018 to 197.216) at the sampling site. The reaction rates (k) of the ions were applied from the literature (Cappellin et al., 2012). A rate constant of 2 × 10⁻⁹ cm3 s−1 was assumed for all ions whose reaction rates (k) were not available in the literature (Smith and Spanel, 2005). The overall uncertainties were in the range of 8 %–13 % in the calculations of the mixing ratios of VOCs present in the standard mixture. The cause of uncertainties in calculating VOC mixing ratios includes the uncertainties in the mass flow controllers (MFCs) of a gas calibration unit (GCU) and the standard mixture (±5 %–6 %). The reaction rates (k) of the ion were applied from the literature (Cappellin et al., 2012). A rate constant of 2 × 10⁻⁹ cm3 s−1 was assumed for all ions for which reaction rates (k) were not available in the literature. Hansel et al. (1999) and Steinbacher et al. (2004) reported up to 30 % uncertainty in the calculations of the mixing ratios of VOCs due to the k reaction rate. The calibration of the instrument was performed at the start, middle, and end of the campaign using a certified standard gas mixture (L5388, Ionicon Analytik GmbH Innsbruck, with a stated accuracy of better than 8 %) containing ∼ 1.0 ppmv of VOCs. A detailed description of the calibration set-up, including zero measurements, is given in the previous studies (Jain et al., 2022; Tripathi et al., 2022) and in Supplement Fig. S2. For method detection limits (MDLs), we have calculated the MDL using 3σ (standard deviation) of the zero air of 20 min time duration data points. The exact mass-identified chemical formula and the family of species of the observed NMVOCs (173 in number) are given in Table S1 in the Supplement. The mixing ratios of these measured 173 NMVOCs are averaged over the study period and compared in the box plots as shown in Fig. S3. The three most-abundant NMVOC species are observed to be acetaldehyde, acetone, and acetic acid.
2.3 HR-ToF-AMS measurements of NR-PM2.5
A HR-ToF-AMS (Aerodyne Research Inc., USA) was also deployed for campaign measurements. A HR-ToF-MS (Decarlo et al., 2006) measures size-resolved mass spectra of non-refractory PM2.5 (NR-PM2.5) with a high time resolution (2 min). A detailed description of the instrument can be found in other studies (Lalchandani et al., 2021; Shukla et al., 2021) and is explained briefly here. The ambient aerosol particles were sampled through the PM2.5 cyclone (BGI, Mesa Labs, Inc.), which gets transmitted through stainless-steel tubing (∼ 8 mm inner diameter and ∼ 10 mm outer diameter) with a maintained flow (0.08 Lpm). This set-up is further connected to a Nafion dryer (MD-110-144P-4: Perma Pure, Halma, UK) to reduce moisture content and is then connected to the instrument's sampling inlet. The ambient aerosols enter the aerodynamic lens through a sampling inlet (100 µm-diameter critical orifice) and focus on a narrow beam. This particle beam then enters a sizing chamber, where it can be sorted based on its size. This size-resolved beam enters the vaporisation chamber, and the non-refractory part of the particles (NR-PM2.5) vaporises at 600 ∘C and ∼ 10−7 Torr. These gaseous molecules are then ionised and detected by a ToF-MS, depending on their ratio. The HR-ToF-AMS was operated in the high-sensitivity V mode for two cycles of 60 s (total 2 min), regularly switching between MS and PToF mode for 30 s each. During the study period, the particle-free air was provided for 1–2 h every week to check and correct the fragmentation table at s 12, 16, 18, 29, 33, 40, and 44. The IE (ionisation efficiency) calibrations were performed at the start, middle, and end of the campaign study following the mass-based method (Jayne et al., 1998, 2000) with an SMPS (scanning mobility particle sizer) unit (TSI Inc.). The raw data from the HR-ToF-AMS were analysed for unit mass resolution (UMR) and high resolution (HR) using the SQUIRREL (version 1.59) and PIKA (version 1.19) toolkits in the Igor Pro software (version 6.37). The NR-PM2.5 is chemically categorised into organics (Org), nitrates (NO3), sulfates (SO4), and chlorides (Cl). The organic aerosol mass spectra obtained from HR analysis and UMR analysis were combined from 12 to 300 (∼ 422 ions) to make the input matrix for PMF analysis. The PMF analysis was performed using the ME-2 engine implemented in SoFi Pro (Source Finder, Datalystica Ltd., Switzerland) (Canonaco et al., 2013, 2021) in the graphical interface software Igor Pro version 6.37 (Wavemetrics, Inc., Portland). The detailed analysis and results of the PMF of NR-PM2.5 are given in other studies (Lalchandani et al., 2021; Tobler et al., 2020; Talukdar et al., 2021), beyond the scope of this paper. In brief, the organic aerosol (OA) mass spectra from the HR-ToF-AMS were explained by five factors, consisting of one hydrocarbon-like organic aerosol factor (AMS_HOA), two solid fuel combustion factors (AMS_SFC/BB and AMS_SFC/OA), one more-oxidised oxygenated OA (AMS_MO-OOA), and one low-oxidised oxygenated OA (AMS_LO-OOA).
2.4 Supporting measurements
An Aethalometer (Magee Scientific, model AE-33) was also deployed at the campaign site to measure the real-time black carbon (BC) mass concentrations. It collects the aerosol particle samples on the quartz filter tape and quantifies the optical attenuation at seven different wavelengths (370, 470, 520, 590, 660, 880, and 950 mm) with high temporal resolution (1 min). It is based on a dual-spot technique for loading corrections (Drinovec et al., 2015). The change in optical attenuation measurements in the selected time interval at 880 nm is converted to equivalent BC (eBC) measurements using the mass absorption cross section (MAC) of 7.77 m2 g−1 (Drinovec et al., 2017, 2015). Using the enhanced absorption of biomass burning aerosols in the near-ultraviolet and blue wavelength ranges, the Aethalometer's multi-wavelength BC data may be apportioned into biomass burning and traffic combustion sources (Sandradewi et al., 2008; Zotter et al., 2017). The model employs an absorption Ångström exponent (AAE) value that corresponds to both vehicular and biomass combustion as the primary sources of light-absorbing particles. In this study, the AAE values of 0.9 for traffic and 1.5 for biomass burning emissions are based on previous studies (Tobler et al., 2020; Lalchandani et al., 2021). More details about the instrument can be found in the previous studies (Lalchandani et al., 2021; Shukla et al., 2021). The sampling site (building) is a part of the national Central Ambient Air Quality Monitoring Stations (CAAQMS). The meteorological parameters (temperature, relative humidity, wind parameters) and concentrations of trace gases (NO2, SO2, ozone) are downloaded from the CAAQMS dashboard (https://app.cpcbccr.com/ccr/#/caaqm-dashboard-all/caaqm-landing, last access: 15 July 2022) managed by the Central Pollution Control Board (CPCB), the government of India for Gomti Nagar station, Lucknow.
2.5 Source apportionment
Numerous receptor models have been used to analyse the dynamic behaviour of ambient aerosol measurements and relate it to physical sources. One of the recently developed algorithms, PMF (Paatero and Tapper, 1994), has been explored by numerous studies to apportion the measured bulk composition and temporal variation of aerosols (Zhang et al., 2011; Talukdar et al., 2021). The PMF algorithm is a non-negative, symmetrical factor analytic technique that produces unique factorisation by iterative re-weighting of individual data values and unique solutions. It solves the common bilinear equation, given as (Eq. 2):
where X represents the measured matrix, G and F are unknown matrices, and E is the error/residual matrix. The m and n represent the time series and individual mass dimensions, and p is the number of factors. The calculated quantities G and F represent time series and profiles of the specific factor of the model solution, respectively. The ME-2 solver decreases the rotational ambiguity and fits the G and F entries to minimise the uncertainty in quantity “Q”. This Q is the sum of the squared residuals weighted by their respective uncertainties, as given in Eq. (3). From the equation, it can be inferred as a normalised chi-square metric, where eij represents the residual matrix of E and σij represents measured data uncertainties.
Another quantity, Qexp, the degree of freedom, depends on the dimensions of the matrix and the number of factors. In an ideal case, the ratio of is expected to be 1, with all the elements of the measured matrix and uncertainties well-defined. However, it has been noticed in earlier studies that the absolute value of the ratio, , is not always equal to 1 due to errors in measured data uncertainties, transient sources, and unknown model residuals. It is recommended to use the relative change in this ratio and characteristics of the physical source while choosing the optimum factor solution (Paatero and Tapper, 1993, 1994). In this study, this algorithm is applied over the measured NMVOC mass spectra using ME-2 (a multi-linear engine) (Paatero, 1999) over SoFi Pro (Source Finder, Datalystica Ltd., Switzerland) (Canonaco et al., 2013) in a graphical interface software Igor Pro version 6.37 (Wavemetrics, Inc., Portland). Earlier studies applied a similar PMF algorithm over mass spectra of 90 NMVOCs in Delhi (Jain et al., 2022; L. Wang et al., 2020) and 101 NMVOCs in Beijing (L. Wang et al., 2021). In this study, for the first time, we have included 170 NMVOCs measured by the PTR-ToF-MS from 42.034 to 197.216. The input and the residual error matrix for the PMF analysis were prepared using time series of mass spectra and calculated individual errors for each data point, as explained in the previous study (Jain et al., 2022). After incorporating the calibration factors, the uncertainties or the residual error matrix are estimated by multiplying the peak area by the correction matrix. The total uncertainties vary in the range of 8 %–12 % during calculations of the mixing ratios of NMVOCs. The three most-abundant NNMVOCs are not included in the PMF analysis due to their high signal-to-noise ratios and relatively higher (about 5–15 times) concentrations than other NMVOCs, as shown in Fig. S3. The pre-treatment of the input matrix also includes applying a minimum error threshold. The weak variables, with a signal-to-noise ratio of < 2, and bad variables, with a signal-to-noise ratio of < 0.2, are down-weighted by 2 and 10, respectively (Paatero and Hopke, 2003; Ulbrich et al., 2009).
The PMF algorithm calculates factor profiles, unlike the chemical mass balance (CMB) receptor model. The most crucial decision for the interpretation of the findings of the PMF is selecting the optimum modelled number of factor solutions. This is achieved by applying several mathematical metrics, correlating with external measurements, and interpreting the physical sources. The ratio of is first examined for every factor solution. The factor solution with an absolute value of the ratio near 1 indicates an accurate estimation of errors, and it should be selected but not observed for real observations. The and ≪1 indicate underestimation and overestimation of errors or variability in the factor solution, respectively. It is anticipated that Q will drop with each addition of the number of factors, as this introduces extra degrees of freedom to improve the fit of the data. Another important metric is the evaluation of scaled residuals in the time series and mass spectra. The scaled residuals ±3 for each data point in the time series are considered evidence of a good solution (Paatero and Hopke, 2003; Canonaco et al., 2021). Figure S4 shows the scaled residuals over the time series and diurnal cycle for the 3–10-factor solution. In the present study, the does not lie near 1, but the high percentage change in the is observed while examining three- to five-factor solutions, as shown in Fig. 2. The total scaled residual of all species is calculated and plotted for different factors in Fig. 2. The changes in the residuals and the drops in indicate that the five-factor solution is an optimum solution. This solution is further analysed regarding their mass spectral features, time series, and correlation with external tracers (Org, NO3, SO4, Cl from NR-PM2.5, organic resolved factors, gases (O3, NO, NO2, NOx, SO2), temperature, relative humidity (RH), wind direction (WD), wind speed (WS), and BC concentrations).
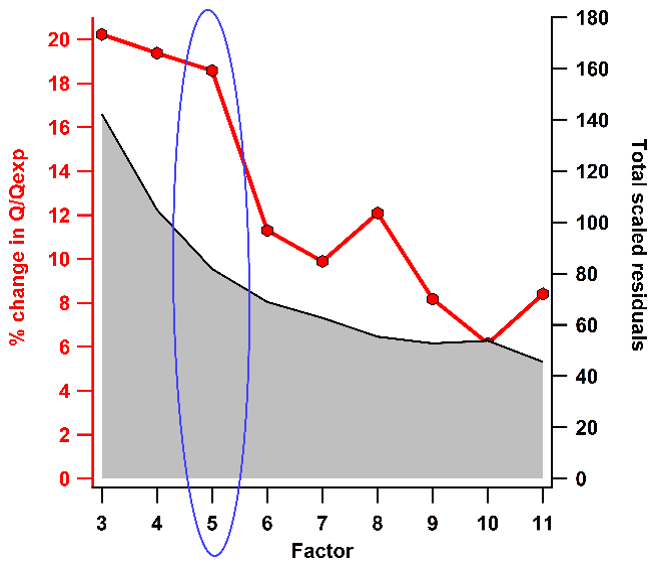
Figure 2The plot (percentage change) and total summed scaled residuals for each factor solution.
The optimum factor solution from the PMF analysis was further refined by self-constraining the secondary volatile organic compound (SVOC) factor with random values varying from 0.1 to 1 with delta a=0.1. Finally, a=0.3 was chosen as the optimum solution after examining the temporal and diurnal variation of the factor. More details about the constraint of the solution are explained in Text ST1 in the Supplement. Further, the uncertainty of the selected solution is quantitatively addressed by bootstrap analysis (Davison and Hinkley, 1997; Paatero et al., 2014), a module available in SoFi Pro (Canonaco et al., 2021), as explained in Text ST2. Previous studies have also followed this methodology for uncertainty estimation of organic aerosol source apportionment (SA) results (Lalchandani et al., 2021; Tobler et al., 2020; Shukla et al., 2021; Lalchandani et al., 2022), elemental aerosol SA results (Shukla et al., 2021), and VOC SA results (L. Wang et al., 2021; Jain et al., 2022; Stewart et al., 2021c). The uncertainty or PMFerror is observed as 1 % or less for all the factors (Fig. S5). This implies that the five-factor solution is a statistically robust solution with rather low uncertainty.
2.6 Ozone formation potential and SOA yield of NMVOCs
Ozone formation potential (OFP) is a reactivity-based estimation technique to assess the sensitivity of the VOCs for ozone formation (Carter, 2010, 1994). Numerous VOCs are emitted into the atmosphere from various sources, followed by distinct reaction pathways, and have different OFPs. The calculated reactivities of VOCs have been investigated in multiple modelling studies depending on the environmental conditions (Carter, 1994a). This approach is based on calculating OFPs using maximum incremental reactivity (MIR) values for individual VOC species, reported and updated by Carter (2010). MIR values are calculated as the change in the ozone formed by adding a VOC to the base case in a scenario with adjusted NOx concentrations. The OFP of individual VOCs is estimated using Eq. (4). Here, this equation is adopted (Carter, 2010, 1994) and modified for this study to calculate the ozone formation potential for each of the factors, resolved from PMF analysis as given below (Eq. 5):
where OFP(j) and OFP(i) represent the ozone formation potential for an individual VOC(j) and a factor number (i), respectively, expressed in micrograms per cubic metre. [VOCj] represents the mixing ratio (ppbv) of a given VOC ion (j), Cj is the number of carbon atoms present in each VOC ion (j), and RCji is the relative contribution of VOC ion (j) to the factor (i). MIRj is the maximum incremental reactivity of a VOC ion (j). The MIRj values are adopted from Carter (2008, 2010, 1994a). The above equation is used to compute the OFP for each factor and to determine which source factor contributes the most to ozone generation, as explained later. The MIR values are available for a limited number (40) of NMVOCs given in Table S2. The NMVOCs without reported MIR values are not considered for OFP estimation.
The chemical pathways and reaction products involved in SOA formation from NMVOCs are poorly understood or even unknown. Estimation of SOA formation (SOA yield) has been largely constrained to indirect methods due to the complexity of the chemical matrix of organic aerosols and the lack of direct chemical analysis methods. Numerous studies have estimated SOA yield from different species involving computer modelling and chamber experiments (Zhang et al., 2017). The smog-chamber studies help estimate the value for SOA yield as more reliable as they mimic the actual scenarios. These parameters also helped in improving model parameterisation and SOA mitigation strategies. For the current study, the contribution of an individual NMVOC species to SOA is estimated by multiplying the SOA yield by the concentration of the NMVOC species in the atmosphere (amount available for the reaction), as shown in Eq. (6). The SOA yields YSOA(j) reported by Bruns et al. (2016) were used for this analysis. The compounds for which SOA yields values are not available from the literature directly, and it is estimated that compounds with more than six carbon atoms (C >6) will have the same SOA yield of 0.32 (Bruns et al., 2016). Based on their structure, the compounds (C >6) are considered to contribute significantly to SOA (Bruns et al., 2016). The average value (0.32) of the published SOA yield of 18 compounds (C > 6) is used. In this study, the individual SOA yield values considered are given in Table S3. The contribution of the individual factor to SOA formation is also estimated using Eqs. (6) and (7) as given here.
CSOA(j) and CSOA(i) represent the contribution to SOA formation for an individual VOC(j) and a factor number (i), respectively, expressed in micrograms per cubic metre. VOCj represents the concentration (µg m−3) of a given VOC ion (j), and RCji is the relative contribution of VOC ion (j) to the factor (i). YSOA(j) is the SOA yield of VOC ion (j). This analysis represents the estimated OFP and SOA formation potential of the air mass composition at the sampling site, not the actual OFP and SOA formation potential from various sources. This means that air masses dominated by fresh emissions (e.g. traffic) will have different OFP and SOA formation potentials than those in aged air masses (e.g. long-range transport of BB plumes) or any other source.
2.7 Concentration-weighted back-trajectory analysis
Concentrated-weighted back-trajectory (CWT) analysis determines the originating source and transport of air parcels at the receptor location within a specific period (Seibert et al., 1994; Draxler et al., 1998). The HYSPLIT model (v4.1 Hybrid Single-Particle Lagrangian Integrated Trajectory) was used to perform the CWT analysis (Draxler et al., 2018; Stein et al., 2015). The 72 h back trajectories with a 3 h time interval at 100 m of arrival height above the ground were calculated using monthly GDAS (Global Data Assimilation System) files (ftp://arlftp.arlhq.noaa.gov/pub/archives/gdas1, last access: 15 July 2022) with a 1∘ × 1∘ resolution. The estimated back trajectories (BTs) were weighted with VOC factor time series and averaged over 3 h intervals using a CWT model to locate air masses based on their concentrations. ZeFir (Petit et al., 2017), an IGOR-based interface, was used to construct the CWT graphs, as shown in Fig. S6.
3.1 NMVOC concentration and temporal variation
The average daily concentration of measured NMVOCs during the study period was 125.5 ± 37.5 ppbv. Figure 3 shows the daily time series and monthly mean concentrations of NMVOCs, inorganic and organic fractions of NR-PM2.5, O3, NOx, SO2, temperature, relative humidity, wind speed, and wind direction. Out of 173 detected NMVOCs, the levels of three major species (acetaldehyde, acetone, and acetic acid) were present 5–15 times higher than for other species, as shown in Fig. S3. The monthly averaged concentrations of NMVOCs were higher during the winter months from December (193.7 ppbv) to January (110.2 ppbv) till February (109.7 ppbv) than during the summer months March (101.2 ppbv), April (137.8 ppbv), and May (150.8 ppbv). The averaged concentrations of NMVOCs (127 ± 40 ppbv), as well as NR-PM2.5 (inorganics and organics) (102.8 ± 51 µg m−3), were higher during the winter months. The calm conditions and relatively lower planetary boundary layer during winters have slowed down the dispersion of the pollutants. In contrast, NR-PM2.5 (39.8 ± 20 µg m−3) decreased drastically during the summer months, but NMVOC concentrations (122 ± 32 ppbv) were similar to winters. This may be due to high temperatures during warmer periods leading to more photo-oxidation of primary VOCs (Sahu et al., 2017), production of biogenic VOCs (Sahu et al., 2017; Baudic et al., 2016), and evaporation of volatile household products (M. Qin et al., 2021), while aerosol particles managed to disperse in the atmosphere due to the high planetary boundary layer and windy conditions. The difference in the emission sources' characteristics during both seasons may have also played an important role. During the winter, the PM2.5 is exceeded on more days than the National Ambient Air Quality Standards (NAAQS). PM2.5 exceeds standards more frequently than ozone. On approximately 80 % of the days during the whole study period, PM2.5 exceeds the NAAQS in the city, as shown in Fig. 3.

Figure 3Daily averaged time series of acetaldehyde, acetone, and acetic acid, other NMVOCs, PM2.5 and its organic fraction, NO2, SO2, O3, temperature, relative humidity, and wind speed and direction.
The three most-abundant NMVOCs were not considered in the PMF analysis, as explained in Sect. 2.5. The remaining 170 NMVOCs, considered for the PMF analysis, varied from 42.034 to 197.216. The average concentration of these 170 NMVOCs was 79.3 ± 30.6 ppbv. The average concentration during winters was 86.7 ± 35 ppbv, a bit more than during summers at 68.3 ± 17.2 ppbv. These NMVOCs belong to different families based on their chemical composition. They are categorised as aromatics (Ar_CxHy), simple non-aromatics (N_CxHy), furans, phenols, and oxygenates: first-order (CHO1), second-order (CHO2), and third-order (CHO3), nitrogen-containing compounds (CxHyNz and CxHyNzOn), and others. The others include high-order oxygenates (CHO4) and some hydrocarbons (CxHy). The degree of unsaturation (i.e. the number of rings and/or double bonds) of more than 4 distinguishes aromatics (ArCxHy) from the CxHy family. This allowed us to identify important VOC markers, their families, and their role in their atmospheric chemistry. Overall, during the study period, the highest contributing family belongs to oxygenates and aromatics. The CHO1, CHO2, and CHO3 families were 28.8 % (∼ 20.1 ppbv), 16.8 % (11.7 ppbv), and 2 % (1.4 ppbv) of total NMVOC concentrations. The contributions from Ar_CxHy and N_CxHy were about 21.5 % (∼ 15 ppbv) and 10.6 % (∼ 7.4 ppbv), respectively. Nitrogen-containing compounds were relatively less present (5.6 % CxHyNz and 1.2 % CxHyNzOn); 6.3 % (∼ 4.4 ppbv) and 3.7 % (∼ 2.6 ppbv) were contributed by furans and phenols at the site, and the rest was included in the others (3.4 %). The CPCB notified the annual NAAQS only for benzene of 5 µg m−3 (∼ 1.6 ppbv), while the World Health Organization (WHO) recommended no safe level of exposure to benzene. The mean mixing ratio of benzene during the study period was found to be 2.9 ± 1.9 ppbv, which is around 2 times higher than the standard guidelines. Prolonged exposure or high short-term exposure to benzene adversely affects the health of citizens of the city due to its haematotoxic, genotoxic, and carcinogenic properties.
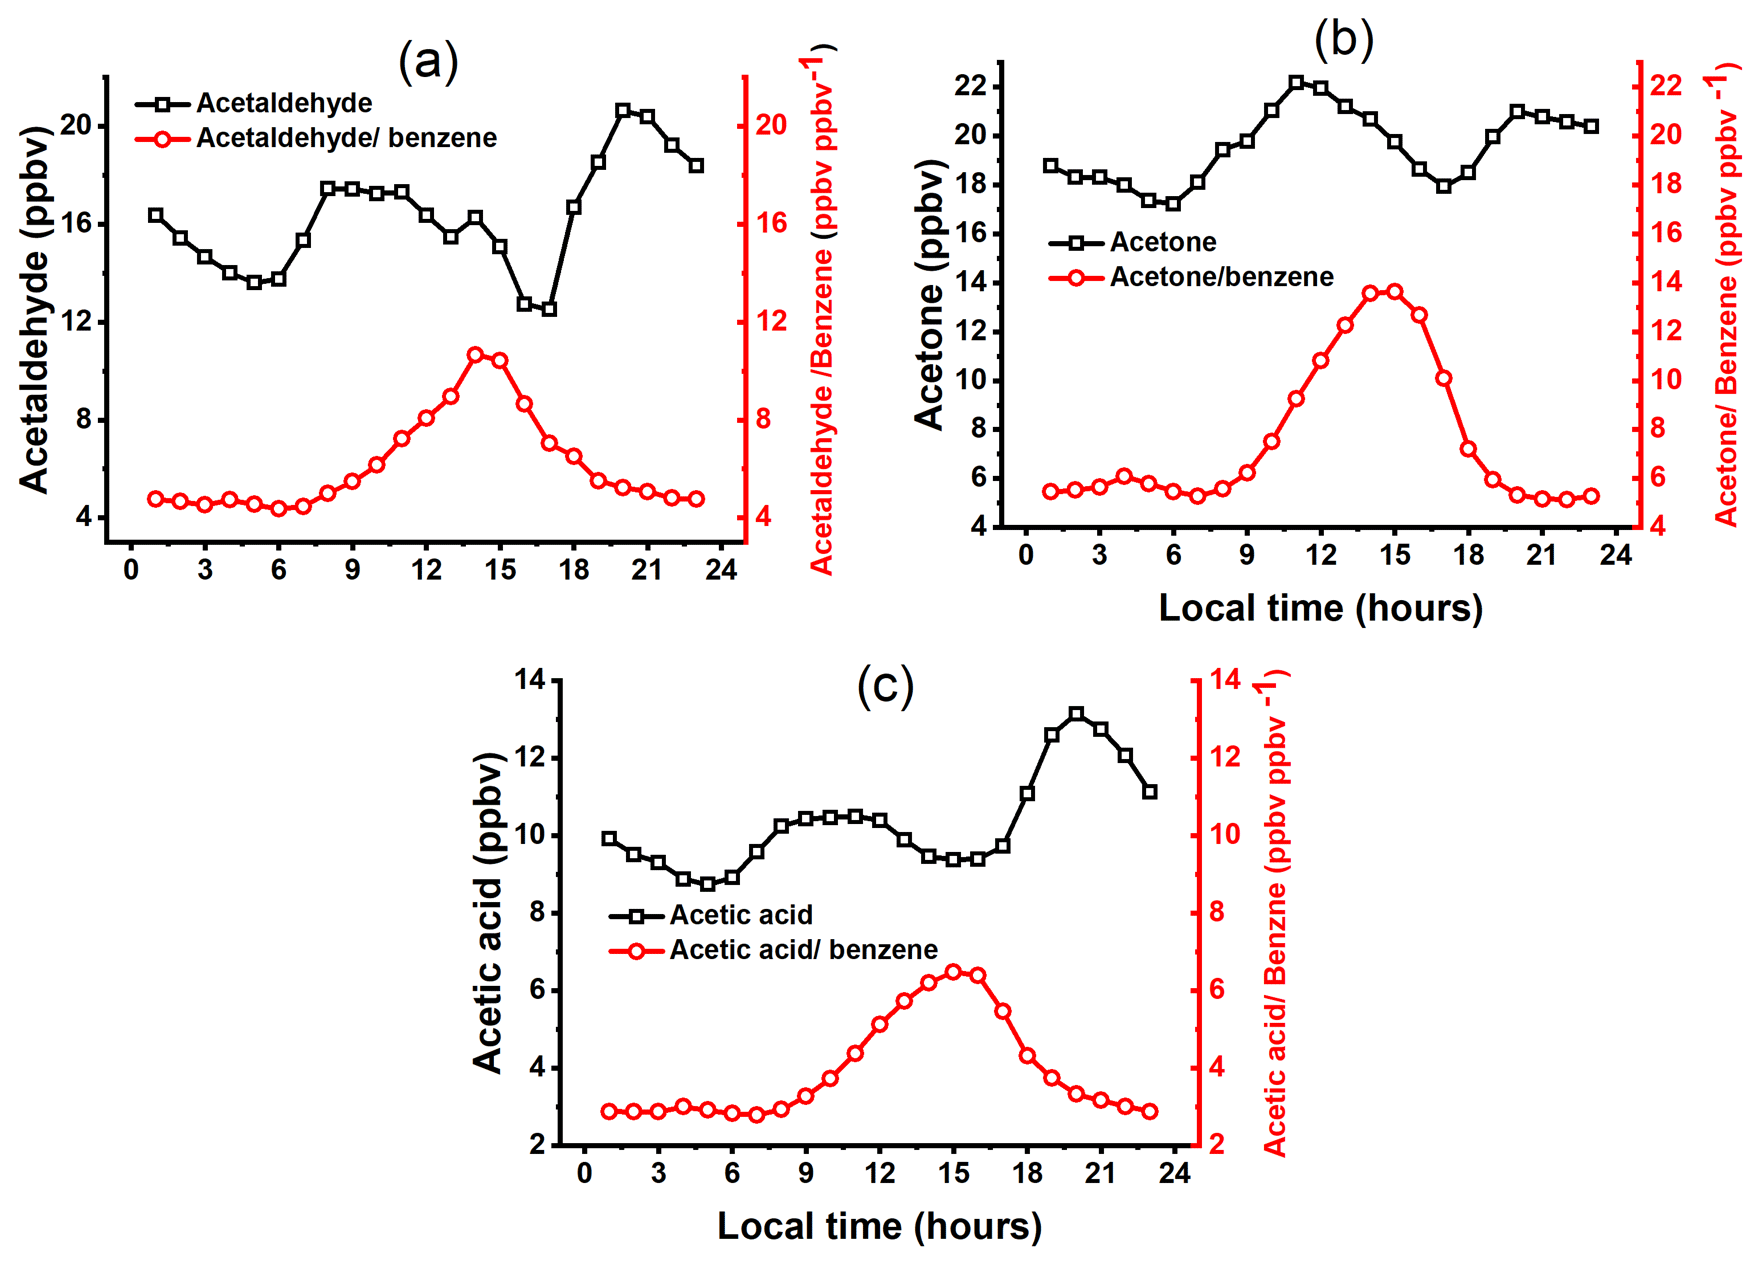
Figure 4Diurnal variations over the whole study period for (a) acetaldehyde and the acetldehyde / benzene ratio, (b) acetone and the acetone / benzene ratio, and (c) acetic acid and the acetic acid / benzene ratio.
All three abundant NMVOCs present at 45.034 (C2H5O, acetaldehyde), 59.049 (C3H7O, acetone), and 61.028 (C2H5O2, acetic acid) are OVOCs. The sources of these OVOCs could be direct emissions from biogenic and anthropogenic activities and the secondary/photochemical processes. Diurnal variations of secondary formation, anthropogenic emission levels, meteorological conditions, and planetary boundary layer heights influence OVOC benzene ratios (Sahu et al., 2017; Tripathi et al., 2022; Sahu et al., 2016) to some extent. The diurnal patterns of the acetaldehyde benzene, acetone benzene, and acetic acid benzene ratios are plotted to check the influence of biogenic and secondary sources (see Fig. 4a–c). All the OVOC benzene ratios are observed to increase during the daytime (10:00–18:00), similarly to temperature variation. This implies the influence of these compounds' photochemical formation and/or biogenic emissions. The elevated OVOC concentrations during the night confirm the influence of anthropogenic emissions.
Acetone and acetaldehyde are formed during photo-oxidation and ozonolysis of various terpenes and aromatic compounds emitted from multiple biogenic and anthropogenic sources (Lee et al., 2006a, b; S. Wang et al., 2020). Acetone plays a major role in ozone production. It can be transported to remote areas due to its long lifetime in the troposphere (∼ 15 d) (Seco et al., 2007). The average concentrations of acetone during winters, late winters, and summers were observed to be 13.6 ± 4.5, 15.3 ± 5.4, and 34.9 ± 10.3 ppbv, respectively. The observed concentrations of acetone in Lucknow are on the higher side of the range of measured concentrations in other Indian cities. The reported average concentrations of acetone in the present study are comparable to Delhi (whole year) at ∼ 16.7 ppbv (13–15 ppbv during winters) (Jain et al., 2022) but higher than Ahmedabad at 5.35 ± 1 ppbv during late winters (Sahu et al., 2016) and Mohali at 5.9 ± 3.7 ppbv during summers (Sinha et al., 2014). This shows the presence of more OVOCs in cities within the IGB region than in other cities of India.
Figures 4a and 3b show that the diurnal variation of acetaldehyde and acetone, respectively, starts increasing from 09:00 in the morning to 16:00 in the afternoon. The acetaldehyde and acetone had their morning maxima at around 10:00 and 11:00 LT, respectively, and later during the morning rush hours of vehicular emissions (08:00–10:00). This trend is similar to a previous study in Ahmedabad (Sahu and Saxena, 2015). It indicates the secondary formation of acetone and acetaldehyde from terpenes and aromatics emitted from vehicles. The OH reaction rate constant of the hydroxyl radical with acetaldehyde (15 × 10−12 cm3 molecule−1 s−1) is significantly higher than the reaction rate constant of the hydroxyl radical with acetone (0.17 × 10⁻¹² cm3 molecule−1 s−1), indicating faster degradation of acetaldehyde than acetone (Atkinson and Arey, 2003). Figure 4c shows the diurnal variation of acetic acid and the acetic acid benzene ratio. Acetic acid is one of the most abundant VOC species in the atmosphere globally, with a half-life of more than 1 d. It contributes to atmospheric acidity (Chebbi and Charlie, 1996) and is responsible for 30 % of the acidity of the wet deposition in polluted urban areas (Seco et al., 2007; Peña et al., 2002). This compound also has toxic effects on human health. Residential wood combustion is one of the critical sources of acetic acid (Bruns et al., 2017). High levels of acetic acid have also been reported from aged open biomass (hay and straw) burning plumes (Brilli et al., 2014), a variety of biomass fuels (Stockwell et al., 2015), and natural gas (Gilman et al., 2013). The average concentration of acetic acid during the whole study period is about 10.3 ± 4.1 ppbv, highest during winters at 15.2 ± 3.5 ppbv and lower during summers at 6.9 ± 2.1 ppbv. The observed increased concentrations of acetic acid in the winter and lower concentrations in the summer may demonstrate that its production is influenced by open biomass burning crops in nearby fields and residential wood combustion for heating and cooking purposes in Lucknow. The diurnal pattern of acetic acid concentrations shows high concentrations during the night, which implies its accumulation.
3.2 Characteristics of selected PMF factors
This section includes a discussion of the selection of the source apportionment solution and its interpretation. The NMVOC factors are identified based on their mass spectra, diurnal and temporal variation, and correlation with external tracers. For the first time, we have included mass spectra of 170 NMVOCs from 42.034 to 197.216 in the PMF analysis. The three abundant NMVOCs (compounds below 42) detected by PTR-ToF-MS, acetaldehyde, acetone, and acetic acid, are not included in the PMF analysis. Including these NMVOCs in the PMF analysis resulted in biased solutions where only these ions are well-explained. Additionally, a few small alkane and alkene (C1–C4) compounds, which are not detected by PTR-ToF-MS, are excluded from the PMF analysis. However, previous studies have found that these ions are minor contributors to SOA formation. Included compounds (above 42) are major contributors to SOA formation and dominant markers of various sources. As explained in Sect. 2.4, the optimum solution after the PMF analysis chosen is a five-factor solution. This selected five-factor PMF solution exhibits distinct mass spectral characteristics related to different sources and atmospheric processes. Figure 5 shows the intricate plots of the profile and the diurnal variation of the five-factor solution. The five factors are traffic, SFC 1 (solid fuel combustion), SVOCs, SFC 2, and VCPs (volatile chemical products) after thoroughly investigating markers, chemical species and their families, diurnal variation, and the relation to meteorological parameters and external measurements. The diurnal variation of the factors for two seasons (winter and summer) was compared, as shown in Fig. S7. The time series of the five factors resolved from NMVOC mass spectra are correlated with external measurements such as OOAs, BC concentrations, and CAAQMS data (WD, WS, RH, temperature, NO, NO2, NOx, SO2, O3), as given in Fig. 6.
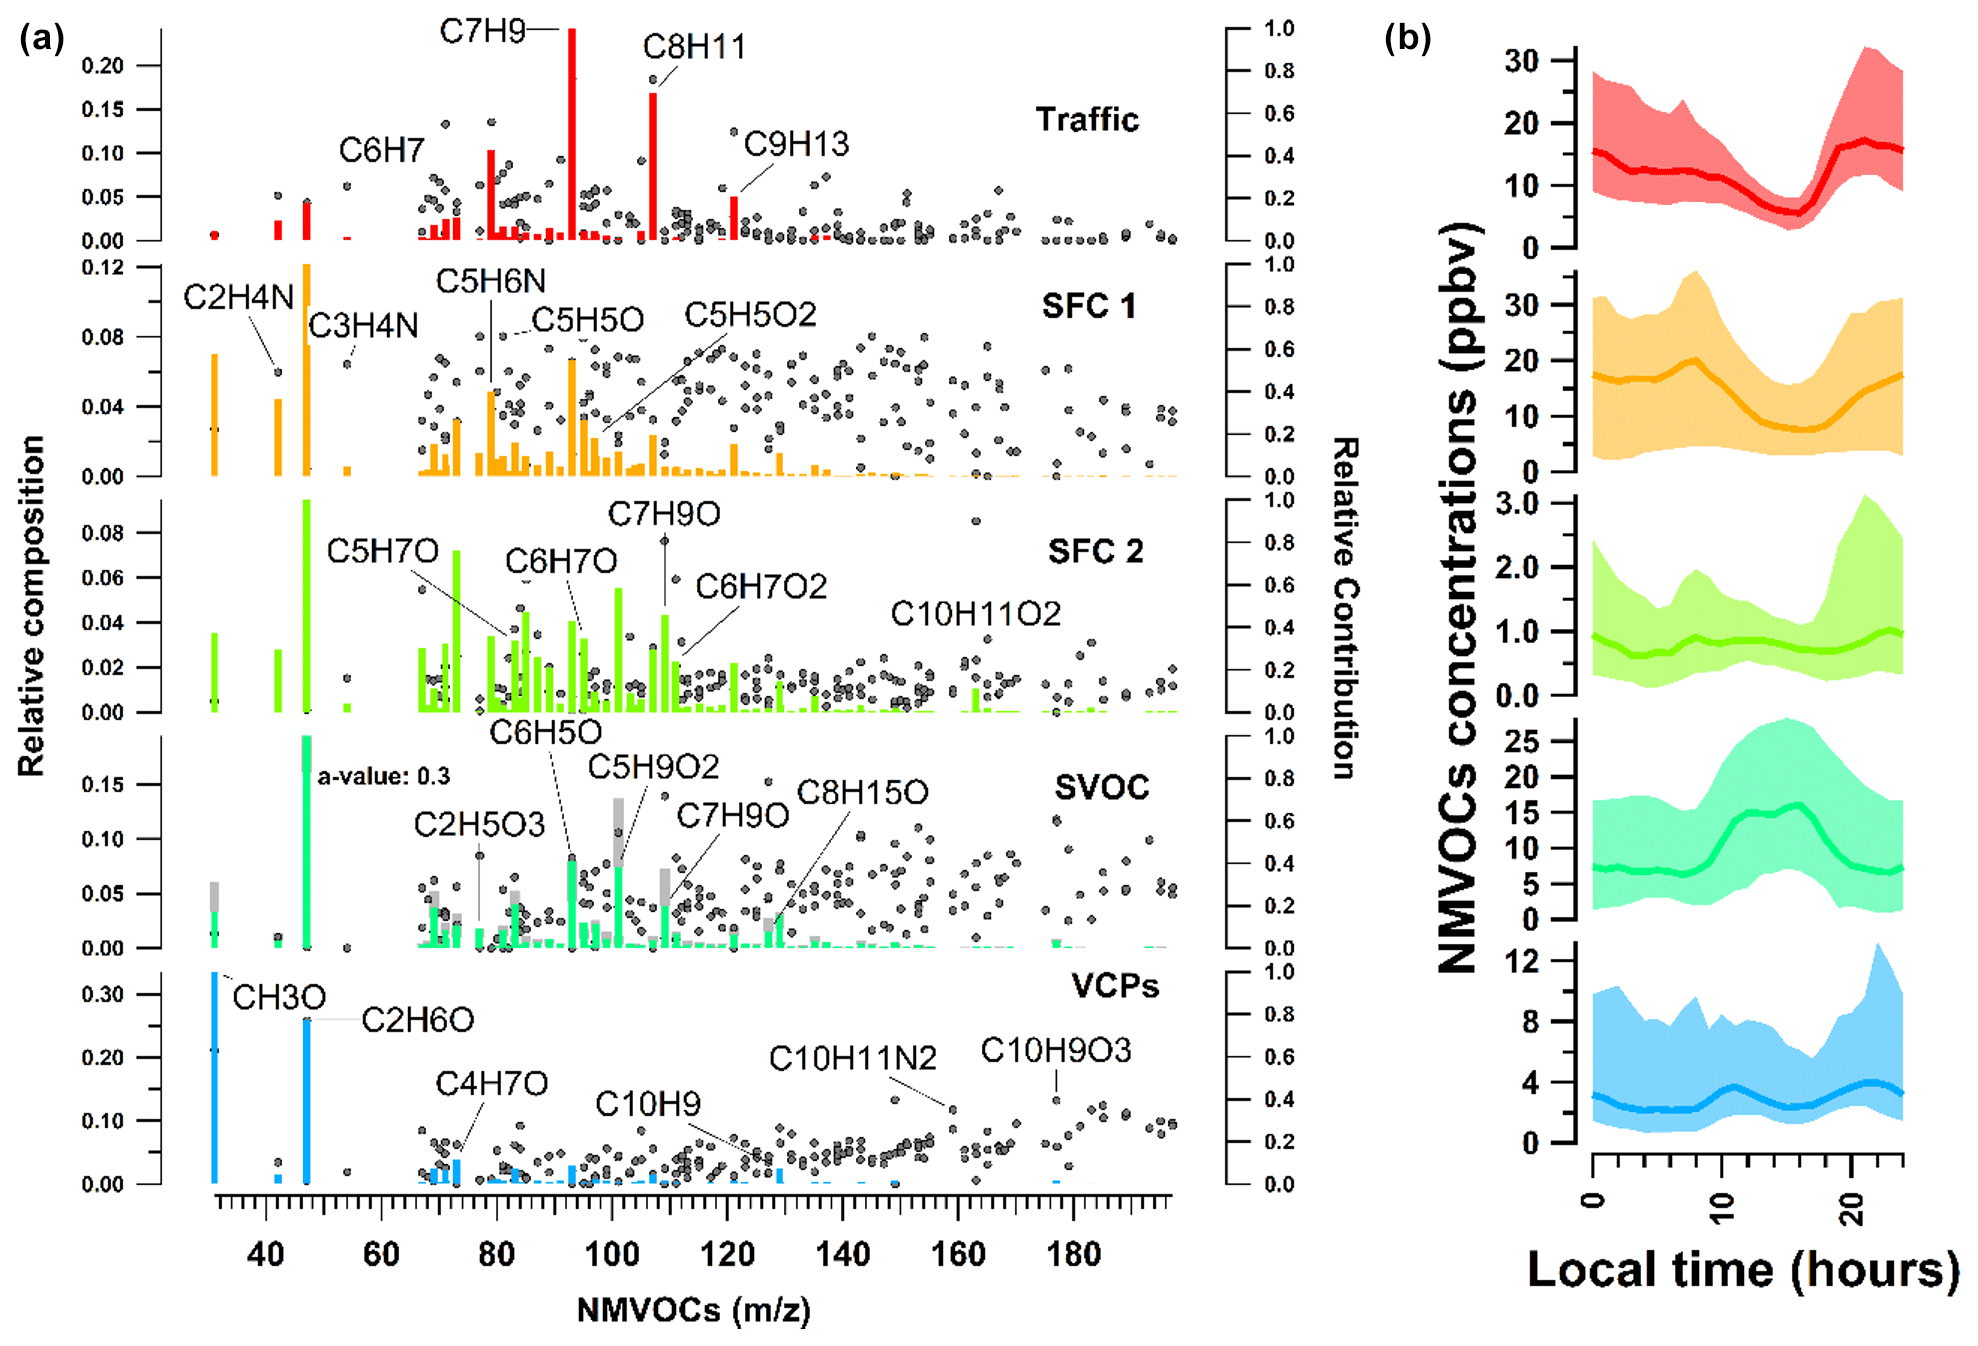
Figure 5Profile and diurnal variation of individual factors of the selected five-factor solution after PMF analysis at Lucknow for the whole study period. In panel (a), the left axis represents the relative composition of each factor, given by the vertical bars. The sum of all the bars at different for each factor is 1, and the right axis represents the relative contribution of each factor to a given , shown as grey dots. The grey bars in the SVOC factor represent the degree of constraint on the known source profile and time series. In panel (b) the middle dark line represents the median of the diurnal, while the shaded region represents the interquartile ranges from the 25th to 75th percentiles.
3.2.1 Factor 1: traffic
The first factor is identified as traffic. It is characterised by the presence of aromatics, such as benzene ( 79.053, C6H6H+), toluene ( 93.07, C7H8H+), xylene (107.09, C8H10H+), C9 aromatics (121.1, C9H10H+), and C10 aromatics (135.12, C10H14H+); 56 % of the total aromatics are explained by this factor, as shown in Fig. 7. The explained variation of individual NMVOCs, such as C6H6H+, C7H8H+, and C8H10H+, by the traffic factor is around 0.56, 0.77, and 0.76, respectively, as shown in Fig. 8a. The NMVOCs' traffic factor shows a temporal correlation (Pearson r2 ∼ 0.74) with nitrogen oxides (NOx), which is also an indicator of vehicular emissions (Fig. 6). Also, this factor has a good correlation (Pearson r2 ∼ 0.65) with the AMS_HOA (PMF-resolved factor from HR-ToF-AMS), as shown in Fig. 9a and b. This AMS_HOA factor is characterised (Lalchandani et al., 2021) by NMVOCs, NOx, and primary OA. These NMVOCs and the primary OA also exhibit similar temporal and diurnal variation, with sharp peaks during the morning and evening hours, as shown in Fig. S8. This diurnal pattern indicates the vehicular commute pattern in the city and the high density of vehicles on the roads during rush hours in the morning and evening. The diurnal pattern is compared between two seasons, winters and summers, and also shows a similar pattern in Fig. S7. The traffic factor in previous studies observed similar markers and diurnal patterns in Delhi (Jain et al., 2022; L. Wang et al., 2020) and Beijing (Wang et al., 2021), indicating a similar commute pattern in most of the urban cities. Other source-specific studies also identified similar markers for vehicular emissions (Cao et al., 2016; Caplain et al., 2006). The back-trajectory analysis of the factor (CWT graph), given in Fig. S6, shows the probable sources of traffic present near the sampling site.
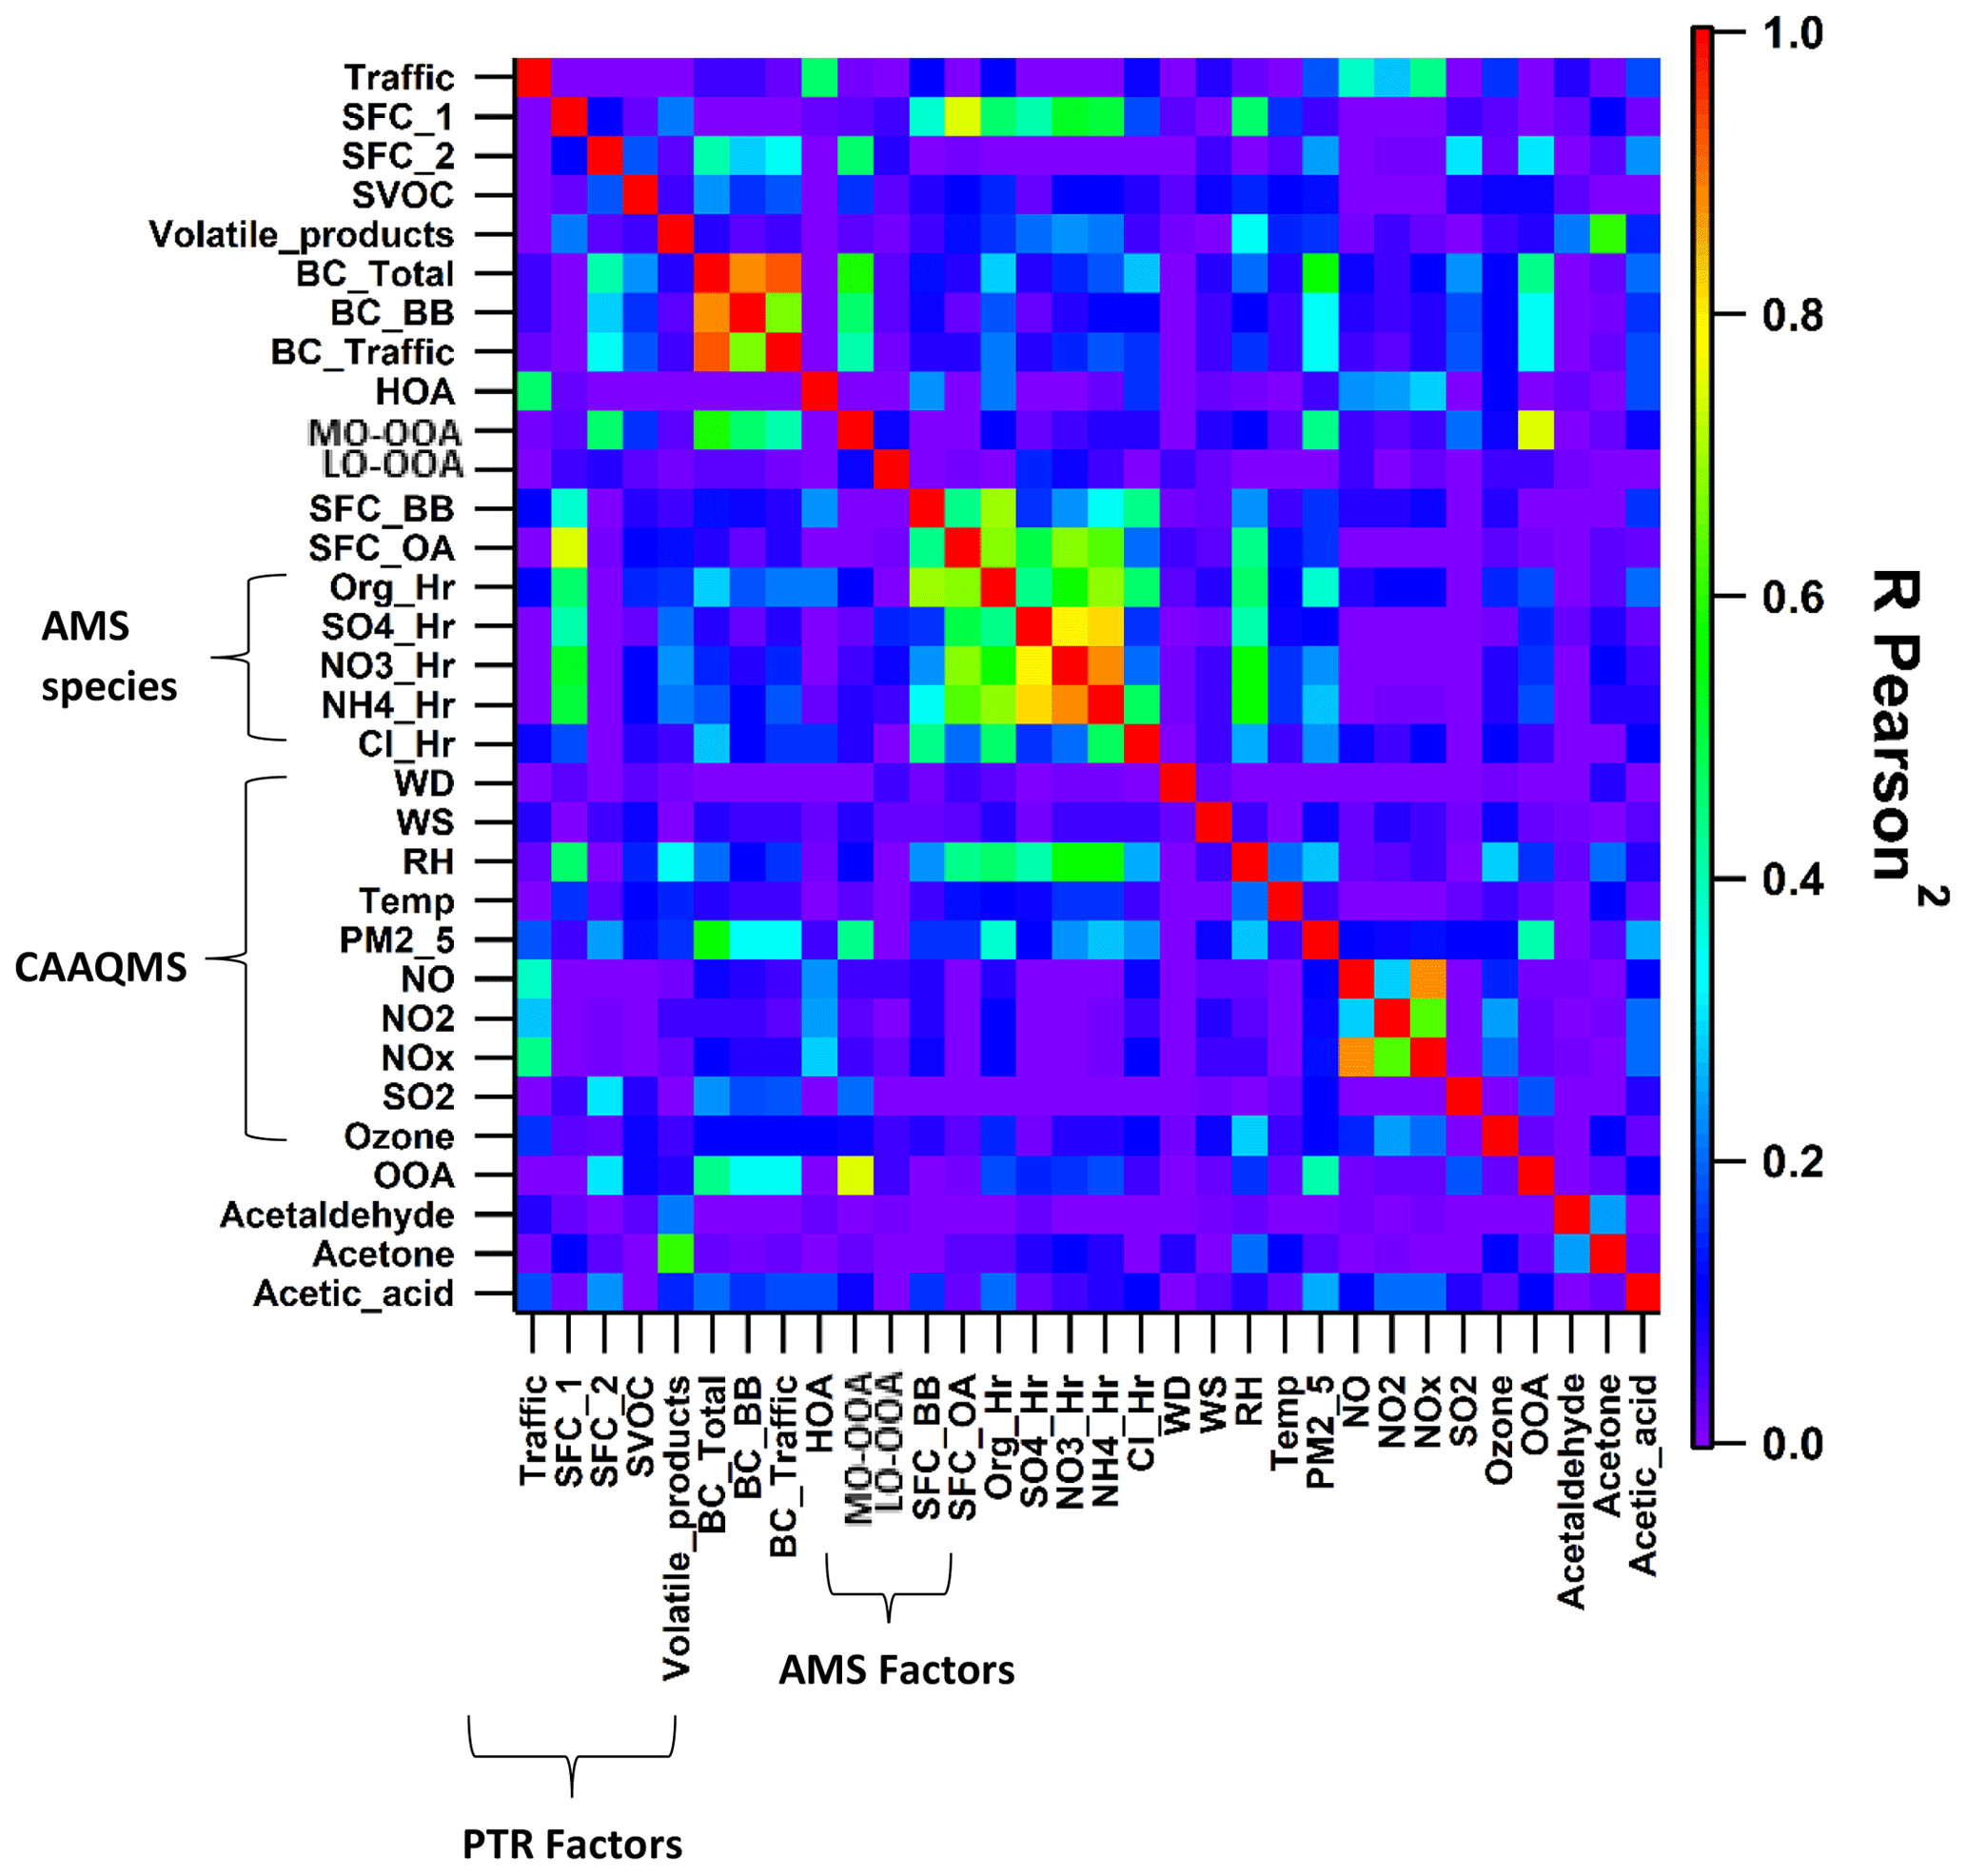
Figure 6Correlation of the five factors in the external measurements, including factors from AMS, organic NR-PM2.5 and inorganic NR–PM2.5, black carbon (BC total, percentage BC from fossil and non-fossil fuels), CAAQMS data, total oxygenated organic aerosols (OAAs), and VOC species. The CAAQMS data include wind direction (WD), wind speed (WS), relative humidity (RH), ambient temperature (temp), particulate matter (PM2.5), nitric oxide (NO), nitrogen dioxide (NO2), nitrogen oxides (NOx), sulfur dioxide (SO2), and ozone. The correlation between the time series of the parameters is represented by R Pearson2, colour-coded with a rainbow colour scheme, showing violet as 0 (no correlation) and red as 1 (highest correlation).

3.2.2 Factor 2: solid fuel combustion (SFC 1)
Another factor which is resolved is solid fuel combustion (SFC 1), with the highest contributions from furans and substituted furans (∼ 36 %) and nitrogen-containing compounds (34 %), as shown in Fig. 7. The prominent signals of acrylonitrile ( 54.034, C3H4N), furan ( 69.033, C4H5O), pyridine (80.054, C5H6N), furfurals (81.036, C5H5O), furaldehyde ( 97.027, C5H5O2), dimethyl furan (97.064, C6H9O), and C3H3N2O3 (115.012) also contribute to the factor's mass spectra as shown in Fig. 5a. This factor profile is characterised by the strong peak of acetonitrile ( 42.034, C2H4N) with an explained variation of about ∼ 0.49, as shown in Fig. 5b. Acetonitrile is considered a unique marker of biomass burning (Holzinger et al., 1999). Furans and nitrogen-containing compounds are mostly emitted from combustion processes (Coggon et al., 2019), cooking fires, burning of peat, crop residue and biomass fuel such as wood, and grasses (Stockwell et al., 2015). Studies have also shown that furans and nitrogen-containing compounds have a high potential to form secondary organic aerosols and particles. Other markers, nitrophenol ( 140.033, C6H6NO3) and methoxy nitrophenol ( 154.054, C7H8NO3), are explained by SFC 1 factor profiles of ∼ 0.53 and 0.52, respectively. It is reported that phenols in a biomass smoke plume react with NOx to form nitrophenol, considered a unique marker for aged biomass burning smoke (Harrison et al., 2005; Mohr et al., 2013). Nitrophenols and other nitrogen-containing aerosols act as cloud condensation nuclei (Kerminen et al., 2005; Laaksonen et al., 2005; Sotiropoulou et al., 2006) and contribute to the formation of SOA and light-absorbing brown carbon aerosols (Mohr et al., 2013; Laskin et al., 2009). The SFC 1 factor correlates well with organic fractions of NR-PM2.5 (Org_Hr), NO3_Hr (inorganics NO3 of NR-PM2.5), and RH, with Pearson r2 ∼ 0.46, 0.53, and 0.47, respectively (Lalchandani et al., 2021; Shukla et al., 2021), as given in Figs. 6 and 9d. Thus, we interpret SFC 1 as being more related to conventional biomass burning at the site. The diurnal pattern of the SFC 1 from NMVOCs (Fig. 5) shows peaks during cooking times, morning (07:00–08:00) and evening (19:00–21:00). The domestic usage of biomass for cooking and other purposes is one of the leading factors in primary emissions of gas-phase (SFC 1) and particle-phase (OOA) oxygenates. The city is surrounded by various agricultural fields, which generally involve open biomass burning activities. The back-trajectory analysis of the factor also shows the probable sources in nearby areas, mainly coming from the western direction of the sampling site (Fig. S3). This argues that this factor is also influenced by the aged biomass burning plume, transported from sources located on the outskirts of the city and nearby districts.
3.2.3 Factor 3: solid fuel combustion (SFC 2)
The third factor, solid fuel combustion (SFC 2), was identified in the five-factor solution. This component is basically only present in December. The factor's mass spectra are characterised by peak signals of methyl furan ( 83.049, C5H7O), phenol ( 95.049, C6H7O), cresol ( 109.06, C7H9O), catechol ( 111.043, C6H7O2), phenyl butanedione ( 163.115, C10H11O2), and hexene ( 85.093, C6H13), as shown in Fig. 5a. The SFC 1 and SFC 2 factor profiles are compared with each other in Fig. 8a. They explain the similar NMVOCs present in the factors, but the intensity of the signal is different. This is due to the difference in the emission sources and chemical pathways of formation. Lower ambient temperature and high relative humidity during this month are responsible for the different chemical pathways for the fates of compounds. For example, high-molecular-weighted and more substituted phenolic compounds such as guaiacol ( 125.059, C7H9O2) and cresol are released at the early stages of the smouldering stage of the fire (lower temperature), and low-molecular-weighted phenols are released during later stages (high temperature) (Stewart et al., 2021b). The higher explained variation from cresol (∼ 0.8) and guaiacol (0.21) to the factor's profile indicates their new emissions from residential heating activities and the burning of sawdust (Stewart et al., 2021b), as shown in Fig. 8b. Other compounds like phenols (0.27) and hexene (∼ 0.62) are explained by this SFC 2 factor's profile. These two compounds are being reported in the emissions from local biomass burning of wood in an Indian city (Delhi) (Stewart et al., 2021c). The factor profile explains 53 % of phenols, 23 % of second-order oxygenates, 30 % of furans, and 21 % of nitrogen-containing compounds. Commonly used domestic fuels other than liquid petroleum gas (LPG) in the Indian sub-continent are cow dung, fuelwood, and peat in different proportions depending on their composition and availability. A previous study (Stewart et al., 2021a) observed phenols released from the combustion of fuelwood (22 %–80 %), followed by crop residue (32 %–57 %), cow dung cake (32 %–36 %), and municipal solid waste (24 %–37 %). The combustion process at a higher temperature leads to the depolymerisation of lignin content in the biomass, which allows the aromatisation process to give off phenols, substituted phenolic compounds, and non-substituted aromatics (Sekimoto et al., 2018; Simonelt et al., 1993). The lower ambient temperature during December is also responsible for increased burning activities for cooking and heating purposes. The diurnal variation of SFC 2 shows its prominence during evening hours and accumulation during the late evening (21:00) till midnight. The correlation coefficient between SFC 2 and black carbon concentrations is ∼ 0.4. The factor SFC 2, derived from the VOC mass spectra, is less related (Pearson r2 ∼ 0.38) to the AMS_MO-OOA, as shown in Figs. 9c and S8. AMS_MO-OOA is characterised by higher 44 (CO2) and 43 (C2H3O) fractions than the primary OA sources. This factor is comparatively more oxidised, with a higher O C ratio of ∼ 0.89 than AMS_LO-OOA (O C ratio ∼ 0.62). It may be interpreted that SFC 2 is influenced by fresh oxidation of primary biomass burning emissions. Moreover, as shown in Fig. S3, the CWT plots show no evidence of its long-range transport.

Figure 8(a) Comparison of the relative composition of two factor profiles (SFC 1 and SFC 2). SFC 1 spectrum on top and SFC 2 spectrum on bottom. (b) Explained variation of selected NMVOC species, stacked such that the total explained variation is 1, colour-coded by the five factors.
3.2.4 Factor 4: SVOCs
The fourth factor, SVOCs, has the highest contribution from second-order oxygenates (40 %) and third-order oxygenates (40 %), as shown in Fig. 7. The relative composition of the profile of the factor reveals significant signals of acetic acid ( 77.019, C2H5O3), propylene glycol ( 77.048, C3H9O2), methylglyoxal ( 73.028, C3H5O2), methyl methacrylate (93.033 C6H5O), and C5H9O2 ( 101.059), given in Fig. 5a. Lower contributions from first-order oxygenates than the second- and third-order oxygenates indicate that these OVOCs are products of various photochemical and oxidation processes in the atmosphere instead of their direct emissions. The diurnal mean concentration of the SVOC factor in Fig. 5b shows distinct day-to-night variation, following the pattern of solar radiation. The mean concentration increases during the morning (08:00), peaks during the afternoon hours (12:00–15:00), and decreases towards the evening (20:00). The nighttime concentration of the factor is lowest due to the absence of photochemical activity at night. Small organic acids like formic acid ( 47.012, CH3O2) could potentially come from the photo-oxidation of furans and aromatics (S. Wang et al., 2020; Stewart et al., 2021b), which contribute 42.2 % to the SVOC factor's profile (Fig. 7). Other compounds like methoxyphenols are released by biomass burning, which is further photo-oxidised, resulting in the formation of SOA (Yee et al., 2013; Li et al., 2014). Figure 8b shows that the explained variations of these compounds, such as vanillin (methoxyphenol) and syringol (2,6-dimethoxyphenol), in the SVOC factor are ∼ 0.57 and 0.41, respectively, which is relatively high. This also confirms the association of products and intermediate products of photochemical reactions with the SVOC factor. The temporal variation of this factor has no significant correlation with any of the AMS factors or external tracers.
3.2.5 VCPs
The VCP factor is identified with prominent signals of ethanol ( 47.049, C2H6O) and naphthalene ( 129.05, C10H9) given in Fig. 5a; 76.6 % of the ethanol contributes to the VCP factor (Fig. 7). Volatile chemical products show good temporal correlation with a solvent-based NMVOC species, acetone, with Pearson r2 ∼ 0.6 (Fig. 6). Ethanol is used as a solvent in the paint, solvent-based, textile, plastics, and automobile industries. Many such kinds of industries (solvent-based and textile) are present in the close vicinity of the sampling site, possibly due to the high concentration of formaldehyde and ethanol. Shorter lifespans of ethanol (∼ 3–4 h) in the atmosphere confirm its emissions from local sources instead of transport from regional sources. The relative contribution of naphthalene is about 28.3 % to the factor. Other dominant signals of naphthalene diamine ( 159.102, C10H11N2) and methoxy benzopyranone ( 177.056, C10H9O3) relatively contribute about 34.5 % and 44.45 % to the factor. Naphthalene is present in ambient air due to emissions from industries such as metal industries, chemical manufacturing industries, and pharmaceuticals (Preuss et al., 2003). Naphthalene is also used as an intermediate product in coal tar, dyes or inks, and the leather tanning and asphalt industries (Jia and Batterman, 2010). It is classified as a possible human carcinogen and a precursor of atmospheric SOA (Tang et al., 2020; Jia and Batterman, 2010). There are very sharp peaks in the concentrations of ethanol, naphthalene, naphthalene diamine, and benzopyrene in the high-resolution time series, as shown in Fig. S9. This may be due to the influence of particular activities in nearby industries. A conglomerate of the industries is present in the south-westerly direction of the sampling site within and outside the city, as shown in Fig. 1. The direction of the wind changing to the south-west during summers may have brought the high levels of naphthalene and its derivatives emitted from these industrial areas to the sampling site. The CWT graph also shows the strong influence of the source present in the south-westerly direction of the sampling site (Fig. S3). A previous study has found, among the emitted OVOCs from sewage sludge, a first-order OVOC constituent of ∼ 60 % followed by high-order OVOCs (Haider et al., 2022). Interestingly, there are three sewage treatment plants located near the sampling site. They may have also influenced the concentrations of OVOCs at the sampling site. The influence of factor contribution during summertime is probably due to the increased production of naphthalene and ethanol from their local industrial sources and secondary formation at higher temperatures, as shown in the time series of the factors (Fig. S8).
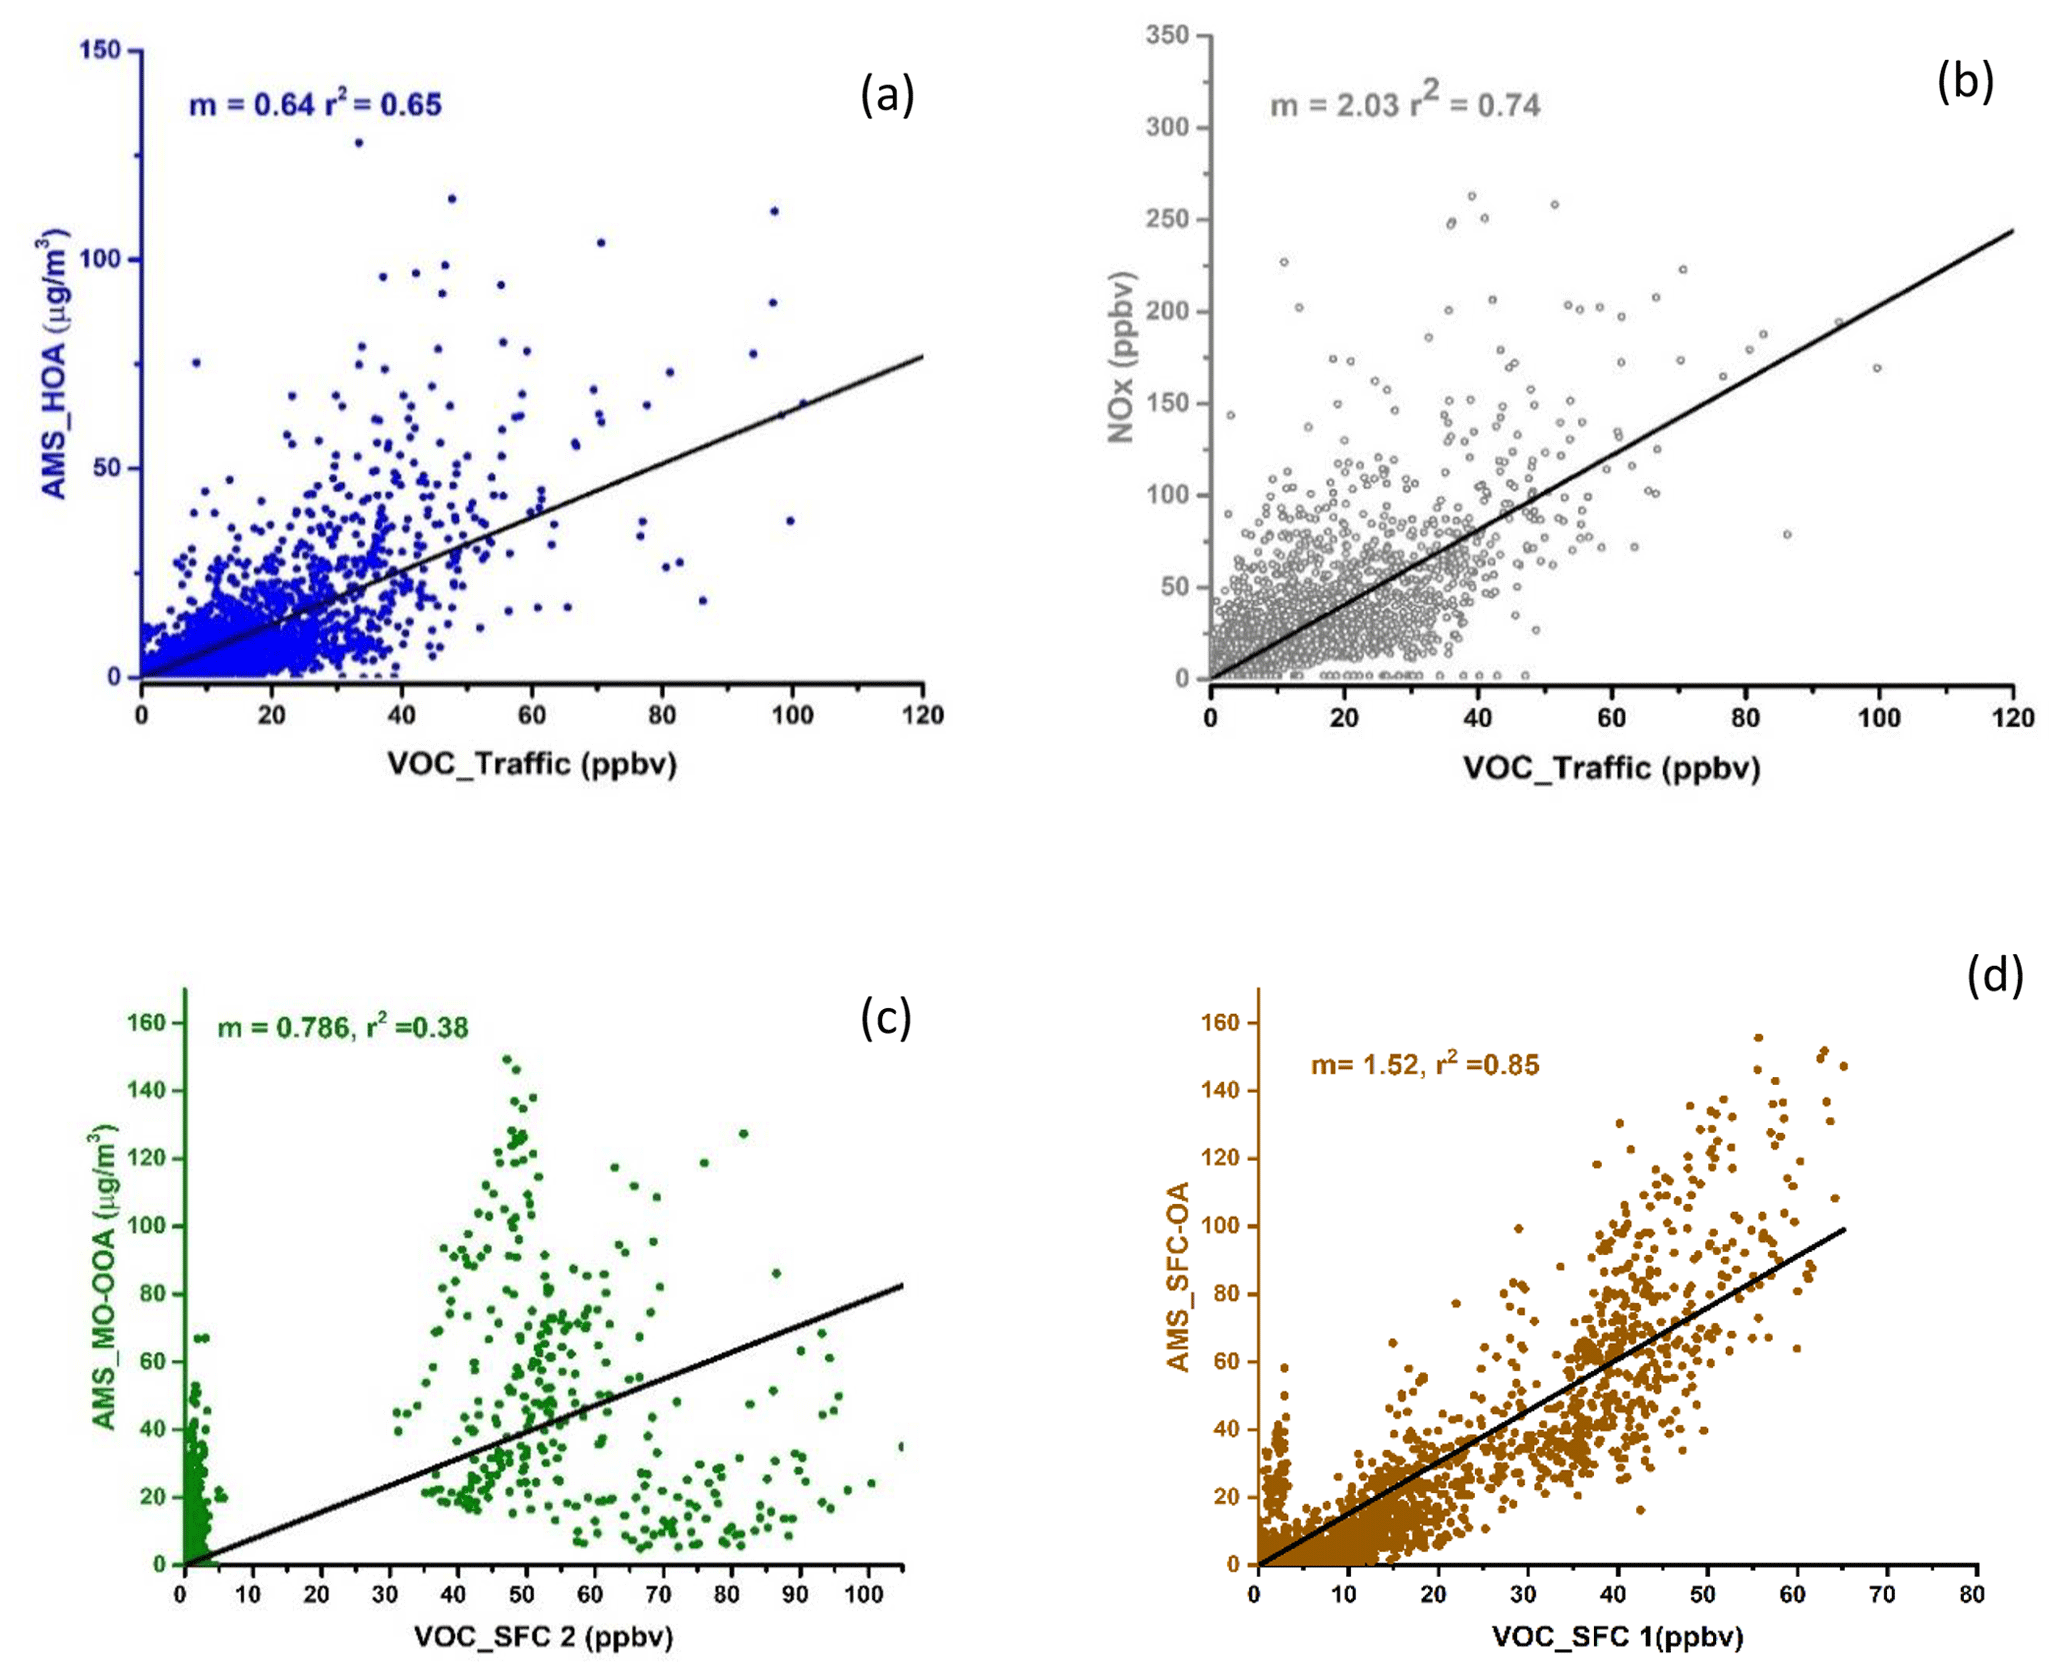
Figure 9Scatter plots showing a correlation between VOC_factors with their respective AMS_factors.
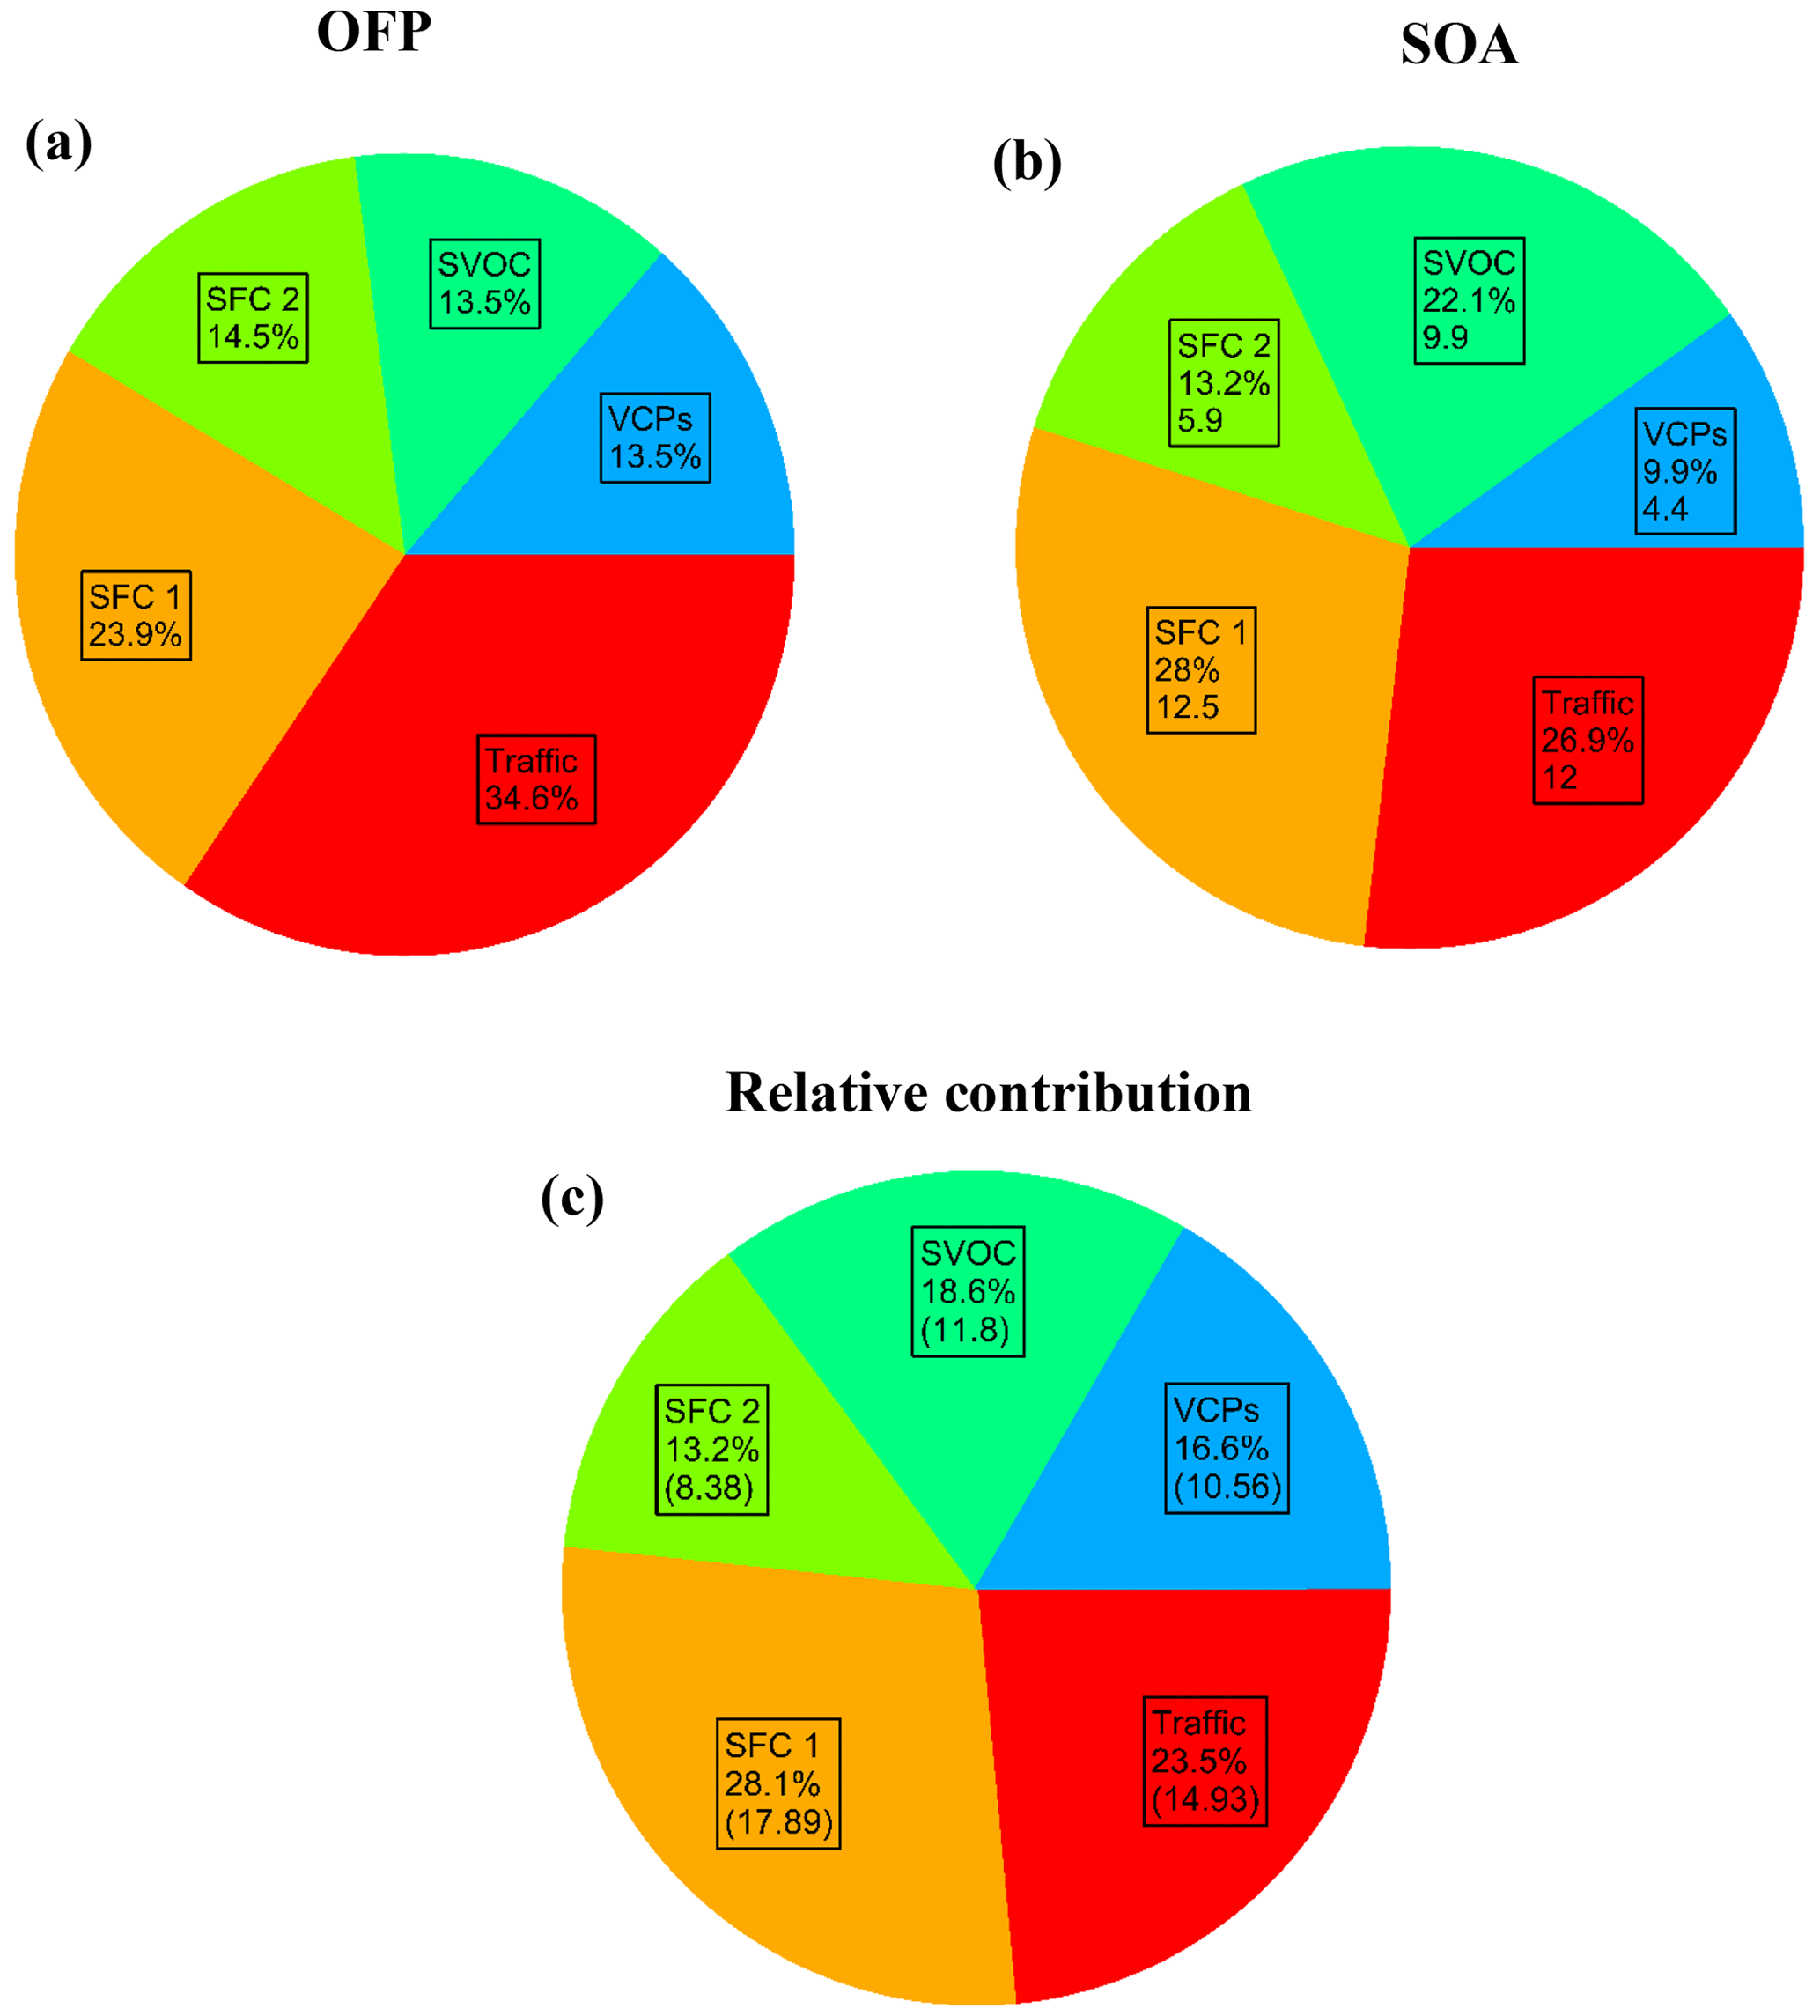
Figure 10Distribution in percentage (%) of individual factors to (a) ozone formation potential (OFP), (b) SOA formation, and (c) relative contribution. The bottom absolute values (in brackets) for panels (b) and (c) are the SOA yield mass concentration (µg m−3) and the average mixing ratios (ppbv).
3.3 OFP and SOA yield from individual sources
Based on the method explained in Sect. 2.5, the ozone formation potential was calculated for each factor after considering the MIR values of NMVOC species as given in Table S2. The relative contribution of each NMVOC to the individual factor after PMF analysis is multiplied by the averaged individual concentration of the NMVOC species. The highest contributor species to the ozone formation potential is toluene, followed by xylene, isoprene, and methyl cyclohexene. The distribution of individual sources of OFP is shown in Fig. 10a. Toluene, xylene, and isoprene were found to be the highest contributors in terms of OFP in other Asian cities, including Guangzhou and Beijing (Zheng et al., 2009; Zhu et al., 2016; Zhan et al., 2021; Duan et al., 2008). In the previous study in Delhi, it was also noticed that the contributions of aromatics (xylene and toluene) have a substantial effect on the ozone formation potential (Tripathi et al., 2022). The traffic factor contributes the maximum to the OFP among all the factors with 34.6 %, followed by SFC 1 (23.9 %) and then SFC 2 (14.5 %), SVOCs (13.5 %), and VCPs (13.5 %). Similarly, the contribution to the formation of SOA is also estimated for each factor with the SOA yield of individual NMVOCs, as given in Table S3. The overall SOA yield is influenced by toluene, benzene, phenol, naphthalene, xylene, methyl furan, and trimethyl benzene. These compounds mostly belong to the aromatics and first-order oxygenate families. The measured SOA from the HR-ToF-AMS may be considered the sum of a more-oxidised oxygenated OA factor (AMS_MO-OOA) and one low-oxidised oxygenated OA (AMS_LO-OOA) factor (Lalchandani et al., 2021). The five highest contributors to SOA formation potential were correlated with the measured SOA in Fig. S10, and the high-resolution time series shows the co-occurrence of high and low peaks of benzene, toluene, and xylene with measured SOA during the day and night hours. This shows the significant role of aromatic NMVOC species in the formation of SOA. The primary factors, traffic and SFC 1, are the highest contributors to the SOA formation, with 28 % and 27 %, respectively, as shown in Fig. 10b. These factors are ridden with the highest SOA-formation-contributing NMVOC species. Previous studies have also found that aromatic hydrocarbons contributed more than 95 % to the SOA formation potential in other Asian cities (J. Qin et al., 2021; Zhan et al., 2021). It was observed that the sources related to vehicular emissions (diesel and petrol-driven vehicles), paddy stubble fire, and garbage fire emissions were the most contributing factors to ozone formation potential in Mohali (Kumar et al., 2020). In the present study, the SVOC factor contributes 22 % to the SOA formation, with the maximum contribution from high-molecular oxygenated species. SFC 2 and the VCPs are contributing less to the SOA formation.
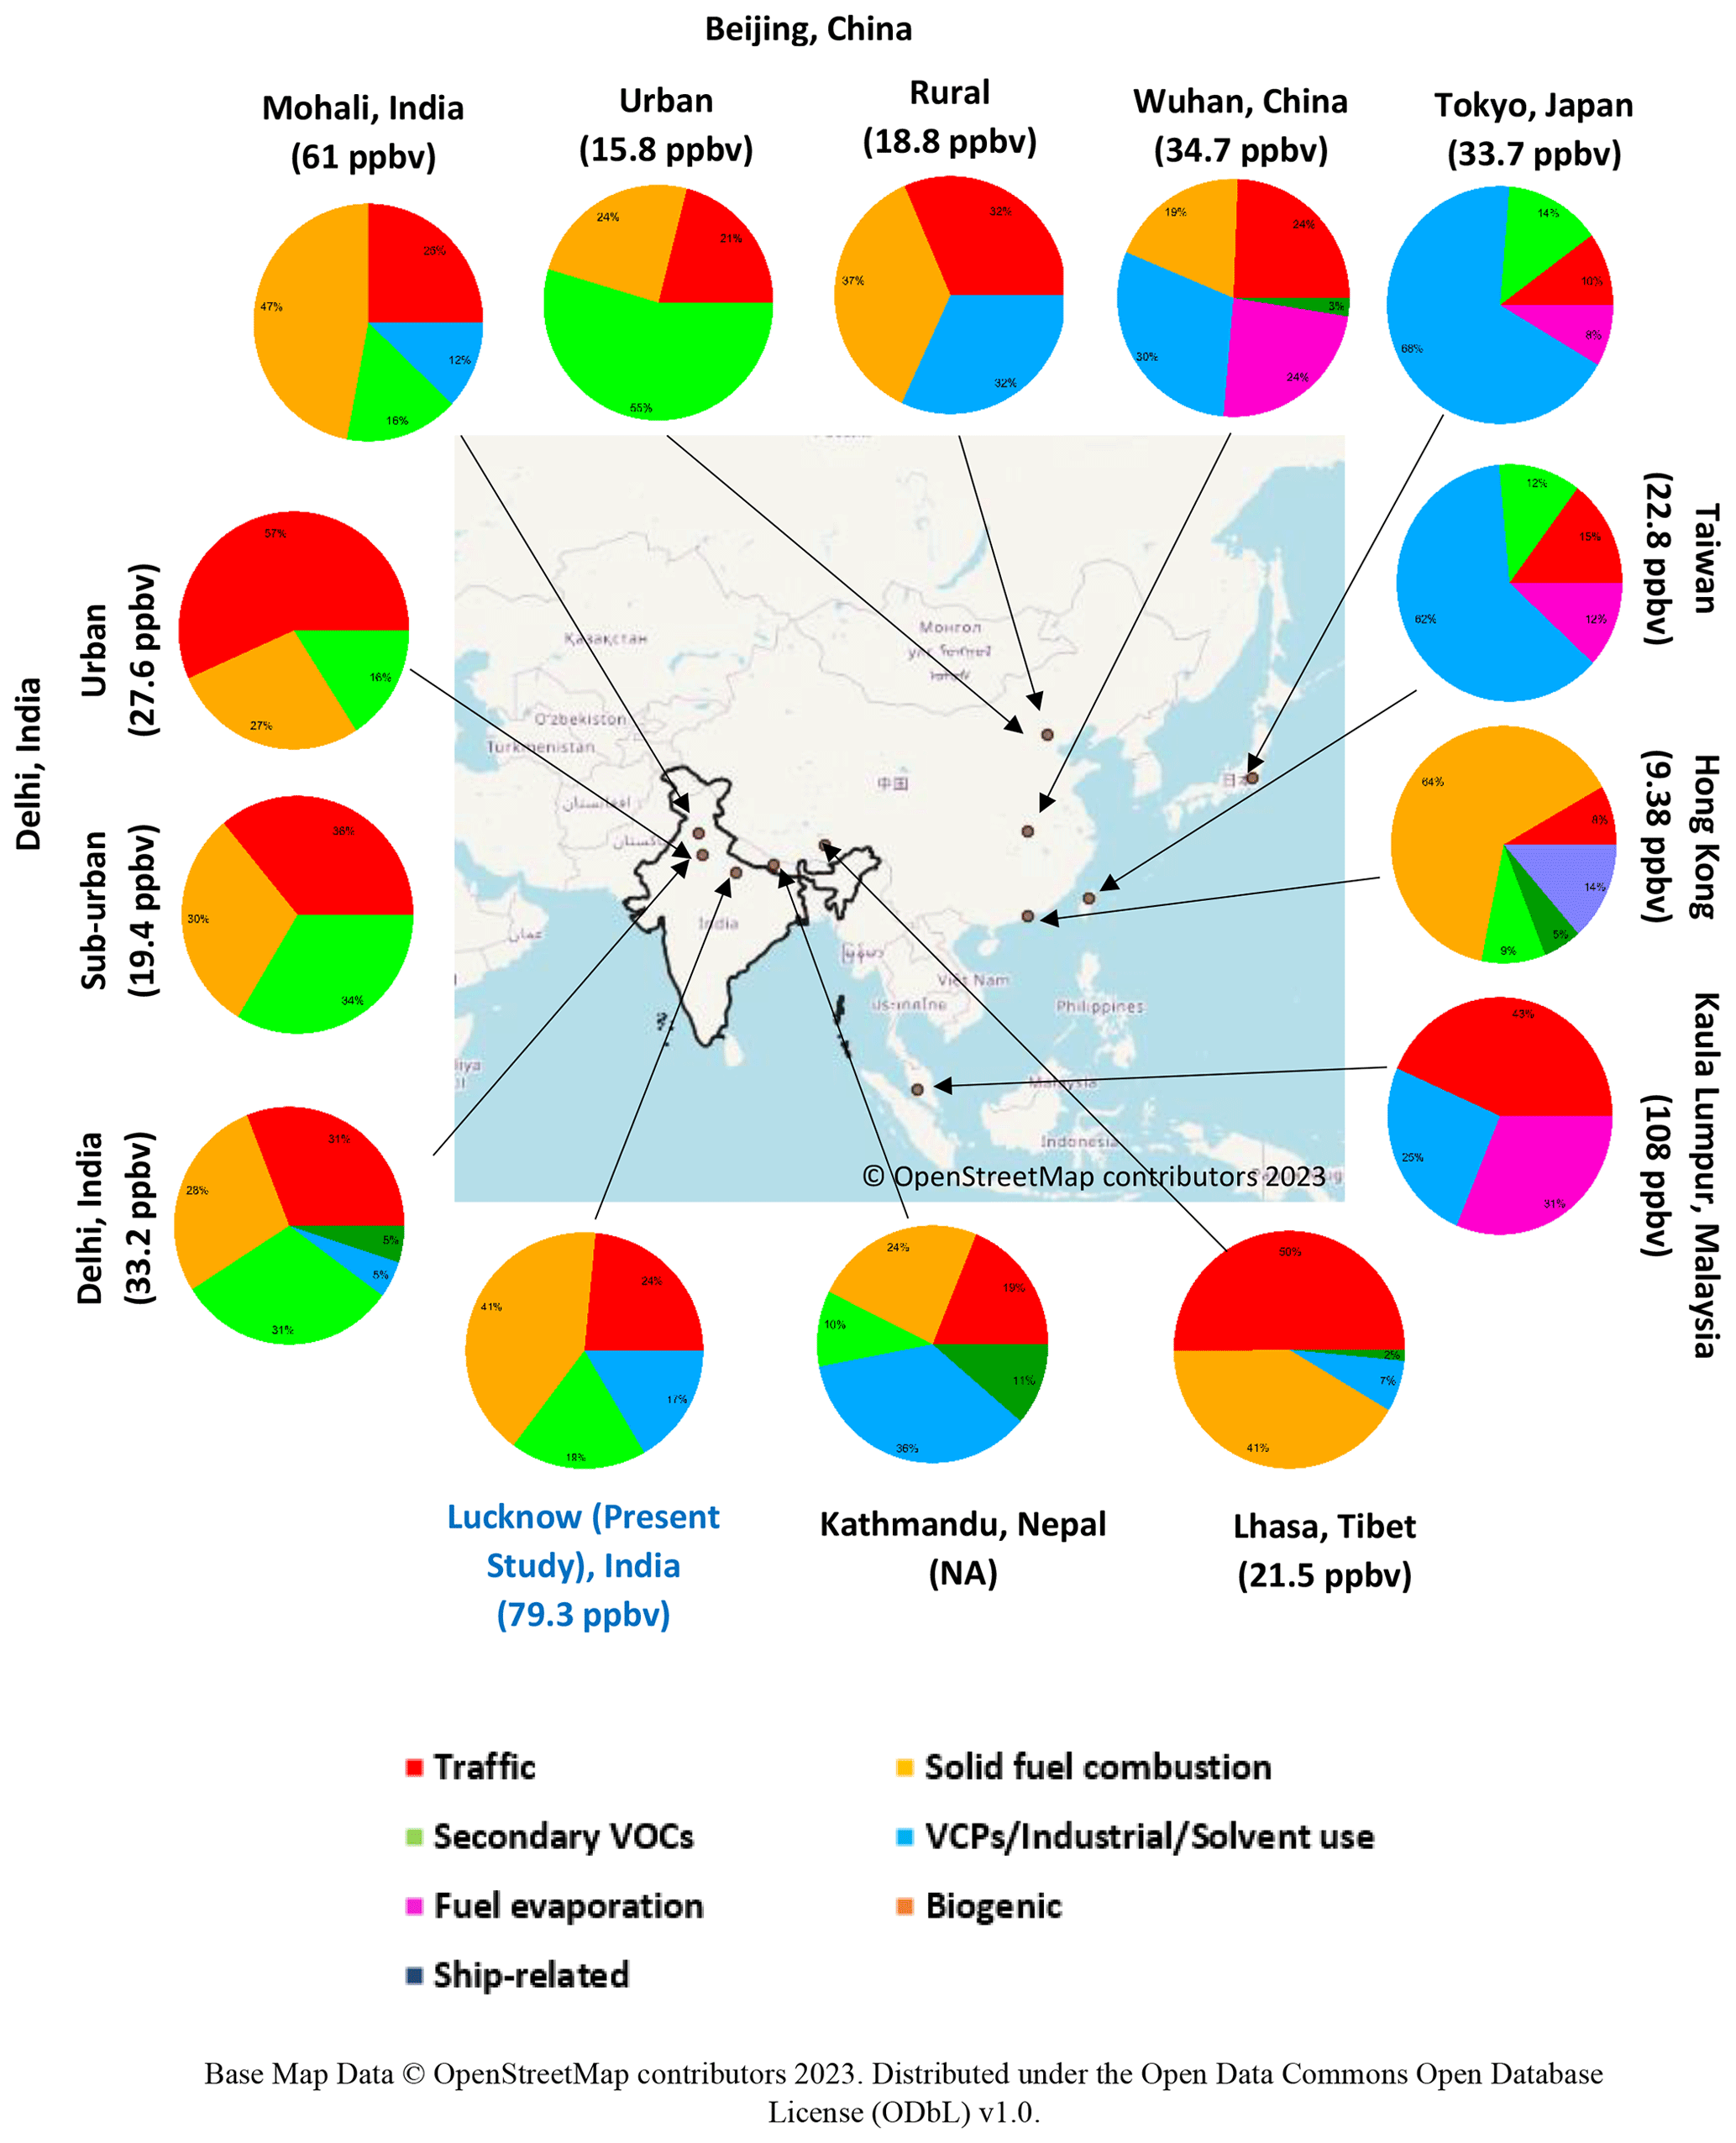
Figure 11Mapped pie charts showing various sources of NMVOCs in different Asian and Indian cities. The bottom values (in brackets) represent the averaged mixing ratios of total NMVOCs in the respective study. Base map data © OpenStreetMap contributors 2023. Distributed under the Open Data Commons Open Database License (ODbL) v1.0.
In contrast, this sequence is not similar to the relative contributions of the sources according to their concentration (Fig. 10c). The source contributing to the highest concentration of NMVOCs is SFC 1, followed by traffic, SVOCs, and VCPs. The lowest contributor is SFC 2. This comparison shows the importance of the source of NMVOCs to SOA and ozone chemistry. The factor contributing the most to the concentration of NMVOCs may not necessarily influence the ozone and SOA formation similarly. These values estimate the potential for ozone and SOA formation and do not indicate the actual yields of ozone and SOA. This estimation method represents the complex behaviour of NMVOCs, NOx, and solar radiation for producing tropospheric ozone and SOA. There are many NMVOC species with unknown ozone and SOA yield values. One needs to understand the chemical fates and pathways of many NMVOCs by mimicking a real-time atmosphere in smog-chamber studies or through computational modelling studies. More research on this section is needed. Nonetheless, other parameters, including solar radiation and concentrations of oxides of nitrogen, also play a key role in the formation of ozone in the troposphere. In reality, OFP and SOA do not provide complete information about how VOCs influence O3, and organic aerosol chemistry zone formation in Lucknow is more sensitive to NMVOC concentrations than NOx, similar to other Asian cities. So, decreasing the VOC NOx ratio would also help reduce the secondary pollutants (O3 and SOA). It is observed that vehicular emissions were the main source of aromatics (benzene, toluene, xylene). Therefore, vehicular emission control strategies should be implemented to reduce aromatic BTEX. Stringent implementation of policies and fuel-efficient standards related to vehicular emissions in Japan and South Korea have primarily improved the air quality (13 %–17 % reduction in NMVOCs) (Wang et al., 2014). In the present study, one of the key observations was that toluene is the main contributor to SOA and ozone production potential. This illustrates that targeting other sources of some NMVOCs (toluene and xylene) will also enhance their control. For example, paint solvents (sources of ethylbenzene and xylene) and printing products (sources of toluene) were targeted in a city, Hong Kong, where the VOC content of 172 types of consumer products was prescribed by the respective government (Lyu et al., 2017). In the present study, other potential contributor species are methyl cyclohexene (for ozone) and naphthalene (for SOA). These compounds are related to volatile chemical products, as found in the PMF analysis in Lucknow. This implies that stringent policies related to solvent-based industries such as textile, automobile, paint, and disinfectant are needed. Regulation and control of NMVOC content in the manufacturing and use of solvent-based products such as paints, disinfectants, fungicides, and insecticides should also be implemented. In China, various industries implemented end-of-pipe measures to control NMVOCs, such as refineries, plant oil extraction, gasoline storage and service stations, pharmacies, and crude oil storage and distribution (Wang et al., 2014). It is also estimated that China's end-of-pipe technologies and new energy-saving policies will help decrease about one-third of NMVOC emissions (Zhang et al., 2020). Phenols and furans were observed as some of the highest contributors to SOA formation potential related to solid fuel combustion. This suggests controlling solid fuel use for residential energy and crop-residue burning in the fields within and around the city of Lucknow. Firewood burning during the heating period and domestic in-field straw burning have substantially reduced emissions from biomass burning in China (Wu et al., 2020). Derwent et al. (2007) reported that reactivity-based VOC control measures might be more effective than mass-based regulations in controlling ozone and secondary organic aerosol formation. The present study also suggests that the reduction in VOCs, especially from vehicular emission, is needed for the abatement of O3 and SOA formation in urban areas.
Figure 11 represents mapped pie charts to compare overall NMVOC concentrations and relative source contributions in different Asian and Indian cities. The earlier studies reported the total NMVOC concentrations between 15 and 35 ppbv in different cities in China during winter (Hui et al., 2018; L. Wang et al., 2021; Yang et al., 2018; Wang et al., 2016). The highest concentration of NMVOCs was found in the city of Wuhan (∼ 34.6 ppbv), with maximum contributions from alkanes and oxygenated VOCs (Hui et al., 2018). The relative composition of sources of NMVOCs found in Wuhan was industrial/solvent usage (29.9 %), followed by traffic (24.4 %), fuel evaporation (23.87 %), biomass burning (19.3 %), and biogenic (2.5 %). The urban site in Beijing reported the maximum contribution from secondary VOCs (54.6 %), followed by biomass burning (24.4 %) and traffic (21 %) (L. Wang et al., 2021), while the rural site in Beijing had significant contributions from biomass burning (37 %) (Yang et al., 2018). Industrial and traffic contributed similarly at the rural site in Beijing (∼ 31.5 %). The difference in source profiles and contributions in urban and rural areas implied a need for different control strategies and policies in the country (Zhang et al., 2020). It is found that vehicular emissions and biomass burning sources contribute to NMVOC concentrations (average ∼ 21.5 ppbv) of an overall 50 % and 41 %, respectively, during summers, in a land-locked urban city, Lhasa, Tibet (Guo et al., 2022), while industrial/solvent usage contributed 68 % to NMVOCs (average ∼ 33.7 ppbv) in Tokyo, Japan (Fukusaki et al., 2021b). It is interesting to note that near the coastal region in Hong Kong, 63.7 % and 13.5 % of NMVOC contributions (average ∼ 9.8 ppbv) are related to various biomass burning and ship emission (Tan et al., 2021) air pollution control strategies implemented for over a decade, and NMVOC and O3 concentrations did not decrease significantly in Hong Kong (Lyu et al., 2017). A previous study in Kathmandu (Sarkar et al., 2017), Nepal, demonstrated that biomass co-fired brick kilns (29 %) and traffic (28 %) contribute to SOA production significantly. Other sources, such as industrial/solvent usage, biomass burning, and biogenic-related emissions, dominate the city.
Earlier source apportionment studies over the NMVOC mass spectra conducted in Indian cities were limited to two cities in the upper IGB region, Delhi (full year) and Mohali (summer). Comparison of the urban and sub-urban sites of Delhi found that vehicular emissions are dominant at both sites, with relatively fewer contributions to NMVOCs in the sub-urban region (36 %) compared to the urban region (57 %). Throughout the year, traffic emissions dominated the NMVOC concentration (31 %), with comparable contributions from biomass burning (28 %) and secondary formation (31 %) overall in Delhi. Mohali is located upwind of Delhi, with maximum contributions from biomass burning (47 %), followed by traffic (25 %) and secondary formation (16 %). The industrial sources contributed about 5 % and 12 % to NMVOC concentrations in Delhi and Mohali, respectively, while in the present study, it is found that the solid fuel combustion-related emissions majorly (41.3 %) contributed to NMVOC concentrations in Lucknow, located in the central IGB region. The traffic-related emissions (23.5 %) and secondary formation (18.6 %) are contributing relatively less to NMVOCs as compared to the upper IGB region cities (Delhi and Mohali). Moreover, the volatile chemical products were emitted more during the summer period in Lucknow compared to Delhi and Mohali. Solid fuel combustion sources aided concentrations of NMVOCs in both Mohali and Lucknow significantly. This may be due to both cities being located downwind of the widespread area of agricultural fields. Both cities observed relatively fewer formations of secondary volatile organic compounds, suggesting the dominance of fresh emissions over aged compounds in the air mass. Overall, the ambient concentrations of NMVOCs in Indian cities are majorly influenced by solid fuel combustion emissions, vehicular-related emissions, secondary formations, and industrial sources. This suggests the need for control measures and policies implemented for specific sources country-wide and specific to the city.
This study investigated the high time-resolved chemical characterisation of NMVOCs in Lucknow between December 2020 and May 2021. The mass spectra of the NMVOCs were used to perform source apportionment and study the diurnal variations. The individual species were identified as per their chemical formulas and exhibited large temporal fluctuations. The highest NMVOC concentrations during winters were due to their increased emissions from solid fuel combustion and stagnant conditions due to lower mixing height. The warmer period between April and May showed the influence of high photochemical activity and regional transport. The major industries are observed in the south-westerly direction from the sampling site, which may be responsible for highly volatile chemical products during summer. The five major factors resolved from source apportionment were a traffic factor, two solid fuel combustion factors, SVOCs, and VCPs. The primary sources, such as traffic factor and solid fuel combustion, exhibited a stronger correlation with organic-aerosol-resolved factors, indicating their expected times of origin from similar sources. The traffic factor had a similar profile found in Delhi, which suggested a similar vehicular pattern and fuel composition in different urban centres of the IGB region of India. The biomass burning factors in Lucknow had distinct profiles from Delhi due to different cooking or domestic fuel consumption and cropping patterns. Moreover, the regional transport of secondary volatile organic compounds was also observed in the back-trajectory analysis. The primary first-order oxygenates most contributed to the VCP factor, while the secondary VOC factor had contributions from the second- and third-order oxygenates. The highest contributing factor to the NMVOC emissions in Lucknow was solid fuel combustion (SFC 1) and traffic. The PTR-ToF-MS-resolved source factors of NMVOCs were correlated with HR-ToF-AMS-resolved factors, NR-PM2.5 (organics and inorganics), and supporting measurements (BC, NOx, SO2, O3) to analyse their common sources and diurnal patterns. The ozone and SOA formation potential from individual NMVOC species and sources was also estimated using MIR and SOA yield value-based methods, respectively. There is scope to improve these estimates as these values represented the potential for the formation of SOA and O3, not the actual yields. It is found that a few of the NMVOC species are significantly responsible for secondary pollutant formations. Stringent policies and control actions regarding aromatics (benzene, toluene, xylene, and naphthalene) and oxygenates (phenol and furans) could reduce the NMVOC emissions drastically. The sources potentially contributing to SOA and ozone formation are traffic, SFCs, and VCPs. Further control measures and end-to-pipe technologies to reduce emissions from solvent-based industries, consumer products, residential and domestic biomass burning, and vehicular fleets are required to mitigate the health and environmental impacts of NMVOCs and secondary pollutants. The results of this study suggest that to refine the strategies to improve air quality in urban regions of India, particularly the Indo-Gangetic Plain, comprehensive measurements of VOCs are necessary to characterise their emission sources and understand their photochemical processes. This work highlights that those local emissions, meteorology, city planning, and implementation of the policies in the IGB region highly influence the NMVOC sources. Further studies focusing on VOC–secondary organic aerosol interactions would help identify the gas–particle partitioning, ageing, and transport of pollution in the region.
The data are available on request from the corresponding author.
The supplement related to this article is available online at: https://doi.org/10.5194/acp-23-3383-2023-supplement.
VJ: conceptualisation, data curation, methodology, software, validation, formal analysis, investigation, writing – original draft, writing – review and editing, visualisation; NT: investigation, data curation, validation, writing – review and editing; SNT: conceptualisation, writing – review and editing, supervision, project administration, funding acquisition; MG: investigation, data curation, validation, writing – review and editing; LKS: resources, methodology, validation, writing – review and editing; SG: investigation, data curation, validation; AKS: validation, writing – review and editing; VM: formal analysis, validation, writing – review and editing; ASHP: methodology, validation, writing – review and editing.
The contact author has declared that none of the authors has any competing interests.
Publisher's note: Copernicus Publications remains neutral with regard to jurisdictional claims in published maps and institutional affiliations.
Lokesh K. Sahu, Nidhi Tripathi, and Mansi Gupta thank Anil Bhardwaj, director of the Physical Research Laboratory (PRL), Ahmedabad, India, for the support and permission to deploy the PTR-ToF-MS during the experimental campaign. The authors would like to acknowledge the support from the UPPCB (Uttar Pradesh Pollution Control Board) for the set-up of the campaign site. The authors are also grateful for the support of the Paul Scherrer Institute (PSI) and Centre of Excellence (ATMAN) approved by the office of the Principal Scientific Officer to the Government of India. The Centre of Excellence is supported by philanthropies, including Bloomberg Philanthropies, the Children's Investment Fund Foundation (CIFF), the Open Philanthropy, and the Clean Air Fund.
This research has been funded by the Swiss Agency for Development and Cooperation, Switzerland, to conduct this research under project no. 7F-10093.01.04 (contract no. 81062452). Sachchida N. Tripathi was also supported by the Duke University Office of Research Support, sub-award no. 349-0685.
This paper was edited by Ivan Kourtchev and reviewed by two anonymous referees.
Anenberg, S. C., Henze, D. K., Tinney, V., Kinney, P. L., Raich, W., Fann, N., Malley, C. S., Roman, H., Lamsal, L., Duncan, B., Martin, R. v., van Donkelaar, A., Brauer, M., Doherty, R., Jonson, J. E., Davila, Y., Sudo, K., and Kuylenstierna, J. C. I.: Estimates of the Global Burden of Ambient PM2.5, Ozone, and NO2 on Asthma Incidence and Emergency Room Visits, Environ. Health Perspect., 126, 107004, https://doi.org/10.1289/EHP3766, 2018.
Atkinson, R.: Atmospheric chemistry of VOCs and NOx, Atmos. Environ., 34, 2063–2101, https://doi.org/10.1016/S1352-2310(99)00460-4, 2000. 2000.
Atkinson, R. and Arey, J.: Atmospheric Degradation of Volatile Organic Compounds, Chem. Rev., 103, 4605–4638, https://doi.org/10.1021/cr0206420, 2003.
Atkinson, R., Baulch, D. L., Cox, R. A., Crowley, J. N., Hampson, R. F., Hynes, R. G., Jenkin, M. E., Rossi, M. J., and Troe, J.: Evaluated kinetic and photochemical data for atmospheric chemistry: Volume I – gas phase reactions of Ox, HOx, NOx and SOx species, Atmos. Chem. Phys., 4, 1461–1738, https://doi.org/10.5194/acp-4-1461-2004, 2004.
Balakrishnan, K., Chen, G., Brauer, M., and Chow, J.: IARC Monographs on the Evaluation of Carcinogenic Risks to Humans: Outdoor Air Pollution, International Agency for Research on Cancer – World Health Organisation, 656 pp., ISBN 978-92-832-0175-5, 2015.
Baudic, A., Gros, V., Sauvage, S., Locoge, N., Sanchez, O., Sarda-Estève, R., Kalogridis, C., Petit, J.-E., Bonnaire, N., Baisnée, D., Favez, O., Albinet, A., Sciare, J., and Bonsang, B.: Seasonal variability and source apportionment of volatile organic compounds (VOCs) in the Paris megacity (France), Atmos. Chem. Phys., 16, 11961–11989, https://doi.org/10.5194/acp-16-11961-2016, 2016.
Blake, R. S., Whyte, C., Hughes, C. O., Ellis, A. M., and Monks, P. S.: Demonstration of proton-transfer reaction time-of-flight mass spectrometry for real-time analysis of trace volatile organic compounds, Anal. Chem., 76, 3841–3845, https://doi.org/10.1021/ac0498260, 2004.
Blake, R. S., Monks, P. S., and Ellis, A. M.: Proton-transfer reaction mass spectrometry, Chem. Rev., 109, 861–896, https://doi.org/10.1021/cr800364q, 2009.
Brilli, F., Gioli, B., Ciccioli, P., Zona, D., Loreto, F., Janssens, I. A., and Ceulemans, R.: Proton Transfer Reaction Time-of-Flight Mass Spectrometric (PTR-TOF-MS) determination of volatile organic compounds (VOCs) emitted from a biomass fire developed under stable nocturnal conditions, Atmos. Environ., 97, 54–67, https://doi.org/10.1016/j.atmosenv.2014.08.007, 2014.
Bruns, E. A., El Haddad, I., Slowik, J. G., Kilic, D., Klein, F., Baltensperger, U., and Prévôt, A. S. H.: Identification of significant precursor gases of secondary organic aerosols from residential wood combustion, Sci. Rep., 6, 1–9, https://doi.org/10.1038/srep27881, 2016.
Bruns, E. A., Slowik, J. G., El Haddad, I., Kilic, D., Klein, F., Dommen, J., Temime-Roussel, B., Marchand, N., Baltensperger, U., and Prévôt, A. S. H.: Characterization of gas-phase organics using proton transfer reaction time-of-flight mass spectrometry: fresh and aged residential wood combustion emissions, Atmos. Chem. Phys., 17, 705–720, https://doi.org/10.5194/acp-17-705-2017, 2017.
Burnett, R. T., Arden Pope, C., Ezzati, M., Olives, C., Lim, S. S., Mehta, S., Shin, H. H., Singh, G., Hubbell, B., Brauer, M., Ross Anderson, H., Smith, K. R., Balmes, J. R., Bruce, N. G., Kan, H., Laden, F., Prüss-Ustün, A., Turner, M. C., Gapstur, S. M., Diver, W. R., and Cohen, A.: An integrated risk function for estimating the global burden of disease attributable to ambient fine particulate matter exposure, Environ. Health Perspect., 122, 397–403, https://doi.org/10.1289/ehp.1307049, 2014.
Canonaco, F., Crippa, M., Slowik, J. G., Baltensperger, U., and Prévôt, A. S. H.: SoFi, an IGOR-based interface for the efficient use of the generalized multilinear engine (ME-2) for the source apportionment: ME-2 application to aerosol mass spectrometer data, Atmos. Meas. Tech., 6, 3649–3661, https://doi.org/10.5194/amt-6-3649-2013, 2013.
Canonaco, F., Tobler, A., Chen, G., Sosedova, Y., Slowik, J. G., Bozzetti, C., Daellenbach, K. R., El Haddad, I., Crippa, M., Huang, R.-J., Furger, M., Baltensperger, U., and Prévôt, A. S. H.: A new method for long-term source apportionment with time-dependent factor profiles and uncertainty assessment using SoFi Pro: application to 1 year of organic aerosol data, Atmos. Meas. Tech., 14, 923–943, https://doi.org/10.5194/amt-14-923-2021, 2021.
Cao, X., Yao, Z., Shen, X., Ye, Y., and Jiang, X.: On-road emission characteristics of VOCs from light-duty gasoline vehicles in Beijing, China, Atmos. Environ., 124, 146–155, https://doi.org/10.1016/j.atmosenv.2015.06.019, 2016.
Caplain, I., Cazier, F., Nouali, H., Mercier, A., Déchaux, J. C., Nollet, V., Joumard, R., André, J. M., and Vidon, R.: Emissions of unregulated pollutants from European gasoline and diesel passenger cars, Atmos. Environ., 40, 5954–5966, https://doi.org/10.1016/j.atmosenv.2005.12.049, 2006.
Cappellin, L., Karl, T., Probst, M., Ismailova, O., Winkler, P. M., Soukoulis, C., Aprea, E., Märk, T. D., Gasperi, F., and Biasioli, F.: On quantitative determination of volatile organic compound concentrations using proton transfer reaction time-of-flight mass spectrometry, Environ. Sci. Technol., 46, 2283–2290, https://doi.org/10.1021/es203985t, 2012.
Carter, W.: Updated maximum incremental reactivity scale and hydrocarbon bin reactivities for regulatory applications, California Air Resources Board Contract 339, 84 pp., https://hero.epa.gov/hero/index.cfm/reference/details/reference_id/192380 (last access: 30 July 2022), 2010.
Carter, W. P. L.: Development of ozone reactivity scales for volatile organic compounds, J. Air Waste Manage. Assoc., 44, 881–899, https://doi.org/10.1080/1073161x.1994.10467290, 1994a.
Carter, W. P. L.: Reactivity Estimates for Selected consumer product compounds- Final Report to the California Air resources Board, 162 pp., https://www.regulations.gov/document/EPA-HQ-OAR-2013-0775-0021 (last access: 30 July 2022), 2008.
Census of India: Registrar General and Census Commissioner of India, https://censusindia.gov.in (last access: 15 July 2022), 2011.
Chameides, W. L., Fehsenfeld, F., Rodgers, M. O., Cardelino, C., Martinez, J., Parrish, D., Lonneman, W., Lawson, D. R., Rasmussen, R. A., Zimmerman, P., Greenberg, J., Middleton, P., and Wang, T.: Ozone precursor relationships in the ambient atmosphere, J. Geophys. Res., 97, 6037–6055, https://doi.org/10.1029/91JD03014, 1992.
Chattopadhyay, G., Samanta, G., Chatterjee, S., and Chakraborti, D.: Determination of benzene, toluene and xylene in ambient air of calcutta for three years during winter, Environ. Technol., 18, 211–218, https://doi.org/10.1080/09593331808616529, 1997.
Chauhan, S. K., Saini, N., and Yadav, V. B.: Recent Trends of Volatile Organic Compounds in Ambient Air & Its Health Impacts: a Review, International Journal For Technological Research In Engineering, 1, 667–678, 2014.
Chebbi, A. and Carlier, P.: Carboxylic acids in the troposphere, occurrence, sources, and sinks: A review, Atmos. Environ., 30, 4233–4249, https://doi.org/10.1016/1352-2310(96)00102-1, 1996.
Coggon, M. M., Lim, C. Y., Koss, A. R., Sekimoto, K., Yuan, B., Gilman, J. B., Hagan, D. H., Selimovic, V., Zarzana, K. J., Brown, S. S., Roberts, J. M., Müller, M., Yokelson, R., Wisthaler, A., Krechmer, J. E., Jimenez, J. L., Cappa, C., Kroll, J. H., de Gouw, J., and Warneke, C.: OH chemistry of non-methane organic gases (NMOGs) emitted from laboratory and ambient biomass burning smoke: evaluating the influence of furans and oxygenated aromatics on ozone and secondary NMOG formation, Atmos. Chem. Phys., 19, 14875–14899, https://doi.org/10.5194/acp-19-14875-2019, 2019.
Davison, A. C. and Hinkley, D. V.: Bootstrap Methods and their Application, Cambridge University Press, https://doi.org/10.1017/CBO9780511802843, 1997.
Decarlo, P. F., Kimmel, J. R., Trimborn, A., Northway, M. J., Jayne, J. T., Aiken, A. C., Gonin, M., Fuhrer, K., Horvath, T., Docherty, K. S., Worsnop, D. R., and Jimenez, J. L.: Field-Deployable, High-Resolution, Time-of-Flight Aerosol Mass Spectrometer, Anal. Chem., 78, 8281–8289, https://doi.org//10.1021/ac061249n, 2006.
de Gouw, J. A., Middlebrook, A. M., Warneke, C., Goldan, P. D., Kuster, W. C., Roberts, J. M., Fehsenfeld, F. C., Worsnop, D. R., Canagaratna, M. R., Pszenny, A. A. P., Keene, W. C., Marchewka, M., Bertman, S. B., and Bates, T. S.: Budget of organic carbon in a polluted atmosphere: Results from the New England Air Quality Study in 2002, J. Geophys. Res.-Atmos, 110, 1–22, https://doi.org/10.1029/2004JD005623, 2005.
Derwent, R. G., Jenkin, M. E., Passant, N. R., and Pilling, M. J.: Reactivity-based strategies for photochemical ozone control in Europe, Environ. Sci. Policy, 10, 445–453, https://doi.org/10.1016/j.envsci.2007.01.005, 2007.
Draxler, R. R. and Hess, G. D.: An overview of the HYSPLIT_4 modelling system for trajectories, dispersion and deposition, Aust. Meteorol. Mag., 47, 295–308, 1998.
Draxler, R. R., Stunder, B., Rolph, G., Stein, A., and Taylor, A.: HYSPLIT4 User’s Guide: Version 4, http://www.arl.noaa.gov/hysplit.html (last access: 15 July 2022), 2018.
Drinovec, L., Močnik, G., Zotter, P., Prévôt, A. S. H., Ruckstuhl, C., Coz, E., Rupakheti, M., Sciare, J., Müller, T., Wiedensohler, A., and Hansen, A. D. A.: The “dual-spot” Aethalometer: an improved measurement of aerosol black carbon with real-time loading compensation, Atmos. Meas. Tech., 8, 1965–1979, https://doi.org/10.5194/amt-8-1965-2015, 2015.
Drinovec, L., Gregorič, A., Zotter, P., Wolf, R., Bruns, E. A., Prévôt, A. S. H., Petit, J.-E., Favez, O., Sciare, J., Arnold, I. J., Chakrabarty, R. K., Moosmüller, H., Filep, A., and Močnik, G.: The filter-loading effect by ambient aerosols in filter absorption photometers depends on the coating of the sampled particles, Atmos. Meas. Tech., 10, 1043–1059, https://doi.org/10.5194/amt-10-1043-2017, 2017.
Duan, J., Tan, J., Yang, L., Wu, S., and Hao, J.: Concentration, sources and ozone formation potential of volatile organic compounds (VOCs) during ozone episode in Beijing, Atmos. Res., 88, 25–35, https://doi.org/10.1016/j.atmosres.2007.09.004, 2008.
Fukusaki, Y., Kousa, Y., Umehara, M., Ishida, M., Sato, R., Otagiri, K., Hoshi, J., Nudejima, C., Takahashi, K., and Nakai, S.: Source region identification and source apportionment of volatile organic compounds in the Tokyo Bay coastal area, Japan, Atmos. Environ., 9, 100103, https://doi.org/10.1016/j.aeaoa.2021.100103, 2021a.
Fukusaki, Y., Kousa, Y., Umehara, M., Ishida, M., Sato, R., Otagiri, K., Hoshi, J., Nudejima, C., Takahashi, K., and Nakai, S.: Source region identification and source apportionment of volatile organic compounds in the Tokyo Bay coastal area, Japan, Atmos. Environ., 9, 100103, https://doi.org/10.1016/j.aeaoa.2021.100103, 2021b.
Garg, A., Gupta, N. C., and Tyagi, S. K.: Study of seasonal and spatial variability among benzene, toluene, and p-Xylene (BTp-X) in ambient air of Delhi, India, Pollution, 5, 135–146, https://doi.org/10.22059/poll.2018.260934.469, 2019.
Gilman, J. B., Lerner, B. M., Kuster, W. C., and De Gouw, J. A.: Source signature of volatile organic compounds from oil and natural gas operations in northeastern Colorado, Environ. Sci. Technol., 47, 1297–1305, https://doi.org/10.1021/es304119a, 2013.
Government of India: Road Transport Year Book (2016-17), Ministry of Ministry of Road Transport and Highways Transport Research wing, 73 pp., https://morth.nic.in/road-transport-year-books (last access: 30 July 2022), 2019.
Graus, M., Müller, M., and Hansel, A.: High resolution PTR-TOF: Quantification and Formula Confirmation of VOC in Real Time, J. Am. Soc. Mass. Spectrom., 21, 1037–1044, https://doi.org/10.1016/j.jasms.2010.02.006, 2010.
Guo, S., Wang, Y., Zhang, T., Ma, Z., Ye, C., Lin, W., Yang Zong, D. J., and Yang Zong, B. M.: Volatile organic compounds in urban Lhasa: variations, sources, and potential risks, Front Environ. Sci., 10, 1–16, https://doi.org/10.3389/fenvs.2022.941100, 2022.
Haider, K. M., Lafouge, F., Carpentier, Y., Houot, S., Petitprez, D., Loubet, B., Focsa, C., and Ciuraru, R.: Chemical identification and quantification of volatile organic compounds emitted by sewage sludge, Sci. Total Environ., 838, 55948, https://doi.org/10.1016/j.scitotenv.2022.155948, 2022.
Hallquist, M., Wenger, J. C., Baltensperger, U., Rudich, Y., Simpson, D., Claeys, M., Dommen, J., Donahue, N. M., George, C., Goldstein, A. H., Hamilton, J. F., Herrmann, H., Hoffmann, T., Iinuma, Y., Jang, M., Jenkin, M. E., Jimenez, J. L., Kiendler-Scharr, A., Maenhaut, W., McFiggans, G., Mentel, Th. F., Monod, A., Prévôt, A. S. H., Seinfeld, J. H., Surratt, J. D., Szmigielski, R., and Wildt, J.: The formation, properties and impact of secondary organic aerosol: current and emerging issues, Atmos. Chem. Phys., 9, 5155–5236, https://doi.org/10.5194/acp-9-5155-2009, 2009.
Hansel, A., Jordan, A., Warneke, C., Holzinger, R., Wisthaler, A., and Lindinger, W.: Proton-transfer-reaction mass spectrometry (PTR-MS): On-line monitoring of volatile organic compounds at volume mixing ratios of a few pptv, Plasma Sources Sci. Technol., 8, 332–336, https://doi.org/10.1088/0963-0252/8/2/314, 1999.
Harrison, M. A. J., Barra, S., Borghesi, D., Vione, D., Arsene, C., and Iulian Olariu, R.: Nitrated phenols in the atmosphere: A review, Atmos. Environ., 39, 231–248, https://doi.org/10.1016/j.atmosenv.2004.09.044, 2005.
Heald, C. L., Henze, D. K., Horowitz, L. W., Feddema, J., Lamarque, J. F., Guenther, A., Hess, P. G., Vitt, F., Seinfeld, J. H., Godstein, A. H., and Fung, I.: Predicted change in global secondary organic aerosol concentrations in response to future climate, emissions, and land use change, J. Geophys. Res.-Atmos., 113, 1–16, https://doi.org/10.1029/2007JD009092, 2008.
Holzinger, R., Wameke, C., Hansel, A., Jordan, A., Lindinger, W., Scharffe, D. H., Schade, G., and Crutzen, P. J.: Biomass burning as a source of formaldehyde, acetaldehyde, methanol, acetone, acetonitrile, and hydrogen cyanide, Geophys. Res. Lett., 26, 1161–1164, https://doi.org/10.1029/1999GL900156, 1999.
Hoque, R. R., Khillare, P. S., Agarwal, T., Shridhar, V., and Balachandran, S.: Spatial and temporal variation of BTEX in the urban atmosphere of Delhi, India, Sci. Total Environ., 392, 30–40, https://doi.org/10.1016/j.scitotenv.2007.08.036, 2008.
Hui, L., Liu, X., Tan, Q., Feng, M., An, J., Qu, Y., Zhang, Y., and Jiang, M.: Characteristics, source apportionment and contribution of VOCs to ozone formation in Wuhan, Central China, Atmos. Environ., 192, 55–71, https://doi.org/10.1016/j.atmosenv.2018.08.042, 2018.
Jain, V., Tripathi, S. N., Tripathi, N., Sahu, L. K., Gaddamidi, S., Shukla, A. K., Bhattu, D., and Ganguly, D.: Seasonal variability and source apportionment of non-methane VOCs using PTR-TOF-MS measurements in Delhi , India, Atmos. Environ., 283, 119163, https://doi.org/10.1016/j.atmosenv.2022.119163, 2022.
Jang, M., Czoschke, N. M., Lee, S., and Kamens, R. M.: Heterogeneous atmospheric aerosol production by acid-catalyzed particle-phase reactions, Science, 298, 814–817, https://doi.org/10.1126/science.1075798, 2002.
Jayne, J. T., Worsnop, D. R., Kolb, C. E., Leard, D., Davidovits, P., Zhang, X., and Smith, K. A.: Aerosol mass spectrometer for size and composition analysis of submicron particles, J. Aerosol. Sci., 29, 49–70, https://doi.org/10.1016/S0021-8502(98)00158-X, 1998.
Jayne, J. T., Leard, D. C., Zhang, X., Davidovits, P., Smith, K. A., Kolb, C. E., and Worsnop, D. R.: Development of an aerosol mass spectrometer for size and composition analysis of submicron particles, Aerosol Sci. Technol., 33, 49–70, https://doi.org/10.1080/027868200410840, 2000.
Jia, C. and Batterman, S.: A critical review of naphthalene sources and exposures relevant to indoor and outdoor air, Int. J. Environ. Res. Public Health, 7, 2903–2939, https://doi.org/10.3390/ijerph7072903, 2010.
Jordan, A., Haidacher, S., Hanel, G., Hartungen, E., Märk, L., Seehauser, H., Schottkowsky, R., Sulzer, P., and Märk, T. D.: A high resolution and high sensitivity proton-transfer-reaction time-of-flight mass spectrometer (PTR-TOF-MS), Int. J. Mass. Spectrom., 286, 122–128, https://doi.org/10.1016/j.ijms.2009.07.005, 2009.
Kerminen, V. M., Lihavainen, H., Komppula, M., Viisanen, Y., and Kulmala, M.: Direct observational evidence linking atmospheric aerosol formation and cloud droplet activation, Geophys. Res. Lett., 32, 1–4, https://doi.org/10.1029/2005GL023130, 2005.
Kroll, J. H., Ng, N. L., Murphy, S. M., Flagan, R. C., and Seinfeld, J. H.: Secondary organic aerosol formation from isoprene photooxidation, Environ. Sci. Technol., 40, 1869–1877, https://doi.org/10.1021/es0524301, 2006.
Kumar, A., Sinha, V., Shabin, M., Hakkim, H., Bonsang, B., and Gros, V.: Non-methane hydrocarbon (NMHC) fingerprints of major urban and agricultural emission sources for use in source apportionment studies, Atmos. Chem. Phys., 20, 12133–12152, https://doi.org/10.5194/acp-20-12133-2020, 2020.
Laaksonen, A., Hamed, A., Joutsensaari, J., Hiltunen, L., Cavalli, F., Junkermann, W., Asmi, A., Fuzzi, S., and Facchini, M. C.: Cloud condensation nucleus production from nucleation events at a highly polluted region, Geophys. Res. Lett., 32, 1–4, https://doi.org/10.1029/2004GL022092, 2005.
Lalchandani, V., Kumar, V., Tobler, A., M. Thamban, N., Mishra, S., Slowik, J. G., Bhattu, D., Rai, P., Satish, R., Ganguly, D., Tiwari, S., Rastogi, N., Tiwari, S., Močnik, G., Prévôt, A. S. H., and Tripathi, S. N.: Real-time characterization and source apportionment of fine particulate matter in the Delhi megacity area during late winter, Sci. Total Environ., 770, 145324, https://doi.org/10.1016/j.scitotenv.2021.145324, 2021.
Lalchandani, V., Srivastava, D., Dave, J., Mishra, S., Tripathi, N., Shukla, A. K., Sahu, R., Thamban, N. M., Gaddamidi, S., Dixit, K., Ganguly, D., Tiwari, S., Srivastava, A. K., Sahu, L., Rastogi, N., Gargava, P., and Tripathi, S. N.: Effect of Biomass Burning on PM2.5 Composition and Secondary Aerosol Formation During Post-Monsoon and Winter Haze Episodes in Delhi, J. Geophys. Res.-Atmos., 127, 1–21, https://doi.org/10.1029/2021JD035232, 2022.
Laskin, A., Smith, J. S., and Laskin, J.: Molecular characterization of nitrogen-containing organic compounds in biomass burning aerosols using high-resolution mass spectrometry, Environ. Sci. Technol., 43, 3764–3771, https://doi.org/10.1021/es803456n, 2009.
Lawrence, A. and Fatima, N.: Urban air pollution & its assessment in Lucknow City – The second largest city of North India, Sci. Total Environ., 488–489, 447–455, https://doi.org/10.1016/j.scitotenv.2013.10.106, 2014.
Lee, A., Goldstein, A. H., Keywood, M. D., Gao, S., Ng, N. L., Varutbangkul, V., Bahreini, R., Flagan, R. C., and Seinfeld, J. H.: Gas-phase products and secondary aerosol yields from the ozonolysis of ten different terpenes, J.Geophys. Res.-Atmos., 111, D17305, https://doi.org/10.1029/2005JD006437, 2006a.
Lee, A., Goldstein, A. H., Kroll, J. H., Ng, N. L., Varutbangkul, V., Flagan, R. C., and Seinfeld, J. H.: Gas-phase products and secondary aerosol yields from the photooxidation of 16 different terpenes, J. Geophys. Res.-Atmos., 111, D07302, https://doi.org/10.1029/2006JD007050, 2006b.
Li, Y. J., Huang, D. D., Cheung, H. Y., Lee, A. K. Y., and Chan, C. K.: Aqueous-phase photochemical oxidation and direct photolysis of vanillin – a model compound of methoxy phenols from biomass burning, Atmos. Chem. Phys., 14, 2871–2885, https://doi.org/10.5194/acp-14-2871-2014, 2014.
Lyu, X. P., Zeng, L. W., Guo, H., Simpson, I. J., Ling, Z. H., Wang, Y., Murray, F., Louie, P. K. K., Saunders, S. M., Lam, S. H. M., and Blake, D. R.: Evaluation of the effectiveness of air pollution control measures in Hong Kong, Environ. Pollut. 220, 87–94, https://doi.org/10.1016/j.envpol.2016.09.025, 2017.
Majumdar, D., Mukherjeea, A. K., and Sen, S.: BTEX in Ambient Air of a Metropolitan City, J. Environ. Prot., 2, 11–20, https://doi.org/10.4236/jep.2011.21002, 2011.
Majumdar (neé Som), D., Dutta, C., Mukherjee, A. K., and Sen, S.: Source apportionment of VOCs at the petrol pumps in Kolkata, India; exposure of workers and assessment of associated health risk, Transport Res.-D Tr. E., 13, 524–530, https://doi.org/10.1016/j.trd.2008.09.011, 2008.
Markandeya, Verma, P. K., Mishra, V., Singh, N. K., Shukla, S. P., and Mohan, D.: Spatio-temporal assessment of ambient air quality, their health effects and improvement during COVID-19 lockdown in one of the most polluted cities of India, Environ. Sci. Pollut. Res., 28, 10536–10551, https://doi.org/10.1007/s11356-020-11248-3, 2021.
Ministry of MSME, Government of India: Brief Industrial Profile of District Lucknow: Uttar Pradesh, Lucknow, MSME – Development Institute, 1–21, http://www.msmedikanpur.gov.in/views/dip.asp (last access: 30 July 2022), 2018.
Mohr, C., Lopez-Hilfiker, F. D., Zotter, P., Prévoît, A. S. H., Xu, L., Ng, N. L., Herndon, S. C., Williams, L. R., Franklin, J. P., Zahniser, M. S., Worsnop, D. R., Knighton, W. B., Aiken, A. C., Gorkowski, K. J., Dubey, M. K., Allan, J. D., and Thornton, J. A.: Contribution of nitrated phenols to wood burning brown carbon light absorption in detling, united kingdom during winter time, Environ. Sci. Technol., 47, 6316–6324, https://doi.org/10.1021/es400683v, 2013.
Monks, P. S., Granier, C., Fuzzi, S., Stohl, A., Williams, M. L., Akimoto, H., Amann, M., Baklanov, A., Baltensperger, U., Bey, I., Blake, N., Blake, R. S., Carslaw, K., Cooper, O. R., Dentener, F., Fowler, D., Fragkou, E., Frost, G. J., Generoso, S., Ginoux, P., Grewe, V., Guenther, A., Hansson, H. C., Henne, S., Hjorth, J., Hofzumahaus, A., Huntrieser, H., Isaksen, I. S. A., Jenkin, M. E., Kaiser, J., Kanakidou, M., Klimont, Z., Kulmala, M., Laj, P., Lawrence, M. G., Lee, J. D., Liousse, C., Maione, M., McFiggans, G., Metzger, A., Mieville, A., Moussiopoulos, N., Orlando, J. J., O'Dowd, C. D., Palmer, P. I., Parrish, D. D., Petzold, A., Platt, U., Pöschl, U., Prévôt, A. S. H., Reeves, C. E., Reimann, S., Rudich, Y., Sellegri, K., Steinbrecher, R., Simpson, D., ten Brink, H., Theloke, J., van der Werf, G. R., Vautard, R., Vestreng, V., Vlachokostas, C., and von Glasow, R.: Atmospheric composition change – global and regional air quality, Atmos. Environ., 43, 5268–5350, https://doi.org/10.1016/j.atmosenv.2009.08.021, 2009.
Müller, M., Graus, M., Wisthaler, A., Hansel, A., Metzger, A., Dommen, J., and Baltensperger, U.: Analysis of high mass resolution PTR-TOF mass spectra from 1,3,5-trimethylbenzene (TMB) environmental chamber experiments, Atmos. Chem. Phys., 12, 829–843, https://doi.org/10.5194/acp-12-829-2012, 2012.
Ng, N. L., Chhabra, P. S., Chan, A. W. H., Surratt, J. D., Kroll, J. H., Kwan, A. J., McCabe, D. C., Wennberg, P. O., Sorooshian, A., Murphy, S. M., Dalleska, N. F., Flagan, R. C., and Seinfeld, J. H.: Effect of NOx level on secondary organic aerosol (SOA) formation from the photooxidation of terpenes, Atmos. Chem. Phys., 7, 5159–5174, https://doi.org/10.5194/acp-7-5159-2007, 2007.
Paatero, P.: The Multilinear Engine – A Table-Driven, Least Squares Program for Solving Multilinear Problems, Including the n-Way Parallel Factor Analysis Model, J. Comput. Graph. Stat., 8, 854–888, https://doi.org/10.1080/10618600.1999.10474853, 1999.
Paatero, P. and Hopke, P. K.: Discarding or downweighting high-noise variables in factor analytic models, Anal. Chim. Acta, 490, 277–289, https://doi.org/10.1016/S0003-2670(02)01643-4, 2003.
Paatero, P. and Tapper, U.: Analysis of different modes of factor analysis as least squares fit problems, Chemometr. Intell. Lab., 18, 183–194, https://doi.org/10.1016/0169-7439(93)80055-M, 1993.
Paatero, P. and Tapper, U.: Positive matrix factorization: A non-negative factor model with optimal utilization of error estimates of data values, Environmetrics, 5, 111–126, https://doi.org/10.1002/env.3170050203, 1994.
Paatero, P., Eberly, S., Brown, S. G., and Norris, G. A.: Methods for estimating uncertainty in factor analytic solutions, Atmos. Meas. Tech., 7, 781–797, https://doi.org/10.5194/amt-7-781-2014, 2014.
Pallavi, Sinha, B., and Sinha, V.: Source apportionment of volatile organic compounds in the northwest Indo-Gangetic Plain using a positive matrix factorization model, Atmos. Chem. Phys., 19, 15467–15482, https://doi.org/10.5194/acp-19-15467-2019, 2019.
Pandey, P., Khan, A. H., Verma, A. K., Singh, K. A., Mathur, N., Kisku, G. C., and Barman, S. C.: Seasonal trends of PM2.5 and PM10 in ambient air and their correlation in ambient air of Lucknow City, India, Bull. Environ. Contam. Toxicol., 88, 265–270, https://doi.org/10.1007/s00128-011-0466-x, 2012.
Pandey, P., Patel, D. K., Khan, A. H., Barman, S. C., Murthy, R. C., and Kisku, G. C.: Temporal distribution of fine particulates (PM2.5, PM10), potentially toxic metals, PAHs and Metal-bound carcinogenic risk in the population of Lucknow City, India, J. Environ Sci. Heal. A, 48, 730–745, https://doi.org/10.1080/10934529.2013.744613, 2013.
Peña, R. M., García, S., Herrero, C., Losada, M., Vázquez, A., and Lucas, T.: Organic acids and aldehydes in rainwater in a northwest region of Spain, Atmos. Environ., 36, 5277–5288, https://doi.org/10.1016/S1352-2310(02)00648-9, 2002.
Petit, J. E., Favez, O., Albinet, A., and Canonaco, F.: A user-friendly tool for comprehensive evaluation of the geographical origins of atmospheric pollution: Wind and trajectory analyses, Environ. Modell. Softw., 88, 183–187, https://doi.org/10.1016/j.envsoft.2016.11.022, 2017.
Preuss, R., Angerer, J., and Drexler, H.: Naphthalene - An environmental and occupational toxicant, Int. Arch. Occ. Env. Hea., 76, 556–576, https://doi.org/10.1007/s00420-003-0458-1, 2003.
Pye, H. O. T., Ward-Caviness, C. K., Murphy, B. N., Appel, K. W., and Seltzer, K. M.: Secondary organic aerosol association with cardiorespiratory disease mortality in the United States, Nat. Commun., 12, 1–8, https://doi.org/10.1038/s41467-021-27484-1, 2021.
Qin, J., Wang, X., Yang, Y., Qin, Y., Shi, S., Xu, P., Chen, R., Zhou, X., Tan, J., and Wang, X.: Source apportionment of VOCs in a typical medium-sized city in North China Plain and implications on control policy, J. Environ. Sci., 107, 26–37, https://doi.org/10.1016/j.jes.2020.10.005, 2021a.
Qin, M., Murphy, B. N., Isaacs, K. K., McDonald, B. C., Lu, Q., McKeen, S. A., Koval, L., Robinson, A. L., Efstathiou, C., Allen, C., and Pye, H. O. T.: Criteria pollutant impacts of volatile chemical products informed by near-field modelling, Nat. Sustain., 4, 129–137, https://doi.org/10.1038/s41893-020-00614-1, 2021b.
Sahu, L. K. and Saxena, P.: High time and mass resolved PTR-TOF-MS measurements of VOCs at an urban site of India during winter: Role of anthropogenic, biomass burning, biogenic and photochemical sources, Atmos. Res., 164–165, 84–94, https://doi.org/10.1016/j.atmosres.2015.04.021, 2015.
Sahu, L. K., Yadav, R., and Pal, D.: Source identification of VOCs at an urban site of western India: Effect of marathon events and anthropogenic emissions, J. Geophys. Res.-Atmos., 121, 2416–2433, https://doi.org/10.1002/2015JD024454, 2016.
Sahu, L. K., Tripathi, N., and Yadav, R.: Contribution of biogenic and photochemical sources to ambient VOCs during winter to summer transition at a semi-arid urban site in India, Environ. Pollut., 229, 595–606, https://doi.org/10.1016/j.envpol.2017.06.091, 2017.
Sandradewi, J., Prévôt, A. S. H., Szidat, S., Perron, N., Alfarra, M. R., Lanz, V. A., Weingartner, E., and Baltensperger, U. R. S.: Using aerosol light abosrption measurements for the quantitative determination of wood burning and traffic emission contribution to particulate matter, Environ. Sci. Technol., 42, 3316–3323, https://doi.org/10.1021/es702253m, 2008.
Sarkar, C., Sinha, V., Sinha, B., Panday, A. K., Rupakheti, M., and Lawrence, M. G.: Source apportionment of NMVOCs in the Kathmandu Valley during the SusKat-ABC international field campaign using positive matrix factorization, Atmos. Chem. Phys., 17, 8129–8156, https://doi.org/10.5194/acp-17-8129-2017, 2017.
Seco, R., Peñuelas, J., and Filella, I.: Short-chain oxygenated VOCs: Emission and uptake by plants and atmospheric sources, sinks, and concentrations, Atmos. Environ., 41, 2477–2499, https://doi.org/10.1016/j.atmosenv.2006.11.029, 2007.
Seibert, P., Kromp-Kolb, H., Baltensperger, U., Jost, D. T., and Schwikowski, M.: Trajectory Analysis of High-Alpine Air Pollution Data, Air Pollut. Model. Its Appl. X, 595–596, https://doi.org/10.1007/978-1-4615-1817-4_65, 1994.
Sekimoto, K., Koss, A. R., Gilman, J. B., Selimovic, V., Coggon, M. M., Zarzana, K. J., Yuan, B., Lerner, B. M., Brown, S. S., Warneke, C., Yokelson, R. J., Roberts, J. M., and de Gouw, J.: High- and low-temperature pyrolysis profiles describe volatile organic compound emissions from western US wildfire fuels, Atmos. Chem. Phys., 18, 9263–9281, https://doi.org/10.5194/acp-18-9263-2018, 2018.
Sharma, K., Singh, R., Barman, S. C., Mishra, D., Kumar, R., Negi, M. P. S., Mandal, S. K., Kisku, G. C., Khan, A. H., Kidwai, M. M., and Bhargava, S. K.: Comparison of trace metals concentration in PM10 of different locations of Lucknow City, India, Bull. Environ. Contam. Toxicol., 77, 419–426, https://doi.org/10.1007/s00128-006-1082-z, 2006.
Sharma, S. and Khare, M.: Simulating ozone concentrations using precursor emission inventories in Delhi – National Capital Region of India, Atmos. Environ., 151, 117–132, https://doi.org/10.1016/j.atmosenv.2016.12.009, 2017.
Shukla, A. K., Lalchandani, V., Bhattu, D., Dave, J. S., Rai, P., Thamban, N. M., Mishra, S., Gaddamidi, S., Tripathi, N., Vats, P., Rastogi, N., Sahu, L., Ganguly, D., Kumar, M., Singh, V., Gargava, P., and Tripathi, S. N.: Real-time quantification and source apportionment of fine particulate matter including organics and elements in Delhi during summertime, Atmos. Environ., 261, 118598, https://doi.org/10.1016/j.atmosenv.2021.118598, 2021.
Simonelt, B. R. T., Rogge, W. F., Mazurek, M. A., Standley, L. J., Hildemann, L. M., and Cass, G. R.: Lignin Pyrolysis Products, Lignans, and Resin Acids as Specific Tracers of Plant Classes in Emissions from Biomass Combustion, Environ. Sci. Technol., 27, 2533–2541, https://doi.org/10.1021/es00048a034, 1993.
Sinha, V., Kumar, V., and Sarkar, C.: Chemical composition of pre-monsoon air in the Indo-Gangetic Plain measured using a new air quality facility and PTR-MS: high surface ozone and strong influence of biomass burning, Atmos. Chem. Phys., 14, 5921–5941, https://doi.org/10.5194/acp-14-5921-2014, 2014.
Smith, D. and Spanel, P.: Selected ion flow tube mass spectrometry SIFT-MS for on-line trace gas analysis, Mass. Spectrom. Rev., 24, 661–700, https://doi.org/10.1002/mas.20033, 2005.
Sotiropoulou, R. E. P., Tagaris, E., Pilinis, C., Anttila, T., and Kulmala, M.: Modeling new particle formation during air pollution episodes: Impacts on aerosol and cloud condensation nuclei, Aerosol Sci. Tech., 40, 557–572, https://doi.org/10.1080/02786820600714346, 2006.
Srivastava, A., Sengupta, B., and Dutta, S. A.: Source apportionment of ambient VOCs in Delhi City, Sci. Total Environ., 343, 207–220, https://doi.org/10.1016/j.scitotenv.2004.10.008, 2005.
Srivastava, A., Joseph, A. E., and Devotta, S.: Volatile organic compounds in ambient air of Mumbai – India, Atmos. Environ., 40, 892–903, https://doi.org/10.1016/j.atmosenv.2005.10.045, 2006.
Stein, A. F., Draxler, R. R., Rolph, G. D., Stunder, B. J. B., Cohen, M. D., and Ngan, F.: Noaa’s hysplit atmospheric transport and dispersion modeling system, B. Am. Meteorol. Soc., 96, 2059–2077, https://doi.org/10.1175/BAMS-D-14-00110.1, 2015.
Steinbacher, M., Dommen, J., Ammann, C., Spirig, C., Neftel, A., and Prevot, A. S. H.: Performance characteristics of a proton-transfer-reaction mass spectrometer (PTR-MS) derived from laboratory and field measurements, Int. J. Mass. Spectrom., 239, 117–128, https://doi.org/10.1016/j.ijms.2004.07.015, 2004.
Stewart, G. J., Acton, W. J. F., Nelson, B. S., Vaughan, A. R., Hopkins, J. R., Arya, R., Mondal, A., Jangirh, R., Ahlawat, S., Yadav, L., Sharma, S. K., Dunmore, R. E., Yunus, S. S. M., Hewitt, C. N., Nemitz, E., Mullinger, N., Gadi, R., Sahu, L. K., Tripathi, N., Rickard, A. R., Lee, J. D., Mandal, T. K., and Hamilton, J. F.: Emissions of non-methane volatile organic compounds from combustion of domestic fuels in Delhi, India, Atmos. Chem. Phys., 21, 2383–2406, https://doi.org/10.5194/acp-21-2383-2021, 2021a.
Stewart, G. J., Acton, W. J. F., Nelson, B. S., Vaughan, A. R., Hopkins, J. R., Arya, R., Mondal, A., Jangirh, R., Ahlawat, S., Yadav, L., Sharma, S. K., Dunmore, R. E., Yunus, S. S. M., Hewitt, C. N., Nemitz, E., Mullinger, N., Gadi, R., Sahu, L. K., Tripathi, N., Rickard, A. R., Lee, J. D., Mandal, T. K., and Hamilton, J. F.: Emissions of non-methane volatile organic compounds from combustion of domestic fuels in Delhi, India, Atmos. Chem. Phys., 21, 2383–2406, https://doi.org/10.5194/acp-21-2383-2021, 2021b.
Stewart, G. J., Nelson, B. S., Drysdale, W. S., Acton, W. J. F., Vaughan, A. R., Hopkins, J. R., Dunmore, R. E., Hewitt, C. N., Nemitz, E., Mullinger, N., Langford, B., Shivani, Reyes-Villegas, E., Gadi, R., Rickard, A. R., Lee, J. D., and Hamilton, J. F.: Sources of non-methane hydrocarbons in surface air in Delhi, India, Faraday Discuss., 226, 409–431, https://doi.org/10.1039/d0fd00087f, 2021c.
Stockwell, C. E., Veres, P. R., Williams, J., and Yokelson, R. J.: Characterization of biomass burning emissions from cooking fires, peat, crop residue, and other fuels with high-resolution proton-transfer-reaction time-of-flight mass spectrometry, Atmos. Chem. Phys., 15, 845–865, https://doi.org/10.5194/acp-15-845-2015, 2015.
Talukdar, S., Tripathi, S. N., Lalchandani, V., Rupakheti, M., Bhowmik, H. S., Shukla, A. K., Murari, V., Sahu, R., Jain, V., Tripathi, N., Dave, J., Rastogi, N., and Sahu, L.: Air pollution in new delhi during late winter: An overview of a group of campaign studies focusing on composition and sources, Atmosphere-Basel, 12, 1–22, https://doi.org/10.3390/atmos12111432, 2021.
Tan, Y., Han, S., Chen, Y., Zhang, Z., Li, H., Li, W., Yuan, Q., Li, X., Wang, T., and Lee, S. cheng: Characteristics and source apportionment of volatile organic compounds (VOCs) at a coastal site in Hong Kong, Sci. Total Environ., 777, 146241, https://doi.org/10.1016/j.scitotenv.2021.146241, 2021.
Tang, T., Cheng, Z., Xu, B., Zhang, B., Zhu, S., Cheng, H., Li, J., Chen, Y., and Zhang, G.: Triple Isotopes (δ13C, δ2H, and Δ14C) Compositions and Source Apportionment of Atmospheric Naphthalene: A Key Surrogate of Intermediate-Volatility Organic Compounds (IVOCs), Environ. Sci. Technol., 54, 5409–5418, https://doi.org/10.1021/acs.est.0c00075, 2020.
Tobler, A., Bhattu, D., Canonaco, F., Lalchandani, V., Shukla, A., Thamban, N. M., Mishra, S., Srivastava, A. K., Bisht, D. S., Tiwari, S., Singh, S., Močnik, G., Baltensperger, U., Tripathi, S. N., Slowik, J. G., and Prévôt, A. S. H.: Chemical characterization of PM2.5 and source apportionment of organic aerosol in New Delhi, India, Sci. Total Environ., 745, 1–12, https://doi.org/10.1016/j.scitotenv.2020.140924, 2020.
Tripathi, N. and Sahu, L.: Chemosphere Emissions and atmospheric concentrations of a-pinene at an urban site of India: Role of changes in meteorology, Chemosphere, 256, 127071, https://doi.org/10.1016/j.chemosphere.2020.127071, 2020.
Tripathi, N., Sahu, L. K., Patel, K., Kumar, A., and Yadav, R.: Ambient air characteristics of biogenic volatile organic compounds at a tropical evergreen forest site in Central Western Ghats of India, J. Atmos. Chem., 78, 139–159, https://doi.org/10.1007/s10874-021-09415-y, 2021.
Tripathi, N., Sahu, L. K., Wang, L., Vats, P., Soni, M., Kumar, P., Satish, R. V., Bhattu, D., Sahu, R., Patel, K., Rai, P., Kumar, V., Rastogi, N., Ojha, N., Tiwari, S., Ganguly, D., Slowik, J., Prévôt, A. S. H., and Tripathi, S. N.: Characteristics of VOC composition at urban and suburban sites of New Delhi, India in winter, J. Geophys. Res.-Atmos., 127, e2021JD035342, https://doi.org/10.1029/2021jd035342, 2022.
Ulbrich, I. M., Canagaratna, M. R., Zhang, Q., Worsnop, D. R., and Jimenez, J. L.: Interpretation of organic components from Positive Matrix Factorization of aerosol mass spectrometric data, Atmos. Chem. Phys., 9, 2891–2918, https://doi.org/10.5194/acp-9-2891-2009, 2009.
Uttar Pradesh Pollution Control Board: Action Plan for the control of Air Pollution in Lucknow city, 5 pp., https://cpcb.nic.in/Actionplan/Lucknow.pdf (last access: 30 July 2022), 2019.
Wang, G., Cheng, S., Wei, W., Zhou, Y., Yao, S., and Zhang, H.: Characteristics and source apportionment of VOCs in the suburban area of Beijing, China, Atmos. Pollut. Res., 7, 711–724, https://doi.org/10.1016/j.apr.2016.03.006, 2016.
Wang, L., Slowik, J. G., Tripathi, N., Bhattu, D., Rai, P., Kumar, V., Vats, P., Satish, R., Baltensperger, U., Ganguly, D., Rastogi, N., Sahu, L. K., Tripathi, S. N., and Prévôt, A. S. H.: Source characterization of volatile organic compounds measured by proton-transfer-reaction time-of-flight mass spectrometers in Delhi, India, Atmos. Chem. Phys., 20, 9753–9770, https://doi.org/10.5194/acp-20-9753-2020, 2020.
Wang, L., Slowik, J. G., Tong, Y., Duan, J., Gu, Y., Rai, P., Qi, L., Stefenelli, G., Baltensperger, U., Huang, R. J., Cao, J., and Prévôt, A. S. H.: Characteristics of wintertime VOCs in urban Beijing: Composition and source apportionment, Atmos. Environ., 9, 100100, https://doi.org/10.1016/j.aeaoa.2020.100100, 2021.
Wang, S., Newland, M. J., Deng, W., Rickard, A. R., Hamilton, J. F., Muñoz, A., Ródenas, M., Vázquez, M. M., Wang, L., and Wang, X.: Aromatic Photo-oxidation, A New Source of Atmospheric Acidity, Environ. Sci. Technol., 54, 7798–7806, https://doi.org/10.1021/acs.est.0c00526, 2020.
Wang, S. X., Zhao, B., Cai, S. Y., Klimont, Z., Nielsen, C. P., Morikawa, T., Woo, J. H., Kim, Y., Fu, X., Xu, J. Y., Hao, J. M., and He, K. B.: Emission trends and mitigation options for air pollutants in East Asia, Atmos. Chem. Phys., 14, 6571–6603, https://doi.org/10.5194/acp-14-6571-2014, 2014.
Warneke, C., de Gouw, J. A., Goldan, P. D., Kuster, W. C., Williams, E. J., Lerner, B. M., Jakoubek, R., Brown, S. S., Stark, H., Aldener, M., Ravishankara, A. R., Roberts, J. M., Marchewka, M., Bertman, S., Sueper, D. T., McKeen, S. A., Meagher, J. F., and Fehsenfeld, F. C.: Comparison of daytime and nighttime oxidation of biogenic and anthropogenic VOCs along the New England coast in summer during New England Air Quality Study 2002, J. Geophys. Res.-Atmos., 109, 1–14, https://doi.org/10.1029/2003JD004424, 2004.
WHO: International Agency for Resaech on Cancer, World Health organisation: IARC Monographs on the identification of carcinogenic hazards to Humans- Acrolein, Crotonaldehyde, And Arecoline, 133 pp., https://www.iarc.who.int/faq/iarc-monographs-meeting-128-acrolein-crotonaldehyde-and-arecoline/ (last access: 15 July 2022), 2021.
Wu, J., Kong, S., Wu, F., Cheng, Y., Zheng, S., Qin, S., Liu, X., Yan, Q., Zheng, H., Zheng, M., Yan, Y., Liu, D., Ding, S., Zhao, D., Shen, G., Zhao, T., and Qi, S.: The moving of high emission for biomass burning in China: View from multi-year emission estimation and human-driven forces, Environ. Int., 142, 105812, https://doi.org/10.1016/j.envint.2020.105812, 2020.
Xu, L., Kollman, M. S., Song, C., Shilling, J. E., and Ng, N. L.: Effects of NOx on the Volatility of Secondary Organic Aerosol from Isoprene Photooxidation, Environ. Sci. Technol., 48, 2253–2262, https://doi.org/10.1021/es404842g, 2014.
Yadav, M., Soni, K., Soni, B. K., Singh, N. K., and Bamniya, B. R.: Source apportionment of particulate matter, gaseous pollutants, and volatile organic compounds in a future smart city of India, Urban Clim., 28, 100470, https://doi.org/10.1016/j.uclim.2019.100470, 2019.
Yang, W., Zhang, Y., Wang, X., Li, S., Zhu, M., Yu, Q., Li, G., Huang, Z., Zhang, H., Wu, Z., Song, W., Tan, J., and Shao, M.: Volatile organic compounds at a rural site in Beijing: influence of temporary emission control and wintertime heating, Atmos. Chem. Phys., 18, 12663–12682, https://doi.org/10.5194/acp-18-12663-2018, 2018.
Yee, L. D., Kautzman, K. E., Loza, C. L., Schilling, K. A., Coggon, M. M., Chhabra, P. S., Chan, M. N., Chan, A. W. H., Hersey, S. P., Crounse, J. D., Wennberg, P. O., Flagan, R. C., and Seinfeld, J. H.: Secondary organic aerosol formation from biomass burning intermediates: phenol and methoxyphenols, Atmos. Chem. Phys., 13, 8019–8043, https://doi.org/10.5194/acp-13-8019-2013, 2013.
Zhan, J., Feng, Z., Liu, P., He, X., He, Z., Chen, T., Wang, Y., He, H., Mu, Y., and Liu, Y.: Ozone and SOA formation potential based on photochemical loss of VOCs during the Beijing summer, Environ. Pollut., 285, 117444, https://doi.org/10.1016/j.envpol.2021.117444, 2021.
Zhang, F., Xing, J., Zhou, Y., Wang, S., Zhao, B., Zheng, H., Zhao, X., Chang, H., Jang, C., Zhu, Y., and Hao, J.: Estimation of abatement potentials and costs of air pollution emissions in China, J. Environ. Manage., 260, 110069, https://doi.org/10.1016/j.jenvman.2020.110069, 2020.
Zhang, Q., Jimenez, J. L., Canagaratna, M. R., Ulbrich, I. M., Ng, N. L., Worsnop, D. R., and Sun, Y.: Understanding atmospheric organic aerosols via factor analysis of aerosol mass spectrometry: A review, Anal. Bioanal. Chem., 401, 3045–3067, https://doi.org/10.1007/s00216-011-5355-y, 2011.
Zhang, Z., Wang, H., Chen, D., Li, Q., Thai, P., Gong, D., Li, Y., Zhang, C., Gu, Y., Zhou, L., Morawska, L., and Wang, B.: Emission characteristics of volatile organic compounds and their secondary organic aerosol formation potentials from a petroleum refinery in Pearl River Delta, China, Sci. Total Enviro., 584–585, 1162–1174, https://doi.org/10.1016/j.scitotenv.2017.01.179, 2017.
Zheng, J., Shao, M., Che, W., Zhang, L., Zhong, L., Zhang, Y., and Streets, D.: Speciated VOC emission inventory and spatial patterns of ozone formation potential in the Pearl River Delta, China, Environ. Sci. Technol., 43, 8580–8586, https://doi.org/10.1021/es901688e, 2009.
Zhu, Y., Yang, L., Chen, J., Wang, X., Xue, L., Sui, X., Wen, L., Xu, C., Yao, L., Zhang, J., Shao, M., Lu, S., and Wang, W.: Characteristics of ambient volatile organic compounds and the influence of biomass burning at a rural site in Northern China during summer 2013, Atmos. Environ., 124, 156–165, https://doi.org/10.1016/j.atmosenv.2015.08.097, 2016.
Zotter, P., Herich, H., Gysel, M., El-Haddad, I., Zhang, Y., Močnik, G., Hüglin, C., Baltensperger, U., Szidat, S., and Prévôt, A. S. H.: Evaluation of the absorption Ångström exponents for traffic and wood burning in the Aethalometer-based source apportionment using radiocarbon measurements of ambient aerosol, Atmos. Chem. Phys., 17, 4229–4249, https://doi.org/10.5194/acp-17-4229-2017, 2017.