the Creative Commons Attribution 4.0 License.
the Creative Commons Attribution 4.0 License.
 | 15 Mar 2023
Triggering effects of large topography and boundary layer turbulence on convection over the Tibetan Plateau
Xiangde Xu
Yi Tang
Hongshen Zhang
Ruixia Liu
Mingyu Zhou
In this study, we analyze the diurnal variations and formation mechanisms of low clouds at different elevations. We further discuss whether there exists a triggering mechanism for convection over the Tibetan Plateau (TP) and whether there is an association among low air density, strong turbulence, and ubiquitous “popcorn-like” cumulus clouds. The buoyancy term (BT) and shear term (ST) over the TP are significantly greater than those at low elevations, which is favorable for the formation of an increasing planetary boundary layer height (PBLH) and also plays a key role in the convective activities in the lower troposphere. From the viewpoint of global effects, the triggering of convection by boundary layer dynamics is analyzed over the TP, but also in the Northern Hemisphere over the Rocky Mountains. It is found that ST and BT are strong over both high-elevation regions. The strong thermal turbulence and large-scale ascending motion jointly result in obvious positive values of PBLH–LCL (lifting condensation level) under low relative humidity (RH) conditions over the TP. The obvious large-scale subsidence on both sides of the Rocky Mountains, especially the western side, leads to inversion above the PBL and lower RH within the PBL, which further leads to negative values of PBLH–LCL and decreased low cloud cover (LCC) in most parts of the Rocky Mountains. The slightly greater-than-zero PBLH–LCL corresponds spatially to increased LCC in the partial regions of the central Rocky Mountains. Thus, less LCC is generated at the Rocky Mountains compared to the TP.
- Article
(13060 KB) - Full-text XML
-
Supplement
(606 KB) - BibTeX
- EndNote


The Tibetan Plateau (TP), which resembles a “third pole” and a “world water tower”, plays an important and special role in the global climate and the energy–water cycle (Xu et al., 2008; Wu et al., 2015). The TP covers a quarter of China. Additionally, the average altitude of the TP is 4000 m, reaching one-third of the tropopause height, and so it is called the “roof of the world”. Cumulus convection over the TP transfers heat, moisture, and momentum into the free troposphere, which can impact the atmospheric circulation regionally and globally (Li and Zhang, 2016; Xu et al., 2014) and reveals the important “window effect” for the transfer and exchange of global energy and water vapor over the TP. It is a dynamic effect caused by the special heat source that constitutes the “window effect” and the “thermally driven” mechanism over the TP.
The results of the second Tibetan Plateau Experiments (TIPEX II), which were carried out in 1998, show that the strong convective plumes within the PBL observed by sodar and a frequently occurring deep mixed layer (> 2 km) can lead to ubiquitous “popcorn-like” cumulus clouds in Dangxiong as proposed by Zhou et al. (2000), and Xu et al. (2002) came up with a comprehensive physical pattern of land–air dynamic and thermal structures on the TP (Xu et al., 2002; Zhou et al., 2000). Previous studies have done many valuable researches on the triggering mechanism of moist convection over moist and dry surfaces based on atmospheric observations and simulations (Ek and Mahrt, 1994; Findell and Eltahir, 2003; Gentine et al., 2013). For dry surfaces, the weak stratification and strong sensible heat flux result in the rapid growth of the plantary boundary layer height (PBLH) so that the relative humidity at the top of the boundary layer RHtop increases rapidly, which favors the formation of clouds. For moist surfaces, strong stratification and evaporation (small Bowen ratio) not only cause slow growth of the PBLH, but also increase the mixed layer specific humidity and RHtop, which favor the formation and development of clouds. Taylor et al. (2012) found that the afternoon rain falls preferentially over soils that are relatively dry compared to the surrounding area, especially for semiarid regions. Guillod et al. (2015) reconciled spatial and temporal soil moisture effects on the afternoon rainfall. They showed that afternoon precipitation events tend to occur during wet and heterogeneous soil moisture conditions while being located over comparatively drier patches. Tuttle and Salvucci (2016) showed empirical evidence of contrasting soil moisture–precipitation feedbacks across the United States, and they found that soil moisture anomalies significantly influence rainfall probabilities over 38 % of the area, with a median factor of 13 %. Findell and Eltahir (2003) analyzed the model results over dry and wet soils in Illinois. They summarized the predictive capability of rain and shallow clouds by using the convective triggering potential (CTP) and a low-level humidity index, with HIlow as a measure of the early morning atmospheric setting. Our previous studies pointed out that the developments of these cumulus clouds are related to the special large-scale dynamic structure and turbulence within the PBL over the TP (Xu et al., 2014; Wang et al., 2020). In addition, Wang et al. (2020) pointed out that, despite the same relative humidity between eastern China and the TP, the lower temperature over the TP results in a lower lifting condensation level. With the same surface sensible heat flux, lower air density over the TP results in a larger buoyancy flux and a deeper boundary layer. All the above results indicate that the topography of the TP plays a major role in increasing the occurrence frequency of strong convective clouds (Luo et al., 2011). This conclusion is consistent with the viewpoint of Flohn and Reiter (1967), who emphasized the chimney effect of the huge cumulonimbus clouds on heat transfer in the upper troposphere.
The TP is one of the regions in China that is characterized by a high frequency of cumulus clouds, and the development of a cumulus system is related to both the turbulence and special dynamical structure in the PBL over the TP. The vertical motion over the TP is associated with anomalous convective activities. However, as Li and Zhang (2016) mentioned, the details of PBL processes are not very clear. The same is true for the diurnal variations and formation mechanisms of low clouds over the TP and low-elevation regions. The different variation characteristics of these low clouds at different elevations and regions also need to be discussed and analyzed. Moreover, we need to investigate whether there exist “high-efficiency” triggering mechanisms for convection over the TP and whether there is an association among low air density, strong turbulence, and ubiquitous popcorn-like cumulus clouds. Is there also strong turbulence in higher-elevation regions with lower air density in the globe? What is the impact of the large-scale vertical motions on clouds? Because both the TP and the Rocky Mountains are high-elevation regions covering large mid-latitude areas, we select these two typical regions to make a deep analysis. Unlike our previous paper by Wang et al. (2020), in this study we mainly focus on the comparison between these two regions to analyze the above scientific questions.
We use in situ measurements of temperature (T) and relative humidity (RH) at 2 m height, surface pressure data every hour, and low cloud cover (LCC) every 3 h from 2402 automatic weather stations from June to August 2010–2019 in China. LCC here refers to the fraction of the sky covered by low clouds as estimated by human observers, including five cloud types: nimbostratus (Ns), stratocumulus (Sc), stratus (St), cumulus (Cu), and deep convection (DC). These surface observation datasets are provided by the China National Meteorological Information Center.
In addition, we use the hourly 0.25∘ × 0.25∘ ERA5 reanalysis surface layer data in the summer (1 June to 31 August) from 2010 to 2019 (Hersbach et al., 2020).
We use more than 4 years (from 15 June 2006 to 31 August 2010) of the satellite (CloudSat radar and Calipso lidar)-merged cloud classification product 2B-CLDCLASS lidar to calculate the mean LCC with 1∘ × 1∘ resolution at about 14:00 and 02:00 LT in summer. The introduction of this product and details of the LCC calculation methods are summarized in Sassen and Wang (2008) and Wang et al. (2020).
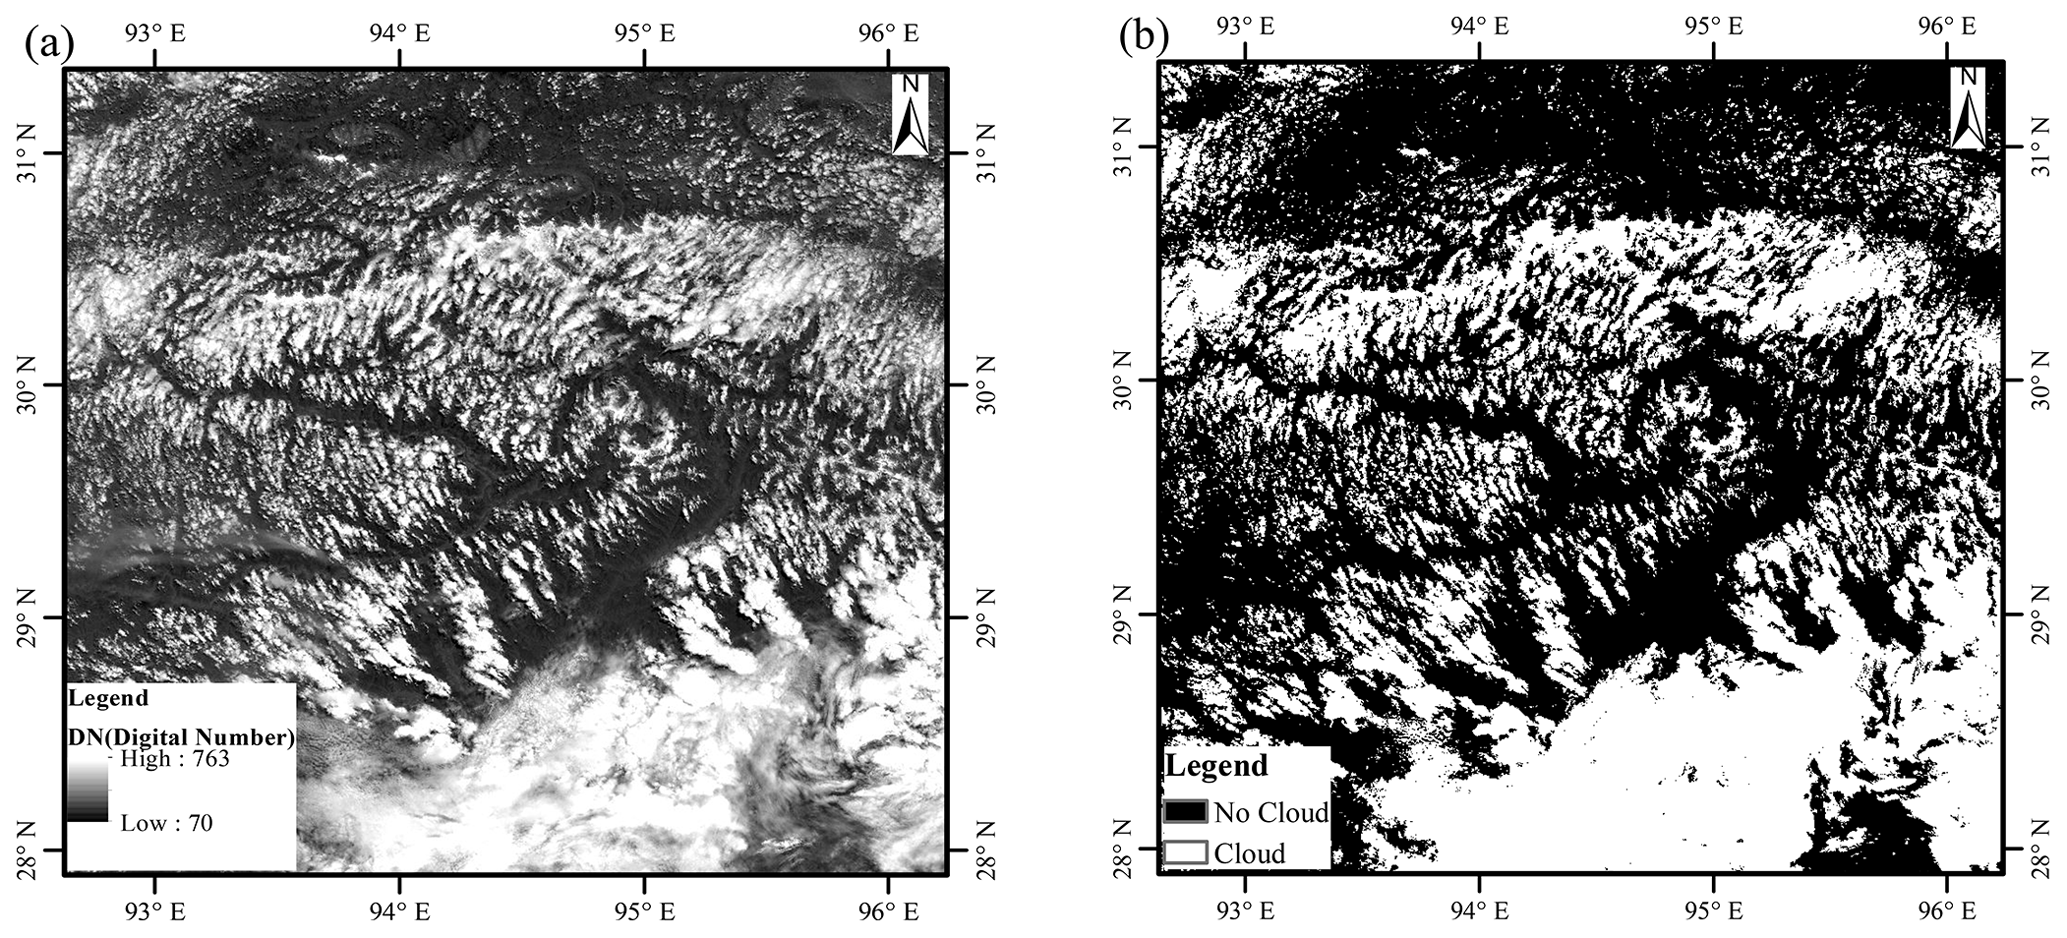
Figure 1The (a) digital number (DN) and (b) spatial distribution of cloud in the southeastern TP from the geostationary earth observation satellite Gaofen 4 (GF 4) at 12:00 Beijing time (about 10:20 LT) on 4 August 2020. Here we simply use DN = 250 as a threshold. All the grids in panel (a) are divided into two classes (DN > 250, cloud; DN < 250, no cloud), and then we give panel (b).
We use a Gaofen 4 (GF 4) visible satellite image with a spatial resolution of 50 m on 4 August 2020 to show the organized structures (cellular convection) in the southeastern TP as shown in Fig. 1. GF 4 is a geostationary earth observation satellite in the Gaofen series of Chinese civilian remote-sensing satellites. We also use the 1-year (from 1 June to 31 August 2016) geostationary satellite Himawari-8 retrieval product (cloud top height) over land in East Asia.
In this study, we also use T at 2 m height, RH at 2 m height, surface pressure, and PBLH from ERA5 reanalysis data from 2010 to 2019. To be specific, the above four variables represent hourly averaged values for each month (24 values in total for a month). The lifting condensation level (LCL) is calculated by the method proposed by Romps (2017).
Using sensible heat flux H, northward turbulent surface stress τy and eastward turbulent surface stress τx from ERA5 reanalysis data, we calculate the buoyancy term (BT) and shear term (ST) in the turbulent kinetic energy (TKE) equation for each grid. Both of these two terms can be used to analyze the effect of boundary layer turbulence in the surface layer on convection. The details of the method for computing BT and ST are as follows.
The ST and BT in the TKE equation maintain the turbulent motions. In order to simplify calculations, the x axis is directed along the average wind. Assuming horizontal homogeneity and no mean divergence, the TKE equation is written as
The left-hand side of Eq. (1) is the local time variation , and the terms on the right-hand side of Eq. (1) describe the buoyancy and shear energy production or consumption, turbulent transport of , pressure correlation, and viscous dissipation (Stull, 1988).
Here we use Eq. (2) to calculate the virtual potential temperature θv, and is derived from Eq. (3). Finally, we derive BT.
where g=9.8 m s−2 is the gravitational constant, H (W m−2) is the sensible heat flux, ρ (kg m−3) is the air density, R is the specific gas constant for dry air, cp (= 1004 J kg−1 K−1) is the specific heat of air at constant pressure, T is the air temperature at 2 m height, q is the specific humidity at 2 m height, and p0 and p are standard atmospheric pressure and surface pressure, respectively.
The wind shear is determined from heat flux H and momentum flux τ obtained from the ERA5 reanalysis data. Because we cannot directly obtain the τ from the ERA5 product list, we need to use Eq. (4) to calculate τ.
According to Monin–Obukhov similarity theory, wind shear is given as
where ϕm is the Monin–Obukhov stability function for momentum, . The von Karman constant κ=0.4, is the horizontal wind speed in the surface layer.
, with z = height and L = Obukhov stability length, are defined as in Gryanik et al. (2020) as
ϕm is the Monin–Obukhov stability function: here we use Eqs. (7) and (8) for stable and unstable conditions to derive ϕm (Dyer, 1974).
Then we use Eq. (9) to derive . Finally, we derive ST.
Figure 2 shows the spatial distribution of overland LCC in China from June to August 1951–2019. Compared to the LCC in eastern China, the high-value areas of LCC are mainly located in the mid-eastern TP and the area of the upper Yangtze River valley. However, LCC is also identified in the western and northern parts of the TP. We will further discuss this in the subsequent paragraphs. Using 4 years of CloudSat–Calipso satellite data, Li and Zhang (2016) confirmed that the climatological occurrence of cumulus over the TP is significantly greater than that in mid-eastern China at the same latitude. The elevated land surface with strong radiative heating makes the massive TP a favorable region for initiating convective cells with a high frequency of cumulonimbus and mesoscale convective systems (Sugimoto and Ueno, 2012). As a strong heat source, the TP has frequent convective activities in summer. During the TIPEX II in 1998, the long and narrow thermal plume corresponding to vigorous cellular convection on the microscale was observed by sodar in Dangxiong. As shown in Fig. 1, the shallow convective clouds on a horizontal scale from hundreds of meters to several kilometres over the southeastern TP (92.7–96.2∘ E, 29.5–31.3∘ N) are probably related to the organized eddies on the mesoscale and microscale over the TP. The cloud fraction over the southeastern TP is about 31.3 %.
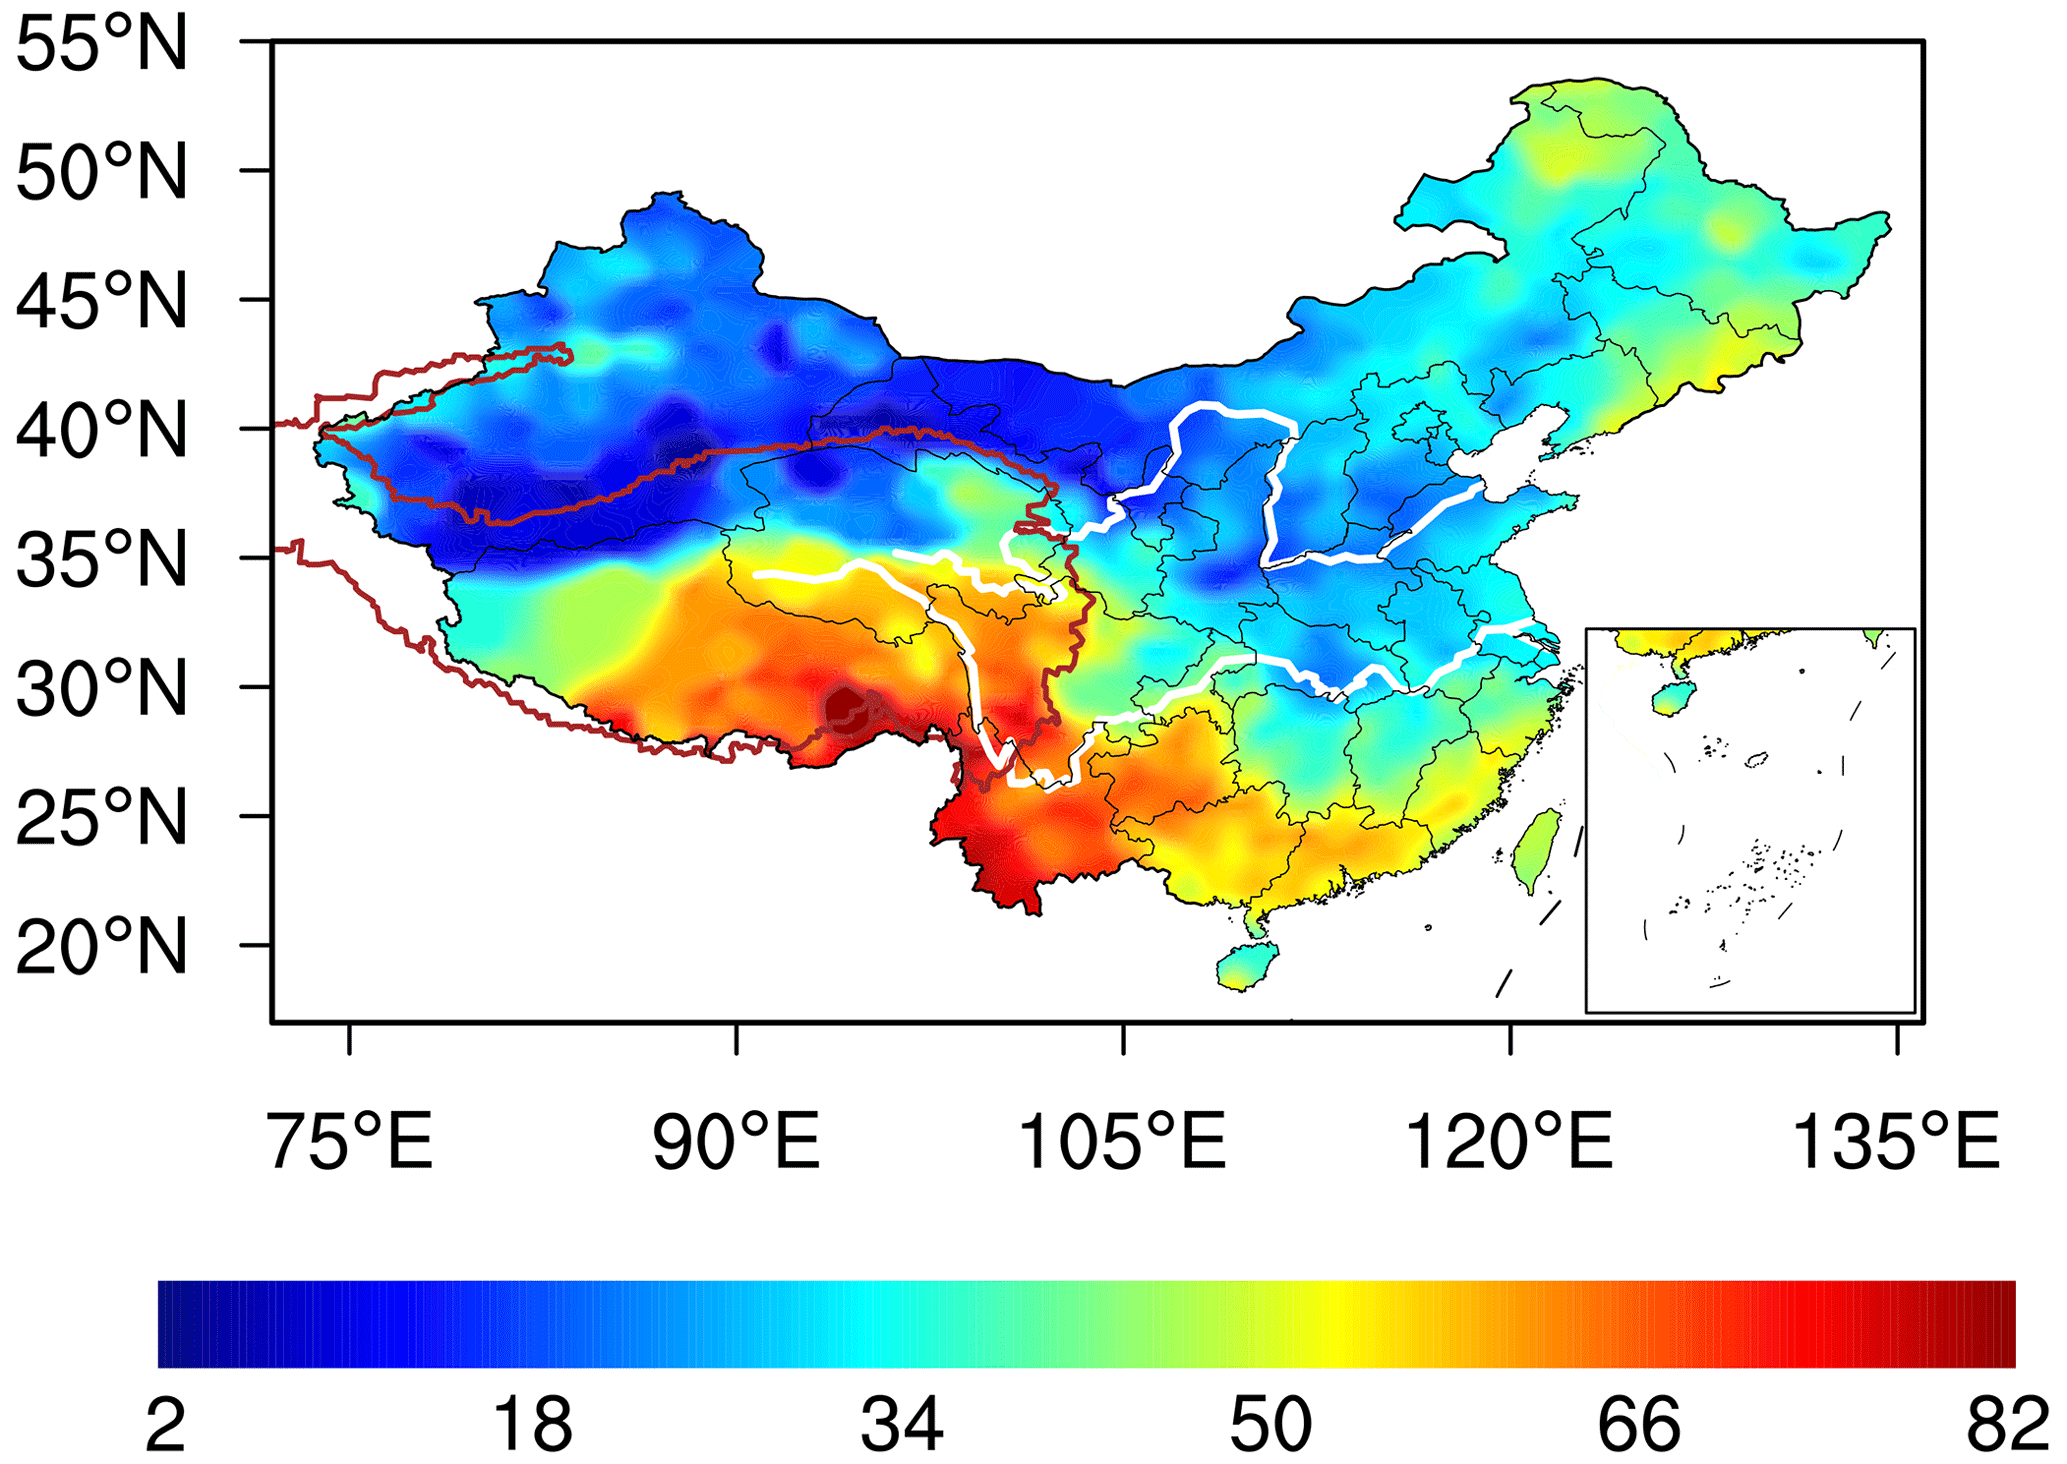
Figure 2The summer mean LCC derived from surface observations from 1951 to 2019 in China. The thick red contour denotes the 2.5 km topography height referred to as the TP. The white lines located in the northern and southern parts of China denote the Yellow and Yangtze rivers, respectively.
As shown in Fig. 3, in general, LCC increases with increasing elevation. The median of LCCH is significantly greater than those of LCCL and LCCM throughout the day. The diurnal variations of LCCL and LCCM are generally distributed in a unimodal pattern, with the maximum appearing at 14:00 Beijing time (median LCCL = 37 %, LCCM = 38 %), and low values (∼ 20 %) are maintained during the night. The diurnal variation of LCCH presents a bimodal curve, with the maximum appearing at 17:00 Beijing time (median LCCH = 69 %) and the secondary local maximum appearing at 08:00 Beijing time (median LCCH = 61 %). Compared to the low elevation, the interquartile ranges (IQRs) of LCCH are smaller than those of LCCL and LCCM, which implies that the LCCH maintains high values during the day. To further confirm and compare the above results with in situ measurements, using ERA5 LCC data, we also add Fig. S1 to show the diurnal cycle of LCC in summer in East Asia and North America in the Supplement.
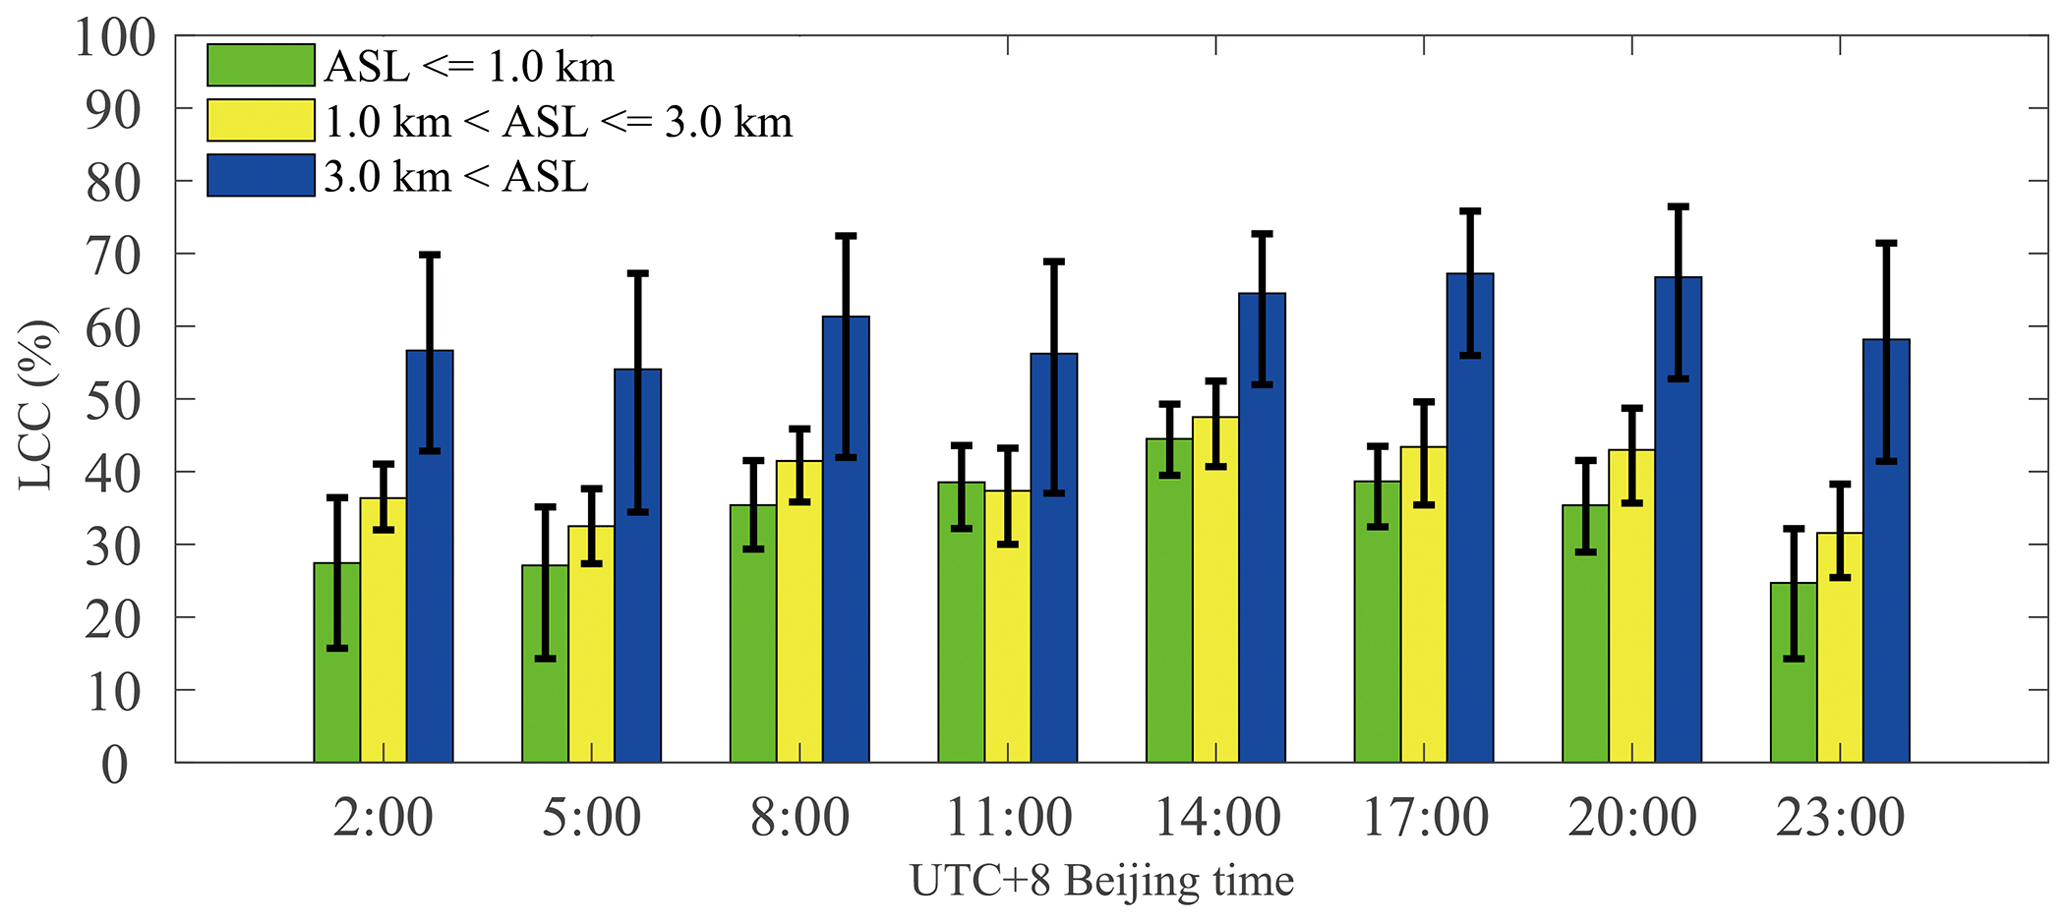
Figure 3The diurnal cycle of LCC in summer from 2010 to 2019 at different altitudes above sea level (ASL): ASL ≤ 1.0 km (LCCL), 1.0 km < ASL ≤ 3.0 km (LCCM), and 3.0 km < ASL (LCCH). It should be noted that all the sites ranged from 27 to 40∘ N in China, and each sample is derived from the monthly mean LCC at a particular time in summer for each site. The bar and error bar represent the median values and interquartile ranges (IQRs) of LCC, respectively. The subscripts L, M, and H of LCC denote the low, medium, and high clouds, respectively.
On the other hand, we note that there is no obvious trend of decreasing LCC over the TP from late afternoon to evening, as shown in Fig. 3. Based on the spatial distribution of topography in the Northern Hemisphere as shown in Fig. 7a, it is clear that both the TP (27–40∘ N, 70–105∘ E) and the Rocky Mountains (27–40∘ N, 103–120∘ W) in North America are two large areas with high elevations in mid-latitude regions in the Northern Hemisphere, so here we select these two typical large-topography regions to analyze the triggering effects of large topography and the related dynamical structure within the boundary layer on convective clouds. As shown in Fig. 4a, in general, there are obvious large-scale ascending motions from the middle troposphere (∼ 500 hPa) to the upper troposphere (∼ 200 hPa) over the TP. The convergence in the middle troposphere (the blue-shaded areas) and the divergence in the upper troposphere (the orange-shaded areas) are usually associated with the deep convection over the TP. Figure 4c shows that there are generally positive PBLH–LCL (∼ 500 m) values over the TP, and the median and IQR of the PBLH are close to those of the LCL in eastern China. These results are consistent with the conclusions proposed by Xu et al. (2014) and Wang et al. (2020). In contrast, Fig. 4b shows that there are only weak large-scale ascending motions from the near-surface layer to the middle troposphere over the Rocky Mountains. The large-scale subsidence on both sides of the Rocky Mountains, especially the western side, can lead to inversion above the PBL and lower RH within the PBL, which can be verified by the vertical distribution of the and RH at the latitude across sections from 30 to 35∘ N over the Rocky Mountains in Fig. S2. There exists a high value center of at about 950 hPa (or 850 hPa) on the western (or eastern) side of the Rocky Mountains, and the RH within the PBL is generally less than 55 %. The former restricts the growth of PBLH during the day, while the latter leads to an increased LCL. Thus, negative PBLH–LCL is identified on both sides of the Rocky Mountains (30–35∘ N, 110–120∘ W and 30–35∘ N, 100–105∘ W), especially for the western Rocky Mountains (30–35∘ N, 110–120∘ W) with strong large-scale subsidence, as shown in Fig. 4d. Dynamic processes of vapor transport are generated because of the thermal structure of the TP, which is similar to the conditional instability of the second kind (CISK) mechanism of tropical cyclones (Smith, 1997). It should be pointed out that there are large-scale descending motions at 500 hPa in parts of the western TP and Qaidam Basin as shown in Fig. S3, which lead to less LCC in these regions compared to the other parts of the TP, as shown in Fig. 2. In addition, the meteorological stations in the northern TP (34–36∘ N, 80–90∘ E) are scarcely and unevenly distributed, and therefore the LCC in the Taklamakan Desert leads to false LCC values in the northern TP (80–90∘ E, 34–36∘ N), as shown in Fig. 2. In fact, there is high LCC in these regions, as shown in Fig. 7e. Figure 5 shows the spatial distribution of daytime variations of cloud top height in summer. Compared to eastern China at the same latitude, the cloud top height increases significantly from 14:30 LT (∼ 7 km) to 18:30 LT (∼ 14 km) over the TP. The cloud top height approaches the tropopause (∼ 14 km) in the evening, which implies the frequent occurrence of deep convective clouds at this time. This result is consistent with the observation of millimeter-wave radar in Naqu (Yi and Guo, 2016).
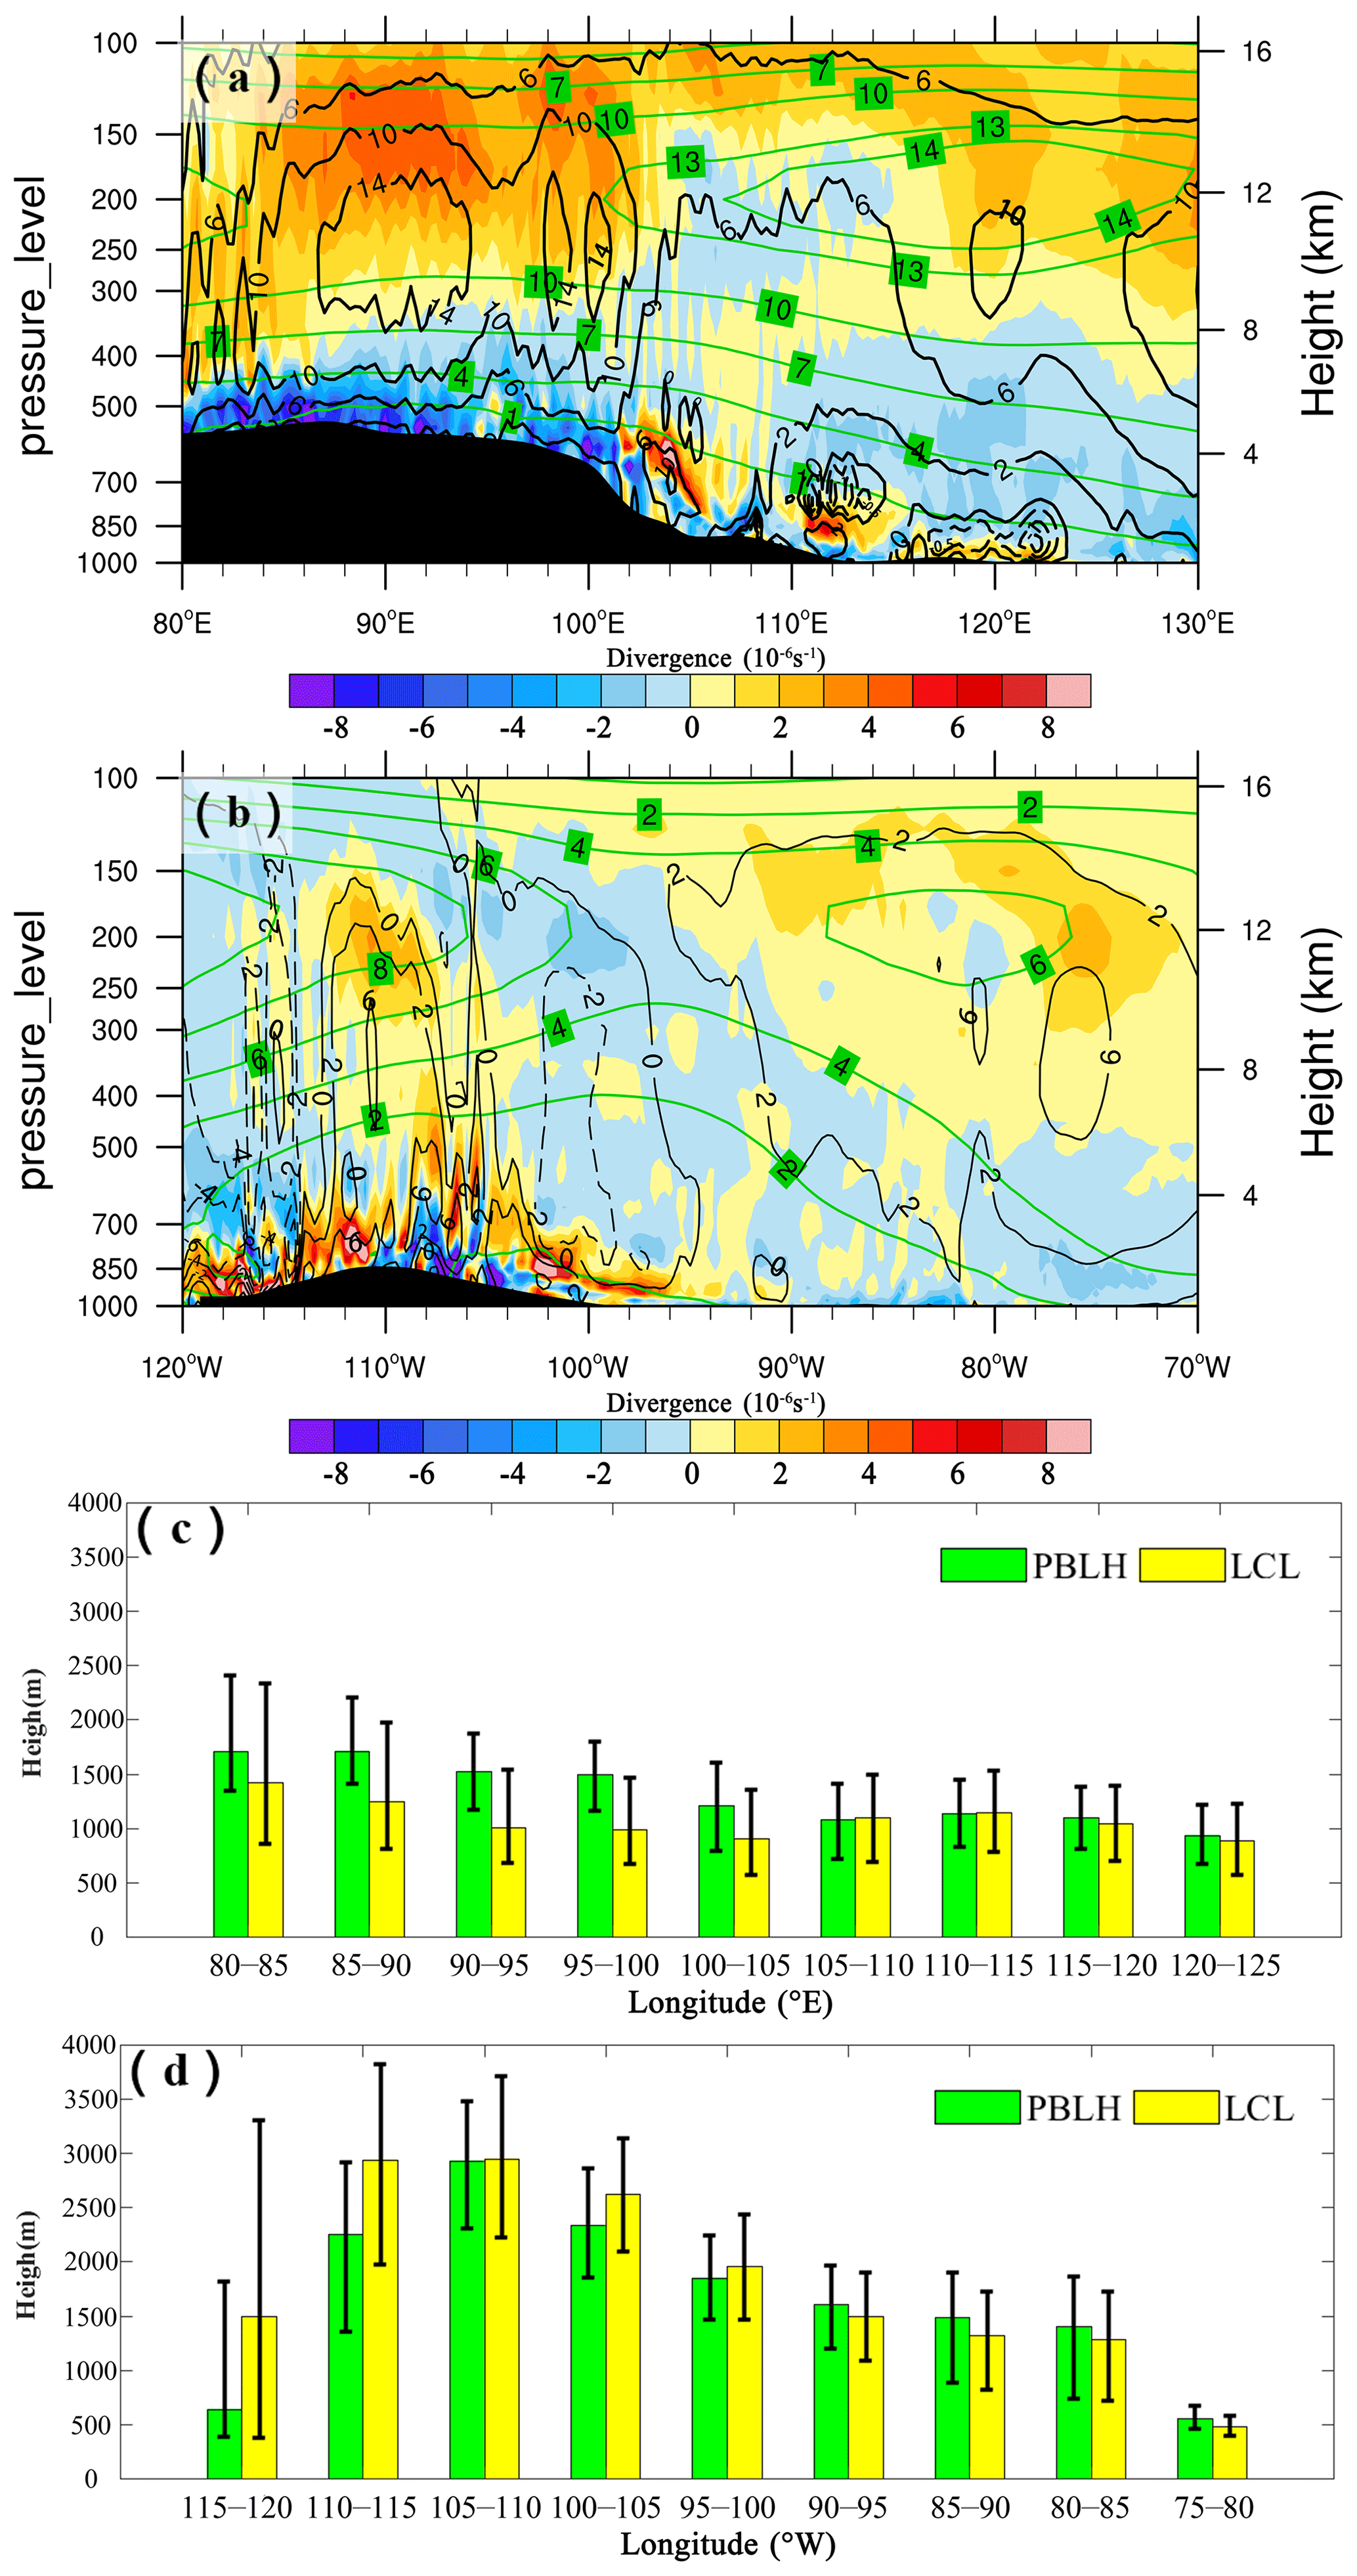
Figure 4Vertical distribution of summer mean divergence (10−6 s−1) (shaded) at 14:00 LT from 2010 to 2019 at the latitude across sections from 30 to 35∘ N in (a) East Asia and (b) North America. The green and black contours denote the summer mean U (m s−1) and W (10−2 m s−1) wind components with the zonal circulations, respectively. The solid and dashed contour lines represent the positive and negative values, respectively. The black-shaded areas represent the topography. Panels (c) and (d) are the PBLH (green) and LCL (yellow) versus longitude in East Asia and North America, respectively. The bar and error bar represent the median values and IQRs, respectively.
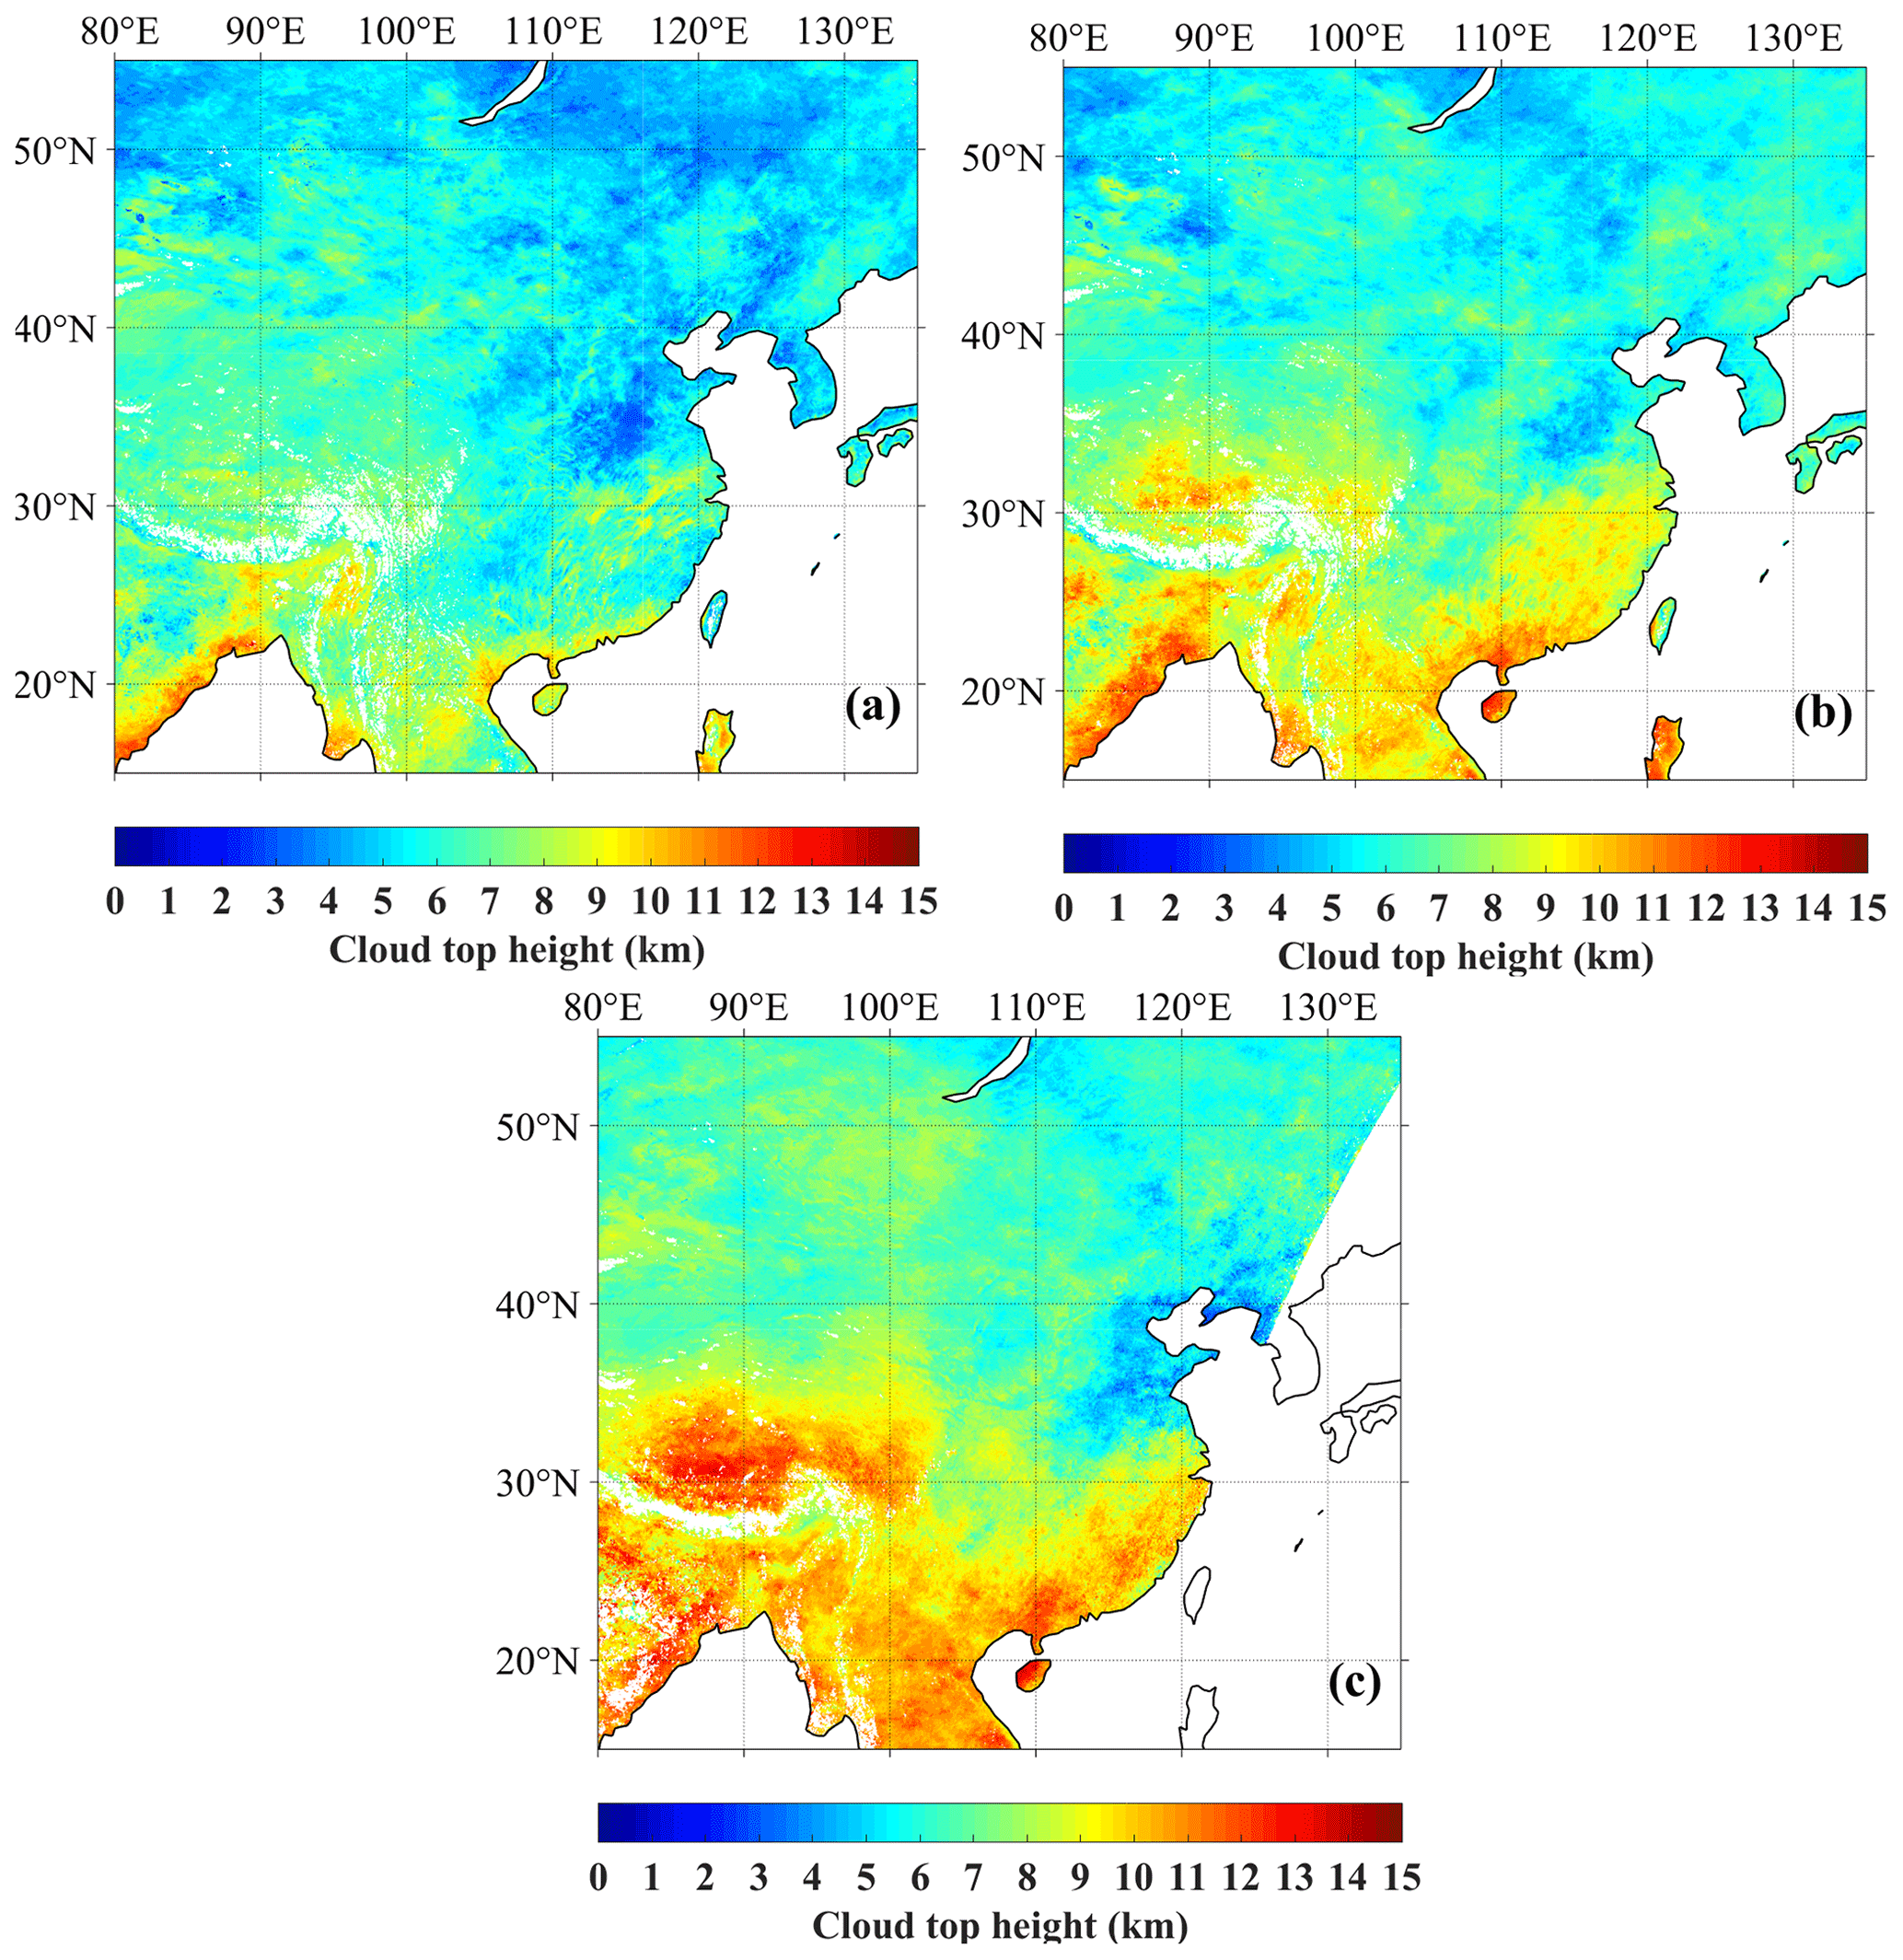
Figure 5The median cloud top height derived from the Himawari-8 retrieval product at three Beijing times: (a) 14:30 LT ± 0.5 h, (b) 16:30 LT ± 0.5 h, and (c) 18:30 LT ± 0.5 h from June to August in 2016 over land in East Asia. Missing data are shaded in white color.
By comprehensively analyzing the TIPEX II sodar data, Xu et al. (2002) and Zhou et al. (2000) found that, with narrow upward motion and a timescale from 1.2 to 1.5 h, the maximum upward motion of the thermal turbulence was identified at a height of about 120 m above the surface, with the vertical speed up to 1 m s−1. They also found symmetrical and wide downward-motion areas on either side of the narrow upward-motion zone. The question arises as to whether there is a relationship between the formation and evolution of frequent popcorn-like convective clouds and microscale thermal turbulence in the atmospheric convective boundary layer over the TP. Xu et al. (2012) speculate that these low clouds are probably initiated by strong thermal turbulence under low air density conditions. Compared to the low elevation in eastern China, the increased thermal turbulence associated with low air density over the TP leads to the different turbulence characteristics of the convective boundary layer (CBL). The CBL is mainly driven by buoyancy heat flux, and the thermal turbulence with an organized thermal plume is not totally random (Young, 1988a, b). The strong BT and ST over the TP play key roles in the convective activities in the lower troposphere.
By using the statistical results from sodar data in TIPEX II, Zhou et al. (2000) calculated the BT and ST at a height of 50 m under strong convection conditions in Dangxiong (located in the central TP). The results indicate that the BT is comparable to ST. Both the thermodynamic and dynamic processes have important influences on the convective activities. Both the BT and ST in the surface layer in Dangxiong are almost an order of magnitude greater than those at low elevations given by Brümmer (1985) over the North Sea and by Weckwerth et al. (1997) in Florida. Direct measurements from the Third Tibetan Plateau Experiments (TIPEX III) also confirmed that surface buoyancy flux over the TP is significantly larger than that in eastern China (Zhou et al., 2000; Wang et al., 2016). Both the sodar data in TIPEX II and the boundary layer tower data in TIPEX III showed that contributions of BT and ST to the turbulent kinetic energy in the lower troposphere are larger over the TP than over the southeastern margin of the TP and the low-altitude Chengdu Plain (Zhou et al., 2000; Wang et al., 2015). Thus, one might ask the question: what is the relationship between high frequent low cloud and the above physical quantities (e.g., turbulence structure, temperature, and humidity) under low air density conditions over the TP? The physical mechanism should be discussed and analyzed. In addition, at low elevation in eastern China, the question arises as to whether or not the variations of PBLH and LCL favor the formation and development of low clouds.
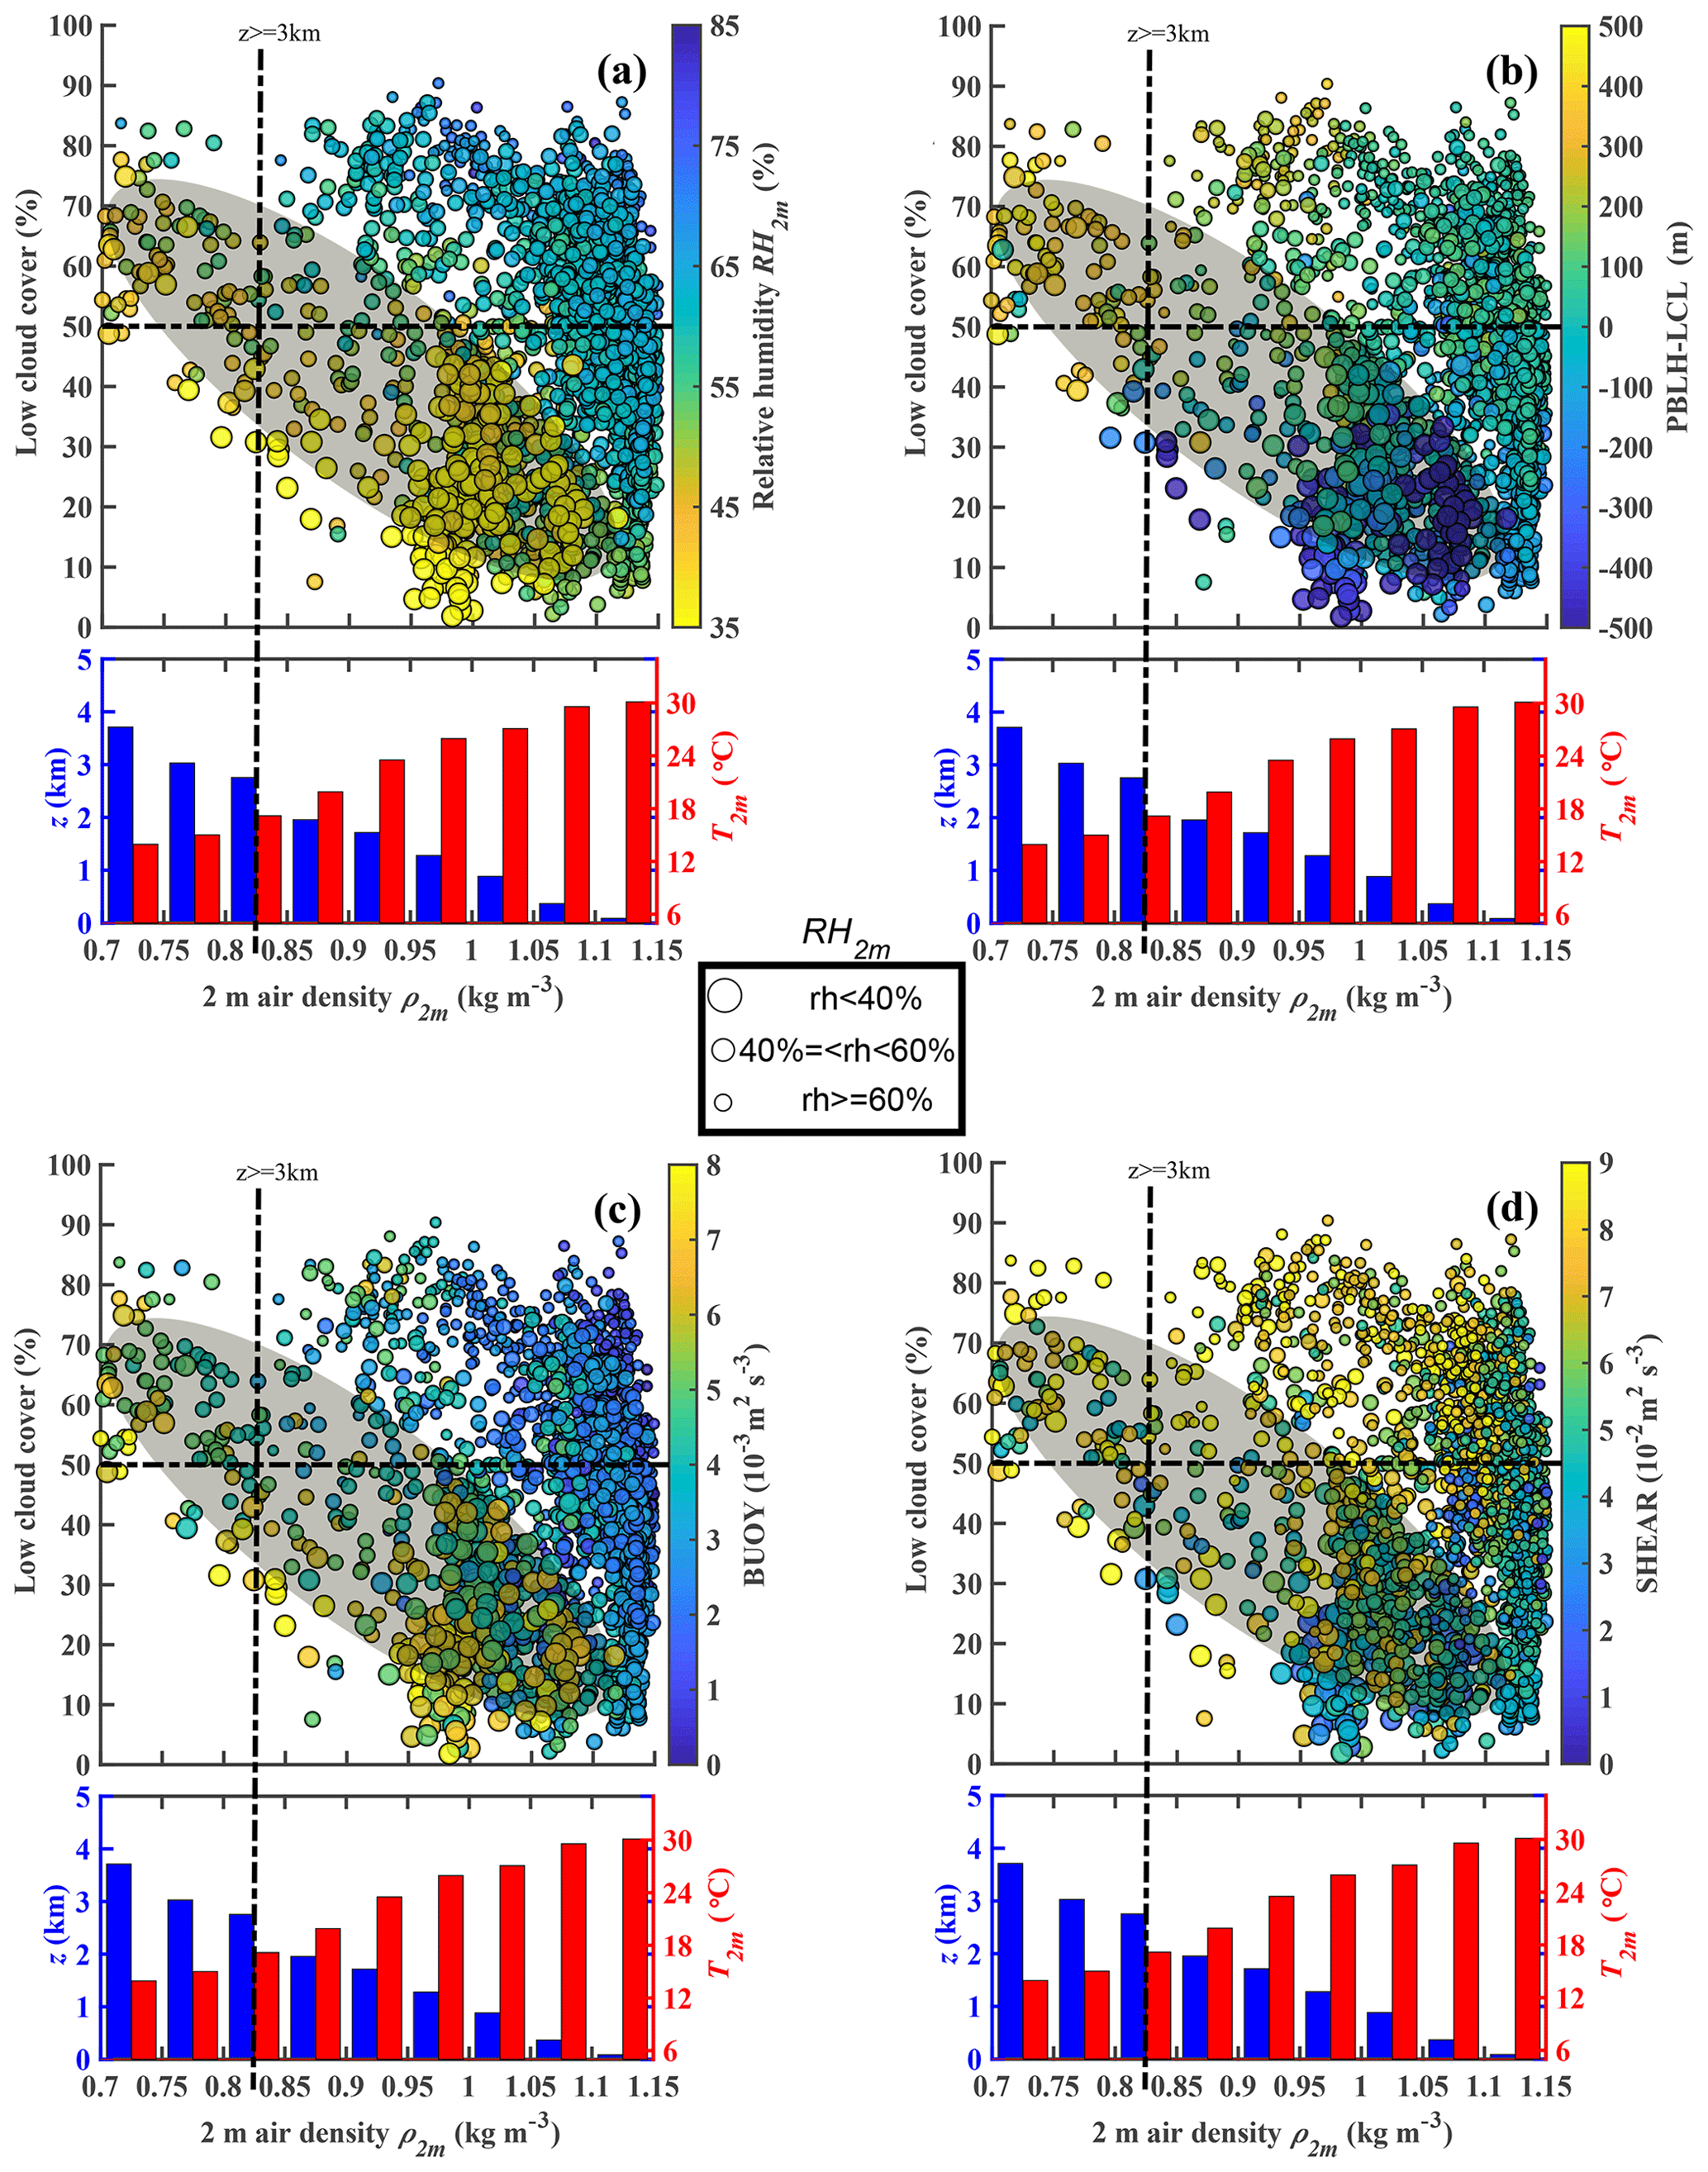
Figure 6The relationships among monthly means of LCC, ρ2 m, and (a) RH2 m, (b) PBLH–LCL, (c) BT, and (d) ST at 14:00 Beijing time from 2010 to 2019 in summer in China. The samples are divided into three groups: RH2 m ≧ 60 % (small-sized dots), 60 % > RH2 m ≧ 40 % (medium-sized dots), and RH2 m < 40 % (large-sized dots). The LCC, T2 m, and RH2 m are observed by in situ measurements, and PBLH, LCL, BT, and ST are derived from ERA5 reanalysis data. Here we use the nearest-neighbor gridding method to derive PBLH, LCL, BT, and ST at each site. The blue and red histograms show the surface elevation z (blue) and air temperature at 2 m (T2 m) (red) as functions of 2 m air density (ρ2 m). The dots with lower RH2 m (RH2 m < 40 %) are mostly distributed within grey-shaded elliptic regions as shown in panels (a)–(d).
As shown in Fig. 6a, compared to the low elevation, there is larger LCC (LCC > 50 %) over the TP (ASL > 3 km) under low-RH2 m conditions (RH2 m < 40 %). In contrast, larger LCC mostly corresponds to a higher-RH2 m condition at low elevation, which is consistent with our common sense. The above interesting phenomenon can be explained by the differences in PBLH–LCL between the TP and low-elevation regions on summer afternoons. These differences are mainly attributed to the following two mechanisms. The first mechanism is that, with a similar sensible heat flux, the lower air density over the TP leads to greater surface buoyancy flux (or BT) as shown in Fig. 6c, which is conducive to the increase in PBLH over the TP. Figure 6d shows great ST over the TP, which is mainly attributed to high wind speed. Although here we only show the ST in the surface layer, strong wind shear in the boundary layer probably also plays a role in increasing PBLH over the TP. On the other hand, the second mechanism is that, with a similar RH, Wang et al. (2020) have indicated that, compared to the low elevation in eastern China, the lower temperature over the TP leads to a lower LCL. Together these two mechanisms lead to a greater (PBLH–LCL) difference over the TP on summer afternoons, which increases the probability of air parcels reaching the LCL and forming clouds as shown in Fig. 6b. In most cases, the positive value of PBLH–LCL as well as the great BT and ST over the TP correspond to larger LCC (LCC > 50 %) under low-RH2 m conditions (RH2 m < 60 %), which implies that the enhanced local LCC is relevant to the diurnal variation of the PBL process. In contrast, for eastern China, in most cases, the increased LCC (LCC > 50 %) generally corresponds to high RH2 m (RH2 m > 60 %), and the LCC is not significantly correlated with PBLH–LCL or BT and ST, which implies that other factors besides the PBL process (e.g., large-scale ascending motion) play a more important role in LCC.
Figure 7d shows the mean spatial distribution of PBLH–LCL in the Northern Hemisphere from June to August 2010–2019. The TP (27–40∘ N, 70–105∘ E) and Rocky Mountains (27–40∘ N, 103–120∘ W) are two typical large-topography regions in the Northern Hemisphere, and the mean PBLH–LCL values over the TP and Rocky Mountains are 376.7 and −101.9 m, respectively.
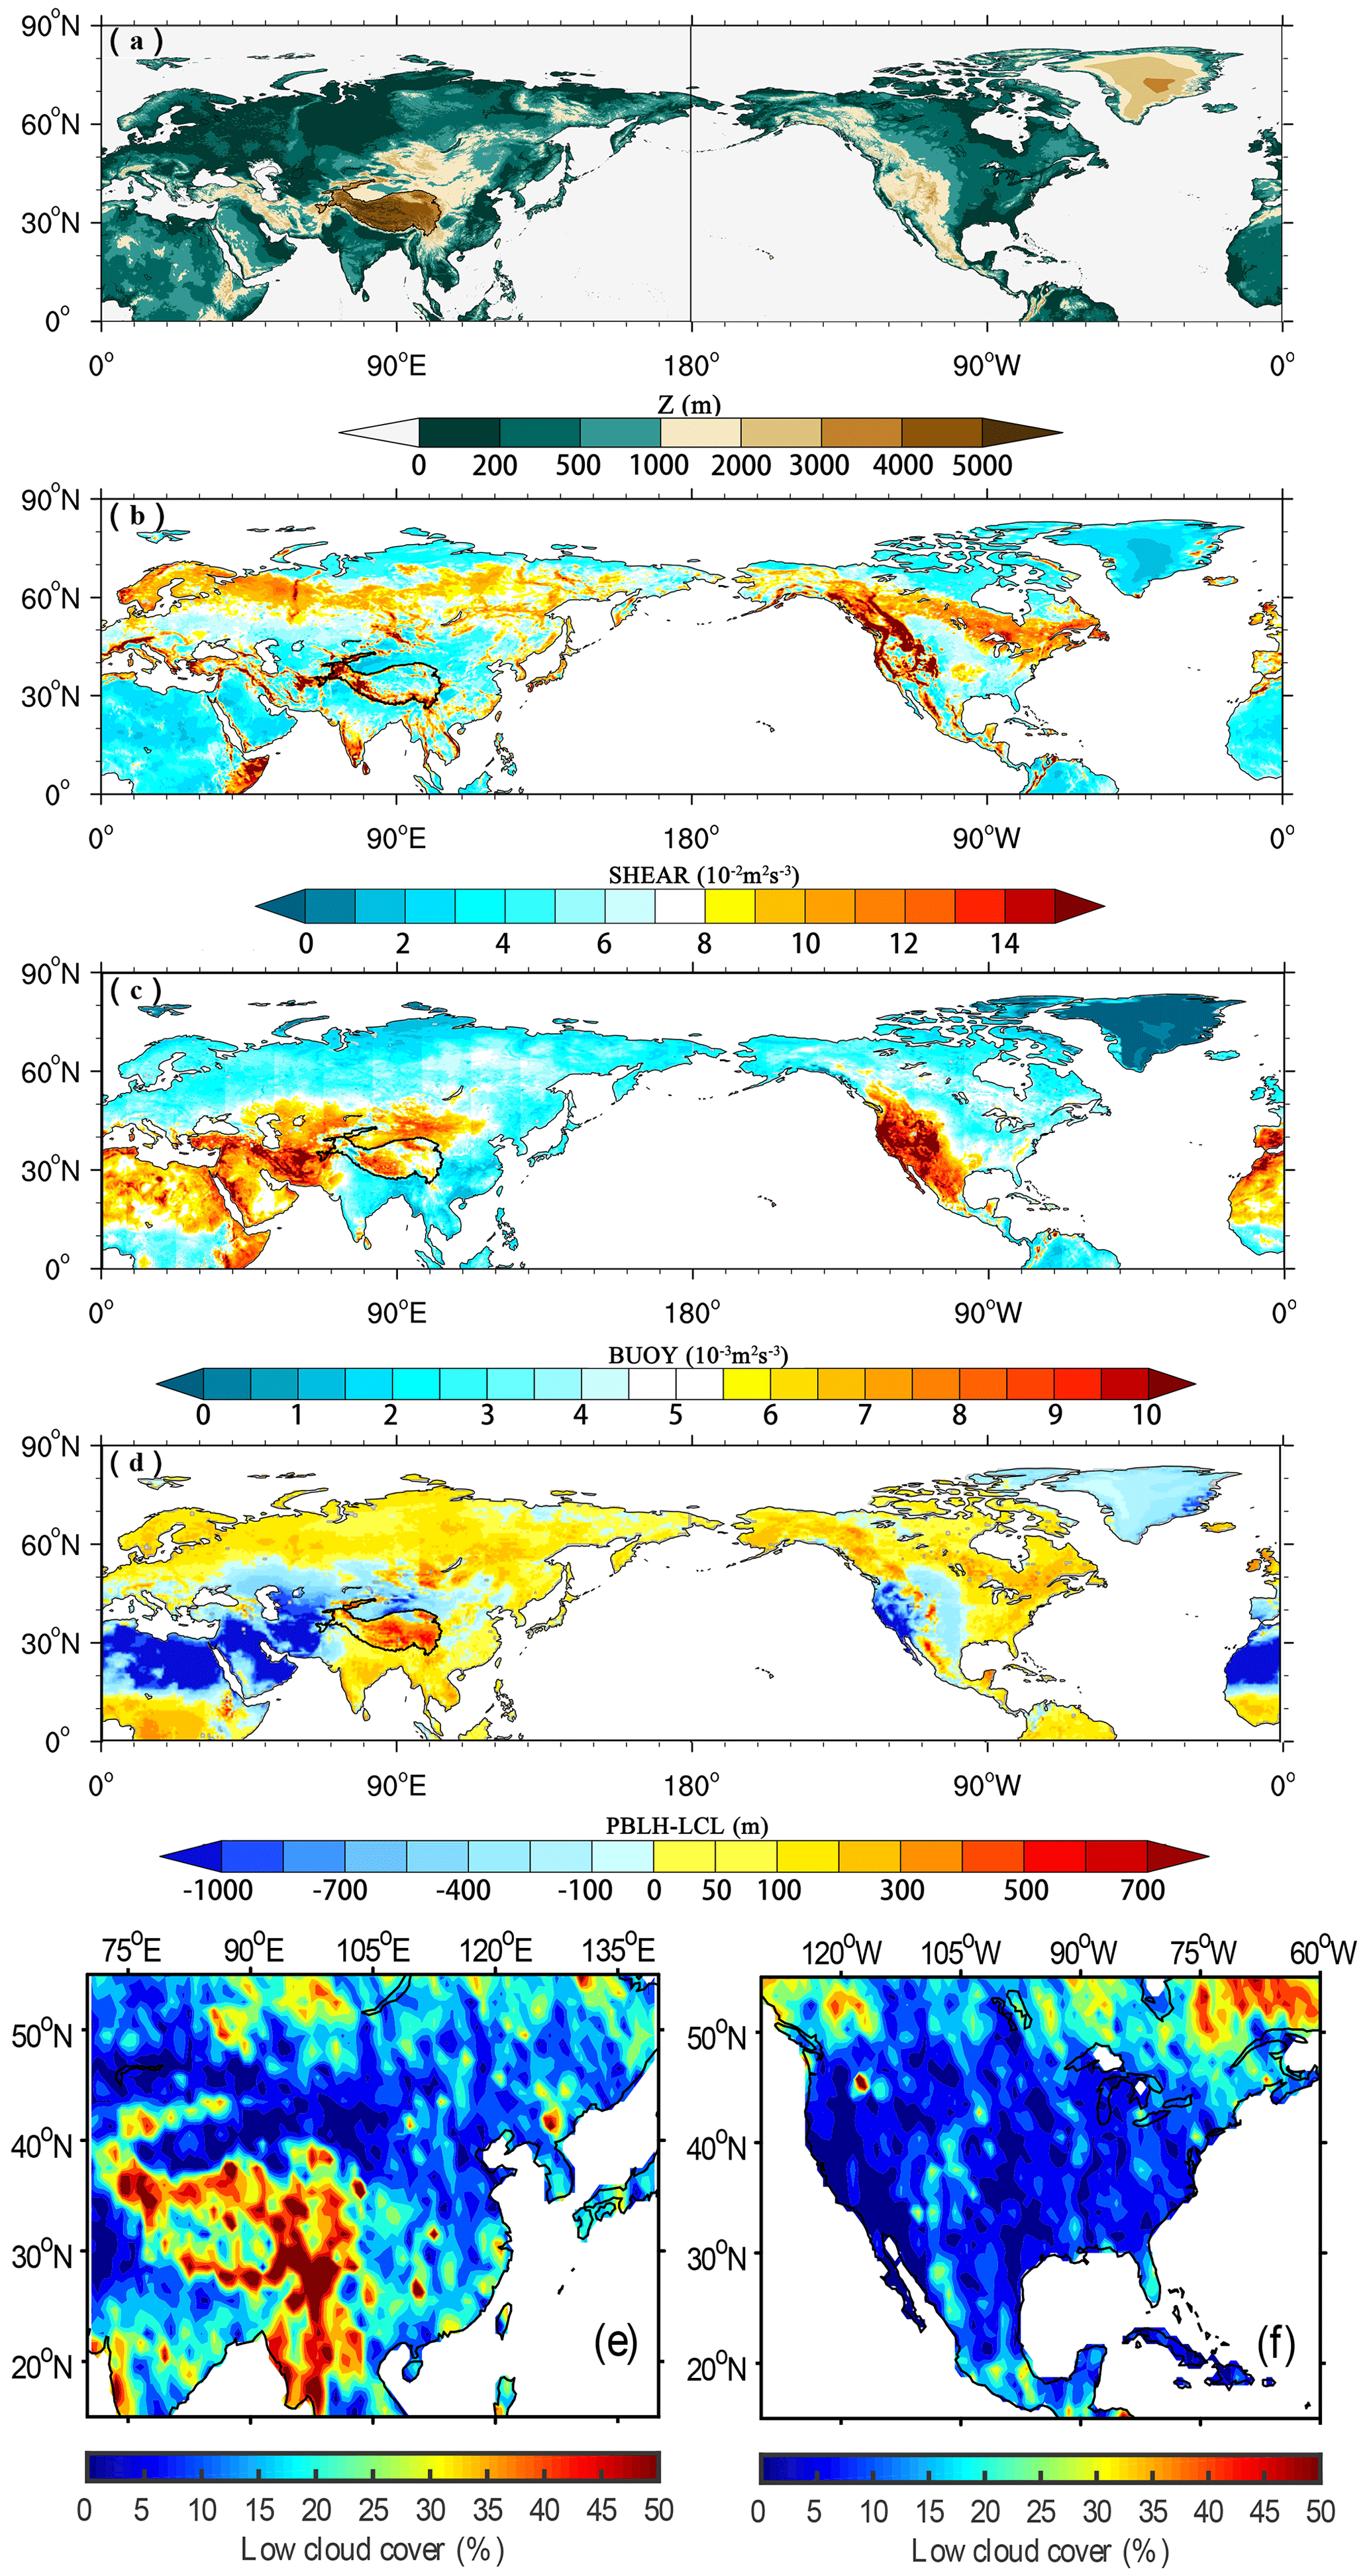
Figure 7The spatial distribution of (a) ground-level elevation (m), (b) ST (10−2 m2 s−3), (c) BT (10−3 m2 s−3), and (d) PBLH–LCL (m) derived from ERA5 reanalysis data at 14:00 LT in the Northern Hemisphere in summer. Panels (e) and (f) are the summer mean LCC (%) derived from CloudSat satellite data at 14:00 LT in East Asia and North America, respectively.
Figure 7b–c show the spatial distributions of ST and BT in the Northern Hemisphere from June to August 2010–2019, respectively. The effect of strong thermal turbulence results in obvious positive values of PBLH–LCL in high-elevation regions under low air density conditions in the Northern Hemisphere (BT = 0.008 m2 s−3, PBLH–LCL = 376.7 m over the TP and BT = 0.011 m2 s−3, and PBLH–LCL = −101.9 m over the Rocky Mountains). Figure 7b also shows that there are strong STs in these two high-elevation regions (ST = 0.087 m2 s−3 over the TP, and ST = 0.085 m2 s−3 over the Rocky Mountains). Both the BT and ST increase significantly at high elevation due to low air density compared to those at low elevation. The above results enlighten us on thinking about whether the triggering effects of large topography and boundary layer turbulence, which reflect the special surface characteristics in the boundary layer at high-elevation regions under low air density conditions, can be applicable for any large topography in the globe, including the TP and other regions (e.g., Rocky Mountains).
Figure 8 shows a conceptual model of the atmosphere from the near surface to the upper troposphere over the TP. Compared to the low elevation, the TP is characterized by higher PBLH and lower LCL because of a strong BT and ST, which is favorable for the formation of shallow clouds in the afternoon. Meanwhile, the large-scale ascending motion over the TP results in the transition from shallow clouds to deep convective clouds in the late afternoon and evening.
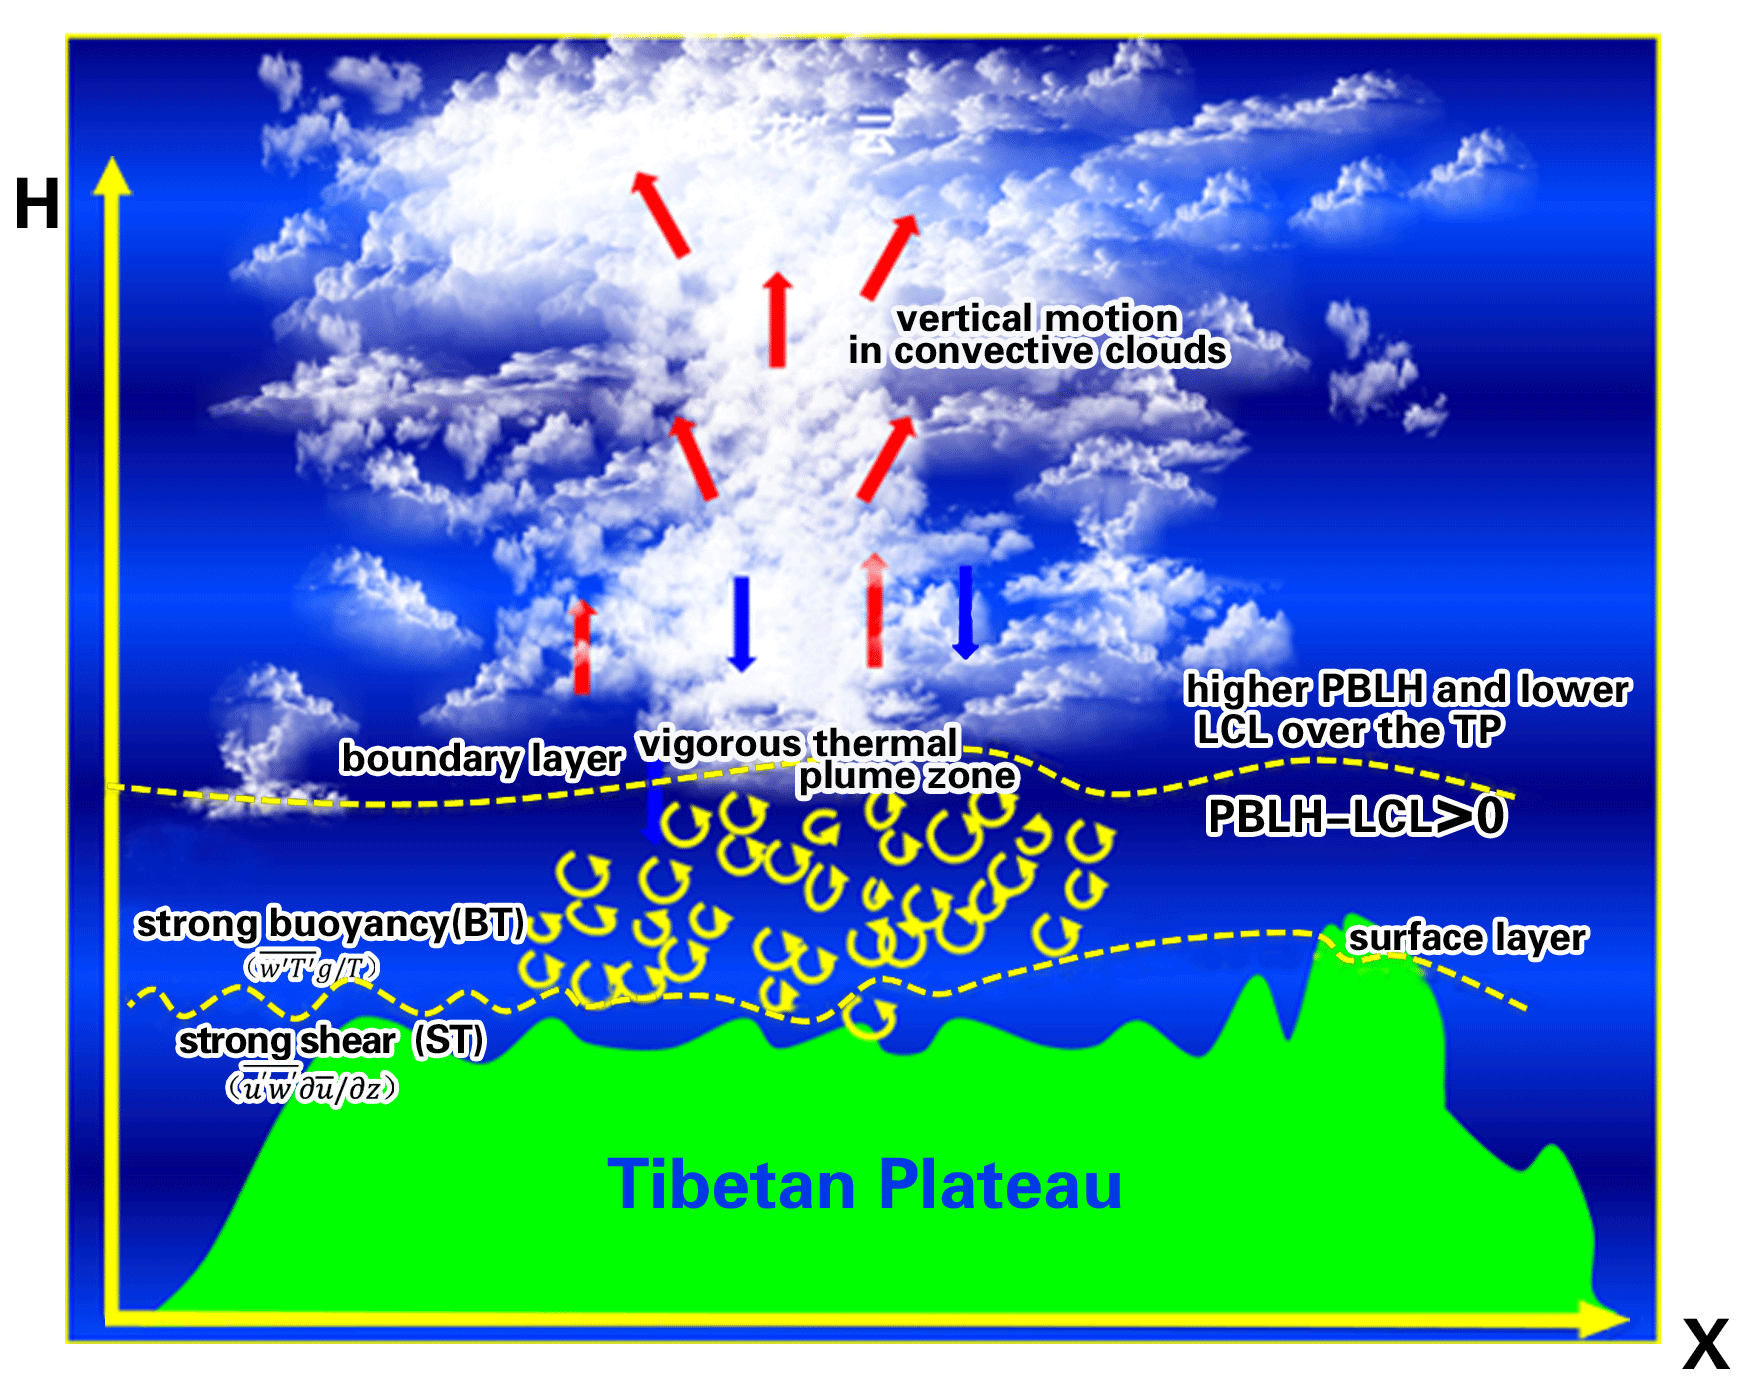
Figure 8The characteristic model of boundary layer turbulence related to “high-efficiency” triggering mechanisms for convection over the TP.
In this study, we focus on the triggering effects of large topography and boundary layer turbulence over the Tibetan Plateau on convection. The topography of the TP plays a major role in the increased occurrences of convective clouds. Our results further confirm the conclusions from Wang et al. (2020), which found that the difference PBLH–LCL in the summer afternoons over the TP is greater than that in eastern China. Compared to eastern China, with the same relative humidity, lower temperature over the TP results in a lower lifting condensation level. With the same surface sensible heat flux, lower air density over the TP results in a larger buoyancy flux and a deeper boundary layer. The observational results show that, under low relative humidity conditions (RH < 40 %), the low cloud cover (LCC) is higher than 60 % over the TP. In contrast, the high LCC (LCC > 60 %) only appears under high-RH conditions (RH > 60 %) at low elevations.
In general, LCC increases with increasing elevation. The median of LCCs at high elevation (TP) is significantly greater than those at low elevation (eastern China) throughout the day. The diurnal variations of LCC at low elevation are generally distributed in a unimodal pattern, with the maximum appearing at 14:00 Beijing time and low values during the night. The diurnal variations of LCC at high elevation (TP) present a bimodal curve, with the maximum appearing at 17:00 Beijing time and the secondary local maximum appearing at 08:00 Beijing time. In addition, LCC maintains high values at high elevation (TP) during the day. The median cloud top height derived from the Himawari-8 retrieval product shows the transition from shallow clouds to deep convective clouds in the late afternoon and evening over the TP, which is attributed to the strong large-scale ascending motion from the near surface to the upper troposphere over the TP.
The buoyancy term (BT) and shear term (ST) over the TP are significantly greater than those at the low elevation, which is favorable for the increasing PBLH. Similar phenomena occur in other high-elevation areas (e.g., the Rocky Mountains). The strong thermal turbulence and large-scale ascending motion jointly result in a positive value of PBLH–LCL under low-RH conditions over the TP. The obvious large-scale subsidence on both sides of the Rocky Mountains, especially the western side, leads to inversion above the PBL and lower RH within the PBL, which further leads to negative values of PBLH–LCL and decreased LCC in most parts of the Rocky Mountains. The slightly greater-than-zero PBLH–LCL corresponds spatially to increased LCC in the partial regions of the central Rocky Mountains. Thus, less LCC is generated at the Rocky Mountains compared to the TP.
The data in this study are analyzed with MATLAB and NCL. Contact Yinjun Wang for specific code requests.
All reanalysis data used in this study were obtained from publicly available sources: ERA5 reanalysis data can be obtained from the ECMWF public datasets web interface https://cds.climate.copernicus.eu/#!/search?text=era5 (Copernicus Climate Change Service, 2023), and ERA5 data documentation can be obtained from https://confluence.ecmwf.int/display/CKB/ERA5%3A+data+documentation (ECMWF, 2023; Hersbach et al., 2020). The satellite (CloudSat radar and Calipso lidar)-merged cloud classification product 2B-CLDCLASS-lidar summarized in Sassen and Wang (2008) can be obtained from Colorado State University https://www.cloudsat.cira.colostate.edu/order/ (last access: 14 March 2023) after ordering successfully, and the publications by using these data are available at https://www.cloudsat.cira.colostate.edu/publications (last access: 14 March 2023). The Himawari-8 user's guide can be obtained from https://www.eorc.jaxa.jp/ptree/userguide.html (Japan Meteorological Agency, 2023), and Himawari-8 retrieval products summarized in Iwabuchi et al. (2018) are available at ftp://ftp.ptree.jaxs.jp (last access: 14 March 2023) after registration.
The supplement related to this article is available online at: https://doi.org/10.5194/acp-23-3299-2023-supplement.
XX and YW led this work with contributions from all the authors. YT and YW made the calculations and created the figures. XX, YW, HZ, and MZ led the analyses, interpreted the results, and wrote the paper. RL supports high-resolution satellite Gaofen images to show the organized structures (cellular convection) for shallow convection.
The contact author has declared that none of the authors has any competing interests.
Publisher's note: Copernicus Publications remains neutral with regard to jurisdictional claims in published maps and institutional affiliations.
We deeply appreciate the three reviewers' constructive comments that greatly helped us to improve the quality of the article.
Xiangde Xu and Yinjun Wang are supported by the Second Tibetan Plateau Scientific Expedition and Research (STEP) program (grant no. 2019QZKK0105), major projects of Natural Science Foundation (grant no. 91337000), National Natural Science Foundation of China (grant no. 91837310), and the National Natural Science Foundation for Young Scientists of China (grant no. 41805006).
This paper was edited by Jianping Huang and reviewed by three anonymous referees.
Brümmer, B.: Structure, dynamics and energetics of boundary layer rolls from Kon Tur aircraft observations, Contributions to Atmospheric Physics, 58, 237–254, 1985.
Copernicus Climate Change Service: ERA5 reanalysis data, C3S [data set], https://cds.climate.copernicus.eu/#!/search?text=era5, last access: 14 March 2023.
Dyer, A. J.: A review of flux-profile relationships, Bound.-Lay. Meteorol., 7, 363–372, https://doi.org/10.1007/bf00240838, 1974.
ECMWF: ERA5: data documentation, European Centre for Medium-Range Weather Forecasts [data set], https://confluence.ecmwf.int/display/CKB/ERA5%3A+data+documentation, last access: 14 March 2023.
Ek, M. and Mahrt, L.: Daytime Evolution of Relative Humidity at the Boundary Layer Top, Mon. Weather Rev., 122, 2709–2721, https://doi.org/10.1175/1520-0493(1994)122<2709:DEORHA>2.0.CO;2, 1994.
Findell, K. L. and Eltahir, E. A. B.: Atmospheric Controls on Soil Moisture–Boundary Layer Interactions. Part I: Framework Development, J. Hydrometeorol., 4, 552–569, https://doi.org/10.1175/1525-7541(2003)004<0552:ACOSML>2.0.CO;2, 2003.
Flohn, H. and Reiter, E. R.: Contributions to a meteorology of the Tibetan highlands, Atmos. Sci. Pap., vol. 130, 120 pp., Dept. of Atmos. Sci., Colo. State Univ., Fort Collins, 1967.
Gentine, P., Holtslag, A. A. M., D'Andrea, F., and Ek, M.: Surface and Atmospheric Controls on the Onset of Moist Convection over Land, J. Hydrometeorol., 14, 1443–1462, https://doi.org/10.1175/JHM-D-12-0137.1, 2013.
Gryanik, V. M., Lüpkes, C., Grachev, A., and Sidorenko, D.: New modified and extended stability functions for the stable boundary layer based on SHEBA and parametrizations of bulk transfer coefficients for climate models. J. Atmos. Sci., 77, 2687–2716, https://doi.org/10.1175/JAS-D-19-0255.1, 2020.
Guillod, B. P., Orlowsky, B., Miralles, D. G., Teuling, A. J., and Seneviratne, S. I.: Reconciling spatial and temporal soil moisture effects on afternoon rainfall, Nat. Commun., 6, 6443, https://doi.org/10.1038/ncomms7443, 2015.
Hersbach, H., Bell, B., Berrisford, P., Hirahara, S., Horányi, A., Muñoz-Sabater, J., Nicolas, J., Peubey, C., Radu, R., Schepers, D., Simmons, A., Soci, C., Abdalla, S., Abellan, X., Balsamo, G., Bechtold, P., Biavati, G., Bidlot, J., Bonavita, M., Chiara, G. D., Dahlgren, P., Dee, D., Diamantakis, M., Dragani, R., Flemming, J., Forbes, R., Fuentes, M., Geer, A., Haimberger, L., Healy, S., Hogan, R. J., Hólm, E., Janisková, M., Keeley, S., Laloyaux, P., Lopez, P., Lupu, C., Radnoti, G., Rosnay, P. de, Rozum, I., Vamborg, F., Villaume, S., and Thépaut, J.-N.: The ERA5 global reanalysis, Q. J. Roy. Meteor. Soc., 146, 1999–2049, https://doi.org/10.1002/qj.3803, 2020.
Iwabuchi, H., Putri, N. S., Saito, M., Tokoro, Y., Sekiguchi, M., Yang, P., and Baum, B. A.: Cloud property retrieval from multiband infrared measurements by Himawari-8, J. Meteorol. Soc. Jpn. Ser. II, 96B, 27–42, https://doi.org/10.2151/jmsj.2018-001, 2018.
Japan Meteorological Agency (JMA): JAXA Himawari Monitor, user's guide, https://www.eorc.jaxa.jp/ptree/userguide.html, last access: 14 March 2023.
Li, Y. and Zhang, M.: Cumulus over the Tibetan Plateau in the Summer Based on CloudSat–CALIPSO Data, J. Climate, 29, 1219–1230, https://doi.org/10.1175/JCLI-D-15-0492.1, 2016.
Luo, Y., Zhang, R., Qian, W., Luo, Z., and Hu, X.: Intercomparison of Deep Convection over the Tibetan Plateau–Asian Monsoon Region and Subtropical North America in Boreal Summer Using CloudSat/CALIPSO Data, J. Climate, 24, 2164–2177, https://doi.org/10.1175/2010JCLI4032.1, 2011.
Romps, D. M.: Exact expression for the lifting condensation level, J. Atmos. Sci., 74, 3891–3900, https://doi.org/10.1175/JAS-D-17-0102.1, 2017.
Sassen, K. and Wang, Z.: Classifying clouds around the globe with the CloudSat radar: 1-year of results, Geophys. Res. Lett., 35, L04805, https://doi.org/10.1029/2007GL032591, 2008.
Smith, R. K.: On the theory of CISK, Q. J. Roy. Meteor. Soc., 123, 407–418, 1997.
Stull, R. B.: Mean Boundary Layer Characteristics, in: An Introduction to Boundary Layer Meteorology, edited by: Stull, R. B., Springer Netherlands, Dordrecht, 1–27, https://doi.org/10.1007/978-94-009-3027-8_1, 1988.
Sugimoto, S. and Ueno, K.: Role of Mesoscale Convective Systems Developed around the Eastern Tibetan Plateau in the Eastward Expansion of an Upper Tropospheric High during the Monsoon Season, J. Meteorol. Soc. Jpn. Ser. II, 90, 297–310, https://doi.org/10.2151/jmsj.2012-209, 2012.
Taylor, C. M., de Jeu, R. A. M., Guichard, F., Harris, P. P., and Dorigo, W. A.: Afternoon rain more likely over drier soils, Nature, 489, 423–426, https://doi.org/10.1038/nature11377, 2012.
Tuttle, S. and Salvucci, G.: Empirical evidence of contrasting soil moisture–precipitation feedbacks across the United States, Science, 352, 825–828, https://doi.org/10.1126/science.aaa7185, 2016.
Wang, Y., Xu, X., Zhao, T., Sun, J., Yao, W., and Zhou, M.: Structures of convection and turbulent kinetic energy in boundary layer over the southeastern edge of the Tibetan Plateau, Sci. China Earth Sci., 58, 1198–1209, https://doi.org/10.1007/s11430-015-5054-1, 2015.
Wang, Y., Xu, X., Liu, H., Li, Y., Li, Y., Hu, Z., Gao, X., Ma, Y., Sun, J., Lenschow, D. H., Zhong, S., Zhou, M., Bian, X., and Zhao, P.: Analysis of land surface parameters and turbulence characteristics over the Tibetan Plateau and surrounding region, J. Geophys. Res.-Atmos., 121, 9540–9560, https://doi.org/10.1002/2016JD025401, 2016.
Wang, Y., Zeng, X., Xu, X., Welty, J., Lenschow, D. H., Zhou, M., and Zhao, Y.: Why Are There More Summer Afternoon Low Clouds Over the Tibetan Plateau Compared to Eastern China?, Geophys. Res. Lett., 47, e2020GL089665, https://doi.org/10.1029/2020GL089665, 2020.
Weckwerth, T. M., Wilson, J., Wakimoto, R., and Crook, N. A.: Horizontal convective rolls: Determining the environmental conditions supporting their existence and characteristics, Mon. Weather Rev., 125, 505–526, https://doi.org/10.1175/1520-0493(1997)125<0505:hcrdte>2.0.co;2, 1997.
Wu, G., Duan, A., Liu, Y., Mao, J., Ren, R., Bao, Q., He, B., Liu, B., and Hu, W.: Tibetan Plateau climate dynamics: recent research progress and outlook, Natl. Sci. Rev., 2, 100–116, https://doi.org/10.1093/nsr/nwu045, 2015.
Xu, X., Zhou, M., Chen, J., Bian, L., Zhang, G., Liu, H., Li, S., Zhang, H., Zhao, Y., Suolongduoji, and Jizhi, W.: A comprehensive physical pattern of land-air dynamic and thermal structure on the Qinghai-Xizang Plateau, Sci. China Ser. D, 45, 577–594, https://doi.org/10.1360/02yd9060, 2002.
Xu, X., Zhang, R., Koike, T., Lu, C., Shi, X., Zhang, S., Bian, L., Cheng, X., Li, P., and Ding, G.: A New Integrated Observational System Over the Tibetan Plateau, B. Am. Meteorol. Soc., 89, 1492–1496, https://doi.org/10.1175/2008BAMS2557.1, 2008.
Xu, X., Shi, X., and Lu, C.: Theory and Application for Warning and Prediction of Disastrous Weather Downstream from the Tibetan Plateau, Novinka Science Publishers, Inc., New York, ISBN 9781621004332, 2012.
Xu, X., Zhao, T., Lu, C., Guo, Y., Chen, B., Liu, R., Li, Y., and Shi, X.: An important mechanism sustaining the atmospheric “water tower” over the Tibetan Plateau, Atmos. Chem. Phys., 14, 11287–11295, https://doi.org/10.5194/acp-14-11287-2014, 2014.
Yi, C. and Guo, X.: Characteristics of convective cloud and precipitation during summer time at Naqu over Tibetan Plateau, Chinese Sci. Bull., 61, 1706–471, https://doi.org/10.1360/N972015-01292, 2016 (in Chinese).
Young, G. S.: Convection in the atmospheric boundary layer, Earth-Sci. Rev., 25, 179–198, https://doi.org/10.1016/0012-8252(88)90020-7, 1988a.
Young, G. S.: Turbulence Structure of the Convective Boundary Layer. Part I. Variability of Normalized Turbulence Statistics, J. Atmos. Sci., 45, 719–726, https://doi.org/10.1175/1520-0469(1988)045<0719:TSOTCB>2.0.CO;2, 1988b.
Zhou, M., Xu, X., Bian, L., Chen, J., Liu H., Zhang, H., Li, S., and Zhao J.: Observational analysis and dynamic study of atmospheric boundary layer on Tibetan Plateau, China Meteorology Press, Beijing, 125 pp., ISBN 9787502929664, 2000 (in Chinese).
high-efficiencytriggering mechanism for convection over the TP and whether there is an association among low air density and strong turbulence and ubiquitous popcorn-like cumulus clouds.