the Creative Commons Attribution 4.0 License.
the Creative Commons Attribution 4.0 License.
 | 09 Mar 2023
Characteristics of supersaturation in midlatitude cirrus clouds and their adjacent cloud-free air
Georgios Dekoutsidis
Silke Groß
Martin Wirth
Martina Krämer
Christian Rolf
Water vapor measurements of midlatitude cirrus clouds, obtained by the WAter vapour Lidar Experiment in Space (WALES) lidar system during the Mid-Latitude Cirrus (ML-CIRRUS) airborne campaign, which took place in the spring of 2014 over central Europe and the NE Atlantic Ocean, are combined with model temperatures from the European Centre for Medium-Range Weather Forecasts (ECMWF) and analyzed. Our main focus is to derive the distribution and temporal evolution of humidity with respect to ice within cirrus clouds and in their adjacent cloud-free air. We find that 34.1 % of in-cloud data points are supersaturated with respect to ice. Supersaturation is also detected in 6.8 % of the cloud-free data points. When the probability density of the relative humidity over ice (RHi) is calculated with respect to temperature for the in-cloud data points from the ML-CIRRUS dataset, there are two peaks: one around 225 K and close to saturation, RHi = 100 %, and a second one at colder temperatures around 218 K in subsaturation, RHi = 79 %. These two regions seem to represent two cirrus cloud categories: in situ formed and liquid origin. Regarding their vertical structure, most clouds have higher supersaturations close to the cloud top and become subsaturated near the cloud bottom. Finally, we find that the vertical structure of RHi within the clouds is also indicative of their life stage. RHi skewness tends to go from positive to negative values as the cloud ages. RHi modes are close to saturation in young clouds, supersaturated in mature clouds and subsaturated in dissipating clouds.
- Article
(5650 KB) - Full-text XML
- BibTeX
- EndNote


Cirrus clouds greatly affect Earth's climate system, primarily through their impact on the radiation budget (Manabe and Strickler, 1964; Cox, 1971; Ramanathan et al., 1983; Liou, 1986; Stephens et al., 1990; Chen et al., 2000; Gasparini et al., 2018). Despite that, the exact effects are still not certain (IPCC, 2007, 2013). Typically, they are considered to have a net warming effect (Chen et al., 2000), but this can differ between clouds with varying characteristics (Joos et al., 2014; Krämer et al., 2020). The radiative effects of midlatitude cirrus clouds strongly depend on their microphysical properties, such as ice crystal shape, size and concentration (Stephens et al., 1990; Haag and Kärcher, 2004; Fusina et al., 2007), which are in turn largely determined by their initial freezing mechanism and ambient conditions (e.g., temperature, available aerosol, turbulence) (Heymsfield, 1977; Khvorostyanov and Sassen, 1998; Kärcher and Lohmann, 2003; Seifert et al., 2004; Gensch et al., 2008; Krämer et al., 2016; Luebke et al., 2016). Modeling of these small-scale microphysical processes – for which much still remains unknown – proves to be a challenge (Burkhardt, 2013; Kärcher, 2017). Thus, most models use parametrizations and approximations, leading to inaccuracies in the prediction of cirrus clouds, their radiative effects and interactions with aerosols (Kärcher et al., 2006; Liu and Penner, 2005; Phillips et al., 2008). To improve the model predictions and to be able to determine with greater precision the effects that midlatitude cirrus clouds have on the climate, a better understanding of the micro- and macrophysical and optical properties of these clouds is needed (Haag et al., 2003; Di Girolamo et al., 2009; Groß et al., 2014).
Measurements of cirrus clouds can be conducted either in situ or with remote sensing instruments, such as lidar. For in situ measurements the instruments are aircraft-bound and flown through the cirrus clouds. With this method specific clouds can be selected and parts of the cloud in different evolutionary stages can be measured. A downside is that measurements can be conducted only at one selected flight level at a time. Thus, in situ measurements do not provide information about the vertical structure of the clouds. Lidar measurements on the other hand have the advantage of providing a 2D curtain of the measured clouds, giving information also on their vertical structure. Lidar instruments can be ground-based, airborne or satellite-bound. Ground-based lidars are capable of measuring cirrus clouds with great spatial and temporal resolution (Comstock et al., 2002, 2004), but they lack versatility. Ground-based lidars can only measure clouds that happen to pass over them at one location. This way the collected data can be used for statistical analysis, rather than case studies, as the measured clouds cannot be chosen, and it is uncertain which parts of the clouds and at which evolutionary stages it will overpass the lidar. Satellite remote sensing with lidar also provides 2D measurements of cirrus clouds, but they lack accuracy, compared to the other methods, because of the distance between instrument and cloud and can only measure clouds along their flight tracks. Finally, airborne lidar measurements are the most versatile and accurate. Specific clouds can be selected and the measurements can be conducted in such a way that many different parts and evolutionary stages of the cloud are measured. That way, the vertical structure can be measured for different stages of the cloud's life cycle.
Various lidar measurement techniques have been developed with a multitude of applications, capable of measuring polarization, temperature, wind speed, backscatter and others. The high-spectral-resolution lidar (HSRL) technique filters out the molecular backscatter and provides the aerosol backscatter, with which clouds are identified. Differential absorption lidar (DIAL) systems use laser frequencies on and off absorption lines of gases, such as water vapor, in order to determine their mixing ratio with great vertical and temporal resolution, especially when airborne (Ehret et al., 1993; Bösenberg, 1998; Browell et al., 1998; Chen et al., 2002; Groß et al., 2014).
Both in situ and airborne lidar measurements face the problem of needing to reach very high altitudes. Few research aircraft are capable of reaching these altitudes to perform measurements (Groß et al., 2014). The German research aircraft High Altitude and LOng range (HALO) (Krautstrunk and Giez, 2012) provides a platform that is capable of reaching the altitudes needed in order to successfully measure cirrus clouds (Groß et al., 2014). During the ML-CIRRUS campaign, which took place over central Europe and the NE Atlantic in the spring of 2014 (Voigt et al., 2017), HALO was equipped with the differential absorption (DIAL) and high-spectral-resolution (HSRL) lidar system, WAter vapour Lidar Experiment in Space (WALES) (Wirth et al., 2009). By combining both techniques, WALES provides high temporal and spatial resolution curtains of the optical properties of clouds and collocated water vapor measurements. Here we combine the water vapor measurements taken by WALES during the ML-CIRRUS campaign with model temperatures from the European Centre for Medium-Range Weather Forecasts (ECMWF) and calculate the relative humidity over ice (RHi) for these clouds.
Our goals are to study the distribution of humidity with respect to ice within and in the vicinity of midlatitude cirrus clouds, determine the vertical structure of RHi within them and its temporal evolution, and also investigate the differences between clouds with different formation processes. The questions we want to answer are as follows: is supersaturation detected in cirrus clouds and the cloud-free air at the midlatitudes? How is it distributed and what values does it reach? What is the vertical structure of RHi within these clouds? What cloud regions can be determined by the vertical distribution? How does the formation process affect the relative humidity? How does the relative humidity change during the life cycle of a cloud?
2.1 ML-CIRRUS campaign
In March and April 2014, the ML-CIRRUS campaign took place. The main objective of this campaign was to study the microphysical, macrophysical, radiative and optical properties of natural and anthropogenic cirrus clouds over the midlatitudes. For this, the High Altitude and LOng-Range Research aircraft (HALO) was used. It was equipped with in situ, as well as remote sensing, instruments and performed research flights over central Europe and the NE Atlantic. One advantage of HALO is its high flight ceiling of 15 km (Krautstrunk and Giez, 2012). Due to its payload during the research flights this altitude was not reached, but the flight planning was done in such a way that HALO would fly at least 1.5 km over the cloud tops in order to warrant good measurements with the lidar. More details about this campaign can be found in Voigt et al. (2017).
2.2 WALES system
One of the instruments on board the HALO aircraft was the WALES lidar system. WALES is a high-spectral-resolution (HSRL) and differential absorption (DIAL) lidar (Esselborn et al., 2008; Wirth et al., 2009). It provides 2D measurements of extinction coefficient, backscatter coefficient, aerosol depolarization and water vapor mixing ratio. In this study we use data taken by the WALES system during 10 missions of the ML-CIRRUS campaign (Fig. 1). We focus on the water vapor mixing ratio measured with the DIAL technique. Regarding the errors of the measurements, Kiemle et al. (2008) estimated the statistical error of the water vapor retrieval to be about 5 %, although the exact value is dependent on various parameters that differ for individual measurements. Errors that arise due to the high spatial inhomogeneity of the backscatter within cirrus clouds are kept below 5 % by filtering. Finally, the Rayleigh–Doppler effect is corrected in the retrieval algorithm, leaving an error of less than 2 % (Groß et al., 2014). Groß et al. (2014) compared water vapor DIAL measurements from WALES, taken during a flight of the HALO TECHNO mission with simultaneous in situ measurements taken from an aircraft flying below HALO (their Fig. 4). They found the measurements to be in a good agreement with a deviation of <1 % for the time periods where the two aircraft were on close horizontal distances. They also note the capability of the WALES-DIAL measurements to resolve even small-scale features. This leads to the conclusion that WALES-DIAL measurements are accurate and suitable for the study of ice clouds (Groß et al., 2014). In-depth description, technical characteristics and accuracy of WALES can be found in the abovementioned references.
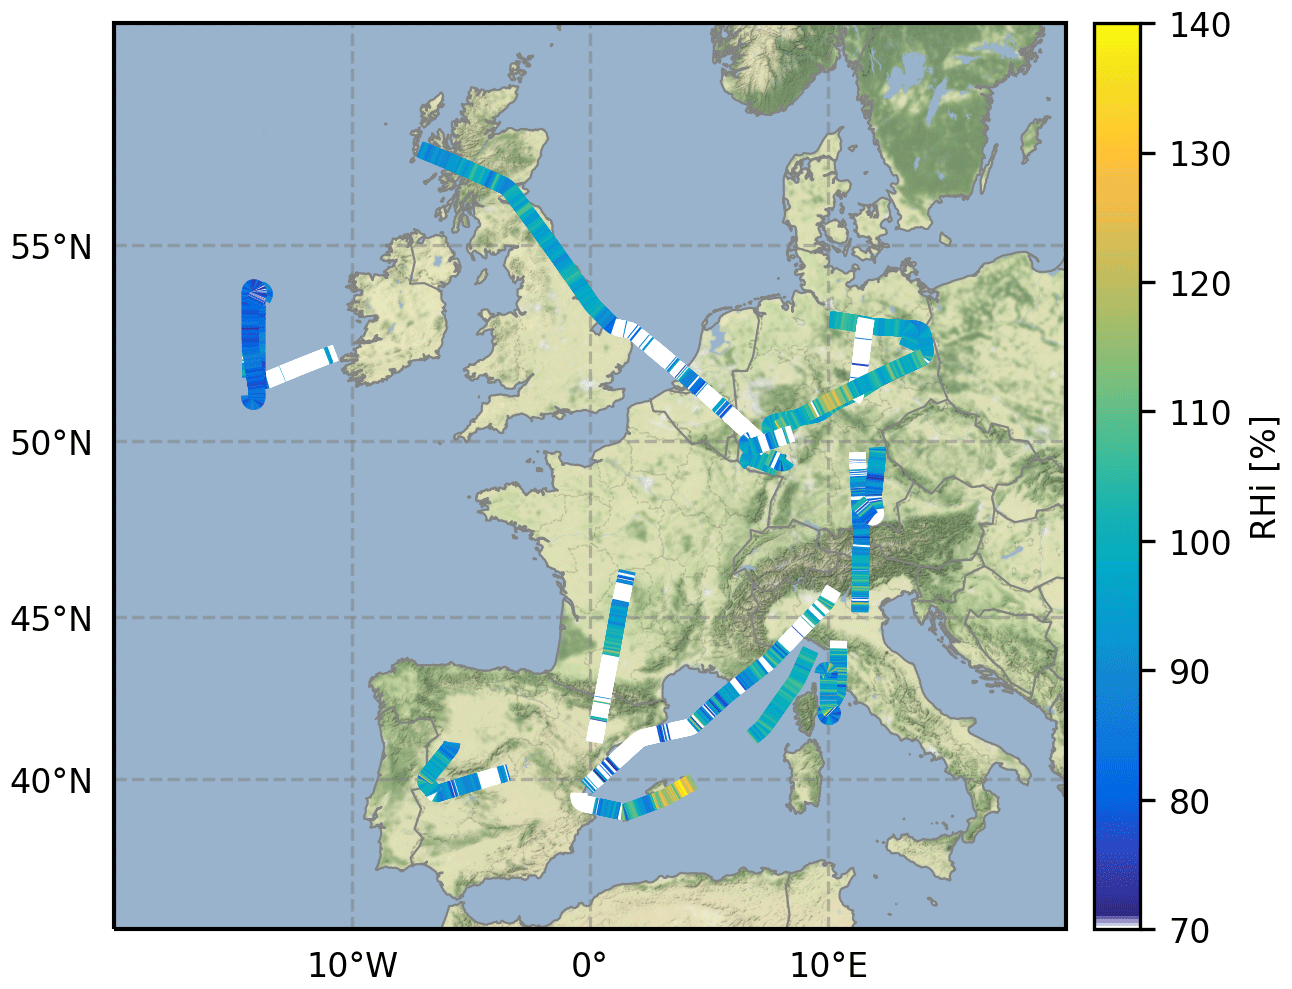
Figure 1Lidar legs of the research flights conducted during the ML-CIRRUS campaign. The color scale represents the mean RHi of the vertical column from cloud base to cloud top. The white color represents columns for which the mean RHi is 70 % or less or regions where no ice clouds were measured along the flight track.
2.3 Cirrus classification
A classification of cirrus clouds, based on their formation mechanism and microphysical properties, was presented by Krämer et al. (2016) and also Luebke et al. (2016). They distinguish between two types of cirrus. The first type is in situ origin cirrus, which form directly as ice. The second type is liquid-origin cirrus. They originate from mixed-phase clouds, whose liquid droplets freeze the latest when they reach cold enough temperatures (<235 K). In our study we use the classification from Krämer et al. (2016) and Luebke et al. (2016). They calculate 24 h backward trajectories. For the wind data they use the ECMWF reanalysis dataset ERA-Interim (ECMWF, 2011). For vertical transport, diabatic heating rates are used with the trajectory module of the Chemical Lagrangian Model of the Stratosphere (CLaMS) (McKenna et al., 2002). The ice water content (IWC) is then calculated with CLaMS-Ice. The clouds are then grouped depending on the simulated IWC along the track and the location of the maximum IWC value. For some lidar legs in situ, as well as liquid-origin clouds, were measured during one flight. Furthermore, some clouds had an in situ layer – most commonly the top layer – and a liquid-origin part. In these cases, the dataset was split and grouped accordingly. For a more complete understanding of the two cloud types, the cloud depths for each group have been calculated. The in situ clouds in our dataset have a mean cloud depth of 983 m with a standard deviation of 500 m and the liquid-origin clouds a mean depth of 1255 m with a standard deviation of 592 m.
2.4 Methodology
The relative humidity over ice (RHi) largely controls the formation and nucleation mechanism of cirrus clouds, which in turn has a great effect on their characteristics (Heymsfield and Miloshevich, 1995; Comstock et al., 2002; Haag et al., 2003; Krämer et al., 2009; Sakai et al., 2014). Based on that we choose RHi as our main parameter in this study. We calculate RHi from the retrieved water vapor mixing ratio and model temperature from ECMWF (Esselborn et al., 2008). We use equations from Huang (2018) for the calculation of the saturation vapor pressures of water and ice. A similar method has also been applied by Groß et al. (2014) and Urbanek et al. (2018). Groß et al. (2014) studied the applicability of the ECMWF temperature field for the calculation of RHi. They compared the ECMWF temperatures with those measured by in situ sensors on board HALO and found a difference of 0.8 K for the typical height and temperature range of cirrus clouds. This induces an error of about 10 % to 15 % in the calculated RHi. Despite that, they concluded that the ECMWF model temperature is suitable for the study of cirrus clouds at the midlatitudes. Since we use the same data and similar method we deem their findings to be representative also for our study.
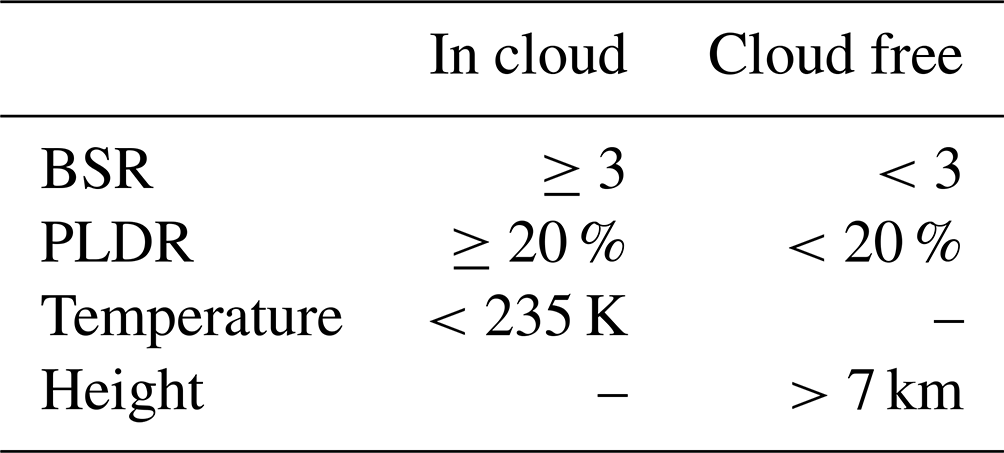
In the next step we construct and apply a cloud mask, in order to separate the cirrus clouds and the cloud-free air around them. We set thresholds for the backscatter ratio (BSR), particle linear depolarization ratio (PLDR), temperature and altitude of each data point (Table 1). Groß et al. (2014) and Urbanek et al. (2017, 2018) find that a wide range of BSR values can be used as a threshold between in-cloud and cloud-free data points. They chose a BSR threshold of 4, 2 and 3, respectively. From our own analysis we find the optimal BSR to be 3. The PLDR threshold is selected at 20 %, as this is indicative of ice crystals (Gobbi, 1998; Chen et al., 2002; Comstock et al., 2004). The temperature of 235 K is the threshold below which in situ cirrus clouds form (Ström et al., 2003; Kärcher and Seifert, 2016; Krämer et al., 2016; Gasparini et al., 2018; Urbanek et al., 2018). The cloud-free data in the vicinity of the cirrus clouds are the data points from the whole lidar leg curtain after the detected clouds are removed. We choose to only keep data points with an altitude higher than 7 km, as we only want areas where ice crystals would most probably be able to form (Ström et al., 2003; Comstock et al., 2004; Gasparini et al., 2018; Kärcher, 2017). We consider the vicinity around cirrus clouds as a maximum horizontal distance of 250 km from the cloud edges and altitudes from 7 to 12 km, as we mostly detect cirrus clouds in this range.
Finally, to get some insight into the microphysics of the clouds and the ice nucleation processes, we calculate three temperature-dependent thresholds: two for heterogeneous nucleation (HET) and one for homogeneous nucleation (HOM) (Urbanek et al., 2017, their Table 1, and original formulations from Krämer et al., 2016). We also calculate the ice and water saturation thresholds. The water saturation threshold is the limit above which water droplets can form in addition to ice crystals. In situ HOM nucleation occurs when supercooled solution droplets (SSPs) are lifted up to altitudes with very low temperatures (<235 K). For HET nucleation to take place, ice-nucleating particles (INPs) are needed. Different INPs have different freezing thresholds. We specify a high threshold where we consider inefficient INPs, which lead to higher RHi being necessary for the nucleation, and a low threshold for easily activated INPs where lower RHi is necessary for nucleation. For the high threshold we choose coated soot as an example of an inefficient INP, and for the low threshold we choose mineral dust, which is more efficient as an INP and more abundant (Pruppacher and Klett, 1997; Kärcher and Lohmann, 2003; Gensch et al., 2008; Hoose and Möhler, 2012; Cziczo et al., 2013; Krämer et al., 2016; Ansmann et al., 2019).
3.1 Overview
In Table 2, we present the most common values of the RHi distributions (RHi modes) and supersaturation percentages inside the cirrus clouds and in the cloud-free air around them for the whole dataset, the in situ and the liquid-origin clouds. In the temperature range of our data, RHi 120 % could be considered an approximate threshold for HET nucleation and RHi 140 % for HOM nucleation, respectively (Koop et al., 2000; Haag et al., 2003; Comstock et al., 2004; Khvorostyanov and Curry, 2009; Kärcher, 2012). Based on that and in order to present our data in a more easily understandable way we define three bins of RHi, 100 %–120 %, 120 %–140 % and >140 %, representing the low HET, high HET and HOM nucleation regimes, respectively (see Sect. 2.4).
The frequency distribution of RHi for the in-cloud data points of the whole dataset has a mode value of 96 %. Around 34 % of the in-cloud data points are supersaturated with respect to ice. A total of 30.3 % have RHi values up to 120 %, 3.3 % have RHi values between 120 % and 140 %, and 0.5 % have RHi values higher than 140 %. For the cloud-free data points the frequency distribution of RHi has a mode value of 68 %. A total of 6.8 % of the cloud-free data points are supersaturated; 5.7 % have RHi values between 100 % and 120 %, 1 % is in the range of 120 % to 140 %, and 0.2 % have RHi values higher than 140 %.
Table 2Results from the analysis of the probability density functions (PDFs) of RHi. RHi mode: most common value of the dataset.
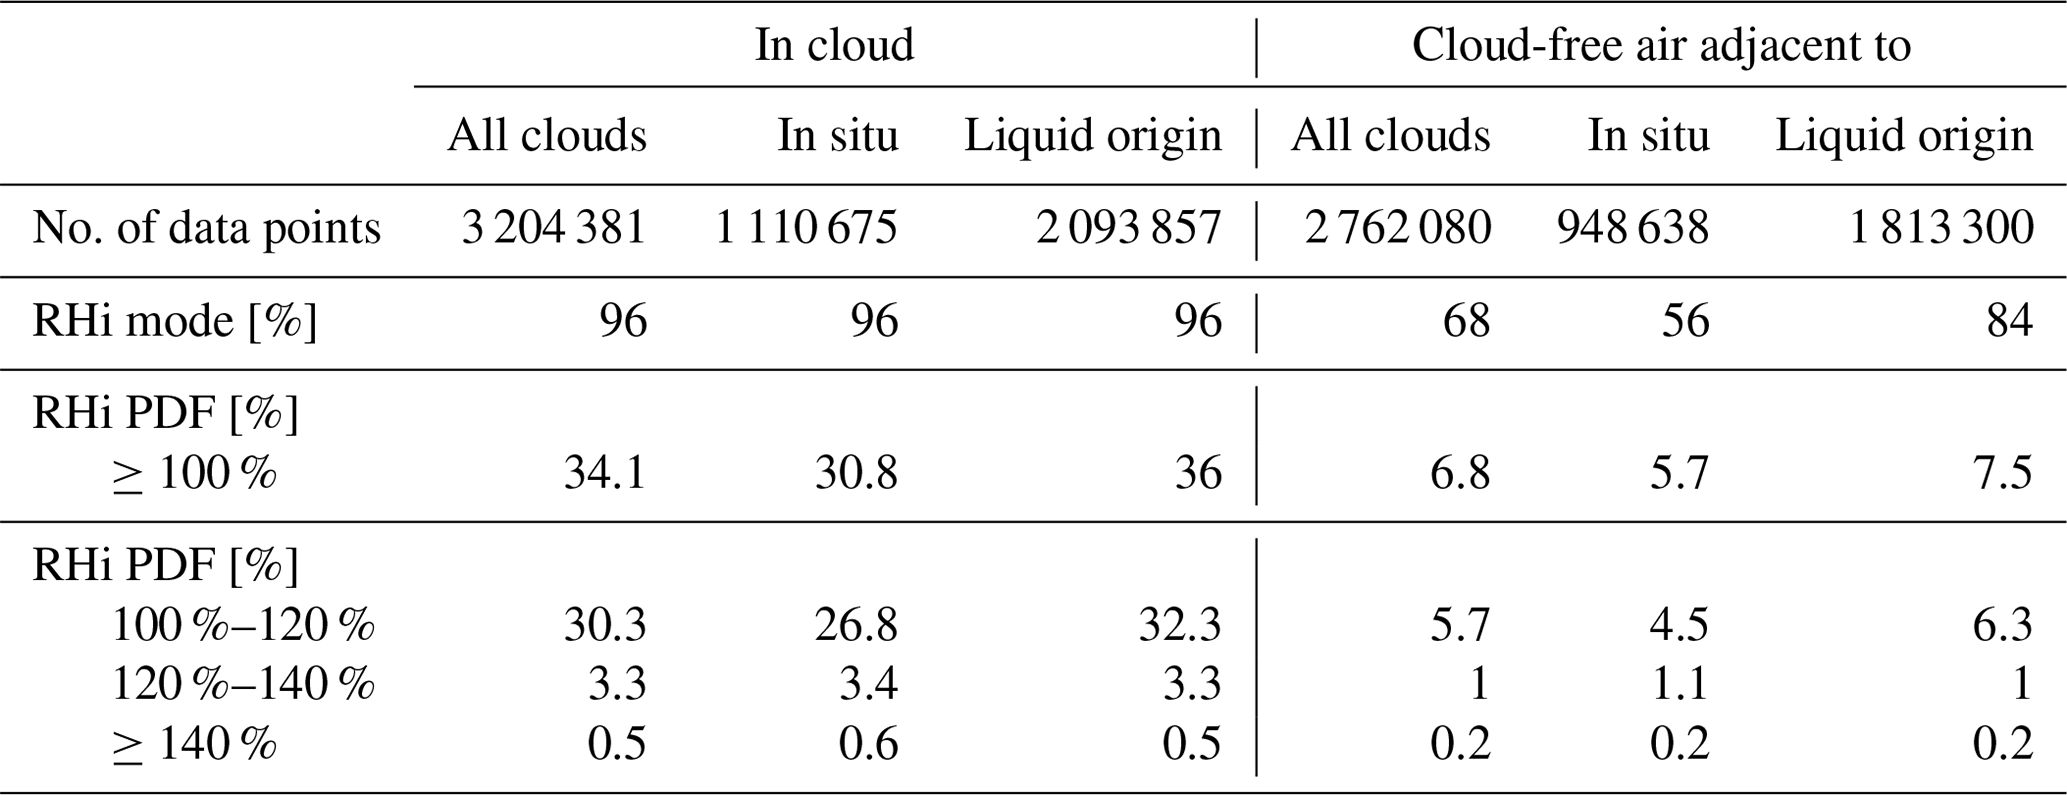
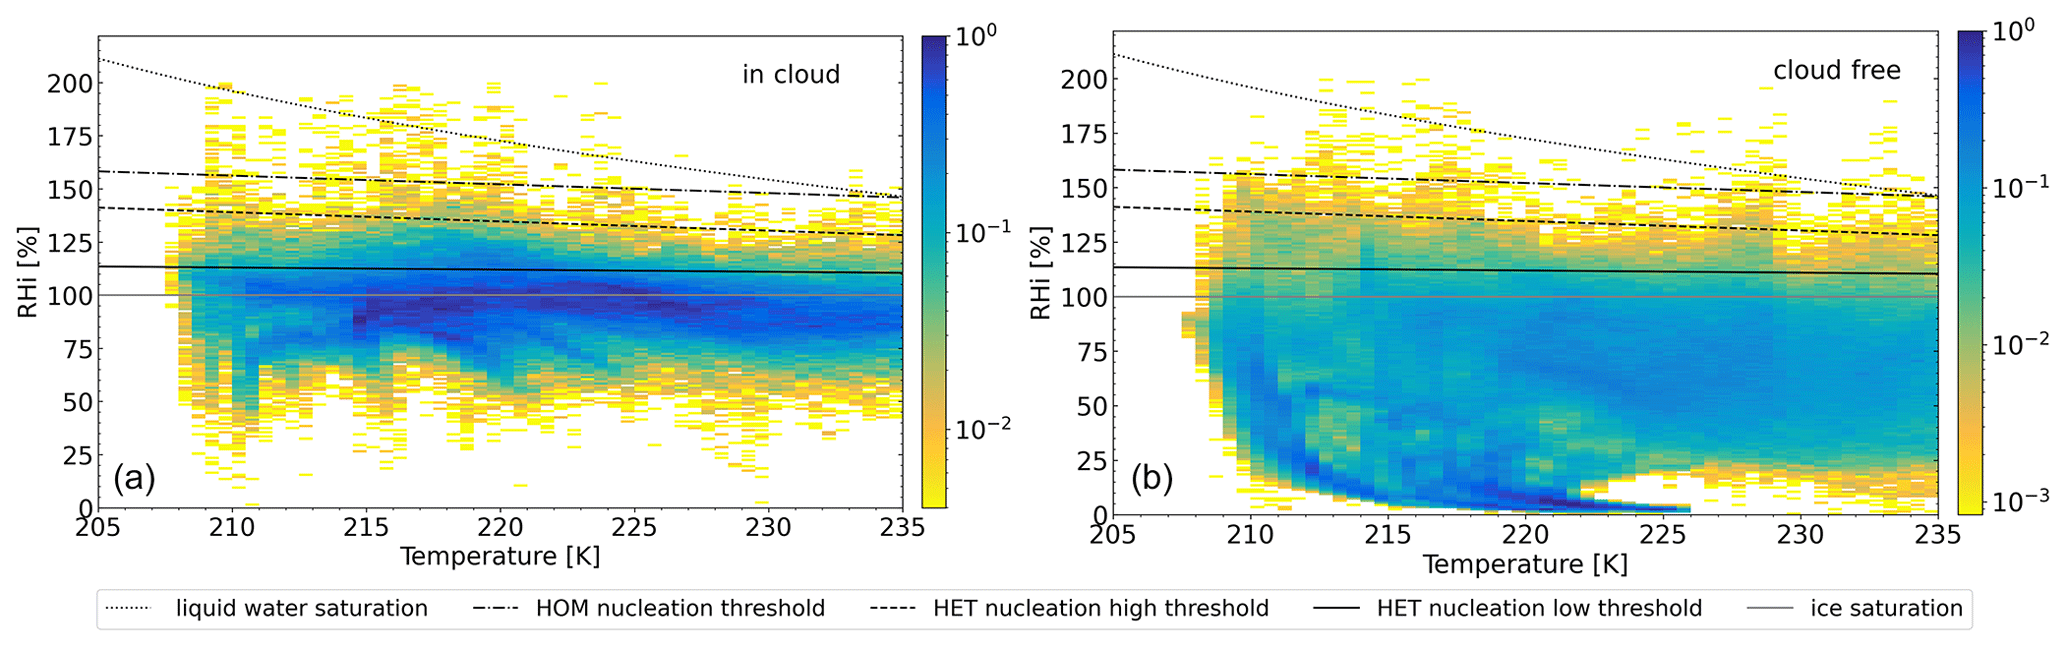
Figure 2Probability densities of the relative humidity over ice (RHi) with respect to ambient temperature. (a) Calculated for the in-cloud data points. (b) Calculated for the cloud-free data points. The bin sizes are 0.5 K and 1 % RHi. The grey line depicts the ice saturation threshold at RHi = 100 %. The solid black line is the low threshold for heterogeneous nucleation (HET). The ice-nucleating particle (INP) for this threshold corresponds to mineral dust, which is efficient as an initiator of ice formation. The dashed line represents the high threshold for HET nucleation. Here the INP corresponds to coated soot, which is not activated as easily as mineral dust. The dash-dotted line indicates the threshold at which homogeneous nucleation (HOM) can take place. During HOM, ice crystals form without the need of INPs. The dotted line is the supercooled liquid water saturation line.
Aiming to gain a more detailed view into the characteristics of RHi and to get an insight into the nucleation mechanisms, we plot the probability density of RHi with respect to the ambient temperature, accompanied by the ice and water saturation (Huang, 2018) lines, low and high HET regime (Gensch et al., 2008, as shown in Fig. 4 of Krämer et al., 2016) and HOM (Koop et al., 2000, as shown in Fig. 4 of Krämer et al., 2016) regime (Fig. 2). The in-cloud data points reach temperatures down to 207 K and are most frequently detected close to ice saturation (RHi = 100 %) for the entire temperature range. Their distribution is bimodal: one peak can be seen at a temperature of 225 K and ice saturation, RHi 100 %, and a second one at 218 K and below ice saturation at RHi around 79 %. An increase in supersaturated points can be seen for temperatures between 215 and 225 K. Regarding the nucleation processes, most of the supersaturated data points are in the HET regime, with the highest probabilities close to the low HET threshold. The probability density drops significantly above the high HET threshold. Very few data points are found above the HOM threshold. Finally, there is also a very small probability of detection over the water saturation threshold, which probably stems from the uncertainties in the water vapor measurements, the model temperatures or both.
The majority of the cloud-free data points are detected below the lower threshold for HET nucleation. Some data points reach up to the high HET threshold. The probability for detection up to the high HET threshold is higher for colder temperatures. The probability of data points exceeding the high HET and HOM thresholds is very low. A peak of the probability density can be seen around 220 K and relative humidities close to zero, forming a coma shape. This feature is detected in many cases. For temperatures under 215 K it represents data points with a water vapor mixing ratio around 1.5 ppmv, which is the minimum value observed in the upper troposphere (Krämer et al., 2009). For higher temperatures it most probably stems from data points measured in the stratosphere.
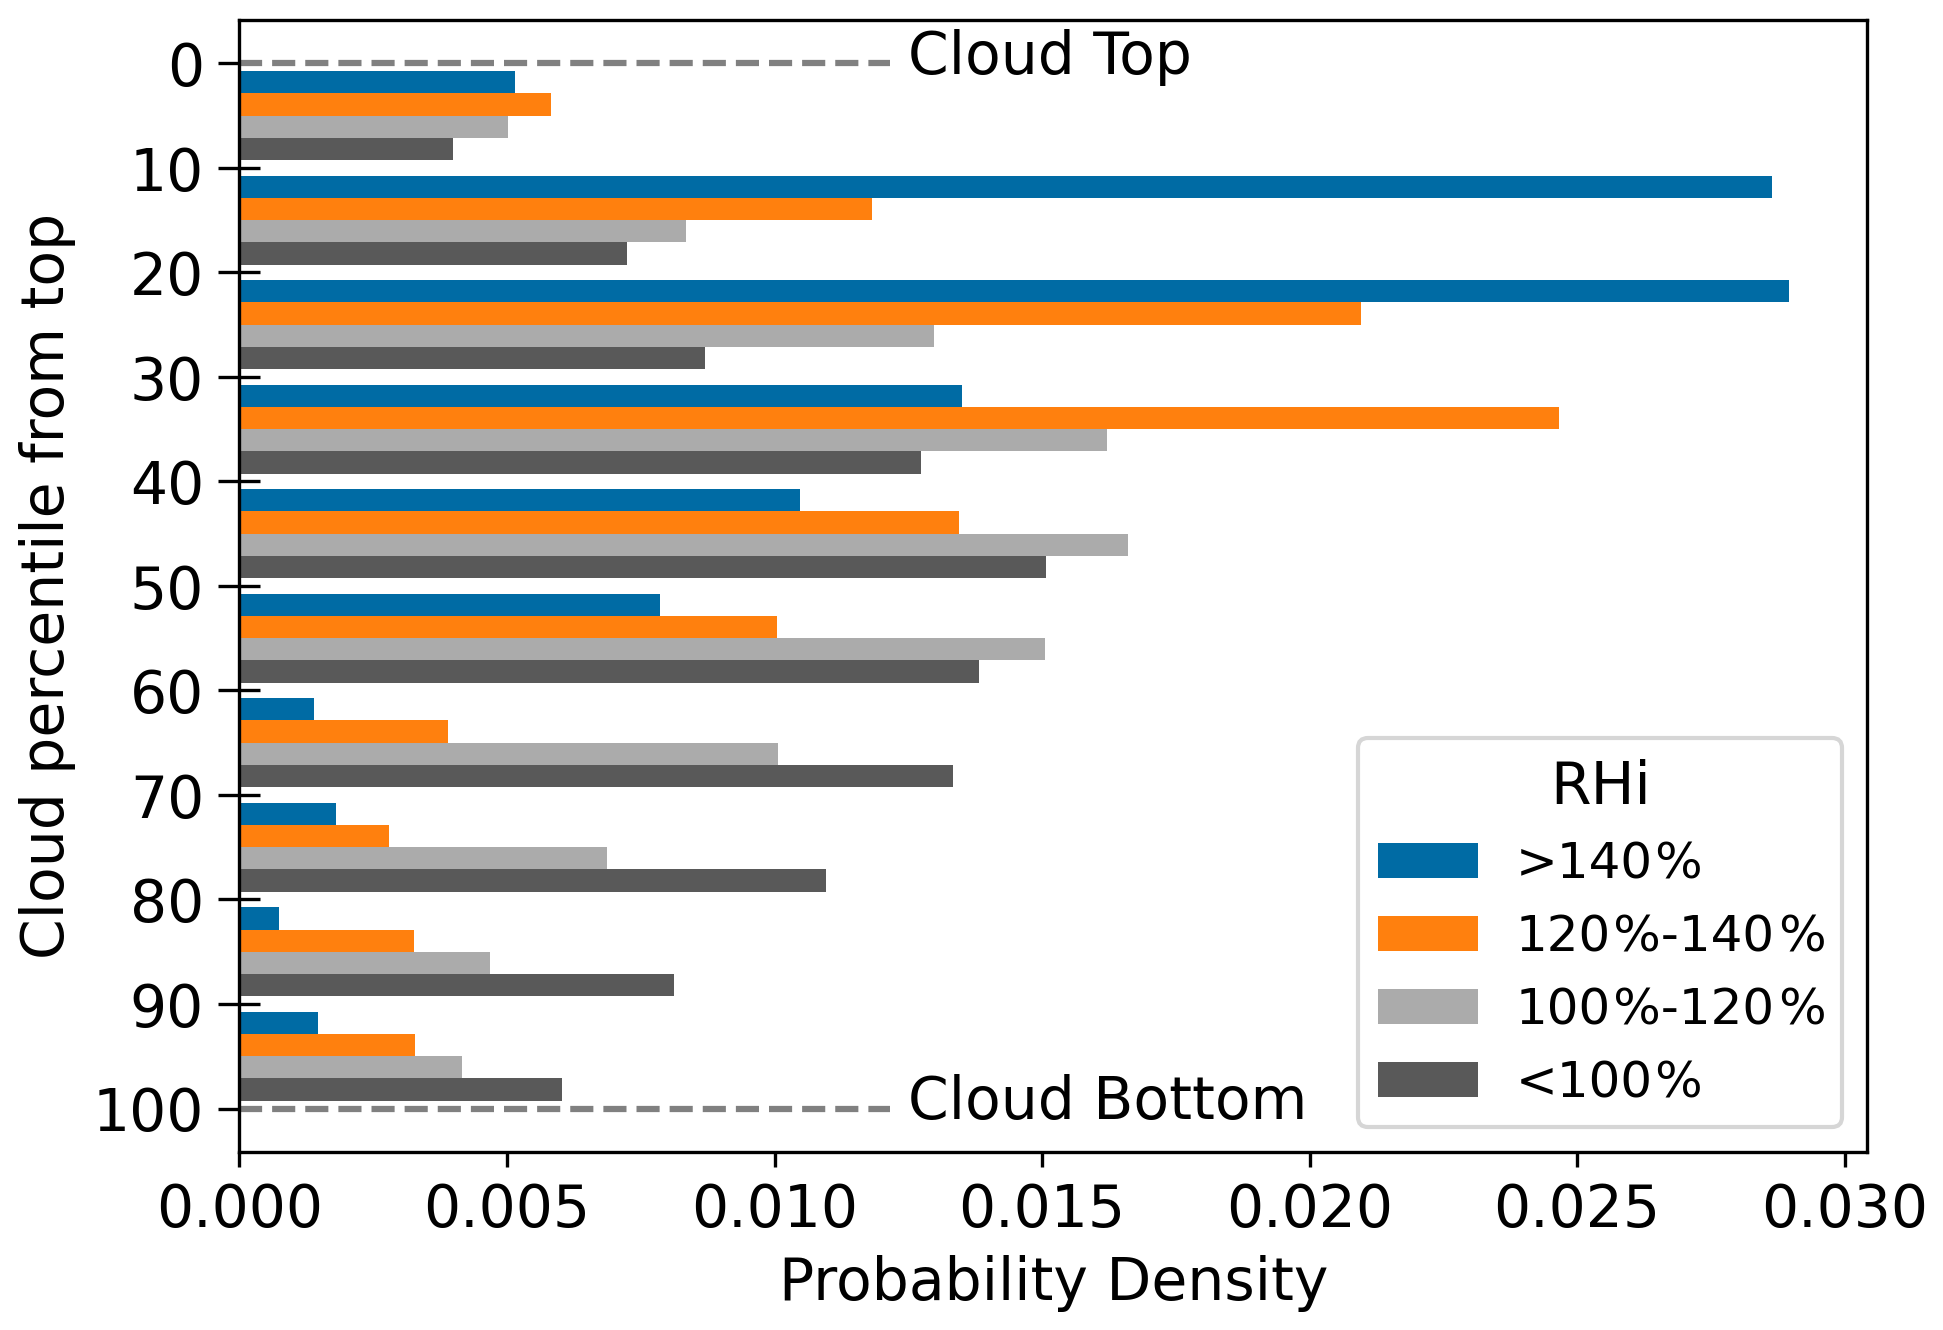
Figure 3Probability densities of RHi in a relative location to the cloud top. RHi values of in-cloud data points are grouped into four, approximately representing the subsaturation (dark grey), low HET regime (grey), high HET regime (orange) and HOM regime (blue). For every group the probability density in bins with respect to the relative location to the cloud top is plotted. For example: the bin from the 20th to the 30th percentile contains the probability of occurrence of the four RHi groups in a slice of the cloud located 20 % to 30 % of the distance between the cloud top and cloud base.
In Fig. 3, we present the vertical distribution of RHi within the midlatitude cirrus clouds in our dataset. For each cloud the in-cloud data points are divided in four groups based on their RHi value. The four groups represent the subsaturated, low HET, high HET and HOM regimes. The cloud base and cloud top are determined, and the relative location of every data point with respect to the cloud top is calculated in bins of a 10 % distance between the top and base. From the cloud top up to a 20 % cloud depth high supersaturations with RHi values above 140 % are most frequent. From the 20th to the 40th percentile, the dominating group is supersaturations between 120 % and 140 %. From the 40th to the 60th percentile (midway between the cloud top and bottom) supersaturations of up to 120 % are most frequent. From a 60 % cloud depth and until the cloud bottom mostly subsaturated data points are detected. In summary, high supersaturations are detected at the cloud top, and lower supersaturations gradually become dominant towards the middle of the clouds. From around the midpoint of the clouds and until the cloud bottom most data points are subsaturated. It should be noted that in some cases the lidar signal gets completely attenuated before reaching the actual cloud base. In our analysis we consider the altitude of complete attenuation as the cloud base. For around 20 % of the cases the uppermost layer has lower supersaturation than deeper layers or is even subsaturated (not shown).
3.2 Comparison of in situ and liquid-origin clouds
The frequency distribution of RHi for the in situ-formed cirrus clouds has a 96 % RHi mode value (Table 1). Around 31 % of the data points are supersaturated with respect to ice. A total of 26.8 % have low supersaturation and RHi up to 120 %, 3.4 % have RHi values between 120 % and 140 %, and 0.6 % have high supersaturations with RHi being above 140 %. The frequency distribution for the liquid-origin clouds also has a mode value of 96 %. Supersaturation has an occurrence frequency of 36 %, which is higher than for the in situ clouds. A total of 32.3 % of the in-cloud data points have low supersaturations, RHi < 120 %, 3.3 % have RHi values between 120 % and 140 %, and 0.5 % have higher supersaturations with RHi exceeding 140 %.
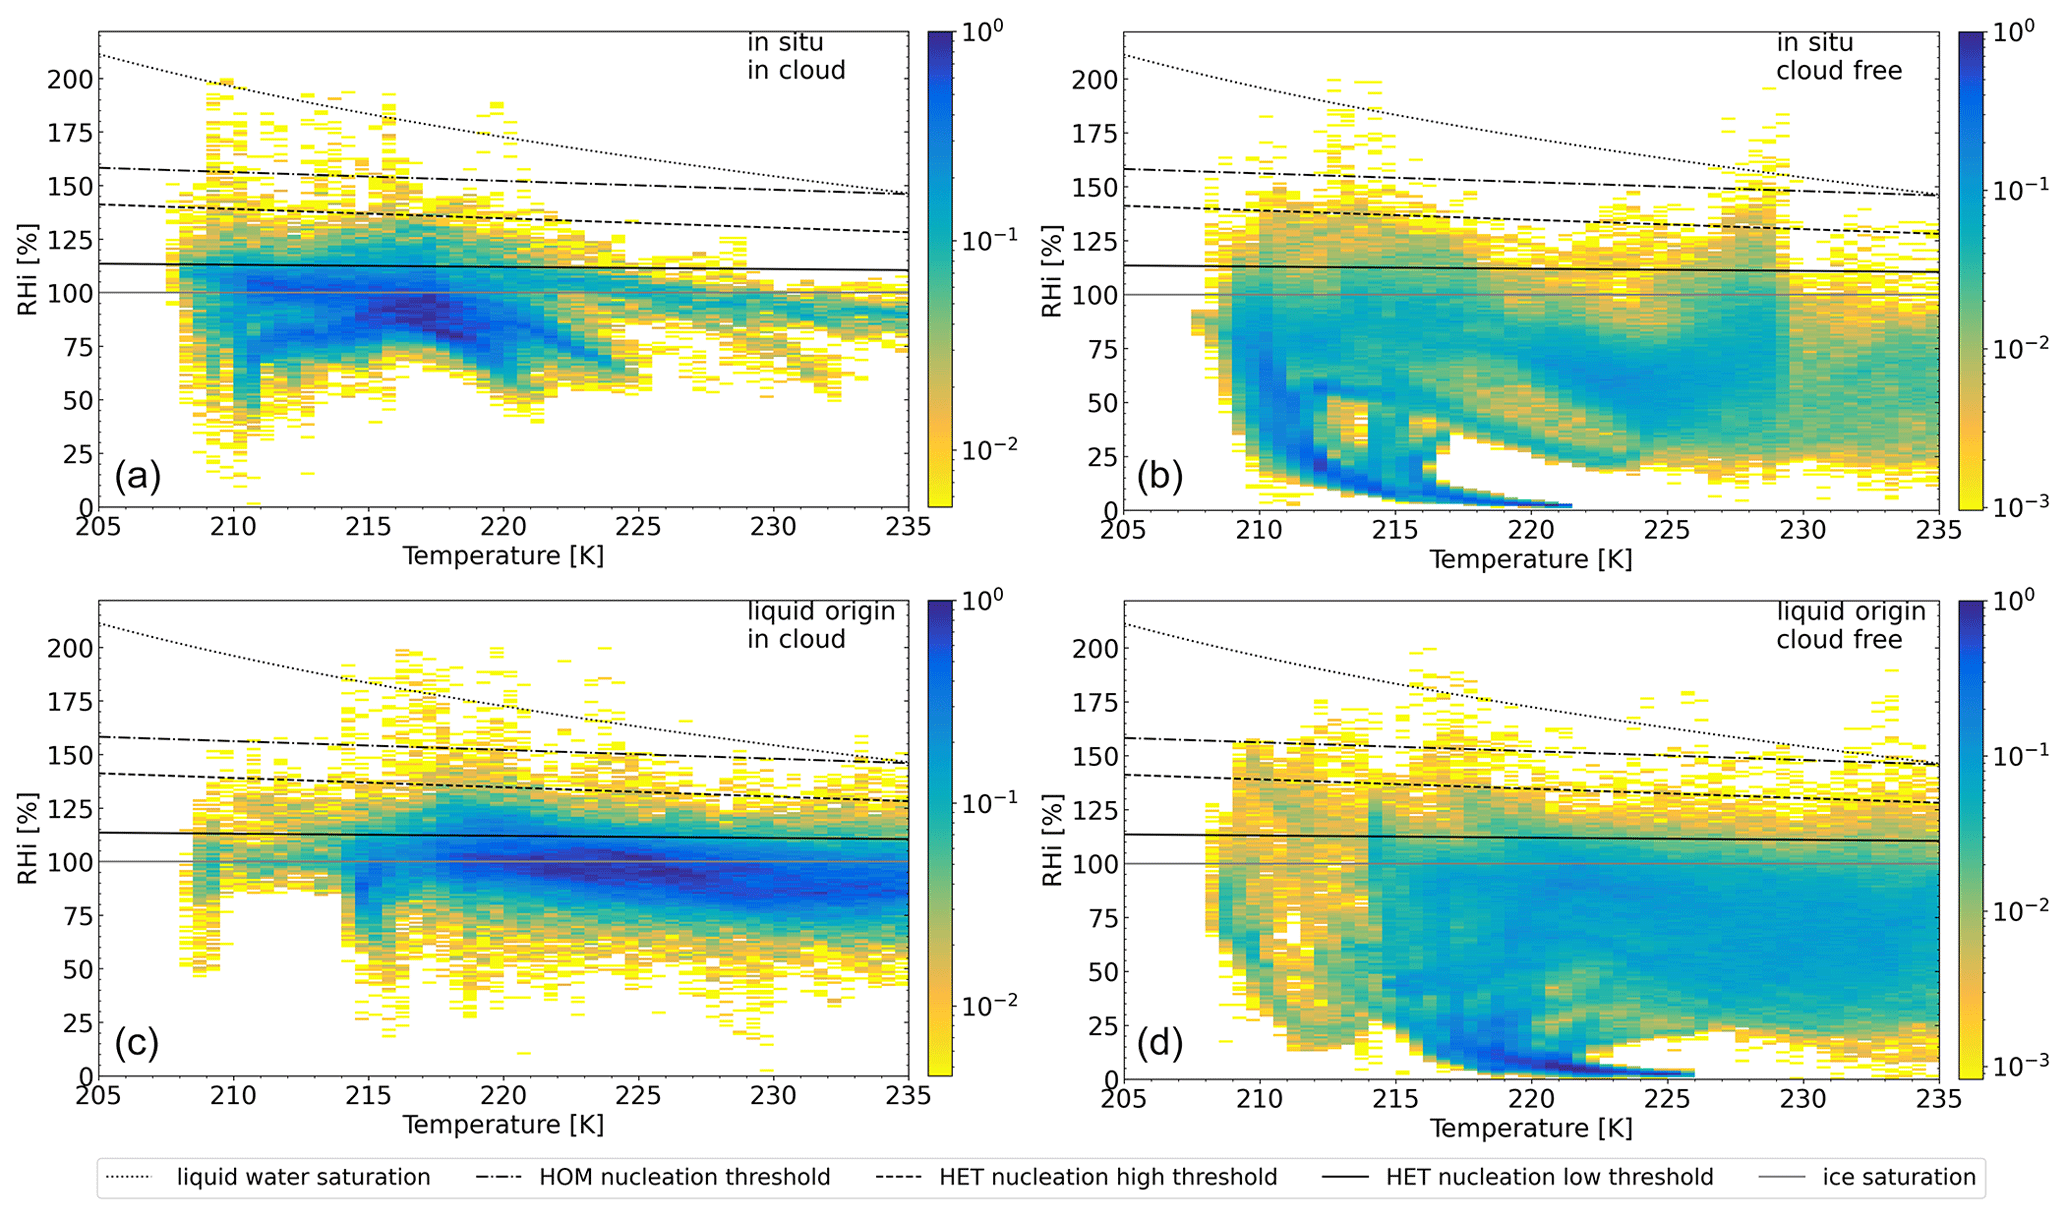
Figure 4PDFs of RHi with respect to ambient temperature. (a) In situ in-cloud data points. (b) In situ cloud-free data points. (c) Liquid-origin in-cloud data points. (d) Liquid-origin cloud-free data points. For an in-detail explanation see Fig. 2.
The ambient conditions at which in situ and liquid-origin clouds form are different. This leads to differences in the distribution of RHi inside the clouds, as well as in their surrounding cloud-free air. Although cloud-free air cannot be classified as in situ or liquid-origin we use the terms in situ and liquid-origin cloud free for simplicity to describe the air adjacent to in situ and liquid-origin clouds, respectively. For the cloud-free data points in the vicinity of in situ clouds the mode of the frequency distribution of RHi is 56 %. Supersaturation occurs for 5.7 % of the data points. A total of 4.5 % have RHi values between 100 % and 120 %, 1.1 % have RHi values from 120 % to 140 %, and finally 0.2 % have high supersaturations with RHi higher than 140 %. The frequency distribution of RHi for cloud-free data points around liquid-origin clouds has a higher mode at 84 %. Supersaturation has an occurrence of 7.5 %. A total of 6.3 % is in the low supersaturation regime where RHi reaches up to 120 %, 1 % for RHi between 120 % and 140 % and 0.2 % for RHi higher than 140 %.
In Fig. 4, we plot the in-cloud and cloud-free frequency distributions of RHi with respect to ambient temperature for both cloud groups. In situ cirrus clouds are more frequently measured at temperatures below 225 K. The peak is located at a temperature of around 218 K and an RHi of 79 %. Most data points are below the low HET threshold but can also reach the high threshold. The liquid-origin clouds are mostly measured in warmer environments, above 215 K. Most data points are close to saturation. The peak can be located around a temperature of 225 K and an RHi of 100 %. The probability density is significant up to the high HET threshold, mostly at around 220 K. The two peaks detected in Fig. 2 seem to correspond to the two cloud types.
The cloud-free data points around in situ clouds are mostly subsaturated and reach temperatures of as low as 208 K. The few data points with an RHi above 100 % are detected for temperatures below 220 K, reaching up to almost the high HET threshold, although a peak to higher RHi is also located at around 228 K. The cloud-free data points in the vicinity of liquid-origin cirrus clouds are mostly measured in warmer temperatures, above 215 K. Low supersaturations, below the low HET threshold, are detected on a wide temperature range, 214–235 K. The coma shape seen in Fig. 2 is also present in the cloud-free distributions of both cloud groups.
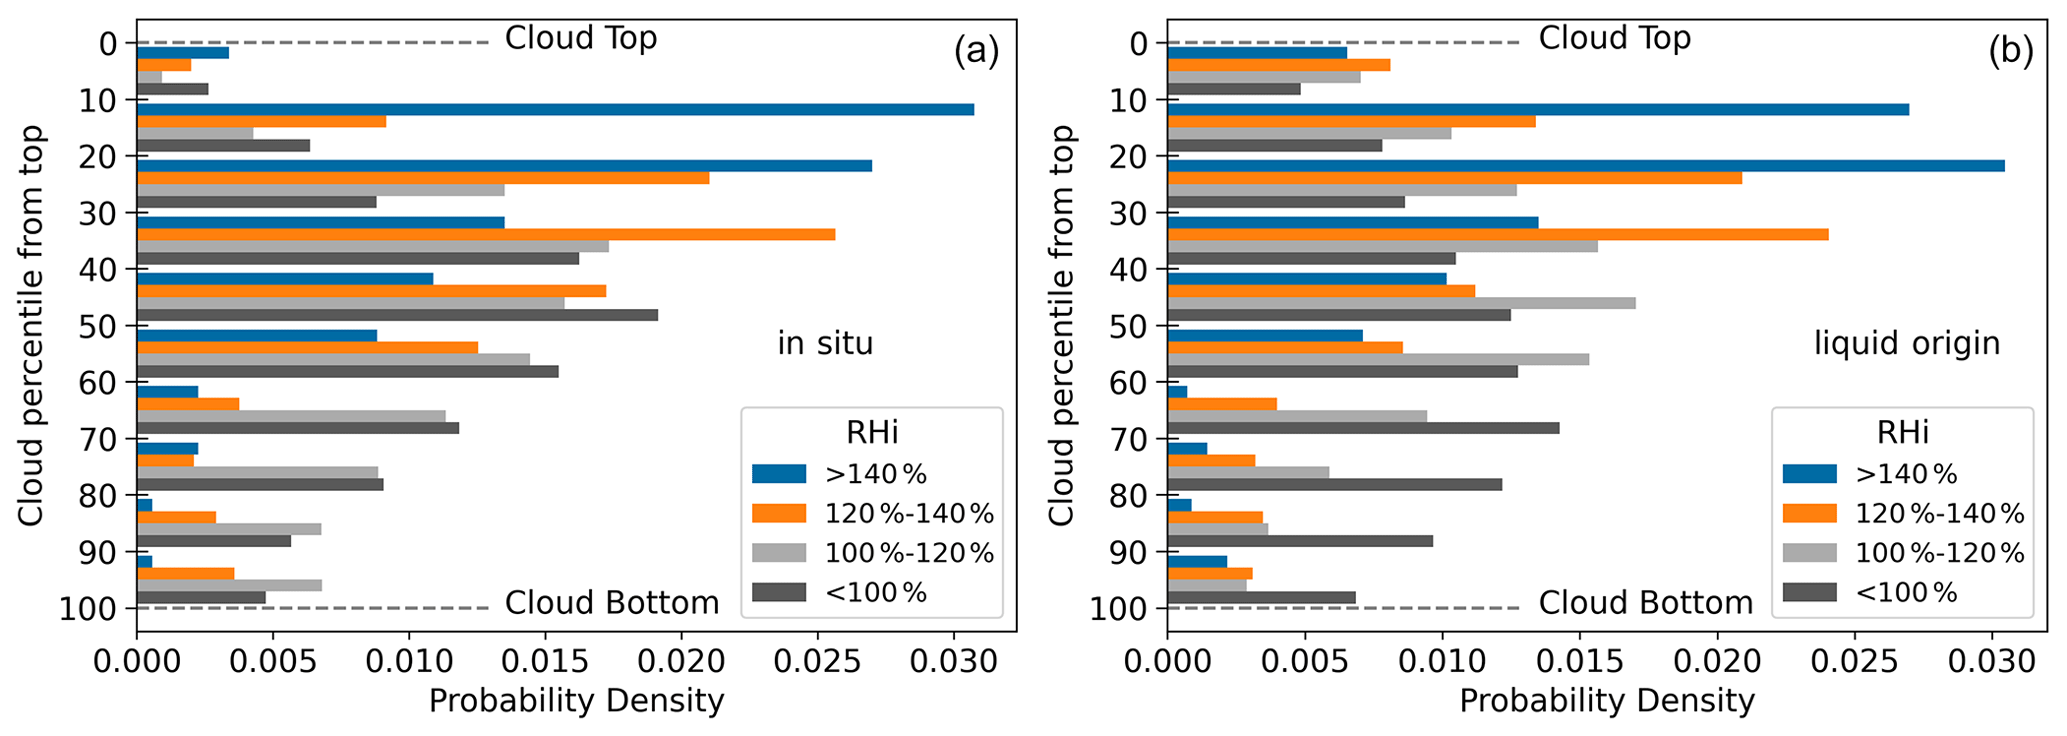
Figure 5Probability densities of RHi in a relative location to the cloud top. (a) In situ clouds. (b) Liquid-origin clouds. For an in-detail description see Fig. 3.
In Fig. 5 we present the vertical distribution of RHi for in situ and liquid-origin cirrus clouds, following the same method as in Fig. 3. Both cloud types seem to have a similar distribution of RHi as the one described in Sect. 3.1. High supersaturations are detected near the cloud top, and lower supersaturations are detected near the cloud middle; the cloud base is subsaturated. Despite following this general form each group has individual characteristics. For the in situ clouds the cloud base is dominated by data points with low supersaturations <120 % rather than subsaturated points. Subsaturated data points become the dominant group below the cloud middle and down to the 80th percentile of cloud depth. Above the cloud middle the distribution follows the general form. Liquid-origin clouds follow the general vertical distribution from the cloud base and up to the 10th percentile. The cloud top – down to the 10th percentile of cloud depth – is most frequently populated by data points with RHi values lower than the ones in the deeper parts of the cloud.
3.3 Case studies of temporal evolution
In order to study the temporal evolution of cirrus clouds and more specifically the changes in RHi through various stages of the cloud's lifetime, we choose two cases where a cloud system was measured over an extensive time period and different cloud evolutionary stages were captured.
3.3.1 Mesoscale convective system
The first case consists of two lidar legs conducted during Mission 6 of the campaign on 29 March 2014 over the west Mediterranean (Voigt et al., 2017, their Table 3). In these legs a multicell thunderstorm evolving into a mesoscale convective system (MCS) was measured. The flight was conducted in such a way that young, mature and dissipating clouds were measured. In Fig. 6, we present the BSR measured during these legs. We further split the legs into three parts, each containing clouds on a different evolutionary stage, young cells (p1), mature cell (p2) and dissipating cell (p3). Between the two lidar legs, in situ measurements were performed, causing the time gap between parts 2 and 3.
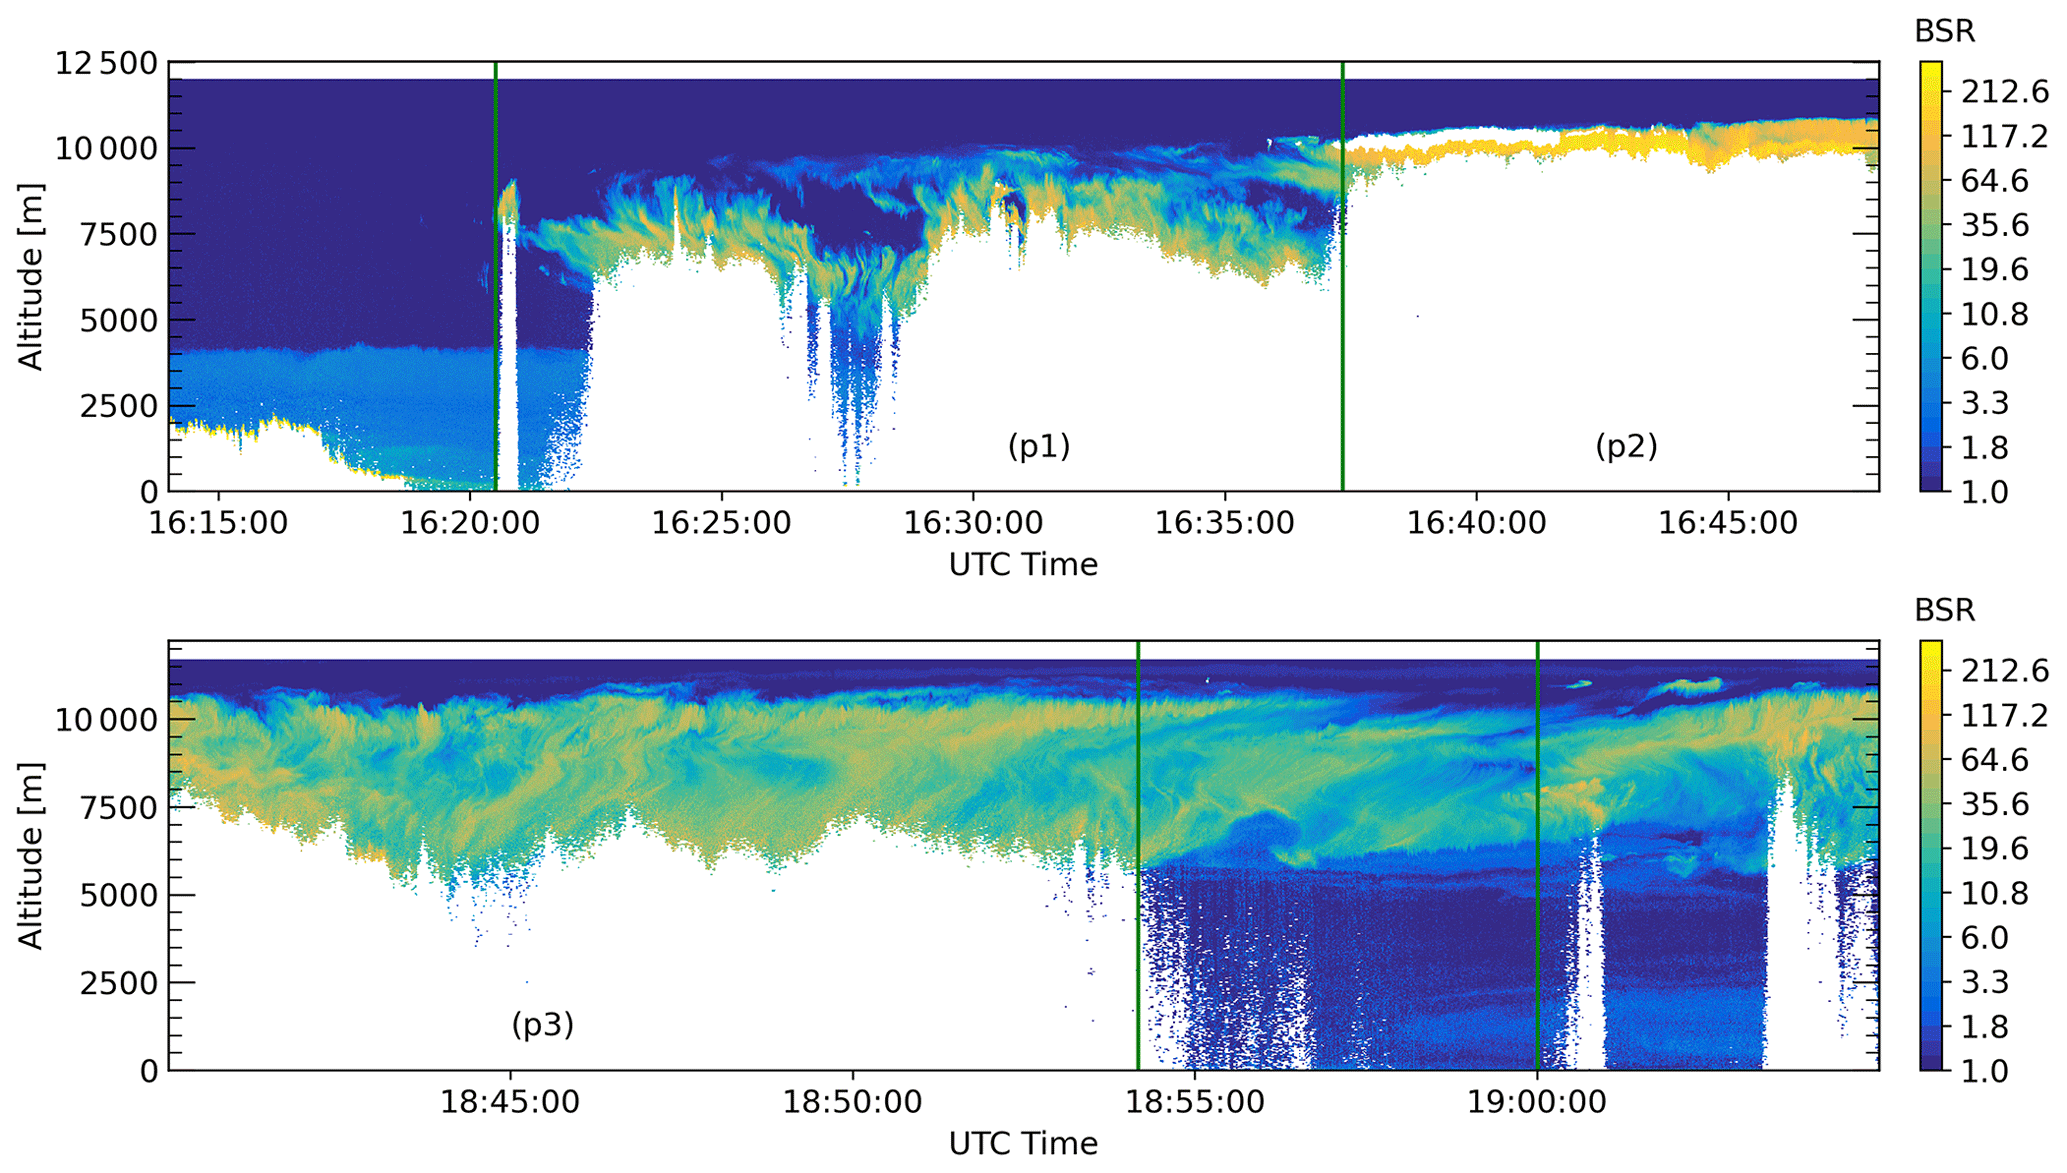
Figure 6Backscatter ratio (BSR) measured by WALES lidar at 532 nm (color coded). Two lidar legs performed during Mission 6 of the ML-CIRRUS campaign on 29 March 2014 over the west Mediterranean, depicting a mesoscale convective system. p1 contains two towering convective cells. p2 contains the main convective cell. p3 depicts the outflow of the system. The white regions at the cloud top are a result of saturation of the detector. The clouds in p1 and especially p2 are not fully depicted, and only the top portions of the cloud could be measured by the lidar system.
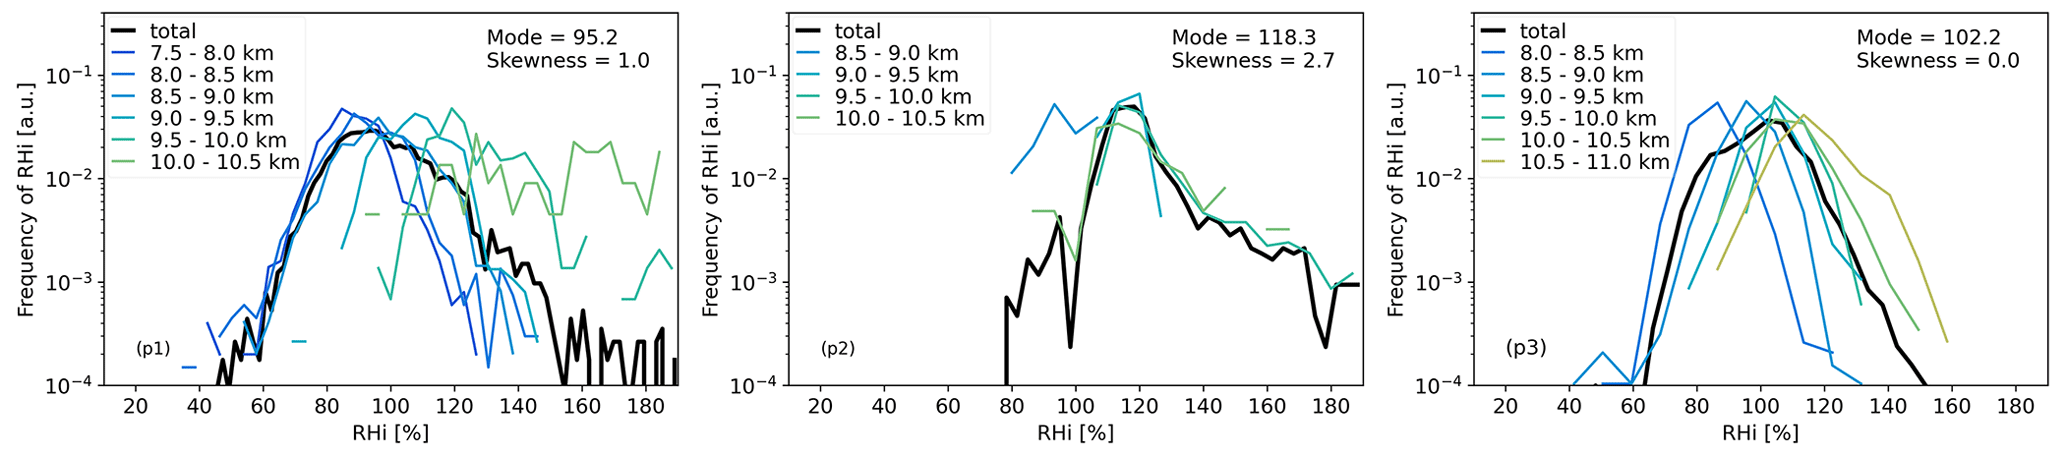
Figure 7PDF of in-cloud RHi in vertical layers with 500 m depths from the cloud bottom to the cloud top. From left to right: (p1) young cells, (p2) mature cell and (p3) stable cell, in accordance with Fig. 6. The number of layers differs depending on the geometrical depth of the cloud and the depth at which the lidar could provide measurements.
Figure 7 contains the frequency distributions of RHi for the three parts. In order to study the altitude dependence of RHi within these clouds we divide them into vertical layers with a depth of 500 m. For the first part of the thunderstorm (p1), which contains the young cells, the mode of the RHi is 95 % and the skewness is 1. Regarding the vertical structure, the topmost layers of these clouds are dominated by very high supersaturations. Moving deeper into the cloud the RHi values gradually drop to saturation. For the second part (p2) the mode of RHi is 118 %, and the skewness is 2.7. The majority of the data points is supersaturated. RHi reaches values higher than 180 % and is only rarely below saturation. Such high RHi values that exceed the HOM threshold could be explained as a result of the uncertainties of the temperature data from ECMWF. Vertically only a few levels could be measured. They all share similar characteristics. In the third part of this case (p3), the stable cell has an RHi mode of 102 % and no skewness. Subsaturated and supersaturated values of RHi are almost balanced through the cloud. Vertically all layers have a similar shape of distribution. The mode of each layer decreases from the cloud top to the cloud bottom.
3.3.2 Warm conveyor belt
The second case is a lidar leg, conducted over the United Kingdom and Belgium, as part of Mission 14 of the campaign on 11 April 2014 (Voigt et al., 2017, their Table 3). The targeted system was the outflow of a warm conveyor belt (WCB). For this leg a quasi-Lagrangian approach was selected, where the flight path of the aircraft coincided with the movement and evolution of the cloud system by following the geopotential lines of the WCB.
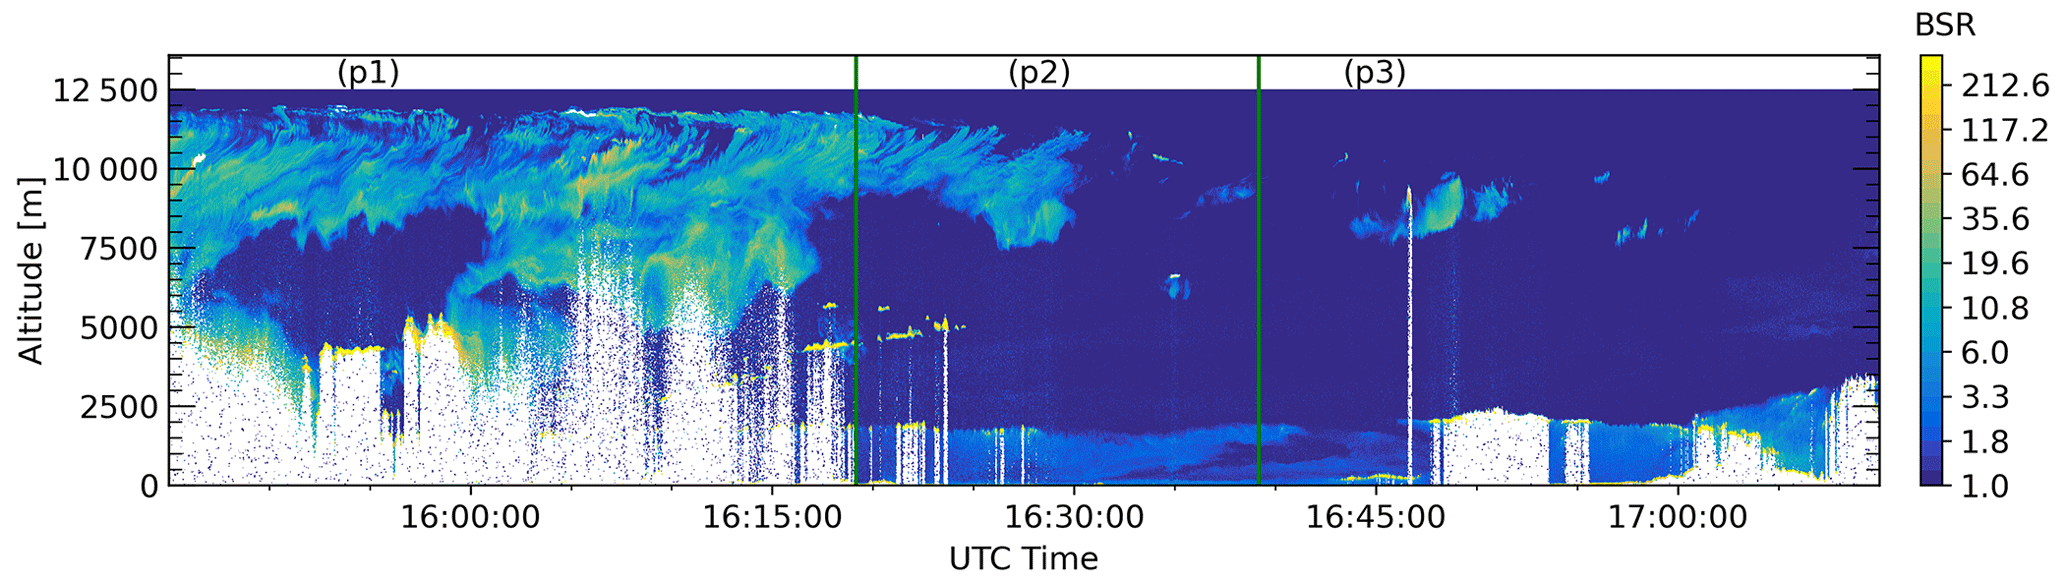
Figure 8Backscatter ratio (BSR) measured by WALES lidar at 532 nm (color coded). The measurement was performed during Mission 14 of the ML-CIRRUS campaign on 11 April 2014 over the United Kingdom and Belgium, depicting the outflow of a warm conveyor belt (WCB). The flight was conducted in a semi-Lagrangian manner, following the axis of the evolution of the system. p1, p2 and p3 depict clouds in different phases of aging from young to old, respectively.
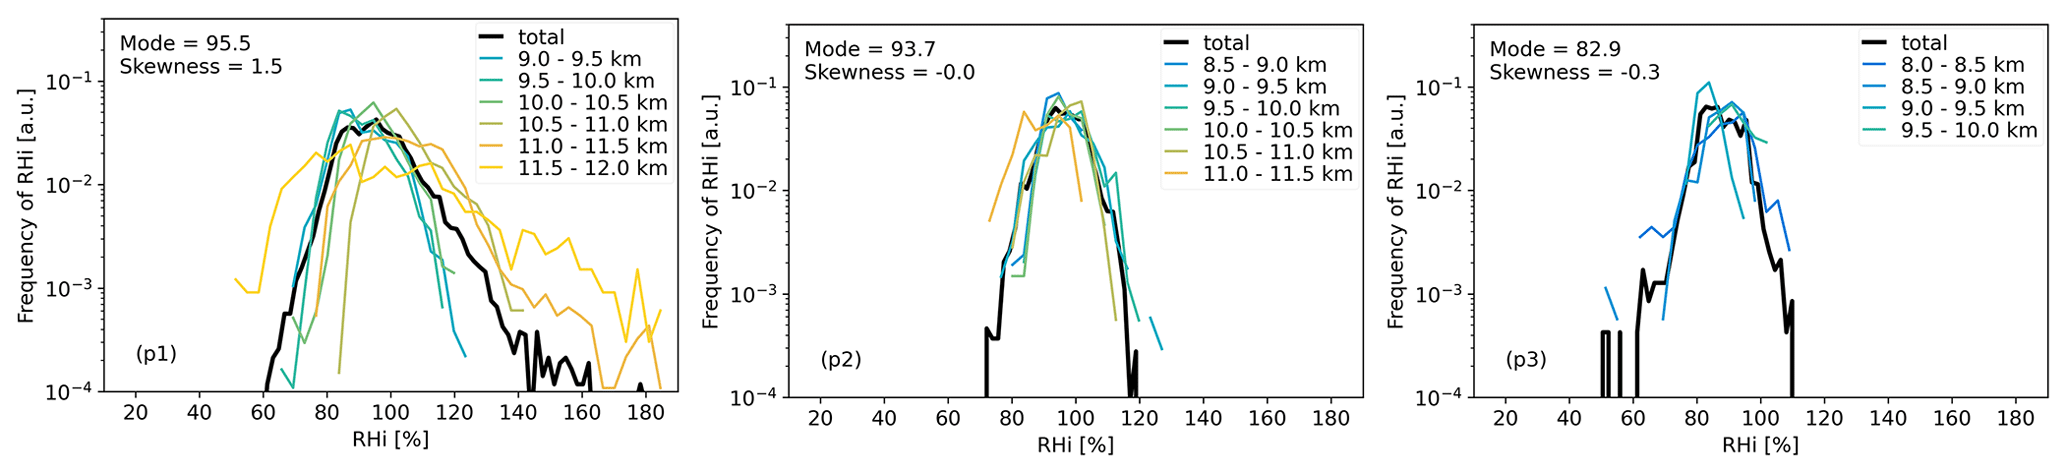
Figure 9PDF of in-cloud RHi in vertical layers with 500 m depths from the cloud bottom to the cloud top. From left to right: (p1) young phase, (p2) mature phase and (p3) stable phase, in accordance with Fig. 8. The number of layers differs depending on the geometrical depth of the cloud and the depth at which the lidar could provide measurements.
In Fig. 8, we plot the BSR of the WCB. We once again split the case into three parts, depending on the evolutionary stage of the clouds, and divide the clouds into vertical layers with a depth of 500 m. For this lidar leg, HALO flew along the WCB from near the center of the system to its outer edge. Thus, we consider the first part to be the youngest. It has an RHi mode of 95.5 % and a positive skewness of 1.5. The range of the distributions reaches RHi values above 140 %. The vertical structure is rather uniform. The uppermost layers of the cloud seem to have more data points with higher supersaturations. The second part is slightly older. The mode here is 94, and the skewness is close to 0. At this stage the cloud is stable. This is also seen in the vertical structure which is uniform throughout the cloud. The third part is the furthest from the center of the system, and thus, we consider it to be the oldest of the three. The RHi mode for this cloud is 83 %, and the skewness is slightly negative, and the cloud has started dissipating at this stage (Fig. 9).
Using lidar measurements of cirrus clouds over the midlatitudes and following the abovementioned methods, we found that the distribution of RHi in midlatitude cirrus clouds has a 96 % mode value, which is close to the ice saturation threshold, considering the error of 10 %–15 % in the calculation of RHi. Around 34 % of the in-cloud data points showed ice supersaturation; 3.8 % had RHi values higher than 120 %, and 0.5 % exceed 140 % RHi. Ovarlez et al. (2002), Ström et al. (2003), Kübbeler et al. (2011), Petzold et al. (2017) and Kaufmann et al. (2018) using in situ measurements, Gensch et al. (2008) using in situ measurements and a model, Comstock et al. (2004) using ground-based Raman lidar measurements, and Krämer et al. (2009, 2020) using in situ and satellite remote sensing (lidar and radar) measurements also found an RHi mode close to or at ice saturation for midlatitude cirrus clouds. Groß et al. (2014) analyzed water vapor measurements by WALES taken over Germany during November 2010 and found an RHi mode of 98 % and an ice supersaturation frequency of 30 %, which is in accordance with our findings, but contrary to our findings they reported only 2 % of data points over RHi 120 %. Differences may arise due to the seasonal variability of RHi and the fact that they performed measurements only in one atmospheric system (Kahn et al., 2008; Dzambo and Turner, 2016). Other studies also found supersaturations of around 30 % in midlatitude cirrus clouds; namely, Comstock et al. (2004) analyzed Raman lidar measurements taken over the Southern Great Plains (SGP) and Ovarlez et al. (2002) in situ measurements over Scotland, during the INter hemispheric difference in Cirrus properties from Anthropogenic emissions (INCA) campaign (Ström et al., 2003). Only Jensen et al. (2001) found a higher ice supersaturation frequency, 49 %, but from in situ measurements taken during the SUCCESS aircraft field campaign over an area close to the SGP. It must be noted that the SUCCESS campaign focused on measuring areas with high ice supersaturations.
After studying the correlation of RHi with temperature we found that the probability for the occurrence of supersaturation is slightly higher in the temperature range between 215 and 225 K. Comstock et al. (2004), Krämer et al. (2009, 2020) and Jensen et al. (2013) also detected a trend to higher supersaturations for colder temperatures. Most of the supersaturated data points are in the HET regime; some are also found in the HOM regime, and very few are even above water saturation, in contrast to Krämer et al. (2009), who found no supersaturations above that threshold. The errors on the RHi values that stem from the used datasets should also be regarded.
Regarding the vertical structure of RHi, we found that the cloud tops mostly consist of data points with high supersaturations and RHi values above 140 %. Lower supersaturations gradually become dominant in deeper layers of the clouds, while the cloud bases are mostly subsaturated. This leads to the conclusion that ice crystals form near the cloud tops, grow at the cloud middle, and sublimate or sediment at the cloud base. Diao et al. (2013, 2015) also define the ice nucleation, growth and sublimation stages based on the measured ice super- and subsaturation. Model simulations by Heymsfield and Miloshevich (1995) and Spichtinger and Gierens (2009) predicted the same vertical distribution of supersaturation. Other field studies over the midlatitudes also confirm our findings. Comstock et al. (2004) and Di Girolamo et al. (2009) used ground-based Raman lidar over the SGP and Italy (EAQUATE experiment), respectively, and noted higher ice supersaturation near the cloud top and subsaturation near the cloud base. Sakai et al. (2014) measured cirrus clouds with an instrumented balloon and ground-based lidar and also detected their highest supersaturations near the cloud tops. Dzambo and Turner (2016) also came to the same conclusions by using a combination of radiosonde and millimeter-wavelength cloud radar data from the SGP, as did Korolev and Isaac (2006) by using in situ measurements.
In some cases, the uppermost cloud layer had lower supersaturations than deeper layers or was even subsaturated. The analysis of those cases showed that these clouds also had a lower RHi mode and a low or negative RHi skewness, leading to the conclusion that they were older clouds in which ice crystal formation had ceased. Groß et al. (2014) also noted this behavior in one of their analyzed cases and came to the same conclusion.
The cloud-free air in the vicinity of the measured cirrus clouds has an RHi mode of 68 %. Voigt et al. (2010) also report cloud-free RHi mostly below saturation with most of the data between 70 % and 100 % RHi. Supersaturation with respect to ice is detected for 6.8 % of the cloud-free data points, although only 1.2 % have RHi values over 120 %. Colder data points have a higher probability of being supersaturated. Comstock et al. (2004) detected a higher supersaturation frequency for the cloud-free air (9 %). Aircraft-based studies such as Heymsfield et al. (1998), Gierens et al. (1999, 2000) and Jensen et al. (2001, 2005) also detected high supersaturations over ice in the upper troposphere of the midlatitudes. Most of the supersaturated data points are in the HET regime, although very few are also detected close to or in the HOM regime. This was also detected by Ovarlez et al. (2002), Krämer et al. (2009, 2020) and Cziczo et al. (2013). The high probability density for warm data points with RHi close to zero stems from measurements taken in the stratosphere, as we found by a closer analysis of individual cases.
The correlation of RHi with temperature showed that midlatitude cirrus clouds are most frequently detected in two domains: one around 225 K and close to saturation, RHi = 100 %, and a second one around 218 K which is subsaturated, RHi = 79 %. These two domains coincide with the two cirrus groups, in situ and liquid origin. In situ represents the colder, subsaturated domain and liquid origin the warmer, saturated domain, as was also shown by Gasparini et al. (2018). More specifically, 30.8 % of the data points of in situ-formed clouds were supersaturated, mostly below the low HET threshold. On the other hand, liquid-origin clouds have a supersaturation occurrence of 36 %, and supersaturation reaches the high HET threshold. The differences between the two groups are most pronounced for RHi up to 120 %; for higher values they have similar occurrence frequencies. Cloud-free air in the vicinity of liquid-origin cirrus clouds is also more likely to be supersaturated.
A variety of factors are able to affect the cloud formation and evolution. The ambient updraft is one of the most important. The intensity of the updraft is one of the regulating factors that determines the cooling rate, supersaturation and nucleation process. In order to investigate the possible effect of the updraft on the two cloud types, we calculated the frequency distributions of the vertical velocities. We used vertical velocities from the ERA5 reanalysis dataset and collocated them to the measured clouds. For the in situ, as well as the liquid-origin clouds, the most common updraft speeds are very close to zero. Liquid-origin clouds are more frequently measured in slightly higher updrafts, but the difference in frequency is small. Krämer et al. (2016) also expect liquid-origin clouds in higher updrafts but consider clouds from WCB systems to be slow updraft liquid-origin clouds. In our study most liquid-origin clouds are also characterized as stemming from WCBs, supporting the small difference between the two cloud types.
From the analysis of the two cases, we identify three evolutionary stages with distinctive characteristics. Young, newly formed clouds have an RHi mode close to ice saturation and an RHi probability density function (PDF) with positive skewness, resembling a Rayleigh distribution. Skewness is higher for the uppermost layers, where more supersaturated data points are located and new ice crystals form. Mature clouds have a supersaturated RHi mode and an RHi PDF with skewness towards higher supersaturations, also close to a Rayleigh distribution. The vertical RHi distribution is rather uniform throughout the cloud, with slightly higher supersaturations near the cloud top. Finally, stable clouds have an RHi mode close to saturation or subsaturated and an RHi PDF with skewness close to zero, described by a nearly Gaussian distribution. Their vertical structure is rather uniform, although supersaturation might still be frequent near the cloud top. At this stage the clouds may still produce new ice crystals but are nearing their dissipation, especially if the RHi mode is subsaturated. It should be noted that especially for younger clouds most commonly only the upper layers could be measured with the lidar. Errors in the calculation of RHi also stem from the error of the ECMWF temperatures as discussed by Groß et al. (2014) and Kaufmann et al. (2018). Comstock et al. (2004) also chose a case and studied the behavior of RHi during the evolution of a cirrus cloud. They note similar stages in their life cycle as we do. The evolutionary stages we find are also confirmed by in situ measurements (Diao et al., 2013, 2015). Ovarlez et al. (2002) split their observed clouds into a warm and cold regime with the threshold temperature being −40 ∘C. They found that a Gaussian distribution can be fitted over the warm clouds and a Rayleigh over the cold ones, due to a positive skewness towards higher RHi values. They conclude that this difference stems from the variability in the amount of time that is needed for a cirrus cloud to reach a stable state, where depositional growth and sublimation of ice crystals are in equilibrium (Khvorostyanov and Sassen, 1998; Hoyle et al., 2005). They interpreted the positive skewness as being an indication of clouds that have not yet reached maturity. This is also observed in our study. Spichtinger et al. (2004) detected positive skewness in the RHi distributions in the higher and colder parts of the clouds measured during the Measurement of Ozone by Airbus In-service aircraft (MOZAIC) project. They also concluded that this observation is relevant to the relaxation times and the effect vertical motion has on them (Gierens, 2003). Finally, Groß et al. (2014) used the shape of the RHi distribution in order to draw conclusions about the evolutionary stage of the cloud in their case study.
In this study we combined water vapor measurements by the WALES lidar system, conducted during the ML-CIRRUS campaign, and model temperatures by ECMWF and studied the general characteristics, vertical structure, and temporal evolution of humidity related to saturation within midlatitude cirrus clouds and their adjacent cloud-free air. The German research aircraft HALO, employed during this campaign, is capable of reaching the altitudes needed for the study of cirrus clouds via lidar and has a long enough range, allowing for continuous measurements of extended systems over land and ocean. The use of a lidar instrument is advantageous over in situ measurements, as it provides a 2D curtain of the measured clouds which under favorable conditions can depict even their complete vertical structure. This way one overflight is sufficient enough to measure a whole cloud or cloud system and to get information about the whole atmospheric column from flight altitude until the ground for cloud-free regions. The WALES lidar system is a unique and powerful instrument as it combines HSRL and DIAL measurement techniques. Thus, the optical properties of the cirrus clouds, as well as water vapor concentrations, are measured simultaneously with a high spatial and temporal resolution. The use of collocated model temperatures from ECMWF does not negatively affect our analysis, despite the known lower resolution and errors. Thus, we are confident that our method is suitable and effective for the study of cirrus clouds in the future.
From our analysis, we not only detect high supersaturations – reaching the threshold for homogeneous nucleation – within the clouds but also in the cloud-free air around them. Within the cirrus clouds we detect a clear vertical structure of RHi. The uppermost parts of the clouds are mostly supersaturated with RHi frequently above 140 %. That is where new ice crystals form. In the cloud middle, lower supersaturated RHi values are detected, and the cloud base is most frequently subsaturated. We detect two regimes which we identify as the two cloud groups suggested by Krämer et al. (2016): in situ-formed and liquid-origin cirrus. These two cloud groups have been shown to have different effects on the climate (Krämer et al., 2020). Krämer et al. (2016) and Gasparini et al. (2018) studied them by means of model simulations and Luebke et al. (2016) and Krämer et al. (2020) by in situ and satellite measurements. To our knowledge this is the first study of these cloud groups with an airborne lidar, where we discuss the characteristics of RHi within them and at their adjacent environment. We also conclude that the shape of the frequency distribution of RHi within cirrus clouds and the vertical structure of RHi can be used as a signature, indicating different evolutionary stages. Rayleigh distributions are indicative of young clouds or cloud layers where ice crystals are being formed – especially if the RHi mode is supersaturated – and Gaussian distributions of older clouds or cloud layers that have reached a mature state of equilibrium, or even dissipating clouds, if additionally, the RHi mode is subsaturated.
Ice-nucleating particles, water vapor and the ambient temperature are three factors that strongly affect the formation of cirrus clouds. Common among these three is that they have a dependence on latitude (DeMott et al., 2010). The microphysical characteristics and thus the radiative effects of cirrus clouds strongly depend on their formation mechanism (Gensch et al., 2008). Based on this it is known that cirrus clouds in the mid and high latitudes also have different characteristics (Hong and Liu, 2015; Gasparini et al., 2018; Mitchell et al., 2018; Sourdeval et al., 2018) and different effects on the climate (Hong and Liu, 2015; Mitchell et al., 2018; Krämer et al., 2020). Measurements of the water vapor profile of cirrus clouds in high latitudes as provided by airborne lidar instruments are scarce and necessary in order to compare their characteristics with midlatitude cirrus clouds and investigate possible differences.
The lidar measurements from the ML-CIRRUS campaign that were used in this study can be found at the HALO database: https://doi.org/10.17616/R39Q0T (Wirth, 2018). Model temperatures are obtained from the European Centre for Medium-Range Weather Forecasts (https://doi.org/10.21957/open-data, ECMWF, 2018).
GD and SG conceptualized the study. Data curation was done by MW. Formal analysis, investigation and visualization were done by GD, assisted by SG and MW. Calculation of backward trajectories and cloud classification were done by CR and MK. Writing of the original draft was done by GD under the supervision of SG. The review and editing of the manuscript was done by SG, MW, MK and CR.
At least one of the (co-)authors is a member of the editorial board of Atmospheric Chemistry and Physics. The peer-review process was guided by an independent editor, and the authors also have no other competing interests to declare.
Publisher's note: Copernicus Publications remains neutral with regard to jurisdictional claims in published maps and institutional affiliations.
The article processing charges for this open-access publication were covered by the German Aerospace Center (DLR).
This paper was edited by Daniel Knopf and reviewed by Eleni Marinou and one anonymous referee.
Ansmann, A., Mamouri, R.-E., Bühl, J., Seifert, P., Engelmann, R., Hofer, J., Nisantzi, A., Atkinson, J. D., Kanji, Z. A., Sierau, B., Vrekoussis, M., and Sciare, J.: Ice-nucleating particle versus ice crystal number concentrationin altocumulus and cirrus layers embedded in Saharan dust:a closure study, Atmos. Chem. Phys., 19, 15087–15115, https://doi.org/10.5194/acp-19-15087-2019, 2019.
Bösenberg, J.: Ground-based differential absorption lidar for water-vapor and temperature profiling: methodology, Appl. Optics, 37, 3845–3860, https://doi.org/10.1364/AO.37.003845, 1998.
Browell, E. V., Ismail, S., and Grant, W. B.: Differential absorption lidar (DIAL) measurements from air and space, Appl. Phys. B, 67, 399–410, https://doi.org/10.1007/s003400050523, 1998.
Burkhardt, U.: Extending a PDF cloud scheme in order to accommodate cirrus physics, 5–8 November 2012, Workshop on Parametrization of Clouds and Precipitation, 99–108, 2013.
Chen, T., Rossow, W. B., and Zhang, Y.: Radiative Effects of Cloud-Type Variations, J. Climate, 13, 264–286, https://doi.org/10.1175/1520-0442(2000)013<0264:REOCTV>2.0.CO;2, 2000.
Chen, W.-N., Chiang, C.-W., and Nee, J.-B.: Lidar ratio and depolarization ratio for cirrus clouds, Appl. Optics, 41, 6470–6476, https://doi.org/10.1364/ao.41.006470, 2002.
Comstock, J. M., Ackerman, T. P., and Mace, G. G.: Ground-based lidar and radar remote sensing of tropical cirrus clouds at Nauru Island: Cloud statistics and radiative impacts, J. Geophys. Res.-Atmos., 107, AAC 16-1–AAC 16-14, https://doi.org/10.1029/2002JD002203, 2002.
Comstock, J. M., Ackerman, T. P., and Turner, D. D.: Evidence of high ice supersaturation in cirrus clouds using ARM Raman lidar measurements: ICE SUPERSATURATION IN CIRRUS CLOUDS, Geophys. Res. Lett., 31, L11106, https://doi.org/10.1029/2004GL019705, 2004.
Cox, S. K.: Cirrus Clouds and the Climate, J. Atmos. Sci., 28, 1513–1515, https://doi.org/10.1175/1520-0469(1971)028<1513:CCATC>2.0.CO;2, 1971.
Cziczo, D. J., Froyd, K. D., Hoose, C., Jensen, E. J., Diao, M., Zondlo, M. A., Smith, J. B., Twohy, C. H., and Murphy, D. M.: Clarifying the Dominant Sources and Mechanisms of Cirrus Cloud Formation, Science, 340, 1320–1324, https://doi.org/10.1126/science.1234145, 2013.
DeMott, P. J., Prenni, A. J., Liu, X., Kreidenweis, S. M., Petters, M. D., Twohy, C. H., Richardson, M. S., Eidhammer, T., and Rogers, D. C.: Predicting global atmospheric ice nuclei distributions and their impacts on climate, P. Natl. Acad. Sci. USA, 107, 11217–11222, https://doi.org/10.1073/pnas.0910818107, 2010.
Diao, M., Zondlo, M. A., Heymsfield, A. J., Beaton, S. P., and Rogers, D. C.: Evolution of ice crystal regions on the microscale based on in situ observations, Geophys. Res. Lett., 40, 3473–3478, https://doi.org/10.1002/grl.50665, 2013.
Diao, M., Jensen, J. B., Pan, L. L., Homeyer, C. R., Honomichl, S., Bresch, J. F., and Bansemer, A.: Distributions of ice supersaturation and ice crystals from airborne observations in relation to upper tropospheric dynamical boundaries, J. Geophys. Res.-Atmos., 120, 5101–5121, https://doi.org/10.1002/2015JD023139, 2015.
Di Girolamo, P., Summa, D., Lin, R.-F., Maestri, T., Rizzi, R., and Masiello, G.: UV Raman lidar measurements of relative humidity for the characterization of cirrus cloud microphysical properties, Atmos. Chem. Phys., 9, 8799–8811, https://doi.org/10.5194/acp-9-8799-2009, 2009.
Dzambo, A. M. and Turner, D. D.: Characterizing relative humidity with respect to ice in midlatitude cirrus clouds as a function of atmospheric state, J. Geophys. Res.-Atmos., 121, 12253–12269, https://doi.org/10.1002/2015JD024643, 2016.
ECMWF (European Centre for Medium-range Weather Forecast): The ERA-Interim reanalysis dataset, Copernicus Climate Change Service (C3S) [data set], https://www.ecmwf.int/en/forecasts/dataset/ecmwf-reanalysis-interim (last access: 3 March 2023), 2011.
ECMWF (European Centre for Medium-range Weather Forecast): Catalogue of ECMWF Real-time Products, ECMWF [data set], https://doi.org/10.21957/open-data, 2018.
Ehret, G., Kiemle, C., Renger, W., and Simmet, G.: Airborne remote sensing of tropospheric water vapor with a near–infrared differential absorption lidar system, Appl. Optics, 32, 4534–4551, https://doi.org/10.1364/AO.32.004534, 1993.
Esselborn, M., Wirth, M., Fix, A., Tesche, M., and Ehret, G.: Airborne high spectral resolution lidar for measuring aerosol extinction and backscatter coefficients, Appl. Optics, 47, 346–358, https://doi.org/10.1364/ao.47.000346, 2008.
Fusina, F., Spichtinger, P., and Lohmann, U.: Impact of ice supersaturated regions and thin cirrus on radiation in the midlatitudes, J. Geophys. Res.-Atmos., 112, D24S14, https://doi.org/10.1029/2007JD008449, 2007.
Gasparini, B., Meyer, A., Neubauer, D., Münch, S., and Lohmann, U.: Cirrus Cloud Properties as Seen by the CALIPSO Satellite and ECHAM-HAM Global Climate Model, J. Climate, 31, 1983–2003, https://doi.org/10.1175/JCLI-D-16-0608.1, 2018.
Gensch, I., Bunz, H., Baumgardner, D., Christensen, L., Fahey, D., Herman, R., Popp, P., Smith, J., Troy, R., Webster, C., Weinstock, E., Wilson, J. C., Peter, T., and Krämer, M.: Supersaturations, microphysics and nitric acid partitioning in a cold cirrus cloud observed during CR-AVE 2006: An observation-modelling intercomparison study, Environ. Res. Lett., 3, 035003, https://doi.org/10.1088/1748-9326/3/3/035003, 2008.
Gierens, K.: On the transition between heterogeneous and homogeneous freezing, Atmos. Chem. Phys., 3, 437–446, https://doi.org/10.5194/acp-3-437-2003, 2003.
Gierens, K., Schumann, U., Helten, M., Smit, H., and Marenco, A.: A distribution law for relative humidity in the upper troposphere and lower stratosphere derived from three years of MOZAIC measurements, Ann. Geophys., 17, 1218–1226, https://doi.org/10.1007/s00585-999-1218-7, 1999.
Gierens, K., Schumann, U., Helten, M., Smit, H., and Wang, P.-H.: Ice-supersaturated regions and subvisible cirrus in the northern midlatitude upper troposphere, J. Geophys. Res.-Atmos., 105, 22743–22753, https://doi.org/10.1029/2000JD900341, 2000.
Gobbi, G. P.: Polarization lidar returns from aerosols and thin clouds: a framework for the analysis, Appl. Optics, 37, 5505–5508, https://doi.org/10.1364/ao.37.005505, 1998.
Groß, S., Wirth, M., Schäfler, A., Fix, A., Kaufmann, S., and Voigt, C.: Potential of airborne lidar measurements for cirrus cloud studies, Atmos. Meas. Tech., 7, 2745–2755, https://doi.org/10.5194/amt-7-2745-2014, 2014.
Haag, W. and Kärcher, B.: The impact of aerosols and gravity waves on cirrus clouds at midlatitudes, J. Geophys. Res.-Atmos., 109, D12202, https://doi.org/10.1029/2004JD004579, 2004.
Haag, W., Kärcher, B., Ström, J., Minikin, A., Lohmann, U., Ovarlez, J., and Stohl, A.: Freezing thresholds and cirrus cloud formation mechanisms inferred from in situ measurements of relative humidity, Atmos. Chem. Phys., 3, 1791–1806, https://doi.org/10.5194/acp-3-1791-2003, 2003.
Heymsfield, A. J.: Precipitation Development in Stratiform Ice Clouds: A Microphysical and Dynamical Study, J. Atmos. Sci., 34, 367–381, https://doi.org/10.1175/1520-0469(1977)034<0367:PDISIC>2.0.CO;2, 1977.
Heymsfield, A. J. and Miloshevich, L. M.: Relative Humidity and Temperature Influences on Cirrus Formation and Evolution: Observations from Wave Clouds and FIRE II, J. Atmos. Sci., 52, 4302–4326, https://doi.org/10.1175/1520-0469(1995)052<4302:RHATIO>2.0.CO;2, 1995.
Heymsfield, A. J., Miloshevich, L. M., Twohy, C., Sachse, G., and Oltmans, S.: Upper-tropospheric relative humidity observations and implications for cirrus ice nucleation, Geophys. Res. Lett., 25, 1343–1346, https://doi.org/10.1029/98GL01089, 1998.
Hong, Y. and Liu, G.: The Characteristics of Ice Cloud Properties Derived from CloudSat and CALIPSO Measurements, J. Climate, 28, 3880–3901, https://doi.org/10.1175/JCLI-D-14-00666.1, 2015.
Hoose, C. and Möhler, O.: Heterogeneous ice nucleation on atmospheric aerosols: a review of results from laboratory experiments, Atmos. Chem. Phys., 12, 9817–9854, https://doi.org/10.5194/acp-12-9817-2012, 2012.
Hoyle, C. R., Luo, B. P., and Peter, T.: The Origin of High Ice Crystal Number Densities in Cirrus Clouds, J. Atmos. Sci., 62, 2568–2579, https://doi.org/10.1175/JAS3487.1, 2005.
Huang, J.: A Simple Accurate Formula for Calculating Saturation Vapor Pressure of Water and Ice, J. Appl. Meteorol. Clim., 57, 1265–1272, https://doi.org/10.1175/JAMC-D-17-0334.1, 2018.
IPCC: Climate change 2007: the physical science basis: contribution of Working Group I to the Fourth Assessment Report of the Intergovernmental Panel on Climate Change, edited by: Solomon, S., Qin, D., Manning, M., Chen, Z., Marquis, M., Averyt, K. B., Tignor, M., and Miller, H. L., Cambridge University Press, Cambridge, New York, 996 pp., ISBN 978-0-521-88009-1, 978-0-521-70596-7, 2007.
IPCC: Climate Change 2013: The Physical Science Basis. Contribution of Working Group I to the Fifth Assessment Report of the Intergovernmental Panel on Climate Change, edited by: Stocker, T. F., Qin, D., Plattner, G.-K., Tignor, M., Allen, S. K., Boschung, J., Nauels, A., Xia, Y., Bex, V., and Midgley, P. M., Cambridge University Press, Cambridge, United Kingdom and New York, NY, USA, 1535 pp., ISBN 978-1-107-05799-9, 978-1-107-66182-0, 2013.
Jensen, E. J., Toon, O. B., Vay, S. A., Ovarlez, J., May, R., Bui, T. P., Twohy, Cynthia. H., Gandrud, B. W., Pueschel, R. F., and Schumann, U.: Prevalence of ice-supersaturated regions in the upper troposphere: Implications for optically thin ice cloud formation, J. Geophys. Res.-Atmos., 106, 17253–17266, https://doi.org/10.1029/2000JD900526, 2001.
Jensen, E. J., Smith, J. B., Pfister, L., Pittman, J. V., Weinstock, E. M., Sayres, D. S., Herman, R. L., Troy, R. F., Rosenlof, K., Thompson, T. L., Fridlind, A. M., Hudson, P. K., Cziczo, D. J., Heymsfield, A. J., Schmitt, C., and Wilson, J. C.: Ice supersaturations exceeding 100 % at the cold tropical tropopause: implications for cirrus formation and dehydration, Atmos. Chem. Phys., 5, 851–862, https://doi.org/10.5194/acp-5-851-2005, 2005.
Jensen, E. J., Diskin, G., Lawson, R. P., Lance, S., Bui, T. P., Hlavka, D., McGill, M., Pfister, L., Toon, O. B., and Gao, R.: Ice nucleation and dehydration in the Tropical Tropopause Layer, P. Natl. Acad. Sci. USA, 110, 2041–2046, https://doi.org/10.1073/pnas.1217104110, 2013.
Joos, H., Spichtinger, P., Reutter, P., and Fusina, F.: Influence of heterogeneous freezing on the microphysical and radiative properties of orographic cirrus clouds, Atmos. Chem. Phys., 14, 6835–6852, https://doi.org/10.5194/acp-14-6835-2014, 2014.
Kahn, B. H., Liang, C. K., Eldering, A., Gettelman, A., Yue, Q., and Liou, K. N.: Tropical thin cirrus and relative humidity observed by the Atmospheric Infrared Sounder, Atmos. Chem. Phys., 8, 1501–1518, https://doi.org/10.5194/acp-8-1501-2008, 2008.
Kärcher, B.: Atmospheric Ice Formation Processes, in: Atmospheric Physics: Background – Methods – Trends, edited by: Schumann, U., Springer, Berlin, Heidelberg, 151–167, https://doi.org/10.1007/978-3-642-30183-4_10, 2012.
Kärcher, B.: Cirrus Clouds and Their Response to Anthropogenic Activities, Curr. Clim. Change Rep., 3, 45–57, https://doi.org/10.1007/s40641-017-0060-3, 2017.
Kärcher, B. and Lohmann, U.: A parameterization of cirrus cloud formation: Heterogeneous freezing, J. Geophys. Res.-Atmos., 108, 4402, https://doi.org/10.1029/2002JD003220, 2003.
Kärcher, B. and Seifert, A.: On homogeneous ice formation in liquid clouds, Q. J. Roy. Meteor. Soc., 142, 1320–1334, https://doi.org/10.1002/qj.2735, 2016.
Kärcher, B., Hendricks, J., and Lohmann, U.: Physically based parameterization of cirrus cloud formation for use in global atmospheric models, J. Geophys. Res.-Atmos., 111, D01205, https://doi.org/10.1029/2005JD006219, 2006.
Kaufmann, S., Voigt, C., Heller, R., Jurkat-Witschas, T., Krämer, M., Rolf, C., Zöger, M., Giez, A., Buchholz, B., Ebert, V., Thornberry, T., and Schumann, U.: Intercomparison of midlatitude tropospheric and lower-stratospheric water vapor measurements and comparison to ECMWF humidity data, Atmos. Chem. Phys., 18, 16729–16745, https://doi.org/10.5194/acp-18-16729-2018, 2018.
Khvorostyanov, V. I. and Curry, J. A.: Critical humidities of homogeneous and heterogeneous ice nucleation: Inferences from extended classical nucleation theory, J. Geophys. Res.-Atmos., 114, D04207, https://doi.org/10.1029/2008JD011197, 2009.
Khvorostyanov, V. I. and Sassen, K.: Cirrus Cloud Simulation Using Explicit Microphysics and Radiation. Part II: Microphysics, Vapor and Ice Mass Budgets, and Optical and Radiative Properties, J. Atmos. Sci., 55, 1822–1845, https://doi.org/10.1175/1520-0469(1998)055<1822:CCSUEM>2.0.CO;2, 1998.
Kiemle, C., Wirth, M., Fix, A., Ehret, G., Schumann, U., Gardiner, T., Schiller, C., Sitnikov, N., and Stiller, G.: First airborne water vapor lidar measurements in the tropical upper troposphere and mid-latitudes lower stratosphere: accuracy evaluation and intercomparisons with other instruments, Atmos. Chem. Phys., 8, 5245–5261, https://doi.org/10.5194/acp-8-5245-2008, 2008.
Koop, T., Luo, B., Tsias, A., and Peter, T.: Water activity as the determinant for homogeneous ice nucleation in aqueous solutions, Nature, 406, 611–614, https://doi.org/10.1038/35020537, 2000.
Korolev, A. and Isaac, G. A.: Relative Humidity in Liquid, Mixed-Phase, and Ice Clouds, J. Atmos. Sci., 63, 2865–2880, https://doi.org/10.1175/JAS3784.1, 2006.
Krämer, M., Schiller, C., Afchine, A., Bauer, R., Gensch, I., Mangold, A., Schlicht, S., Spelten, N., Sitnikov, N., Borrmann, S., de Reus, M., and Spichtinger, P.: Ice supersaturations and cirrus cloud crystal numbers, Atmos. Chem. Phys., 9, 3505–3522, https://doi.org/10.5194/acp-9-3505-2009, 2009.
Krämer, M., Rolf, C., Luebke, A., Afchine, A., Spelten, N., Costa, A., Meyer, J., Zöger, M., Smith, J., Herman, R. L., Buchholz, B., Ebert, V., Baumgardner, D., Borrmann, S., Klingebiel, M., and Avallone, L.: A microphysics guide to cirrus clouds – Part 1: Cirrus types, Atmos. Chem. Phys., 16, 3463–3483, https://doi.org/10.5194/acp-16-3463-2016, 2016.
Krämer, M., Rolf, C., Spelten, N., Afchine, A., Fahey, D., Jensen, E., Khaykin, S., Kuhn, T., Lawson, P., Lykov, A., Pan, L. L., Riese, M., Rollins, A., Stroh, F., Thornberry, T., Wolf, V., Woods, S., Spichtinger, P., Quaas, J., and Sourdeval, O.: A microphysics guide to cirrus – Part 2: Climatologies of clouds and humidity from observations, Atmos. Chem. Phys., 20, 12569–12608, https://doi.org/10.5194/acp-20-12569-2020, 2020.
Krautstrunk, M. and Giez, A.: The Transition From FALCON to HALO Era Airborne Atmospheric Research, in: Atmospheric Physics: Background – Methods – Trends, edited by: Schumann, U., Springer, Berlin, Heidelberg, 609–624, https://doi.org/10.1007/978-3-642-30183-4_37, 2012.
Kübbeler, M., Hildebrandt, M., Meyer, J., Schiller, C., Hamburger, Th., Jurkat, T., Minikin, A., Petzold, A., Rautenhaus, M., Schlager, H., Schumann, U., Voigt, C., Spichtinger, P., Gayet, J.-F., Gourbeyre, C., and Krämer, M.: Thin and subvisible cirrus and contrails in a subsaturated environment, Atmos. Chem. Phys., 11, 5853–5865, https://doi.org/10.5194/acp-11-5853-2011, 2011.
Liou, K.-N.: Influence of Cirrus Clouds on Weather and Climate Processes: A Global Perspective, Mon. Weather Rev., 114, 1167–1199, https://doi.org/10.1175/1520-0493(1986)114<1167:IOCCOW>2.0.CO;2, 1986.
Liu, X. and Penner, J. E.: Ice nucleation parameterization for global models, Meteorol. Z., 499–514, https://doi.org/10.1127/0941-2948/2005/0059, 2005.
Luebke, A. E., Afchine, A., Costa, A., Grooß, J.-U., Meyer, J., Rolf, C., Spelten, N., Avallone, L. M., Baumgardner, D., and Krämer, M.: The origin of midlatitude ice clouds and the resulting influence on their microphysical properties, Atmos. Chem. Phys., 16, 5793–5809, https://doi.org/10.5194/acp-16-5793-2016, 2016.
Manabe, S. and Strickler, R. F.: Thermal Equilibrium of the Atmosphere with a Convective Adjustment, J. Atmos. Sci., 21, 361–385, https://doi.org/10.1175/1520-0469(1964)021<0361:TEOTAW>2.0.CO;2, 1964.
McKenna, D. S., Konopka, P., Grooß, J.-U., Günther, G., Müller, R., Spang, R., Offermann, D., and Orsolini, Y.: A new Chemical Lagrangian Model of the Stratosphere (CLaMS) 1. Formulation of advection and mixing, J. Geophys. Res.-Atmos., 107, ACH 15-1–ACH 15-15, https://doi.org/10.1029/2000JD000114, 2002.
Mitchell, D. L., Garnier, A., Pelon, J., and Erfani, E.: CALIPSO (IIR–CALIOP) retrievals of cirrus cloud ice-particle concentrations, Atmos. Chem. Phys., 18, 17325–17354, https://doi.org/10.5194/acp-18-17325-2018, 2018.
Ovarlez, J., Gayet, J.-F., Gierens, K., Ström, J., Ovarlez, H., Auriol, F., Busen, R., and Schumann, U.: Water vapour measurements inside cirrus clouds in Northern and Southern hemispheres during INCA, Geophys. Res. Lett., 29, 60-1–60-4, https://doi.org/10.1029/2001GL014440, 2002.
Petzold, A., Krämer, M., Neis, P., Rolf, C., Rohs, S., Berkes, F., Smit, H., Gallagher, M., Beswick, K., Lloyd, G., Baumgardner, D., Spichtinger, P., Nédélec, P., Ebert, V., Buchholz, B., Riese, M., and Wahner, A.: Upper tropospheric water vapour and its interaction with cirrus clouds as seen from IAGOS long-term routine: In situ observations, Faraday Discuss., 200, 229–249, https://doi.org/10.1039/C7FD00006E, 2017.
Phillips, V. T. J., DeMott, P. J., and Andronache, C.: An Empirical Parameterization of Heterogeneous Ice Nucleation for Multiple Chemical Species of Aerosol, J. Atmos. Sci., 65, 2757–2783, https://doi.org/10.1175/2007JAS2546.1, 2008.
Pruppacher, H. R. and Klett, J. D.: Microphysics of Clouds and Precipitation, 2nd Edn., Atmospheric and Oceanographic Sciences Library, Vol. 18, Springer Dordrecht, 954 pp., https://doi.org/10.1007/978-0-306-48100-0, 1997.
Ramanathan, V., Pitcher, E. J., Malone, R. C., and Blackmon, M. L.: The Response of a Spectral General Circulation Model to Refinements in Radiative Processes, J. Atmos. Sci., 40, 605–630, https://doi.org/10.1175/1520-0469(1983)040<0605:TROASG>2.0.CO;2, 1983.
Sakai, T., Orikasa, N., Nagai, T., Murakami, M., Tajiri, T., Saito, A., Yamashita, K., and Hashimoto, A.: Balloon-borne and Raman lidar observations of Asian dust and cirrus cloud properties over Tsukuba, Japan, J. Geophys. Res.-Atmos., 119, 3295–3308, https://doi.org/10.1002/2013JD020987, 2014.
Seifert, M., Ström, J., Krejci, R., Minikin, A., Petzold, A., Gayet, J.-F., Schlager, H., Ziereis, H., Schumann, U., and Ovarlez, J.: Aerosol-cirrus interactions: a number based phenomenon at all?, Atmos. Chem. Phys., 4, 293–305, https://doi.org/10.5194/acp-4-293-2004, 2004.
Sourdeval, O., Gryspeerdt, E., Krämer, M., Goren, T., Delanoë, J., Afchine, A., Hemmer, F., and Quaas, J.: Ice crystal number concentration estimates from lidar–radar satellite remote sensing – Part 1: Method and evaluation, Atmos. Chem. Phys., 18, 14327–14350, https://doi.org/10.5194/acp-18-14327-2018, 2018.
Spichtinger, P. and Gierens, K. M.: Modelling of cirrus clouds – Part 1b: Structuring cirrus clouds by dynamics, Atmos. Chem. Phys., 9, 707–719, https://doi.org/10.5194/acp-9-707-2009, 2009.
Spichtinger, P., Gierens, K., Smit, H. G. J., Ovarlez, J., and Gayet, J.-F.: On the distribution of relative humidity in cirrus clouds, Atmos. Chem. Phys., 4, 639–647, https://doi.org/10.5194/acp-4-639-2004, 2004.
Stephens, G. L., Tsay, S.-C., Stackhouse, P. W., and Flatau, P. J.: The Relevance of the Microphysical and Radiative Properties of Cirrus Clouds to Climate and Climatic Feedback, J. Atmos. Sci., 47, 1742–1754, https://doi.org/10.1175/1520-0469(1990)047<1742:TROTMA>2.0.CO;2, 1990.
Ström, J., Seifert, M., Kärcher, B., Ovarlez, J., Minikin, A., Gayet, J.-F., Krejci, R., Petzold, A., Auriol, F., Haag, W., Busen, R., Schumann, U., and Hansson, H. C.: Cirrus cloud occurrence as function of ambient relative humidity: a comparison of observations obtained during the INCA experiment, Atmos. Chem. Phys., 3, 1807–1816, https://doi.org/10.5194/acp-3-1807-2003, 2003.
Urbanek, B., Groß, S., Schäfler, A., and Wirth, M.: Determining stages of cirrus evolution: a cloud classification scheme, Atmos. Meas. Tech., 10, 1653–1664, https://doi.org/10.5194/amt-10-1653-2017, 2017.
Urbanek, B., Groß, S., Wirth, M., Rolf, C., Krämer, M., and Voigt, C.: High Depolarization Ratios of Naturally Occurring Cirrus Clouds Near Air Traffic Regions Over Europe, Geophys. Res. Lett., 45, 13166–13172, https://doi.org/10.1029/2018GL079345, 2018.
Voigt, C., Schumann, U., Jurkat, T., Schäuble, D., Schlager, H., Petzold, A., Gayet, J.-F., Krämer, M., Schneider, J., Borrmann, S., Schmale, J., Jessberger, P., Hamburger, T., Lichtenstern, M., Scheibe, M., Gourbeyre, C., Meyer, J., Kübbeler, M., Frey, W., Kalesse, H., Butler, T., Lawrence, M. G., Holzäpfel, F., Arnold, F., Wendisch, M., Döpelheuer, A., Gottschaldt, K., Baumann, R., Zöger, M., Sölch, I., Rautenhaus, M., and Dörnbrack, A.: In-situ observations of young contrails – overview and selected results from the CONCERT campaign, Atmos. Chem. Phys., 10, 9039–9056, https://doi.org/10.5194/acp-10-9039-2010, 2010.
Voigt, C., Schumann, U., Minikin, A., Abdelmonem, A., Afchine, A., Borrmann, S., Boettcher, M., Buchholz, B., Bugliaro, L., Costa, A., Curtius, J., Dollner, M., Dörnbrack, A., Dreiling, V., Ebert, V., Ehrlich, A., Fix, A., Forster, L., Frank, F., Fütterer, D., Giez, A., Graf, K., Grooß, J.-U., Groß, S., Heimerl, K., Heinold, B., Hüneke, T., Järvinen, E., Jurkat, T., Kaufmann, S., Kenntner, M., Klingebiel, M., Klimach, T., Kohl, R., Krämer, M., Krisna, T. C., Luebke, A., Mayer, B., Mertes, S., Molleker, S., Petzold, A., Pfeilsticker, K., Port, M., Rapp, M., Reutter, P., Rolf, C., Rose, D., Sauer, D., Schäfler, A., Schlage, R., Schnaiter, M., Schneider, J., Spelten, N., Spichtinger, P., Stock, P., Walser, A., Weigel, R., Weinzierl, B., Wendisch, M., Werner, F., Wernli, H., Wirth, M., Zahn, A., Ziereis, H., and Zöger, M.: ML-CIRRUS: The Airborne Experiment on Natural Cirrus and Contrail Cirrus with the High-Altitude Long-Range Research Aircraft HALO, B. Am. Meteorol. Soc., 98, 271–288, https://doi.org/10.1175/BAMS-D-15-00213.1, 2017.
Wirth, M.: HALO database, Mission: ML-CIRRUS, WALES, DLR [data set], https://doi.org/10.17616/R39Q0T, 2018.
Wirth, M., Fix, A., Mahnke, P., Schwarzer, H., Schrandt, F., and Ehret, G.: The airborne multi-wavelength water vapor differential absorption lidar WALES: system design and performance, Appl. Phys. B, 96, 201–213, https://doi.org/10.1007/s00340-009-3365-7, 2009.