the Creative Commons Attribution 4.0 License.
the Creative Commons Attribution 4.0 License.
 | 03 Mar 2023
Measurement report: Volatile organic compound characteristics of the different land-use types in Shanghai: spatiotemporal variation, source apportionment and impact on secondary formations of ozone and aerosol
Yu Han
Tao Wang
Rui Li
Hongbo Fu
Yusen Duan
Song Gao
Liwu Zhang
Jianmin Chen
Volatile organic compounds (VOCs) have important impacts on air quality, atmospheric chemistry and human health. In order to identify the spatiotemporal variations, sources and ozone (O3) and secondary organic aerosol (SOA) formation potentials of the atmospheric VOCs, a concurrent multi-site observation campaign was performed at the supersites of Shanghai, East China, in the first three months of 2019. The sampling sites are located at the different land-use types, including an industrial district (the Jinshan site: JS), residential and commercial mixed districts (the Pudong site: PD) and a background district (the Qingpu site: QP) of Shanghai. During the observation period, the average VOC concentrations were sensitive to the land-use types in the order of the JS (21.88 ± 12.58 ppb) > PD (21.36 ± 8.58 ppb) > QP (11.93 ± 6.33 ppb) sites. The predominant VOC category was alkanes (49.32 %–71.48 %), followed by aromatics (10.70 %–21.00 %), alkenes (10.13 %–15.30 %) and alkynes (7.69 %–14.80 %) at the studied sites. There were distinct diurnal variations and “weekend effects” of VOCs at the sampling sites. The VOC concentrations increased by 27.15 %, 32.85 % and 22.42 % during the haze events relative to the clean days. Vehicle exhaust was determined as the predominant VOC source. The second-largest VOC contributor was identified as industrial production at the JS and PD sites, while it proved to be fuel production and evaporation at the QP site. The industrial emission and biomass burning showed slight contributions to VOC concentrations at the QP and JS/PD sites, respectively. This was consistent with the regional characteristics of anthropogenic activities dominated by land-use types. High potential source contribution function (PSCF) values primarily appeared in the northeastern and northern areas surrounding sampling sites, suggesting strong local emissions. The ozone formation potential (OFP) values of each land-use type were in the order of the JS (50.89 ± 2.63 ppb) > PD (33.94 ± 1.52 ppb) > QP (24.26 ± 1.43 ppb) sites, with alkenes and aromatics being the predominant contributors. Secondary organic aerosol formation potential (SOAFP), mainly contributed by the aromatics, was highest at the JS site (1.00 ± 2.03 µg m−3), followed by the PD (0.46 ± 0.88 µg m−3) and QP (0.41 ± 0.58 µg m−3) sites. The VOC–PM2.5 sensitivity analysis showed that VOCs at the QP site displayed a more rapid increment along with the increase in PM2.5 values relative to the other two sites. Alkenes and aromatics are both the key concerns in controlling the VOC-related pollution of O3 and SOA in Shanghai. These findings provide more information on accurate air-quality control at a city level in China. The results shown herein highlight that the simultaneous multi-site measurements with the different land-use types in a megacity or city cluster could be more appropriate for fully understanding the VOC characteristics relative to a single-site measurement performed normally.
- Article
(5203 KB) - Full-text XML
-
Supplement
(6813 KB) - BibTeX
- EndNote


Serious air pollution in China is currently characterized by high levels of ozone (O3) and fine particulate matter (PM), especially PM2.5 (PM with an aerodynamic diameter of less than 2.5 µm). The atmospheric volatile organic compounds (VOCs) greatly influence the O3 and PM2.5 formations and function as important precursors (Carter, 1994; Liu et al., 2008; Yuan et al., 2013; Lu et al., 2018; Ma et al., 2019; Yu et al., 2021). In brief, the primary VOCs can be oxidized and/or photolyzed by OH, O3 and NO3 to produce secondary VOCs, e.g., non-/semi-volatile organic compounds, NVOCs SVOCs, which both further transform into secondary organic aerosol (SOA) via a series of atmospheric processes (Odum et al., 1997; Ng et al., 2007; Heald et al., 2020). It was well known that SOA has strong influences on the radiative forcing and climate change (Sadeghi et al., 2021). On the other hand, active VOCs react with NOx and radicals via an array of photochemical pathways to produce O3. Photochemical assessment monitoring stations (PAMSs) have confirmed that, in total, 57 VOCs, including C2–C10 alkanes, alkenes, alkynes and aromatics, greatly contribute to the formation of O3 (US EPA, 1990). Atmospheric O3 shows profound impacts on the atmospheric oxidizing capacity, agriculture production and ecosystem (Liu, 1987; Carter, 1994; Mousavinezhad et al., 2021; Sadeghi et al., 2021). Additionally, O3 and PM2.5, together with their VOC precursors, can damage human health and lead to many diseases, such as cancers and respiratory and nervous illness (Rumchev et al., 2007; Amor-Carro et al., 2020). Therefore, the VOC-related studies can provide scientific-based information for decision makers to draw up strategies to control PM2.5 and O3.
The long-term VOC emission inventory highlighted that there were significant spatial discrepancies in VOC emissions (Y. J. Li et al., 2019). The observation campaign also showed that VOC concentrations varied with the sampling sites. These phenomena were attributed to the fact that VOC concentrations were closely correlated with the land-use types. For instance, the VOC concentrations varied approximately from 20 to 40 ppb in the urban area (Geng et al., 2008; Cai et al., 2010b; Huang et al., 2015; Dai et al., 2017; Liu et al., 2019; Xu et al., 2019; Ren et al., 2020; Wang et al., 2020; Liu et al., 2021) and ∼ 90 ppb in the industrial area in Shanghai, China (Zhang et al., 2018; Wang et al., 2021). Kumar et al. (2018) found that the VOC concentration in the urban area was approximately twice as high as that in the rural area in Delhi, India, in agreement with the finding of Tang et al. (2008). However, the reported VOC concentrations were widely discussed by single-site measurements, and the limited knowledge is available on multi-site research at a city level. In addition, the land-use types were also related to the VOC sources, especially the anthropogenic sources (Yoo et al., 2015; Chen et al., 2017; T. Wang et al., 2017; Jookjantra et al., 2022). For example, in Shanghai, China, vehicle-related sources were regarded as the predominant VOC source, accounting for 34 % in the urban area (Cai et al., 2010a), while the industrial emission accounted for over 50 % of the measured VOCs near an industrial site (Zhang et al., 2018). In Zhengzhou, China, the solvent utilization was the largest contributor (34 %) in the urban area (Y. D. Li et al., 2020), whereas coal and biomass burning was the major source of ambient VOCs (30.6 %) at the Gongshui site surrounded by several manufacturing plants (B. Li et al., 2019). Such great discrepancies among the different land-use types result in the fact that it is necessary to perform concurrent multi-site measurements of VOC characteristics at a city level.
The diversities of VOC concentrations among the different land-use types could affect the ozone and SOA formation potentials (OFP and SOAFP), resulting in the variations of O3 and SOA concentrations. For instance, Song et al. (2021) found that the OFP values in the commercial and residential areas were approximately twice as high as that in the area dominated by natural vegetation in Xi'an, China, which was in agreement with the finding of Kumar et al. (2018). Such a scenario could influence the atmospheric O3 concentration in that VOCs are an important precursor of O3 formation. In detail, atmospheric VOCs undergo degradation to produce oxidants (HO2 and RO2), which further oxidize atmospheric NO, followed by producing NO2 and formating O3 finally via the photochemical pathways (R. Wang et al., 2017). In terms of SOAFP, there was a higher value in the urban area relative to the suburban area, increasing by 54.84 % in Beijing, China (Zhan et al., 2021; Liu et al., 2022). This discrepancy further had profound impacts on the concentration, physical property and chemical composition of SOA. As the key precursor of SOA, VOCs can be oxidized to produce the low VOCs, followed by the formation of SOA via homogeneous nucleation (Merikanto et al., 2009). Moreover, the partitioning of semi-volatile products from VOCs and oxidant gas-phase photochemical reactions forms SOA (Pankow, 1994; Lim et al., 2010). Additionally, low VOCs are produced via the aqueous-phase reactions in atmospheric waters, e.g., clouds, fogs, and aerosol water, which are largely retained in the particle phase to generate SOA (Lim et al., 2010).
As the junction of transportation and a center of industry, finance, economy and technology of East China, Shanghai covers an area of 6340 km2 and has a population of over 24 million. The expanding urbanization and industrialization jointly aggravate the VOC pollution. Moreover, the O3 concentration in the urban area in Shanghai increased by ∼ 67 % from 2006 to 2015, with a growth rate of 1.1 ppbv yr−1 (Gao et al., 2017). The maximum 1 h concentration of O3 could exceed 380 µg m−3 during polluted days (Shi et al., 2015; Gu et al., 2020). Such a scenario suggested that O3 played an important role in atmospheric pollution and that Shanghai was suffering from heavy O3 pollution. Additionally, the large changes in land use occurred in Shanghai due to the rapid development; e.g., many cultivated areas became urban and/or industrial zones, resulting in the diverse land-use types (Tian et al., 2017). Therefore, Shanghai is regarded as an ideal area for performing atmospheric measurements with the different land-use types. However, many studies were mainly focused on the single-site measurements, particularly conducted at the urban site in Shanghai, resulting in the impact of land-use type on VOC characteristics becoming still unclear to date. In addition, they mainly concentrated on the O3 characteristics, while the O3 and SOA formations from VOCs and the relationship between VOCs together with PM2.5 and O3 were rarely analyzed. Given the factors mentioned above, in this study, the concurrent multi-site and high-time-resolution measurements of VOCs with three typical land-use types in Shanghai for their concentrations, sources and ozone and SOA formation potentials were performed. The objectives of this study are to (1) figure out the VOC characteristics varying with the land-use types, (2) identify the predominant VOC emission sources and (3) quantitatively evaluate the roles of VOCs in the formation of PM2.5 and O3. The findings could advance our knowledge on the atmospheric characteristics of VOCs and provide more control strategies for policymakers to alleviate atmospheric pollution.
2.1 Sampling site description
The three sampling sites are located at the different land-use types of Shanghai, China: an industrial district (the Jinshan site: JS, 121.18∘ N, 30.44∘ E), residential and commercial mixed districts (the Pudong site: PD, 121.54∘ N, 31.23∘ E) and a background district (the Qingpu site: QP, 120.98∘ N, 31.09∘ E) (Fig. S1 in the Supplement). The online instruments were 30 m above the ground level to avoid airflow obstruction.
The JS site is located in the Second Jinshan Industrial Area of Shanghai as an industrial site. The site is situated ∼ 20 km southwest of the Shanghai Chemical Industrial Park and Garbage Disposal Incinerator 2. Moreover, a large number of chemical factories, such as rubber factories, paint solvent factories and oil refineries, are located within 2 km of the JS site. In particular, the Shanghai Petrochemical Industrial Limited Company (one of the largest refining-chemical integrated petrochemical companies in Shanghai) is 1.5 km southeast of the JS site. Additionally, two arterial roads are located 100 and 300 m away from the JS site, respectively. Thus, the land-use type of the JS site could be regarded as an industrial district (Table S1 in the Supplement).
The PD site is located in the Pudong New Area as an urban site ∼ 59 km northeast of the JS site. The Pudong New Area is the most populous district of Shanghai, with a population of up to 5.6 million (the Seventh Census of China). The Baosteel Group Corporation, International Cruise Port wharf, Waigaoqiao Shipbuilding LTD and Domestic Waste Incinerator are located within 30 km of the PD site. The Yangshan harbor (the biggest harbor of Shanghai) and Garbage Disposal Incinerator 1 are located 51 and 37 km southeast of the PD site, respectively. Furthermore, the PD site is surrounded by the three main airports of Shanghai, including Hongqiao International Airport, Longhua Airport and Pudong International Airport. In addition, the site is a junction of road, commercial and financial areas with intense human activities that is ∼ 1.5 km away from Jinxiu Road, Jincai High School, Jinnan High School, and Jincai Experimental Primary School. Therefore, the land-use type of the PD site is residential and commercial mixed districts (Table S1).
The QP site is located near the southeast of Lake Dianshan, which is a tourist attraction in the Qingpu district as a city background site, ∼ 50 km northwest of the JS site and 54 km southwest of the PD site. Surrounded by vegetation, the QP site is situated ∼ 7.6 and 4.6 km northeast of the Grand View Garden and Chenguang Garden, respectively. Moreover, this site is 3.6 km northeast of the Qingxi Country Park and 7.5 km southwest of the Zhuxi Garden. In addition, the QP site is close to the Hu-Yu Highway. Hence, the land-use type of the QP site is considered to be a background district (Table S1). Since the distinct land-use types among the sampling sites were observed, it is quite necessary to perform atmospheric measurements herein.
2.2 Sampling and analysis
The concentrations of VOCs, CO, NO–NO2–NOx and PM2.5 and meteorological factors including temperature, wind speed and relative humidity (RH) were measured at 1 h resolution. The sampling campaign was performed simultaneously at the three sites from 1 January to 31 March 2019.
At the JS site, the VOCs were collected and analyzed by online gas chromatography (GC866, Chromato, France) equipped with a flame ionization detector (FID). In brief, after the removal of water, the samples were separated for low-carbon (C2–C5) and high-carbon (C6–C12) compounds at temperatures of −5 and 25∘, respectively. Then the gas was analyzed by FID after high-temperature desorption (380∘) and column chromatographic separation. At the PD site, VOCs were measured by gas chromatography (GC580-FID, PE, USA) and TD300 (a transformer driver). The samples were separated at −30∘ after the removal of water. Then the gas was determined by FID after high-temperature desorption (325∘) and column chromatographic separation. At the QP site, VOCs were determined by gas chromatography (GC5000 BTX/VOC, AMA, German) and an FID. The samples were condensed for low-carbon (C2–C5) compounds at 15∘ and high-carbon (C6–C12) compounds at 30∘. Then the gas was analyzed by FID after high-temperature desorption (230∘) and column chromatographic separation. The curve correlation coefficient (R2) of all of the VOCs was ≥ 0.995. The accuracy of more than 95 % of the compounds was 20 %. The precision of all the target compounds was ≤ 10 %. In total, 43 species of VOCs were observed, including 16 alkanes, 11 alkenes, 16 aromatics and 1 alkyne. The minimum detection limit (MDL) of most VOC components was ≤ 0.15 ppb (Table S2).
The O3 and NO–NO2–NOx were characterized by trace gas instruments (49i ozone analyzer and 42i nitrogen oxide analyzer, produced by Thermo Environmental Instruments Inc., USA) with detection limits of 0.50 and 0.40 ppb, respectively. PM2.5 was monitored by a TEOM 1405-F. The meteorological variables including temperature, RH and wind speed were acquired from each air monitoring station.
2.3 Spatial analysis
The spatial heterogeneity of VOC concentration between two different sites was determined by the coefficient of divergence (COD) (Wongphatarakul et al., 1998; Sawvel et al., 2015). The COD was calculated by Eq. (1):
where xij presents the mass concentration in i time, j and k are two datasets and p presents the number of observations. The values of COD represent the degree of similarity of the two datasets; i.e., the value of COD approached 1, illustrating that the big difference exists in the two datasets (Song et al., 2017).
2.4 Positive matrix factorization (PMF) model
PMF was a receptor model designed for the source identification of atmospheric pollutants (L. Li et al., 2015; Hopke et al., 2016; Pallavi et al., 2019). In brief, it measured the contributions and sources of pollutants by least squares and was based on the mass balance instead of the spectrum of the source component (Hui et al., 2018). In PMF 5.0, the mass balance equation was calculated by Eq. (2):
where xij is the jth species concentration in the sample i, gik represents the species contribution of the kth source to the ith sample, fkj is the jth species fraction from the kth source, eij is the residual result for the jth species in the ith sample and p is the number of independent sources (Paatero, 1997). The function Q was an important factor of PMF (Brown et al., 2015) and calculated by the iterative minimization algorithm (Hui et al., 2018). The objective function Q is shown in Eq. (3):
where uij is the uncertainty of the jth species in sample i.
The uncertainty of sampling was calculated by Eq. (4).
where MDL is the minimum detection limit and EF is the error fraction and can be set to 0.05–0.2 (Song et al., 2007). It was 0.1 in this study. In this study, 4 to 11 factors were utilized to determine the option solution. and are important parameters for characterizing the rationality of the PMF results (Brown et al., 2015). Seven factors were regarded as the optimal solution, comparing the ratios of , and PMF results. The values were set to 1.0 at the three sampling sites. The values were 1.3, 1.1 and 1.0 at the JS, PD and QP sites, respectively.
2.5 Potential source contribution function (PSCF) and Cluster
PSCF and Cluster were widely used to determine the back trajectories, sources and directions of pollutants (Draxier and Hess, 1998; Hong et al., 2019; Liu et al., 2019) and designed to measure the potential VOC source and primary transport pathway of trace elements (Ashbaugh et al., 1985; Xie and Berkowitz, 2007; Zheng et al., 2018; Liu et al., 2020).
This study was determined by the 24 h back trajectories (1 h interval) at a height of 500 m via the MeteoInfoMap software. Relevant parameters were acquired from the National Oceanic and Atmospheric Administration. The study area covered by back trajectories was divided into an array of 0.25∘ × 0.25∘ grid cells. The higher PSCF indicated that the area was a great contributor to the VOC pollution. The PSCF could be defined as Eq. (5).
where mij is the number of polluted trajectories through the grid, and nij is all of the trajectories through the grid. In order to distinguish the value of PSCF and increase the accuracy, the weight function Wij was applied to reveal the uncertainty of small values of nij (Polissar et al., 1999). The Wij could be calculated using Eq. (6) as follows.
Therefore, PSCFij can be calculated using Eq. (7) as follows.
2.6 Ozone formation potential (OFP)
The photochemical activity of VOCs was normally assessed by the OFP (Niu et al., 2016). The value of the OFP was affected by many factors, like meteorological conditions, VOC concentrations and VOC sources. The OFP was calculated by Eq. (8):
where OFPi is the ozone formation potential of the i species, [conc]i is the concentration of the VOC species i and MIRi is the maximum incremental reaction of the i VOC species, as reported by Carter (1994).
2.7 Secondary organic aerosol formation potential (SOAFP)
As discussed by Grosjean and Seinfeld (1989), SOAFP could be used to evaluate quantitatively the VOC influences on the secondary aerosol formation based on a variety of assumed interactions between VOCs and OH under the sunlight irradiation (08:00–17:00).
where VOCi is the concentration of the i VOC species, and FACi is the fraction aerosol coefficient of the i compound. The FACi was obtained from previous studies (Grosjean and Seinfeld, 1989; Zhu et al., 2017; Mozaffar et al., 2020).
2.8 Sensitivity analysis
In order to further understand the relationship between VOCs and PM2.5, a gradient model was applied to investigate the sensitivity of PM2.5 pollution to the VOC concentration. Equation (10) is below:
where ΔVOCs and are the concentrations of VOCs and PM2.5 is the specific PM2.5 gradients, respectively. The characteristic structure and reactivity could influence the contribution of VOCs to PM2.5 formation (Carter, 1994). To determine the quantitative relationship between the VOCs and PM2.5, the VOC sensitivity coefficient (VOCs–S) was used as in Eq. (11):
where BVOCs and are the background concentrations of VOCs and PM2.5. The PM2.5 concentrations below 20 µg m−3 were averaged to the background level (Han et al., 2017). The background concentration of VOCs (BVOCs) was the corresponding VOC concentrations. The higher the value of VOC–S, the more sensitive the VOCs to the PM2.5 concentrations. In order to quantify the sensitivity of VOCs to PM2.5, VOCs and PM2.5 were classified into different groups with a PM2.5 concentration interval of 5 µg m−3. It could be calculated by Eqs. (12)–(15):
where k represents the linear coefficient between ln() and ln(), and c is the intercept. This method was appropriate for understanding the sensitivity of VOC concentrations to PM2.5.
3.1 Characteristics of air pollutants
3.1.1 Data overview
Figure 1 shows the variations of meteorological factors, VOC categories and PM2.5 and O3 at the sampling sites. The average temperatures were 8.69 ± 3.24, 9.02 ± 3.24 and 7.73 ± 2.92∘, and the mean RHs were 83.77 ± 11.38 %, 75.37 ± 13.29 % and 71.80 ± 9.28 % at the JS, PD and QP sites, respectively. The wind speeds at the QP site (4.37 ± 1.47 m s−1) were 2.29 and 1.36 times higher than those at the JS (1.91 ± 0.49 m s−1) and PD (1.30 ± 0.62 m s−1) sites, respectively, indicating the decreased dilution and diffusion conditions at the latter two sites. In addition, the land-use types of the JS (industrial district) and PD (residential and commercial mixed districts) sites could lead to high anthropogenic emissions. These phenomena result in the fact that the VOC concentrations at the JS (21.88 ± 12.58 ppb) and PD (21.36 ± 8.58 ppb) sites were higher than that at the QP site (11.93 ± 6.33 ppb). Compared with the relevant measurements performed previously in Shanghai at the same sampling sites, this study generally presented lower VOC concentrations (Cai et al., 2010b; Zhang et al., 2018; K. Zhang et al., 2020). In detail, at the JS site, the VOC concentration was approximately 4 times lower than the measurement of Zhang et al. (2018) (94.14 ppb). At the PD and QP sites, the results in this study were slightly lower than those reported by Cai et al. (2010b) (24.3 ppb) and K. Zhang et al. (2020) (15.41 ppb). A variety of control strategies, such as prohibiting fireworks in the open air, improving VOC detection standards and strengthening control technology, were implemented, thus resulting in the low VOC concentrations herein. In particular, the policy of “one factory, one strategy”, targeted at mitigating VOC emissions, was published by the Shanghai government in 2018.
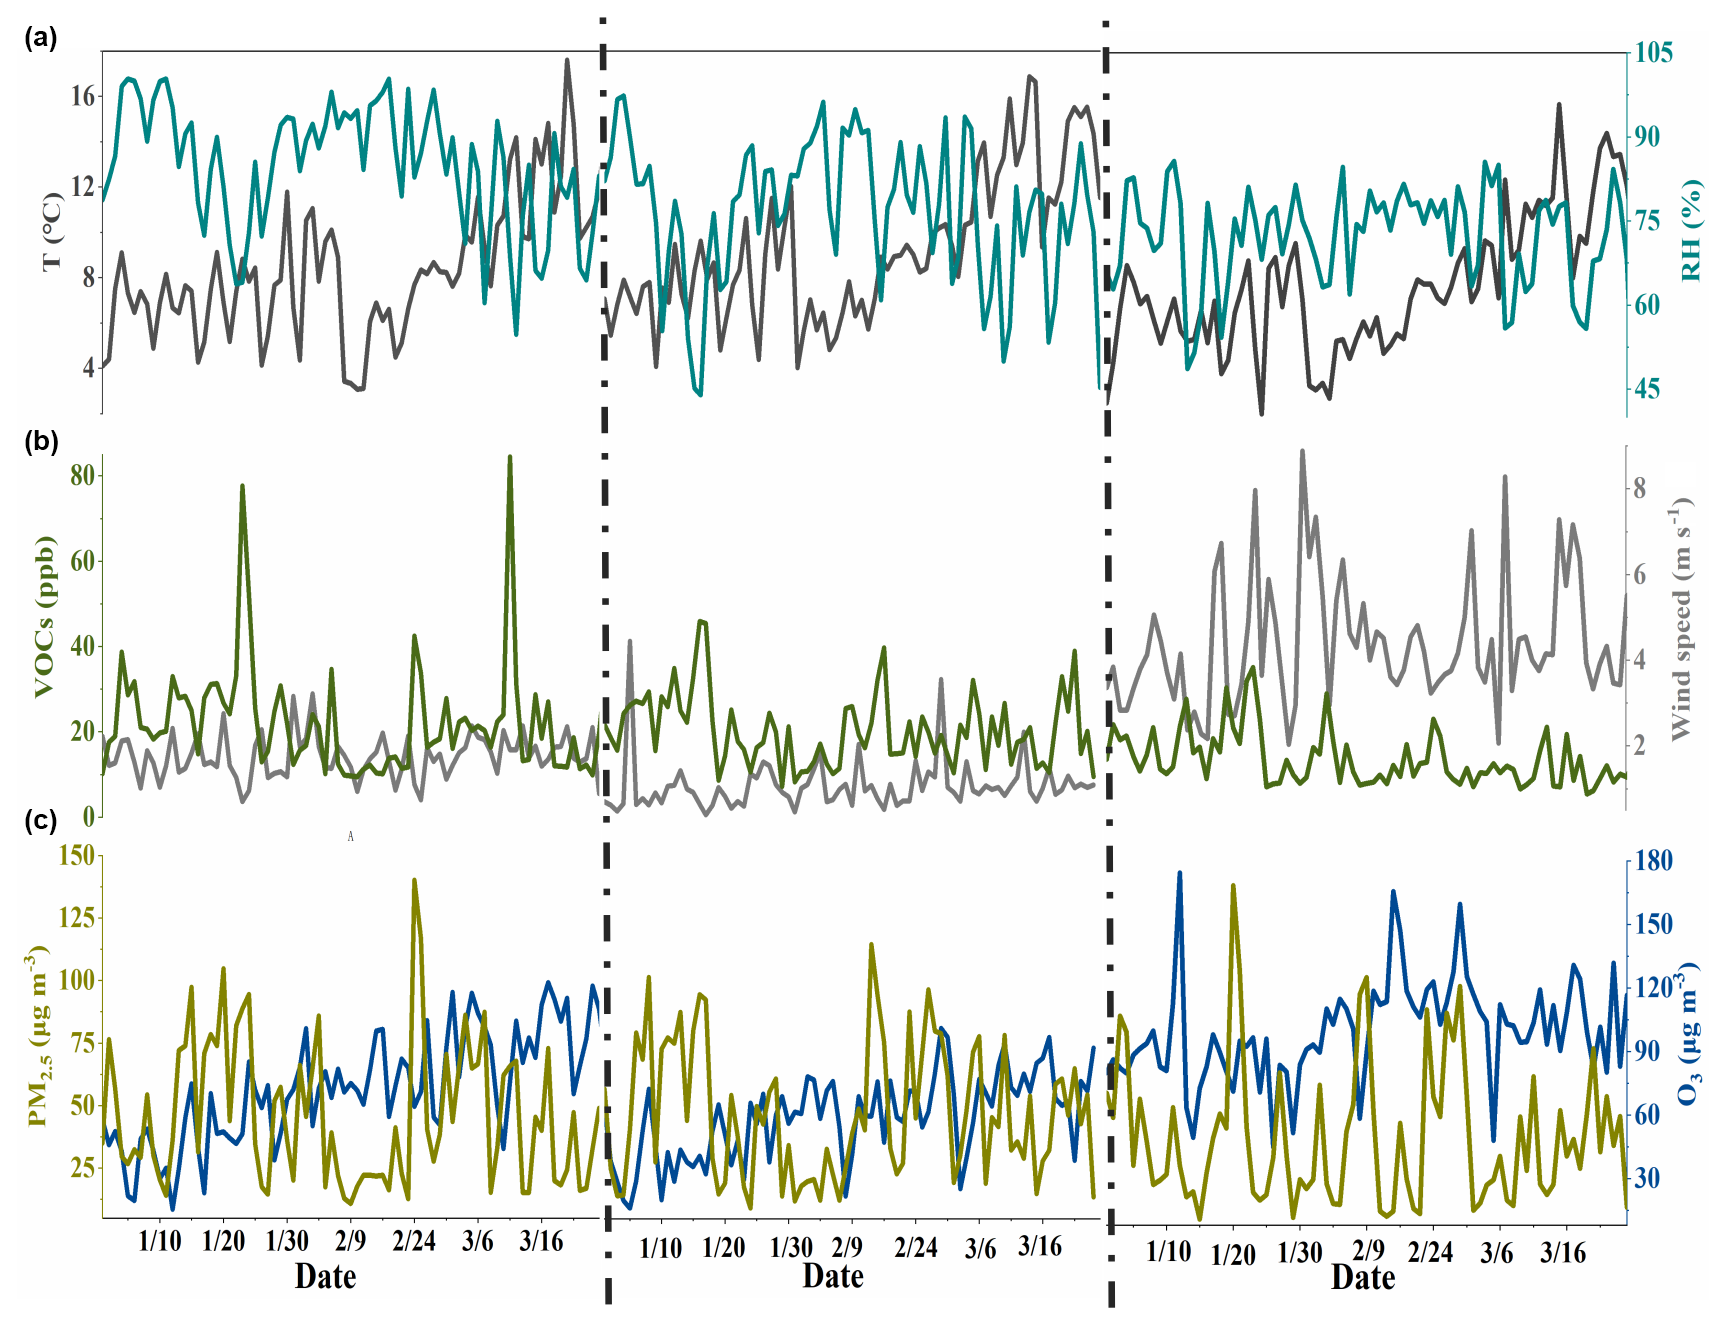
Figure 1Time series of temperature (T), relative humidity (RH), wind speed, VOC category, PM2.5 and O3 at the (a) JS, (b) PD and (c) QP sites.
The two prominent peaks of VOC concentrations were observed at the JS site on 23 January and 11 March, respectively. The highest VOC concentration appeared on 11 March with a value of 84.49 ppb. This phenomenon might be attributed to the leaking of chemical factories. The second-highest VOC concentration was observed on 23 January with a value of 77.71 ppb, which was 38.85 % and 57.07 % higher than those at the PD and QP sites, respectively. According to the Shanghai Municipal Bureau of Statistics (http://tjj.sh.gov.cn, last access: 3 March 2022), the traffic flow in January was ∼ 10 % higher than that in the following two months. Such a scenario was likely due to the Spring Festival travel rush; i.e., population travel intensively occurred around the Chinese Spring Festival. Moreover, these were pronounced in the industrial production in January compared with those in February (∼ 36 % uplift) and March (∼ 6 % uplift) (http://tjj.sh.gov.cn). The phenomena could be responsible for the elevated VOC emissions. Additionally, the lowest WS was observed on 23 January, with a value of 0.85 m s−1, which was contrary to dispersive dilution and convection of VOCs, causing high concentrations of VOC at the JS site (Kumar et al., 2018).
During the observation period, the average PM2.5 values were 45.57 ± 27.59, 48.51 ± 27.22 and 40.27 ± 27.78 µg m−3, and the mean O3 concentrations were averaged to 73.59 ± 23.59, 57.48 ± 20.49 and 99.30 ± 24.00 µg m−3 at the JS, PD and QP sites, respectively. VOCs were found to be positively correlated with PM2.5, and the Spearman correlation coefficients (RSpearman) were 0.72, 0.74 and 0.34 at the JS, PD and QP sites, respectively. It was well documented that the elevated VOC concentrations indicated the increasing rate of PM2.5 production via photochemical oxidation, gas–particle partitioning and/or heterogeneous absorption (Seinfeld et al., 2001; Yang et al., 2015; Han et al., 2017). However, the VOC concentrations were negatively correlated with O3 (.39 at the JS site, .50 at the PD site and .40 at the QP site, respectively). Lots of factors, including NOx levels, sunshine duration, temperature and relative humidity, not only the emission of precursors, impacted the surface O3. B. Li et al. (2019) emphasized that the absolute concentration of the precursor was not the only factor during the O3 formation in Zhengzhou, China.
3.1.2 Chemical compositions
The VOC compositions at the JS, PD and QP sites are presented in Fig. 2. During the observation campaign, 43 VOC species, including 16 alkanes, 11 alkenes, 16 aromatics and 1 alkyne, were measured, and the contributions of total VOCs (TVOCs) > 1 % were marked. The most abundant species was alkanes, followed by aromatics at the JS, PD and QP sites. The contributions of alkenes and alkynes were comparable at the above sites. Specifically, ethane, propane, iso-butane, n-butane, ethylene, benzene, toluene and ethyne were the abundant individual species, and they in total contributed more than 75 % of the TVOCs.
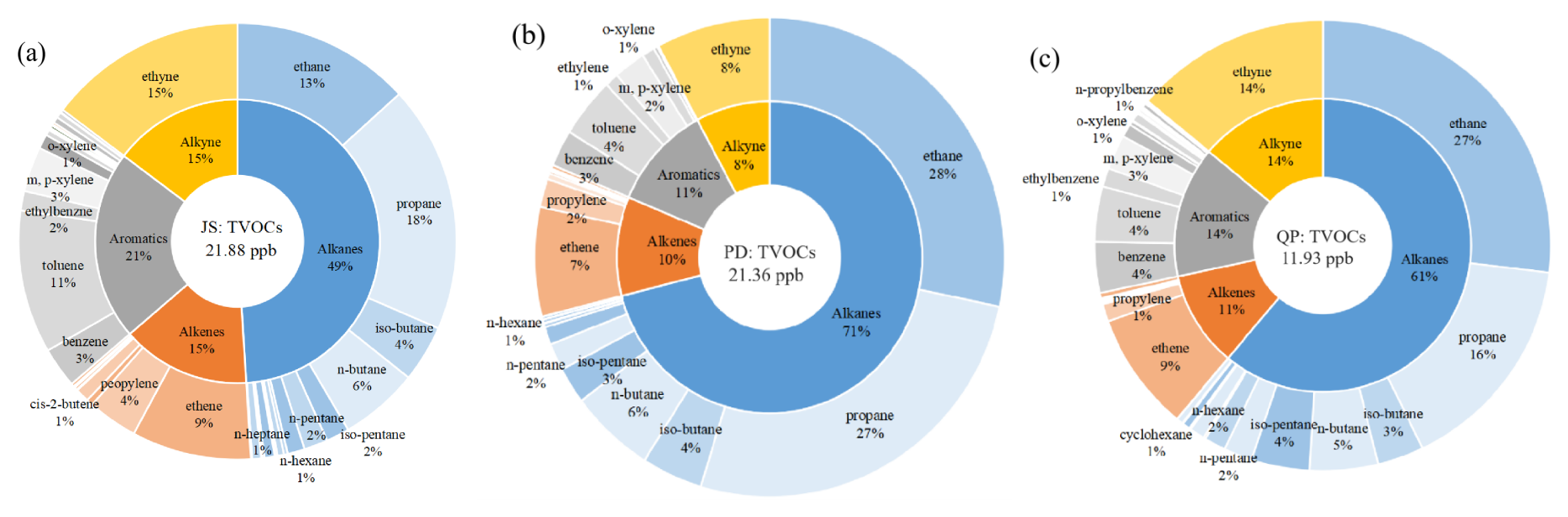
Figure 2Contributions of the VOC categories (43 species) at the (a) JS, (b) PD and (c) QP sites (the contributions > 1 % were marked).
Among the four major organic classes, the fractions of alkanes were 49.32 %, 71.48 % and 60.88 % at the JS, PD and QP sites, respectively, in line with the previous result (59.36 %) (K. Zhang et al., 2020). Such a high fraction of alkanes can be attributed to their widespread emission sources and long atmospheric lifetimes. In terms of VOC species, the ethane, propane and C4–C6 branches' alkanes contributed greatly to the alkanes at the sampling sites, in accordance with the findings of K. Zhang et al. (2020) and Song et al. (2021).
The second-largest group was aromatics, accounting for 21.00 %, 10.70 % and 13.75 % at the JS, PD and QP sites, respectively. As reported by Cai et al. (2010b), the aromatics at the Xujiahui site in Shanghai, China, accounted for 24.9 % of the TVOCs, which was slightly higher than the results obtained in this study. It is interesting to note that the dominating compounds of aromatics were toluene, m-/p-xylene, benzene, ethylbenzene and o-xylene (BTEX), in line with the results in some Chinese cities such as Shanghai (Zhang et al., 2018) and Xi'an (Song et al., 2021).
The alkenes accounted for 15.30 %, 10.13 % and 10.57 % at the JS, PD and QP sites, respectively, and the discrepancies of alkene contributions to TVOCs among the three sites were narrow. The ethene, propylene and butene were predominant compounds in the composition of alkenes, and their contributions were comparable to the results of Shao et al. (2016). The alkyne contributed 14.38 %, 7.69 % and 14.80 % to the TVOCs at the above sites. Relative to the result reported by K. Li et al. (2017) in Hangzhou, China, the contribution of alkyne was comparable to the present study, accounting for 16.6 % of the TVOCs.
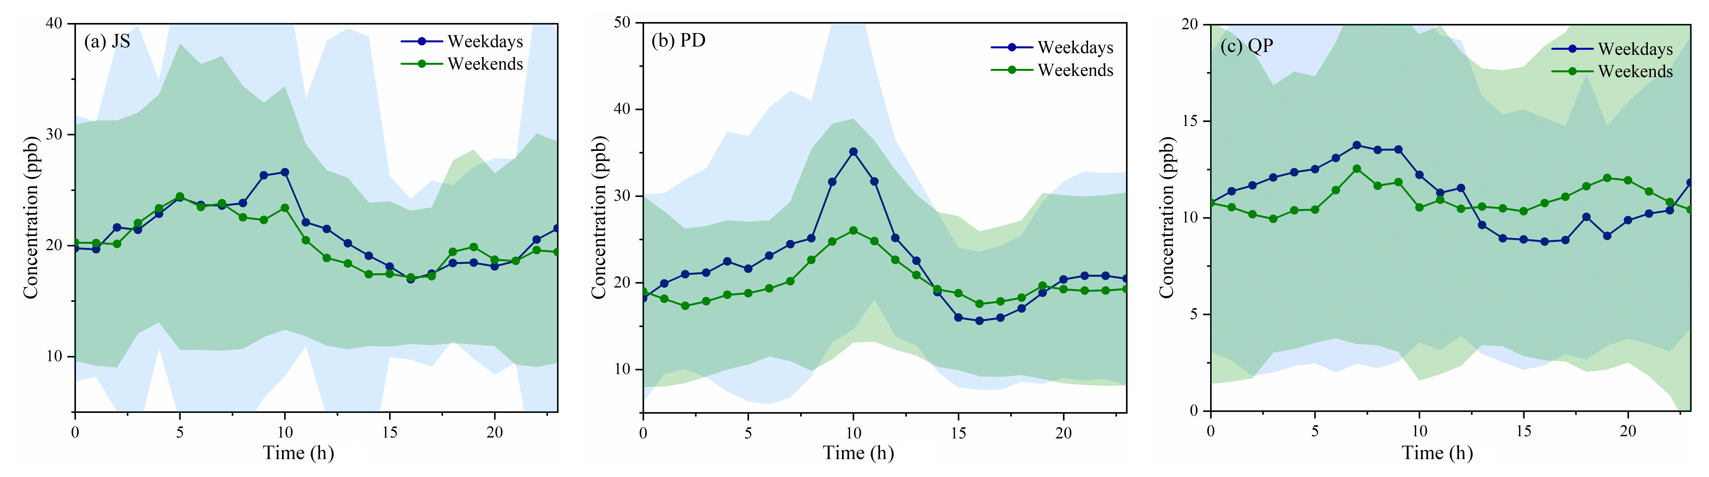
3.1.3 “Weekend effects”
The weekend effects of VOCs at the JS, PD and QP sites are shown in Fig. 3. On the weekdays, the average VOC concentrations were 21.03 ± 2.66, 22.00 ± 4.88 and 11.09 ± 1.58 ppb at the JS, PD and QP sites, respectively. The morning peak values were observed during the rush-hour traffic at 08:00 to 10:00 LT, reaching 26.61, 35.11 and 13.54 ppb, respectively, due to the morning traffic. The peak was more significant at the PD site than those at the JS and QP sites, illustrating the significant impact of land-use type, leading to the high vehicle emission at the PD site. During the rush-hour traffic at 18:00 to 21:00 LT, the VOC concentrations also tended to increase, and the evening peak values were 18.46, 20.82 and 10.22 ppb at the JS, PD and QP sites, respectively. Such a scenario could be attributed to the strong influence of the vehicle exhaust. The VOC concentrations dropped to a minimum at 16:00 LT, with values of 16.96, 15.62 and 8.77 ppb at the JS, PD and QP sites, respectively. The strong radiation, high temperature and boundary layer resulted in the most intense air convection condition and promoted the photochemical loss and dilution of VOCs, leading to the decreased VOC concentration (Zhang et al., 2018). On the weekends, the JS site exhibited the highest average VOC concentration of 20.36 ± 2.23 ppb, followed by the PD and QP sites with concentrations of 19.96 ± 2.37 and 10.96 ± 0.67 ppb, respectively. The VOC concentrations on the weekends were 3.31 %, 10.19 % and 1.19 % lower than those on the weekdays at the JS, PD and QP sites, respectively. Similarly, the elevated VOC concentrations on the weekdays were found in other studies, including Shanghai, China (Geng et al., 2008), Sacramento, California (Murphy et al., 2007), and Los Angeles, California (Nussbaumer and Cohen, 2020), due to the low anthropogenic activities occurring on the weekends, reflecting the low VOC emission (Murphy et al., 2007). The minimum VOC concentrations on the weekends appeared at 16:00 LT at the JS and PD sites and 15:00 LT at the QP site, respectively, with values of 17.14, 17.56 and 10.33 ppb which occurred around a similar time to those on the weekdays.
3.1.4 Discrepancy of clean and haze days
Referring to the previous documents (L. Li et al., 2017; Hui et al., 2019), haze pollution was defined as a condition with visibility < 10 km and RH < 80 %. During the observation period, there were three sequential haze pollution events at the three sites on the basis of these criteria, i.e., 18 to 25 January, 23 February to 3 March and 21 to 26 March. The VOC concentrations between the clean and haze days are shown in Fig. 4. The VOC concentrations on the clean days were averaged to 20.53 ± 12.10, 19.29 ± 7.60 and 11.04 ± 6.67 ppb at the JS, PD and QP sites, respectively. For the haze days, the VOC concentrations increased by 27.15 %, 32.85 % and 22.42 % at the above sites. Wu et al. (2016) also emphasized the increased VOC concentrations during haze days relative to clean days in Beijing, China. Obviously, the “haze–clean” differences of VOC concentrations were more significant at the JS and PD sites compared with the QP site. Such a scenario could be attributed to the locations of the JS and PD sites, which led to high anthropogenic emissions and low wind speed and implicit stagnant weather conditions, thereby inducing the severe haze pollution. In detail, the “clean–haze” discrepancy was dominated by aromatics (m-ethyltoluene, p-ethyltoluene, ethylbenzene, 1, 2, 4-trimethylbenzene) at the JS and PD sites, as reflected by the 44.54 % and 36.05 % higher concentrations on haze days relative to clean days. The above VOC compounds were related to industrial production, painting/coating and vehicle exhaust, and elevated concentrations reflected the concentrated emission sources. Zhang et al. (2021) studied the VOC characteristics during the haze pollution in Zhengzhou, China, and showed that aromatics present an upward tendency (∼ 34.04 % uplift) on the haze days, which was slightly lower than the results shown herein. At the QP site, alkanes (2, 2, 4-trimethylpentane, n-hexane, n-heptane) presented a significant clean–haze discrepancy (∼ 36.58 % uplift), implying great impacts of vehicle exhaust and fuel evaporation. Hui et al. (2018) also observed the elevated concentration of alkanes during the haze days in Wuhan, China, and found that there was a 37.28 % increment of alkanes, which was comparable to the result in the present study. Thus, it could be deduced that the haze occurrence is mainly associated with vehicle exhaust, industrial production and painting/coating at the JS and PD sites and vehicle exhaust and fuel evaporation at the QP site. Such deduction of the source of haze events agreed well with the studies on haze pollution in Shanghai, China (B. Li et al., 2019; Wei et al., 2019).
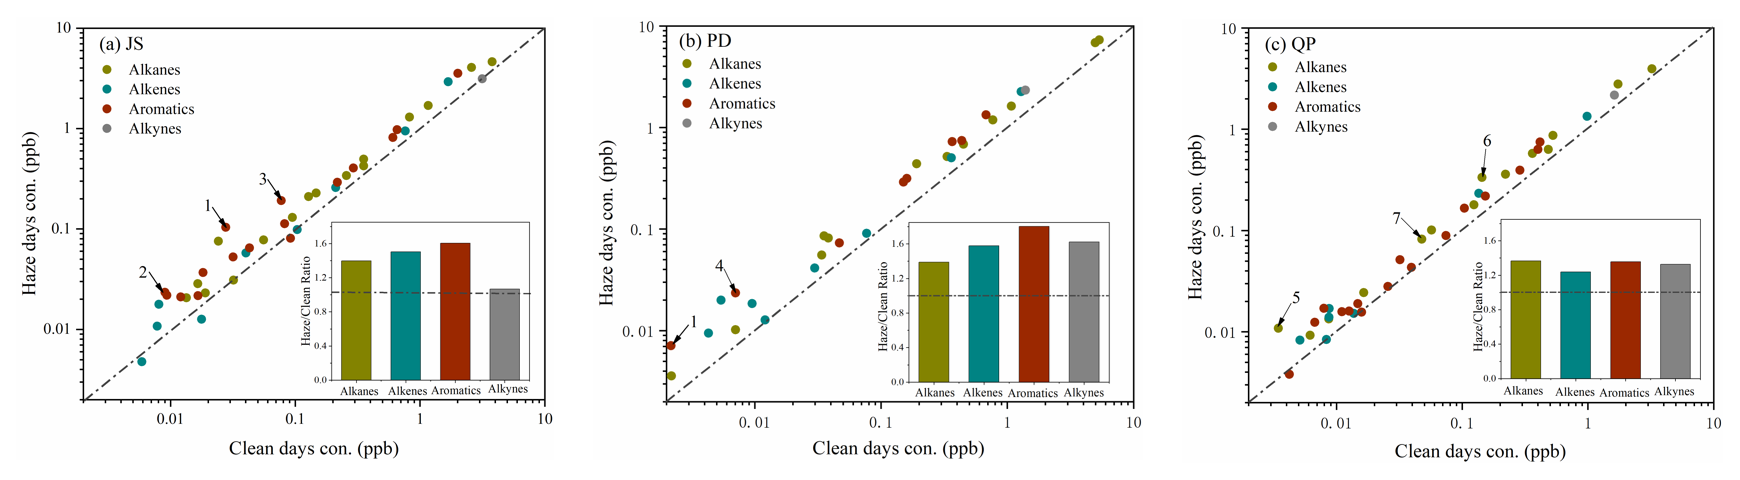
Figure 4Differences in the VOC concentrations between the clean and haze days at the (a) JS, (b) PD and (c) QP sites. (1) 1, 2, 4-trimethylbenzene; (2) p-ethyltoluene; (3) m-ethyltoluene; (4) ethylbenzene; (5) 2, 2, 4-trimethylpentane; (6) n-hexane; (7) h-heptane.
3.2 Source apportionment
3.2.1 Special VOC ratio analysis
Different VOC species have different sources, and the ratios of different species can be used to preliminarily distinguish the emission sources (An et al., 2014). Herein, the characteristics of toluene benzene (T B), iso-pentane n-pentane (P P) and -xylene ethylbenzene (X E) varying at the sampling sites are utilized to identify the VOC sources. The results are shown in Figs. 5 and S2–S4.
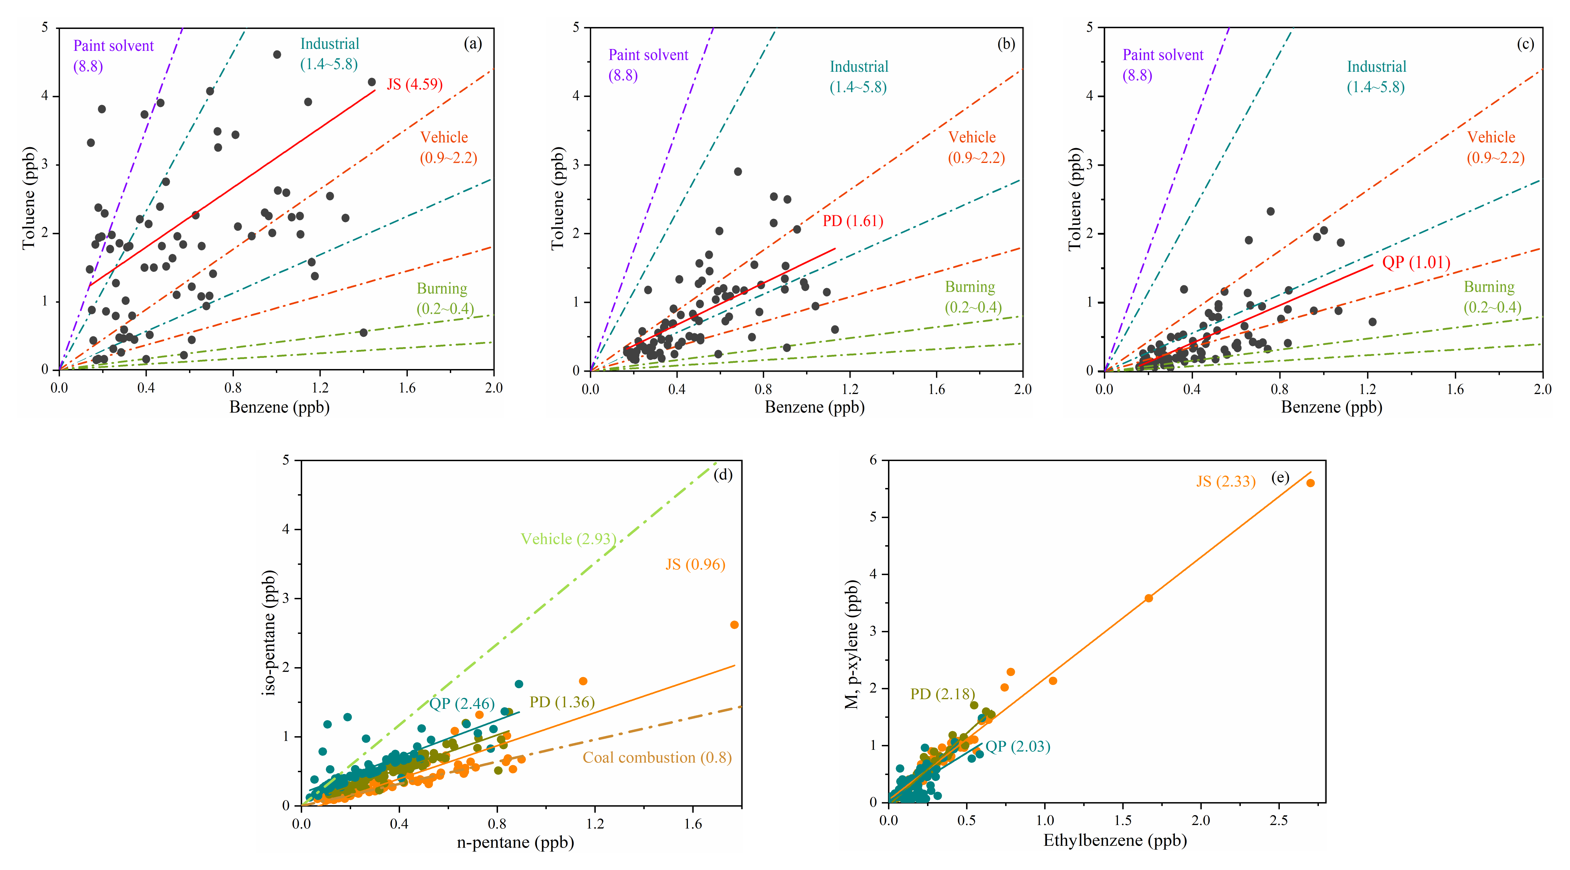
Figure 5Specific ratios of the target VOC species for the source identification. The linear correlations between toluene and benzene at the (a) JS, (b) PD and (c) QP sites and (d) -xylene and ethylbenzene and (e) iso-pentane and n-pentane at JS (orange), PD (yellow) and QP (blue).
It is well documented that the varied VOC sources could be identified by the different T B ratios (Song et al., 2021). The mean T B ratios were 4.59 ± 4.3 and 1.61 ± 0.79, with Pearson correlation coefficients (RPearson) of 0.41 and 0.65, respectively, at the JS and PD sites. Most of the ratios (68.89 % and 84.15 %) distributed ranges of 0.9–2.2 and 1.4–5.8, suggesting that vehicle emissions and industrial emissions exerted a significant impact on VOC concentrations (Fig. 5a–b), which was in good agreement with previous studies (Dai et al., 2013; Zhang et al., 2013; Mo et al., 2015; Shi et al., 2015; Yao et al., 2015; Deng et al., 2018). The average ratio at the QP site was 1.01 ± 0.66 (RPearson=0.70), with 43.02 % of T B ratios distributing ranges of 0.9–2.2 and 0.2–0.4, suggesting that vehicle emissions and burning emissions contributed significantly to VOC pollution (Fig. 5c) (Li et al., 2011; Dai et al., 2013; Zhang et al., 2013; Yao et al., 2015; Mo et al., 2016; Deng et al., 2018). The temporal variations of T B ratios and TVOC concentrations are shown in Fig. S2. The T B ratios were mainly located in the scopes of vehicle emissions and industrial sources at the JS and PD sites when the VOC concentrations were high, respectively, while the specific values at the QP site were only concentrated in the scope of vehicle emissions. Such a scenario showed that vehicle exhaust was a significant contributor to the VOC pollution at the sites we studied, and VOC concentrations were less influenced by the industrial emission at the QP site relative to the JS and PD sites due to the land-use type of the QP site, which is normally taken as a city background site and far from the industrial area.
The fossil-fuel-derived sources (vehicle exhaust, fuel evaporation and coal combustion) could be further distinguished by the P P ratio. Iso-pentane and n-pentane have similar atmospheric lifetimes and therefore varied with a similar trend and were highly correlated (RPearson=0.91, 0.91 and 0.81 at the JS, PD and QP sites, respectively), indicating the similar emission sources of two compounds (Jobson et al., 1998; Yan et al., 2017). Lower P P ratios (0.56–0.80) are often identified for coal combustion (M. Li et al., 2019), and the P P ratios in the range of 2.2–3.8 are characterized by vehicle emissions (Liu et al., 2008; Wang et al., 2013). The average P P ratios between the iso-pentane and n-pentane were 0.96 ± 0.30, 1.36 ± 0.22 and 2.46 ± 1.49 at the JS, PD and QP sites, respectively (Fig. 5d). The result at the QP site was comparable with that measured at a Pearl River tunnel (2.93), suggesting that the vehicle emission was an important VOC source (Liu et al., 2008). The lower ratios at the JS and PD sites indicated that VOC concentrations were affected by coal combustion sources. The temporal variations of the P P ratio and TVOC concentrations are shown in Fig. S3. The P P ratios were distributed within the range of 2.2–3.8 at the sampling sites when the VOC concentrations were high, indicating the great impact of vehicle emissions on VOC pollution, which was in agreement with the report of Song et al. (2021).
Besides the local emissions influencing the VOC pollution characteristics, regional transport has been probed as a potential VOC source. Herein, the ratio of X E was used to evaluate the transport impacts. -xylene and ethylbenzene are found to be similar in emission sources, while the former exhibits ∼ 3 times greater reactivity toward OH radicals than the latter (Nelson and Quigley, 1983; Chang et al., 2006; Vardoulakis et al., 2011). Hence, lower X E ratios normally suggested more significant air mass aging, that is, more influences from external transport. The X E ratios were averaged to be 2.33 ± 0.37 (RPearson=0.98), 2.18 ± 0.42 (RPearson=0.97) and 2.03 ± 1.52 (RPearson=0.74) at the JS, PD and QP sites, respectively (Fig. 5e). The results showed that the X E ratios were slightly lower at the QP site relative to the JS and PD sites, indicating that there were fewer primary emissions from anthropogenic sources at the QP site. The temporal variations of the X E ratio and TVOC concentrations are shown in Fig. S4. When the VOC concentrations were high, the X E ratios were approximately 2.3, 2.5 and 1.8 at the JS, PD and QP sites, respectively. Obviously, the X E ratio was lower at the QP site than those at the JS and PD sites. In particular, the high VOC concentration (27.17 ppb) was observed on 7 February at the QP site, corresponding to the minimum X E ratio (0.27), while the X E ratios were 3.07 and 1.95 at the JS and PD sites, corresponding to the VOC concentrations of 12.45 and 22.45 ppb. Such results illustrated that the impact of external transport during the VOC pollution was greater at the QP site compared with the JS and PD sites.
3.2.2 The PMF analysis
The PMF analysis can quantitatively determine the VOC source contributions (Hui et al., 2019). In this study, 39 VOC species were put into the PMF model, followed by the output of seven resolved factors, including vehicle exhaust, industrial source, LPG usage, paint solvent, fuel production and evaporation, coal combustion and biomass burning. The source profiles of the resolved factors by the PMF model are shown in Fig. 6.
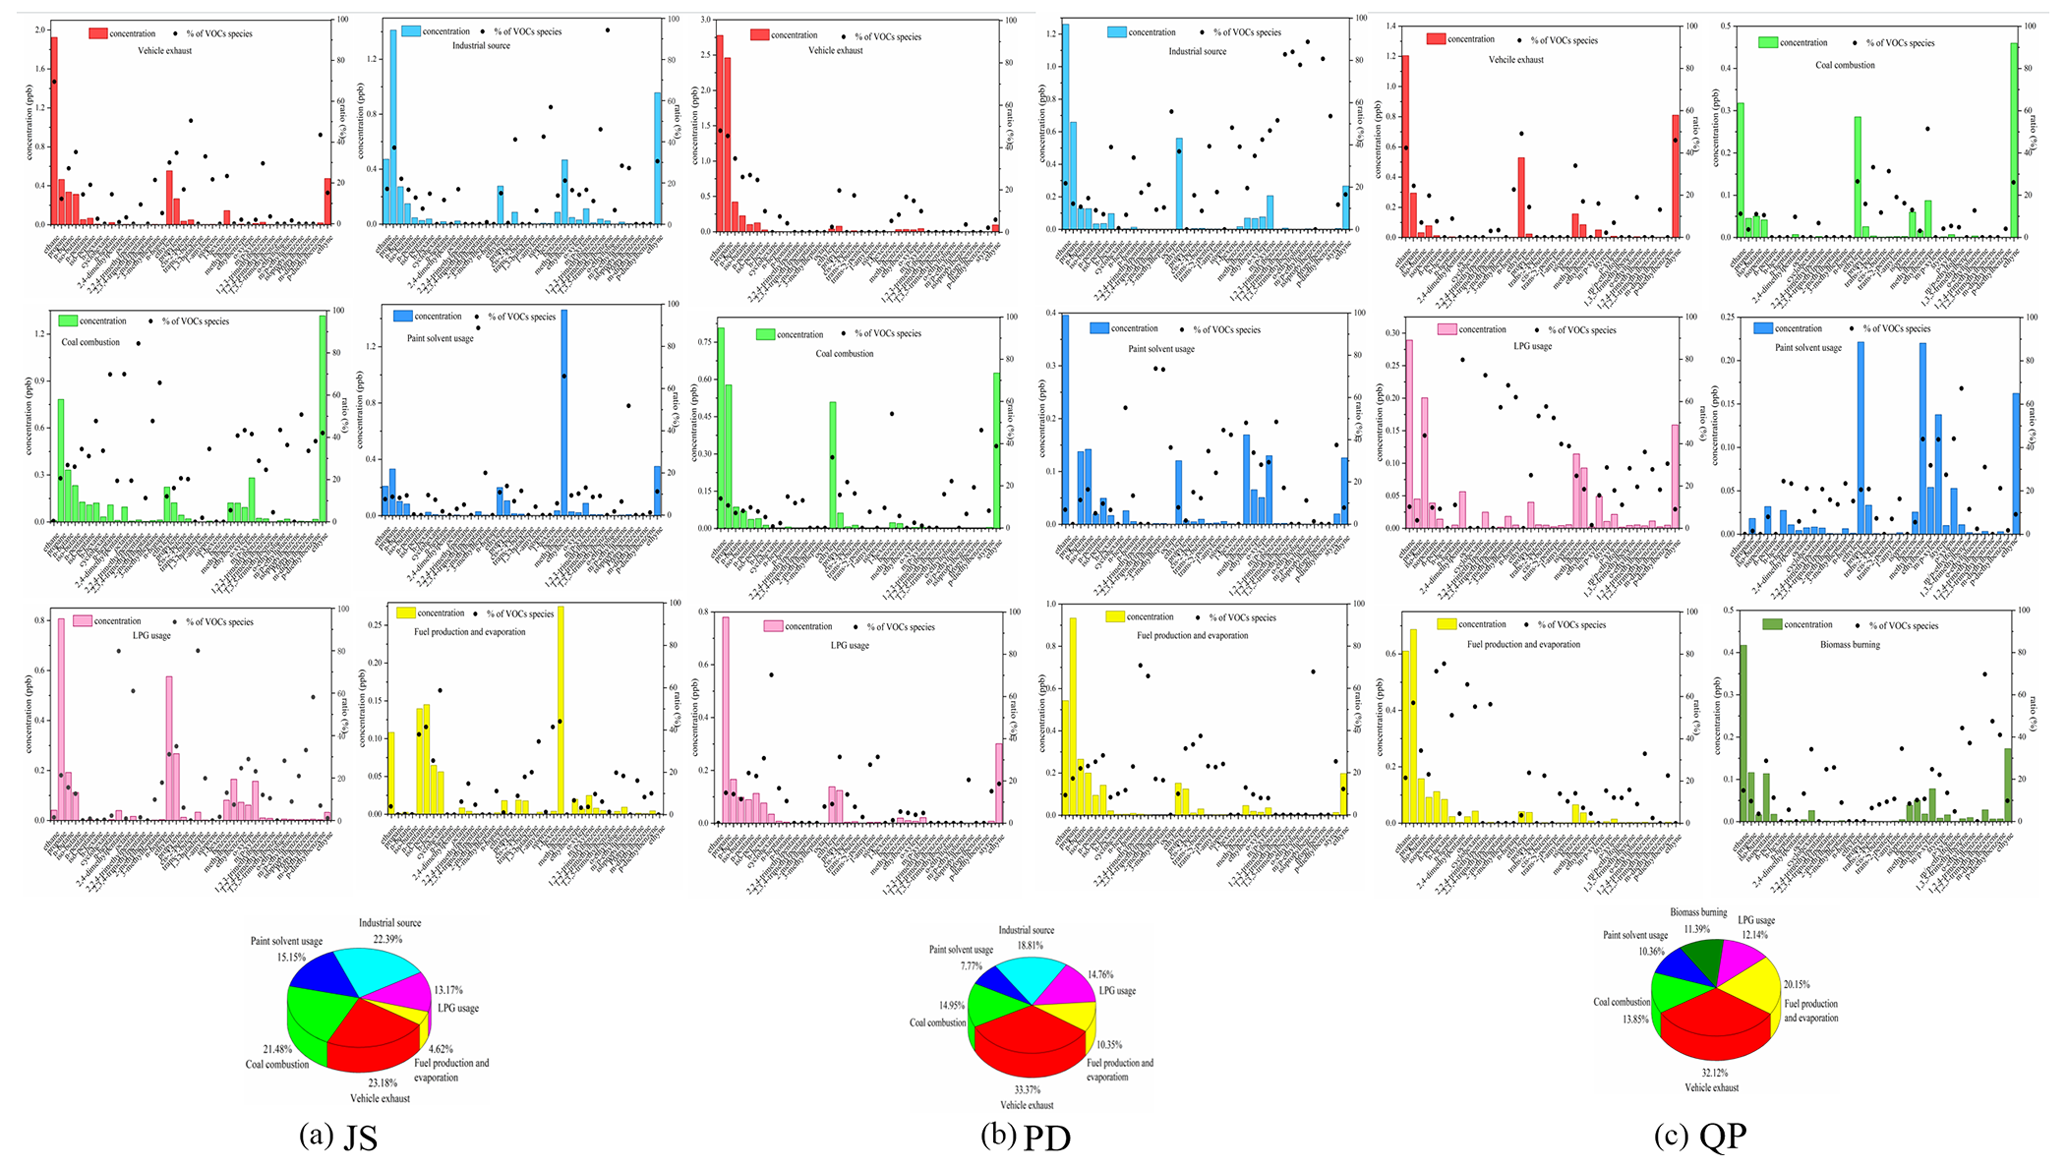
Vehicle exhaust was characterized by high proportions of alkanes, some alkenes and a certain percentage of aromatics (benzene, xylene and trimethylbenzene) (Liu et al., 2008; Cai et al., 2010a; Ling et al., 2011; An et al., 2017; Hui et al., 2018). In this study, the high contributions of the ethane (69.59 % and 48.01 %), iso-butane (35.14 % and 26.12 %) and some alkenes, especially the propylene (34.72 % and 19.74 %) and trans-2-butene (50.49 % and 17.40 %) at the JS and PD sites and the ethane (42.41 %), ethylene (49.14 %) and ethyne (45.94 %) at the QP site, were observed. These compounds are widely regarded as vehicular emission tracers (Cai et al., 2010a; Ling et al., 2011; An et al., 2017; Hui et al., 2018). The contributions of vehicle exhaust were calculated to be 23.18 %, 33.37 % and 32.12 % at the JS, PD and QP sites, respectively. The relevant high results indicate that vehicle exhaust was the predominant source of VOCs, in accordance with the results of the T B and P P ratios mentioned above. Shanghai had more than 4.4 million motor vehicles in 2019. Vehicle exhausts had been proved to be one of the main causes of the local air pollution in Shanghai (Huang et al., 2015; Dai et al., 2017; Liu et al., 2019; Cai et al., 2010b).
Industrial emission was characterized by the high percentage of aromatics (benzene, toluene and trimethylbenzene) and certain percentages of alkanes and alkenes (Guo et al., 2011; Dumanoglu et al., 2014; Sun et al., 2016). At the JS and PD sites, the high contributions of n-nonane (17.84 % and 33.99 %), benzene (13.89 % and 39.16 %), toluene (21.11 % and 19.54 %), trimethylbenzene (94.18 % and 84.05 %), hexane (14.81 % and 38.96 %) and ethylene (14.99 % and 36.91 %) were observed. It was widely acknowledged that asphalt application could release n-nonane (Brown et al., 2007; Liu et al., 2008). Moreover, benzene and toluene are primarily applied for industrial solvent production, and trimethylbenzene is frequently used in manufacturing (Morrow, 1990; Ling et al., 2011). Therefore, the recognized factor can be identified as an industrial source. Industrial events were calculated to contribute 22.39 % and 18.81 % to VOCs at the JS and PD sites, respectively, indicating the considerable contributions of industrialization next to the aforementioned traffic factors. The QP site was far away from the industrial regions and therefore was less influenced by industrial factors compared with the JS and PD sites.
The coal combustion factor was characterized by C2–C3 alkenes such as ethylene and propylene, some alkanes, ethyne, benzene and ethylbenzene (Liu et al., 2008; Ling et al., 2011; Song et al., 2018). Moreover, the proportions of propene, n-hexane, n-heptane and toluene were low, but these compounds could not be neglected yet (Hui et al., 2018). The PMF analysis illustrated that coal combustion was the third-largest source of VOCs at the three sites. Coal combustion was responsible for 14.95 % and 13.85 % of the VOC emission at the PD and QP sites, respectively. However, the contribution reached up to 21.48 % at the JS site, reflecting more frequent fossil usage in the industrial area of Shanghai.
LPG usage was determined by some alkanes (propane, n-butane and iso-butane) and alkenes (ethylene, propylene and butene). There were high proportions of propane (21.24 % and 14.41 %), n-butane (15.53 % and 13.79 %), iso-butane (12.61 % and 11.40 %), ethylene (31.18 % and 10.08 %) and propylene (34.94 % and 31.38 %) observed at the JS and PD sites, coupled with iso-butane (43.88 %), propylene (25.08 %) and cis/trans-2-butene (53.10 % and 57.65 %) at the QP site, highlighting the LPG-related sources (Lyu et al., 2016). Herein, LPG usage accounted for 13.17 %, 14.76 % and 12.14 % of the VOCs monitored at the JS, PD and QP sites, respectively. At the end of 2015, the number of LPG users in household and catering reached 3.3–6.5 million in Shanghai (Hui et al., 2018; Zhang et al., 2018). Overall, LPG usage was one of the important VOC sources at the sampling sites.
Fuel production and evaporation could be identified by C3–C7 alkanes, especially n-pentane and iso-pentane (Zheng et al., 2020), the C3–C5 alkenes such as trans/cis-2-butene (Geng et al., 2009; Hui et al., 2018; Zhang et al., 2018; Zheng et al., 2020) and some aromatics (Liu et al., 2008; Xiong and Du, 2020). There were high contributions of n-pentane (37.94 %, 25.20 % and 71.95 %), iso-pentane (41.45 %, 28.18 % and 23.16 %) and butene (26.73 %, 70.83 % and 22.52 %) at the JS, PD and QP sites, respectively. The contributions of some aromatics such as benzene at the JS site (44.08 %), isopropylbenzene at the PD site (66.71 %) and 1, 2, 4-trimethylbenzene at the QP site (32.90 %) were also high. It was well documented that alkanes like n-pentane and iso-pentane were gasoline tracers, and some alkanes and aromatics could evaporate from the unburned fuels (Guo et al., 2004; Liu et al., 2008; Wang et al., 2013; Xiong and Du, 2020). The VOC contributions from fuel production and evaporation were calculated to be 4.62 %, 10.35 % and 20.15 % at the JS, PD and QP sites, respectively.
Paint solvent usage was normally characterized by C6–C8 alkanes and some aromatics like toluene, ethylbenzene and x-/p-xylene (Wang et al., 2013; An et al., 2017; Hui et al., 2018; Song et al., 2019a). There were high contributions of toluene at the JS site (65.90 %), toluene and ethylbenzene at the PD site (47.95 % and 33.85 %) and x-/p-xylene at the QP site (24.69 %), respectively. Herein, emission factors that meet these characteristics were identified as paint solvent usages, which accounted for 15.15 %, 7.77 % and 10.36 %, respectively, at the JS, PD and QP sites.
Biomass burning was distinguished by the isoprene and some aromatics (Schauer et al., 2001; Liu et al., 2020; Yang et al., 2023). Factors that coincide with the specific characteristic were regarded as biomass burning in this study. Our analysis showed that the contribution of biomass burning to VOC concentrations was 11.39 % at the QP site. However, this emission factor could not be reproduced at the JS and PD sites, implying the limited impacts of biomass burning in the population- and industrialization-concentrated areas that were primarily controlled by the anthropogenic emissions.
3.2.3 Back trajectories and PSCF results
Besides the direct impact of local sources, regional transport could also contribute to VOC pollution (Hui et al., 2018). The 24 h backward trajectories, the PSCF results and the VOC proportion of each trajectory throughout the observation at the JS, PD and QP sites are shown in Fig. 7. There were six clusters (northern trajectories: Cluster 1 + 2; eastern trajectories: Cluster 3; southern trajectories: Cluster 4; southwestern trajectories: Cluster 5; northwestern trajectories: Cluster 6) at the JS site, as shown in Fig. 7a. The contributions of northern trajectories to the total trajectories (Fig. 7a, left) and those of the northern pollution trajectories to the total pollution trajectories (Fig. 7a, right) were significantly higher than those of the other four cluster trajectories, comprising 45.74 % and 46.46 %, respectively (Table 1). Identified as the northerly direction cluster, the northern long-distance trajectory (Cluster 1) and short-distance trajectory (Cluster 2) accounted for 16.67 % and 29.07 % of the VOC transportation. The results indicated that the VOC concentrations at the JS site were mainly impacted by the trajectories from the junction of the Bohai Sea, Shandong Province, the East China Sea and Jiangsu Province in addition to the local emission. The contributions of VOCs by each air mass trajectory indicated that alkanes tended to dominate the transported VOC community at the JS site due to its weak reactivity in the long-range transport.

Figure 7Backward-trajectory cluster analysis (24 h) and PSCF analysis at the JS, PD and QP sites.
Table 1Air mass cluster trajectories at the JS, PD and QP sites.
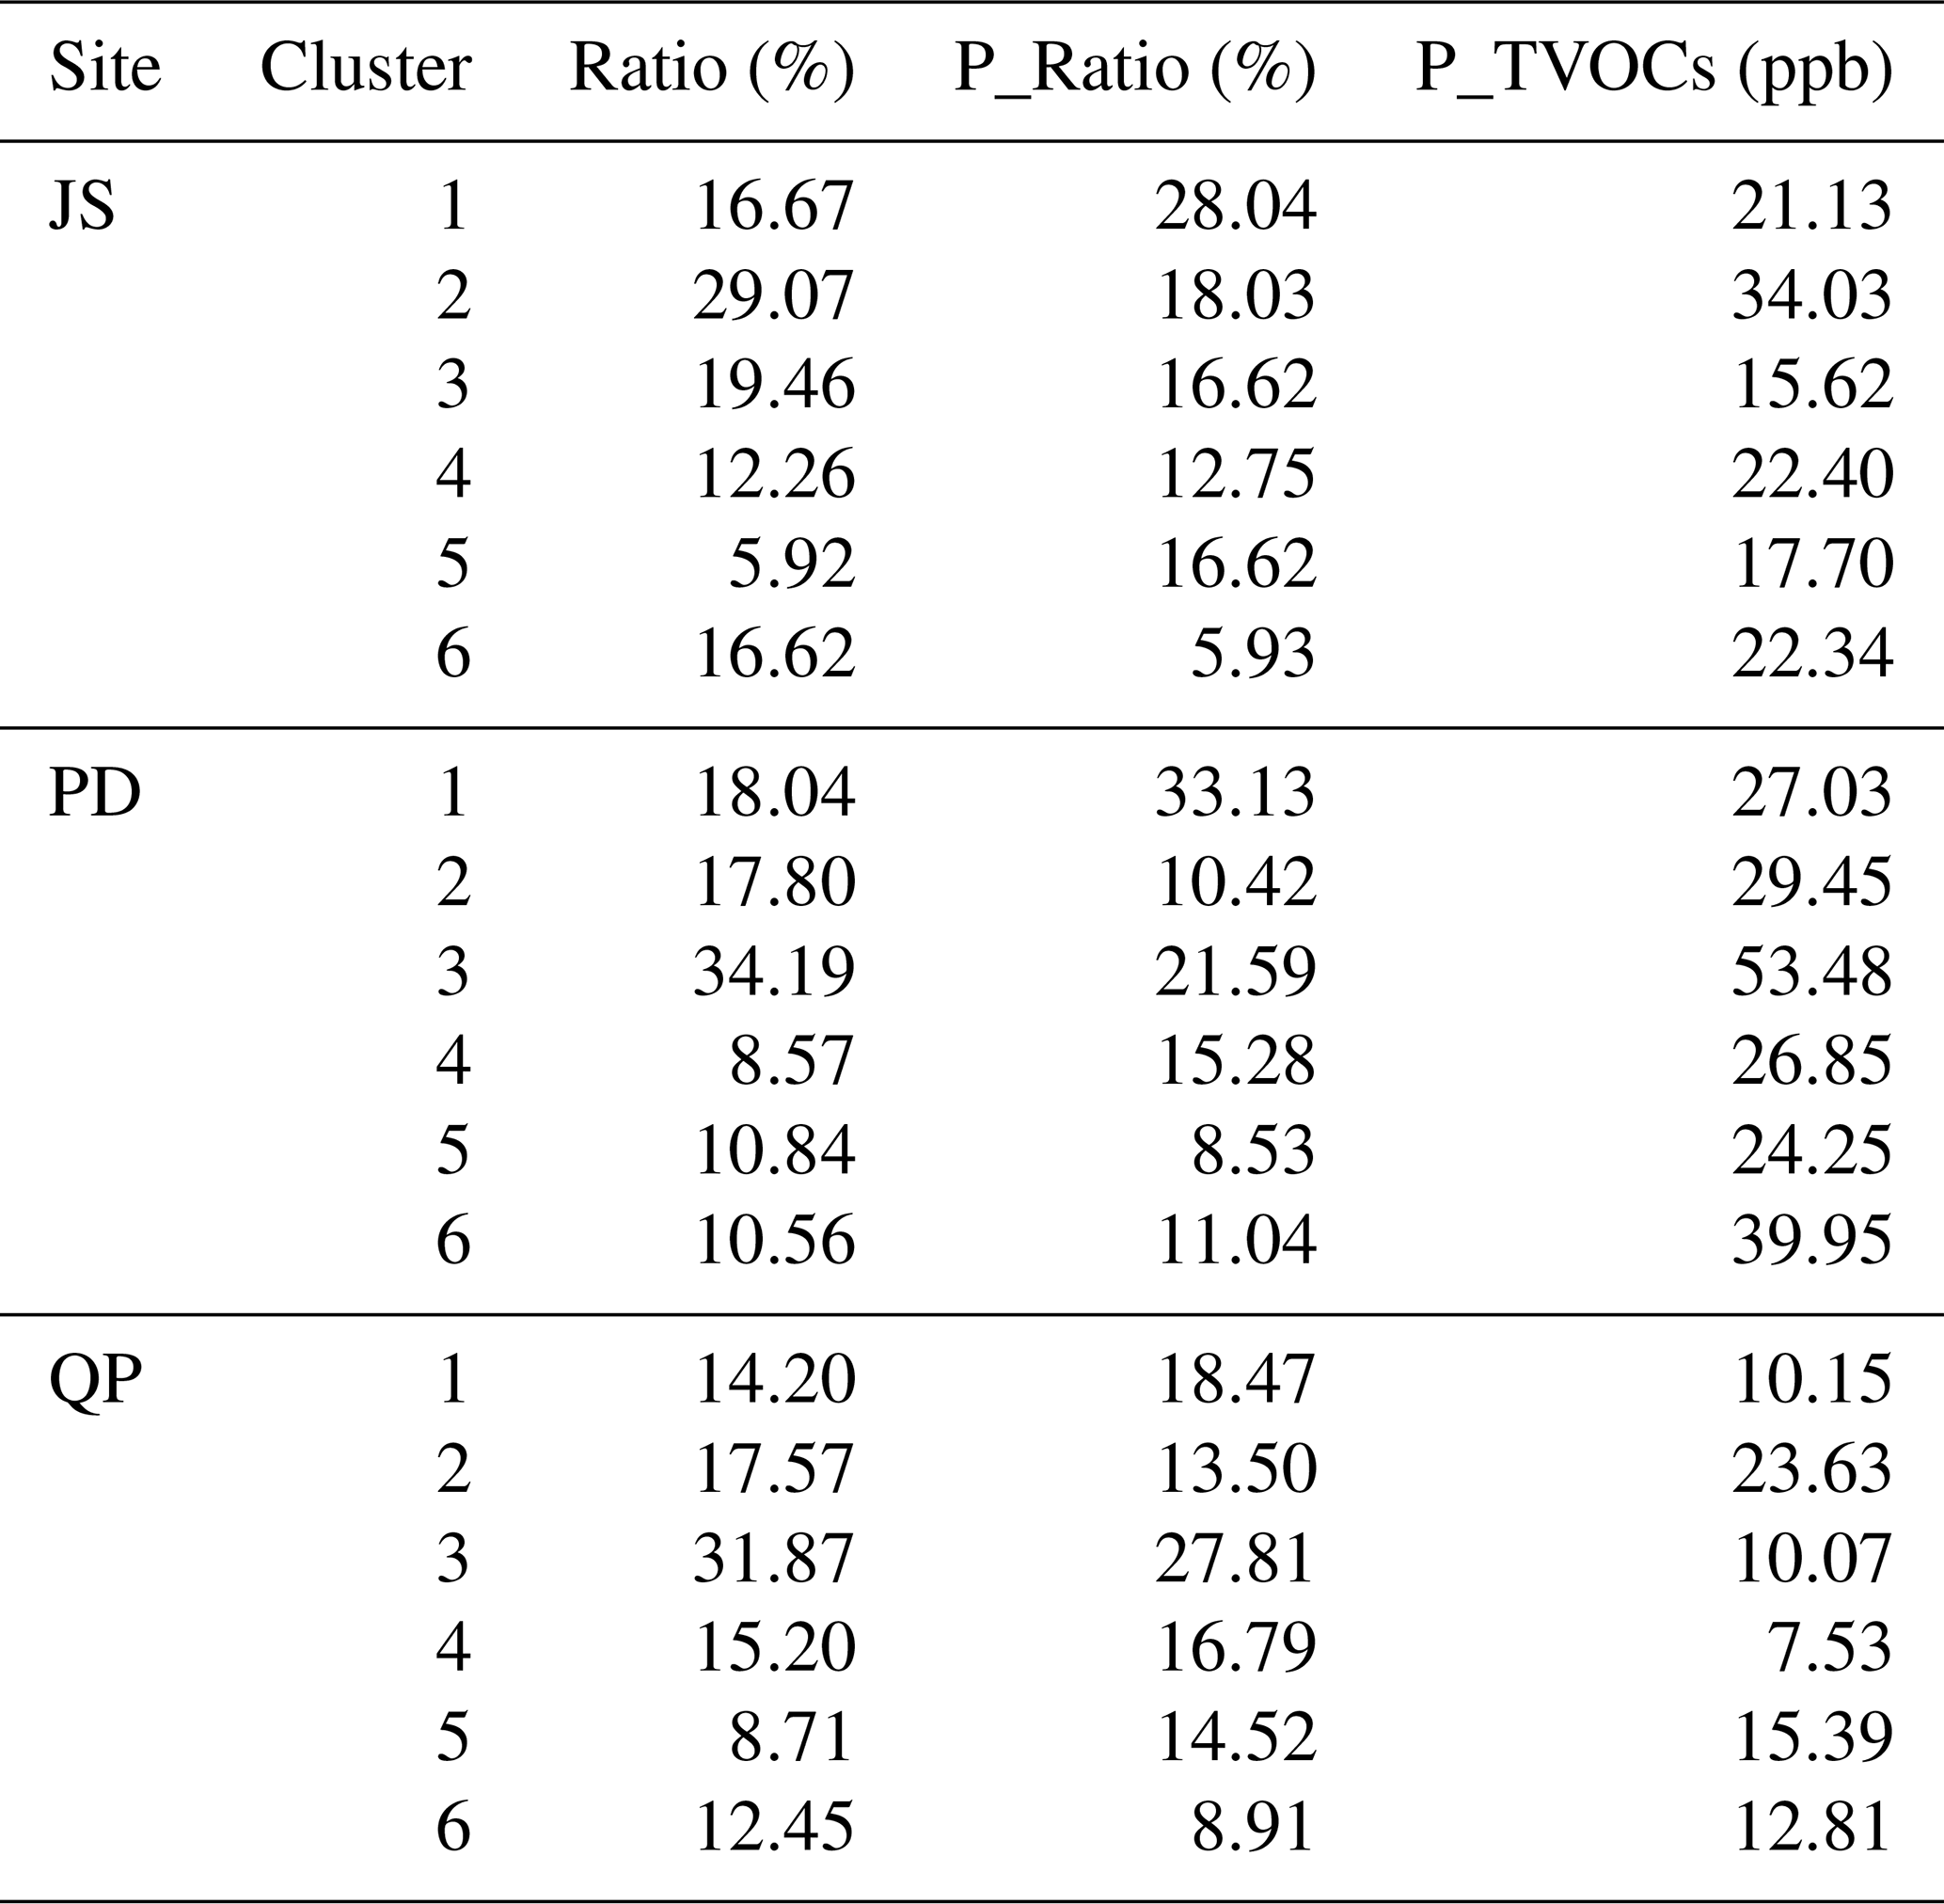
The air mass trajectories could be clustered into northern trajectories (Clusters 1 and 2), northeastern trajectories (Cluster 3), southeastern trajectories (Cluster 4), southwestern trajectories (Cluster 5) and northwestern trajectories (Cluster 6) at the PD site, as shown in Fig. 7b. It is evident that the contributions of northern (Cluster 1) and northeastern (Cluster 3) trajectories to the total trajectories (Fig. 7b left) and that of the northern and northeastern pollution trajectories to the total pollution trajectories (Fig. 7b right) were greatly higher than the other four cluster trajectories, accounting for 52.23 % and 54.72 % of VOC concentrations, respectively. The results suggested that VOCs at the PD site were significantly influenced by the pollution transportation from the East China Sea, Zhejiang Province and Jiangsu Province coupled with the local sources. The proportions of VOCs by each air mass trajectory indicated that alkanes and alkenes both contributed to the transported VOC community at the PD site.
At the QP site (Fig. 7c), the trajectories were clustered into the northern trajectories (Clusters 1 and 2), northeastern trajectories (Cluster 3), southeastern trajectories (Cluster 4), southwestern trajectories (Cluster 5) and northwestern trajectories (Cluster 6). The proportions of northeastern trajectories to the total trajectories (Fig. 7c left) and those of northeastern pollution trajectories to the total pollution trajectories (Fig. 7c right) were higher than those of the other trajectories, accounting for 31.87 % and 27.81 % of the VOC concentrations, respectively. This result indicated that the concentrations of VOCs were mainly impacted by the northeastern trajectory from the junction of the East China Sea, Zhejiang Province and Jiangsu Province in addition to local sources. Although the contribution of Cluster 2 was relatively small, the VOC concentration was the highest, reaching 23.63 ± 10.75 ppb (Table 1). Therefore, attention should be paid to the long-distance transmission of high pollution from Beijing, Tianjin and Liaoning provinces. The alkanes contributed most of the VOCs in air mass trajectories at the QP site, which was in line with the results of the JS site.
The region with high PSCF levels indicates highly potential regional transport sources (Hui et al., 2018). Based on the PSCF results, at the JS and QP sites, high values were observed in the north of Shanghai. At the PD site, high values were observed in the northeast of Shanghai. All three sampling sites showed that the highest PSCF levels appeared in areas near the JS, PD and QP sites, suggesting that the local source was a significant contributor to the VOC pollution compared with regional transport.
3.3 Ozone and SOA formation potentials
3.3.1 Ozone formation potential
The atmospheric VOCs were considered to be an important precursor of O3 due to their photochemical reactivity (Alghamdi et al., 2014; Kumar et al., 2018). Figure 8 displays the OFP contribution proportions of the primary VOC categories and species varying with sampling sites. Hereby, the OFPs were calculated to be 50.89 ± 2.63, 33.94 ± 1.52 and 24.26 ± 1.43 ppb for the VOCs measured at the JS, PD and QP sites, respectively. The photo-induced transformation of VOCs could account for 69.15 %, 59.05 % and 24.43 % of the O3 concentrations at the above sampling sites (OFP values/O3 concentrations). The VOC-related O3 contributions were lower than those in Delhi, India (Kumar et al., 2018), and Chinese cities like Shanghai (Zhang et al., 2018), Wuhan (Hui et al., 2018), Taiwan (Vo et al., 2018), Nanjing (Mozaffar et al., 2020) and Xi'an (Song et al., 2021). The relatively low OFP values were related to the low VOC concentrations in this study (Table S3). The predominant OFP contributor was alkenes, especially ethylene and propylene, which exhibited considerable photochemical reactivity, accounting for 50.21 %, 49.39 % and 60.00 % of the OFPs at the JS, PD and QP sites, respectively (B. Li et al., 2019). Such levels were generally comparable with the result obtained in Shanghai, China, by Zhang et al. (2018), comprising 57 %. Moreover, the high photochemical reactivity of aromatics (B. Li et al., 2019), especially toluene, o-xylene and m-/p-xylene, makes them become the second-largest contributor of OFP, in accordance with the finding of Hui et al. (2018). The fraction of aromatics therein accounted for 33.59 %, 23.21 % and 20.02 % of the OFPs at the JS, PD and QP sites, respectively. In comparison, the contributions of alkanes and alkynes were much lower, accounting for 13.11 % and 3.09 % at the JS site, 22.90 % and 4.50 % at the PD site and 13.07 % and 6.91 % at the QP site, respectively. These results indicated that the VOC photochemical reactivity was closely related to the contribution of O3 formation, which was in agreement with other studies (An et al., 2014; Guo et al., 2017; Hui et al., 2018). Hence, alkenes and aromatics played crucial roles in the formation of O3. According to the source identification results discussed above, the relevant emission sources, which are thought to be the industrial production and vehicle exhaust at the sampling sites, should be controlled as a priority.
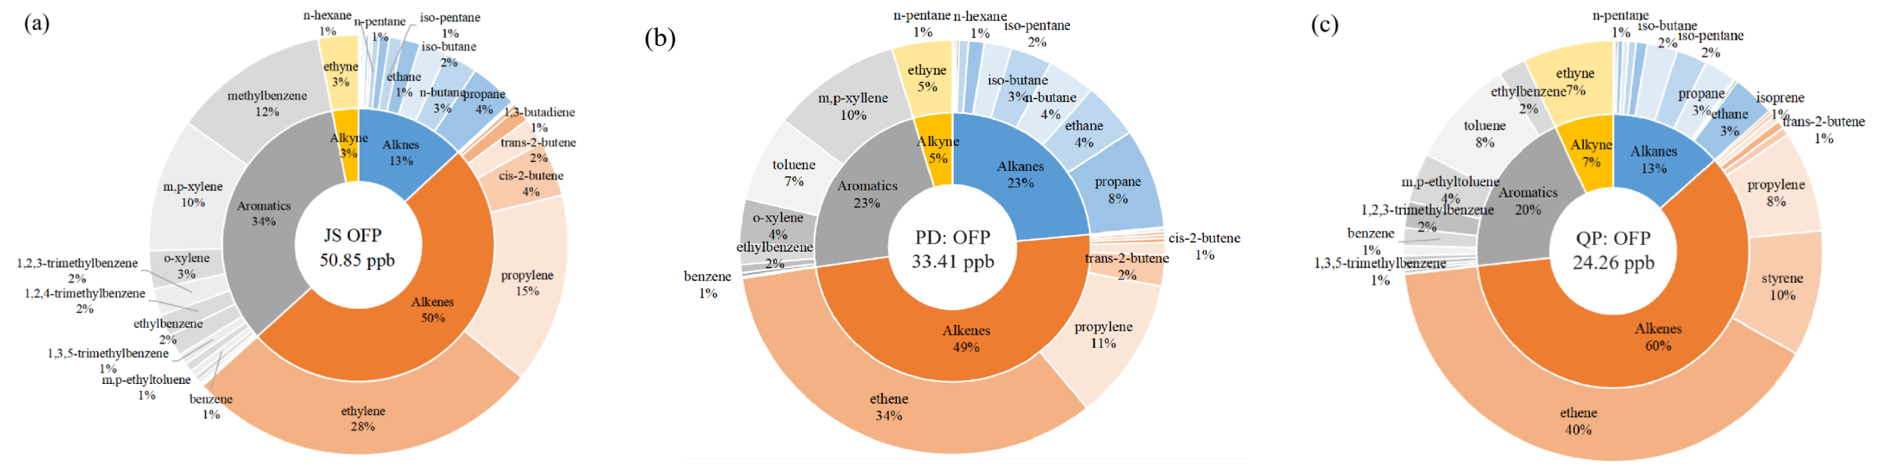
Figure 8Contributions of VOCs to OFP at the (a) JS, (b) PD and (c) QP sites (the contributions > 1 % were marked).
3.3.2 SOA formation potential
The close linkages between VOCs and new particle formation induced the quantitative discussion on SOAFP (Chen et al., 2007; Guo et al., 2017; Tan et al., 2018), and the Grosjean methodology has been widely recommended as the standard reference (Fig. 9). Following the reported methods, the SOAFP was calculated only for daytime (08:00–17:00 LT) to avoid the emission from human activities during nighttime (Grosjean and Seinfeld, 1989; F. Zhang et al., 2020). During the observation campaign, the SOAFP was averaged to be 1.00 ± 2.03, 0.46 ± 0.88 and 0.41 ± 0.58 µg m−3 for the VOCs measured at the JS, PD and QP sites, respectively. Such levels were comparable with those obtained in Jinan, China (Zhang et al., 2017), and Taiwan (Vo et al., 2018), but higher than that of Nanjing, China (Mozaffar et al., 2020) (Table S3). The SOAFP values accounted for 2.19 %, 0.95 % and 1.02 % of the PM2.5 concentrations at the above sampling sites (SOAFP values/PM2.5 concentrations), all of which were lower than the results in Nanjing, China (3.46 %) (Mozaffar et al., 2020), and Wangdu, China (8.4 and 17.84 % under high-NOx and low-NOx conditions, respectively) (Zhang et al., 2020b). The aromatics were determined to be the main SOA contributor, accounting for 86.07 %, 96.21 % and 86.38 % at the JS, PD and QP sites, respectively, in accordance with the findings in Jinan, China (Zhang et al., 2017). The top-five abundant VOC species were toluene, x-/p-xylene, ethylbenzene, benzene and o-xylene at the above sites. Toluene was determined to be the most abundant VOC species for SOA formation, with SOAFP values of 9.31, 3.38 and 2.06 µg m−3 at the JS, PD and QP sites, respectively, in agreement with the results of Mozaffar et al. (2020). Obviously, the value at the JS site was significantly higher than those at the PD and QP sites, due to a large number of chemical factories surrounding the JS site, resulting in the high concentration of VOCs, especially the aromatics (Hui et al., 2018). Therefore, to achieve the better SOA reduction effects, the concentration of aromatics should be controlled as a priority in Shanghai, and more efficient strategies should be developed to limit the emissions of industrial emissions.

In this section, the effects of land-use type on VOC concentrations, sources and ozone and SOA formation potentials are discussed. Previous studies pointed out that the VOC characteristics (e.g., concentrations and diurnal/weekly variations) and sources varied with the land-use types (Yoo et al., 2015; Jookjantra et al., 2022). Further, the discrepancies of VOC characteristics among the land-use types could affect the ozone and SOA formations (Cai et al., 2010a, b; Jookjantra et al., 2022). Herein, the JS site is located in the Second Jinshan Industrial Area of Shanghai as the industrial district and surrounded by many chemical factories. The PD site is located in the Pudong New Area as the residential and commercial mixed districts and surrounded by residences and administrative areas. The QP site is located near the southeast of Lake Dianshan as the background district and surrounded by many farmlands and forests (Table S1). Since the distinct land-use types among the sampling sites were observed, it is highly desirable to discuss the effects of the land-use type on concentrations, sources and O3 and SOA formation potentials of VOCs in Shanghai.
4.1 The effect of land-use type on VOC concentration
The mean VOC concentrations at the JS (21.88 ± 12.58 ppb) and PD (21.36 ± 8.58 ppb) sites were 1.83 and 1.79 times higher than that at the QP site (11.93 ± 6.33 ppb), implying the impact of the land-use type. In more detail, the JS and PD sites are located in the industrial and urban regions with numerous anthropogenic activities. The enhanced emission strengths at the JS and PD sites could induce severe atmospheric pollution, e.g., haze and O3 pollution (Cai et al., 2010a, b; Zhang et al., 2018). Further, the meteorological conditions, including ambient temperature and sunlight irradiance, changed, and the dispersive dilution and convection phenomenon decreased, which contributed to high VOC concentrations (Kumar et al., 2018). By contrast, the emission strength dropped at the QP site as a consequence of the land-use type of this site (background district). In addition, the land-use types could not only affect the VOC concentrations, but also the compositions. Specifically, the JS site exhibited higher fractions of aromatics and alkenes, particularly toluene and propylene, than those at the PD and QP sites. This result necessarily correlated with the fact that the JS site is close to the industrial area, with heavy industrial emissions (the dominating source of toluene and propylene), as reflected by the increased toluene and propylene proportions (Zhang et al., 2018; Hui et al., 2019; B. Li et al., 2019). However, the contribution of ethane at the JS site was ∼ 50 % lower than those at the PD and QP sites. It is well known that ethane is typically a tracer of incomplete combustion, especially vehicle emission (Guo et al., 2011). It was thus supposed that the vehicle emission exerted a relatively weak influence on VOC emission at the JS site (23.18 %) as compared with the PD (33.37 %) and QP sites (32.12 %). The fraction of alkanes, especially the propane, was remarkable in the land-use type with residential and commercial activities (the PD site). This site is the junction of roads, metros and commercial and financial areas that had a significant impact on the enrichment in vehicle sources and hence could have participated in the high contribution of alkanes (Cai et al., 2010a; Ling et al., 2011; An et al., 2017; Hui et al., 2018). The fraction of alkyne at the PD site was 1.88 and 1.75 times lower than those at the JS and QP sites, which might be caused by the weak combustion sources, including chemical and biofuel burning (Zhu et al., 2016; B. Li et al., 2019). Note that the distinct spatial heterogeneity of VOCs was also observed, with the highest value of the coefficient of divergence (COD = 0.36) between the JS and QP sites, followed by the PD and QP sites (COD = 0.33), with that between the JS and PD sites (COD = 0.20) being the lowest. A greater COD value means less redundancy of the data between the two sites (Ma et al., 2019). Hence, the spatial heterogeneity of VOCs between the JS and PD sites was narrow, while the QP site was largely different from the other two sites. This result was ascribed to the fact that there were similar pollutant concentrations, meteorological factors, emission intensities and atmospheric conditions at the JS and PD sites, while these indexes at the QP site were rather different from those of the other sites.
The VOC diurnal variations were analyzed with respect to each of the land-use types. The result showed that the VOC concentrations in the early morning (05:00 LT) at the JS site were 17.06 % and 52.91 % higher than those at the other two sites, which was attributed mostly to the land-use types. There were a large number of rubber factories, paint solvent factories and oil factories surrounding the JS site, whereby some factories usually worked continuously for 24 h, thus inducing the increased VOC concentrations. Compared with the other studies (Velasco et al., 2007; Zhang et al., 2018; Wang et al., 2021), no evident bimodal features can be observed at the sampling sites. The industrial processes and biogenically related emissions surrounding the sampling sites also had a great impact on the VOC variations, except for the traffic exhaust, which was the potential reason for such a scenario (Yoo et al., 2015). In addition to the diurnal variations, the weekend effects of VOCs also appeared to be variable among the different land-use types. Specifically, at the JS site, there were narrow discrepancies in VOC concentrations between the weekdays and weekends, except for the rush hour in the morning, which was related to the influence of the full-day operation of industrial processes. At the PD site, the highest value during the morning peak on the weekends (26.03 ppb) was lower than that on the weekdays (35.11 ppb) and decreased by ∼ 25.86 %, suggesting that there were obvious anthropogenic sources, especially the vehicle exhaust. At the QP site, the elevated VOC concentrations (∼ 18.69 % uplift) were presented during the 18:00–20:00 LT on the weekends relative to the weekdays. The phenomenon might be associated with the joint effect of VOC-intensive emissions by anthropogenic activities at the QP site on the weekends in that this site is located around Lake Dianshan, which is a tourist attraction.
4.2 The effect of land-use type on VOC sources
VOC sources in this study were sensitive to the local emission with the different land-use types. Specifically, the vehicle exhaust was responsible for nearly one-third of the VOC emission and was a primary source of VOCs. It is interesting to note that the vehicle contribution was expected to be lower at the JS site than those at the PD and QP sites. This finding reflected the fact that the JS site is located in the industrial regions, favoring the contribution accumulations of industrial production and coal combustion (Yoo et al., 2015). As reported, vehicle emission was a dominating VOC source in other cities, and the contributions were higher than 20 %, except in Calgary, Canada (17.2 %) (Fig. 10). Therefore, effective and continuous control strategies on vehicle exhaust are still a priority to alleviate the VOC pollution. Apart from vehicle exhaust, the industrial emission was also an important VOC source at the JS and PD sites, the contributions of which herein were higher than those in other studies, except for Xi'an, China (29.7 %), and Paris, France (35 %). This is supported by the locations of the JS and PD sites; i.e., the JS site is located in the Second Jinshan Industrial Area of Shanghai as an industrial site, and Waigaoqiao Ship building LTD and BaoSteel Group Corporation are located within 30 km of the PD site, illustrating the great influence of industrial processes on VOC pollution at both sites. However, the limited influence of industrial sources at the QP site was observed, because the QP site is surrounded by the natural environment and is far away from the industrial regions. The discrepancies of the combustion contribution could also be illustrated by the land-use types. In this case, the contribution of combustion was more pronounced at the JS site than at the PD and QP sites. As mentioned above, the JS site is surrounded by the industrial cluster and hence induced a high emission of industrial combustion (Zhang et al., 2018). Moreover, the contribution of combustion varied greatly among different studies, from 4 % (Song et al., 2019b) to 46 % (Bari and Kindzierski, 2018) (Fig. 10), which was partially ascribed to the different definition of combustion. For instance, Song et al. (2019b) only regarded the wood combustion as the combustion source in the study of Seoul, South Korea, while the sum of fuel combustion and oil/natural gas extraction/combustion was summarized as a combustion source in the study on Calgary, Canada (Bari and Kindzierski, 2018).
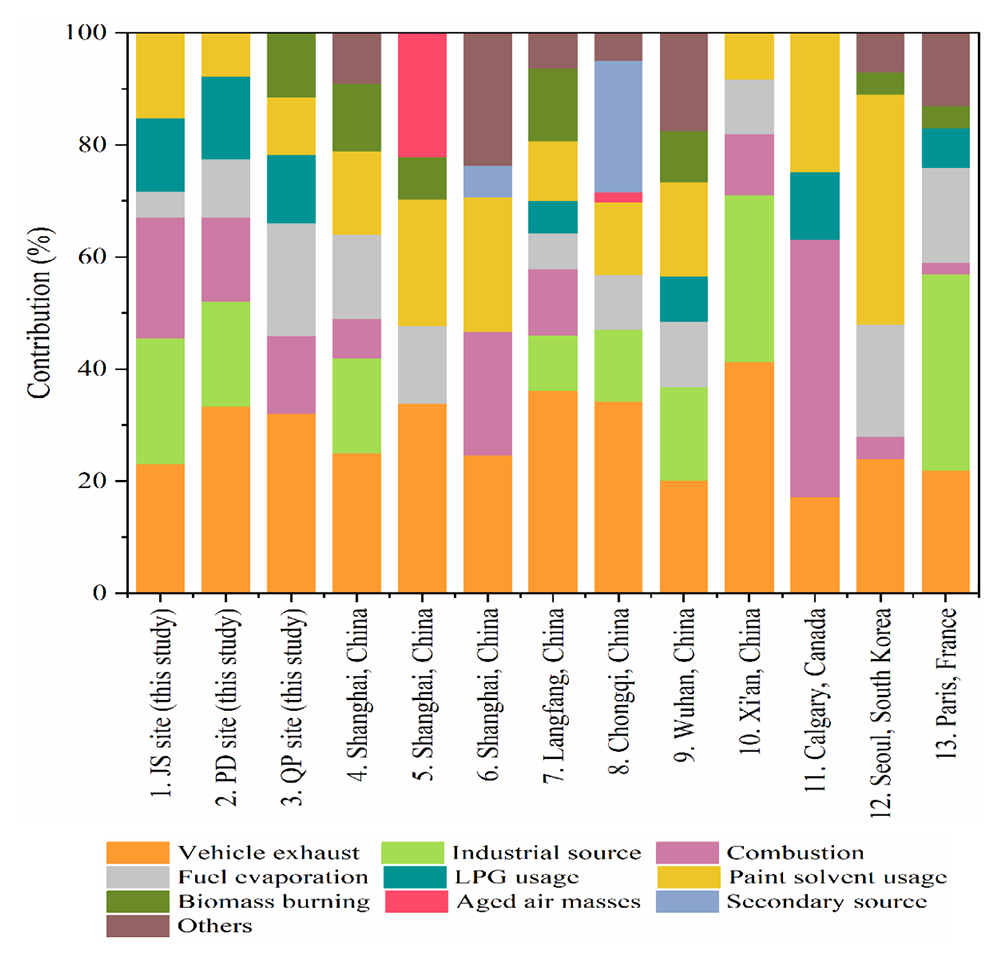
Figure 10Primary emissions of the observed atmospheric VOCs of this study and those measured at different locations or during different periods: (1, 2, 3) Shanghai, China (this study); (4) Shanghai, China (Cai et al., 2010a); (5) Shanghai, China (Liu et al., 2019); (6) Shanghai, China (Liu et al., 2021); (7) Langfang, China (Song et al., 2019a); (8) Chongqing, China (Li et al., 2018); (9) Wuhan, China (Hui et al., 2018); (10) Xi'an, China (Song et al., 2021); (11) Calgary, Canada (Bari and Kindzierski, 2018); (12) Seoul, South Korea (Song et al., 2019b); (13) Paris, France (Gaimoz et al., 2011).
The contribution of fuel production and evaporation showed obvious discrepancies among the different site locations. In detail, the contribution at the JS site (4.62 %) was lower than those in previous studies (6.28 %–20 %), while it was relatively average at the PD site (10.35 %) (Li et al., 2018; Hui et al., 2018; Liu et al., 2019; Song et al., 2019a, b, 2021). At the QP site, the result (20.15 %) was comparable with those from the other studies (11.65 %–20 %) (Hui et al., 2018; Liu et al., 2019; Song et al., 2019b; Gaimoz et al., 2011) (Fig. 10). The proportions of LPG usage were approximately twice as high at the sampling sites as those reported by the other studies (Hui et al., 2018; Song et al., 2019a). The fractions of paint solvent usage here were in the range of estimates by other cities (8.2 %–41 %) (Gaimoz et al., 2011; Bari and Kindzierski, 2018; Li et al., 2018; Liu et al., 2019; Hui et al., 2018; Song et al., 2019a, b; Liu et al., 2021; Song et al., 2021). The contribution of biomass burning at the QP site was relatively average compared with the estimates from other studies (Cai et al., 2010b; Gaimoz et al., 2011; Hui et al., 2018; Song et al., 2019a, b) (Fig. 10). It is worth noting that VOC concentrations at the JS and PD sites were less influenced by the biomass burning relative to the QP site. Since the VOC concentrations were related to the emission strength and the mixing ratio of high intensity was determined by anthropogenic operation, it could be concluded that the human influences at the JS and PD sites were higher than that at the QP site, which was consistent with the regional characteristics of anthropogenic activities controlled by land-use types. Overall, the results of source contribution estimates varied with different studies (Lyu et al., 2016; Z. Y. Li et al., 2020). The VOC sources also showed differences at a regional scale within the city (Tang et al., 2008; B. Li et al., 2019; Cai et al., 2010b; Song et al., 2021). These findings were particularly linked to the land-use types, resulting in varying VOC species, sources and emission strengths (B. Li et al., 2019; Cai et al., 2010b; Z. Y. Li et al., 2020; Song et al., 2021). Thus, the source apportionment for the different land-use types at a regional scale among various studies is necessary to identify the high-quality localized source.
4.3 The effect of land-use type on ozone and SOA formation potentials
The OFP values were closely related to the land-use types. The higher OFPs at the JS and PD sites (50.85 ± 2.63 and 33.94 ± 1.52 ppb) relative to that at the QP site (24.26 ± 1.43 ppb) were observed. However, the concentrations of O3 at the JS and PD sites (73.59 ± 23.59 and 57.48 ± 20.49 µg m−3) were lower than that at the QP site (99.30 ± 24.00 µg m−3), indicating the poor O3 formation conditions. Specifically, the locations of the JS and PD sites resulted in the high emission strength, which could release to high pollutant concentrations and lead to severe atmospheric pollution (Cai et al., 2010a, b; Zhang et al., 2018). This phenomenon could change the strength of solar radiation and further decrease the intensity of O3 photochemical reactions (Kumar et al., 2018). By contrast, the favorable meteorological conditions, especially the intensive solar radiation at the QP site surrounded by vegetation, were observed, which contributed to the high O3 concentration (Yoo et al., 2015). Such results were in good agreement with the findings in Zhengzhou, China (B. Li et al., 2019).
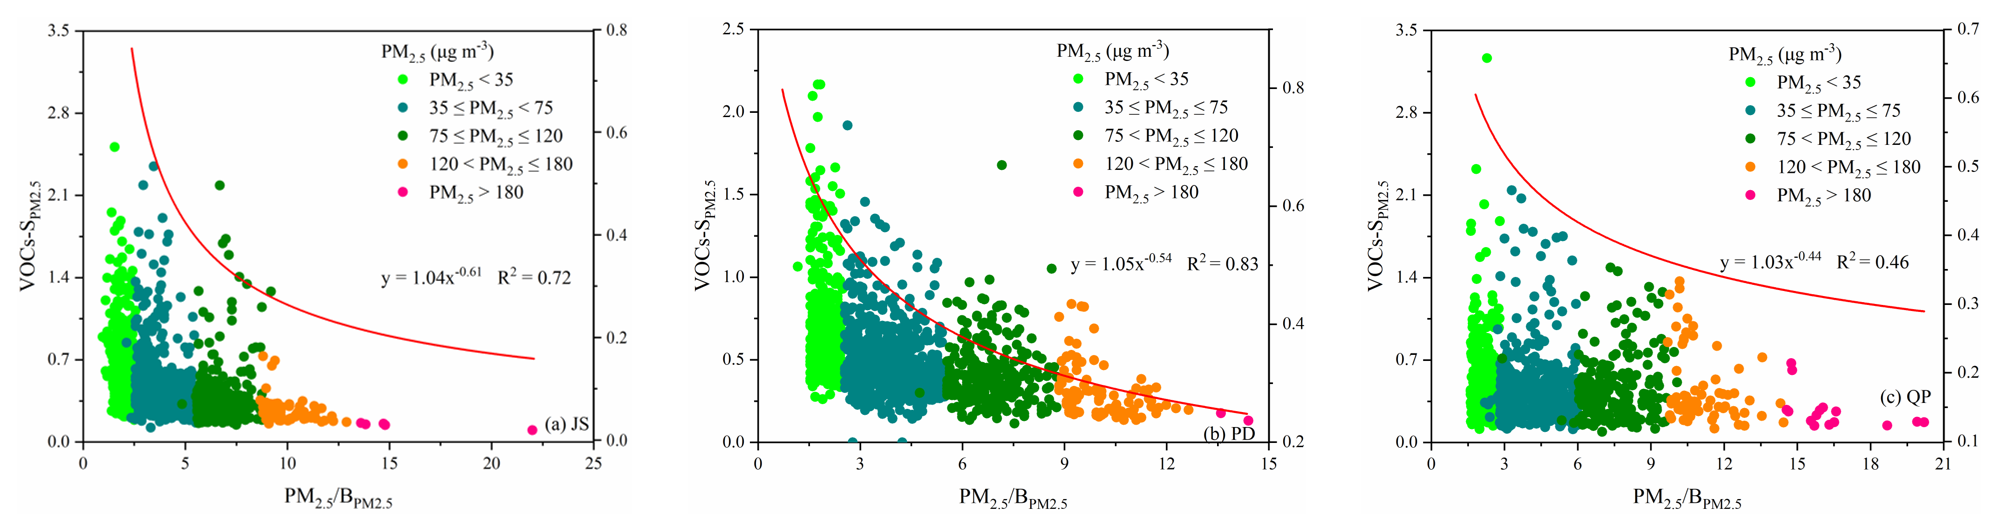
Figure 11The variations of VOC–S at the different levels of PM2.5 at the JS, PD and QP sites.
The discrepancies of SOAFP values among the sampling sites were observed since they could be significantly influenced by the land-use types. At the JS site, the SOAFP values (1.00 ± 2.03 µg m−3) were 2.17 and 2.44 times higher than those at the PD (0.46 ± 0.88 µg m−3) and QP (0.41 ± 0.58 µg m−3) sites, which was consistent with variations in VOC concentrations, especially aromatics, and connected with the land-use types (Zhang et al., 2017; Jookjantra et al., 2022). The JS site is surrounded by heavy industrial activities in a paint and printing factory, a manufacturing factory and a rubber factory, resulting in the concentrated emission sources of industrial production (Zheng et al., 2010; An et al., 2014; Debevec et al., 2021). Because the close associations between VOCs and SOA could induce the sensitive response of VOC concentrations to the different pollution degree of PM2.5, the VOC–PM2.5 sensitivity (VOC–S) was applied to understand the plausible influence on the atmospheric PM2.5 abundance. Atmospheric pollution here can be divided into five levels by the mass concentration of PM2.5: clean level (PM2.5 < 35 µg m−3), slight pollution level (35 < PM2.5 < 75 µg m−3), medium pollution level (75 < PM2.5 < 120 µg m−3), heavy pollution level (120 < PM2.5 < 180 µg m−3) and extreme pollution level (PM2.5 > 180 µg m−3) (Han et al., 2017). The variations of VOC–S as a function of PM2.5 concentration at the JS, PD and QP sites are shown in Fig. 11. The low values of VOC–S basically remain constant, while the high values displayed a descending trend. At the clean level, VOC–S varied greatly, from 0.19 to 2.50, 0.26 to 2.17 and 0.11 to 3.26 at the JS, PD and QP sites, respectively. At the pollution level, the scope of VOC–S was narrow, especially at the extreme pollution level, with the values fluctuating from 0.10 to 0.16, 0.13 to 0.17 and 0.17 to 0.28 at the JS, PD and QP sites, respectively. It is worth noting that the VOC–S values displayed a steady decreasing trend, and the ratios of PM2.5 to increased at the clean and slightly polluted levels. Such a result demonstrated that the VOC concentrations were sensitive to that of PM2.5 in the above two episodes. In order to quantify the sensitivity of VOCs to PM2.5, we classified VOCs and PM2.5 into different groups with a PM2.5 concentration interval of 5 µg m−3 on the basis of the study reported by Han et al. (2017). The mean VOC–S values followed an exponential function, and the values of k were determined to be 0.39, 0.46 and 0.56 at the JS, PD and QP sites, respectively, according to Eqs. (12)–(15). The VOCs at the QP site showed a more rapid increment along with an increase in PM2.5 values. The VOC compositions displayed similar linkages with VOCs, and the higher values of k were attributed to the aromatics at the JS and PD sites and the alkanes at the QP site (Fig. S5). Thus, the optimal choices for controlling VOC species varied with the land-use types. Accordingly, in order to efficiently control the VOC-induced haze pollution, the concentrations of aromatics at the JS and PD sites as well as alkanes at the QP site should be controlled as a priority as the results of the discrepancy between clean and haze days.
Herein, a concurrent atmospheric observation campaign was performed at the three supersites with the different land-use types of Shanghai from January to March 2019. Based on the observation data, this study carefully discussed the concentration variations, primary sources, ozone and SOA formation potentials of the atmospheric VOCs influenced by land-use types.
The VOC concentrations in the order of the JS (21.88 ± 12.58 ppb) > PD (21.36 ± 8.58 ppb) > QP (11.93 ± 6.33 ppb) sites were locally sensitive to the land-use types. Alkanes dominated the VOC community and accounted for 50.33 %, 71.48 % and 60.88 % of the TVOCs at the JS, PD and QP sites, respectively, because of their widespread emission sources and longer atmospheric lifetimes. The relatively high VOC concentrations during the rush-hour traffic in the morning and evening were observed at the sampling sites due to the vehicle emission. The “weekend effects” of VOCs showed that the VOC concentrations on the weekends were 3.31 %, 10.19 % and 1.19 % lower than those on the weekdays at the JS, PD and QP sites, respectively, due to the low anthropogenic activities occurring on the weekends. Overall, the variations of VOC characteristics were closely related to the land-use types. The average PM2.5 values were 45.57 ± 27.59, 48.51 ± 27.22 and 40.27 ± 27.78 µg m−3 at the JS, PD and QP sites, respectively. The highest O3 concentration was observed at the QP site (99.30 ± 24.00 ppb), followed by the JS (73.59 ± 23.59 ppb) and PD (57.48 ± 20.49 ppb) sites. The occurrence of haze pollution was characterized by the elevated concentrations of aromatics at the JS and PD sites and alkanes at the QP site.
The special ratios and PMF were used to investigate the local sources. Local anthropogenic emissions contributed largely to the VOC pollution and varied with land-use types. The vehicle exhaust was determined to be the predominant source at the three sites. The second-largest VOC contributor was identified as industrial production at the JS and PD sites, whereas it proved to be fuel production and evaporation at the QP site. The limited influence of industrial sources at the QP site was observed, which was related to the land-use type of this site; i.e., the QP site is surrounded by a natural environment and is far away from the industrial regions. Relative to the QP site, the JS and PD sites were less affected by the biomass burning, which was consistent with the regional characteristics of anthropogenic activities dominated by land-use types. Apart from the local sources, the influence of regional transport was analyzed via 24 h back trajectories and PSCF. The results showed that VOCs were impacted by the northern or/and northeastern trajectories at the sampling sites. The highest PSCF values were observed in the area near the above sites, indicating that the local source was a significant contributor to the VOC pollution.
The formation potentials of O3 and SOA induced by the studied VOCs were also discussed. During the observation period, relative to the SOA formation, the formation of O3 was more dependent on the VOC concentrations, and the sensitivity analysis of VOC compositions varied with the land-use type. Specifically, the OFP results illustrated that alkenes were the major OFP contributor, and the aromatic compounds were also positively associated with the high OFP. The higher OFPs at the JS and PD sites (50.85 ± 2.63 and 33.94 ± 1.52 ppb) relative to that at the QP site (24.26 ± 1.43 ppb) were observed, while the O3 concentrations were low. The result was related to the land-use types of both sites, which led to high pollutant concentrations and decreased the solar radiation and the intensity of photochemical reactions. In terms of SOAFP, BTEX was the greatest contributor to SOAFP, comprising 86.07 %, 96.21 % and 86.38 % at the JS, PD and QP sites, respectively. The SOAFP values of each land-use type turned out to be in the order of the JS (1.00 ± 2.03 µg m−3) > PD (0.46 ± 0.88 µg m−3) > QP (0.41 ± 0.58 µg m−3) sites in connection with the land-use types. The VOC–PM2.5 sensitivity analysis showed that VOCs at the QP site showed a more rapid increment along with the increase in PM2.5 values compared with the other two sampling sites. Of the four VOC categories, aromatics at the JS and PD sites and alkanes at the QP site were more sensitive to PM2.5. This finding indicated that alkenes and aromatics were key concerns in reducing the atmospheric secondary pollution in Shanghai. The relevant results herein reveal the influences of land-use type on atmospheric pollution and set an example for future VOC observation research at a city level.
Measurement data in this study are available in the data repository maintained by Mendeley Data https://doi.org/10.17632/mf4gf36r9n.1 (Han, 2022).
The supplement related to this article is available online at: https://doi.org/10.5194/acp-23-2877-2023-supplement.
RL and HF designed the research. YH analyzed the data and wrote the paper. YD and SG planned the locations of the field observations and VOC grid sampling sites. YH, TW, RL, HF, LZ and JC contributed to the review of the paper.
The contact author has declared that none of the authors has any competing interests.
Publisher's note: Copernicus Publications remains neutral with regard to jurisdictional claims in published maps and institutional affiliations.
This work was supported by the National Key R&D Program of China (grant no. 2022YFC3701102), the National Natural Science Foundation of China (grant nos. 22176038, 91744205 and 21777025) and the Natural Science Foundation of Shanghai City (grant no. 22ZR1404700).
This research has been supported by the National Key R&D Program of China (grant no. 2022YFC3701102), the National Natural Science Foundation of China (grant nos. 22176038, 91744205 and 21777025) and the Natural Science Foundation of Shanghai City (grant no. 22ZR1404700).
This paper was edited by Zhibin Wang and reviewed by three anonymous referees.
Alghamdi, M. A., Khoder, M., Abdelmaksoud, A. S., Harrison, R. M., Hussein, T., Lihavainen, H., and Hämeri, K.: Seasonal and diurnal variations of BTEX and their potential for ozone formation in the urban background atmosphere of the coastal city Jeddah, Saudi Arabia, Air Qual. Atmos. Hlth., 7, 467–480, https://doi.org/10.1007/s11869-014-0263-x, 2014.
Amor-Carro, O., White, K. M., Fraga-Iriso, R., Marinas-Pardo, L. A., Nunez-Naveira, L., Lema-Costa, B., Villarnovo, M., Verea-Hernando, H., and Ramos-Barbon, D.: Airway hyperresponsiveness, inflammation, and pulmonary emphysema in rodent models designed to mimic exposure to fuel oil-derived volatile organic compounds encountered during an experimental oil spill, Environ. Health Persp., 128, 027003, https://doi.org/10.1289/EHP4178, 2020.
An, J., Zhu, B., Wang, H., Li, Y., Lin, X., and Yang, H.: Characteristics and source apportionment of VOCs measured in an industrial area of Nanjing, Yangtze River Delta, China, Atmos. Environ., 97, 206–214, https://doi.org/10.1016/j.atmosenv.2014.08.021, 2014.
An, J. L., Wang, J. X., Zhang, Y. X., and Zhu, B.: Source Apportionment of Volatile Organic Compounds in an Urban Environment at the Yangtze River Delta, China, Arch. Environ. Con. Tox., 72, 335–348, https://doi.org/10.1007/s00244-017-0371-3, 2017.
Ashbaugh, L. L., Malm, W. C., Sadeh, W. Z. A residence time probability analysis of sulfur concentrations at ground canyon national park, Atmos. Environ., 19, 1263–1270, https://doi.org/10.1016/0004-6981(85)90256-2, 1985.
Bari, M. A. and Kindzierski, W. B.: Ambient volatile organic compounds (VOCs) in Calgary, Alberta: Sources and screening health risk assessment, Sci. Total Environ., 631–632, 627–640, https://doi.org/10.1016/j.scitotenv.2018.03.023, 2018.
Brown, S. G., Frankel, A., and Hafner, H. R.: Source apportionment of VOCs in the Los Angeles area using positive matrix factorization, Atmos. Environ., 41, 227–237, https://doi.org/10.1016/j.atmosenv.2006.08.021, 2007.
Brown, S. G., Eberly, S., Paatero, P., and Norris, G. A.: Methods for estimating uncertainty in PMF solutions: Examples with ambient air and water quality data and guidance on reporting PMF results, Sci. Total Environ., 518–519, 626–635, https://doi.org/10.1016/j.scitotenv.2015.01.022, 2015.
Cai, C., Geng, F., Yu, Q., An, J., and Han, J.: Source apportionment of VOCs at city centre of Shanghai in summer, Acta Sci. Circumst., 30, 926–934, https://doi.org/10.1631/jzus.A1000244, 2010a.
Cai, C., Geng, F. H., Tie, X. X., Yu, Q., and An, J. L., Characteristics of ambient volatile organic compounds (VOCs) measured in Shanghai, China, Sensors, 10, 7843–7862, https://doi.org/10.3390/s100807843, 2010b.
Carter, W. P. L.: Development of ozone reactivity scales for volatile organic compounds, J. Air Waste Manage. Assoc., 44, 881–899, https://doi.org/10.1080/1073161X.1994.10467290, 1994.
Chang, C. C., Wang, J. L., Liu, S. C., and Candice, L. S. C.: Assessment of vehicular and non-vehicular contributions to hydrocarbons using exclusive vehicular indicators, Atmos. Environ., 40, 6349–6361, https://doi.org/10.1016/j.atmosenv.2006.05.043, 2006.
Chen, C., Xia, Z. H., Wu, M. M., Zhang, Q. Q., Wang, T., and Wang, L. P.: Concentrations, Source Identification, and Lung Cancer Risk Associated with Springtime PM2.5-Bound Polycyclic Aromatic Hydrocarbons (PAHs) in Nanjing, China, Arch. Environ. Contam. Toxicol., 73, 391–400, https://doi.org/10.1007/s00244-017-0435-4, 2017.
Chen, T. M., Kuschner, W. G., Gokhale, J., and Schofer, S.: Outdoor air pollution: Ozone health effects, Am. J. Med. Sci., 333, 244–248, https://doi.org/10.1097/MAJ.0b013e31803b8e8c, 2007.
Dai, H. X., Jing, S. G., Wang, H. L., Ma, Y. G., Li, L., Song, W. M., and Kan, H. D.: VOC characteristics and inhalation health risks in newly renovated residences in Shanghai, China, Sci. Total Environ., 577, 73–83, https://doi.org/10.1016/j.scitotenv.2016.10.071, 2017.
Dai, P., Ge, Y., Lin, Y., Su, S., and Liang, B.: Investigation on characteristics of exhaust and evaporative emissions from passenger cars fueled with gasoline/methanol blends, Fuel, 113, 10–16, https://doi.org/10.1016/j.fuel.2013.05.038, 2013.
Debevec, C., Sauvage, S., Gros, V., Salameh, T., Sciare, J., Dulac, F., and Locoge, N.: Seasonal variation and origins of volatile organic compounds observed during 2 years at a western Mediterranean remote background site (Ersa, Cape Corsica), Atmos. Chem. Phys., 21, 1449–1484, https://doi.org/10.5194/acp-21-1449-2021, 2021.
Deng, C. X., Jin, Y. J., Zhang, M., Liu, X. W., and Yu, Z. M.: Emission Characteristics of VOCs from On-Road Vehicles in an Urban Tunnel in Eastern China and Predictions for 2017–2026, Aerosol Air Qual. Res., 18, 3025–3034, https://doi.org/10.4209/aaqr.2018.07.0248, 2018.
Draxier, R. R. and Hess, G. D.: An overview of the hysplit-4 modelling system for trajectories, Aust. Meteorol. Mag., 47, 295–308, 1998.
Dumanoglu, Y., Kara, M., Altiok, H., Odabasi, M., Elbir, T., and Bayram, A.: Spatial and seasonal variation and source apportionment of volatile organic compounds (VOCs) in a heavily industrialized region, Atmos. Environ., 98, 168–178, https://doi.org/10.1016/j.atmosenv.2014.08.048, 2014.
Gaimoz, C., Sauvage, S., Gros, V., Herrmann, F., Williams, J., Locoge, N., Perrussel, O., Bonsang, B., d'Argouges, O., Sarda-Estève, R., and Sciare, J.: Volatile organic compounds sources in Paris in spring 2007. Part II: Source apportionment using positive matrix factorisation, Environ. Chem., 8, 91–103, https://doi.org/10.1071/EN10067, 2011.
Gao, W., Tie, X., Xu, J., Huang, R., Mao, X., Zhou, G., and Chang, L.: Long-term trend of O3 in a mega City 694 (Shanghai), China: Characteristics, causes, and interactions with precursors, Sci. Total Environ., 695, 603–604, https://doi.org/10.1016/j.scitotenv.2017.06.099, 2017.
Geng, F. H., Cai, C. J., Tie, X. X., Yu, Q., An, J. L., Peng, L., Zhou, G. Q., and Xu, J. M.: Analysis of VOC emissions using PCA/APCS receptor model at city of Shanghai, China, J. Atmos. Chem., 62, 229–247, https://doi.org/10.1007/s10874-010-9150-5, 2009.
Grosjean, D. and Seinfeld, J. H.: Parameterization of the formation potential of secondary organic aerosols, Atmos. Environ., 23, 1733–1747, https://doi.org/10.1016/0004-6981(89)90058-9, 1989.
Gu, Y. X., Li, K., Xu, J. M., Liao, H., and Zhou, G. Q.: Observed dependence of surface ozone on increasing temperature in Shanghai, China, Atmos. Environ., 221, 117108, https://doi.org/10.1016/j.atmosenv.2019.117108, 2020.
Guo, H., Cheng, H. R., Ling, Z. H., Louie, P. K. K., and Ayoko, G. A.: Which emission sources are responsible for the volatile organic compounds in the atmosphere of Pearl River Delta?, J. Hazard. Mater., 188, 116-1-24, https://doi.org/10.1016/j.jhazmat.2011.01.081, 2011.
Guo, H., Ling, Z. H., Cheng, H. R., Simpson, I. J., Lyu, X. P., Wang, X. M., Shao, M. Z., Lu, H. X., Ayoko, G., Zhang, Y. L., Saunders, S., Lam, S., Wang, J. L., and Blake, D. R.: Tropospheric volatile organic compounds in China, Sci. Total Environ., 574, 1021–1043, https://doi.org/10.1016/j.scitotenv.2016.09.116, 2017.
Guo, H., Wang, T., and Louie, P. K.: Source apportionment of ambient non-methane hydrocarbons in Hong Kong: application of a principal component analysis/absolute principal component scores (PCA/APCS) receptor model, Environ. Pollut., 129, 489–498, https://doi.org/10.1016/j.envpol.2003.11.006, 2004.
Han, D. M., Wang, Z., Cheng, J. P., Wang, Q., Chen, X. J., and Wang, H. L.: Volatile organic compounds (VOCs) during non-haze and haze days in Shanghai: characterization and secondary organic aerosol (SOA) formation, Environ. Sci. Pollut. Res., 24, 18619–18629, https://doi.org/10.1007/s11356-017-9433-3, 2017.
Han, Y.: Data for: “Measurement report: Simultaneous multi-site observations of VOCs in Shanghai, East China: characteristics, sources and secondary formation potentials”, Mendeley Data [data set], https://doi.org/10.17632/mf4gf36r9n.1, 2022.
Heald, C. L., Gouw, J. De, Goldstein, A. H., Guenther, A. B., Hayes, P. L., Hu, W., Isaacman-Vanwertz, G., Jimenez, J. L., Keutsch, F. N., Koss, A. R., Misztal, P. K., Rappenglück, B., Roberts, J. M., StevensP. S., Washenfelder, R. A., Warneke, C., and Young, C. J.: Contrasting reactive organic carbon observations in the Southeast United States (SOAS) and Southern California (CalNex), Environ. Sci. Technol., 54, 14923–14935, https://doi.org/10.1021/acs.est.0c05027, 2020.
Hong, Z., Li, M., Wang, H., Xu, L., Hong, Y., Chen, J., Chen, J., Zhang, H., Zhang, Y., Wu, X., Hu, B., and Li, M.: Characteristics of atmospheric volatile organic compounds (VOCs) at a mountainous forest site and two urban sites in the southeast of China, Sci. Total Environ., 657, 1491–1500, https://doi.org/10.1016/j.scitotenv.2018.12.132, 2019.
Hopke, P. K. Review of receptor modeling methods for source apportionment, J. Air Waste Manage., 66, 237–259, https://doi.org/10.1080/10962247.2016.1140693, 2016.
Huang, C., Wang, H. L., Li, L., Wang, Q., Lu, Q., de Gouw, J. A., Zhou, M., Jing, S. A., Lu, J., and Chen, C. H.: VOC species and emission inventory from vehicles and their SOA formation potentials estimation in Shanghai, China, Atmos. Chem. Phys., 15, 11081–11096, https://doi.org/10.5194/acp-15-11081-2015, 2015.
Hui, L. R., Liu, X. G., Tan, Q. W., Feng, M., An, J. L., Qu, Y., Zhang, Y. H., and Jiang, M. Q.: Characteristics, source apportionment and contribution of VOCs to ozone formation in Wuhan, Central China, Atmos. Environ., 192, 55–71, https://doi.org/10.1016/j.atmosenv.2018.08.042, 2018.
Hui, L. R., Liu, X. G., Tan, Q. W., Feng, M., An, J. L., Qu, Y., Zhang Y. H., and Cheng, N. L.: VOC characteristics, sources and contributions to SOA formation during haze events in Wuhan, Central China, Sci. Total Environ., 650, 2624–2639, https://doi.org/10.1016/j.scitotenv.2018.10.029, 2019.
Jobson, B. T., Parrish, D. D., Goldan, P., Kuster, W., Fehsenfeld, F. C., Blake, D. R., and Niki, H.: Spatial and temporal variability of nonmethane hydrocarbon mixing ratios and their relation to photochemical lifetime, J. Geophys. Res.-Atmos., 103, 13557–13567, https://doi.org/10.1029/97JD01715, 1998.
Jookjantra, P., Thepanondh, S., Keawboonchu, J., Kultan, V., and Laowagul, W.: Formation potential and source contribution of secondary organic aerosol from volatile organic compounds, J. Environ. Qual., 51, 1061–1034, https://doi.org/10.1002/jeq2.20381, 2022.
Kumar, A., Singh, D., Kumar, K. S., Singh, B. B., and Jain, V. K.: Distribution of VOCs in urban and rural atmospheres of subtropical India: Temporal variation, source attribution, ratios, OFP and risk assessment, Sci. Total Environ., 613–614, 492–501, https://doi.org/10.1016/j.scitotenv.2017.09.096, 2018.
Li, B., Ho, S. S. H., Gong, S., Ni, J., Li, H., Han, L., Yang, Y., Qi, Y., and Zhao, D.: Characterization of VOCs and their related atmospheric processes in a central Chinese city during severe ozone pollution periods, Atmos. Chem. Phys., 19, 617–638, https://doi.org/10.5194/acp-19-617-2019, 2019.
Li, J., Zhai, C. Z., Yu, J. Y., Liu, R. L., Li, Y. Q., Zeng, L. M., and Xie, S. D.: Spatiotemporal variations of ambient volatile organic compounds and their sources in Chongqing, a mountainous megacity in China, Sci. Total Environ., 627, 1442–1452, https://doi.org/10.1016/j.scitotenv.2018.02.010, 2018.
Li, K., Chen, L., Ying, F., White, S. J., Jang, C., Wu, X., Gao, X., Hong, S., Shen, J., Azzi, M., and Cen, K.: Meteorological and chemical impacts on ozone formation: A case study in Hangzhou, China, Atmos. Res., 196, 40–52, https://doi.org/10.1016/j.atmosres.2017.06.003, 2017.
Li, L., Xie, S., Zeng, L., Wu, R., and Li, J.: Characteristics of volatile organic compounds and their role in ground-level ozone formation in the Beijing-Tianjin-Hebei region, China, Atmos. Environ., 113, 247–254, https://doi.org/10.1016/j.atmosenv.2015.05.021, 2015.
Li, L., Tan, Q., Zhang, Y., Feng, M., Qu, Y., An, J., and Liu, X.: Characteristics and source apportionment of PM2.5 during persistent extreme haze events in Chengdu, Southwest China, Environ. Pollut., 230, 718–729, https://doi.org/10.1016/j.envpol.2017.07.029, 2017.
Li, M., Zhang, Q., Zheng, B., Tong, D., Lei, Y., Liu, F., Hong, C., Kang, S., Yan, L., Zhang, Y., Bo, Y., Su, H., Cheng, Y., and He, K.: Persistent growth of anthropogenic non-methane volatile organic compound (NMVOC) emissions in China during 1990–2017: drivers, speciation and ozone formation potential, Atmos. Chem. Phys., 19, 8897–8913, https://doi.org/10.5194/acp-19-8897-2019, 2019.
Li, X. H., Wang, S. X., and Hao, J. M.: Characteristics of Volatile Organic Compounds (VOCs) Emitted from Biofuel Combustion in China, Environ. Sci., 32, 3515–3521, https://doi.org/10.1109/ICMTMA.2014.201, 2011.
Li, Y. D., Yin, S. S., Yu, S. J., Yuan, M. H., Dong, Z., Zhang, D., Yang, L. M., and Zhang, R. Q.: Characteristics, source apportionment and health risks of ambient VOCs during high ozone period at an urban site in central plain, China, Chemosphere, 250, 126283, https://doi.org/10.1016/j.chemosphere.2020.126283, 2020.
Li, Y. J., Ren, B. N., Qiao, Z., Zhu, J. P., Wang, H. L., Zhou, M., Qiao, L. P., Lou, S. R., Jing, S. G., Huang, C., Tao, S. K., Rao, P. H., and Li, J.: Characteristics of atmospheric intermediate volatility organic compounds (IVOCs) in winter and summer under different air pollution levels, Atmos. Environ., 210, 58–65, https://doi.org/10.1016/j.atmosenv.2019.04.041, 2019.
Li, Z. Y., Ho, K. F., and Yin, S. H. L.: Source apportionment of hourly-resolved ambient volatile organic compounds: Influence of temporal resolution, Sci. Total Environ., 725, 138243, https://doi.org/10.1016/j.scitotenv.2020.138243, 2020.
Lim, Y. B., Tan, Y., Perri, M. J., Seitzinger, S. P., and Turpin, B. J.: Aqueous chemistry and its role in secondary organic aerosol (SOA) formation, Atmos. Chem. Phys., 10, 10521–10539, https://doi.org/10.5194/acp-10-10521-2010, 2010.
Ling, Z. H., Guo, H., Cheng, H. R., and Yu, Y. F.: Sources of ambient volatile organic compounds and their contributions to photochemical ozone formation at a site in the Pearl River Delta, southern China, Environ. Pollut., 159, 2310–2319, https://doi.org/10.1016/j.envpol.2011.05.001, 2011.
Liu, J., Chu, B. W., Jia, Y. C., Cao, Q., Zhang, H., Chen, T. Z., Ma, Q. X., Ma, J. Z., Wang, Y. H., Zhang, P., and Hong, H.: Dramatic decrease of secondary organic aerosol formation potential in Beijing: Important contribution from reduction of coal combustion emission, Sci. Total Environ., 832, 155045, https://doi.org/10.1016/j.scitotenv.2022.155045, 2022.
Liu, S. C.: Ozone production in the rural troposphere and the implications for regional and global ozone distributions., J. Geophys. Res., 92, 4191–4207, https://doi.org/10.1029/JD092iD04p04191, 1987.
Liu, Y., Shao, M., Fu, L. L., Lu, S. H., Zeng, L. M., and Tang, D. G.: Source profiles of volatile organic compounds (VOCs) measured in China: Part I, Atmos. Environ., 42, 6247–6260, https://doi.org/10.1016/j.atmosenv.2008.01.070, 2008.
Liu, Y., Wang, H., Jing, S., Gao, Y., Peng, Y., Lou, S., Cheng, T., Tao, S., Li, L., Li, Y., Huang, D., Wang, Q., and An, J.: Characteristics and sources of volatile organic compounds (VOCs) in Shanghai during summer: Implications of regional transport, Atmos. Environ., 215, 116902, https://doi.org/10.1016/j.atmosenv.2019.116902, 2019.
Liu, Y., Song, M., Liu, X., Zhang, Y., Hui, L., Kong, L., Zhang, Y., Zhang, C., Qu, Y., An, J., Ma, D., Tan, Q., and Feng, M.: Characterization and sources of volatile organic compounds (VOCs) and their related changes during ozone pollution days in 2016 in Beijing, China, Environ. Pollut., 257, 113599, https://doi.org/10.1016/j.envpol.2019.113599, 2020.
Liu, Y. H., Wang, H. L., Jing, S. G., Peng, Y. R., Gao, Y. Q., Yan, R. S., Wang, Q., Lou, S. R., Cheng, T. T., and Huang, C.: Strong regional transport of volatile organic compounds (VOCs) during wintertime in Shanghai megacity of China, Atmos. Environ., 244, 117940, https://doi.org/10.1016/j.atmosenv.2020.117940, 2021.
Lu, X., Hong, J., Zhang, L., Cooper, O. R., Schultz, M. G., Xu, X., Wang, T., Gao, M., Zhao, Y., and Zhang, Y.: Severe surface ozone pollution in China: A global perspective, Environ. Sci. Tech. Let., 5, 487–494, https://doi.org/10.1021/acs.estlett.8b00366, 2018.
Lyu, X. P., Chen, N., Guo, H., Zhang, W. H., Wang, N., Wang, Y., and Liu, M.: Ambient volatile organic compounds and their effect on ozone production in Wuhan, Central China, Sci. Total Environ., 541, 662–669, https://doi.org/10.1016/j.scitotenv.2015.09.093, 2016.
Ma, T., Duan, F., He, K., Qin, Y., Tong, D., Geng, G., Liu, X., Li, H., Yang, S., Ye, S., Xu, B., Zhang, Q., and Ma, Y.: Air pollution characteristics and their relationship with emissions and meteorology in the Yangtze River Delta region during 2014–2016, J. Environ. Sci., 83, 8–20, https://doi.org/10.1016/j.jes.2019.02.031, 2019.
Merikanto, J., Spracklen, D. V., Mann, G. W., Pickering, S. J., and Carslaw, K. S.: Impact of nucleation on global CCN, Atmos. Chem. Phys., 9, 8601–8616, https://doi.org/10.5194/acp-9-8601-2009, 2009.
Mo, Z., Shao, M., Lu, S., Qu, H., Zhou, M., Sun, J., and Gou, B.: Process-specifific emission characteristics of volatile organic compounds (VOCs) from petrochemical facilities in the Yangtze River Delta, China, Sci. Total Environ., 533, 422–431, https://doi.org/10.1016/j.scitotenv.2015.06.089, 2015.
Mo, Z., Shao, M., and Lu, S.: Compilation of a source profile database for hydrocarbon and OVOC emissions in China, Atmos. Environ., 143, 209–217, https://doi.org/10.1016/j.atmosenv.2016.08.025, 2016.
Mousavinezhad, S., Choi, Y., Pouyaei, A., Ghahremanloo, M., and Nelson, D. L.: A comprehensive investigation of surface ozone pollution in China, 2015–2019: Separating the contributions from meteorology and precursor emissions, Atmos. Res., 257, 105599, https://doi.org/10.1016/j.atmosres.2021.105599, 2021.
Morrow, N. L.: The industrial production and use of 1,3-butadiene, Environ. Health Persp., 86, 7–8, https://doi.org/10.1289/ehp.90867, 1990.
Mozaffar, A., Zhang, Y. L., Fan, M. Y., Cao, F., and Lin, Y. C.: Characteristics of summertime ambient VOCs and their contributions to O3 and SOA formation in a suburban area of Nanjing, China, Atmos. Res., 240, 104923, https://doi.org/10.1016/j.atmosres.2020.104923, 2020.
Murphy, J. G., Day, D. A., Cleary, P. A., Wooldridge, P. J., Millet, D. B., Goldstein, A. H., and Cohen, R. C.: The weekend effect within and downwind of Sacramento – Part 1: Observations of ozone, nitrogen oxides, and VOC reactivity, Atmos. Chem. Phys., 7, 5327–5339, https://doi.org/10.5194/acp-7-5327-2007, 2007.
Nelson, P. and Quigley, S.: The m, p-xylenes: ethylbenzene ratio. A technique for estimating hydrocarbon age in ambient atmospheres, Atmos. Environ., 17, 659–662, https://doi.org/10.1016/0004-6981(83)90141-5, 1983.
Ng, N. L., Kroll, J. H., Chan, A. W. H., Chhabra, P. S., Flagan, R. C., and Seinfeld, J. H.: Secondary organic aerosol formation from m-xylene, toluene, and benzene, Atmos. Chem. Phys., 7, 3909–3922, https://doi.org/10.5194/acp-7-3909-2007, 2007.
Niu, H., Mo, Z., Shao, M., Lu, S., and Xie, S.: Screening the emission sources of volatile organic compounds (VOCs) in China by multi-effects evaluation, Front. Env. Sci. Eng., 10, 1–11, https://doi.org/10.1007/s11783-016-0828-z, 2016.
Nussbaumer, C. M. and Cohen, R. C.: The role of temperature and NOx in ozone trends in the Los Angeles Basin, Environ. Sci. Technol., 54, 15652–15659, https://doi.org/10.1021/acs.est.0c04910, 2020.
Odum, J. R., Jungkamp, T. P. W., Griffin, R. J., Forstner, H. J. L., Flagan, R. C., and Seinfeld, J. H.: Aromatics, reformulated gasoline, and atmospheric organic aerosol formation, Environ. Sci. Technol., 31, 1890–1897, https://doi.org/10.1021/es960535l, 1997.
Paatero, P.: Least squares formulation of robust non-negative factor analysis, Chem. Intell. Lab. Syst., 37, 23–35, https://doi.org/10.1016/S0169-7439(96)00044-5, 1997.
Pallavi, Sinha, B., and Sinha, V.: Source apportionment of volatile organic compounds in the northwest Indo-Gangetic Plain using a positive matrix factorization model, Atmos. Chem. Phys., 19, 15467–15482, https://doi.org/10.5194/acp-19-15467-2019, 2019.
Pankow, J. F.: An absorption-model of gas-particle partitioning of organic-compounds in the atmosphere, Atmos. Environ., 28, 185–188, https://doi.org/10.1016/1352-2310(94)90093-0, 1994.
Polissar, A. V., Hopke, P. K., Paatero, P., Kaufmann, Y. J., Hall, D. K., Bodhaine, B. A., Dutton, E. G., and Harris, J. M.: The aerosol at Barrow, Alaska: long-term trends and source locations, Atmos. Environ., 33, 2441–2458, https://doi.org/10.1016/S1352-2310(98)00423-3, 1999.
Ren, B. N., Zhu, J. P., Tian, L. J., Wang, H. L., Huang, C., Jing, S. A., Lou, S. G., An, J. Y., Lu, J., Rao, P. H., Fu, Q. Y., Huo, J. T., and Li, Y. J.: An alternative semi-quantitative GC/MS method to estimate levels of airborne intermediate volatile organic compounds (IVOCs) in ambient air, Atmos. Environ., 6, 100075, https://doi.org/10.1016/j.aeaoa.2020.100075, 2020.
Rumchev, K., Brown, H., and Spickett, J.: Volatile organic compounds: do they present a risk to our health?, Rev. Environ. Health, 22, 39–55, https://doi.org/10.1515/REVEH.2007.22.1.39, 2007.
Sadeghi, B., Pouyaei, A., Choi, Y., and Rappenglueck, B.: Measurement report: Summertime and wintertime VOCs in Houston: Source apportionment and spatial distribution of source origins, Atmos. Chem. Phys. Discuss. [preprint], https://doi.org/10.5194/acp-2021-565, 2021.
Sawvel, E. J., Willis, R., West, R. R., Casuccio, G. S., Norris, G., Kumar, N., Hammond, D., and Peters, T. M.: Passive sampling to capture the spatial variability of coarse particles by composition in Cleveland, OH, Atmos. Environ., 105, 61–69, https://doi.org/10.1016/j.atmosenv.2015.01.030, 2015.
Seinfeld, J. H., Erdakos, G. B., Asher, W. E., and Pankow, J. F.: Modeling the formation of secondary organic aerosol (SOA). 2. The predicted effects of relative humidity on aerosol formation in the α-pinene-, β-pinene-, sabinene-, Δ3-carene-, and cyclohexene-ozone systems. Environ. Sci. Technol., 35, 1806–1817, https://doi.org/10.1021/es011025g, 2001.
Schauer, J. J., Kleeman, M. J., Cass, G. R., and Simoneit, B. R. T.: Measurement of emissions from air pollution sources. 3. C-1-C-29 organic compounds from fireplace combustion of wood, Environ. Sci. Technol., 35, 1716e1728, https://doi.org/10.1021/es001331e, 2001.
Shao, P., An, J. L., Xin, J. Y., Wu, F. K., Wang, J. X., Ji, D. S., and Wang, Y. S.: Source apportionment of VOCs and the contribution to photochemical ozone formation during summer in the typical industrial area in the Yangtze River Delta, China, Atmos. Res., s176–s177, 64–74, https://doi.org/10.1016/j.atmosres.2016.02.015, 2016.
Shi, C. Z., Wang, S., Liu, R., Zhou, R., Li, D., Wang, W., Li, Z., Cheng, T., and Zhou, B.: A study of aerosol optical properties during ozone pollution episodes in 2013 over Shanghai, China, Atmos. Res, 153, 235–249, https://doi.org/10.1016/j.atmosres.2014.09.002, 2015.
Shi, J., Deng, H., Bai, Z., Kong, S., Wang, X., Hao, J., Han, X., and Ning, P.: Emission and profifile characteristic of volatile organic compounds emitted from coke production, iron smelt, heating station and power plant in Liaoning Province, China, Sci. Total Environ., 515, 101–108, https://doi.org/10.1016/j.scitotenv.2015.02.034, 2015.
Song, C. B., Wu, L., Xie, Y. C., He, J. J., Chen, X., Wang, T., Lin, Y. C., Jin, T. S., Wang, A. X., Liu, Y., Dai, Q. L., Liu, B. S., Wang, Y. N., and Mao, H. J.: Air pollution in China: Status and spatiotemporal variations, Environ. Pollut., 227, 334–347, https://doi.org/10.1016/j.envpol.2017.04.075, 2017.
Song, M., Tan, Q., Feng, M., Qu, Y., Liu, X., An, J., and Zhang, Y.: Source Apportionment and Secondary Transformation of Atmospheric Nonmethane Hydrocarbons in Chengdu, Southwest China, J. Geophys. Res.-Atmos., 123, 9741–9763, https://doi.org/10.1029/2018JD028479, 2018.
Song, M., Li, X., Yang, S., Yu, X., Zhou, S., Yang, Y., Chen, S., Dong, H., Liao, K., Chen, Q., Lu, K., Zhang, N., Cao, J., Zeng, L., and Zhang, Y.: Spatiotemporal variation, sources, and secondary transformation potential of volatile organic compounds in Xi'an, China, Atmos. Chem. Phys., 21, 4939–4958, https://doi.org/10.5194/acp-21-4939-2021, 2021.
Song, M. D., Liu, X. G., Zhang, Y. H., Shao, M., Lu, K. D., Tan, Q. W., Feng, M., and Qu, Y.: Sources and abatement mechanisms of VOCs in southern China, Atmos. Environ., 201, 28–40, https://doi.org/10.1016/j.atmosenv.2018.12.019, 2019a.
Song, S. K., Shon, Z. H., Kang, Y. H., Kim, K. H., Han, S. B., Kang, M. S., Bang, J. H., and Oh, I.: Source apportionment of VOCs and their impact on air quality and health in the megacity of Seoul, Environ. Pollut., 247, 763–774, https://doi.org/10.1016/j.envpol.2019.01.102, 2019b.
Song, Y., Shao, M., Liu, Y., Lu, S., Kuster, W., Goldan, P., and Xie, S.: Source apportionment of ambient volatile organic compounds in Beijing, Environ. Sci. Technol., 41, 4348–4353, https://doi.org/10.1021/es0625982, 2007.
Sun, J., Wu, F. K., Hu, B., Tang, G. Q., Zhang, J. K., and Wang, Y. S.: VOC characteristics, emissions and contributions to SOA formation during haze episodes, Atmos. Environ., 141, 560–570, https://doi.org/10.1016/j.atmosenv.2016.06.060, 2016.
Tan, Z., Lu, K., Jiang, M., Su, R., Dong, H., Zeng, L., Xie, S. D., Tan, Q. W., and Zhang, Y. H.: Exploring ozone pollution in Chengdu, southwestern China: A case study from radical chemistry to O3-VOC-NOx sensitivity, Sci. Total Environ., 636, 775–786, https://doi.org/10.1016/j.scitotenv.2018.04.286, 2018.
Tang, J. H., Chan, L. Y., Chan, C. Y., Li, Y. S., Chang, C. C., Wang, X. M., and Wu, D.: Implications of changing urban and rural emissions on non-methane hydrocarbons in the Pearl River Delta region of China, Atmos. Environ., 42, 3780–3794, https://doi.org/10.1016/j.atmosenv.2007.12.069, 2008.
Tian, L., Li, Y. F., Shao, L., and Zhang, Y.: Measuring Spatio-temporal Characteristics of City Expansion and Its Driving Forces in Shanghai from 1990 to 2015, Chin. Geogra. Sci., 27, 875–890, https://doi.org/10.1007/s11769-017-0883-9, 2017.
US EPA: Photochemical Assessment Monitoring Stations (PAMS), http://www3.epa.gov/ttnamti1/pamsmain.html (last access: 3 December 2018), 1990.
Vardoulakis, S., Solazzo, E., and Lumbreras, J.: Intra-urban and street scale variability of BTEX, NO2 and O3 in Birmingham, UK: Implications for exposure assessment, Atmos. Environ., 45, 5069–5078, https://doi.org/10.1016/j.atmosenv.2011.06.038, 2011.
Velasco, E., Lamb, B., Westberg, H., Allwine, E., Sosa, G., Arriaga-Colina, J. L., Jobson, B. T., Alexander, M. L., Prazeller, P., Knighton, W. B., Rogers, T. M., Grutter, M., Herndon, S. C., Kolb, C. E., Zavala, M., de Foy, B., Volkamer, R., Molina, L. T., and Molina, M. J.: Distribution, magnitudes, reactivities, ratios and diurnal patterns of volatile organic compounds in the Valley of Mexico during the MCMA 2002 & 2003 field campaigns, Atmos. Chem. Phys., 7, 329–353, https://doi.org/10.5194/acp-7-329-2007, 2007.
Vo, T. D. H., Lin, C. S., Weng, C. E., Yuan, C. S., Lee, C. W., Hung, C. H., Bui, X. T., Lo, K. C., and Lin, J. X.: Vertical stratification of volatile organic compounds and their photochemical product formation potential in an industrial area, J. Environ. Manag., 217, 327–336, doi.:10.1016/j.jenvman.2018.03.101, 2018.
Wang, H. L., Gao, Y. Q., Jing, S. A., Lou, S. R., Hu, Q. Y., An, J. Y., Wu, Y. H., Gao, W., Zhu, L., and Huang, C.: Characterization of volatile organic compounds (VOCs) using mobile monitoring around the industrial parks in the Yangzte River Delta region of China, Huan jing ke xue= Huanjing kexue, 42, 1298–1305, https://doi.org/10.13227/j.hjkx.202007265, 2021.
Wang, M., Shao, M., Lu, S. H., Yang, Y. D., and Chen, W. T.: Evidence of coal combustion contribution to ambient VOCs during winter in Beijing, Chin. Chem. Lett., 24, 829–832, https://doi.org/10.1016/j.cclet.2013.05.029, 2013.
Wang, P., Chen, Y., Hu, J. L., Zhang, H. L., and Ying, Q.: Source apportionment of summertime ozone in China using a sourceoriented chemical transport model, Atmos. Environ., 211, 79–90, https://doi.org/10.1016/j.atmosenv.2019.05.006, 2019.
Wang, P., Wang, T., and Ying, Q.: Regional source apportionment of summertime ozone and its precursors in the megacities of Beijing and Shanghai using a source-oriented chemical transport model, Atmos. Environ., 224, 117337, https://doi.org/10.1016/j.atmosenv.2020.117337, 2020.
Wang, R., Xu, X., Jia, S., Ma, R., Ran, L., Deng, Z., Lin, W., Wang, Y., and Ma, Z.: Lower tropospheric distributions of O3 and aerosol over Raoyang, a rural site in the North China Plain, Atmos. Chem. Phys., 17, 3891–3903, https://doi.org/10.5194/acp-17-3891-2017, 2017.
Wang, T., Xia, Z. H., Wu, M. M., Zhang, Q. Q., Sun, S. Q., Yin, J., Zhou, Y. C., and Yang, H.: Pollution characteristics, sources and lung cancer risk of atmospheric polycyclic aromatic hydrocarbons in a new urban district of Nanjing, China, J. Environ. Sci., 55, 118–128, https://doi.org/10.1016/j.jes.2016.06.025, 2017.
Wei, X. Y., Liu, M., Yang, J., Du, W. N., Sun, X., Huang, Y. P., Zhang, X., Khalil, S. K., Luo, D. M., and Zhou, Y. D.: Characterization of PM2.5-bound PAHs and carbonaceous aerosols during three-month severe haze episode in Shanghai, China: Chemical composition, source approtionment and long-range transportation, Atmos. Environ., 203, 1–9, https://doi.org/10.1016/j.atmosenv.2019.01.046, 2019.
Wongphatarakul, V., Fridelander, S. K., and Pinto, J. P.: A comparative study of PM2.5 ambient aerosol chemical databases, Environ. Sci. Technol., 32, 3926–3934, https://doi.org/10.1016/S0021-8502(98)00164-5, 1998.
Wu, R. R., Li, J., Hao, Y. F., Li, Y. Q., Zeng, L. M., and Xie, S. D.: Evolution process and sources of ambient volatile organic compounds during a severe haze event in Beijing, China, Sci. Total Environ., 560–561, 62–72, https://doi.org/10.1016/j.scitotenv.2016.04.030, 2016.
Xie, Y. L. and Berkowitz, C. M.: The use of conditional probability functions and potential source contribution functions to identify source regions and advection pathways of hydrocarbon emissions in Houston, Texas, Atmos. Environ., 41, 5831–5847, https://doi.org/10.1016/j.atmosenv.2007.03.049, 2007.
Xiong, Y. and Du, K.: Source-resolved attribution of ground-level ozone formation potential from VOC emissions in Metropolitan Vancouver, BC, Sci. Total Environ., 721, 137698, https://doi.org/10.1016/j.scitotenv.2020.137698, 2020.
Xu, J., Tie, X., Gao, W., Lin, Y., and Fu, Q.: Measurement and model analyses of the ozone variation during 2006 to 2015 and its response to emission change in megacity Shanghai, China, Atmos. Chem. Phys., 19, 9017–9035, https://doi.org/10.5194/acp-19-9017-2019, 2019.
Yan, Y. L., Peng, L., Li, R. M., Li, Y. H., Li, L. J., and Bai, H. L.: Concentration, ozone formation potential and source analysis of volatile organic compounds (VOCs) in a thermal power station centralized area: A study in Shuozhou, China, Environ. Pollut., 223, 295–304, https://doi.org/10.1016/j.envpol.2017.01.026, 2017.
Yang, M. R., Li, F. X., Huang, C. Y., Tong, L., Dai, X. R., and Xiao, H.: VOC characteristics and their source apportionment in a coastal industrial area in the Yangtze River Delta, China, J. Environ. Sci., 127, 483–493, https://doi.org/10.1016/j.jes.2022.05.041, 2023.
Yang, Y. R., Liu, X. G., Qu, Y., An, J. L., Jiang, R., Zhang, Y. H., Sun, Y. L., Wu, Z. J., Zhang, F., Xu, W. Q., and Ma, Q. X.: Characteristics and formation mechanism of continuous hazes in China: a case study during the autumn of 2014 in the North China Plain, Atmos. Chem. Phys., 15, 8165–8178, https://doi.org/10.5194/acp-15-8165-2015, 2015.
Yao, Z., Wu, B., Shen, X., Cao, X., Jiang, X., Ye, Y., and He, K.: On-road emission characteristics of VOCs from rural vehicles and their ozone formation potential in Beijing, China, Atmos. Environ., 105, 91–96, https://doi.org/10.1016/j.atmosenv.2015.01.054, 2015.
Yoo, J.-M., Jeong, M.-J., Kim, D., Stockwell, W. R., Yang, J.-H., Shin, H.-W., Lee, M.-I., Song, C.-K., and Lee, S.-D.: Spatiotemporal variations of air pollutants (O3, NO2, SO2, CO, PM10, and VOCs) with land-use types, Atmos. Chem. Phys., 15, 10857–10885, https://doi.org/10.5194/acp-15-10857-2015, 2015.
Yu, S., Su, F., Yin, S., Wang, S., Xu, R., He, B., Fan, X., Yuan, M., and Zhang, R.: Characterization of ambient volatile organic compounds, source apportionment, and the ozone–NOx–VOC sensitivities in a heavily polluted megacity of central China: effect of sporting events and emission reductions, Atmos. Chem. Phys., 21, 15239–15257, https://doi.org/10.5194/acp-21-15239-2021, 2021.
Yuan, B., Hu, W. W., Shao, M., Wang, M., Chen, W. T., Lu, S. H., Zeng, L. M., and Hu, M.: VOC emissions, evolutions and contributions to SOA formation at a receptor site in eastern China, Atmos. Chem. Phys., 13, 8815–8832, https://doi.org/10.5194/acp-13-8815-2013, 2013.
Zhan, J. L., Feng, Z. M., Liu, P. F., He, X. W., He, Z. M., Chen, T. Z., Wang, Y. F., He, H., Mu, Y. J., and Liu, Y. C.: Ozone and SOA formation potential based on photochemical loss of VOCs during the Beijing summer, Environ. Pollut., 285, 117444, https://doi.org/10.1016/j.envpol.2021.117444, 2021.
Zhang, D., He, B., Yuan, M. H., Yu, S. J., Yin, S. S., and Zhang, R. Q.: Characteristics, sources and health risks assessment of VOCs in Zhengzhou, China during the haze pollution season, J. Environ. Sci., 108, 44–57, https://doi.org/10.1016/j.jes.2021.01.035, 2021.
Zhang, F., Shang, X. N., Chen, H., Xie, G. Z., Fu, Y., Wu, D., Sun, W. W., Liu, P. F., Wang, G. H., and Chen, J. M.: Significant impact of coal combustion on VOCs emissions in winter in a North China rural site, Sci. Total Environ., 720, 137617, https://doi.org/10.1016/j.scitotenv.2020.137617, 2020b.
Zhang, G., Wang, N., Jiang, X., and Zhao, Y.: Characterization of ambient volatile organic compounds (VOCs) in the area adjacent to a petroleum refinery in Jinan, China, Aerosol Air Qual. Res., 17, 944–950, https://doi.org/10.4209/aaqr.2016.07.0303, 2017.
Zhang, K., Li, L., Huang, L., Wang, Y. J., Huo, J. T., Duan, Y. S., Wang, Y. H., and Fu, Q. Y.: The impact of volatile organic compounds on ozone formation in the suburban area of Shanghai, Atmos. Environ., 232, 137617, https://doi.org/10.1016/j.atmosenv.2020.117511, 2020a.
Zhang, S. B., Wang, S. S., Zhang, R. F., Guo, Y. L., Yan, Y. H., Ding, Z. F., and Zhou, B.: Investigating the Sources of Formaldehyde and Corresponding Photochemical Indications at a Suburb Site in Shanghai From MAX-DOAS Measurements, J. Geophys. Res.-Atmos., 126, 1–20, https://doi.org/10.1029/2020JD033351, 2021.
Zhang, Y., Wang, X., Zhang, Z., Lu, S., Shao, M., Lee, F. S. C., and Yu, J.: Species profiles and normalized reactivity of volatile organic compounds from gasoline evaporation in China, Atmos. Environ., 79, 110–118, https://doi.org/10.1016/j.atmosenv.2013.06.029, 2013.
Zhang, Y. C., Li, R., Fu, H. B., Zhou, D., and Chen, J. M.: Observation and analysis of atmospheric volatile organic compounds in a typical petrochemical area in Yangtze River Delta, China, J. Environ. Sci., 71, 233–248, https://doi.org/10.1016/j.jes.2018.05.027, 2018.
Zheng, H., Kong, S., Xing, X., Mao, Y., Hu, T., Ding, Y., Li, G., Liu, D., Li, S., and Qi, S.: Monitoring of volatile organic compounds (VOCs) from an oil and gas station in northwest China for 1 year, Atmos. Chem. Phys., 18, 4567–4595, https://doi.org/10.5194/acp-18-4567-2018, 2018.
Zheng, H., Kong, S. F., Yan, Y. Y., Chen, N., Yao, L. Q., Liu, X., Wu, F. Q., Cheng, Y., Niu, Z. Z., Zheng, S. R., Zeng, X., Yan, Q., Wu, J., Zheng, M. M., Liu, D. T., Zhao, D. L., and Qi, S. H.: Compositions, sources and health risks of ambient volatile organic compounds (VOCs) at a petrochemical industrial park along the Yangtze River, Sci. Total. Environ., 73, 135505, https://doi.org/10.1016/j.scitotenv.2019.135505, 2020.
Zheng, J. Y., Zhong, L. J., Wang, T., Louie, P. K. K., and Li, Z. C.: Ground-level ozone in the Pearl River Delta region: analysis of data from a recently established regional air quality monitoring network, Atmos. Environ., 44, 814–823, https://doi.org/10.1016/j.atmosenv.2009.11.032, 2010.
Zhu, Y., Yang, L., Chen, J., Wang, X., Xue, L., Sui, X., Wen, L., Xu, C., Yao, L., Zhang, J., Shao, M., Lu, S., and Wang, W.: Characteristics of ambient volatile organic compounds and the influence of biomass burning at a rural site in Northern China during summer 2013, Atmos. Environ., 124, 156–165, https://doi.org/10.1016/j.atmosenv.2015.08.097, 2016.
Zhu, Y. H., Yang, L. X., Kawamura, K., Chen, J. M., Ono, K. R., Wang, X. F., Xue, L. K., and Wang, W. X.: Contribution and source identification of biogenic and anthropogenic hydrocarbons to secondary organic aerosols at Mt. Tai in 2014, Environ. Pollut., 220, 863–872, https://doi.org/10.1016/j.envpol.2016.10.070, 2017.