the Creative Commons Attribution 4.0 License.
the Creative Commons Attribution 4.0 License.
 | 02 Mar 2023
Diurnal differences in the effect of aerosols on cloud-to-ground lightning in the Sichuan Basin
Haichao Wang
Yongbo Tan
Zheng Shi
Ning Yang
Tianxue Zheng
The effect of aerosols on lightning has been examined in many studies, but its mechanisms are complex and far from understood. This study investigated the influence of aerosols on cloud-to-ground (CG) lightning during both afternoon (12:00–18:00 Beijing Time) and night (23:00–05:00 Beijing Time) in the Sichuan Basin by analysing 9-year datasets of CG lightning, aerosol loading, dynamic-thermodynamic, and cloud-related data from ground-based measurements, satellite, and model reanalysis to understand the difference in the influences of aerosols under conditions with and without solar radiation. The relationship between lightning and aerosol optical depth (AOD) is nonlinear in the afternoon and at night with a turning point at AOD ≅ 0.3. When AOD is less than 0.3, increasing AOD will lead to an increase in lightning flashes both in the afternoon and at night. When the AOD exceeds 0.3, the increase of AOD will reduce the lightning flashes in the afternoon but have no obvious effect on the lightning flashes at night. The different relationship between aerosol loading and lightning flashes in the afternoon and at night after AOD exceeds 0.3 is related to the changes in solar radiation in these two periods. In the afternoon, excessive aerosols reduce the solar radiation reaching the ground through its direct and indirect radiative effects, resulting in the decrease of the surface temperature, increasing atmospheric stability, inhibiting convection, and thus reducing lightning. At night, due to the absence of solar radiation, the influence of aerosols on surface temperature is weakened; thus, the inhibition of aerosols on lightning activity is weakened.
- Article
(4867 KB) - Full-text XML
-
Supplement
(713 KB) - BibTeX
- EndNote


Lightning is an intense discharge phenomenon in the atmosphere that threatens the safety of human life and property and leads to significant increases in NOx in the middle and upper troposphere (Holle et al., 2019; Zhang et al., 2012; Choi et al., 2005; Yair, 2018). Many observational studies have shown the important role of aerosols in affecting lightning from the ocean to the continent (Westcott, 1995; Bell et al., 2009; Yuan et al., 2011; Altaratz et al., 2010, 2017; Thornton et al., 2017; Liu et al., 2020).
The effects of aerosols on lightning encompass two parts: microphysical and radiative effects (Altatatz et al., 2014; Fan et al., 2016; Li et al., 2017b; Kuniyal and Guleria, 2019). The microphysical effects are related to aerosols serving as cloud condensation nuclei (CCN). Adding aerosols to clouds produces more small cloud droplets, inhibits coalescence, and delays the onset of warm-rain processes. For deep convective clouds, this process allows more liquid water to ascend into the mixed-phase region of the atmosphere through strong updrafts, forming more super-cooled water and ice particles. Freezing a large amount of liquid water releases more latent heat and invigorates convection (Rosenfeld et al., 2008; Khain and Lynn, 2009; Tao et al., 2012). Through radiative effects, aerosols can heat the atmospheric layer and cool the surface by absorbing and scattering solar radiation, which increases the stability of the atmosphere and thus likely suppresses the development of convection (Kaufman et al., 2002; Koren et al., 2004, 2008; Tan et al., 2016; Li et al., 2017a). The content of super-cooled water and ice particles in clouds as well as the strength of convection are thus modulated by aerosols, and they are tightly correlated with the occurrence and progression of lightning (Takahashi, 1978; Jayaratne et al., 1983; Mansell et al., 2005; Saunders, 2008).
The relationships between aerosol loading and lightning or convective activity are complex and variable (Li et al., 2018; Lal et al., 2017; Dayeh et al., 2021). Several studies revealed the transition between two opposing effects of aerosols on clouds and lightning. The first is the microphysical effect which increases the convective intensity and lightning, followed by the radiative effect that becomes dominant with the increase in aerosol loading suppressing the convective intensity (Altaratz et al., 2010). The aerosol type determines the ability of aerosols to affect cloud microphysical and solar radiation, which further affects the relationship between aerosols and lightning (Li et al., 2017b). In central China, dominated by absorbing aerosols, a negative relationship was found between aerosols and thunderstorms as well as lightning. In contrast, in southeast China, dominated by hygroscopic aerosols, a positive relationship was found between them (Yang et al., 2013, 2016; Yang and Li, 2014). The environmental condition can also change the direction of aerosol effects on lightning. For example, in dry northern Africa, the aerosols invigorate and suppress lightning under low and high aerosol loading conditions, respectively. However, in moist central Africa, the aerosol-invigoration effects are sustained under both low and high aerosol loading conditions (Wang et al., 2018). In summary, the complex relationship between aerosols and lightning results from the superposition of aerosol microphysical and radiative effects, which are altered by aerosol loading, aerosol type, and specific environmental conditions. Some model studies simulated the development of thunderstorms under different aerosol backgrounds and found that increasing aerosol concentration leads to the enhancement of lightning even if the aerosol concentration reaches a high level (Zhao et al., 2015; Shi et al., 2015, 2019). However, these model results are difficult to verify using observations, because the radiative effects of aerosols will offset the microphysical effects when the aerosol loading is excessively high.
Many observational studies concerning the relationship between aerosols and lightning on a relatively coarse time resolution (such as a yearly, monthly, or daily timescale) have been published (Lal and Pawar, 2011; Wang et al., 2011; Altaratz et al., 2017; Shi et al., 2020; Liu et al., 2021; Wang et al., 2021; Chakraborty et al., 2021). Few studies have investigated the linkage between aerosols and lightning (and convective activity) on an hourly timescale. Guo et al. (2016) investigated the daily cycle of precipitation and lightning under clean and polluted conditions over the Pearl River Delta. Under polluted conditions, heavy precipitation and lightning occurred later in the day. Chen et al. (2021) reported that convective clouds preferentially occur under polluted conditions in the morning but the situation is reversed in the afternoon through analysing data from two warm seasons in eastern China. These studies revealed a diurnal difference in aerosol effects. Still, changes in aerosol effects on lightning or convective activity on an hourly timescale are far from understood.
Based on the above discussion, the combination of aerosol radiation suppression and microphysical stimulation and the change of their relative strength related to various factors are the main reasons for the complicated relationship between aerosols and lightning. The aerosol radiation suppression effect depends on solar radiation, and some studies based on hourly data reveal that the aerosol-inhibited effect on lightning weakens after sunset (Guo et al., 2016). The current study aims to investigate the difference in the effects of aerosols on lightning under conditions with and without solar radiation. To achieve this goal, we selected the Sichuan Basin as the study region. The Sichuan Basin is one of the aerosol high-value centres in China (Liu et al., 2016; Ning et al., 2018). It also is one of the most lightning-active regions in China. Due to its unique topography and meteorological conditions, lightning over the Sichuan Basin occurs more frequently at nighttime during the warm season (Yang et al., 2015; Xia et al., 2015). Nine years (2010–2018) of measurements and reanalysis data over the Sichuan Basin were analysed to investigate the difference in the influences of aerosols, dynamics-thermodynamics factors, and cloud-related variables on cloud-to-ground (CG) lightning in the day and night. This paper is organized as follows. Section 2 describes the datasets, region of interest, and study methods. Results and discussion are given in Sect. 3. Summary and conclusion are presented in Sect. 4.
2.1 Lightning data
The time series of cloud-to-ground (CG) lightning (hereafter referred to as lightning) data used in this study were obtained from the China Meteorological Administration (CMA) and China National Meteorological Center (CNMC). The CG lightning data were detected by the China Lightning Detection Network (CLDN). This network is based on the ground-based Advanced Time of Arrival and Direction (ADTD) system and uses the Improved Performance through Combined Technology (IMPACT) method (Cummins et al., 1998). This system provides information about the time, latitude, longitude, polarity, and peak current of the CG flashes. CLDN comprises 357 sensors, covers most of central and eastern China, and has a detection efficiency of 80 %–90 % (Yang et al., 2015; Xia et al., 2015). Some data quality controls have been performed. Positive CG flashes with a peak current of less than 15 kA are removed because many of them may be intracloud flashes (Cummins and Murphy, 2009). Only the first stroke is retained if multiple strokes occur in the next second within 10 km of the first stroke, and two strokes that occur within 0.5 s are assumed to be from the same flashes (Cummins et al., 1998). In addition, it is a different flash if the polarity of the stroke is different. The CG lightning data used in this study were aggregated to a spatial resolution. We compared the lightning data used in this paper with the lightning data of LIS/OTD. Overall, the spatial distribution and diurnal variation of the lightning data used in this paper are similar to that from LIS/OTD (Fig. S1 in the Supplement).
2.2 Aerosol data
The aerosol loading in this study is characterized by aerosol optical depth (AOD). AOD (550 nm) data are obtained from the Modern-Era Retrospective Analysis for Research and Application version 2 (MERRA-2). It provides dust, black carbon (BC), organic carbon (OC), and total extinction AODs at 550 nm. The AOD of total aerosols is selected in this study to discuss the possible effects of aerosols on lightning activity. The spatial resolution of it is . We interpolated AOD data onto a spatial resolution grid using bilinear interpolation. MERRA-2 is the latest version of global atmospheric reanalysis for the satellite era produced by NASA Global Modeling and Assimilation Office (GMAO) using the Goddard Earth Observing System Model (GEOS) (Randles et al., 2017; Gelaro et al., 2017). This dataset assimilates AOD from Moderate Resolution Imaging Spectroradiometer (MODIS), Advanced Very High-Resolution Radiometer (AVHRR) over the ocean, the space-based Multiangle Imaging Spectroradiometer (MISR) over bright surfaces, and ground-based Aerosol Robotic Network (AERONET) (Buchard et al., 2017). We compared the AOD data of MERRA-2 and MODIS datasets. The AOD of the two datasets in the study region correlated well (Fig. S2 in the Supplement).
2.3 Dynamics-thermodynamics and cloud-related data
In this study, we select five variables derived from the reanalysis data: 2 m temperature (T; unit: ∘), convective available potential energy (CAPE; unit: J kg−1), vertical wind shear (unit: m s−1), total column cloud liquid water (TCLW; unit: kg m−2), and total column cloud ice water (TCIW; unit: kg m−2). We choose CAPE and vertical wind shear to characterize the dynamics and thermodynamic conditions of the study region. We selected vertical wind shear in the low and middle troposphere, respectively. The vertical wind shear in the low troposphere is calculated from the hourly wind field ((U, V); unit: m s−1) at 850 and 700 hPa (hereafter referred to as 850 to 700 hPa shear), and the vertical wind shear in the middle troposphere is calculated from the hourly wind field at 500 and 400 hPa (hereafter referred to as 500 to 400 hPa shear) as follows:
The TCLW and TCIW are selected to represent cloud-related parameters that affect the development of lightning activity. The TCLW represents the amount of liquid water contained within clouds. Raindrops are not included in this parameter. The TCIW represents the amount of ice contained in clouds. Snow is not included in this parameter. These data are collected from the European Centre for Medium-Range Weather Forecast (ECMWF) ERA-5 reanalysis product with a spatial resolution of . To match the CG lightning and AOD data, these variables were interpolated onto a 0.5∘ spatial resolution grid. ERA-5 is the fifth generation ECMWF reanalysis for the global climate and weather. It combines model data with observations from across the world into a complete, consistent dataset through the law of physics (Hersbach et al., 2018c, 2020).
2.4 Region of interest
The black lines in Fig. 1 outline the specific study region. Figure 1a presents the altitude of its terrain. The spatial distributions of AOD and lightning density (unit: flashes h−1 km−2) for 2010–2018, in the summer months, are shown in Fig. 1b and c. The study region is composed of low hills and plains, mostly entirely encircled by mountains (as shown in Fig. 1a). It contains the large city of Chengdu and parts of Chongqing. Intense anthropogenic emissions, unique terrain, and the climatological low-pressure system at 700 hPa over the basin induce heavy air pollution in this region (Liu et al., 2016; Ning et al., 2018). The lightning density in the Sichuan Basin (especially the southern part of it) is markedly larger than that in its surrounding region. Figure 2 shows the diurnal variation in the occurrence frequency of lightning flashes. Lightning mainly occurs during nighttime (18:00–06:00 Beijing Time, hereafter referred to as BJT), accounting for about 72.9 % of the total lightning flashes. The peak of lightning occurs near midnight (24:00–01:00 BJT). This result is consistent with previous findings that the peak of lightning in the Sichuan Basin mainly happens at night during the warm season (May–September), while that in the contiguous southeastern part of China occurs in the afternoon (Xia et al., 2015).
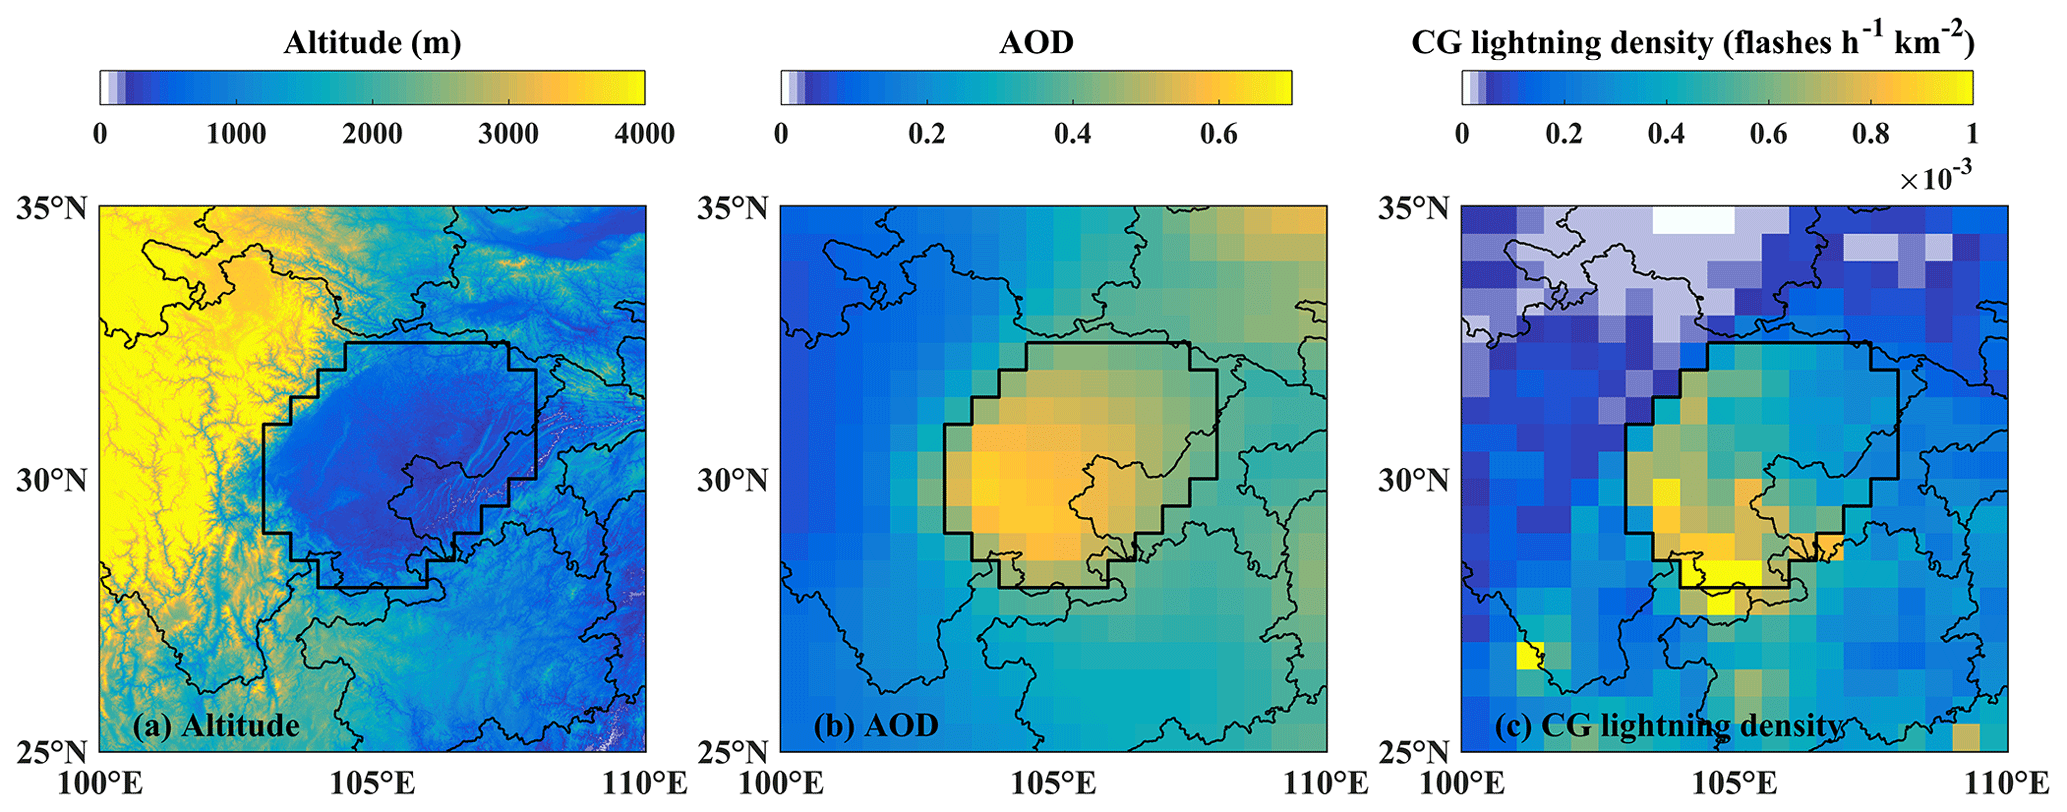
Figure 1(a) The terrain of the study region with a spatial resolution of . Spatial distributions of (b) aerosol optical depth (AOD) and (c) CG lightning density (flashes h−1 km−2) at a spatial resolution of for the summer months (June, July, and August) of 2010–2018. The black lines in (a–c) outline the specific area investigated in this study.
2.5 Data selection and producing
This study investigates summer (June, July, and August) data from 2010 to 2018 over the study region. The data of CG lightning flashes, AOD, dynamics-thermodynamics, and cloud-related variables are all at a spatial resolution of . The first question is how to define a sample and capture the AOD value of a sample. We limit the analysis to grid boxes with at least one CG flash during a 24 h period beginning at 12:00 BJT. The sampling period is chosen to begin at 12:00 BJT because flash rates are lowest at ∼ 12:00 BJT (see Fig. 2) The averaged AOD of these grids in the first hour of a sample was selected to characterize this sample's aerosol loading. To minimize the uncertainties related to the higher probability of misclassification of clouds and aerosols in high-AOD regimes and the influence of hygroscopic growth in a humid environment, the AOD range in this study is set between 0 and 0.8, following the work of Wang et al. (2018, AOD < 1.0), Koren et al. (2008, AOD < 0.8; 2012, AOD < 0.3), Kaufman et al. (2005, AOD < 0.6), and Altaratz et al. (2017, AOD < 0.4). In addition, days when flashes occur in more than 10 % of the study region during any of the 6 h (06:00–12:00 BJT) preceding the sample period are removed to ensure that the thunderstorm is relatively weak before the start of a sample and reduce the potential impact of precipitation on aerosol loading. This filtering limited the dataset to 532 samples. Subsequently, we determine the clean and polluted subsets according to the AOD value of each sample. All samples are sorted according to AOD and divided into three equal sample subsets, where the top third of the AOD range is labelled as polluted, and the bottom third is labelled as clean. The AOD value distribution of all samples and the AOD range of clean and polluted subsets are shown in Fig. 3. Pearson correlation is used in this study to examine the linear relationship between the two factors. The correlation is significant when it passes the significance test at 0.05 level.
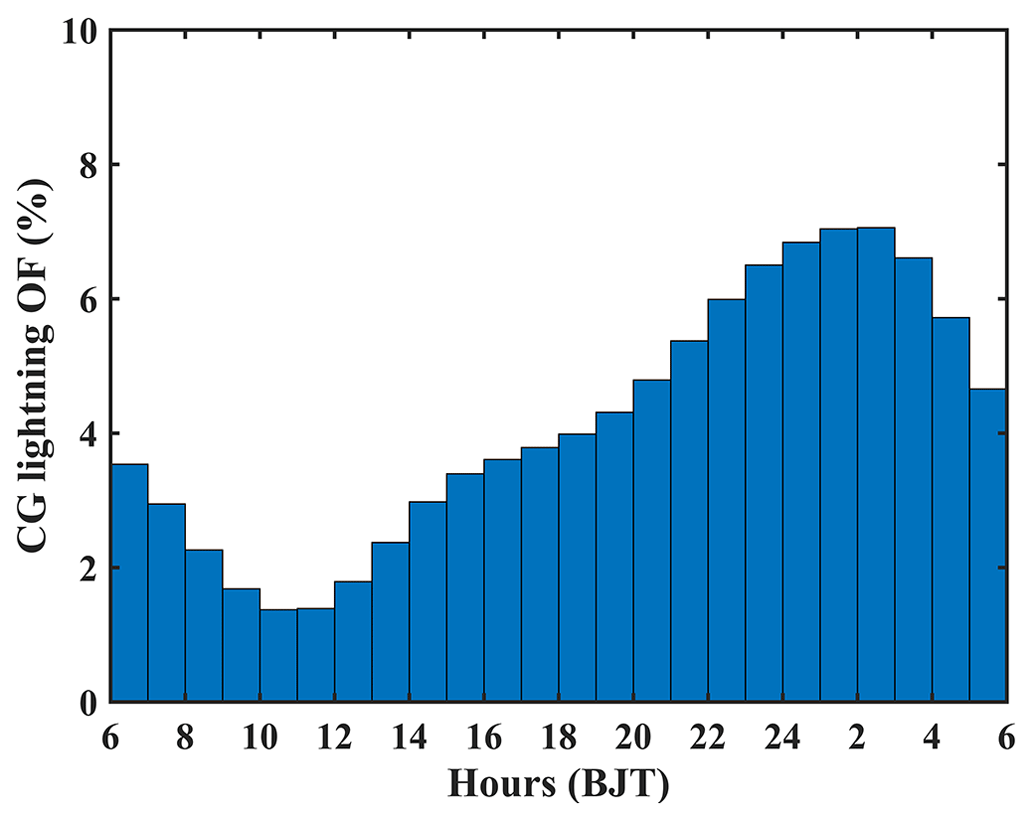
Figure 2The diurnal variation in the occurrence frequency of lightning flashes (unit: %) over the study region during the summer months (June, July, and August) of 2010–2018.
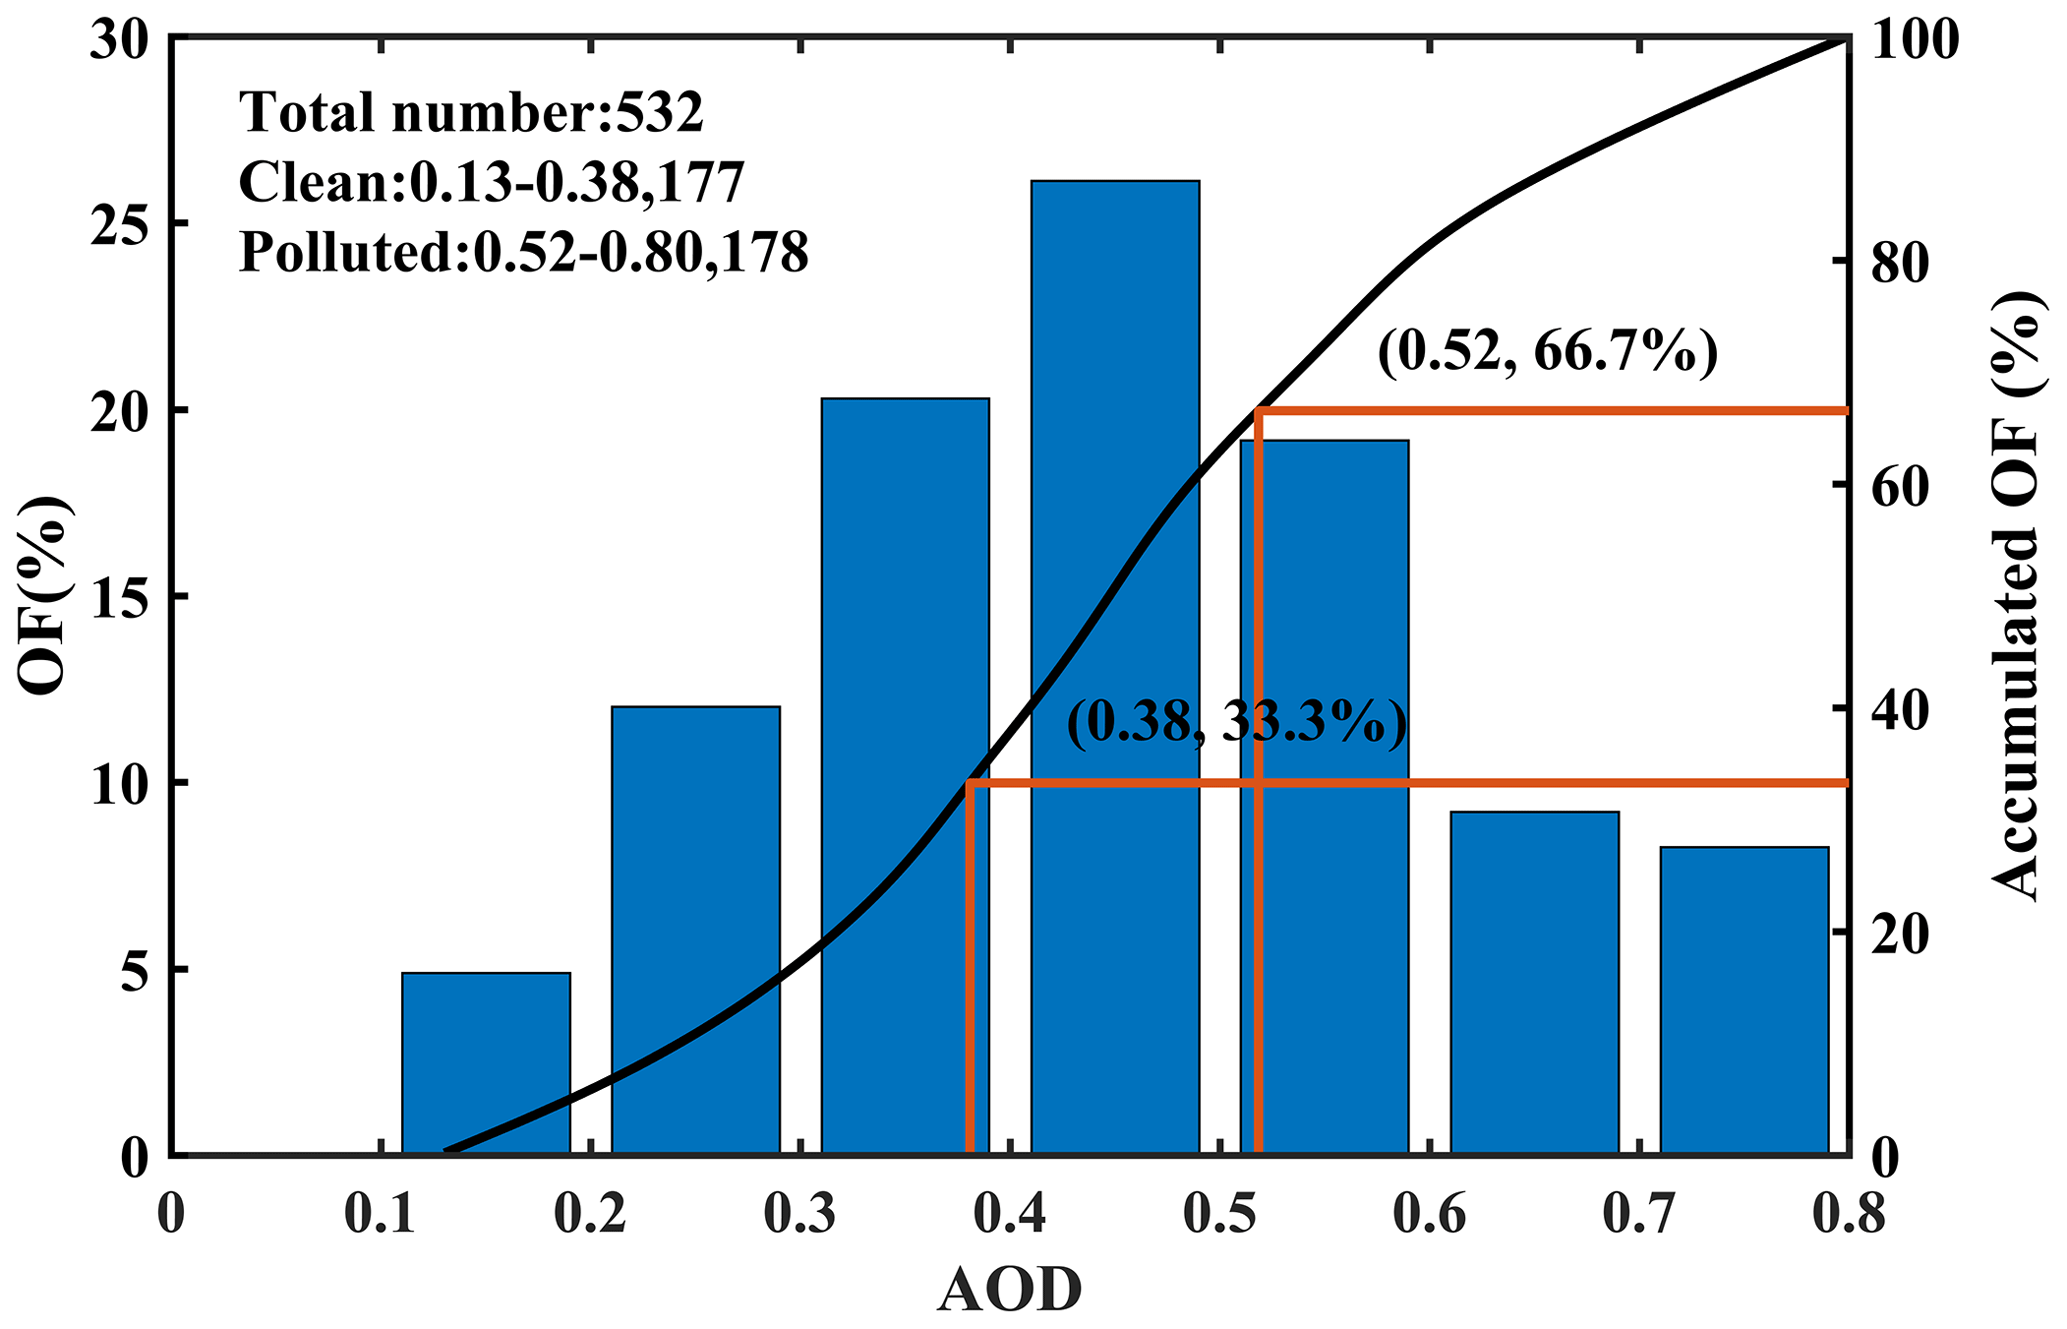
Figure 3The probability density function of ranked AOD of 532 samples. Black solid lines denote accumulated occurrence frequencies for the AOD. Red lines show the top and bottom terciles. The AOD range and sample number in clean and polluted subsets are also shown.
3.1 Diurnal variation of lightning flashes
Figure 4 shows the spatial distribution of total CG lightning flashes with an interval of 3 h. It can be found that the spatial distributions of the CG lightning flashes are markedly different between different periods of the day. In the early morning, the CG lightning flashes mainly occur on the northwest side of the Sichuan Basin (Fig. 4g). By afternoon, the CG lightning flashes are distributed throughout the basin (Fig. 4a and b). After 18:00 BJT, the CG lightning flashes in the southern Sichuan Basin gradually strengthen (Fig. 4c and d). After midnight, lightning is concentrated on the southwest and northwest parts of the Sichuan Basin with an increased focus on the northwest side of the Sichuan Basin (Fig. 4e and f).
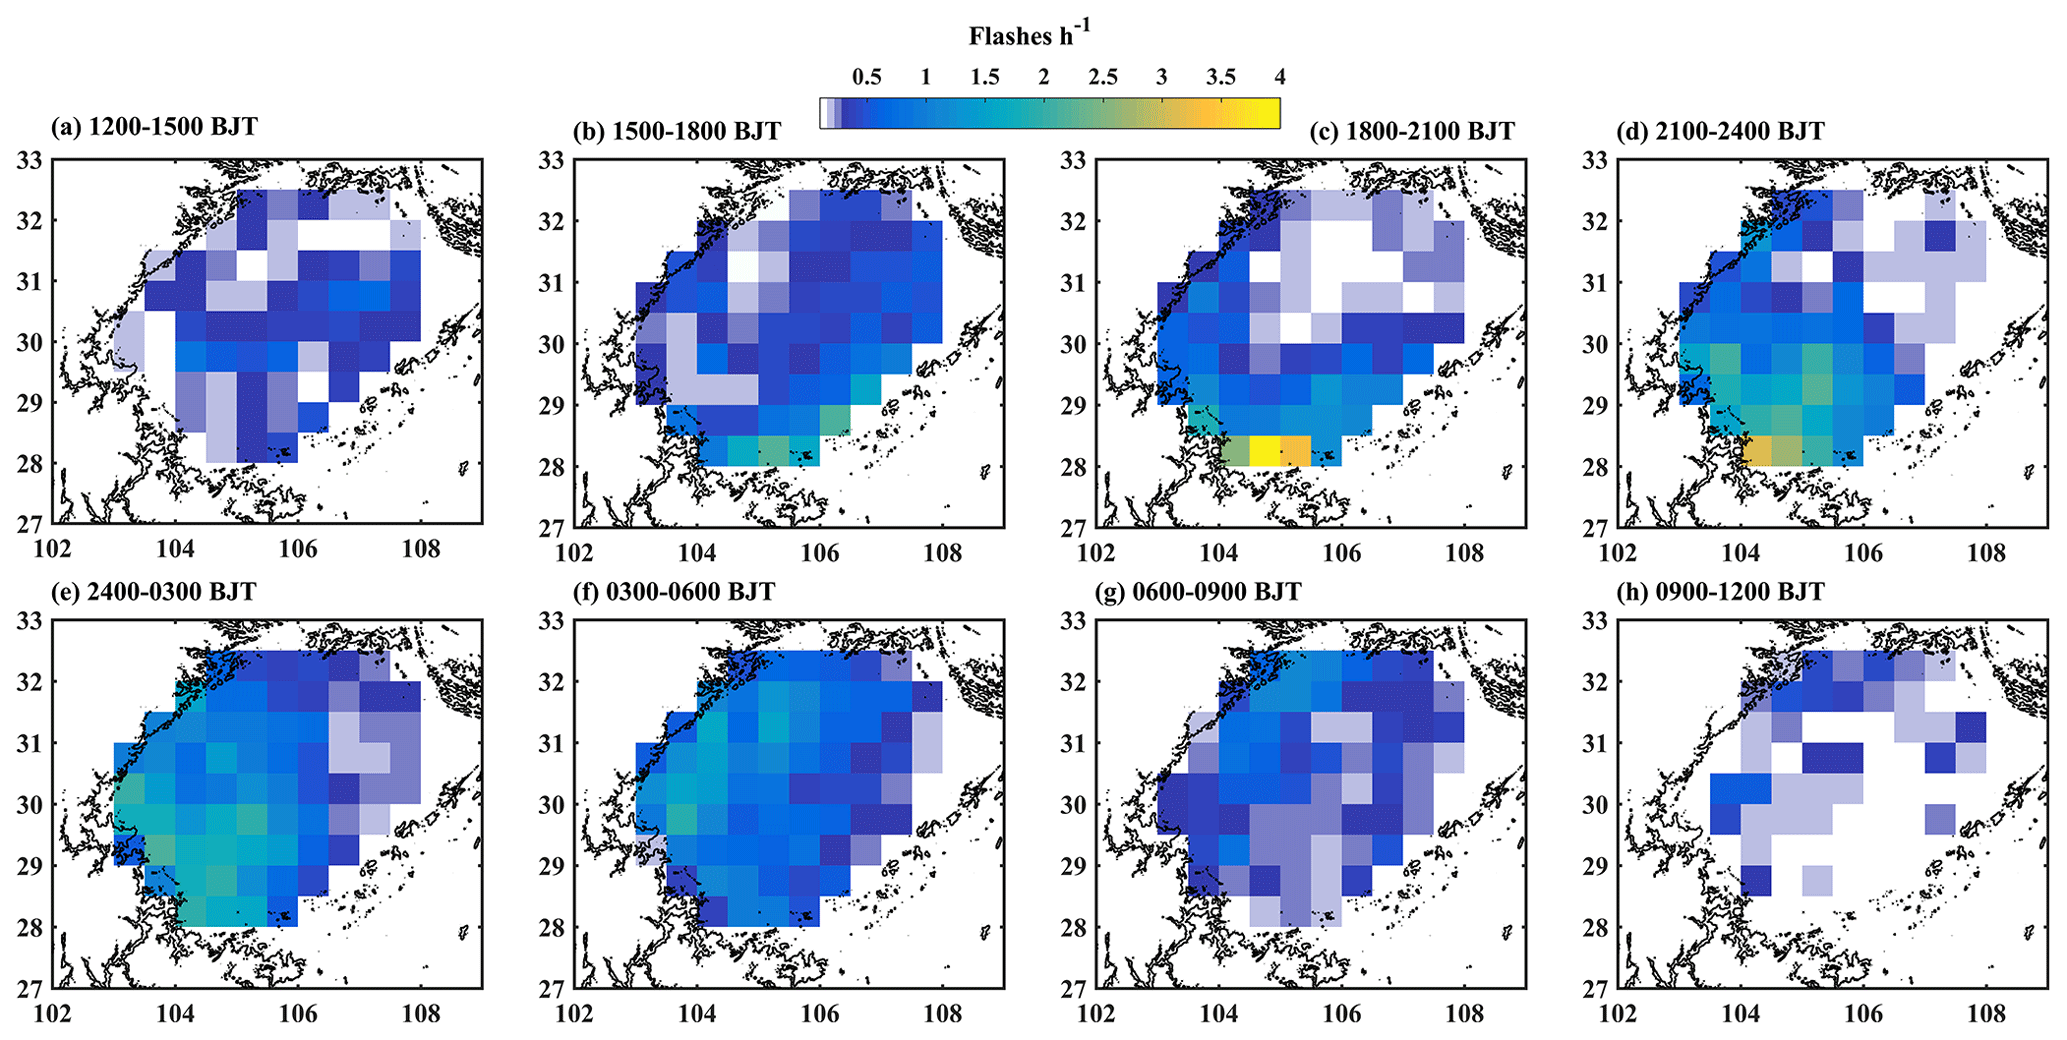
Figure 4Diurnal cycle of lightning flashes (unit: flashes h−1) on a grid with an interval of 3 h (BJT) for 2010–2018 including the summer months (June, July, and August). The 1500 m altitude line is shown with black lines to highlight the location of the basin.
Some studies have investigated the causes of frequent convection and precipitation at night in the Sichuan Basin and provided some explanations. Many clouds in the Sichuan Basin during the day block the short-wave solar radiation from reaching the ground, which is not conducive to convection. At night, the cloud top radiates and cools, making it easy to form convective activity (Li et al., 2008; Yu et al., 2010). Jin et al. (2012) proposed a conceptual model to explain the phenomenon of frequent convection and precipitation at night in the Sichuan Basin. The southwest flow in the lower troposphere strengthens at night, flows around the southeastern edge of the Yunnan-Guizhou Plateau, and enters the Sichuan Basin, forming a strong cyclonic rotation conducive to ascending movement. This process also brings a large amount of water vapour into the basin. Meanwhile, the downdraft along the eastern slope of the Tibetan Plateau encounters the mass accumulation formed in the low altitude of the basin by the southwest warm and wet air transport in the late night, thus generating diabatic warming at a low level of the troposphere in the central basin. Late at night, a cold advection from the Tibetan Plateau to the basin leads to a cooling in the middle troposphere over the central basin. In addition, a recent study found that the prominent diurnal inertial oscillations of the boundary layer south-southwesterly low-level jet into the Sichuan Basin may play an essential role in affecting the daily precipitation cycles in the Sichuan Basin (Zhang et al., 2019). The mechanisms behind the nocturnal convection and precipitation in the Sichuan Basin are complex and are not completely understood. However, the results of Figs. 2 and 4, as well as the findings of previous studies, indicate that convection and thunderstorms are more likely to occur in the study region at night than during the day. In the following content, we further investigate the potential influence of aerosols on CG lightning in the study region on an hourly scale.
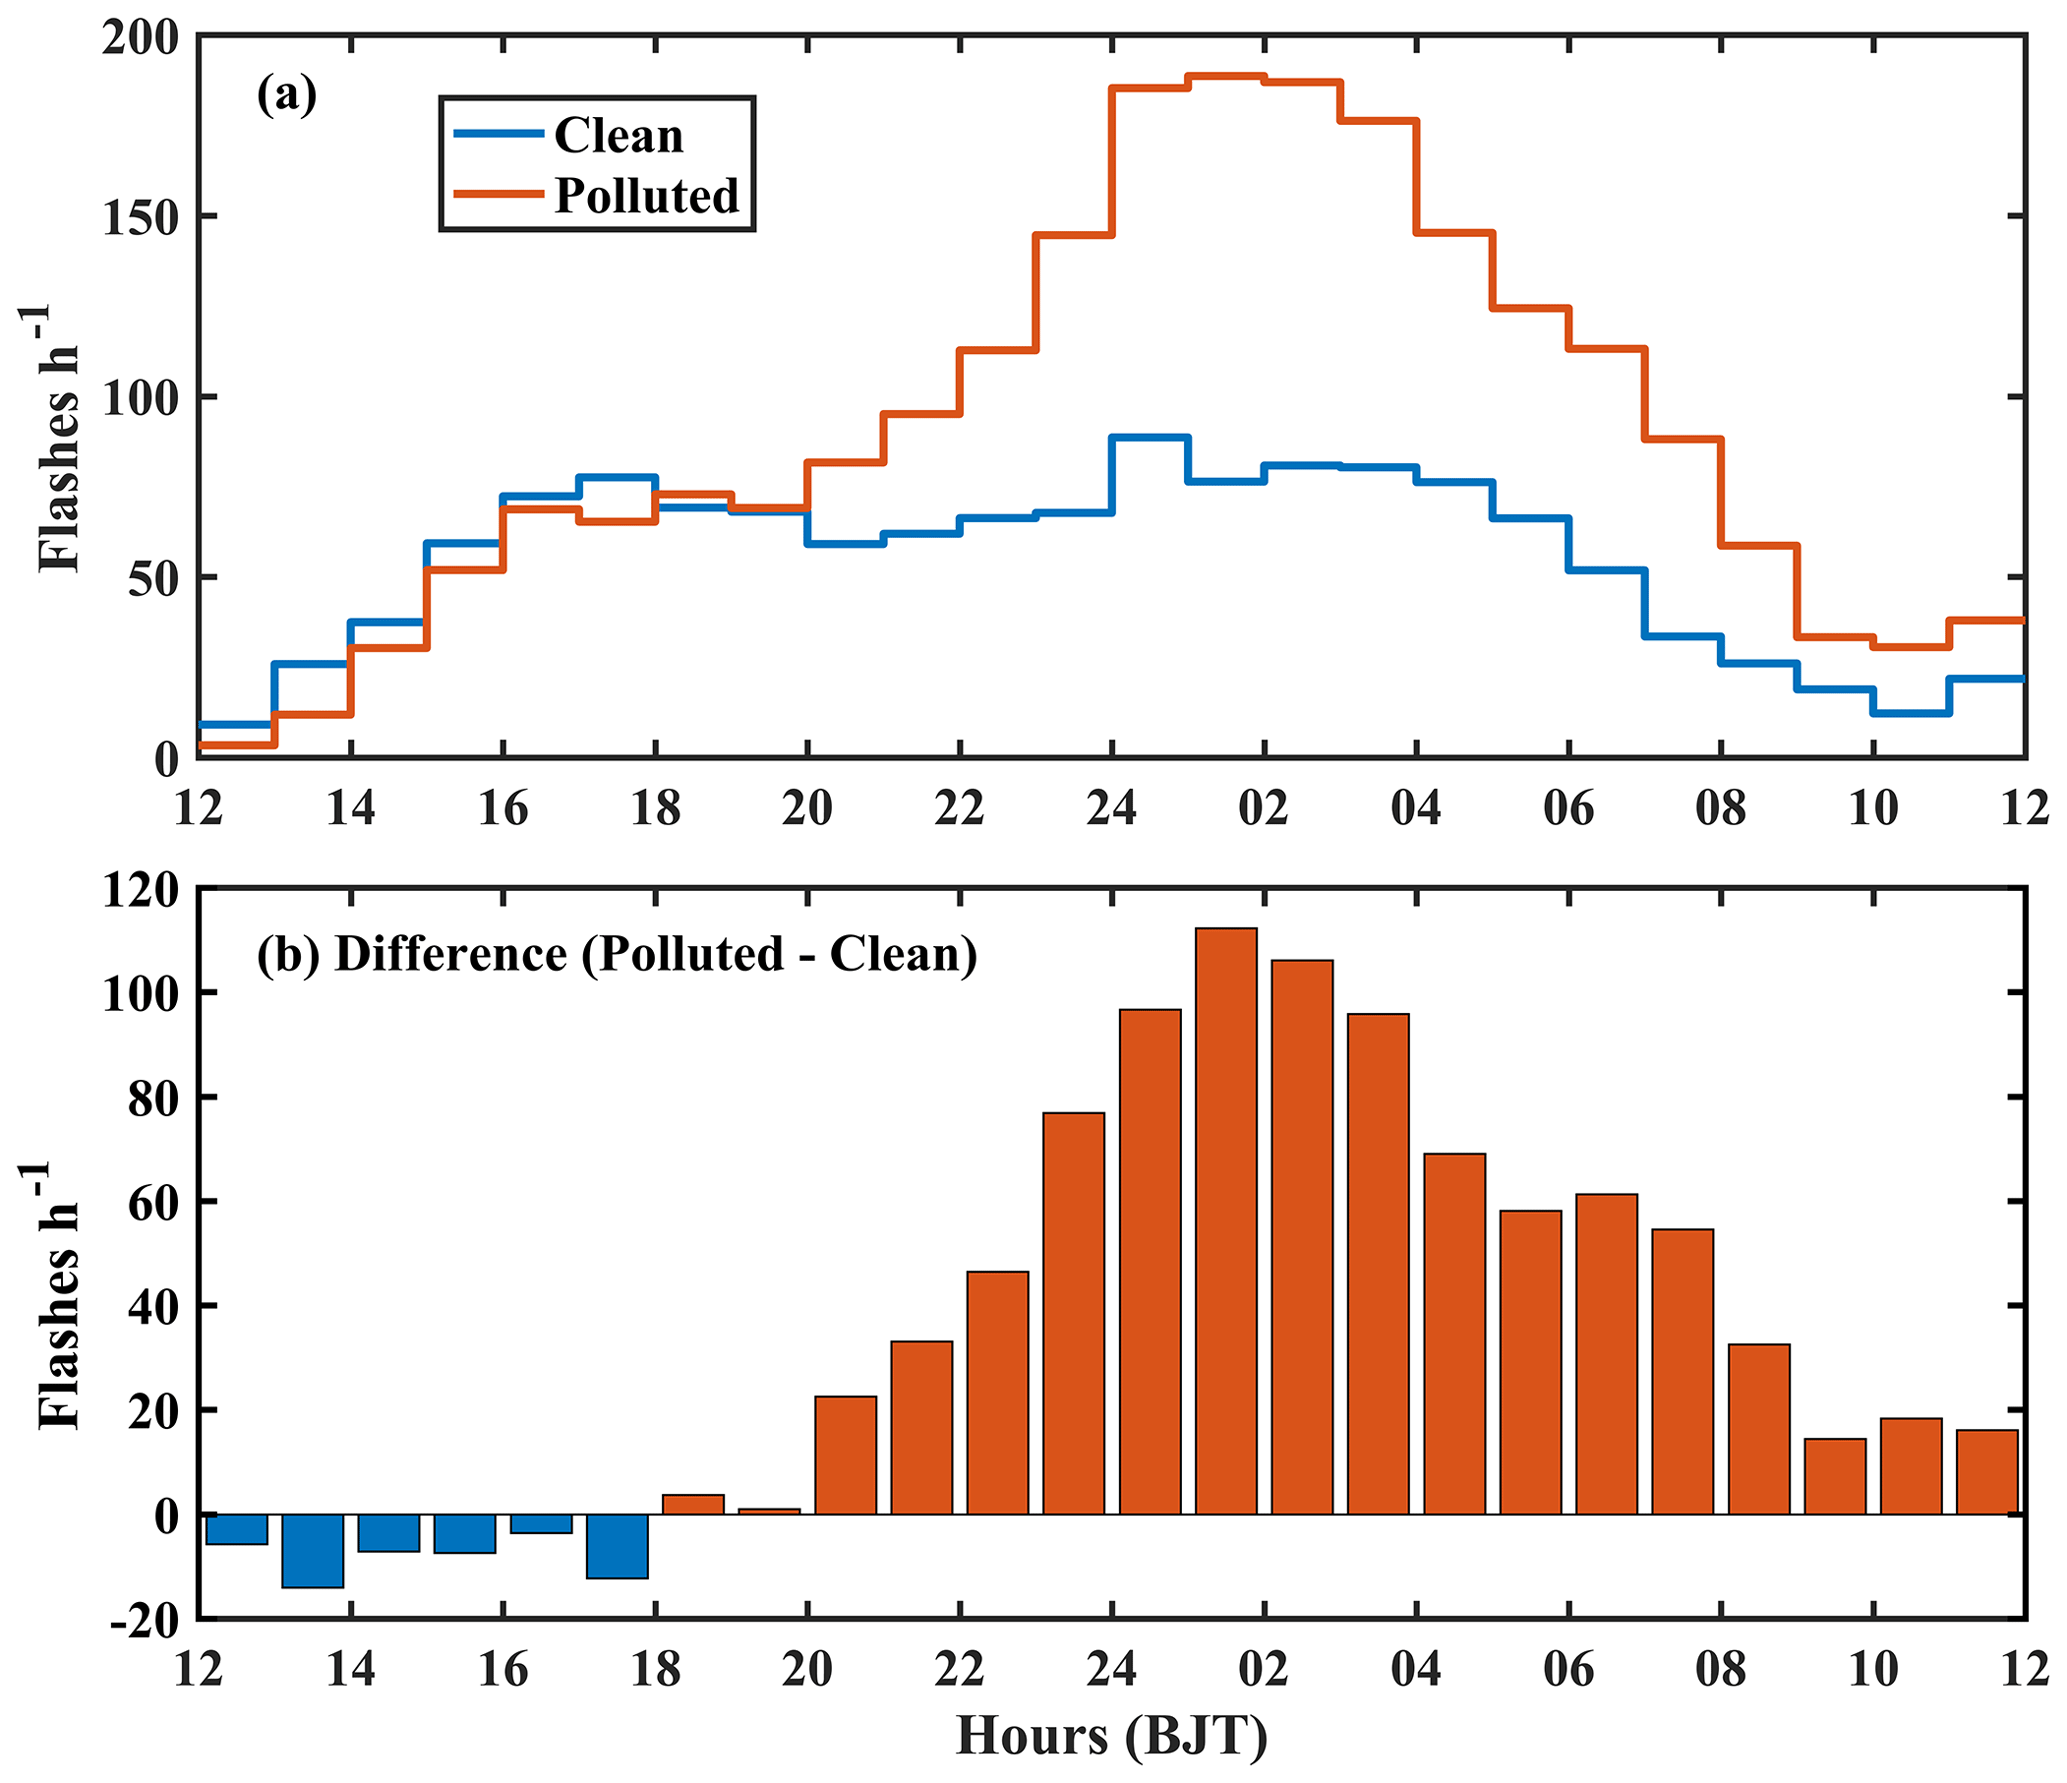
Figure 5(a) The diurnal variations in lightning flashes (unit: flashes h−1) under clean and polluted subsets over the study region during the summer (June, July, and August) season of 2010–2018. (b) The histogram of the difference in CG lightning flashes between polluted and clean subset.
3.2 Changes in lightning flashes associated with aerosols
The hourly variation of lightning flashes is first shown for the clean and polluted subset in Fig. 5a. The histograms of the differences between polluted and clean days are also given (Fig. 5b). On the clean subset, the diurnal variation of lightning flashes shows a peak lasting from 17:00–01:00 BJT. In the polluted subset, the diurnal variation of lightning flashes has one apparent peak, which appears in 24:00–03:00 BJT. Except from 12:00 to 18:00 BJT, the lightning flashes in the polluted subset are larger than those in the clean subset. The difference in lightning flashes between the polluted and clean subsets is largest during 23:00–05:00 BJT and smallest during 12:00–18:00 BJT (as shown in Fig. 5b). These results indicate that the changes in aerosol loading may lead to changes in the diurnal variation of lightning activity. The responses of the lightning flashes to aerosol loading are also different at different times of the day. In the afternoon (12:00–18:00 BJT), adding aerosols tends to decrease lightning flashes slightly. The rest of the time, adding aerosols tends to increase lightning flashes. Note that the difference in the averaged lightning flashes between polluted and clean subsets is relatively small during the afternoon (12:00–18:00 BJT) but is relatively large during (23:00–05:00 BJT). Note that the results found in Fig. 5 are based on regional averages. In Fig. 4, we can find that the spatial distribution of lightning flashes in the study region is distinctly different at different times of the day. Therefore, the response of lightning flashes to aerosol loading may be spatially distinct in different periods. Figure 6 presents the difference in the lightning flashes in polluted and clean subsets (polluted–clean) with a spatial resolution of . Some statistics are also given in Fig. 6. The differences in most (70 %–90 %) study regions are positive between 18:00–12:00 BJT. Between 12:00–15:00 BJT, the differences in most (71.4 %) study regions are negative. Between 15:00–18:00 BJT, the areas with positive (41.4 %) and negative (58.6 %) differences are similar. The differences in the lightning flashes between polluted and clean subsets are relatively small between 09:00 and 21:00 BJT. The absolute value of the differences in most grids during this period is less than one flash h−1 gird−1. During 21:00–09:00 BJT, the difference in the lightning flashes between polluted and clean subsets becomes larger in more areas. In this period, the most obvious change of lightning flashes is mainly concentrated in the south and northwest of the study region (Fig. 6d, i, j, and k). The above results indicate that the response of CG lightning flashes to aerosol loading has apparent spatial distribution differences at different times of the day. The response of total CG lightning flashes to aerosol loading is more significant between 21:00 and 06:00 BJT but changes little in other periods. This is consistent with the results found in Fig. 5. We also check the diurnal cycle of lightning flashes in polluted and clean subsets, respectively (Figs. S3 and S4). In general, the spatial distribution of lightning flashes under polluted and clean subsets is similar, especially between 18:00 and 06:00 BJT. We speculate that the spatial distribution of lightning flashes in the study region is mainly controlled by terrain and meteorological conditions, and aerosol may have little impact on its spatial distribution. The difference brought by aerosols may be mainly reflected in the time difference.
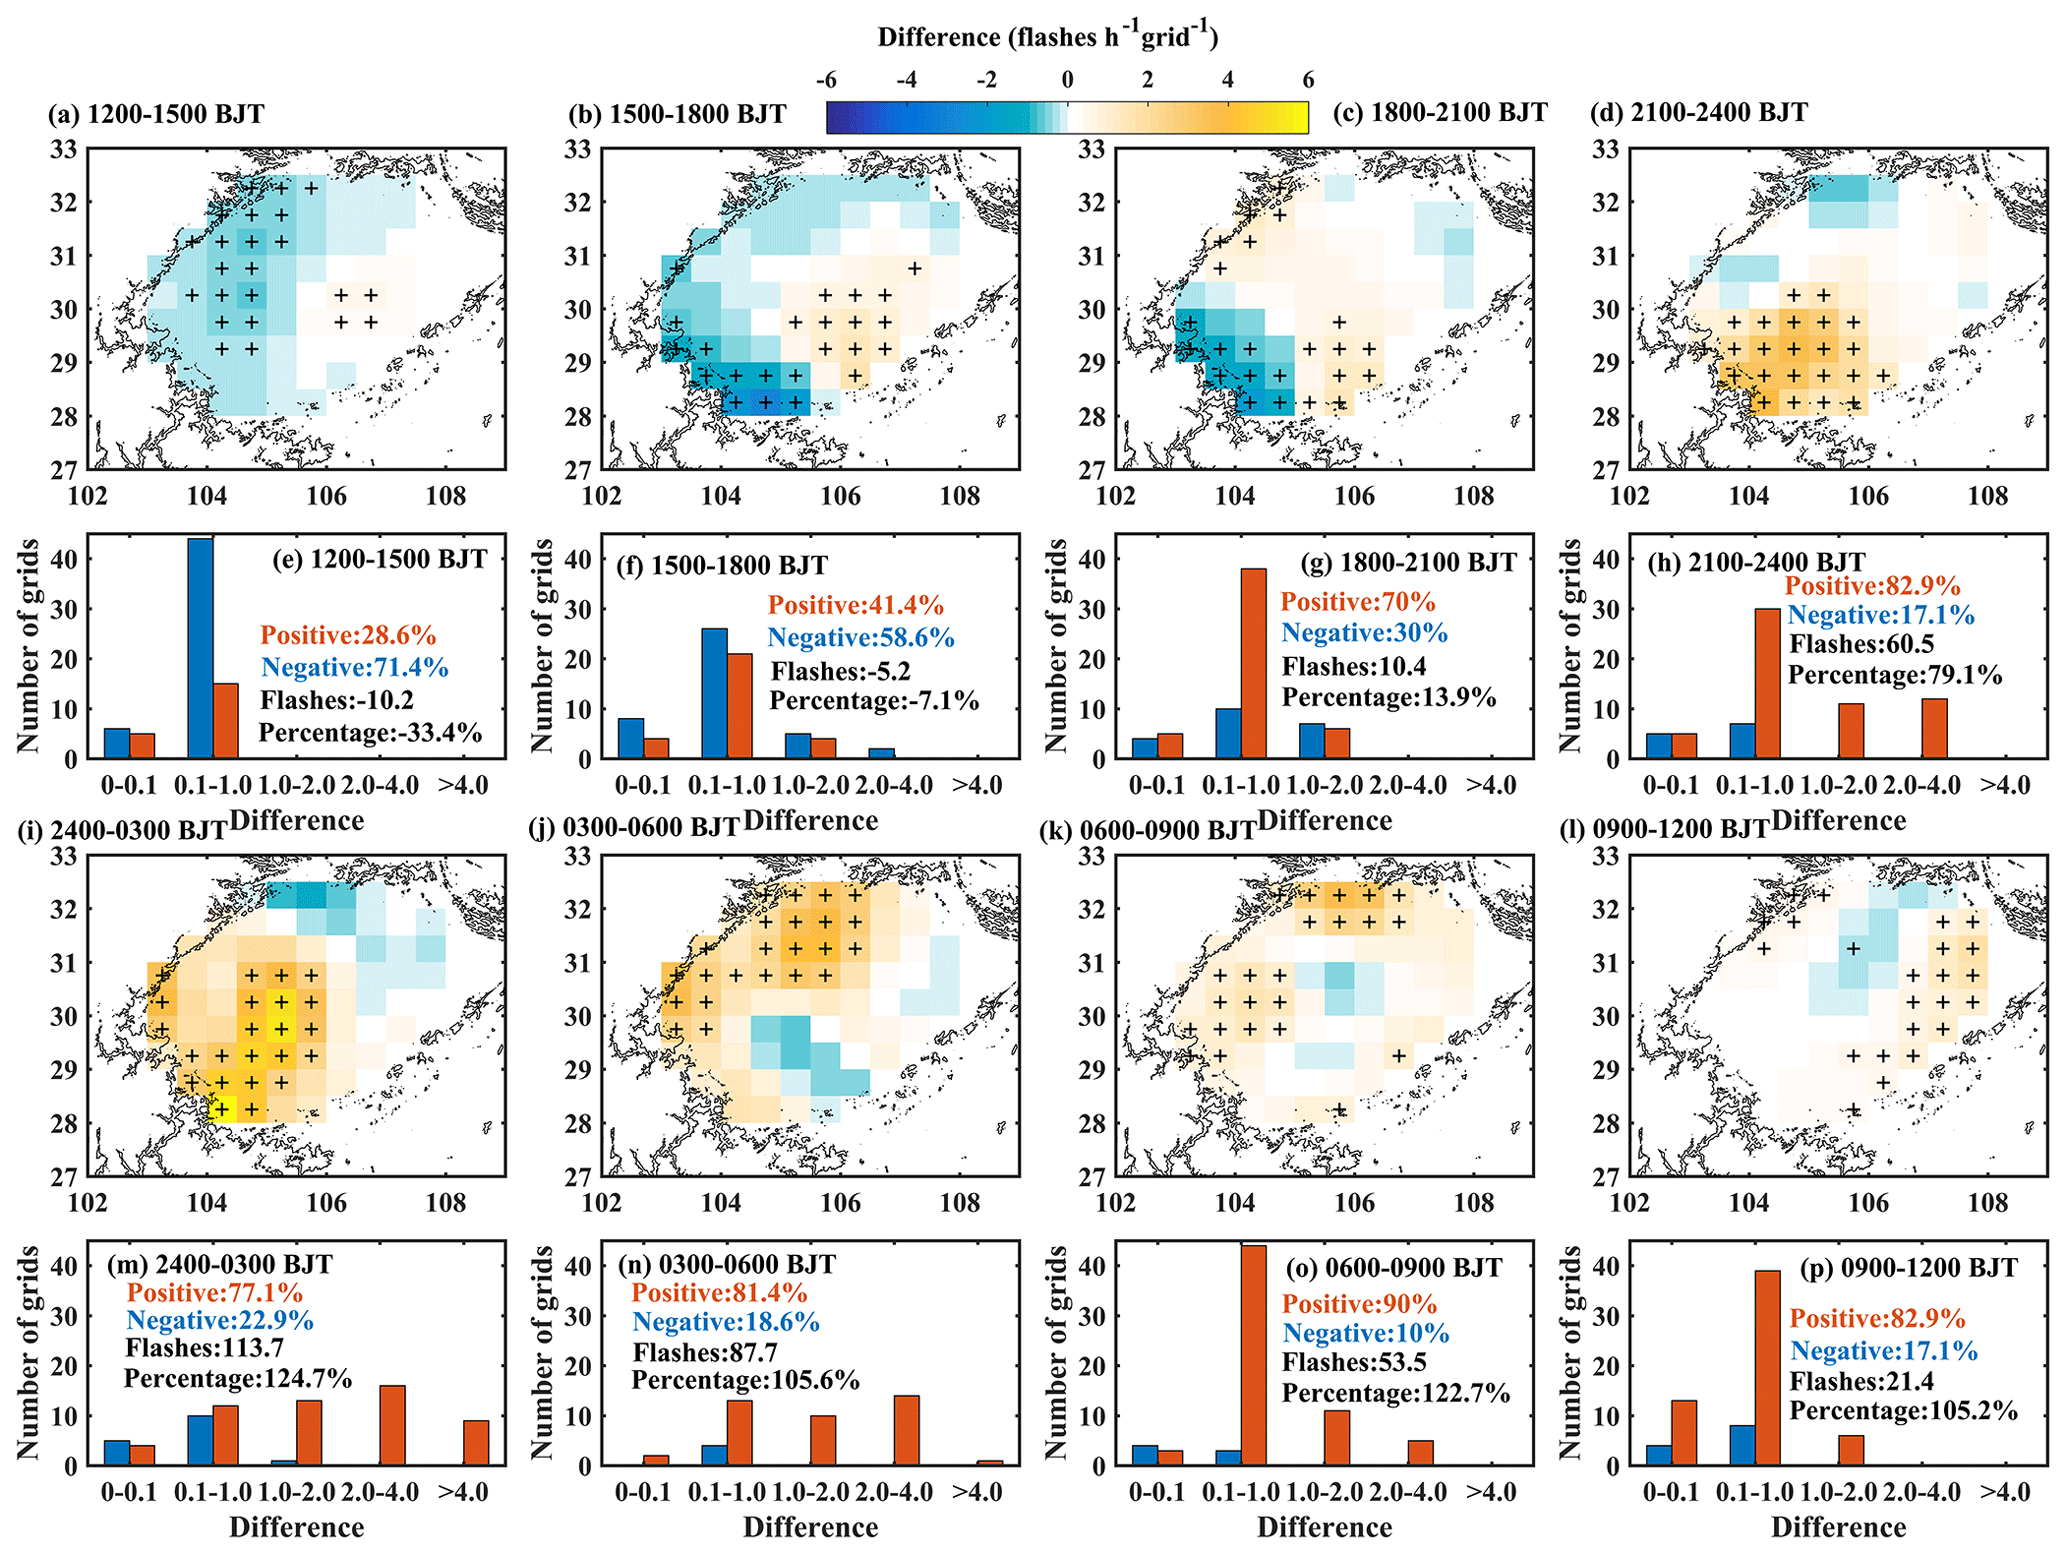
Figure 6(a–d, i–l) Diurnal changes of total CG lightning flash differences (unit: flashes h−1) between polluted and clean subset (polluted–clean) during the study period with an interval of 3 h (BJT). The 1500 m altitude line is shown with black lines to highlight the location of the basin. The spatial resolution is . Warm (cold) colours in the figure mean more (less) lightning flashes in the polluted subset. Plus signs denote those grids with relatively large difference in lightning flashes (the absolute value of difference in lightning flashes ranks in the top third). (e–h, m–p) Histograms of the differences (red: positive, blue: negative) between lightning flashes in the polluted and clean subsets. The percentages of grids with the positive (negative) difference in the total grids, the total change of lightning flashes, and its percentage are also given.
Based on the above results, we can find that the response of CG lightning flashes to aerosol loading in the study region is different at different times of the day. The most apparent difference exists between the afternoon and the rest of the time. In the next section, we select data in the afternoon (12:00–18:00 BJT) and in a period of time at night (23:00–05:00 BJT, hereafter simply referred to as night), when the difference in the lightning flashes between polluted and clean subsets is relatively large, to further investigate the relationships between lightning flashes and AOD, thermodynamic-dynamics, and cloud-related factors.
3.3 Correlation between lightning and AOD, dynamics-thermodynamics, and cloud-related factors
Figure 7 shows the relationships between lightning flashes and AOD in the afternoon (12:00–18:00 BJT) and at night (23:00–05:00 BJT). The AOD and lightning flashes show different nonlinear relationships in the afternoon and night. The lightning flashes first increase with the increase of AOD and then decrease when AOD exceeds about 0.3. At night, the lightning flashes also first increase with the increase of AOD but change little when AOD exceeds about 0.3. Some previous studies reported a nonlinear relationship between aerosols and lightning (i.e. Wang et al., 2018; Altaratz et al., 2010). When the aerosol loading is below a threshold, lightning increases with the increase of aerosol loading, but when the aerosol loading exceeds this threshold, the increase of aerosol may no longer cause significant changes in lightning and even inhibit lightning. The explanation for this phenomenon is that when the aerosol loading is relatively low, the aerosol microphysical effects may play the dominant role in promoting convection. When the aerosol loading further increases, the aerosol direct radiative effects become more marked and entangled with the aerosol microphysical effects, making the relationship between aerosols and lightning unclear, or the aerosol radiative effects dominate, leading to a decrease in convective intensity. In those studies, using AOD to characterize aerosol loading, this threshold is about AOD = 0.3 which is similar to the result found in Fig. 7.
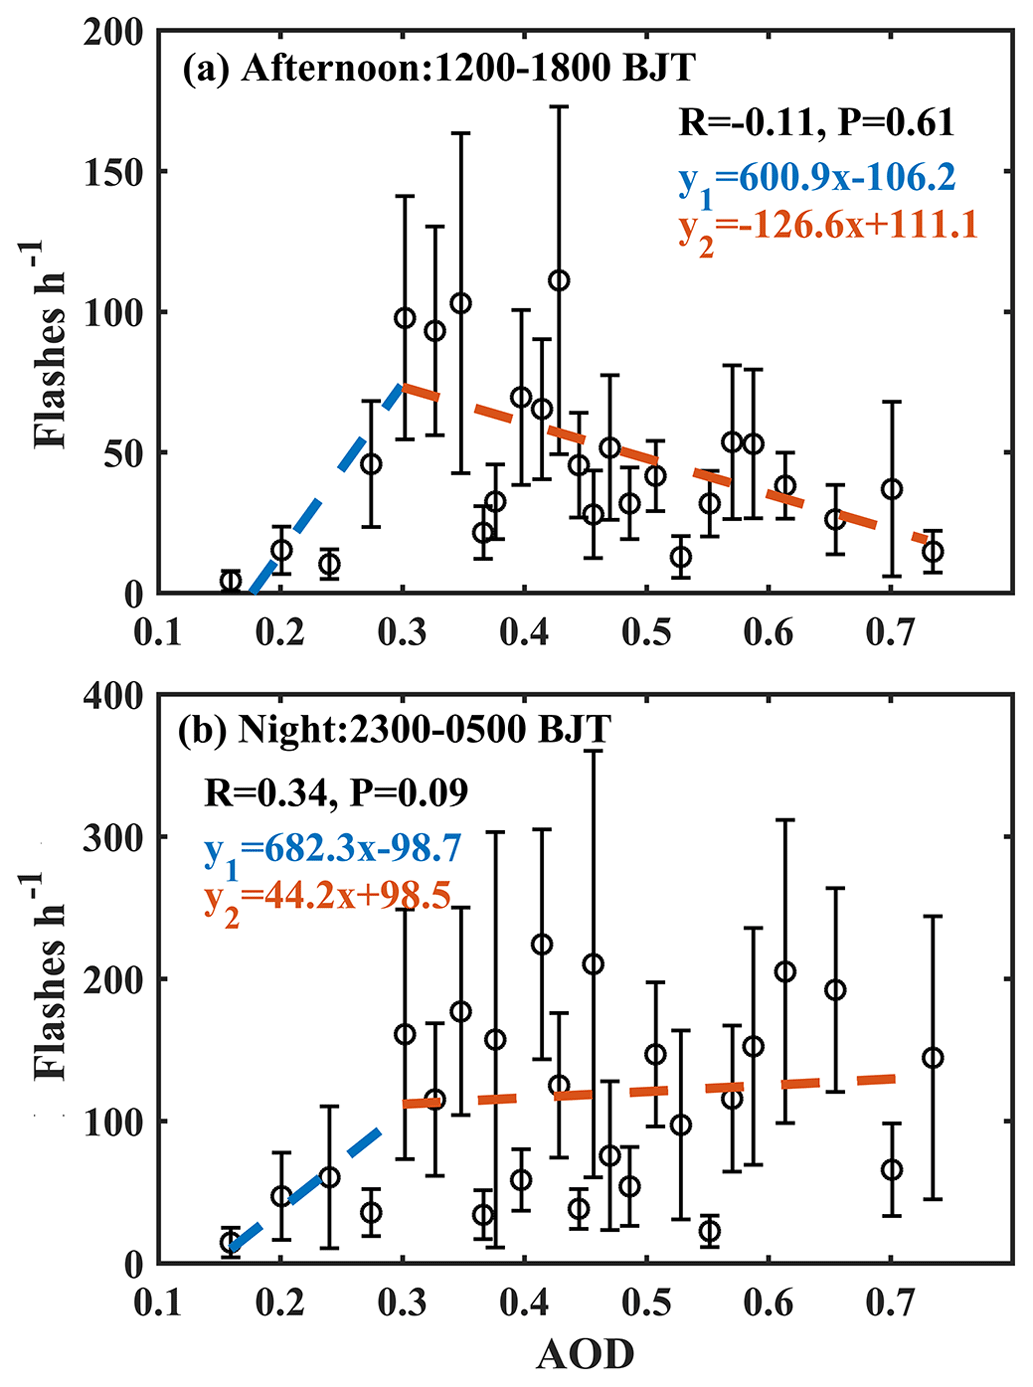
Figure 7Relationships between lightning flashes and AOD in (a) afternoon (12:00–18:00 BJT) and (b) night (23:00–05:00 BJT). Note that samples are first sorted by AOD and then samples with similar AOD were averaged to create the presented scatter plot. The max number of samples in each bin is equal to or less than 20. The difference between the maximum and minimum AOD values of samples in each bin is equal to or less than 0.05. An estimation of the uncertainty was calculated from the standard deviation of each bin divided by the square root of the number of data points in the bin. Linear-fit lines, Pearson correlation coefficients (R), and significant level (P) are also shown.
Figure 8 presents the relationships between lightning flashes and four dynamics-thermodynamics factors (T, CAPE, 850 to 700 hPa shear, and 500 to 400 hPa shear). A nonlinear relationship can be found in lightning flashes and T both in the afternoon and at night. The higher the surface temperature is, the more unstable the atmosphere tends to be, which is more conducive to the occurrence of convective activities. However, the promotion effect of T on lightning seems to reach saturation when the T is relatively high. This phenomenon is more obvious in the afternoon. Positive relationships are found between CAPE and CG lightning flashes in the afternoon (r=0.91) and at night (r=0.75). CAPE is a thermodynamics parameter that describes the potential buoyancy available to idealized rising air parcels and can denote the instability of the atmosphere (Riemann-Campe et al., 2009; Williams, 1992). A higher CAPE means that the atmosphere is more unstable and more likely to form thunderstorms. Many studies have reported a positive relationship between CAPE and lightning activity (Dewan et al., 2018; Murugavel et al., 2014; Pawar et al., 2012). Shear of 850 to 700 hPa is negatively correlated () with CG lightning flashes in the afternoon, but a positive relationship (r=0.71) between them is found at night. When considering the 500 to 400 hPa shear, negative relationships between them were both found in the afternoon () and at night (R=0.70). The vertical wind shear affects the dynamic flow structures around and within a deep convective cloud (Coniglio et al., 2006). Some studies have reported a negative relationship between vertical wind shear and lightning (i.e. Wang et al., 2018; Zhao et al., 2020). Our result is consistent with their findings. However, at night, the relationship between 500 to 400 hPa shear and lightning flashes differs from those studies. Vertical wind shear can suppress vertical cloud development for isolated convection (Richardson et al., 2007). However, low-tropospheric and mid-tropospheric wind shear is critical in organizing mesoscale convection systems, especially for squall lines (Coniglio et al., 2006; Takemi, 2007). From the results found in Fig. 4, we can know that the spatial distribution of lightning flashes in the study area is significantly different at different times. The lightning distributions in the afternoon and at night are different, which may lead to differences in the structure of thunderstorm activities during the two periods. This may result in the different relationship between 850 to 700 hPa shear and lightning in these two periods. For 500 to 400 hPa shear, the relationship between vertical wind shear and lightning does not vary much between the day and night periods.
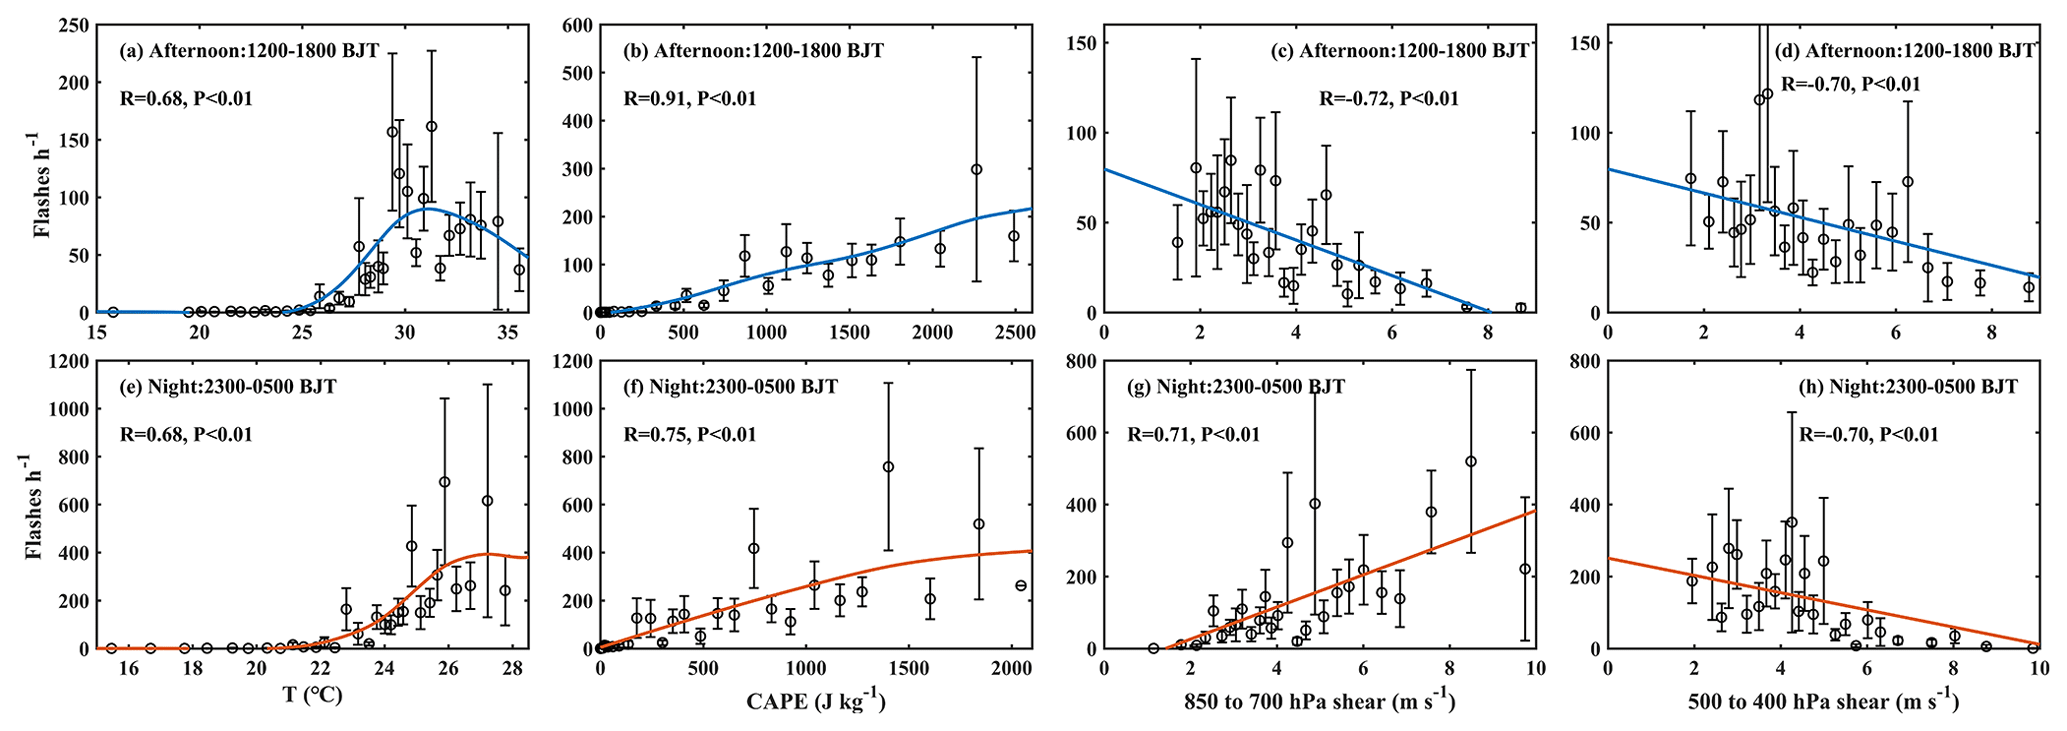
Figure 8Relationships between lightning flashes and dynamics-thermodynamics factors: (a, e) 2 m temperature (T, unit: ∘), (b, f) convective available potential energy (CAPE, unit: J kg−1), (c, g) low troposphere (850 to 700 hPa) vertical wind shear (850 to 700 hPa shear, unit: m s−1), and middle troposphere (500 to 400 hPa) vertical wind shear (500 to 400 hPa, unit: m s−1) in the afternoon (12:00–18:00 BJT) and night (23:00–05:00 BJT). Note that samples are first sorted by the variable on the x axis and then samples with similar values of the x variable were averaged. The max number of samples in each bin is equal to or less than 20. The difference between the maximum and minimum T, CAPE, 850 to 700 hPa shear, and 500 to 400 hPa shear values of samples in each bin is equal to or less than 0.5, 200, 2, and 2. An estimation of the uncertainty was calculated from the standard deviation of each bin divided by the square root of the number of data points in the bin. Smoothing spline-fit curves, Pearson correlation coefficients (R), and significant level (P) are also shown in each panel.
Figure 9 shows the relationships between CG lightning flashes and two cloud-related factors (TCLW and TCIW). A nonlinear relationship is found between lightning flashes and TCLW in the two periods (Fig. 9a and c). The CG lightning flashes increase with the increase of TCLW when the TCLW is relatively low (≲ 0.1 kg m−2) but decrease with the rise of TCLW when its value exceeds about 0.1 kg m−2. With the updraft, increasing cloud liquid water can provide more liquid water to the mixed-phase region of the cloud to form more supercooled water and ice particles, which fuels lightning activity. However, too much cloud liquid water may promote warm cloud precipitation rather than from convection and lightning activities. For TCIW, a nonlinear relationship (R=0.11) between lightning flashes and TCIW is also found in the afternoon (Fig. 9b). A positive relationship (r=0.85) between them is found at night (Fig. 9d). Lightning development mainly depends on the noninductive electrification of the collision and separation between graupel and ice crystals in the presence of supercooled water. The more ice particles, the stronger the lightning activity may be. It should be noted that when the TCIW is less than about 0.05 kg m−2, the positive relationship between TCIW and lightning flashes is robust (both in the afternoon and at night). When the TCIW is greater than 0.05 kg m−2, the relationship between TCIW and lightning flashes becomes more dispersed and the uncertainties in each bin become larger. But in general, lightning flashes are more under conditions with more TCIW.

Figure 9Same as in Fig. 8, but for the (a, c) lightning flashes total column cloud liquid water (TCLW, unit: kg m−2) and (b, d) lightning flashes total column ice water (TCIW, unit: kg m−2). Samples are first sorted by the variable on the x axis and then samples with similar values of the x variable were averaged. The max number of samples in each bin is equal to or less than 20. The difference between the maximum and minimum (a, c) TCLW and (b, d) TCIW values of samples in each bin is equal to or less than 0.05 and 0.01. An estimation of the uncertainty was calculated from the standard deviation of each bin divided by the square root of the number of data points in the bin. Smoothing spline-fit curves, Pearson correlation coefficients (R), and significant level (P) are also shown in each panel.
3.4 Possible reasons for the difference between the effects of aerosols on lightning flashes in the afternoon and at night
Based on the above analysis, when the AOD is relatively large (≳ 0.3), a significant difference can be found in the relationship between AOD and lightning flashes in the afternoon and at night. This part further analyses the possible causes of this difference.
Figure 10 shows the relationship in AOD-T, TCLW-T, TCIW-T, and AOD-TCLW. In the afternoon, AOD is negatively () correlated with T (Fig. 10a). At night, no obvious relationship () between them can be found (Fig. 10e). We speculate that high aerosol loading leads to strong aerosol direct radiative effects. Excessive aerosol loading reduces the solar radiation reaching the ground by absorbing and scattering solar radiation, thus reducing the temperature of the ground below the aerosol layer. At night, solar radiation is absent; thus, direct radiative effects are small and their impact on surface temperature is minimal. In general, TCLW was negatively (afternoon: , night: ) correlated with T in the afternoon and at night (Fig. 10b and f). However, it is worth noting that when TCLW is less than about 0.1 kg m−2, the relationship between TCLW and T is insignificant in the afternoon, while at night, TCLW is positively correlated with T. For TCLW > 0.1 kg m−2, an increase in TCLW leads to a decrease in T both in the afternoon and at night. An increase in the amount of liquid water in clouds means thicker and wider clouds which will block more solar radiation from reaching the ground, thus reducing the surface temperature (Robinson et al., 2002). Too much liquid water in the cloud may also promote warm-rain processes. The precipitation falling to the ground will reduce the surface temperature through evaporation (Pan et al., 2004). On the other hand, the increase in surface temperature will strengthen the updraft, so that more water vapour will be transmitted upward to form more cloud liquid water. In the afternoon, for TCLW > 0.1 kg m−2, the change in T with increases in TCLW is small as both factors are in play. When the TCLW is relatively high (≳ 0.1 kg m−2), increase cloud liquid water forms more cloud and precipitation, thus decreasing surface temperature. At night, the absence of solar radiation reduces the reduction of clouds to surface temperature. For TCLW < 0.1 kg m−2, the increase in surface temperature with cloud liquid water content is dominant. When the TCLW exceeds a certain value (≳ 0.1 kg m−2), increasing cloud liquid water will decrease the surface temperature through precipitation and evaporation. In the afternoon, TCIW is negatively correlated () with T (Fig. 10c), whereas at night, the TCIW has no obvious relationship (R=0.33) with T (Fig. 10g). In the afternoon, increasing TCIW is conducive to forming more ice-phase clouds which block more solar radiation from reaching the ground, thus reducing the surface temperature. At night, the absence of solar radiation weakens this impact of TCIW on the surface temperature, resulting in no obvious relationship between TCIW and T. AOD is positively correlated (afternoon: R=0.91, night: R=0.91) with TCLW in the afternoon and at night (Fig. 10d and h). By acting as CCN, increasing aerosol concentration will produce more but smaller cloud droplets, thus delaying the warm-rain process so that more liquid water can be retained in the cloud. In addition, the decrease in the cloud droplet size will increase the albedo of clouds, further enhancing the scattering effect of clouds on solar radiation. Therefore, we can speculate that the inhibition of aerosols on the surface temperature in the afternoon is not only through the direct radiation inhibition of aerosols, but also through the increase of cloud water content.
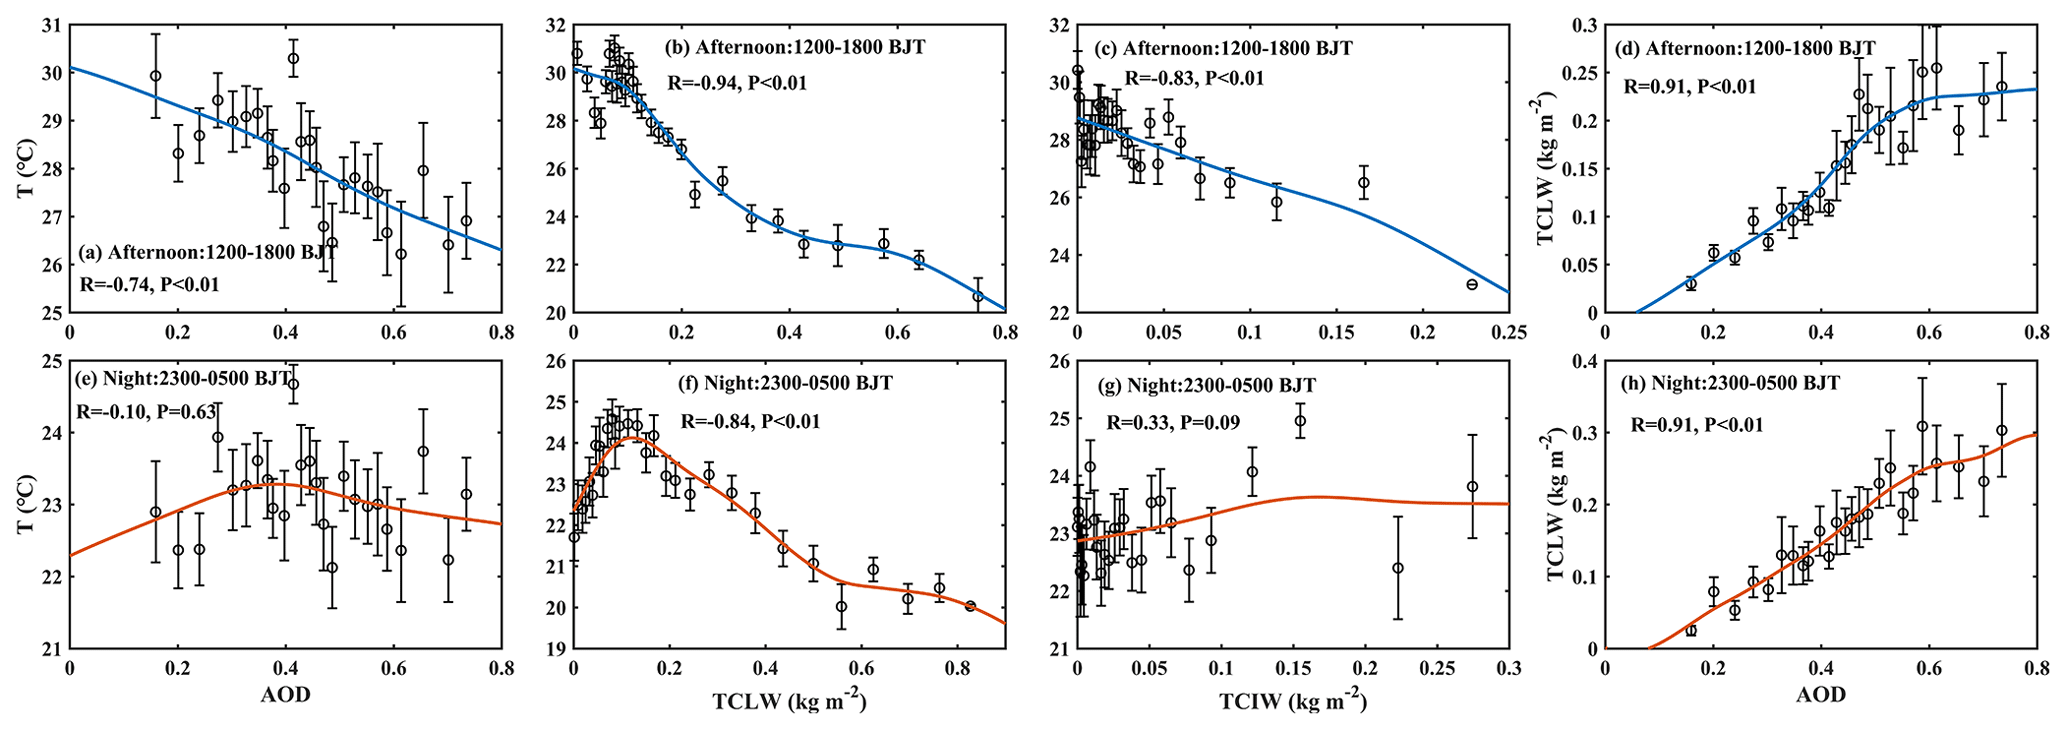
Figure 10Relationships in (a, e) AOD-T, (b, f) TCLW-T, (c, g) TCIW-T, and (d, h) AOD-TCLW in the afternoon (12:00–18:00 BJT) and night (23:00–05:00 BJT). Note that samples are first sorted by the variable on the x axis and then samples with similar values of the x variable were averaged to create the presented scatter plot. The max number of samples in each bin is equal to or less than 20. The difference between the maximum and minimum AOD, TCLW, and TCIW values of samples in each bin is equal to or less than 0.05, 0.05, and 0.01. An estimation of the uncertainty was calculated from the standard deviation of each bin divided by the square root of the number of data points in the bin. Smoothing spline-fit curves, Pearson correlation coefficients (R), and significant level (P) are also shown in each panel.
In summary, excessive aerosols will reduce the surface temperature in the afternoon, thereby increasing atmospheric stability and suppressing lightning. At night, however, the effect of aerosols on surface temperature is minor, and further increase of aerosols will not significantly inhibit lightning. Figure 11 shows a schematic diagram to summarize the possible difference in the effects of aerosols between afternoon and night found in this study. When the aerosol loading is relatively low (AOD ≲ 0.3), the microphysical stimulation of aerosols on convection may be dominant. Increasing aerosols will promote the development of convective activities and generate more lightning. This effect is consistent in the afternoon and at night. When aerosol loading is relatively high (AOD ≳ 0.3), the microphysical stimulation of aerosols reaches saturation, and the direct radiation effect of aerosols gradually increases. Because of the difference in solar radiation in the afternoon and at night, the influence of aerosols on lightning is different in the afternoon and at night. In the afternoon, the direct radiation effect of aerosols will reduce the solar radiation reaching the ground. On the other hand, the microphysical effects of aerosols will also increase cloud albedo, cloud cover, and cloud thickness, and reduce the solar radiation reaching the ground. Both of these two mechanisms will reduce the ground temperature, thereby increasing the stability of the atmosphere, inhibiting convective activities, and reducing lightning. At night, due to the absence of solar radiation, the indirect and direct effects of aerosol radiation and microphysical effects on solar radiation also become weak or absent. Thus, the inhibition of aerosols on lightning activity becomes weak at night. At this time, due to the saturation of the microphysical stimulation of aerosols on convection, further increase of aerosols will not cause significant changes in lightning.
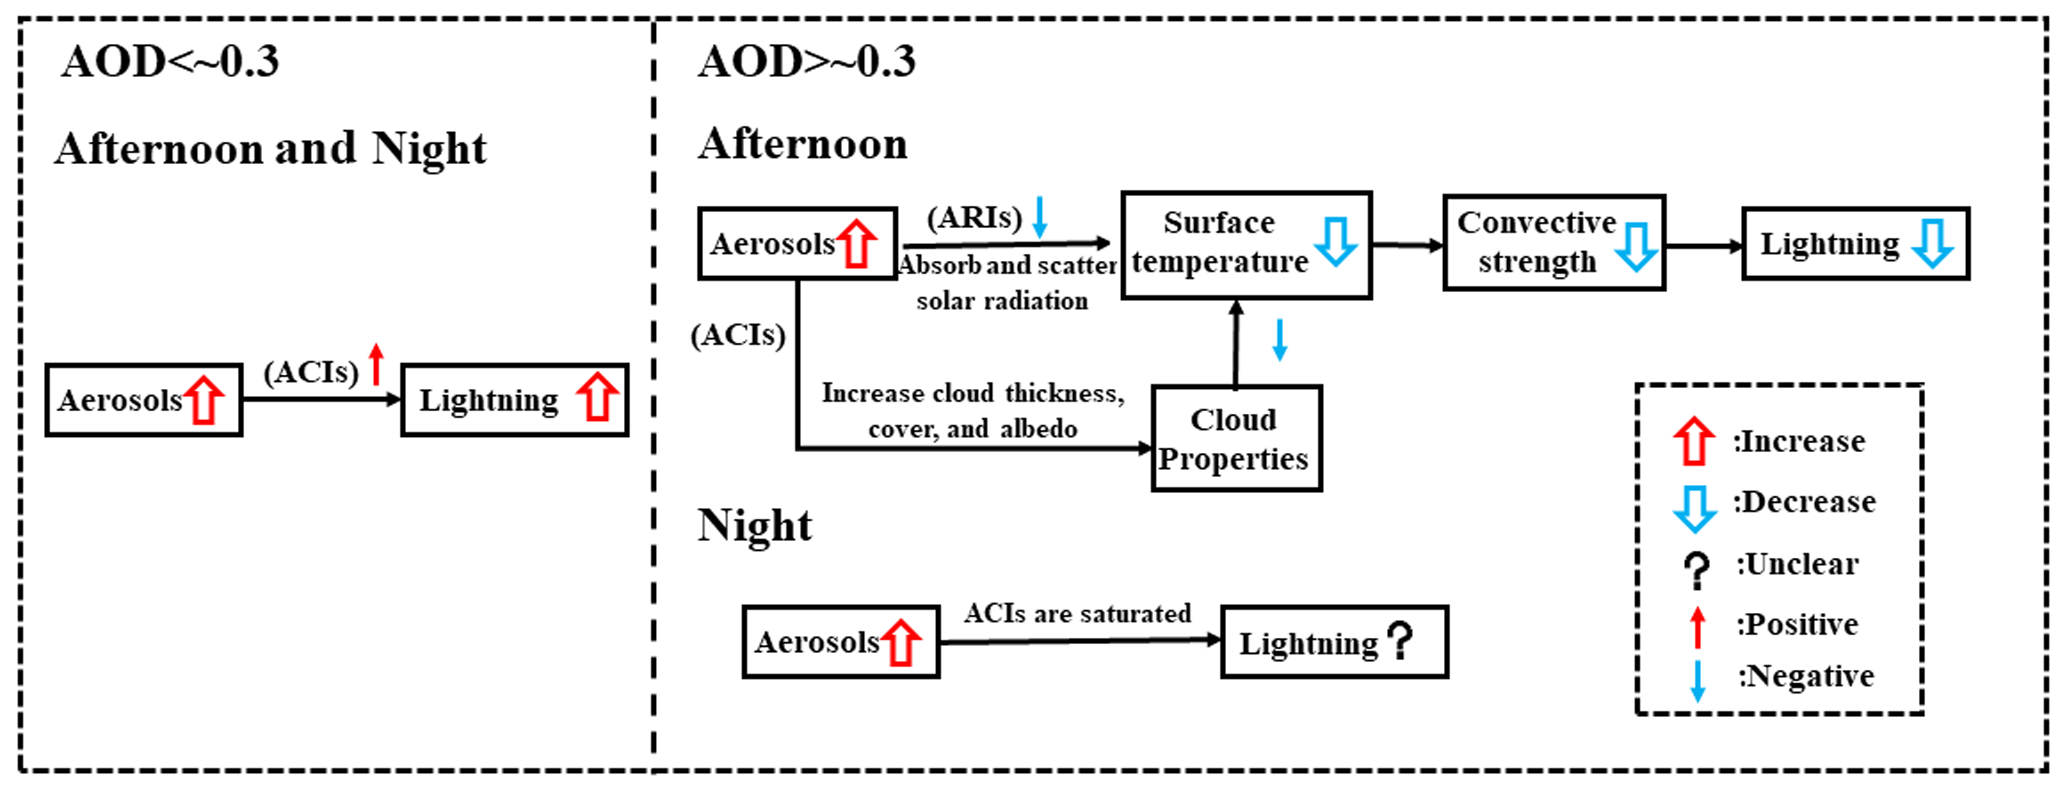
Figure 11Schematic diagram illustrating the difference in effects of aerosols on lightning activity in the afternoon (12:00–18:00 BJT) and at night (23:00–05:00 BJT) over the study region.
The influence of aerosols on lightning is quite complicated. Especially under the condition of high aerosol loading, the direct radiation effect and microphysical effect of aerosols counter each other and have different effects on lightning in combination with different environmental conditions. This study attempts to determine whether aerosols' impact on lightning is different during the day and at night. Due to the special terrain and environmental conditions, the Sichuan Basin has the unique characteristic of frequent lightning at night, and the aerosol loading in this region is also high. Based on this region, we investigated the response of lightning flashes to aerosols on an hourly scale and selected two time periods of the afternoon (12:00–18:00 BJT) and night (23:00–05:00 BJT) to investigate the influences of aerosols, thermodynamic factors, and cloud-related parameters on lightning. The data used for analysis in this paper include lightning flashes, AOD, T, CAPE, 850 to 700 hPa shear, 500 to 400 hPa shear, TCLW, and TCIW in summer seasons from 2010 to 2018. The main conclusions are as follows: under clean and polluted subsets, the diurnal variation and the number of lightning flashes are different. This signifies the potential impact of aerosols on lightning. The difference in lightning flashes between clean and polluted subsets is insignificant in the afternoon, but the difference is significant during the remainder of the period with more lightning flashes in the polluted subset. The difference in lightning flashes between polluted and clean subsets is also different in the spatial distribution in different time periods. Between 21:00 and 09:00 BJT, the most obvious differences were concentrated in the south and northwest parts of the study region, while the lightning differences in other time periods were not significant. We selected two time periods: the afternoon (12:00–18:00 BJT), when the solar radiation is relatively strong, and the night (23:00–05:00 BJT), when the solar radiation is absent, to investigate the influences of aerosols, thermodynamic factors, and cloud-related parameters on lightning in these two time periods over the Sichuan Basin, respectively. We found that the relationship between aerosols and lightning is nonlinear in both two time periods with a turning point at AOD ≅ 0.3. When the AOD is less than this threshold, the increase of AOD in two periods leads to an increase in lightning flashes. When the AOD exceeds this threshold, the increase of AOD in the afternoon causes a decrease in lightning flashes, while at night, the increase of AOD does not cause significant changes in lightning flashes. We further investigated the effects of aerosol and cloud-related parameters on surface temperature in these two time periods. We speculate that when the aerosol loading is relatively low (AOD ≲ 0.3), the microphysical effect of aerosols is dominant, and increasing aerosols will stimulate the development of convection and generate more lightning. When the aerosols loading is relatively high (AOD ≳ 0.3), the microphysical stimulation of aerosols on convection reaches saturation, and the direct radiative effect of aerosols becomes stronger. In addition, adding aerosols will also increase the ability of clouds (increase cloud thickness, cover, and albedo) by acting as cloud condensation nuclei to reduce the solar radiation reaching the ground. In the afternoon, the direct radiative effect of aerosols and the change of cloud properties will reduce the solar radiation reaching the ground, reduce the surface temperature, increase the atmospheric stability, and inhibit the development of convective activities. At night, the solar radiation disappears, and the influence of aerosols on the surface temperature is weakened. Therefore, increasing aerosols will not significantly inhibit lightning in this period.
Previous studies indicated that when the aerosol loading was relatively high, the aerosol types and environmental conditions would alter the impact of aerosols on lightning activity (i.e. Wang et al., 2018). In this paper, we highlight a new possible influencing factor: the diurnal variation of solar radiation. While this finding was discovered in the Sichuan Basin, the mechanism proposed should apply to many other regions in the world with similar environmental conditions.
As a caveat, the analysis of this study is based on limited measurements and reanalysis data. The detailed mechanisms behind these phenomena still need further research through analysis based on more comprehensive data and model simulations.
Processed data in the study and the CG lightning data are available from the first author upon request (whcis4@163.com). MERRA-2 aerosol data can be downloaded from https://doi.org/10.5067/KLICLTZ8EM9D (GMAO, 2015), and ERA5 data can be downloaded from https://doi.org/10.24381/cds.bd0915c6 (Hersbach et al., 2018a) and https://doi.org/10.24381/cds.adbb2d47 (Hersbach et al., 2018b). The LIS/OTD data can be downloaded from https://doi.org/10.5067/LIS/LIS/DATA306 (Albrecht et al., 2016). The MODIS data can be downloaded from https://doi.org/10.5067/MODIS/MYD08_D3.061 (Platnick et al., 2017a) and https://doi.org/10.5067/MODIS/MOD08_D3.061 (Platnick et al., 2017b).
The supplement related to this article is available online at: https://doi.org/10.5194/acp-23-2843-2023-supplement.
HW and YT designed the research ideas for this study. HW carried the out study and prepared the paper. ZS and NY provided the analysis ideas for the dynamics-thermodynamics and cloud-related parameters. TZ edited the paper.
The contact author has declared that none of the authors has any competing interests.
Publisher’s note: Copernicus Publications remains neutral with regard to jurisdictional claims in published maps and institutional affiliations.
We acknowledge the China Meteorological Administration (CMA) and China National Meteorological Center (CNMC) for providing CG lightning data. We also acknowledge the Goddard Modeling and Assimilation Office (GMAO) for providing MERRA-2 reanalysis data, Copernicus Climate Change Service (C3S) Climate Data Store (CDS) for providing ERA5 data, Goddard Space Flight Center (GSFC) for providing the MODIS product, and NASA Global Hydrology Resource Center DAAC for providing LIS/OTD data. We would also like to thank the anonymous reviewers for their thoughtful suggestions and comments.
This research has been supported by the National Key Research and Development Program of China (grant no. 2017YFC1501504), the National Natural Science Foundation of China (grant no. 41875003), the Open Research Program of the State Key Laboratory of Severe Weather (grant no. 2019LASW-A03), and the Open Grants of the State Key Laboratory of Severe Weather (grant no. 2021LASW-B05).
This paper was edited by Zhanqing Li and reviewed by three anonymous referees.
Albrecht, R., Goodman, S., Buechler, D., Blakeslee, R., and Christian, H.: LIS 0.1 Degree Very High Resolution Gridded Lightning Climatology Data Collection, NASA Global Hydrology Resource Center DAAC [data set], https://doi.org/10.5067/LIS/LIS/DATA306, 2016.
Altaratz, O., Koren, I., Yair, Y. Y., and Price, C. G.: Lightning response to smoke from Amazonian fires, Geophys. Res. Lett., 37, L07801, https://doi.org/10.1029/2010GL042679, 2010.
Altaratz, O., Kucieńska, B., Kostinski, A. B., Raga, G. B., and Koren, I.: Global association of aerosol with flash density of intense lightning, Environ. Res. Lett., 12, 114037, https://doi.org/10.1088/1748-9326/aa922b, 2017.
Bell, T. L., Rosenfeld, D., and Kim, K.: Weekly cycle of lightning: Evidence of storm invigoration by pollution, Geophys. Res. Lett., 36, L23805, https://doi.org/10.1029/2009GL040915, 2009.
Buchard, V., Randles, C. A., da Silva, A. M., Darmenov, A. S., Colarco, P. R., Govindaraju, R. C., Ferrare, R. A., Hair, J., Beyersdorf, A. J., Ziemba, L. D., and Yu, H.: The MERRA-2 Aerosol Reanalysis, 1980 Onward. Part II: Evaluation and Case Studies, J. Clim., 30, 6851–6872, https://doi.org/10.1175/JCLI-D-16-0613.1, 2017.
Chakraborty, R., Chakraborty, A., Basha, G., and Ratnam, M. V.: Lightning occurrences and intensity over the Indian region: long-term trends and future projections, Atmos. Chem. Phys., 21, 11161–11177, https://doi.org/10.5194/acp-21-11161-2021, 2021.
Chen, T., Li, Z., Kahn, R. A., Zhao, C., Rosenfeld, D., Guo, J., Han, W., and Chen, D.: Potential impact of aerosols on convective clouds revealed by Himawari-8 observations over different terrain types in eastern China, Atmos. Chem. Phys., 21, 6199–6220, https://doi.org/10.5194/acp-21-6199-2021, 2021.
Choi, Y., Wang, Y., Zeng, T., Martin, R. V., Kurosu, T. P., and Chance, K.: Evidence of lightning NOx and convective transport of pollutants in satellite observations over North America, Geophys. Res. Lett., 32, L02805, https://doi.org/10.1029/2004GL021436, 2005.
Coniglio, M., Stensrud, D. J., and Wicker, L. J.: Effects of Upper-Level Shear on the Structure and Maintenance of Strong Quasi-Linear Mesoscale Convective Systems, J. Atmos. Sci., 63, 1231–1252, https://doi.org/10.1175/JAS3681.1, 2006.
Cummins, K. L. and Murphy, M. J.: An Overview of Lightning Locating Systems: History, Techniques, and Data Uses, With an In-Depth Look at the U.S. NLDN, IEEE T. Electromagn. C., 51, 499–518, https://doi.org/10.1109/TEMC.2009.2023450, 2009.
Cummins, K. L., Murphy, M. J., Bardo, E. A., Hiscox, W. L., Pyle, R. B., and Pifer, A. E.: A Combined TOA/MDF Technology Upgrade of the U.S. National Lightning Detection Network, J. Geophys, Res., 103, 9035–9044, https://doi.org/10.1029/98JD00153, 1998.
Dayeh, M. A., Farahat, A., Ismail-Aldayeh, H. G., and Abuelgasim, A. A.: Effects of aerosols on lightning activity over the Arabian Peninsula, Atmos. Res., 261, 105723, https://doi.org/10.1016/J.ATMOSRES.2021.105723, 2021.
Dewan, A. M., Ongee, E. T., Rafiuddin, M., Rahman, M. M., and Mahmood, R.: Lightning activity associated with precipitation and CAPE over Bangladesh, Int. J. Climatol., 38, 1649–1660, https://doi.org/10.1002/joc.5286, 2018.
Fan, J., Wang, Y., Rosenfeld, D., and Liu, X.: Review of Aerosol–Cloud Interactions: Mechanisms, Significance, and Challenges, J. Atmos. Sci., 73, 4221–4252, https://doi.org/10.1175/JAS-D-16-0037.1, 2016.
Gelaro, R., McCarty, W., Suárez, M. J., Todling, R., Molod, A., Takacs, L., Randles, C. A., Darmenov, A. S., Bosilovich, M. G., Reichle, R. H., Wargan, K., Coy, L., Cullather, R. I., Draper, C., Akella, S., Buchard, V., Conaty, A., Silva, A. M., Gu, W., Kim, G., Koster, R. D., Lucchesi, R., Merkova, D., Nielsen, J. E., Partyka, G., Pawson, S., Putman, W. M., Rienecker, M. M., Schubert, S., Sienkiewicz, M., and Zhao, B.: The Modern-Era Retrospective Analysis for Research and Applications, Version 2 (MERRA-2), J. Climate., 30, 5419–5454, https://doi.org/10.1175/JCLI-D-16-0758.1, 2017.
GMAO: Modeling and Assimilation Office (GMAO), MERRA-2 tavg1_2d_aer_Nx: 2d,1-Hourly,Time-averaged,Single-Level,Assimilation,Aerosol Diagnostics V5.12.4, Greenbelt, MD, USA, Goddard Earth Sciences Data and Information Services Center (GES DISC) [data set], https://doi.org/10.5067/KLICLTZ8EM9D, 2015.
Guo, J., Deng, M., Lee, S., Wang, F., Li, Z., Zhai, P., Liu, H., Lv, W., Yao, W., and Li, X.: Delaying precipitation and lightning by air pollution over the Pearl River Delta. Part I: Observational analyses, J. Geophys. Res.-Atmos., 121, 6472–6488, https://doi.org/10.1002/2015JD023257, 2016.
Hersbach, H., Bell, B., Berrisford, P., Biavati, G., Horányi, A., Muñoz Sabater, J., Nicolas, J., Peubey, C., Radu, R., Rozum, I., Schepers, D., Simmons, A., Soci, C., Dee, D., and Thépaut, J.-N.: ERA5 hourly data on pressure levels from 1959 to present, Copernicus Climate Change Service (C3S) Climate Data Store (CDS) [data set], https://doi.org/10.24381/cds.bd0915c6, 2018a.
Hersbach, H., Bell, B., Berrisford, P., Biavati, G., Horányi, A., Muñoz Sabater, J., Nicolas, J., Peubey, C., Radu, R., Rozum, I., Schepers, D., Simmons, A., Soci, C., Dee, D., and Thépaut, J.-N.: ERA5 hourly data on single levels from 1959 to present, Copernicus Climate Change Service (C3S) Climate Data Store (CDS) [data set], https://doi.org/10.24381/cds.adbb2d47, 2018b.
Hersbach, H., de Rosnay, P., Bell, B., Schepers, D., Simmons, A., Soci, C., Abdalla, S., AlonsoBalmaseda, M., Balsamo, G., Bechtold, P., Berrisford, P., Bidlot, J.-R., de Boisséson, E., Bonavita, M., Browne, P., Buizza, R., Dahlgren, P., Dee, D., Dragani, R., Diamantakis, M., Flemming, J., Forbes, R., Geer, A. J., Haiden, T., Hólm, E., Haimberger, L., Hogan, R., Horányi A., Janiskova, M., Laloyaux, P., Lopez, P., Munoz-Sabater, J., Peubey, C., Radu, R., Richardson, D., Thépaut, J.-N., Vitart, F., Yang, X., Zsótér, E., and Zuo, H.: Operational global reanalysis: progress, future directions and synergies with NWP, ERA Report Series 27, ECMWF, Shinfield Park, Reading, UK, https://doi.org/10.21957/tkic6g3wm, 2018c.
Hersbach, H., Bell, B., Berrisford, P., Hirahara, S., Horányi, A., Muñoz-Sabater, J., Nicolas, J., Peubey, C., Radu, R., Schepers, D., Simmons, A., Soci, C., Abdalla, S., Abellan, X., Balsamo, G., Bechtold, P., Biavati, G., Bidlot, J., Bonavita, M., Chiara, G. D., Dahlgren, P., Dee, D., Diamantakis, M., Dragani, R., Flemming, J., Forbes, R. G., Fuentes, M., Geer, A. J., Haimberger, L., Healy, S. B., Hogan, R. J., Holm, E. V., Janisková, M., Keeley, S. P., Laloyaux, P., Lopez, P., Lupu, C., Radnoti, G., Rosnay, P. D., Rozum, I., Vamborg, F., Villaume, S., and Thepaut, J.: The ERA5 global reanalysis, Q. J. Roy. Meteor. Soc., 146, 1999–2049, https://doi.org/10.1002/qj.3803, 2020.
Holle, R. L., Dewan, A. M., Said, R. K., Brooks, W. A., Hossain, M. F., and Rafiuddin, M.: Fatalities related to lightning occurrence and agriculture in Bangladesh, Int. J. Disast. Risk. Re., 41, 101264, https://doi.org/10.1016/J.IJDRR.2019.101264, 2019.
Jayaratne, E. R., Saunders, C. P., and Hallett, J.: Laboratory studies of the charging of soft hail during ice crystal interactions, Q. J. Roy. Meteor. Soc., 109, 609–630, https://doi.org/10.1002/QJ.49710946111, 1983.
Jin, X., Wu, T., and Li, L. Z.: The quasi-stationary feature of nocturnal precipitation in the Sichuan Basin and the role of the Tibetan Plateau, Clim. Dynam., 41, 977–994, https://doi.org/10.1007/s00382-012-1521-y, 2012.
Kaufman, Y. J., Tanré, D., Holben, B. N., Mattoo, S., Remer, L. A., Eck, T. F., Vaughan, J., and Châtenet, B.: Aerosol Radiative Impact on Spectral Solar Flux at the Surface, Derived from Principal-Plane Sky Measurements, J. Atmos. Sci., 59, 635–646, https://doi.org/10.1175/1520-0469(2002)059<0635:ARIOSS>2.0.CO;2, 2002.
Kaufman, Y. J., Koren, I., Remer, L. A., Rosenfeld, D., and Rudich, Y.: The effect of smoke, dust, and pollution aerosol on shallow cloud development over the Atlantic Ocean, P. Natl. Acad. Sci. USA, 102, 11207–11212, https://doi.org/10.1073/PNAS.0505191102, 2005.
Khain, A. and Lynn, B. H.: Simulation of a supercell storm in clean and dirty atmosphere using weather research and forecast model with spectral bin microphysics, J. Geophys. Res., 114, D19209, https://doi.org/10.1029/2009JD011827, 2009.
Koren, I., Kaufman, Y. J., Remer, L. A., and Martins, J. V.: Measurement of the Effect of Amazon Smoke on Inhibition of Cloud Formation, Science, 303, 1342–1345, https://doi.org/10.1126/SCIENCE.1089424, 2004.
Koren, I., Martins, J. V., Remer, L. A., and Afargan, H.: Smoke Invigoration Versus Inhibition of Clouds over the Amazon, Science, 321, 946–949, https://doi.org/10.1126/science.1159185, 2008.
Kuniyal, J. C. and Guleria, R. P.: The current state of aerosol-radiation interactions: A mini review, J. Aerosol. Sci., 130, 45–54, https://doi.org/10.1016/J.JAEROSCI.2018.12.010, 2019.
Lal, D. M. and Pawar, S.: Effect of urbanization on lightning over four metropolitan cities of India, Atmos. Environ., 45, 191–196, https://doi.org/10.1016/J.ATMOSENV.2010.09.027, 2011.
Lal, D. M., Ghude, S. D., Mahakur, M., Waghmare, R. T., Tiwari, S., Srivastava, M. K., Meena, G. S., and Chate, D. M.: Relationship between aerosol and lightning over Indo-Gangetic Plain (IGP), India, Clim. Dynam., 50, 3865–3884, https://doi.org/10.1007/s00382-017-3851-2, 2017.
Li, J., Yu, R., and Zhou, T.: Seasonal Variation of the Diurnal Cycle of Rainfall in Southern Contiguous China, J. Clim., 21, 6036–6043, https://doi.org/10.1175/2008JCLI2188.1, 2008.
Li, X., Pan, Y., and Mo, Z.: Joint effects of several factors on cloud-to-ground lightning and rainfall in Nanning (China), Atmos. Res., 212, 23–32, https://doi.org/10.1016/J.ATMOSRES.2018.05.002, 2018.
Li, Z., Guo, J., Ding, A., Liao, H., Liu, J., Sun, Y., Wang, T., Xue, H., Zhang, H., and Zhu, B.: Aerosol and boundary-layer interactions and impact on air quality, Nat. Sci. Rev., 4, 810–833, https://doi.org/10.1093/nsr/nwx117, 2017a.
Li, Z., Rosenfeld, D., and Fan, J.: Aerosols and Their Impact on Radiation, Clouds, Precipitation, and Severe Weather Events. Oxford Research Encyclopedias, No. PNNL-SA-124900, https://doi.org/10.1093/acrefore/9780199389414.013.126, 2017b.
Liu, X., Chen, Q., Che, H., Zhang, R., Gui, K., Zhang, H., and Zhao, T.: Spatial distribution and temporal variation of aerosol optical depth in the Sichuan basin, China, the recent ten years, Atmos. Environ., 147, 434–445, https://doi.org/10.1016/J.ATMOSENV.2016.10.008, 2016.
Liu, Y., Guha, A., Said, R., Williams, E., Lapierre, J. L., Stock, M., and Heckman, S. J.: Aerosol Effects on Lightning Characteristics: A Comparison of Polluted and Clean Regimes, Geophys. Res. Lett., 47, L086825, https://doi.org/10.1029/2019GL086825, 2020.
Liu, Y., Williams, E. R., Li, Z., Guha, A., Lapierre, J. L., Stock, M., Heckman, S. J., Zhang, Y., and DiGangi, E. A.: Lightning Enhancement in Moist Convection With Smoke-Laden Air Advected From Australian Wildfires, Geophys. Res. Lett., 48, L092355, https://doi.org/10.1029/2020GL092355, 2021.
Mansell, E. R., MacGorman, D. R., Ziegler, C. L., and Straka, J. M.: Charge structure and lightning sensitivity in a simulated multicell thunderstorm, J. Geophys. Res., 110, D12101, https://doi.org/10.1029/2004JD005287, 2005.
Murray, N. D., Orville, R. E., and Huffines, G. R.: Effect of pollution from Central American fires on cloud-to-ground lightning in May 1998, Geophys. Res. Lett., 27, 2249–2252, https://doi.org/10.1029/2000GL011656, 2000.
Murugavel, P., Pawar, S., and Gopalakrishan, V.: Climatology of lightning over Indian region and its relationship with convective available potential energy, Int. J. Climatol., 34, 3179–3187, https://doi.org/10.1002/joc.3901, 2014.
Ning, G., Wang, S., Yim, S. H. L., Li, J., Hu, Y., Shang, Z., Wang, J., and Wang, J.: Impact of low-pressure systems on winter heavy air pollution in the northwest Sichuan Basin, China, Atmos. Chem. Phys., 18, 13601–13615, https://doi.org/10.5194/acp-18-13601-2018, 2018.
Pan, Z., Arritt, R. W., Takle, E. S., Gutowski, W. J., Anderson, C. J., and Segal, M.: Altered hydrologic feedback in a warming climate introduces a “warming hole”, Geophys. Res. Lett., 31, 17109, https://doi.org/10.1029/2004GL020528, 2004.
Pawar, S., Lal, D. M., and Murugavel, P.: Lightning characteristics over central India during Indian summer monsoon, Atmos. Res., 106, 44–49, https://doi.org/10.1016/J.ATMOSRES.2011.11.007, 2012.
Platnick, S., King, M., and Hubanks, P.: MYD08_D3 – MODIS/Aqua Aerosol Cloud Water Vapor Ozone Daily L3 Global 1Deg CMG, NASA MODIS Adaptive Processing System, Goddard Space Flight Center [data set], https://doi.org/10.5067/MODIS/MYD08_D3.061, 2017a.
Platnick, S., King, M., and Hubanks, P.: MOD08_D3 – MODIS/Terra Aerosol Cloud Water Vapor Ozone Daily L3 Global 1Deg CMG, NASA MODIS Adaptive Processing System, Goddard Space Flight Center [data set], https://doi.org/10.5067/MODIS/MOD08_D3.061, 2017b.
Randles, C. A., da Silva, A. M., Buchard, V., Colarco, P. R., Darmenov, A. S., Govindaraju, R. C., Smirnov, A., Holben, B. N., Ferrare, R. A., Hair, J., Shinozuka, Y., and Flynn, C. J.: The MERRA-2 Aerosol Reanalysis, 1980-onward, Part I: System Description and Data Assimilation Evaluation, J. Clim., 30, 6823–6850, https://doi.org/10.1175/JCLI-D-16-0609.1, 2017.
Richardson, Y. P., Droegemeier, K., and Davies-Jones, R. P.: The Influence of Horizontal Environmental Variability on Numerically Simulated Convective Storms. Part I: Variations in Vertical Shear, Mon. Weather. Rev., 135, 3429–3455, https://doi.org/10.1175/MWR3463.1, 2007.
Riemann-Campe, K., Fraedrich, K., and Lunkeit, F.: Global climatology of Convective Available Potential Energy (CAPE) and Convective Inhibition (CIN) in ERA-40 reanalysis, Atmos. Res., 93, 534–545, https://doi.org/10.1016/J.ATMOSRES.2008.09.037, 2009.
Robinson, W. A., Reudy, R., and Hansen, J. E.: General circulation model simulations of recent cooling in the east-central United States, J. Geophys. Res., 107, 4748, https://doi.org/10.1029/2001JD001577, 2002.
Rosenfeld, D., Lohmann, U., Raga, G. B., O'Dowd, C. D., Kulmala, M., Fuzzi, S., Reissell, A., and Andreae, M. O.: Flood or Drought: How Do Aerosols Affect Precipitation?, Science, 321, 1309–1313, https://doi.org/10.1126/science.1160606, 2008.
Saunders, C. P.: Charge Separation Mechanisms in Clouds, Space. Sci. Rev., 137, 335–353, https://doi.org/10.1007/S11214-008-9345-0, 2008.
Shi, Z., Tan, Y., Tang, H., Sun, J., Yang, Y., Peng, L. K., and Guo, X.: Aerosol effect on the land-ocean contrast in thunderstorm electrification and lightning frequency, Atmos. Res., 164, 131–141, https://doi.org/10.1016/J.ATMOSRES.2015.05.006, 2015.
Shi, Z., Li, L., Tan, Y., Wang, H., and Li, C.: A Numerical Study of Aerosol Effects on Electrification with Different Intensity Thunderclouds, Atmosphere, 10, 208, https://doi.org/10.3390/atmos10090508, 2019.
Shi, Z., Wang, H., Tan, Y., Li, L., and Li, C.: Influence of aerosols on lightning activities in central eastern parts of China, Atmos. Sci. Lett., 21, e957, https://doi.org/10.1002/asl.957, 2020.
Takahashi, T.: Riming Electrification as a Charge Generation Mechanism in Thunderstorms, J. Atmos. Sci., 35, 1536–1548, https://doi.org/10.1175/1520-0469(1978)035<1536:REAACG>2.0.CO;2, 1978.
Takemi, T.: A sensitivity of squall-line intensity to environmental static stability under various shear and moisture conditions, Atmos. Res., 84, 374–389, https://doi.org/10.1016/J.ATMOSRES.2006.10.001, 2007.
Tan, Y., Peng, L. K., Shi, Z., and Haiqin, C.: Lightning flash density in relation to aerosol over Nanjing (China), Atmos. Res., 174, 1–8, https://doi.org/10.1016/J.ATMOSRES.2016.01.009, 2016.
Tao, W., Chen, J., Li, Z., Wang, C., and Zhang, C.: Impact of aerosols on convective clouds and precipitation, Rev. Geophys., 50, RG2001, https://doi.org/10.1029/2011RG000369, 2012.
Thornton, J. A., Virts, K. S., Holzworth, R. H., and Mitchell, T. P.: Lightning enhancement over major oceanic shipping lanes, Geophys. Res. Lett., 44, 9102–9111, https://doi.org/10.1002/2017GL074982, 2017.
Wang, H., Shi, Z., Wang, X., Tan, Y., Wang, H., Li, L., and Lin, X.: Cloud-to-Ground Lightning Response to Aerosol over Air-Polluted Urban Areas in China, Remote. Sens., 13, 2600, https://doi.org/10.3390/rs13132600, 2021.
Wang, Q., Li, Z., Guo, J., Zhao, C., and Cribb, M.: The climate impact of aerosols on the lightning flash rate: is it detectable from long-term measurements?, Atmos. Chem. Phys., 18, 12797–12816, https://doi.org/10.5194/acp-18-12797-2018, 2018.
Wang, Y., Wan, Q., Meng, W., Liao, F., Tan, H., and Zhang, R.: Long-term impacts of aerosols on precipitation and lightning over the Pearl River Delta megacity area in China, Atmos. Chem. Phys., 11, 12421–12436, https://doi.org/10.5194/acp-11-12421-2011, 2011.
Westcott, N. E.: Summertime Cloud-to-Ground Lightning Activity around Major Midwestern Urban Areas, J. Appl. Meteorol., 34, 1633–1642, https://doi.org/10.1175/1520-0450-34.7.1633, 1995.
Williams, E. R.: The Schumann Resonance: A Global Tropical Thermometer, Science, 256, 1184–1187, https://doi.org/10.1126/science.256.5060.1184, 1992.
Xia, R., Zhang, D., and Wang, B.: A 6-yr Cloud-to-Ground Lightning Climatology and Its Relationship to Rainfall over Central and Eastern China, J. Appl. Meteorol. Clim., 54, 2443–2460, https://doi.org/10.1175/JAMC-D-15-0029.1, 2015.
Yair, Y. Y.: Lightning hazards to human societies in a changing climate, Environ. Res. Lett., 13, 123002, https://doi.org/10.1088/1748-9326/aaea86, 2018.
Yang, X. and Li, Z.: Increases in thunderstorm activity and relationships with air pollution in southeast China, J. Geophys. Res.-Atmos., 119, 1835–1844, https://doi.org/10.1002/2013JD021224, 2014.
Yang, X., Yao, Z., Li, Z., and Fan, T.: Heavy air pollution suppresses summer thunderstorms in central China, J. Atmos. Sol.-Terr. Phy., 95, 28–40, https://doi.org/10.1016/J.JASTP.2012.12.023, 2013.
Yang, X., Sun, J., and Li, W.: An Analysis of Cloud-to-Ground Lightning in China during 2010–13, Weather. Forecast., 30, 1537–1550, https://doi.org/10.1175/WAF-D-14-00132.1, 2015.
Yang, X., Li, Z., Liu, L., Zhou, L., Cribb, M., and Zhang, F.: Distinct weekly cycles of thunderstorms and a potential connection with aerosol type in China, Geophys. Res. Lett., 43, 8760–8768, https://doi.org/10.1002/2016GL070375, 2016.
Yu, R., Yuan, W., Li, J., and Fu, Y.: Diurnal phase of late-night against late-afternoon of stratiform and convective precipitation in summer southern contiguous China, Clim. Dynam., 35, 567–576, https://doi.org/10.1007/S00382-009-0568-X, 2010.
Yuan, T., Remer, L. A., Pickering, K. E., and Yu, H.: Observational evidence of aerosol enhancement of lightning activity and convective invigoration, Geophys. Res. Lett., 38, L04701, https://doi.org/10.1029/2010GL046052, 2011.
Zhao, P., Yin, Y., and Xiao, H.: The effects of aerosol on development of thunderstorm electrification: A numerical study, Atmos. Res., 153, 376–391, https://doi.org/10.1016/J.ATMOSRES.2014.09.011, 2015.
Zhao, P., Li, Z., Xiao, H., Wu, F., Zheng, Y., Cribb, M. C., Jin, X., and Zhou, Y.: Distinct aerosol effects on cloud-to-ground lightning in the plateau and basin regions of Sichuan, Southwest China, Atmos. Chem. Phys., 20, 13379–13397, https://doi.org/10.5194/acp-20-13379-2020, 2020.
Zhang, W., Meng, Q., Ma, M., and Zhang, Y.: Lightning casualties and damages in China from 1997 to 2009, Nat. Hazards, 57, 465–476, https://doi.org/10.1007/S11069-010-9628-0, 2012.
Zhang, Y., Xue, M., Zhu, K., and Zhou, B.: What Is the Main Cause of Diurnal Variation and Nocturnal Peak of Summer Precipitation in Sichuan Basin, China? The Key Role of Boundary Layer Low-Level Jet Inertial Oscillations, J. Geophys. Res.-Atmos., 124, 2643–2664, https://doi.org/10.1029/2018JD029834, 2019.