the Creative Commons Attribution 4.0 License.
the Creative Commons Attribution 4.0 License.
 | 02 Mar 2023
Modulation of daily PM2.5 concentrations over China in winter by large-scale circulation and climate change
Zixuan Jia
Carlos Ordóñez
Ruth M. Doherty
Oliver Wild
Steven T. Turnock
Fiona M. O'Connor
We use the United Kingdom Earth System Model, UKESM1, to investigate the influence of the winter large-scale circulation on daily concentrations of PM2.5 (particulate matter with an aerodynamic diameter of 2.5 µm or less) and their sensitivity to emissions over major populated regions of China over the period 1999–2019. We focus on the Yangtze River delta (YRD), where weak flow of cold, dry air from the north and weak inflow of maritime air are particularly conducive to air pollution. These provide favourable conditions for the accumulation of local pollution but limit the transport of air pollutants into the region from the north. Based on the dominant large-scale circulation, we construct a new index using the north–south pressure gradient and apply it to characterise PM2.5 concentrations over the region. We show that this index can effectively distinguish different levels of pollution over YRD and explain changes in PM2.5 sensitivity to emissions from local and surrounding regions. We then project future changes in PM2.5 concentrations using this index and find an increase in PM2.5 concentrations over the region due to climate change that is likely to partially offset the effect of emission control measures in the near-term future. To benefit from future emission reductions, more stringent emission controls are required to offset the effects of climate change.
- Article
(10136 KB) - Full-text XML
-
Supplement
(2916 KB) - BibTeX
- EndNote


Haze air pollution with high levels of PM2.5 (particulate matter with an aerodynamic diameter of 2.5 µm or less) is a major health concern in China, especially in the major populated regions of Beijing–Tianjin–Hebei (BTH), the Yangtze River delta (YRD), and the Pearl River delta (PRD) (Zhao et al., 2013; Ding et al., 2013; Huang et al., 2014). Many studies have explored the underlying causes of high PM2.5 concentrations, and air pollutant emissions (An et al., 2019; Chan and Yao, 2008; Q. Zhang et al., 2019), meteorological conditions (Wang et al., 2009; Hou et al., 2018, 2020), and regional transport (Li et al., 2012; Sun et al., 2015; Chen et al., 2017; Wang et al., 2016) are identified as important contributors. In particular, meteorological conditions can modulate the regional transport as well as the local accumulation, chemical conversion, and wet and dry deposition of air pollutants (e.g. Tai et al., 2010; Zhang et al., 2014; Wang et al., 2014).
Severe haze pollution frequently occurs in winter under stagnant meteorological conditions with weak near-surface winds, strong temperature inversions, and high relative humidity, which are favourable for the accumulation of PM2.5 (Wang et al., 2014; Miao et al., 2015; Leung et al., 2018). These meteorological conditions are in turn affected by large-scale circulation patterns over China dominated by the East Asian winter monsoon during winter with northerlies along the East Asian coast and southerlies from the South China Sea and the East China Sea (Chang et al., 2006; Wang and Chen, 2010; Wang and Lu, 2017). Global climate models can represent these large-scale circulation features better than regional meteorological conditions that typically depend on sub-grid-scale processes (Chen et al., 2012; Zha et al., 2020; Xu et al., 2021). Because of this, many studies have investigated the modulation of large-scale winter circulation on PM2.5 concentrations in China and proposed circulation-based indices. Among these studies, most of the focus has been placed on the BTH region, which has the most severe PM2.5 pollution, or on parts of southern China (e.g. Wang and Chen, 2010; Jia et al., 2015; Jeong and Park, 2017; G. Zhang et al., 2019). As the circulation patterns are more complex over eastern China, fewer studies have focused on this region (e.g. Wang et al., 2016; Leung et al., 2018; Hou et al., 2019). Recently, Jia et al. (2022) diagnosed the dominant large-scale circulation patterns associated with winter PM2.5 and defined new circulation-based indices for BTH, YRD, and PRD. However, these results were based on a short 5-year period and need to be verified over a longer time period.
The sensitivity of air pollution to emission sources is associated with regional transport, which can be modulated by the large-scale circulation. PM2.5 originates from local emissions of primary particles emitted directly from natural and anthropogenic sources and from secondary particles generated by heterogeneous and homogeneous chemical reactions of gaseous precursors in the atmosphere (Feng et al., 2012; He et al., 2012; Du et al., 2020). Air pollution from surrounding regions also affects PM2.5 concentrations through regional transport (Sun et al., 2015, 2022; Wang et al., 2016; Cheng et al., 2019). Cheng et al. (2019) found that the reduction in PM2.5 concentrations in Beijing from 2013 to 2017, which resulted from the implementation of an action plan for controlling anthropogenic emissions, was dominated by emission reductions from both local (65 %) and surrounding (23 %) regions. In a heavy wintertime air pollution episode over the two central Chinese provinces of Hubei and Hunan in January 2019, 71 % of the PM2.5 concentrations were attributed to regional transport from northern China (Hu et al., 2021). YRD is a key emission source and receptor region in eastern China that is affected by both northerly continental winds from Siberia and southerly oceanic winds in winter (e.g. Li et al., 2012; Wang et al., 2016; Jeong and Park, 2017). Consequently, emissions from the major source regions located north and south of YRD, i.e. BTH and PRD, have the potential to affect air pollution in the YRD region (e.g. Zhao et al., 2013; Zhang and Cao, 2015; Liao et al., 2015). A combination of PM2.5 formation from local emissions and regional transport from the surrounding regions results in complex air pollution characteristics in YRD. It is therefore important to investigate the role of emissions from local and surrounding regions in PM2.5 pollution in the region during winter and to identify the impact of large-scale circulation.
Future PM2.5 concentrations will be influenced by changes in both air pollutant emissions and climate. Circulation-based indices derived from climate models are commonly used to represent the future evolution of PM2.5 concentrations (e.g. Cai et al., 2017; Zhao et al., 2021). For instance, more frequent severe haze days have been projected in Beijing under climate change based on the East Asian winter monsoon index (Pei et al., 2018) and the haze weather index (Cai et al., 2017). However, most existing circulation-based indices have been proposed for the North China Plain and do not reflect the link between the large-scale circulation and PM2.5 levels over YRD and PRD. Furthermore, analyses of output from climate models point to large uncertainties in the magnitude and spatial extent of projections of circulation features over China during winter under climate change (Ding et al., 2007; Xu et al., 2016; Miao et al., 2020). Therefore, improved knowledge of the dominant large-scale circulation patterns and identification of appropriate circulation-based indices are needed to understand PM2.5 concentration changes in future climate projections.
In this study we use a state-of-the-art Earth system model (Sects. 2, 3) to investigate the dominant large-scale circulation–PM2.5 relationships for BTH, YRD, and PRD on daily timescales during winter and propose a new circulation-based index for each region (Sect. 4). We then quantify the sensitivity of daily PM2.5 in YRD to emissions from local and surrounding regions and explain the modulation of this sensitivity by the large-scale circulation using the proposed new daily circulation-based index (Sect. 5). Based on these modelled dominant large-scale circulation–PM2.5 relationships and circulation-based indices derived from climate model historical and future simulations, we project daily changes in PM2.5 concentrations under climate change (Sect. 6). Finally, Sect. 7 discusses and summarises the main results.
2.1 Model description and simulations
The United Kingdom Earth System Model, UKESM1, as configured for the latest Coupled Model Intercomparison Project phase model, CMIP6 (Sellar et al., 2019, 2020), is used to simulate the impact of large-scale circulation on daily PM2.5 concentrations for CMIP6 historical (1999–2014) and future (2015–2019) periods. Here, UKESM1 is configured to simulate changes in the atmosphere and land only as used in the Atmospheric Model Intercomparison Project (AMIP; Eyring et al., 2016). The United Kingdom Chemistry and Aerosols model (UKCA; Morgenstern et al., 2009; O'Connor et al., 2014) is the atmospheric composition component of UKESM1 and includes the stratosphere–troposphere gas-phase chemistry scheme, StratTrop (Archibald et al., 2020), and the Global Model of Aerosol Processes (GLOMAP)-mode aerosol scheme (Mann et al., 2010; Mulcahy et al., 2020). UKCA is coupled with the Global Atmosphere 7.1/Global Land 7.0 (GA7.1/GL7.0; Walters et al., 2019) configuration of the Hadley Centre Global Environment Model version 3 (HadGEM3; Hewitt et al., 2011). The model version used here permits simulation of PM2.5 concentrations at daily resolution.
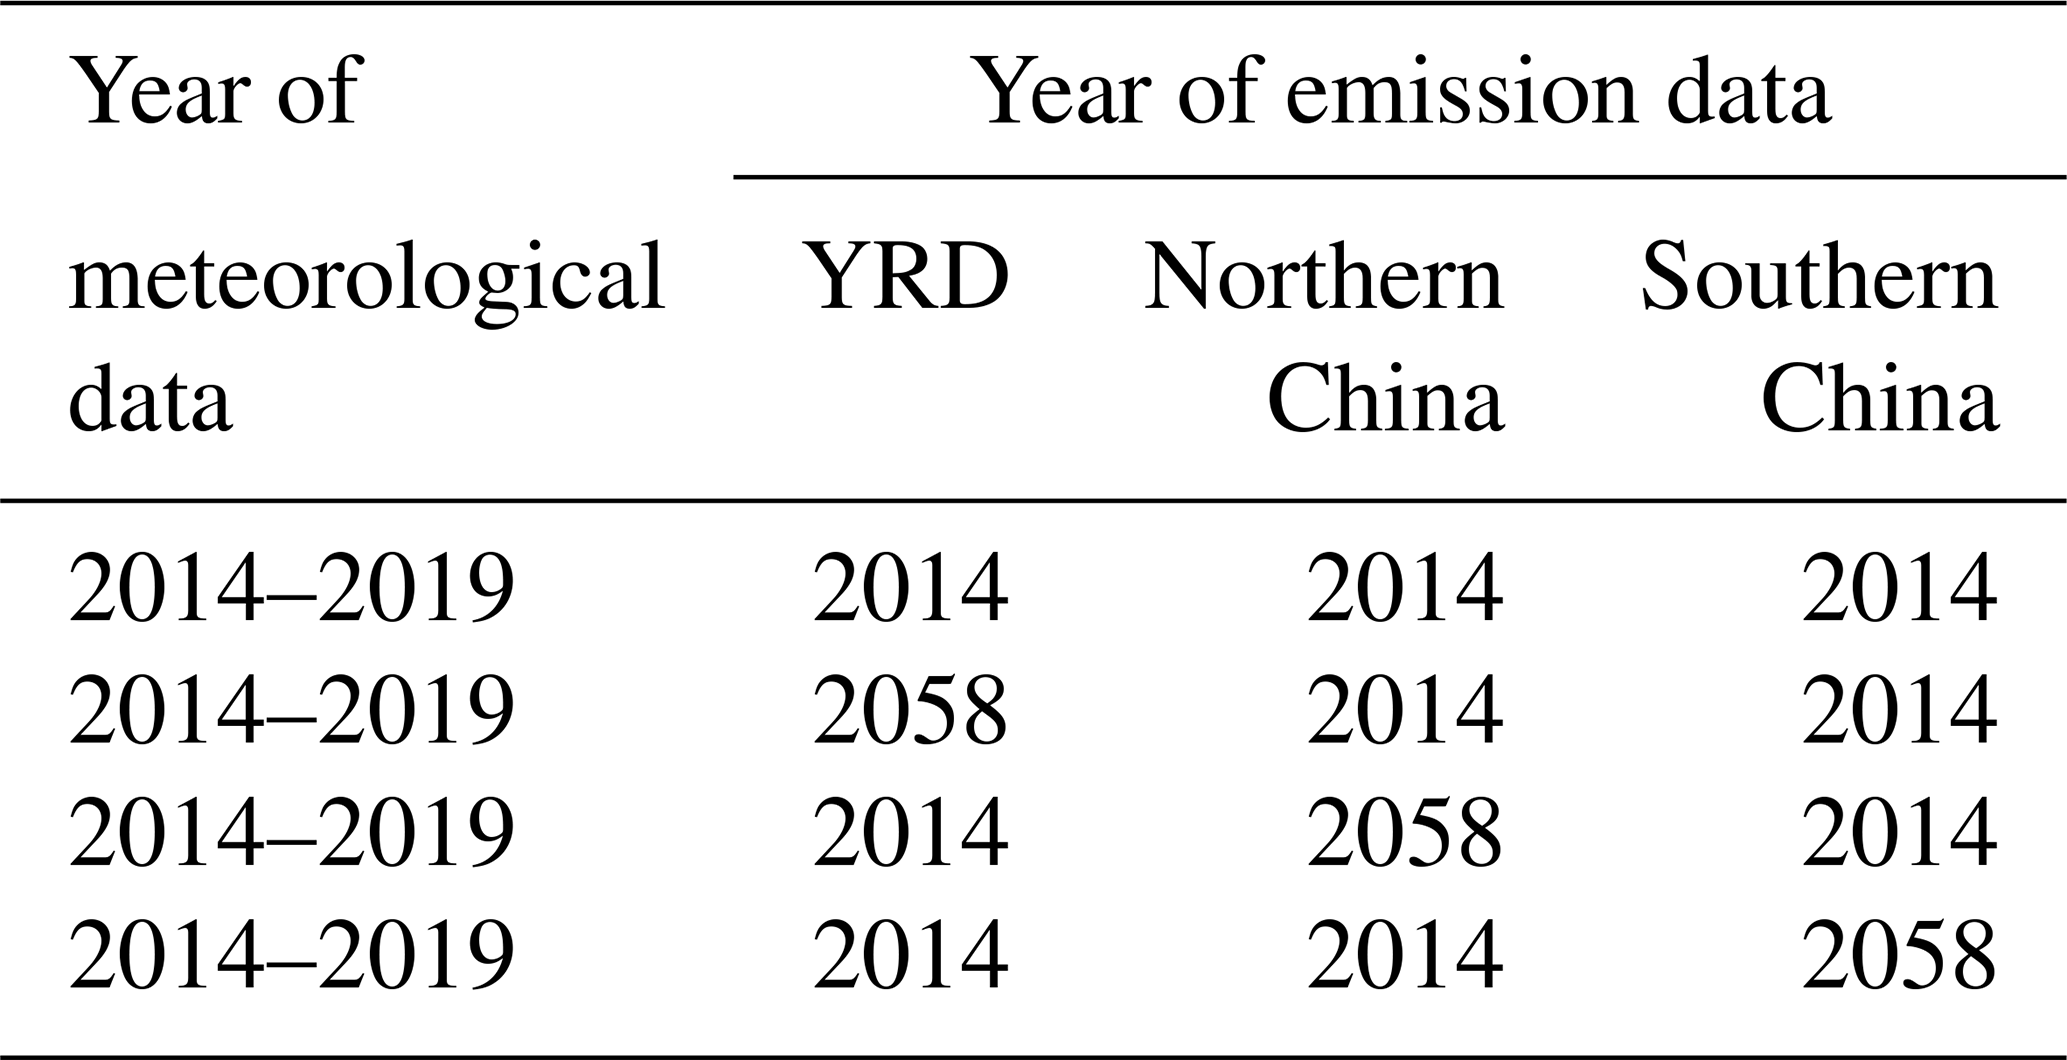
We output PM2.5 concentrations and meteorological fields from 1 December 1999 to 28 February 2019 at a horizontal resolution of 1.875∘ × 1.25∘ (approximately 140 km at mid-latitudes). We then extract daily concentrations for 20 winters from 1 December 1999–28 February 2000 to 1 December 2018–28 February 2019 (hereafter referred to as DJF 1999–2018). In this study, DJF refers to December of the current year and January and February of the following year. Meteorological fields include zonal wind at 850 hPa (U850), meridional wind at 850 hPa (V850), sea level pressure (SLP), precipitation, and geopotential height at 500 hPa (Z500). Wind speed and temperature are nudged with ERA-Interim reanalyses from the European Centre for Medium-Range Weather Forecasts (ECMWF) every 6 h (Dee et al., 2011). By nudging to reanalysis data, this model can produce a realistic representation of the meteorological conditions. Sea surface temperature and sea ice fields are prescribed with observations from the National Oceanic and Atmospheric Administration (NOAA) (Reynolds et al., 2007). Greenhouse gas concentrations and vegetation land cover fraction are prescribed as in CMIP6 historical (1999–2014) and SSP3-7.0 future (2015–2019) simulations conducted by UKESM1 (Meinshausen et al., 2017, 2020). There is little difference between the shared socio-economic pathways (SSPs; O'Neill et al., 2014; van Vuuren et al., 2014) in the first few years of each scenario, so the choice of scenario should not impact the results for the time period considered here. In order to isolate the meteorological contribution to daily PM2.5 variability from emissions, CMIP6 emissions for 2014 are used for the full period of the simulations, 1999–2019. This allows robust relationships between PM2.5 and the dominant large-scale circulation for BTH, YRD, and PRD to be established. Furthermore, three additional simulations have been performed for a 6-year period (2014–2019) with reduced emission fluxes over specific regions to examine the sensitivity of PM2.5 over YRD to different source regions (Table 1).
Table 1Last 6 years of the nudged UKESM1 simulation for 1999–2019 (with CMIP6 historical emissions for year 2014) and three sensitivity simulations with reduced emissions (for year 2058 according to the CMIP6 SSP3-7.0 scenario) over YRD, northern China, and southern China, respectively. The three regions are displayed in Fig. 8.
To project changes in circulation-based indices under climate change, we use daily meteorological data for DJF 1995–2098 derived from the CMIP6 UKESM1 historical experiment and future scenario SSP3-7.0. The CMIP6 SSP3-7.0 scenario has a large anthropogenic climate forcing signal (a radiative forcing of 7.0 W m−2 in 2100) and encompasses weak action in reducing air pollutant emissions (Turnock et al., 2020). We use this strong climate change scenario to quantify how changes in climate alone are likely to affect PM2.5 concentrations in the region. Note that the projected circulation changes will be affected by changes in the emissions of both greenhouse gases and aerosol precursors, while the direct contribution of precursor emission changes to the future evolution of the PM2.5 concentrations is not considered in this study.
2.2 Reanalysis PM2.5 data
The 6-year high-resolution Chinese air quality reanalysis dataset (CAQRA; Kong et al., 2021) is the latest air quality reanalysis for China and includes surface fields of PM2.5 at high spatial (15 km × 15 km) and temporal (1 h) resolution for the period 2013–2018. CAQRA has been validated with independent observational datasets to reproduce the magnitude and variability of PM2.5 in China on a regional scale (Kong et al., 2021). Furthermore, it has been used to investigate the modulation of daily air quality in China during winter by regional meteorological conditions and the large-scale circulation (Jia et al., 2022). We use PM2.5 hourly concentrations from this dataset to calculate the daily average PM2.5 for DJF 2013–2017. To evaluate the UKESM1-simulated daily PM2.5 concentrations, we regrid the CAQRA reanalysis to the coarser spatial resolution of UKESM1.
We have run the UKESM1 model for 1999–2019 with 2014 emissions. The extracted daily PM2.5 concentrations are evaluated against PM2.5 data from the CAQRA reanalysis. A short 3-month period (January–February–December of 2014, JFD 2014) has been used for a first comparison because UKESM1 emissions are fixed at 2014 levels. The spatial pattern of winter mean PM2.5 concentrations in UKESM1 is broadly similar (r=0.87, p<0.01, slope = 0.89) to that found in CAQRA during JFD 2014, albeit with lower concentrations over most regions (Fig. 1). The model version used here does not include ammonium nitrate or formation of anthropogenic secondary organic aerosol, which may partly explain the underestimation of the PM2.5 concentrations (Butt et al., 2017; Archibald et al., 2020). However, the results of this study should not be heavily impacted by this, as we investigate the day-to-day variability of PM2.5 concentrations rather than PM2.5 concentrations directly. We define meteorologically coherent regions representing BTH, YRD, and PRD by identifying UKESM1 grid cells where the simulated daily PM2.5 concentrations are highly correlated (r≥0.7) with those representing Beijing (four grid cells), Shanghai (two grid cells), and Guangzhou (one grid cell), respectively (Fig. 2), following the approach of Jia et al. (2022). Daily regional PM2.5 concentrations are then calculated by averaging grid cell concentrations over these three highly correlated homogeneous regions.
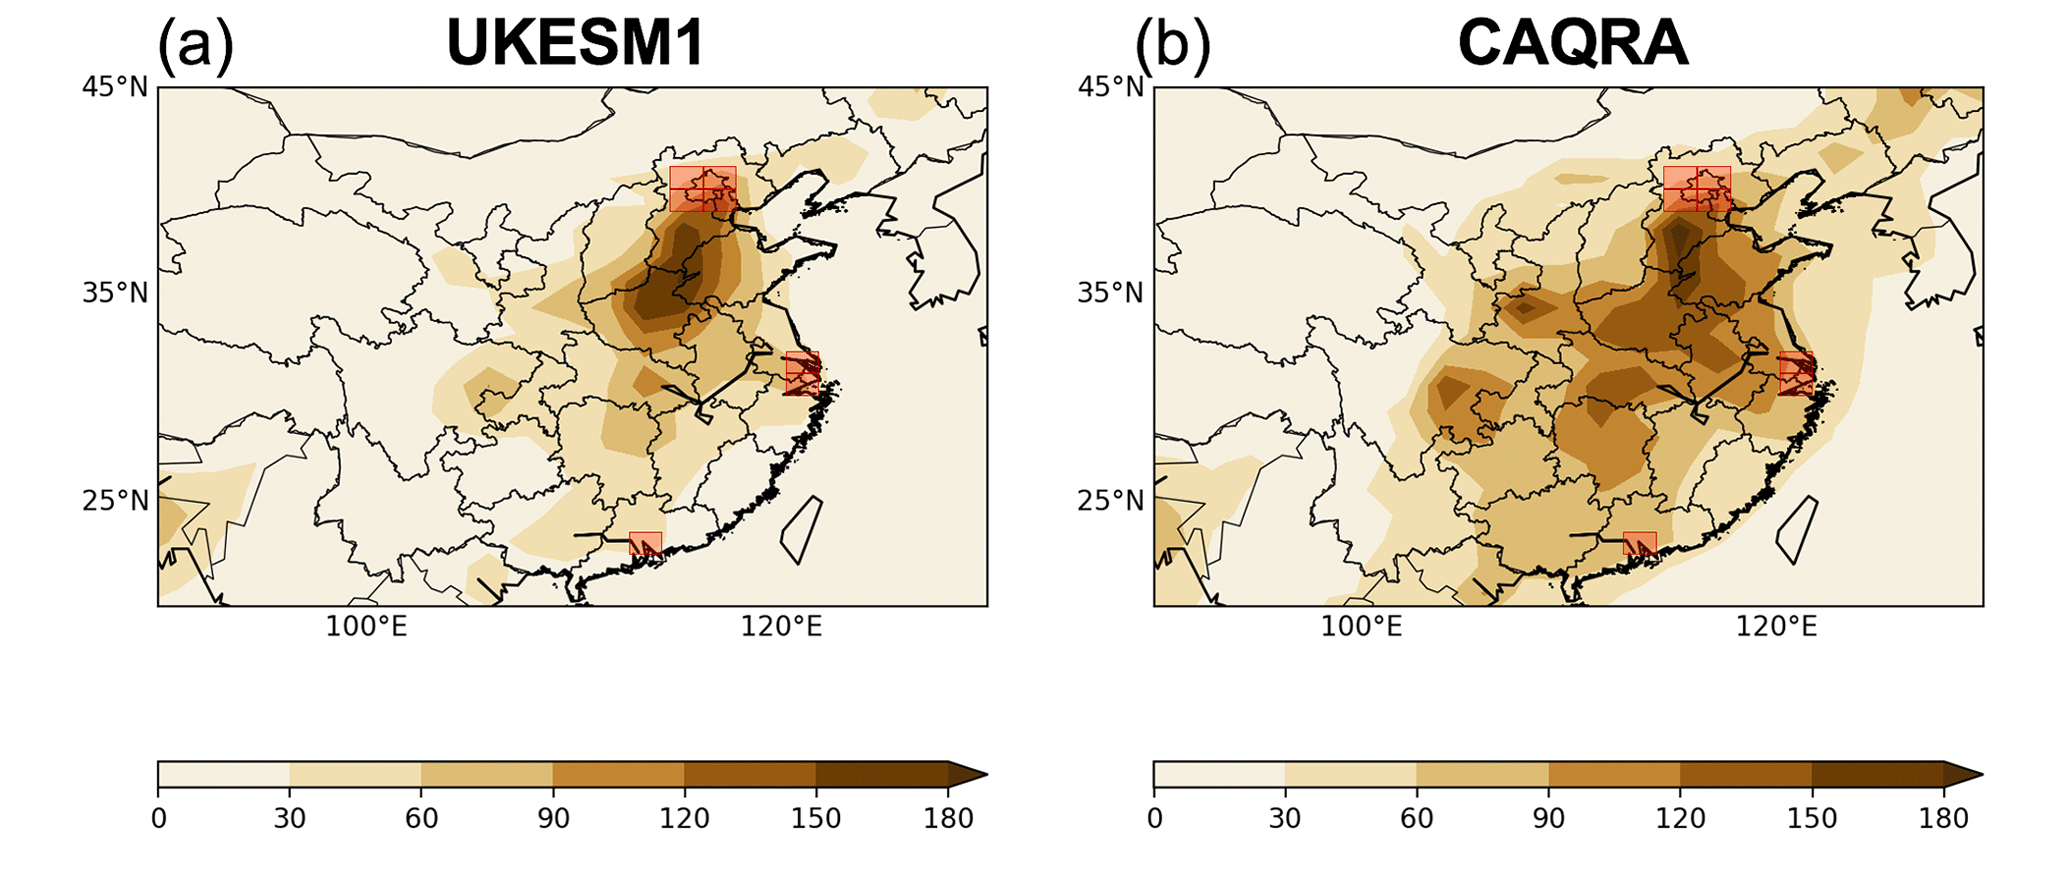
Figure 1Spatial distributions of winter mean daily PM2.5 concentrations (µg m−3) across China during JFD 2014 (a) simulated by UKESM1 and in (b) the CAQRA reanalysis. UKESM1 grid cells covering Beijing (four grid cells), Shanghai (two grid cells), and Guangzhou (one grid cell) are marked by red rectangles.
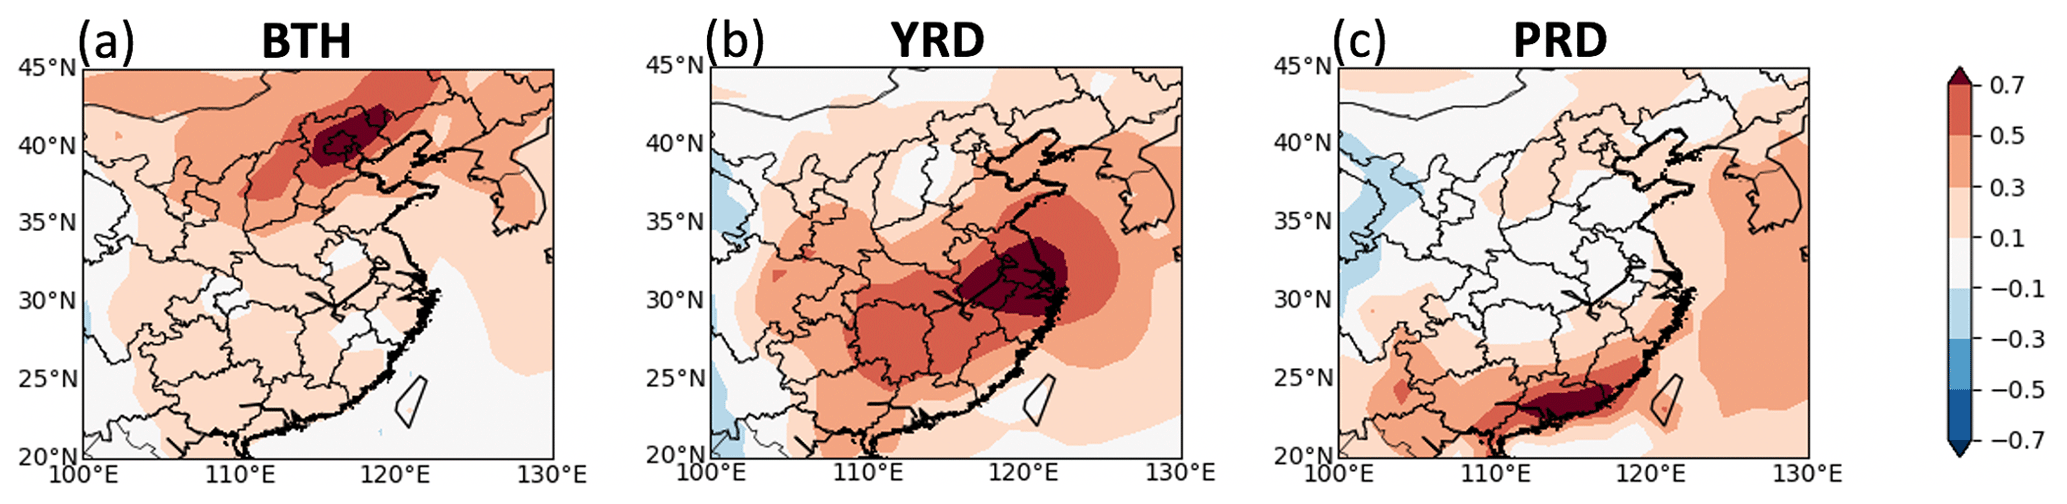
Figure 2Correlation coefficients of daily mean PM2.5 concentrations over all UKESM1 grid cells with those in the grid cells covering (a) Beijing, (b) Shanghai, and (c) Guangzhou during DJF 1999–2018. Regions where correlations are higher than 0.7 (dark red shading) are selected to represent the Beijing–Tianjin–Hebei (BTH), Yangtze River delta (YRD), and Pearl River delta (PRD) regions.
Figure 3a shows the evolution of the daily mean PM2.5 concentrations from UKESM1 and CAQRA for DJF 2013–2017 over BTH, YRD, and PRD, while Fig. 3b compares their frequency distributions. The daily PM2.5 concentrations from UKESM1 are significantly correlated (p<0.01) with those from CAQRA (r=0.54 over BTH; r=0.60 over YRD; r=0.41 over PRD). UKESM1 slightly overestimates the PM2.5 concentrations in BTH, likely because of the rapid emission reductions over the North China Plain after 2014. The underestimation found for the other two regions, especially in PRD, is consistent with the spatial distributions seen in Fig. 1 and cannot be attributed to emission controls. Overall, the spatial pattern of winter mean PM2.5 concentrations (Fig. 1) and the temporal evolution of daily PM2.5 concentrations (Fig. 3) can be simulated well over all three regions, especially over YRD.
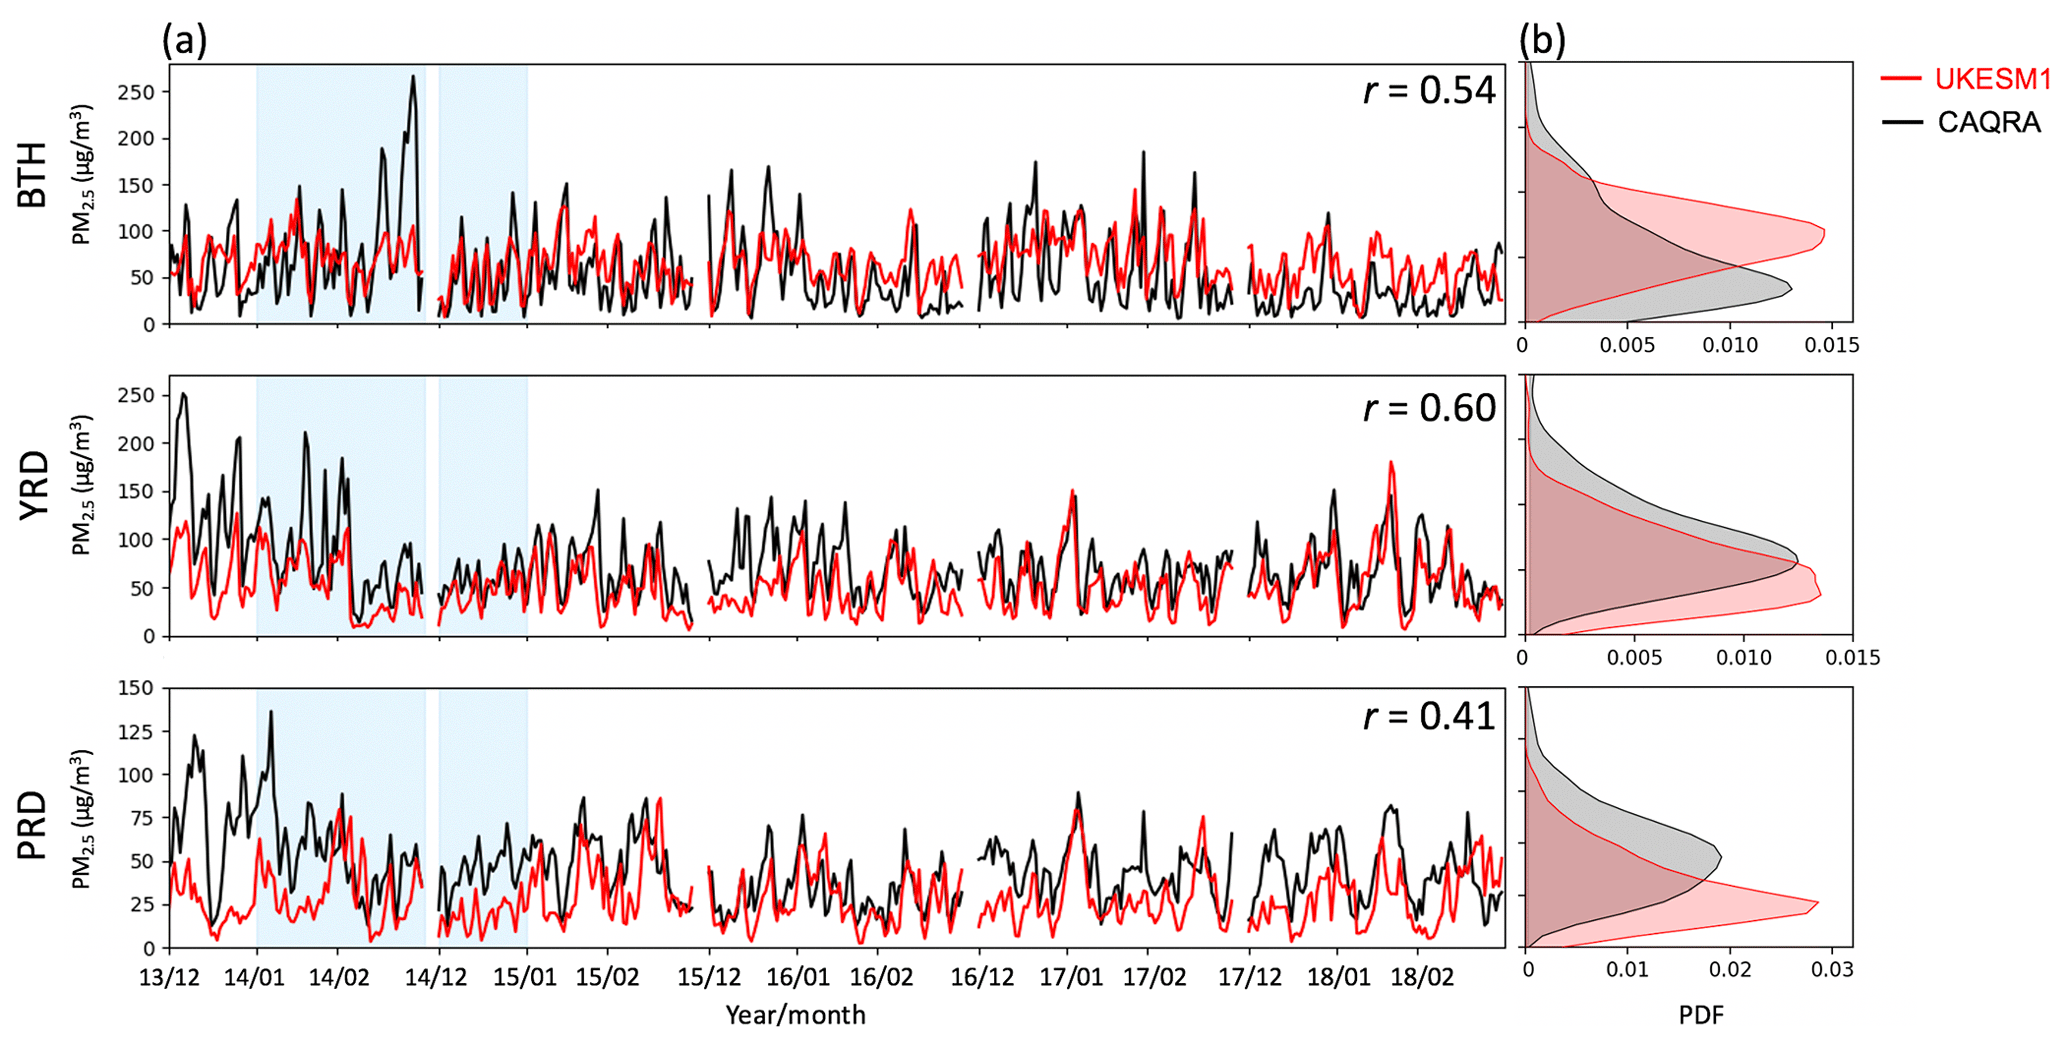
Figure 3Comparison of daily mean PM2.5 concentrations (µg m−3) provided by UKESM1 and CAQRA for BTH, YRD, and PRD during DJF 2013–2017. (a) Time series of daily mean PM2.5 concentrations. Blue area represents JFD 2014. The values of the Pearson correlation coefficients (r) of the daily time series for all days in DJF 2013–2017 are also displayed. All correlation values are significant at the 99 % confidence level using a two-tailed Student's t test as indicated in von Storch and Zwiers (1999). (b) Frequency distributions of the daily mean PM2.5 concentrations.
The wintertime large-scale circulation over East Asia is reproduced by UKESM1 by nudging with the ERA-Interim reanalysis. This is dominated by the “Siberian High”, as seen from the high SLP values centred over north-western Mongolia, and by the “Aleutian Low” to its east and a low pressure over the Maritime Continent (hereafter referred to as the “Maritime Continent Low”) to its south (Fig. 4a). Cold and dry north-westerly lower tropospheric winds over northern China (Fig. 4a) are indicated by negative V850 values (Fig. 4b) and positive U850 values (Fig. 4c). The middle tropospheric East Asian trough is characterised by low Z500 values over north-eastern China as seen in Fig. S1 in the Supplement. Warm and wet south-easterly winds from the South China Sea and the East China Sea are indicated by positive V850 values and negative U850 values, bringing precipitation over southern China (Fig. 4b–d). In this study, we investigate the influence of the large-scale circulation on the variability of daily PM2.5 using 20 winters (DJF 1999–2018) from simulations.
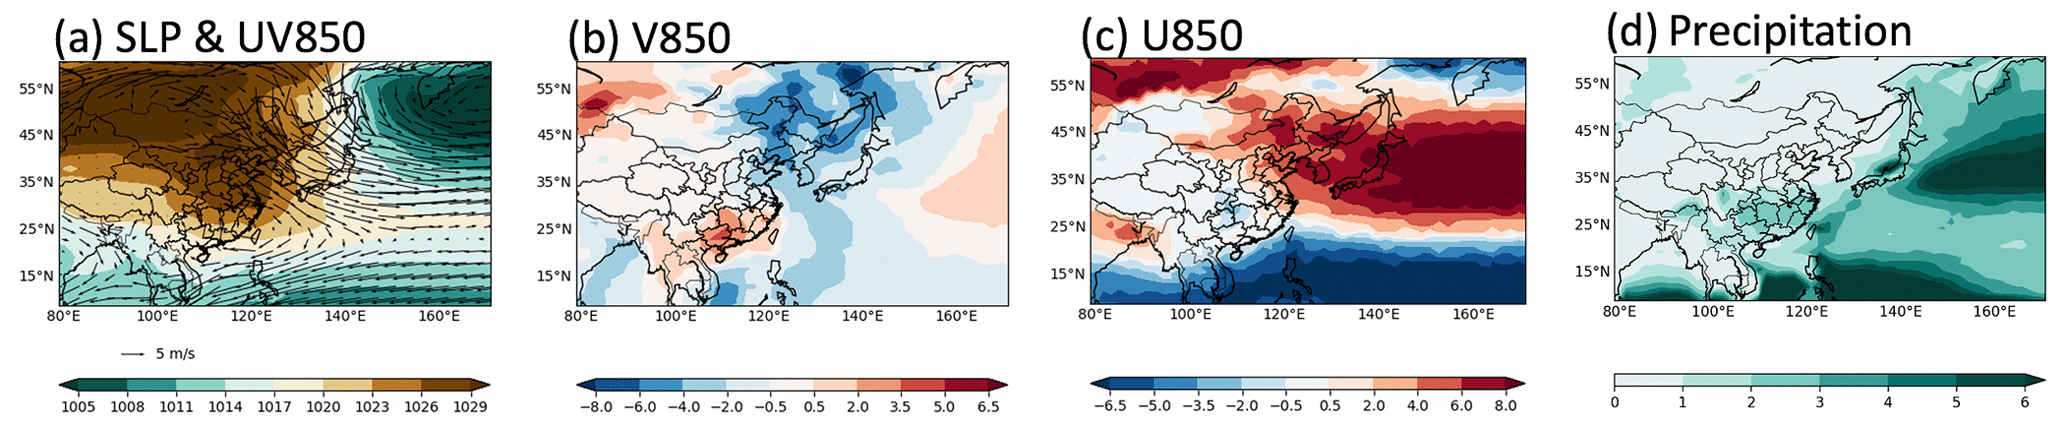
Figure 4Simulated winter mean daily (a) sea level pressure (SLP; hPa, shading) and 850 hPa wind (arrows), (b) 850 hPa meridional wind (V850; m s−1), (c) 850 hPa zonal wind (U850; m s−1), and (d) precipitation (mm d−1) from nudged UKESM1 during DJF 1999–2018.
We first examine the daily correlations of the PM2.5 concentrations in each region with circulation variables and precipitation. The YRD region is shown as an example in Fig. 5 because the circulation patterns are more complex here (Fig. 4) and this region is less well studied than BTH and PRD, as noted earlier. The patterns reveal that daily PM2.5 concentrations in the YRD region are negatively correlated with SLP over northern China and positively correlated over southernmost China and the South China Sea (Fig. 5a). With regards to the wind components, correlations are positive with V850 over northern China and negative over southern China and the South China Sea (Fig. 5b) as well as positive with U850 over eastern and central China (Fig. 5c). Furthermore, PM2.5 concentrations in YRD are negatively correlated with precipitation over central and south-eastern China (Fig. 5d). The comparison between the sign of these correlation coefficients and the winter mean patterns (Fig. 4) highlights the large-scale circulation features that are associated with high PM2.5 pollution days over YRD. These days are mainly characterised by a weak Siberian High, a weak Maritime Continent Low, weak northerly winds over northern China, weak southerly/easterly winds over southern/central China, and above-average westerly winds in eastern China. A weak Siberian High and weak Maritime Continent Low are identified as the dominant large-scale circulation features, because the largest coherent negative and positive correlation values are found for SLP over northern China and the South China Sea. The area-weighted averages of daily SLP over these two regions (yellow rectangles in Fig. 5a) are significantly correlated (p<0.01) with PM2.5 concentrations in YRD ( and r=0.32, respectively).
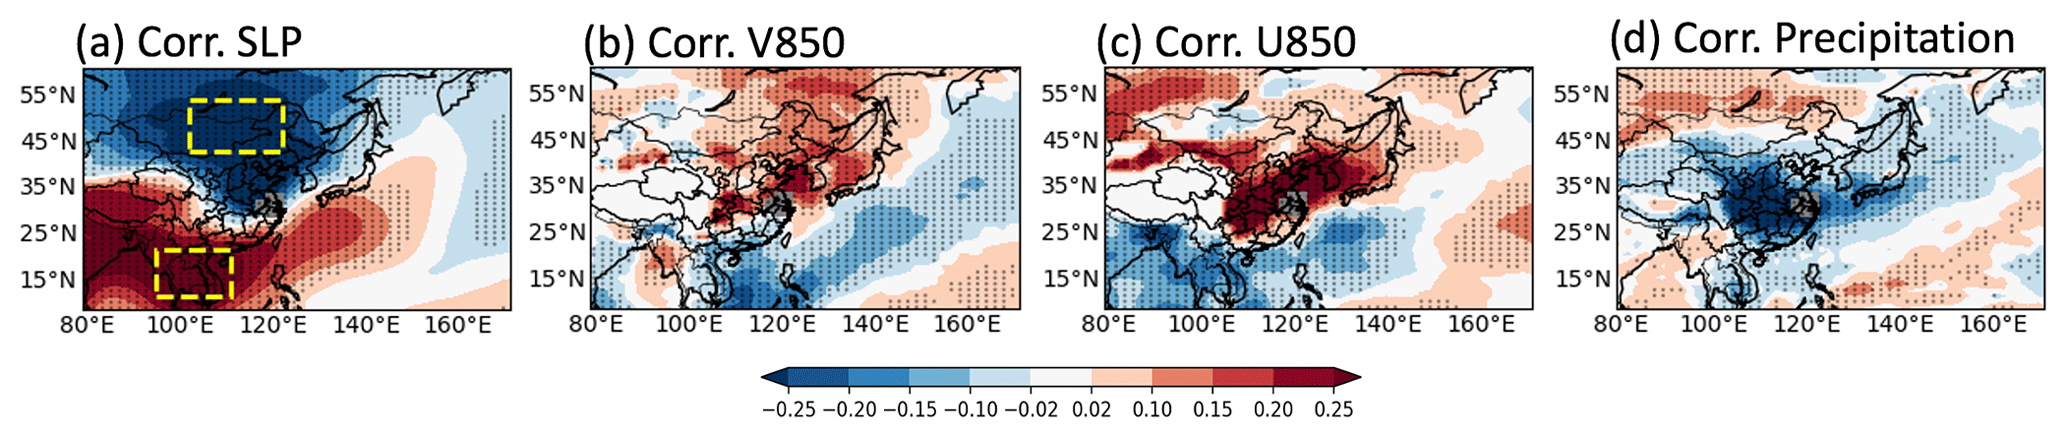
Figure 5Correlation coefficients of daily PM2.5 concentrations in YRD with (a) SLP, (b) V850, (c) U850, and (d) precipitation from nudged UKESM1 during DJF 1999–2018. Dotted regions indicate significant correlations at the 95 % level from a two-tailed Student's t test. Grey shading represents the YRD region. The regions used for the definition of a circulation-based index for YRD (Eq. 1) are marked by two yellow rectangles in panel (a).
To reflect the effect of circulation over the Asian continent and the adjacent ocean, we use the SLP difference averaged over northern and southern China (i.e. [43–54∘ N, 102–122∘ E] minus [12–22∘ N, 95–111∘ E]) to build a north–south SLP gradient-based index for YRD (ISLP_YRD) for all days in DJF 1999–2018 (Eq. 1). The daily SLP data are normalised by subtracting the mean and dividing by the standard deviation to yield a zero mean and unit variance before calculating the SLP gradient-based index. Negative values of ISLP_YRD indicate a weak pressure gradient between the Siberian High and Maritime Continent Low.
ISLP_YRD is significantly correlated (p<0.01) with PM2.5 concentrations in YRD on daily timescales (). These results point to a weak pressure gradient between the Siberian High and Maritime Continent Low as the dominant large-scale circulation pattern contributing to high PM2.5 pollution in YRD. Compared with the winter mean patterns (Fig. 4), on days with (Fig. 6a–d), a weak north–south pressure gradient inhibits the inflow of cold, dry northerly air to eastern China, creating appropriate conditions for the accumulation of aerosols and suppressing the southward transport of aerosols away from YRD. Furthermore, a weak north–south pressure gradient also suppresses the inflow of warm, wet oceanic air from the East China Sea and the South China Sea. The associated reduction in precipitation is also likely to support high air pollution over YRD due to reduced wet deposition of PM2.5 (e.g. Tai et al., 2010; Zhu et al., 2012; Leung et al., 2018). The reverse situation occurs on days with ISLP_YRD>1 (Fig. 6e–h). Regional transport and wet deposition by precipitation have also been identified to contribute to the interannual variability in PM2.5 concentrations over Shanghai in previous studies (e.g. Wang et al., 2016).
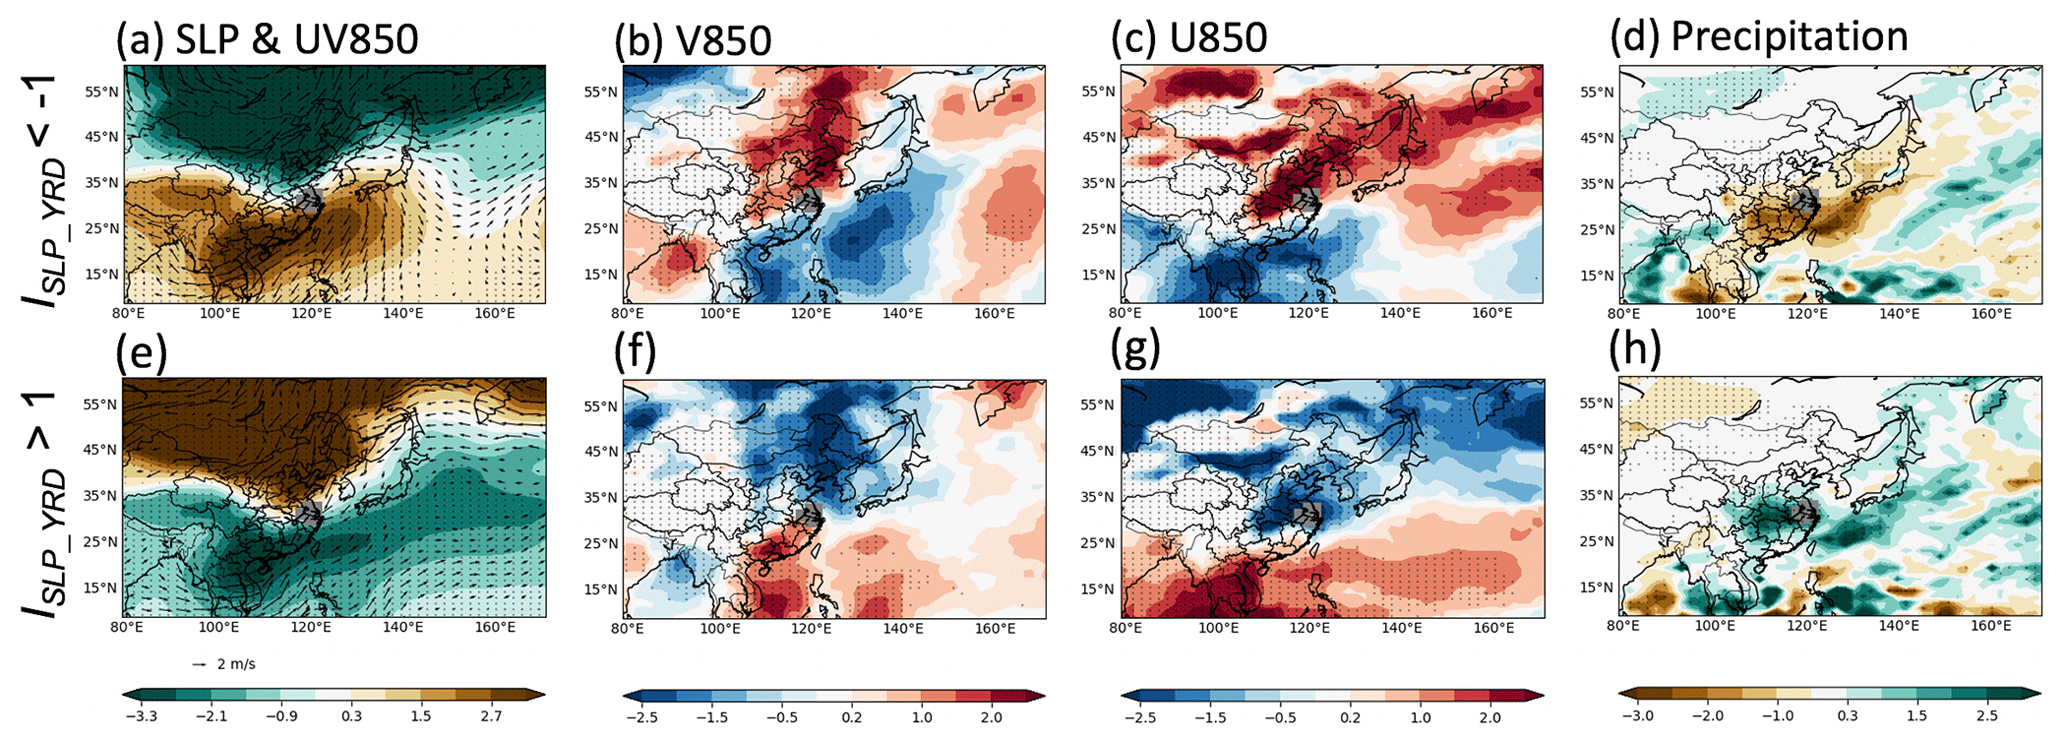
Figure 6Anomalies (days with I minus winter mean) of (a) sea level pressure (SLP; hPa, shading) and 850 hPa wind (arrows), (b) 850 hPa meridional wind (V850; m s−1), (c) 850 hPa zonal wind (U850; m s−1), and (d) precipitation (mm d−1) from nudged UKESM1 during DJF 1999–2018 and anomalies (days with ISLP_YRD>1 minus winter mean) of (e) SLP, (f) V850, (g) U850, and (h) precipitation. Dotted regions mark statistically significant differences at the 95 % level (determined through a bootstrap resampling method). Grey shading represents the YRD region.
We have confirmed the capability of ISLP_YRD to capture the relationship between the dominant large-scale circulation and daily PM2.5 concentrations in YRD. To further examine the performance of ISLP_YRD in distinguishing different levels of air pollution in the region, we compare the distributions of ISLP_YRD for different percentile thresholds of daily PM2.5 (Fig. 7). We group all winter days over the 20-year period below the 10th percentile (p10) of PM2.5 concentrations as clean days (180 d), above the 90th percentile (p90) of PM2.5 concentrations as heavily polluted days (180 d), between p10 and p50 (p10–50) as moderately clean days (720 d), and between p50 and p90 (p50–90) as moderately polluted days (720 d). The average values of ISLP_YRD with associated 95 % confidence intervals are for heavily polluted days, for moderately polluted days, for moderately clean days, and for clean days. These confidence intervals do not overlap, indicating that ISLP_YRD can distinguish effectively between different levels of air pollution and not just between heavily polluted and clean conditions. This SLP-gradient index, ISLP_YRD, improves on the capability of the SLP-based index derived by Jia et al. (2022) that considered only 5 years of winter data to distinguish PM2.5 pollution levels in YRD. We have checked that heavily polluted days in YRD simulated by UKESM1 are characterised by both reduced SLP over eastern China for winter 2013–2017, as found in Jia et al. (2022) for the same period, and enhanced SLP over the Maritime Continent for the longer time period analysed here, i.e. 1999–2018 (Fig. S2). This indicates that the new SLP-gradient index, which takes a dipole structure over the Asian continent and the Maritime Continent, encompasses the spatial variability in the large-scale circulation and its relationship with the winter PM2.5 concentrations in YRD more completely. These results show that improved relationships between air pollution and the atmospheric circulation can be derived through the use of long-term modelled time series with fixed emissions.
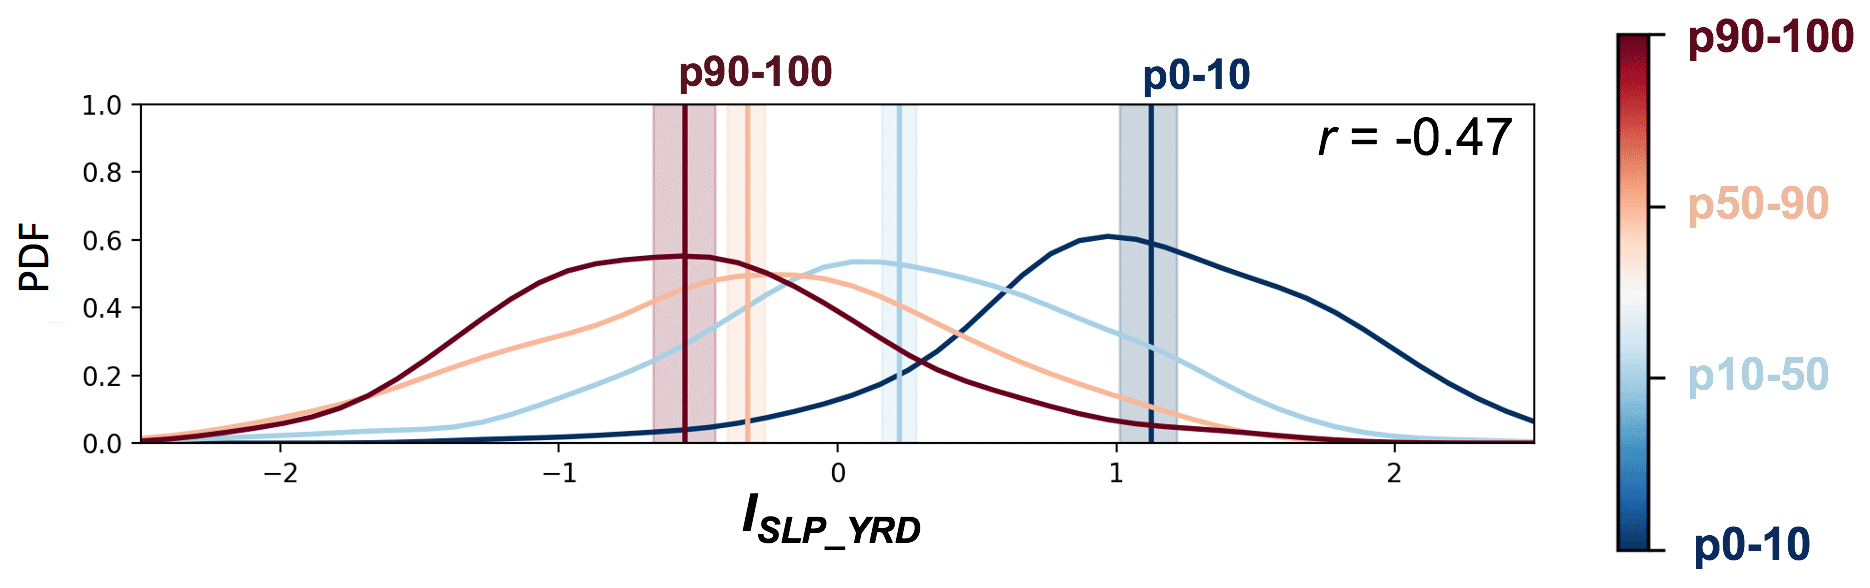
Figure 7Frequency distributions of a circulation-based index for YRD (Eq. 1) for different percentile thresholds of daily mean PM2.5 concentrations over YRD derived from nudged UKESM1 simulations during DJF 1999–2018. The vertical lines and shading represent the averages and the associated 95 % confidence intervals, respectively. Averages are calculated using Tukey's trimean (e.g. Ge et al., 2019). The confidence intervals for these averages are estimated by using bootstrap resampling (e.g. Wang, 2001).
We conduct a similar analysis for the BTH and PRD regions (Figs. S3–S4 in the Supplement). A V850-based index over the East Asian coast (yellow rectangle in Fig. S3c, [31–50∘ N, 113–124∘ E]) (IV850_BTH) and an SLP-based index over mainland China (yellow rectangle in Fig. S4b, [23–42∘ N, 102–122∘ E]) (ISLP_PRD) are proposed for BTH and PRD, respectively, based on the largest coherent correlation values with PM2.5 concentrations. As before, the meteorological fields have been averaged over the regions covered by those rectangles and normalised before the calculation of the indices. Both IV850_BTH and ISLP_PRD are significantly correlated (p<0.01) with daily PM2.5 concentrations in BTH () and in PRD () and can be used to distinguish PM2.5 pollution levels. Our analyses suggest that PM2.5 pollution in both regions is enhanced under suppressed northerly cold, dry winds over the East Asian coast (negative IV850_BTH) associated with a weakened Siberian High (negative ISLP_PRD) and a shallow East Asian trough at 500 hPa. Combined with the above analysis of the YRD region, weak transport of northerly cold, dry air as a consequence of a weakened Siberian High is identified as playing an important role in air pollution accumulation in all three regions (i.e. YRD, BTH, and PRD).
We have found that high PM2.5 concentrations in YRD are associated with suppressed cold, dry air flow from the north and with reduced inflow of maritime air masses. These circulation patterns are associated with weak pressure gradients between the Siberian High and the Maritime Continent Low (negative values of ISLP_YRD). Such reduced pressure gradients may also alter the transport of pollutants into the YRD region from polluted regions to the north and south and suppress the outflow of local pollutants from the region. To investigate this, we examine the sensitivity of PM2.5 in YRD to local emissions and to those from the surrounding upwind and downwind regions. We compare the results from 6 years of the nudged simulation (2014–2019 meteorology with emissions for the year 2014) with those of three 6-year sensitivity simulations for the same period with reduced emissions over three regions: YRD (red grid cells in Fig. 8), northern China (top blue grid cells in Fig. 8), and southern China (bottom blue grid cells in Fig. 8) as shown in Table 1. In each of the sensitivity simulations, the main anthropogenic sources of PM2.5 (sulfur dioxide, black carbon, and organic carbon) are reduced to the values projected for the SSP3-7.0 pathway for 2058 over one of the three regions to avoid using idealised changes. Accordingly, the winter mean emission flux of these sources of PM2.5 decreases by 41 % from 2014 (CMIP6 historical) to 2058 (CMIP6 SSP3-7.0) for all three regions (Table S1 in the Supplement).
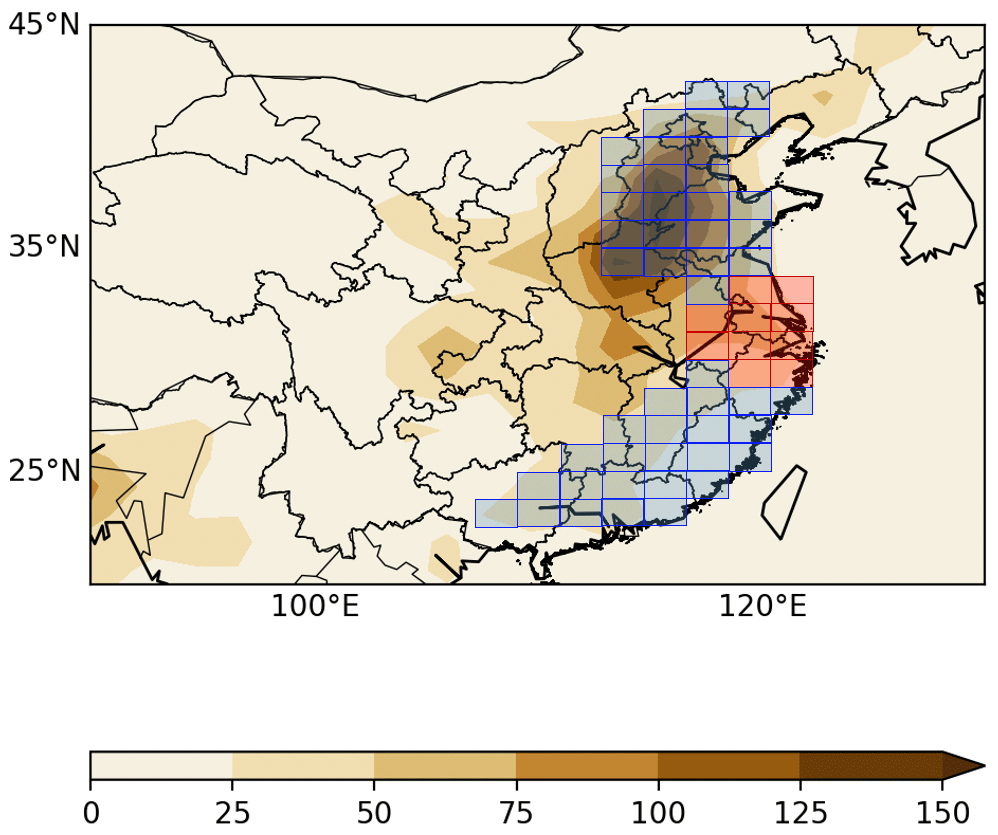
Figure 8Spatial distribution of the winter mean daily PM2.5 concentrations (µg m−3) simulated by UKESM1 across China during DJF 2014–2018 (shaded colours) and UKESM1 model grid cells representing northern China (top blue grid cells), YRD (red grid cells), and southern China (bottom blue grid cells).
The winter daily mean PM2.5 concentration in YRD during DJF 2014–2018 is 46.9 µg m−3 (average value over the red grid cells in Fig. 8). After reducing emissions over YRD, northern China, and southern China, the daily mean PM2.5 concentration in YRD decreases by 3.1, 1.4, and 0.0 µg m−3, respectively. This indicates that PM2.5 pollution over YRD mainly originates locally (69 %) and, to a lesser extent, from northern China (31 %), as found in other studies (e.g. Li et al., 2012; Ren et al., 2021). We then focus on heavily polluted days (PM2.5 above p90) in YRD, for which the daily mean PM2.5 concentration is 53.9 µg m−3 higher than the winter mean value. Because of this, at the same level of emission reduction, heavily polluted days are impacted more strongly, and daily mean PM2.5 concentration in YRD decreases by 8.5, 3.4, and 1.0 µg m−3.
To examine the impact of the large-scale circulation on the contribution of emissions from local and surrounding regions, we show the changes in PM2.5 concentrations separately for all days during DJF 2014–2018 with and ISLP_YRD>1 in Fig. 9. On days with , PM2.5 pollution mainly accumulates over northern, central, and eastern China, with PM2.5 concentrations over YRD exceeding the winter mean by 14.3 µg m−3 (Fig. 9a). After reducing emissions over YRD, northern China, and southern China, the daily mean PM2.5 concentration in YRD decreases by 3.6, 1.4, and 0.2 µg m−3, respectively (Fig. 9b–d). The relative shares of the total reduction (5.2 µg m−3) from local (69 %), north (27 %), and south (4 %) are similar to those for the winter mean. On days with ISLP_YRD>1, the PM2.5 concentrations over YRD are reduced to 16.6 µg m−3 below the winter mean (Fig. 9e). The reductions in mean PM2.5 concentrations over YRD from local, north, and south are 2.1 µg m−3 (57 %), 1.5 µg m−3 (40 %), and 0.1 µg m−3 (3 %). The differences in the relative shares for days with and ISLP_YRD>1 reflect the impact of the atmospheric circulation patterns on the sensitivity of PM2.5 in YRD to emissions from local and surrounding regions. Local emissions contribute more to PM2.5 pollution over YRD for days with , because these days are associated with suppressed transport of pollutants and lower precipitation. Emissions from northern China contribute more to PM2.5 pollution over YRD for days with ISLP_YRD>1 due to the southward aerosol transport to YRD on these days (e.g. Wang et al., 2016; Jeong and Park, 2017).
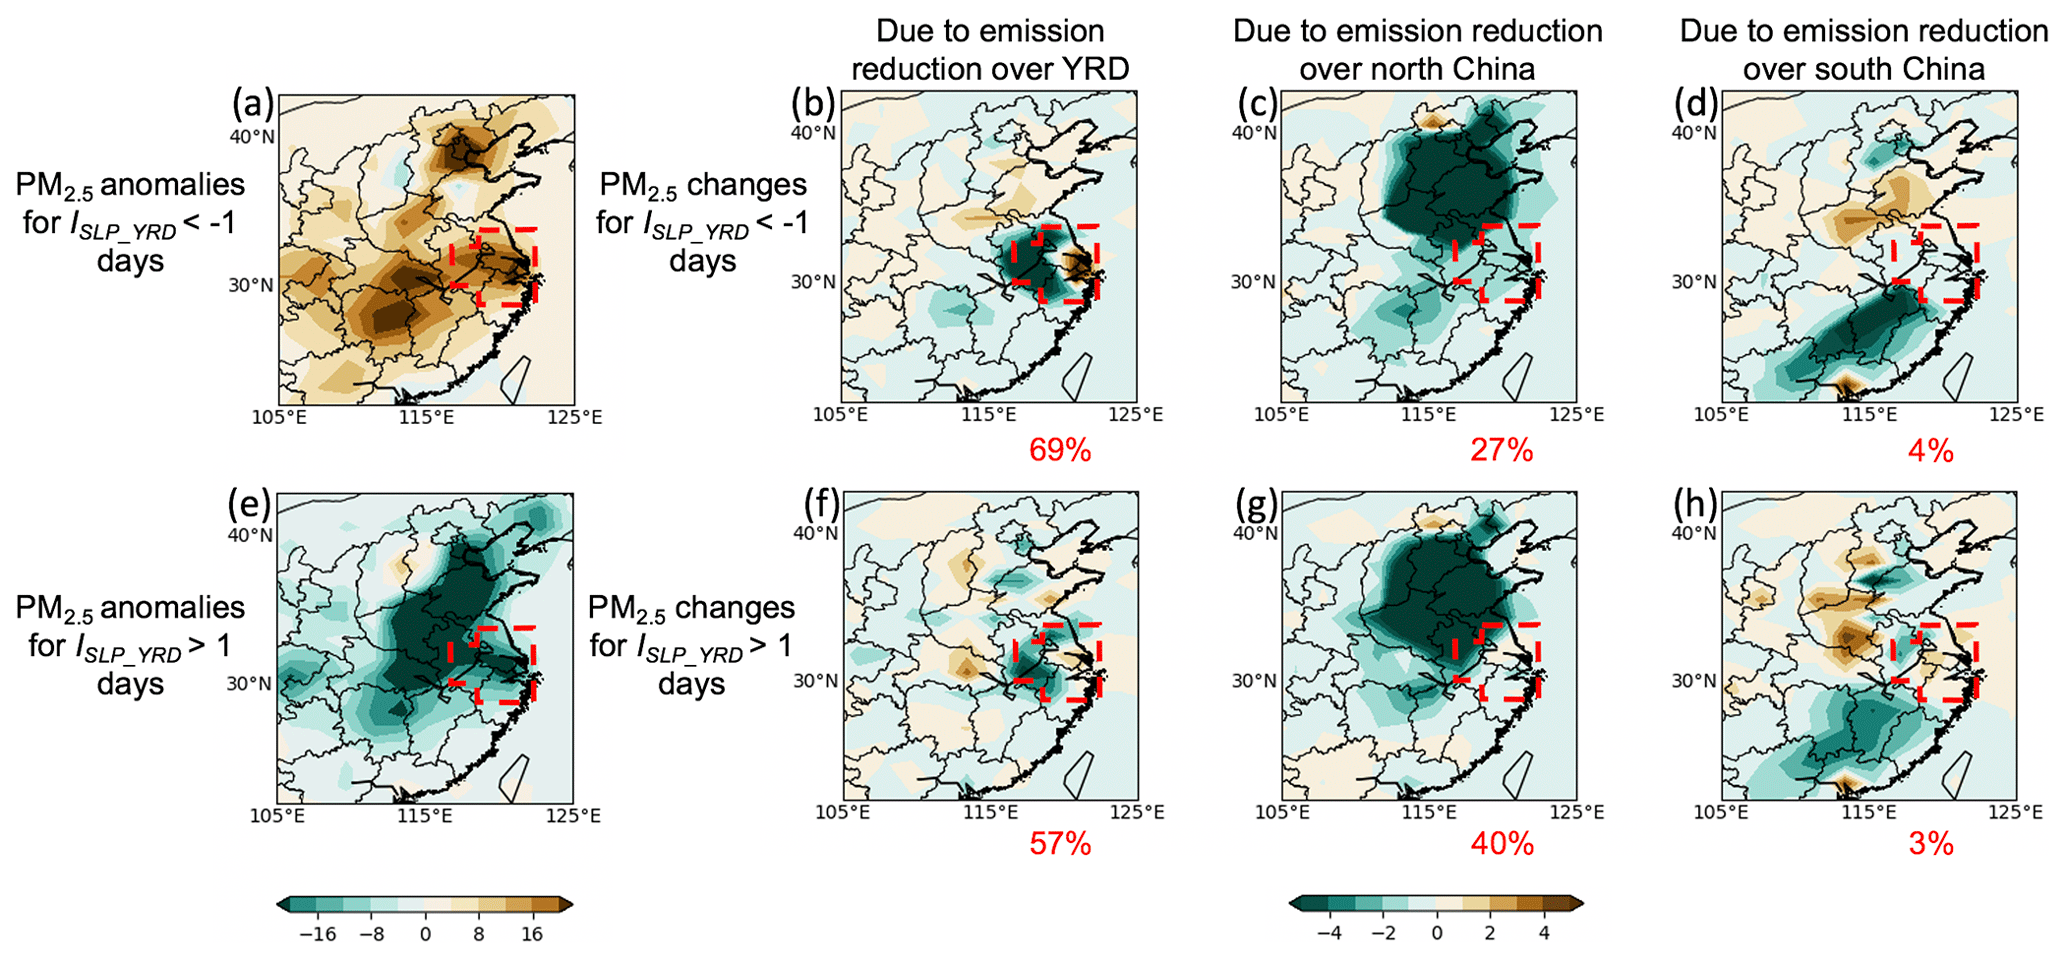
Figure 9PM2.5 anomalies with respect to the winter mean (µg m−3) for (a) days with I and (e) days with ISLP_YRD>1 during DJF 2014–2018, and PM2.5 changes (µg m−3) for the same days due to emission reductions over (b, f) YRD, (c, g) northern China, and (d, h) southern China. The red box represents the YRD region. The relative shares of the total PM2.5 reduction over YRD from local, north, and south are labelled in the bottom right of panels (b)–(d) and (f)–(h).
Note that, although the daily mean PM2.5 concentration averaged in YRD decreases due to emission reductions within the region, some increases can be found over the coast (eastern edge of the red box in Fig. 9b, f). This is related to the increase in organic carbon emissions from fossil fuel combustion from historical 2014 to SSP3-7.0 2058 (Fig. S5a) that leads to increases in both organic matter (Fig. S5b) and PM2.5 (Fig. S5c) concentrations there. However, the results of this study should not be heavily impacted by this as we focus on the broader YRD region, where the winter emission changes in the main anthropogenic sources of PM2.5 are dominated by a reduction in sulfur dioxide, leading to a total emission decrease of 41 % from 2014 to 2058 (Table S1).
We have shown that our SLP gradient-based index (ISLP_YRD) performs well in capturing the dominant relationship between the large-scale circulation and PM2.5 and in distinguishing PM2.5 pollution levels in YRD. This suggests that ISLP_YRD can serve as a robust indicator of PM2.5 pollution over YRD, assuming that its variation is solely due to meteorology. In this section, we project future PM2.5 concentrations over YRD, using ISLP_YRD derived from UKESM1 CMIP6 data from the present day to the end of the 21st century and the relationship between PM2.5 concentrations and ISLP_YRD derived from the nudged UKESM1 run for DJF 1999–2018.
We compare the winter daily values of ISLP_YRD for the CMIP6 historical (1999–2014) period from nudged UKESM1 simulations with those calculated using data from the CMIP6 UKESM1 historical simulation. The frequency distributions of daily mean ISLP_YRD from these two datasets match well (Fig. S6), suggesting that the CMIP6 UKESM1 simulations can be used to project ISLP_YRD in the future under the SSP3-7.0 scenario. Compared to the present-day (1995–2014) mean, the projected ISLP_YRD decreases gradually to mid-century (2039–2058) and end of the century (2079–2098) (Fig. 10). This suggests a weakening of the pressure gradient between the Siberian High and the Maritime Continent Low under climate change. Furthermore, the interannual variability of ISLP_YRD and therefore of the circulation patterns affecting PM2.5 increases from present day until end of the century. We have also examined changes in the circulation-based indices identified for BTH and PRD (Fig. S7). In contrast to ISLP_YRD, both IV850_BTH and ISLP_PRD exhibit little change from the present day to the end of the century.
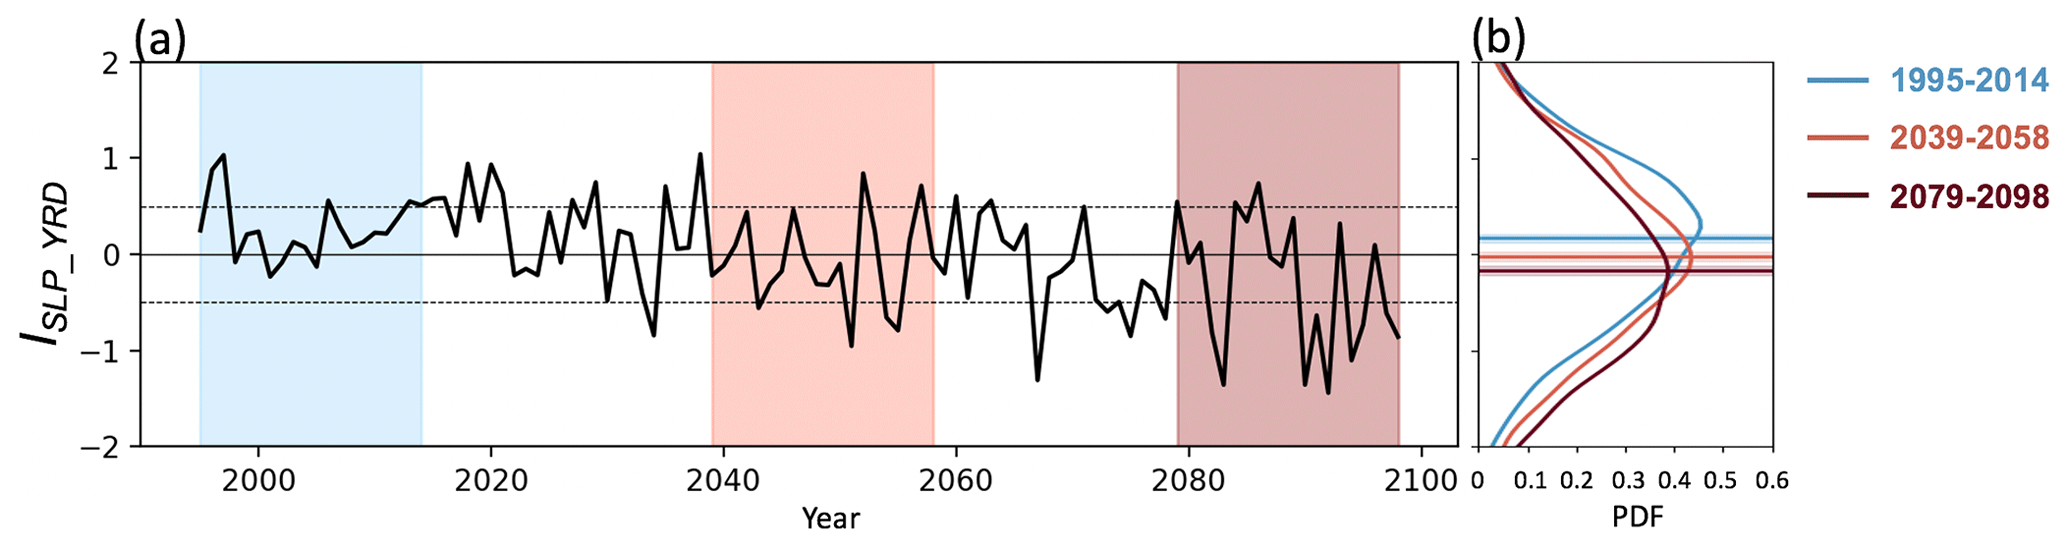
Figure 10(a) Time series of winter mean ISLP_YRD from historical (1995–2014) and future (2015–2098, SSP3-7.0) simulations of UKESM1 in the CMIP6 archive. Blue, orange and red areas represent present day (1995–2014), mid-century (2039–2058), and end of the century (2079–2098), respectively. (b) Frequency distributions of daily mean ISLP_YRD during winter over each period. The horizontal lines and shading represent the mean values and the associated 95 % confidence intervals, respectively.
The simulated future decrease in ISLP_YRD and the negative relationship between ISLP_YRD and PM2.5 concentrations over YRD during DJF 1999–2018 found in Sect. 4 suggest that PM2.5 concentrations over YRD are likely to increase in the future as a result of climate-driven changes in circulation in the absence of future emission changes. To verify this conjecture, we calculate the expected PM2.5 concentrations for the different values of ISLP_YRD in the nudged simulation for DJF 1999–2018 (Fig. S8) and derive a relationship that can be used to estimate PM2.5 in the CMIP6 UKESM1 simulations. As there is non-linearity and considerable spread, a resampling method is used. We first divide ISLP_YRD into bins of 0.1 width and then draw 10 000 values randomly from the set of PM2.5 concentrations within each bin. The estimated PM2.5 concentration in a given bin is calculated as the mean of the corresponding sample of 10 000 values. Winter daily PM2.5 concentrations over YRD are calculated first by applying this relationship to ISLP_YRD values derived from the CMIP6 UKESM1 historical simulation for 1999–2014. The mean value of these calculated winter daily PM2.5 concentrations (48.4 µg m−3) closely matches that directly diagnosed by nudged UKESM1 (48.3 µg m−3).
We then use the same relationship to project winter daily PM2.5 concentrations over YRD for present day (1995–2014), mid-century (2039–2058), and end of the century (2079–2098). The mean PM2.5 concentration increases from present day (46.3 µg m−3) to mid-century (48.9 µg m−3) and to end of the century (50.1 µg m−3) (Fig. S9). This suggests that winter PM2.5 concentrations over YRD will continue to increase until the end of the century under the SSP3-7.0 scenario if there is no change in PM2.5 emission sources. Although the SSP3-7.0 pathway encompasses some emission control measures on the main anthropogenic sources of PM2.5 (Table S1), the expected air quality improvements are likely to be partially offset by an increase in PM2.5 concentrations associated with a weaker pressure gradient between the Siberian High and the Maritime Continent Low. UKESM1 simulations from CMIP6 following the SSP3-7.0 pathway suggest that PM2.5 concentrations in YRD are not expected to change substantially by mid-century. This indicates that the effects on PM2.5 of the circulation changes we calculate due to climate change may still play an important role in the near term despite local emission changes. Nevertheless, by the end of the 21st century, the benefits from emission reduction measures outweigh any penalties from circulation changes.
This study investigates the influence of the large-scale circulation on daily PM2.5 concentrations and their sensitivity to local and regional emissions in China during winter. Using simulations with a state-of-the-art Earth system model (UKESM1) for DJF 1999–2018 with fixed 2014 emissions, we identify the dominant large-scale circulation patterns that display the strongest relationships with daily PM2.5 concentrations in major populated regions of China (BTH, YRD, and PRD), with a focus on YRD. The pressure gradient between the Siberian High and the Maritime Continent Low is found to have a strong relationship with daily PM2.5 concentrations over YRD (). This negative correlation indicates that suppressed cold, dry air flow from the north and reduced inflow of maritime air associated with a weak north–south pressure gradient contribute to air pollution accumulation in the region. We therefore propose a new north–south sea level pressure gradient-based index for YRD (ISLP_YRD). There are few existing daily circulation indices defined for the region, and we demonstrate that ISLP_YRD can explain the day-to-day variability of PM2.5 concentrations and predict the occurrence of heavily polluted (PM2.5 above p90), moderately polluted (PM2.5 within p50–90), moderately clean (PM2.5 within p10–50), and clean (PM2.5 below p10) days.
By performing sensitivity simulations for DJF 2014–2018 with reduced emissions following the SSP3-7.0 scenario for 2058 over different regions, we find that local emissions contribute most to PM2.5 pollution over YRD and that the sensitivity to emissions can be affected by the dominant large-scale circulation patterns. On days with , a weak pressure gradient, through reduced transport and precipitation, supports the accumulation of PM2.5 from local emissions over the region. On days with ISLP_YRD>1, a strong pressure gradient permits effective transport of northerly cold, dry air contributing to the inflow of air pollutants from northern China.
Based on the simulated relationship between PM2.5 and ISLP_YRD with fixed emissions and the daily values of ISLP_YRD derived from CMIP6 UKESM1 simulations, we project future changes in PM2.5 concentrations over YRD. We find a decrease in ISLP_YRD into the future. This suggests that winter mean climate-driven PM2.5 concentrations over the region will increase over the century under the SSP3-7.0 pathway. We note, however, that emissions under SSP3-7.0 decrease over the YRD region, which should lead to reduced PM2.5 levels. Overall, the calculated climate- and emission-driven PM2.5 concentrations from CMIP6 UKESM1 simulations change little by mid-century. Therefore, future changes in the large-scale circulation (i.e. a weaker pressure gradient between the Siberian High and the Maritime Continent Low) are likely to remain important in the near term, partly offsetting any reduction in emissions. This highlights the importance of climate-driven circulation changes in regulating future air quality, as found in previous studies (e.g. Pei et al., 2020; Yang et al., 2021). More stringent emission controls to offset climate change are required to ensure future PM2.5 reductions along this high forcing pathway.
Future changes in PM2.5 concentrations over YRD projected in this study are driven by circulation changes under a high climate forcing scenario (SSP3-7.0) and do not consider the effect of emissions of the main PM2.5 components and precursors. We have also projected changes in the circulation-based index for YRD under two low climate forcing scenarios. Figure S10 shows the time series of winter mean ISLP_YRD from historical (1995–2014) and future (2015–2098, SSP1-2.6 and SSP2-4.5) simulations of UKESM1 in the CMIP6 archive. An overall decrease in ISLP_YRD and an increase in the interannual variability of ISLP_YRD can also be projected under the low forcing scenarios, although the ISLP_YRD decreases are less dramatic than that under SSP3-7.0 (Fig. 10a). The mean value of ISLP_YRD is reduced from 0.14 in 1995–2014 to −0.02 (SSP1-2.6), −0.05 (SSP2-4.5), and −0.16 (SSP3-7.0) in 2079–2098. A weakening of the Siberian High is simulated by most CMIP5 and CMIP6 models for global temperature increases of 2 ∘C or more (Miao et al., 2020; Zhao et al., 2021). Therefore, we expect that a decrease in ISLP_YRD representing a weaker pressure gradient between the Siberian High and the Maritime Continent Low is very likely to be simulated by other climate models as well, especially under high forcing scenarios.
This study benefits from the state-of-the-art Earth system model UKESM1, but there is still some uncertainty in the simulated PM2.5 concentrations. Like other global models, UKESM1 has a coarse horizontal resolution (1.875∘ in longitude and 1.25∘ in latitude) which limits the representation of regional meteorological fields (Chen et al., 2012; Zha et al., 2020; Xu et al., 2021) that depend on sub-grid-scale processes (e.g. relative humidity, surface wind speed). These may impact their ability to simulate secondary aerosol formation and growth and the ventilation of air pollutants. Moreover, PM2.5 concentrations are generally underestimated in CMIP6 models (Turnock et al., 2020), including UKESM1, and this may be due to the absence or underrepresentation of some aerosol formation processes (e.g. nitrate and anthropogenic secondary organic aerosols). Nevertheless, the influence of the winter large-scale circulation on daily concentrations of PM2.5 and the sensitivity to emissions found in this study should not be heavily impacted by this, as these results are based on the day-to-day variability of PM2.5 concentrations rather than on absolute PM2.5 concentrations.
The python code generated in this study is available upon request (contact author).
The data generated in this study are available upon request (contact author). The daily meteorological data derived from the CMIP6 UKESM1 historical experiment and future scenario SSP3-7.0 are publicly available and the web link is: https://esgf-node.llnl.gov/search/cmip6/ (ESGF, 2023; last access: 1 March 2023).
The supplement related to this article is available online at: https://doi.org/10.5194/acp-23-2829-2023-supplement.
ZJ, CO, RMD and OW designed the study. ZJ and STT set up the model. ZJ ran model simulations and performed the analysis. ZJ prepared the paper with contributions from all the co-authors.
The contact author has declared that none of the authors has any competing interests.
Publisher's note: Copernicus Publications remains neutral with regard to jurisdictional claims in published maps and institutional affiliations.
Oliver Wild and Ruth M. Doherty thank the Natural Environment Research Council (NERC) for funding under grant nos. NE/N006925/1, NE/N006976/1, and NE/N006941/1. Steven T. Turnock thanks the UK–China Research and Innovation Partnership Fund through the Met Office Climate Science for Service Partnership (CSSP) China as part of the Newton Fund. This work made use of computation resources on the Met Office and NERC joint supercomputer system (MONSooN) in the UK.
This research has been supported by the Natural Environment Research Council (grant nos. NE/N006925/1, NE/N006976/1, and NE/N006941/1).
This paper was edited by Aijun Ding and reviewed by two anonymous referees.
An, Z., Huang, R. J., Zhang, R., Tie, X., Li, G., Cao, J., Zhou, W., Shi, Z., Han, Y., Gu, Z., and Ji, Y.: Severe haze in northern China: A synergy of anthropogenic emissions and atmospheric processes, P. Natl. Acad. Sci. USA, 116, 8657–8666, https://doi.org/10.1073/pnas.1900125116, 2019.
Archibald, A. T., O'Connor, F. M., Abraham, N. L., Archer-Nicholls, S., Chipperfield, M. P., Dalvi, M., Folberth, G. A., Dennison, F., Dhomse, S. S., Griffiths, P. T., Hardacre, C., Hewitt, A. J., Hill, R. S., Johnson, C. E., Keeble, J., Köhler, M. O., Morgenstern, O., Mulcahy, J. P., Ordóñez, C., Pope, R. J., Rumbold, S. T., Russo, M. R., Savage, N. H., Sellar, A., Stringer, M., Turnock, S. T., Wild, O., and Zeng, G.: Description and evaluation of the UKCA stratosphere–troposphere chemistry scheme (StratTrop vn 1.0) implemented in UKESM1, Geosci. Model Dev., 13, 1223–1266, https://doi.org/10.5194/gmd-13-1223-2020, 2020.
Butt, E. W., Turnock, S. T., Rigby, R., Reddington, C. L., Yoshioka, M., Johnson, J. S., Regayre, L. A., Pringle, K. J., Mann, G. W., and Spracklen, D. V.: Global and regional trends in particulate air pollution and attributable health burden over the past 50 years, Environ. Res. Lett., 12, 104017, https://doi.org/10.1088/1748-9326/aa87be, 2017.
Cai, W., Li, K., Liao, H., Wang, H., and Wu, L.: Weather conditions conducive to Beijing severe haze more frequent under climate change, Nat. Clim. Change, 7, 257–262, https://doi.org/10.1038/nclimate3249, 2017.
Chan, C. K. and Yao, X.: Air pollution in mega cities in China, Atmos. Environ., 42, 1–42, https://doi.org/10.1016/j.atmosenv.2007.09.003, 2008.
Chang, C. P., Wang, Z., and Hendon, H.: The Asian winter monsoon, in: The Asian Monsoon, 89–127, Springer, Berlin, Heidelberg, ISBN 9783540377221, ISBN 3540377220, 2006.
Chen, D., Liu, X., Lang, J., Zhou, Y., Wei, L., Wang, X., and Guo, X.: Estimating the contribution of regional transport to PM2.5 air pollution in a rural area on the North China Plain, Sci. Total. Environ., 583, 280–291, https://doi.org/10.1016/j.scitotenv.2017.01.066, 2017.
Chen, L., Pryor, S. C., and Li, D.: Assessing the performance of Intergovernmental Panel on Climate Change AR5 climate models in simulating and projecting wind speeds over China, J. Geophys. Res.-Atmos., 117, D24, https://doi.org/10.1029/2012JD017533, 2012.
Cheng, J., Su, J., Cui, T., Li, X., Dong, X., Sun, F., Yang, Y., Tong, D., Zheng, Y., Li, Y., Li, J., Zhang, Q., and He, K.: Dominant role of emission reduction in PM2.5 air quality improvement in Beijing during 2013–2017: a model-based decomposition analysis, Atmos. Chem. Phys., 19, 6125–6146, https://doi.org/10.5194/acp-19-6125-2019, 2019.
Dee, D. P., Uppala, S. M., Simmons, A. J., Berrisford, P., Poli, P., Kobayashi, S., Andrae, U., Balmaseda, M. A., Balsamo, G., Bauer, P., Bechtold, P., Beljaars, A. C. M., van de Berg, I., Biblot, J., Bormann, N., Delsol, C., Dragani, R., Fuentes, M., Greer, A. J., Haimberger, L., Healy, S. B., Hersbach, H., Holm, E. V., Isaksen, L., Kallberg, P., Kohler, M., Matricardi, M., McNally, A. P., Mong-Sanz, B. M., Morcette, J.-J., Park, B.-K., Peubey, C., de Rosnay, P., Tavolato, C., Thepaut, J. N., and Vitart, F.: The ERA-Interim reanalysis: Configuration and performance of the data assimilation system, Q. J. Roy. Meteor. Soc., 137, 553–597, https://doi.org/10.1002/qj.828, 2011.
Ding, A. J., Fu, C. B., Yang, X. Q., Sun, J. N., Zheng, L. F., Xie, Y. N., Herrmann, E., Nie, W., Petäjä, T., Kerminen, V.-M., and Kulmala, M.: Ozone and fine particle in the western Yangtze River Delta: an overview of 1 yr data at the SORPES station, Atmos. Chem. Phys., 13, 5813–5830, https://doi.org/10.5194/acp-13-5813-2013, 2013.
Ding, Y., Ren, G., Zhao, Z., Xu, Y., Luo, Y., Li, Q., and Zhang, J.: Detection, causes and projection of climate change over China: an overview of recent progress, Adv. Atmos. Sci., 24, 954–971, https://doi.org/10.1007/s00376-007-0954-4, 2007.
Du, X., Shi, G., Zhao, T., Yang, F., Zheng, X., Zhang, Y., and Tan, Q.: Contribution of secondary particles to wintertime PM2.5 during 2015–2018 in a major urban area of the Sichuan Basin, Southwest China, Earth Space Sci., 7, e2020EA001194, https://doi.org/10.1029/2020EA001194, 2020.
ESGF: WCRP – CMIP6, World Climate Research Programm, ESGF [data set], https://esgf-node.llnl.gov/search/cmip6/, last access: 1 March 2023.
Eyring, V., Bony, S., Meehl, G. A., Senior, C. A., Stevens, B., Stouffer, R. J., and Taylor, K. E.: Overview of the Coupled Model Intercomparison Project Phase 6 (CMIP6) experimental design and organization, Geosci. Model Dev., 9, 1937–1958, https://doi.org/10.5194/gmd-9-1937-2016, 2016.
Feng, J., Guo, Z., Zhang, T., Yao, X., Chan, C., and Fang, M.: Source and formation of secondary particulate matter in PM2.5 in Asian continental outflow, J. Geophys. Res.-Atmos., 117, D3, https://doi.org/10.1029/2011JD016400, 2012.
Ge, W., Yin, Y., Wright, J. S., Huang, W., Jia, B., Wang, Y., and Yang, Z.: Links Between the Large-Scale Circulation and Daily Air Quality Over Central Eastern China During Winter, J. Geophys. Res.-Atmos., 124, 7147–7163, https://doi.org/10.1029/2018JD030154, 2019.
He, K., Zhao, Q., Ma, Y., Duan, F., Yang, F., Shi, Z., and Chen, G.: Spatial and seasonal variability of PM2.5 acidity at two Chinese megacities: insights into the formation of secondary inorganic aerosols, Atmos. Chem. Phys., 12, 1377–1395, https://doi.org/10.5194/acp-12-1377-2012, 2012.
Hewitt, H. T., Copsey, D., Culverwell, I. D., Harris, C. M., Hill, R. S. R., Keen, A. B., McLaren, A. J., and Hunke, E. C.: Design and implementation of the infrastructure of HadGEM3: the next-generation Met Office climate modelling system, Geosci. Model Dev., 4, 223–253, https://doi.org/10.5194/gmd-4-223-2011, 2011.
Hou, X., Fei, D., Kang, H., Zhang, Y., and Gao, J.: Seasonal statistical analysis of the impact of meteorological factors on fine particle pollution in China in 2013–2017, Nat. Hazards, 93, 677–698, https://doi.org/10.1007/s11069-018-3315-y, 2018.
Hou, X., Zhu, B., Kumar, K. R., and Lu, W.: Inter-annual variability in fine particulate matter pollution over China during 2013–2018: Role of meteorology, Atmos. Environ., 214, 116842, https://doi.org/10.1016/j.atmosenv.2019.116842, 2019.
Hou, X., Zhu, B., Kumar, K. R., de Leeuw, G., Lu, W., Huang, Q., and Zhu, X.: Establishment of conceptual schemas of surface synoptic meteorological situations affecting fine particulate pollution across eastern China in the winter, J. Geophys. Res.-Atmos., 125, e2020JD033153, https://doi.org/10.1029/2020JD033153, 2020.
Hu, W. Y., Zhao, T. L., Bai, Y. Q., Kong, S. F., Xiong, J., Sun, X. Y., Yang, Q. J., Gu, Y., and Lu, H. C.: Importance of regional PM2.5 transport and precipitation washout in heavy air pollution in the Twain-Hu Basin over Central China: Observational analysis and WRF-Chem simulation, Sci. Total Environ., 758, 143710, https://doi.org/10.1016/j.scitotenv.2020.143710, 2021.
Huang, R. J., Zhang, Y., Bozzetti, C., Ho, K. F., Cao, J. J., Han, Y., Daellenbach, K. R., Slowik, J. G., Platt, S. M., Canonaco, F., and Zotter, P.: High secondary aerosol contribution to particulate pollution during haze events in China, Nature, 514, 218–222, https://doi.org/10.1038/nature13774, 2014.
Jeong, J. I. and Park, R. J.: Winter monsoon variability and its impact on aerosol concentrations in East Asia, Environ. Pollut., 221, 285–292, https://doi.org/10.1016/j.envpol.2016.11.075, 2017.
Jia, B., Wang, Y., Yao, Y., and Xie, Y.: A new indicator on the impact of large-scale circulation on wintertime particulate matter pollution over China, Atmos. Chem. Phys., 15, 11919–11929, https://doi.org/10.5194/acp-15-11919-2015, 2015.
Jia, Z., Doherty, R. M., Ordóñez, C., Li, C., Wild, O., Jain, S., and Tang, X.: The impact of large-scale circulation on daily fine particulate matter (PM2.5) over major populated regions of China in winter, Atmos. Chem. Phys., 22, 6471–6487, https://doi.org/10.5194/acp-22-6471-2022, 2022.
Kong, L., Tang, X., Zhu, J., Wang, Z., Li, J., Wu, H., Wu, Q., Chen, H., Zhu, L., Wang, W., Liu, B., Wang, Q., Chen, D., Pan, Y., Song, T., Li, F., Zheng, H., Jia, G., Lu, M., Wu, L., and Carmichael, G. R.: A 6-year-long (2013–2018) high-resolution air quality reanalysis dataset in China based on the assimilation of surface observations from CNEMC, Earth Syst. Sci. Data, 13, 529–570, https://doi.org/10.5194/essd-13-529-2021, 2021.
Li, M., Huang, X., Zhu, L., Li, J., Song, Y., Cai, X. and Xie, S.: Analysis of the transport pathways and potential sources of PM10 in Shanghai based on three methods, Sci. Total Environ., 414, 525–534, https://doi.org/10.1016/j.scitotenv.2011.10.054, 2012.
Leung, D. M., Tai, A. P. K., Mickley, L. J., Moch, J. M., van Donkelaar, A., Shen, L., and Martin, R. V.: Synoptic meteorological modes of variability for fine particulate matter (PM2.5) air quality in major metropolitan regions of China, Atmos. Chem. Phys., 18, 6733–6748, https://doi.org/10.5194/acp-18-6733-2018, 2018.
Liao, H., Chang, W., and Yang, Y.: Climatic effects of air pollutants over China: A review, Adv. Atmos. Sci., 32, 115–139, https://doi.org/10.1007/s00376-014-0013-x, 2015.
Mann, G. W., Carslaw, K. S., Spracklen, D. V., Ridley, D. A., Manktelow, P. T., Chipperfield, M. P., Pickering, S. J., and Johnson, C. E.: Description and evaluation of GLOMAP-mode: a modal global aerosol microphysics model for the UKCA composition-climate model, Geosci. Model Dev., 3, 519–551, https://doi.org/10.5194/gmd-3-519-2010, 2010.
Meinshausen, M., Vogel, E., Nauels, A., Lorbacher, K., Meinshausen, N., Etheridge, D. M., Fraser, P. J., Montzka, S. A., Rayner, P. J., Trudinger, C. M., Krummel, P. B., Beyerle, U., Canadell, J. G., Daniel, J. S., Enting, I. G., Law, R. M., Lunder, C. R., O'Doherty, S., Prinn, R. G., Reimann, S., Rubino, M., Velders, G. J. M., Vollmer, M. K., Wang, R. H. J., and Weiss, R.: Historical greenhouse gas concentrations for climate modelling (CMIP6), Geosci. Model Dev., 10, 2057–2116, https://doi.org/10.5194/gmd-10-2057-2017, 2017.
Meinshausen, M., Nicholls, Z. R. J., Lewis, J., Gidden, M. J., Vogel, E., Freund, M., Beyerle, U., Gessner, C., Nauels, A., Bauer, N., Canadell, J. G., Daniel, J. S., John, A., Krummel, P. B., Luderer, G., Meinshausen, N., Montzka, S. A., Rayner, P. J., Reimann, S., Smith, S. J., van den Berg, M., Velders, G. J. M., Vollmer, M. K., and Wang, R. H. J.: The shared socio-economic pathway (SSP) greenhouse gas concentrations and their extensions to 2500, Geosci. Model Dev., 13, 3571–3605, https://doi.org/10.5194/gmd-13-3571-2020, 2020.
Miao, Y. C., Hu, X. M., Liu, S. H., Qian, T. T., Xue, M., Zheng, Y. J., and Wang, S.: Seasonal variation of local atmospheric circulations and boundary layer structure in the Beijing-Tianjin-Hebei region and implications for air quality, J. Adv. Model. Earth Sy., 7, 1602–1626, https://doi.org/10.1002/2015MS000522, 2015.
Miao, J., Wang, T., and Chen, D.: More robust changes in the East Asian winter monsoon from 1.5 to 2.0 ∘C global warming targets, Int. J. Climatol., 40, 4731–4749, https://doi.org/10.1002/joc.6485, 2020.
Morgenstern, O., Braesicke, P., O'Connor, F. M., Bushell, A. C., Johnson, C. E., Osprey, S. M., and Pyle, J. A.: Evaluation of the new UKCA climate-composition model – Part 1: The stratosphere, Geosci. Model Dev., 2, 43–57, https://doi.org/10.5194/gmd-2-43-2009, 2009.
Mulcahy, J. P., Johnson, C., Jones, C. G., Povey, A. C., Scott, C. E., Sellar, A., Turnock, S. T., Woodhouse, M. T., Abraham, N. L., Andrews, M. B., Bellouin, N., Browse, J., Carslaw, K. S., Dalvi, M., Folberth, G. A., Glover, M., Grosvenor, D. P., Hardacre, C., Hill, R., Johnson, B., Jones, A., Kipling, Z., Mann, G., Mollard, J., O'Connor, F. M., Palmiéri, J., Reddington, C., Rumbold, S. T., Richardson, M., Schutgens, N. A. J., Stier, P., Stringer, M., Tang, Y., Walton, J., Woodward, S., and Yool, A.: Description and evaluation of aerosol in UKESM1 and HadGEM3-GC3.1 CMIP6 historical simulations, Geosci. Model Dev., 13, 6383–6423, https://doi.org/10.5194/gmd-13-6383-2020, 2020.
O'Connor, F. M., Johnson, C. E., Morgenstern, O., Abraham, N. L., Braesicke, P., Dalvi, M., Folberth, G. A., Sanderson, M. G., Telford, P. J., Voulgarakis, A., Young, P. J., Zeng, G., Collins, W. J., and Pyle, J. A.: Evaluation of the new UKCA climate-composition model – Part 2: The Troposphere, Geosci. Model Dev., 7, 41–91, https://doi.org/10.5194/gmd-7-41-2014, 2014.
O'Neill, B. C., Kriegler, E., Riahi, K., Ebi, K. L., Hallegatte, S., Carter, T. R., Mathur, R., and van Vuuren, D. P.: A new scenario framework for climate change research: the concept of shared socioeconomic pathways, Clim. Change, 122, 387–400, https://doi.org/10.1007/s10584-013-0905-2, 2014.
Pei, L., Yan, Z., Sun, Z., Miao, S., and Yao, Y.: Increasing persistent haze in Beijing: potential impacts of weakening East Asian winter monsoons associated with northwestern Pacific sea surface temperature trends, Atmos. Chem. Phys., 18, 3173–3183, https://doi.org/10.5194/acp-18-3173-2018, 2018.
Pei, L., Yan, Z., Chen, D., and Miao, S.: Climate variability or anthropogenic emissions: which caused Beijing haze?, Environ. Res. Lett., 15, p. 034004, https://doi.org/10.1088/1748-9326/ab6f11, 2020.
Ren, L., Yang, Y., Wang, H., Wang, P., Chen, L., Zhu, J., and Liao, H.: Aerosol transport pathways and source attribution in China during the COVID-19 outbreak, Atmos. Chem. Phys., 21, 15431–15445, https://doi.org/10.5194/acp-21-15431-2021, 2021.
Reynolds, R. W., Smith, T. M., Liu, C., Chelton, D. B., Casey, K. S., and Schlax, M. G.: Daily high-resolution-blended analyses for sea surface temperature, J. Climate, 20, 5473–5496, https://doi.org/10.1175/2007jcli1824.1, 2007.
Sellar, A. A., Jones, C. G., Mulcahy, J., Tang, Y., Yool, A., Wiltshire, A., O'connor, F. M., Stringer, M., Hill, R., Palmieri, J., and Woodward, S.: UKESM1: Description and evaluation of the UK Earth System Model, J. Adv. Model. Earth Syst., 11, 4513–4558, https://doi.org/10.1029/2019MS001739, 2019.
Sellar, A. A., Walton, J., Jones, C. G., Wood, R., Abraham, N. L., Andrejczuk, M., Andrews, M. B., Andrews, T., Archibald, A. T., de Mora, L., and Dyson, H: Implementation of U.K. Earth System Models for CMIP6, J. Adv. Model. Earth Systems, 12, 1–27, https://doi.org/10.1029/2019MS001946, 2020.
Sun, Y. L., Wang, Z. F., Du, W., Zhang, Q., Wang, Q. Q., Fu, P. Q., Pan, X. L., Li, J., Jayne, J., and Worsnop, D. R.: Long-term real-time measurements of aerosol particle composition in Beijing, China: seasonal variations, meteorological effects, and source analysis, Atmos. Chem. Phys., 15, 10149–10165, https://doi.org/10.5194/acp-15-10149-2015, 2015.
Sun, X., Zhao, T., Bai, Y., Kong, S., Zheng, H., Hu, W., Ma, X., and Xiong, J.: Meteorology impact on PM2.5 change over a receptor region in the regional transport of air pollutants: observational study of recent emission reductions in central China, Atmos. Chem. Phys., 22, 3579–3593, https://doi.org/10.5194/acp-22-3579-2022, 2022.
Tai, A. P., Mickley, L. J., and Jacob, D. J.: Correlations between fine particulate matter (PM2.5) and meteorological variables in the United States: Implications for the sensitivity of PM2.5 to climate change, Atmos. Environ., 44, 3976–3984, https://doi.org/10.1016/j.atmosenv.2010.06.060, 2010.
Turnock, S. T., Allen, R. J., Andrews, M., Bauer, S. E., Deushi, M., Emmons, L., Good, P., Horowitz, L., John, J. G., Michou, M., Nabat, P., Naik, V., Neubauer, D., O'Connor, F. M., Olivié, D., Oshima, N., Schulz, M., Sellar, A., Shim, S., Takemura, T., Tilmes, S., Tsigaridis, K., Wu, T., and Zhang, J.: Historical and future changes in air pollutants from CMIP6 models, Atmos. Chem. Phys., 20, 14547–14579, https://doi.org/10.5194/acp-20-14547-2020, 2020.
van Vuuren, D. P., Kriegler, E., O'Neill, B. C., Ebi, K. L., Riahi, K., Carter, T. R., Edmonds, J., Hallegatte, S., Kram, T., Mathur, R., and Winkler, H.: A new scenario framework for Climate Change Research: scenario matrix architecture, Clim. Change, 122, 373–386, https://doi.org/10.1007/s10584-013-0906-1, 2014.
von Storch, H. and Zwiers, F. W.: Statistical Analysis in Climate Research, Cambridge University Press, Cambridge, UK, 234–241, https://doi.org/10.1017/CBO9780511612336, 1999.
Walters, D., Baran, A. J., Boutle, I., Brooks, M., Earnshaw, P., Edwards, J., Furtado, K., Hill, P., Lock, A., Manners, J., Morcrette, C., Mulcahy, J., Sanchez, C., Smith, C., Stratton, R., Tennant, W., Tomassini, L., Van Weverberg, K., Vosper, S., Willett, M., Browse, J., Bushell, A., Carslaw, K., Dalvi, M., Essery, R., Gedney, N., Hardiman, S., Johnson, B., Johnson, C., Jones, A., Jones, C., Mann, G., Milton, S., Rumbold, H., Sellar, A., Ujiie, M., Whitall, M., Williams, K., and Zerroukat, M.: The Met Office Unified Model Global Atmosphere 7.0/7.1 and JULES Global Land 7.0 configurations, Geosci. Model Dev., 12, 1909–1963, https://doi.org/10.5194/gmd-12-1909-2019, 2019.
Wang, F. K.: Confidence interval for the mean of non-normal data, Qual. Reliab. Eng. Int., 17, 257–267, https://doi.org/10.1002/qre.400, 2001.
Wang, H. L., Qiao, L. P., Lou, S. R., Zhou, M., Ding, A. J., Huang, H. Y., Chen, J. M., Wang, Q., Tao, S. K., Chen, C. H., and Li, L.: Chemical composition of PM2.5 and meteorological impact among three years in urban Shanghai, China, J. Clean. Prod., 112, 1302–1311, https://doi.org/10.1016/j.jclepro.2015.04.099, 2016.
Wang, L. and Chen, W.: How well do existing indices measure the strength of the East Asian winter monsoon?, Adv. Atmos. Sci., 27, 855–870, https://doi.org/10.1007/s00376-009-9094-3, 2010.
Wang, L. and Lu, M. M.: The East Asian winter monsoon, in: The global monsoon system: research and forecast, 3rd Edn, edited by: Chang, C. P., Kuo, H. C., Lau, N. C., Johnson, R.H., Wang, B., and Wheeler, M., World Scientific, Singapore, 51–61, https://doi.org/10.1142/9789813200913_0005, 2017.
Wang, L., Zhang, N., Liu, Z., Sun, Y., Ji, D., and Wang, Y.: The influence of climate factors, meteorological conditions, and boundary-layer structure on severe haze pollution in the Beijing-Tianjin-Hebei region during January 2013, Adv. Meteorol., 2014, 685971, https://doi.org/10.1155/2014/685971, 2014.
Wang, W., Primbs, T., Tao, S., and Simonich, S. L. M.: Atmospheric particulate matter pollution during the 2008 Beijing Olympics, Environ. Sci. Technol., 43, 5314–5320, https://doi.org/10.1021/es9007504, 2009.
Xu, M. M., Xu, H. M., and Ma, J.: Responses of the east Asian winter monsoon to global warming in CMIP5 models, Int. J. Climatol., 36, 2139–2155, https://doi.org/10.1002/joc.4480, 2016.
Xu, Z., Han, Y., Tam, C. Y., Yang, Z. L., and Fu, C.: Bias-corrected CMIP6 global dataset for dynamical downscaling of the historical and future climate (1979–2100), Sci. Data, 8, 1–11, https://doi.org/10.1038/s41597-021-01079-3, 2021.
Yang, Y., Zhou, Y., Li, K., Wang, H., Ren, L., Zeng, L., Li, H., Wang, P., Li, B., and Liao, H.: Atmospheric circulation patterns conducive to severe haze in eastern China have shifted under climate change, Geophys. Res. Lett., 48 p. e2021GL095011, https://doi.org/10.1029/2021GL095011, 2021.
Zha, J., Wu, J., Zhao, D., and Fan, W.: Future projections of the near-surface wind speed over eastern China based on CMIP5 datasets, Clim. Dynam., 54, 2361–2385, https://doi.org/10.1029/2012JD017533, 2020.
Zhao, P. S., Dong, F., He, D., Zhao, X. J., Zhang, X. L., Zhang, W. Z., Yao, Q., and Liu, H. Y.: Characteristics of concentrations and chemical compositions for PM2.5 in the region of Beijing, Tianjin, and Hebei, China, Atmos. Chem. Phys., 13, 4631–4644, https://doi.org/10.5194/acp-13-4631-2013, 2013.
Zhao, S., Feng, T., Tie, X., Li, G., and Cao, J.: Air pollution zone migrates south driven by East Asian winter monsoon and climate change, Geophys. Res. Lett., 48, e2021GL092672, https://doi.org/10.1029/2021GL092672, 2021.
Zhang, G., Gao, Y., Cai, W., Leung, L. R., Wang, S., Zhao, B., Wang, M., Shan, H., Yao, X., and Gao, H.: Seesaw haze pollution in North China modulated by the sub-seasonal variability of atmospheric circulation, Atmos. Chem. Phys., 19, 565–576, https://doi.org/10.5194/acp-19-565-2019, 2019.
Zhang, R. H., Li, Q., and Zhang, R.: Meteorological conditions for the persistent severe fog and haze event over eastern China in January 2013, Sci. China Earth Sci., 57, 26–35, https://doi.org/10.1007/s11430-013-4774-3, 2014.
Zhang, Q., Zheng, Y., Tong, D., Shao, M., Wang, S., Zhang, Y., Xu, X., Wang, J., He, H., Liu, W., and Ding, Y.: Drivers of improved PM2.5 air quality in China from 2013 to 2017, P. Natl. Acad. Sci. USA, 116, 24463–24469, https://doi.org/10.1073/pnas.1907956116, 2019.
Zhang, Y.-L. and Cao, F.: Fine particulate matter (PM 2.5) in China at a city level, Sci. Rep., 5, 14884, https://doi.org/10.1038/srep14884, 2015.
Zhu, J., Liao, H., and Li, J.: Increases in aerosol concentrations over eastern China due to the decadal-scale weakening of the East Asian summer monsoon, Geophys. Res. Lett., 39, L09809, https://doi.org/10.1029/2012GL051428, 2012.
- Abstract
- Introduction
- Data and methodology
- Model evaluation of daily PM2.5 concentrations
- The impact of large-scale circulation on daily PM2.5 concentrations
- Influence of large-scale circulation on daily PM2.5 sensitivity to emissions
- Changes in circulation-based indices and PM2.5 concentrations under climate change
- Discussion and conclusions
- Code availability
- Data availability
- Author contributions
- Competing interests
- Disclaimer
- Acknowledgements
- Financial support
- Review statement
- References
- Supplement