the Creative Commons Attribution 4.0 License.
the Creative Commons Attribution 4.0 License.
 | 27 Feb 2023
Measurement report: Spatiotemporal variability of peroxy acyl nitrates (PANs) over Mexico City from TES and CrIS satellite measurements
Madison J. Shogrin
Vivienne H. Payne
Susan S. Kulawik
Kazuyuki Miyazaki
Emily V. Fischer
Peroxy acyl nitrates (PANs) are photochemical pollutants with implications for health and atmospheric oxidation capacity. PANs are formed via the oxidation of non-methane volatile organic compounds (NMVOCs) in the presence of nitrogen oxide radicals (NOx = NO + NO2). While urban environments are large sources of PANs, in situ observations in urban areas are limited. Here we use satellite measurements of PANs from the Tropospheric Emission Spectrometer (TES) and the Suomi National Polar-orbiting Partnership (S-NPP) Cross-track Infrared Sounder (CrIS) to evaluate the spatiotemporal variability of PANs over and around Mexico City. Monthly mean maxima in PANs over the Mexico City Metropolitan Area (MCMA) occur during spring months (March–May). This time of year coincides with a peak in local photochemistry and more frequent air stagnation. Local fire activity also typically peaks between February and May, which leads to strong interannual variability of PANs over the MCMA. We use S-NPP CrIS data to probe the spatial outflow pattern of PANs produced within urban Mexico City during the month with the largest mixing ratios of PANs (April). Peak outflow in April occurs to the northeast of the city and over the mountains south of the city. Outflow to the northwest appears infrequently. Using observations during 2018 versus 2019, we also show that PANs were not significantly reduced during a year, with a significant decrease in NOx over Mexico City. Our analysis demonstrates that the space-based observations provided by CrIS and TES can increase understanding of the spatiotemporal variability of PANs over and surrounding Mexico City.
- Article
(4851 KB) - Full-text XML
-
Supplement
(841 KB) - BibTeX
- EndNote


Megacities are large metropolitan areas with greater than 10 million residents (Gurjar and Lelieveld, 2005). As of 2018, roughly 55 % of the world's population resided in urban areas, and this is expected to increase to over 60 % by 2030 (UN/DESA, 2018). Megacities have become important sources of air pollutants, and these emissions contribute to regional and global trace gas budgets, as plumes emitted in megacities are redistributed away from source regions, with implications for regional air quality and photochemistry (Gurjar and Lelieveld, 2005; Lawrence et al., 2007; Madronich, 2006; Mage et al., 1996; Molina et al., 2007).
Mexico City is one of the world's largest megacities with a population greater than 20 million and is well known for its high levels of pollution and reduced visibility (Molina and Molina, 2002; Molina et al., 2009). The Mexico City Metropolitan Area (MCMA) is situated at a high altitude in the tropics (2240 m; 19.43∘ N, 99.13∘ W), and it is surrounded on three sides by mountains with a wide-open basin to the north and a mountain passage to the southeast (Chalco passage) (Fig. 1). The MCMA is particularly prone to poor air quality given the regional topography, frequently weak synoptic forcing, and emissions from a variety of sources (see Molina et al., 2007 and references within).

Figure 1Elevation map of the Mexico City region. The red star denotes the center of Mexico City, and the pink box represents the area averaged to create monthly means used throughout the analysis. This area is referred to as “urban Mexico City”. Colored boxes represent regions of potential pollutant outflow further shown in Fig. 4.
During the mid-1980s and 1990s, Mexico City was ranked as the most polluted megacity in the world with all criteria pollutants exceeding air quality standards for human health (UNEP and WHO, 1992). Pollutants of concern include ozone (O3), fine particulate matter (PM), nitrogen oxides (NOx = NO + NO2), and volatile organic compounds (VOCs). In addition to monitoring by the Mexico City atmospheric monitoring system (Sistema de Monitoreo Atmosférico or SIMAT), there have been a number of other efforts to observe and attribute regional photochemistry using in situ measurements. Analyses of field campaign datasets (e.g, MCMA-2003 and MILAGRO-2006; Molina et al., 2007, 2010) indicate that O3 formation is often VOC-limited in the urban core and largely NOx-limited in the surrounding area (Lei et al., 2007, 2008; Tie et al., 2007). The extent of NOx- versus VOC-limited regions is dependent on meteorological conditions (Lei et al., 2008; Song et al., 2010).
Peroxy acyl nitrates (PANs) are an important photochemically produced species that may play an important role in diagnosing aspects of photochemistry within the MCMA and determining the scale over which the MCMA impacts atmospheric composition. PANs are formed alongside O3 in polluted environments when non-methane volatile organic compounds (NMVOCs) are oxidized in the presence of NOx (Singh et al., 1981; Fischer et al., 2014; Gaffney et al., 1989; Roberts, 2007; Singh and Salas, 1986). The high elevation (Fig. 1) and tropical latitude of the MCMA makes for intense sunlight to the area year round, supporting efficient production of PANs given an abundance of precursors (Bravo et al., 1989; MARI, 1994; Emmons et al., 2010; Fast and Zhong, 1998; Lei et al., 2007, 2008; citations from Marley et al., 2007; Streit and Guzman, 1996; Tie et al., 2007). Substantially elevated PANs have been observed within Mexico City (Bravo et al., 1989; MARI, 1994; Emmons et al., 2010; Fast and Zhong, 1998; Gaffney et al., 1999; Lei et al., 2007, 2008; Marley et al., 2007; Streit and Guzman, 1996; Tie et al., 2007). For example, maximum daily mixing ratios in 1997 reached ∼ 34 ppbv (Gaffney et al., 1999) and a maximum of ∼ 8 ppbv was observed in 2003 (Molina et al., 2007, 2010). PANs cause a suite of health effects (Altshuller, 1978; Shepson et al., 1987; Smith, 1965; Taylor, 1969; Kleindienst et al., 1990; Vyskocil et al., 1998) and they are also critical to understanding O3 production. For example, O3 production can continue in outflow regions of the MCMA, as PANs act as a reservoir and source of NOx (Mena-Carrasco et al., 2009). The production of PANs can also help understand the photochemistry of this area (Sillman and West, 2009). PAN concentrations can be used to gauge the effectiveness of O3 control strategies in urban areas, since PANs act as an indicator of regional photochemical activity (Gaffney et al., 1989). A comparison of field campaign observations from 2003 and 2006 to observations from 2014 and 2019 indicates that there have been major changes in O3-relevant VOC sources and oxidized nitrogen chemistry since earlier studies (e.g., Lei et al., 2007, 2008; Tie et al., 2007; Zavala et al., 2020) This points to a need for continued and expanded observations of photochemically relevant species in this region, including PANs.
Here we present new satellite observations of PANs over Mexico City. We leverage measurements from the Aura Tropospheric Emission Spectrometer (TES) and the Suomi-National Polar-orbiting Partnership (S-NPP) Cross-track Infrared Sounder (CrIS), and other complementary satellite and ground-based observations. The satellite data demonstrate the regional seasonality and export pathways for this important global pollutant.
2.1 Satellite observations of PANs
PANs have absorption features in the thermal infrared that can be readily measured with spaceborne spectrometers. Limb-sounding satellite observations have provided global-scale information on PANs in the upper troposphere and lower stratosphere with high vertical resolution and sensitivity (Glatthor et al., 2007; Moore and Remedios, 2010; Pope et al., 2016; Tereszchuk et al., 2013; Ungermann et al., 2016; Wiegele et al., 2012), but the limb-viewing geometry is not well suited to the evaluation of urban influences on the free troposphere. Nadir-viewing observations of PANs have been reported from TES (Payne et al., 2014), the Infrared Atmospheric Sounding Interferometer (IASI) (Franco et al., 2018) and CrIS (Payne et al., 2022). These nadir observations have shown large enhancements in PAN associated with fires (Alvarado et al., 2011; Clarisse et al., 2011; Juncosa Calahorrano et al., 2021) and have so far been used to shed new light on the role of fires, PAN precursor emissions, and dynamics on the global distribution of PAN and on long-range transport of O3 (Fischer et al., 2018; Jiang et al., 2016; Payne et al., 2017; Zhu et al., 2015, 2017). The TES record includes a set of targeted special observations over megacities between 2013 and 2015 (Cady-Pereira et al., 2017). Further details are provided below. The spatial and temporal coverage routinely provided by the IASI and CrIS meteorological sounders offers rich opportunities for examination of wider spatial context and long-term variation of PAN around megacities.
For various reasons, direct comparisons of the TES, IASI, and CrIS products discussed above would be challenging. The three instruments have different noise characteristics, spectral coverage, and spectral resolution, which have affected choices made for different algorithms. The TES PAN retrievals utilized the PAN spectral feature centered around 1150 cm−1, while the IASI observations used a larger spectral range that includes multiple PAN spectral features. The CrIS observations have made use of a spectral feature centered around 790 cm−1. This spectral feature appears in the IR spectra of all PANs at essentially the same frequency. Thus, the CrIS measurements reported are for all PANs (i.e., they include propionyl peroxy nitrate (PPN; CH3CH2C(O)OONO2), methacryloyl peroxy nitrate (MPAN; CH2C(CH3)C(O)OONO2), etc.), in addition to peroxy acetyl nitrate (PAN; CH3C(O)O2NO2). The IASI PAN product described by Franco et al. (2018) utilizes a neural network approach to retrieve PAN total column densities, while the TES and CrIS products cited above utilize an optimal estimation approach to retrieve profiles of volume mixing ratio (VMR), which have then been used to calculate free-tropospheric averages. The TES and CrIS PAN products share a common algorithm heritage, though there are some important differences, as discussed above and in the sections below. In this study, we use the targeted TES megacity observations to provide a view of PAN over Mexico City in the context of other selected megacities worldwide, and we use CrIS observations to focus in on the Mexico City Metropolitan Area and immediate surroundings.
2.2 TES observations
TES is a nadir-viewing Fourier transform spectrometer capable of measuring thermal infrared radiances at high spectral resolution (0.06 cm−1). TES is one of four instruments aboard the NASA Aura satellite, which flies in a sun-synchronous polar orbit in the NASA Afternoon Train (A-Train) constellation with equatorial overpass times of 01:30 and 13:30 LT. Aura was launched in July 2004, and the TES instrument took science measurements between September 2004 and January 2018.
A full description of the TES PAN retrieval algorithm is provided in Payne et al. (2014) and key details are summarized in Fischer et al. (2018). We use the publicly available TES v.7 Level 2 product (NASA/LARC/SD/ASDC, 2017). On a single footprint basis, TES is sensitive to elevated PAN (detection limit of ∼ 0.2 ppbv) in the free troposphere with uncertainties between 30 % to 50 %. The peak sensitivity for TES PAN is typically between 400 and 800 hPa (Payne et al., 2014). In general, TES PAN retrievals have about 1 degree of freedom, meaning that the retrievals do not contain information on the vertical distribution of PAN. The TES PAN retrievals are performed using an optimal estimation approach, with the state vector expressed in log VMR. One impact of this is that the degrees of freedom for signal (DOFS) depends on the amount of PAN present. For the analysis presented below, we use a tropospheric average from 825 to 215 hPa for retrievals with DOF > 0.6. This criterion ensures that we only include retrievals dominated by signal in the measurement rather than signal from the prior value. We also only use retrievals where the PANs desert quality flag >0.95, as suggested by Payne et al. (2014) to avoid issues with a silicate feature that occurs in the surface emissivity for rocky/sandy surfaces and happens to coincide with the location of the 1150 cm−1 PAN spectral feature.
Here we use TES “transect” special observations over megacities collected between January 2013 and December 2015. TES has three methods of observation: global survey, step-and-stare mode, and transect mode. Global survey mode is the nominal observation strategy for TES in which the instrument makes periodic observations along the satellite track spaced ∼ 200 km apart. In step-and-stare mode, the instrument takes nadir measurements every 40 km along the satellite track for a specified latitude range, and in transect mode, TES takes 20 consecutive scans spaced ∼ 12 km apart. An observation strategy focusing on 19 of the world's megacities was introduced in January 2013 and operated through December 2015. This sampling strategy reduced the number of sample points globally, but it increased the number of retrievals over the selected 19 megacities. Each TES megacity transect consists of 20 footprints, each footprint 5 by 8 km in size, spaced 12 km apart, resulting in relatively dense coverage along the orbit track over a limited area, providing a chemical snapshot of each megacity roughly every 2 weeks. For each of these megacities, we calculated the mean tropospheric PAN over all TES transect observations that pass the quality screening criteria over the 2013 to 2015 observation period. This provides an overall picture of “high-PAN” vs. “low-PAN” cities for this set of observations. Figure 2 ranks megacities by the mean detected tropospheric PAN during the TES megacity sampling period. During this period, the highest mean PAN was in Mexico City (average tropospheric PAN mixing ratio of 0.35 ppbv). Thus, the MCMA serves as our first case with new CrIS observations (described next) given the abundance of PAN, a long history of poor air quality, and the availability of complementary datasets.
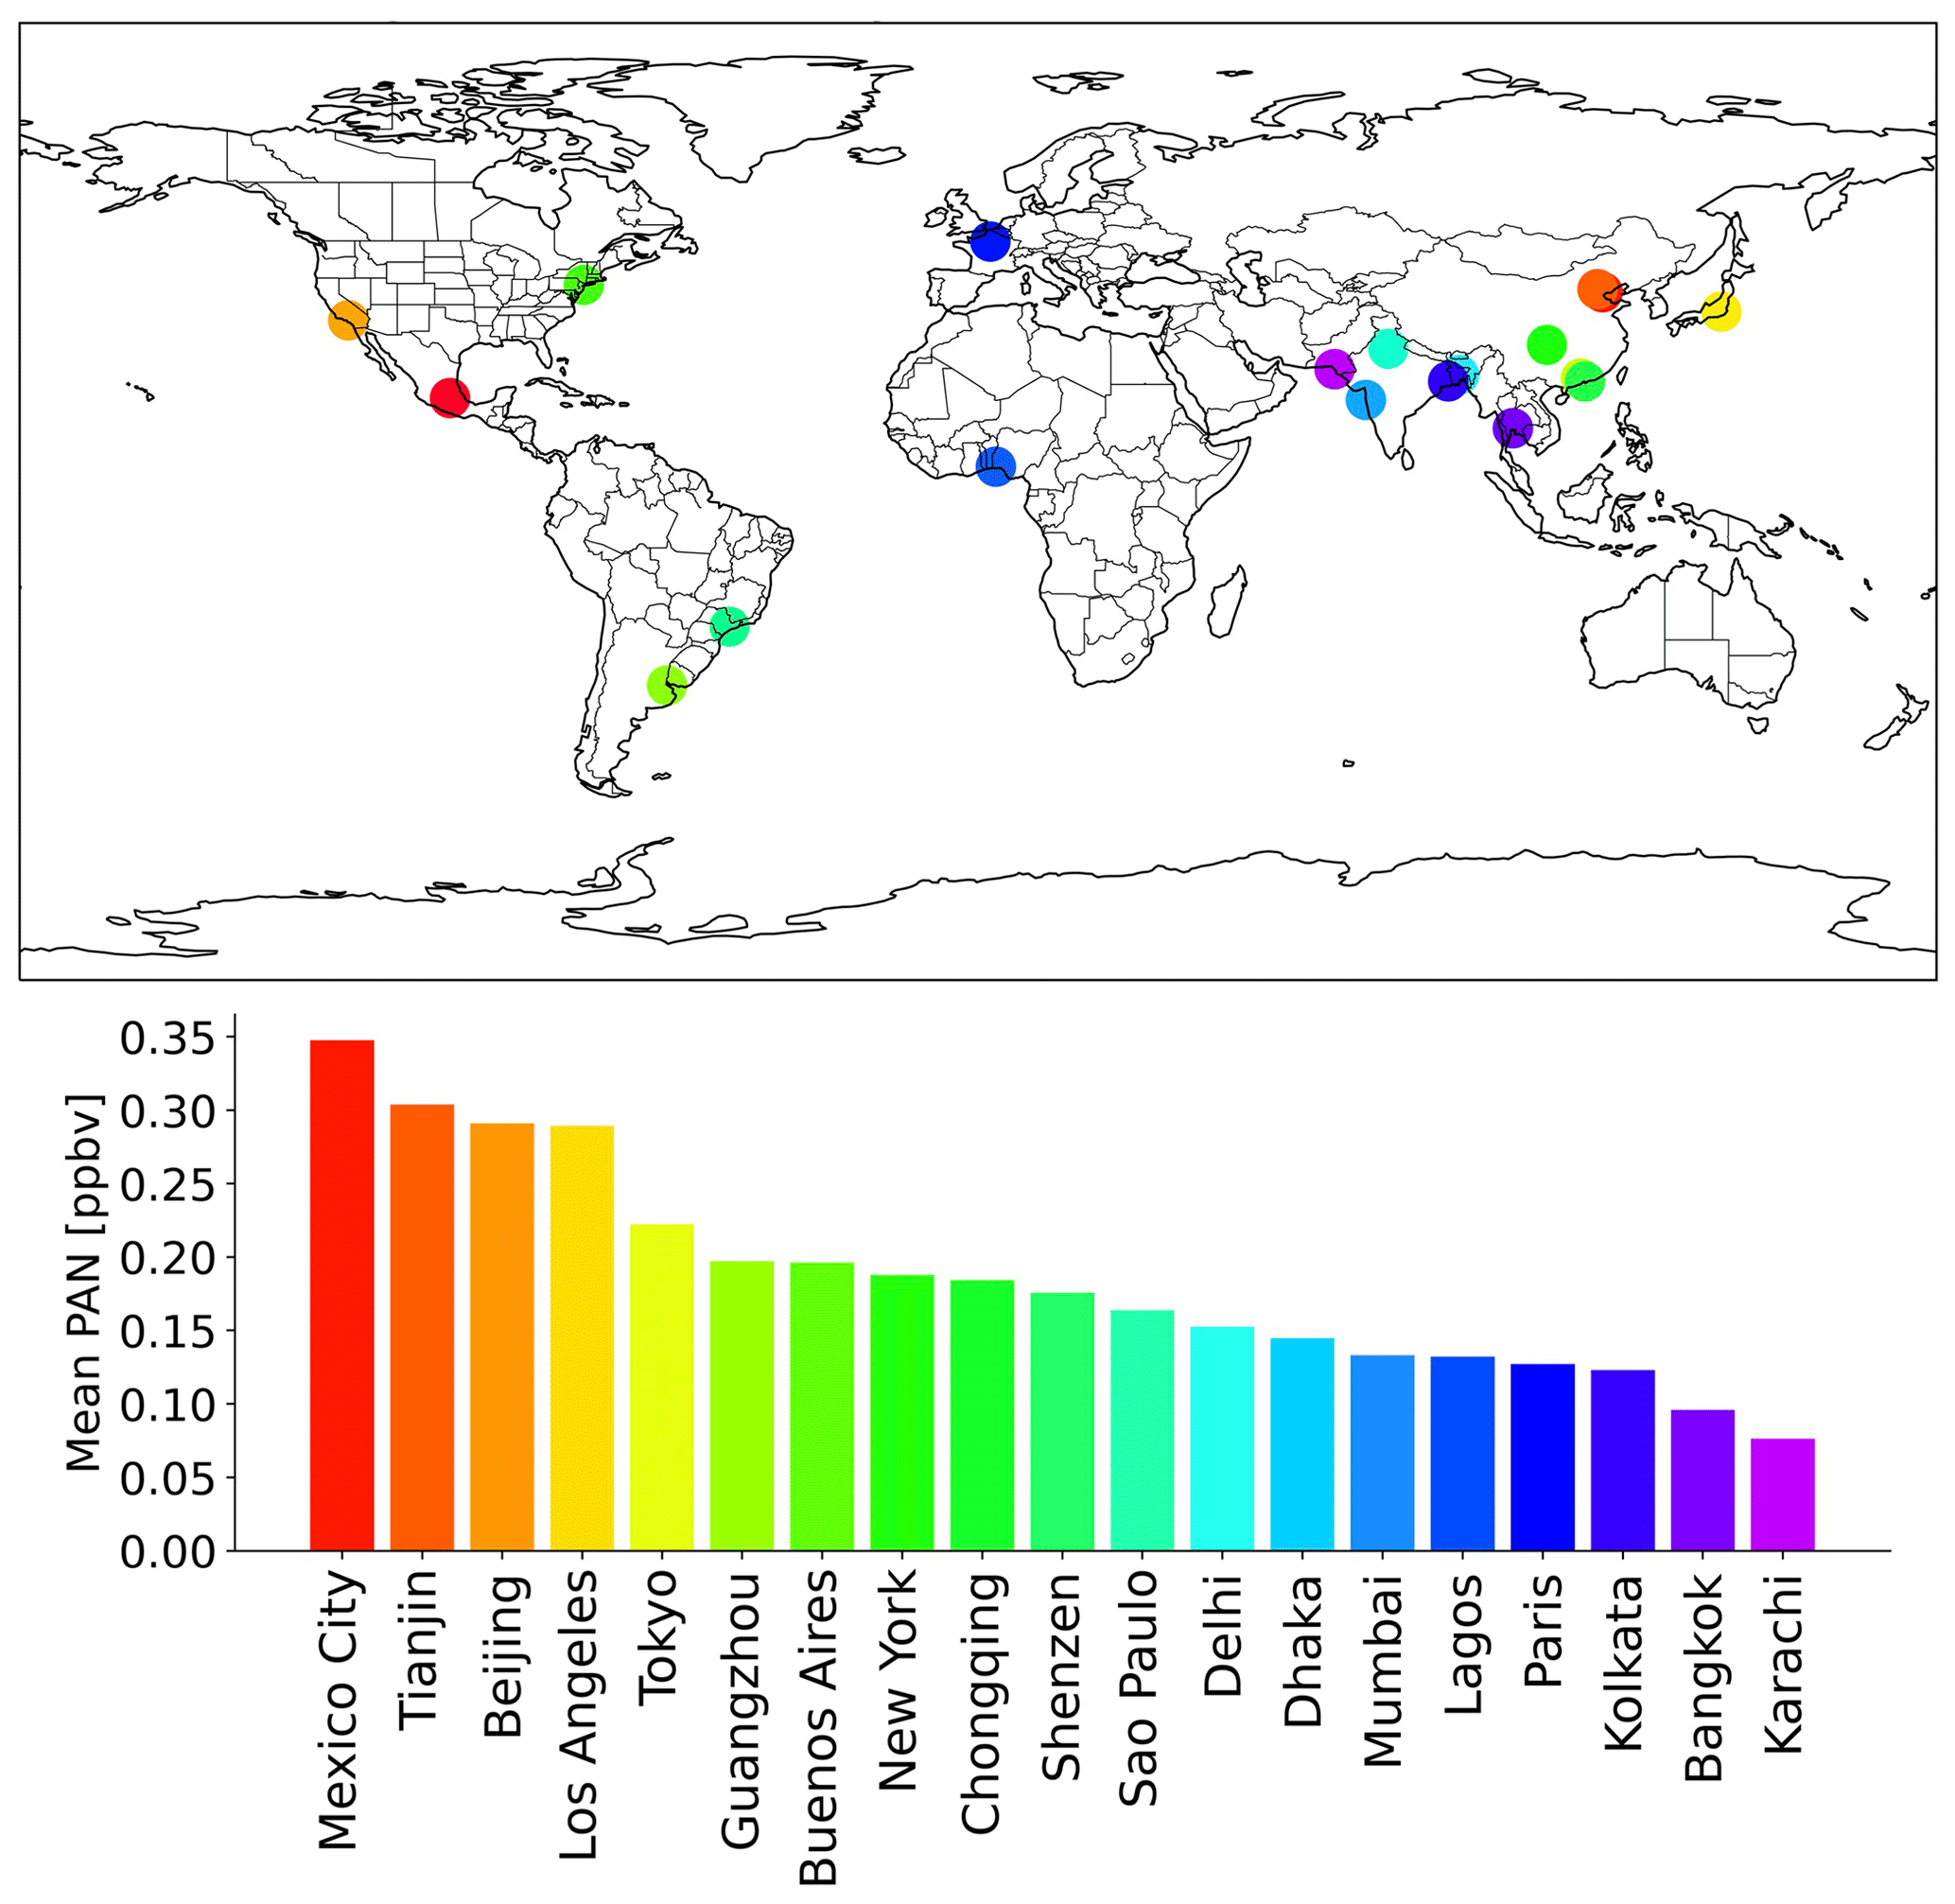
Figure 2Ranked mean PAN in TES megacity transects collected between 2013 and 2015.
2.3 CrIS observations
CrIS is a nadir-viewing Fourier transform spectroradiometer measuring thermal infrared radiances with high spectral resolution (0.625 cm−1). CrIS instruments are currently flying on the Suomi National Polar-orbiting Partnership (S-NPP) satellite and on the National Oceanic and Atmospheric Administration (NOAA-20/JPSS-1) satellite as part of the Joint Polar Satellite System (JPSS). Here we use CrIS on S-NPP. CrIS is one of five instruments aboard S-NPP which flies in a sun-synchronous polar orbit with equatorial overpass times at 01:30 and 13:30 LT. CrIS provides measurements at 30 crosstrack positions, each with a 3×3 array of field of views (FOVs), where each field of view has a diameter of 15 km at nadir. Processed CrIS data provide calibrated and geolocated level 1B spectra in three bands: 650–1095 cm−1 (longwave), 1210–1750 cm−1 (mid-wave), and 2155–2550 cm−1 (shortwave).
The PANs feature used in this analysis is located at 790 cm−1. CrIS retrievals are processed using the MUlti-SpEctra, MUlti-SpEcies, MUlti-Sensors (MUSES) retrieval software (Fu et al., 2013, 2016, 2018; Worden et al., 2019) which builds on the optimal estimation algorithm developed for Aura-TES (Bowman et al., 2006; Beer et al., 2001). One difference from the TES PAN retrieval algorithm is that the retrievals are done in linear VMR (as opposed to log). Further details of the CrIS PANs retrieval can be found in Payne et al. (2022). TES PAN could be biased high relative to CrIS PANs (Mahieu et al., 2021). In retrievals based on ground-based FTIR measurements covering the spectral regions used by both instruments, Mahieu et al. (2021) showed that PAN values retrieved using the retrievals using the 790 cm−1 spectral feature utilized by CrIS were biased low relative to those using the 1150 cm−1 spectral feature used for the TES PAN retrievals.
This analysis used the free-tropospheric column average volume mixing ratio between 825 and 215 hPa in the summary product files (Bowman, 2021a, b). CrIS sensitivity to PANs peaks in the free troposphere (∼ 680 hPa) and decreases rapidly near the surface. Payne et al. (2022) show validation of CrIS PANs observations against aircraft observations over the remote oceans. The validation suggests a single sounding uncertainty of around 0.08 ppbv that reduces with averaging to an approximate floor of 0.05 ppbv and demonstrates the ability of CrIS PANs retrievals to capture variation in the “background” PANs over remote regions.
CrIS-MUSES single-FOV retrievals of PANs, and temperature, water vapor (H2O), deuterated water vapor (HDO), O3, carbon monoxide (CO), methane (CH4), and ammonia (NH3), are processed routinely under the NASA Tropospheric Ozone and Precursors from Earth System Sounding (TROPESS) project and are publicly available via the Goddard Earth Sciences Data and Information Services Center (GES DISC). The TROPESS datasets at the GES DISC include the forward stream, which incorporates both S-NPP and JPSS-1 CrIS data (Bowman, 2021a, b, e). There are also plans to release a “reprocessing” dataset, for which the long-term record will be processed with a uniform algorithm version. Due to constraints associated with algorithm speed and the volume of data from the CrIS meteorological sounder(s), the TROPESS project is not currently processing all available CrIS radiances. The TROPESS CrIS forward stream data are subsampled using a grid sampling approach where the region is divided into 0.8∘ latitude × 0.8∘ longitude grid boxes, and the single, center-most target within each box is selected to be included in the dataset. The forward stream dataset provides both day and night time coverage. The TROPESS datasets also include so-called “special collections” where the sampling may be tailored to address a particular scientific study (or studies). Data for this work were processed as part of a special collection, using the v1.12 of the MUSES algorithm, to provide retrievals for all S-NPP CrIS field of views (FOVs) for the date range January 2016 to May 2021 in 2∘ latitude by 2∘ longitude boxes centered on specific megacities. The list of cities was chosen to match those included in the TES megacity transect set. Note that since the S-NPP and JPSS-1 CrIS instruments are essentially identical, targeted processing of JPSS-1 CrIS over megacities is also possible but has not yet been performed at the time of submission of this work.
CrIS CO data from the same special collection were also incorporated into this analysis as a supplementary dataset to contextualize CrIS PANs observations. For this analysis, we use a tropospheric average of CrIS CO data between 825 and 215 hPa. CrIS can be more sensitive to CO than to PANs in the lower troposphere (Juncosa Calahorrano et al., 2021). Details of the CrIS CO retrieval can be found in Fu et al. (2016) and the CrIS CO validation against aircraft observations in Worden et al. (2022). Note that the TROPESS CrIS CO forward stream is also available at the GES DISC (Bowman, 2021c, d).
This study used S-NPP CrIS data from January 2016 to May 2021. To be included in this analysis, CrIS retrievals have to be deemed “good” by the respective master quality flags (CO and PANs), and retrievals meet the additional following criteria as recommended by the developers of these data (Payne et al., 2022). The first four flags are standard quality flags, and the fifth checks whether the PANs spectral shape was fit, as follows:
-
Radiance residual rms (root mean square of the standard deviation) <5
-
Radiance residual mean <2
-
Residual norm final <5
-
Quality flag in water vapor files = 1
-
(see Eqs. 1 and 2 below)
CrIS PANs data were filtered based on the radiance files using the following equations to check if there is an improvement in the standard deviation, where NESR is the noise equivalent spectral radiance:
There was a correction applied to CrIS PANs as suggested by Payne et al. (2022) to correct for a water vapor-dependent bias (Eq. 3), where c is the correction to be added to individual PAN retrievals and X is the column density of water vapor in units of molecules per cm2.
2.4 Additional datasets
Given the complexity of PANs chemistry and the variety of sources that contribute to PANs abundances, we incorporate several other datasets into our analysis to contextualize the PANs observations.
Surface O3 and NOx data included here are from the environmental government network of Mexico City (Red Automática de Monitoreo Atmosférico; RAMA) (RAMA, 2020). We include monthly means of daytime averages for all of the surface sites within the Mexico City Metropolitan Area (MCMA) in the analysis presented below.
We also use Level 3 NO2 tropospheric column data from the Aura Ozone Monitoring Instrument (OMI) to evaluate spatiotemporal patterns of NO2 (Boersma et al., 2011). We have used the Quality Assurance for Essential Climate Variables (QA4ECV) NO2 Level 3 product described in Boersma et al. (2018). This is the most recent product and has been improved over DOMINO v2. OMI NO2 monthly mean data used in this study can be found via the TEMIS database (Boersma et al., 2017). The OMI NO2 data are processed consistently with the QA4ECV formaldehyde (HCHO) product also used in this study. We use the NASA Level 3 monthly mean tropospheric column HCHO measurements, also from the TEMIS database (De Smedt et al., 2017). Both L3 products are provided on a global 0.125∘ × 0.125∘ grid.
We also use observations of fires from the Moderate Resolution Imaging Spectroradiometer (MODIS) on both the Terra and Aqua satellites for fire counts and fire radiative power (FRP) to assess the seasonal peak in local fire activity. The MODIS active fire product is provided by the Fire Information for Resource Management Systems (FIRMS) (https://doi.org/10.5067/FIRMS/MODIS/MCD14ML). The data are processed by MODIS Adaptive Processing System (MODAPS) using the enhanced contextual fire detection algorithm into the Collection 5 Active Fire product. The algorithm description for the MODIS Active Fire product can be found in Roy et al. (2008). There are two MODIS instruments in orbit, one on the NASA Terra satellite and one on the NASA Aqua satellite. Aqua flies in the NASA A-Train constellation with local overpass times of about 01:30 and 13:30 LT. Terra has an overpass time of about 10:30 LT. MODIS fire data have 1 km resolution. MODIS active fire products are not available for May 2021 on the FIRMS archive; thus, we also use observations of fires from the S-NPP Visual Infrared Imaging Radiometer Suite (VIIRS) (https://doi.org/10.5067/FIRMS/VIIRS/VNP14IMGT_NRT.002). A comparative strength of VIIRS is the ability to detect smaller fires (Li et al., 2018; Wei et al., 2018), leading to a consistently higher fire count than MODIS. MODIS and VIIRS FRP data were filtered using only retrievals with >80 % confidence level.
3.1 Spatial distribution of PANs over Mexico City
Figure 3 presents the spatial extent of the PANs enhancement around urban Mexico City. April and August are plotted because these are the two seasonal maxima in MCMA free-tropospheric PANs from TES (not shown) and PANs from CrIS (see Fig. 6 and later discussion). Figure 3a and b show the spatial extent of MCMA PAN from monthly averaged TES transects (n=2). The limited spatiotemporal and irregular temporal sampling by TES combined with the day-to-day variability in PAN limits the utility of monthly averages within the TES dataset for individual months. Figure 3c and d show clear PANs enhancements in monthly mean gridded CrIS data. Figure 3e and f show north-to-south slices of the data presented in Fig. 3c and d. These panels show that the spatial extent of free-tropospheric average PANs > 0.2 ppbv covers 0.5∘ latitude (∼ 50 km) in April. This is less well defined in August, but this distance is comparable to the diameter of the Mexico City basin (Molina et al., 2009). Thus, Fig. 3 demonstrates that the spatial resolution of CrIS is sufficient to determine the size of urban tropospheric PANs enhancements during specific seasons. Figure 3e and f also confirms that there is a localized peak in free-tropospheric PANs collocated with the center of Mexico City, consistent with local production of PANs within the MCMA city limits.
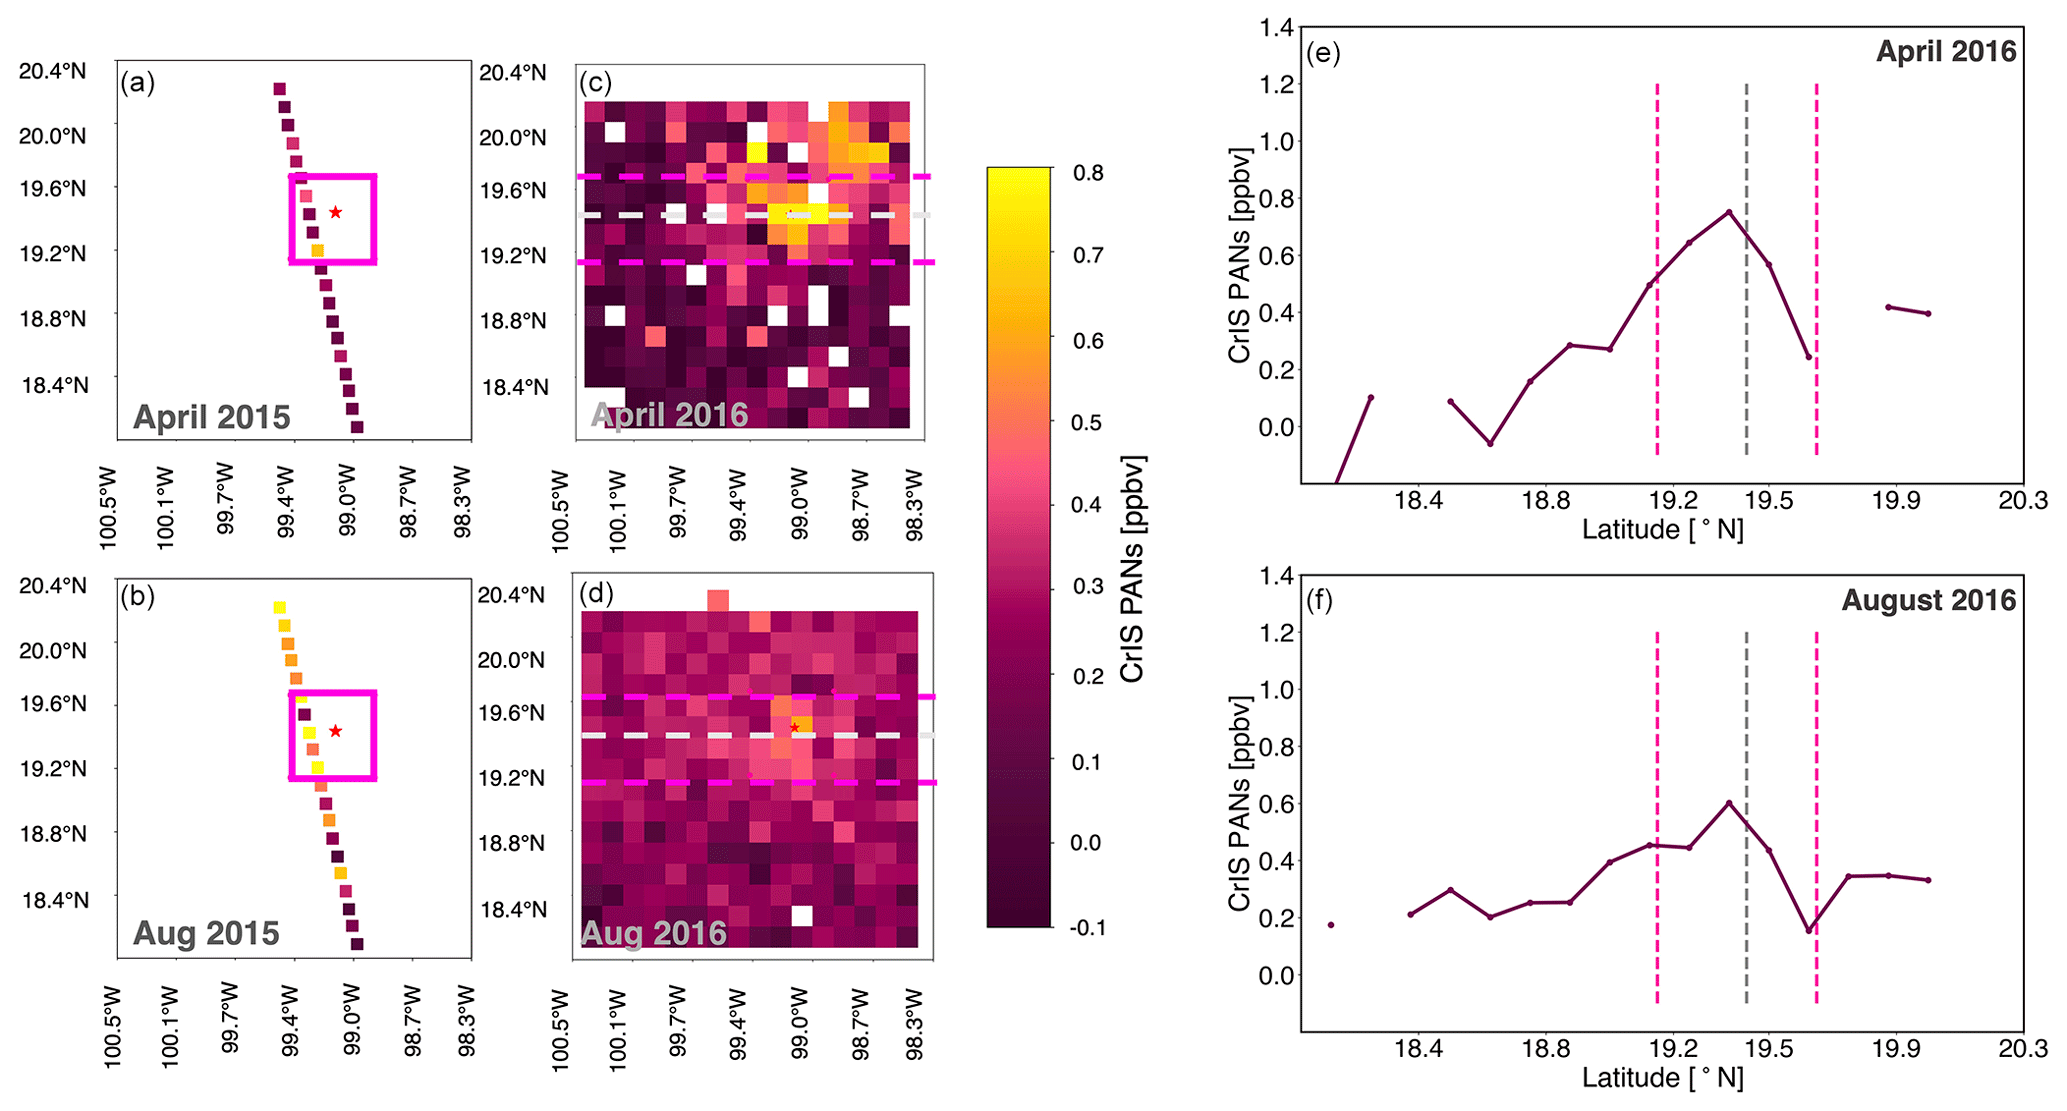
Figure 3Maps demonstrating PANs enhancements around urban Mexico City. Monthly mean TES transects (n=2) are shown for (a) April and (b) August 2015, and monthly averaged gridded CrIS PANs are shown for (c) April and (d) August 2016. CrIS PANs are plotted as a function of latitude for (e) April and (f) August. The latitude bounds of the urban Mexico City box shown in (a)–(b) and Fig. 1 are denoted by pink dashed lines in (c)–(f). The Mexico City center is denoted by gray dashed lines. White pixels show grid boxes with data that have been filtered out.

Figure 4(a) Potential air pollutant outflow regions for the Mexico City basin (colored squares) plotted over monthly mean gridded CrIS PANs for April 2016–2021, (b) boxplots of daily CrIS free-tropospheric PANs measurements within the boxes shown in (a). The orange lines and purple circles represent the median and mean, respectively. The whiskers represent the standard deviation of daily CrIS free-tropospheric PANs measurements.
The regional topography of the MCMA drives the meteorological transport patterns in the city. Previous studies show that thermally driven mountain-valley flows contribute to most of the day-to-day variability in surface wind speed and direction, rather than circulations at the synoptic scale (de Foy et al., 2005, 2006, 2008; Doran and Zhong, 2000; Fast and Zhong, 1998; Lei et al., 2007, 2008; Zavala et al., 2020). Intense vertical shear of these thermally driven flows lead to recirculation of air within the MCMA basin. Near-surface convergence zones due to momentum down-mixing of thermally driven wind and light synoptic winds aloft can lead to the accumulation of pollutants in the basin. However, the MCMA basin has relatively effective venting through the Chalco passage to the southeast and northern plateau, leading to little day-to-day pollutant accumulation (Zavala et al., 2020). Prior work has shown that on average the air quality “footprint” of MCMA is fairly local, as air transported out of the basin is diluted quickly (e.g., Emmons et al., 2010; Mena-Carrasco et al., 2009). However, PANs are an exception because they can act as reservoirs and sources of NOx to increase downwind O3 production. For example, during March 2006, a plume containing elevated NOy species was observed ∼ 900 km downwind in the northeast outflow direction (Mena-Carrasco et al., 2009). Next we explore PANs in the most common outflow regions around Mexico City
Figure 4a denotes subregions within the CrIS data processing area around Mexico City. The regions denoted by NW, NE, S, and SE represent potential pollutant outflow regions for Mexico City, and our choice of regions is informed by the common patterns of pollutant outflow identified by de Foy et al. (2006) for the 2006 MILAGRO (Megacity Initiative: Local and Global Research Observations) field intensive. Figure 4b presents boxplots of daily CrIS free-tropospheric PANs values within these regions. Together, these two panels show that there are more days with higher PANs in the region located to the northeast of Mexico City (yellow box) and in the region that encompasses the mountains south of the city (light purple box). These two regions appear to be the dominant directions of PANs outflow in MCMA in April. Our analysis implies that outflow of PANs to the northwest (magenta box) is infrequent; however, the lower values of PANs in the box could also be due to loss due to a longer transport area from the city center into this region. This box was chosen to represent the region to the NW of the urban area that is not influenced by the surrounding mountains (see Fig. 1). The largest spread in daily average PANs is over the southeast Chalco passage (dark purple box). Figure 4 is largely consistent with the findings of de Foy et al. (2006, 2008) and Emmons et al. (2010). Pollutants can be transported out of Mexico City to the northeast, channeled through the southeast, or vertically injected out over mountains to the southwest, depending on the meteorological conditions present.
3.2 Seasonal cycles of PANs over Mexico City
Figure 5 contrasts PANs over a region only rarely impacted by direct outflow from Mexico City to the PANs observed directly over Mexico City. Figure 5a presents monthly gridded mean PANs for the period of 2016–2021. The orange box in the “December” panel surrounds an area with consistently low free-tropospheric PANs mixing ratios. We refer to this area as “nearby background” PANs conditions here. This is the same background region shown in Fig. 4. Figure 5b presents a time series of monthly averaged CrIS PANs values within the two respective boxes shown in Fig. 5a. Based on this Figure, PANs are always greater over the urban area than in the “nearby background”. On average, over 2016–2021, the difference between urban and background free-tropospheric PANs is greatest in April and reaches a minimum in the winter months of October, November, and December. During these winter months, the average difference between urban and nearby background free-tropospheric PANs is ∼ 100 pptv. The nearby background PANs have a seasonal maximum in May, and this is consistent with the March–April–May peak in local fire activity (Yokelson et al., 2007, 2009, 2011). Background enhancements in July and August were not explored at the time of this work; however, model results included in the Supplement indicate a seasonal enhancement in PANs aloft at this time that is associated with both natural and anthropogenic NOx sources (Figs. S1 and S2 in the Supplement).

Figure 5(a) Monthly mean gridded CrIS PANs over Mexico City. The boxes indicate the locations chosen to illustrate the urban Mexico City PANs (pink) enhancement compared to the “nearby background” (orange). The background box is confined by (18.99∘ N, 99.84∘ W, 18.49∘ N, 99.34∘ W) and the urban Mexico City box is confined by (19.15∘ N, 99.40∘ W, 19.65∘ N, 98.9∘ W). (b) Monthly mean urban and background mean CrIS free-tropospheric PANs for the period January 2016 to May 2021.
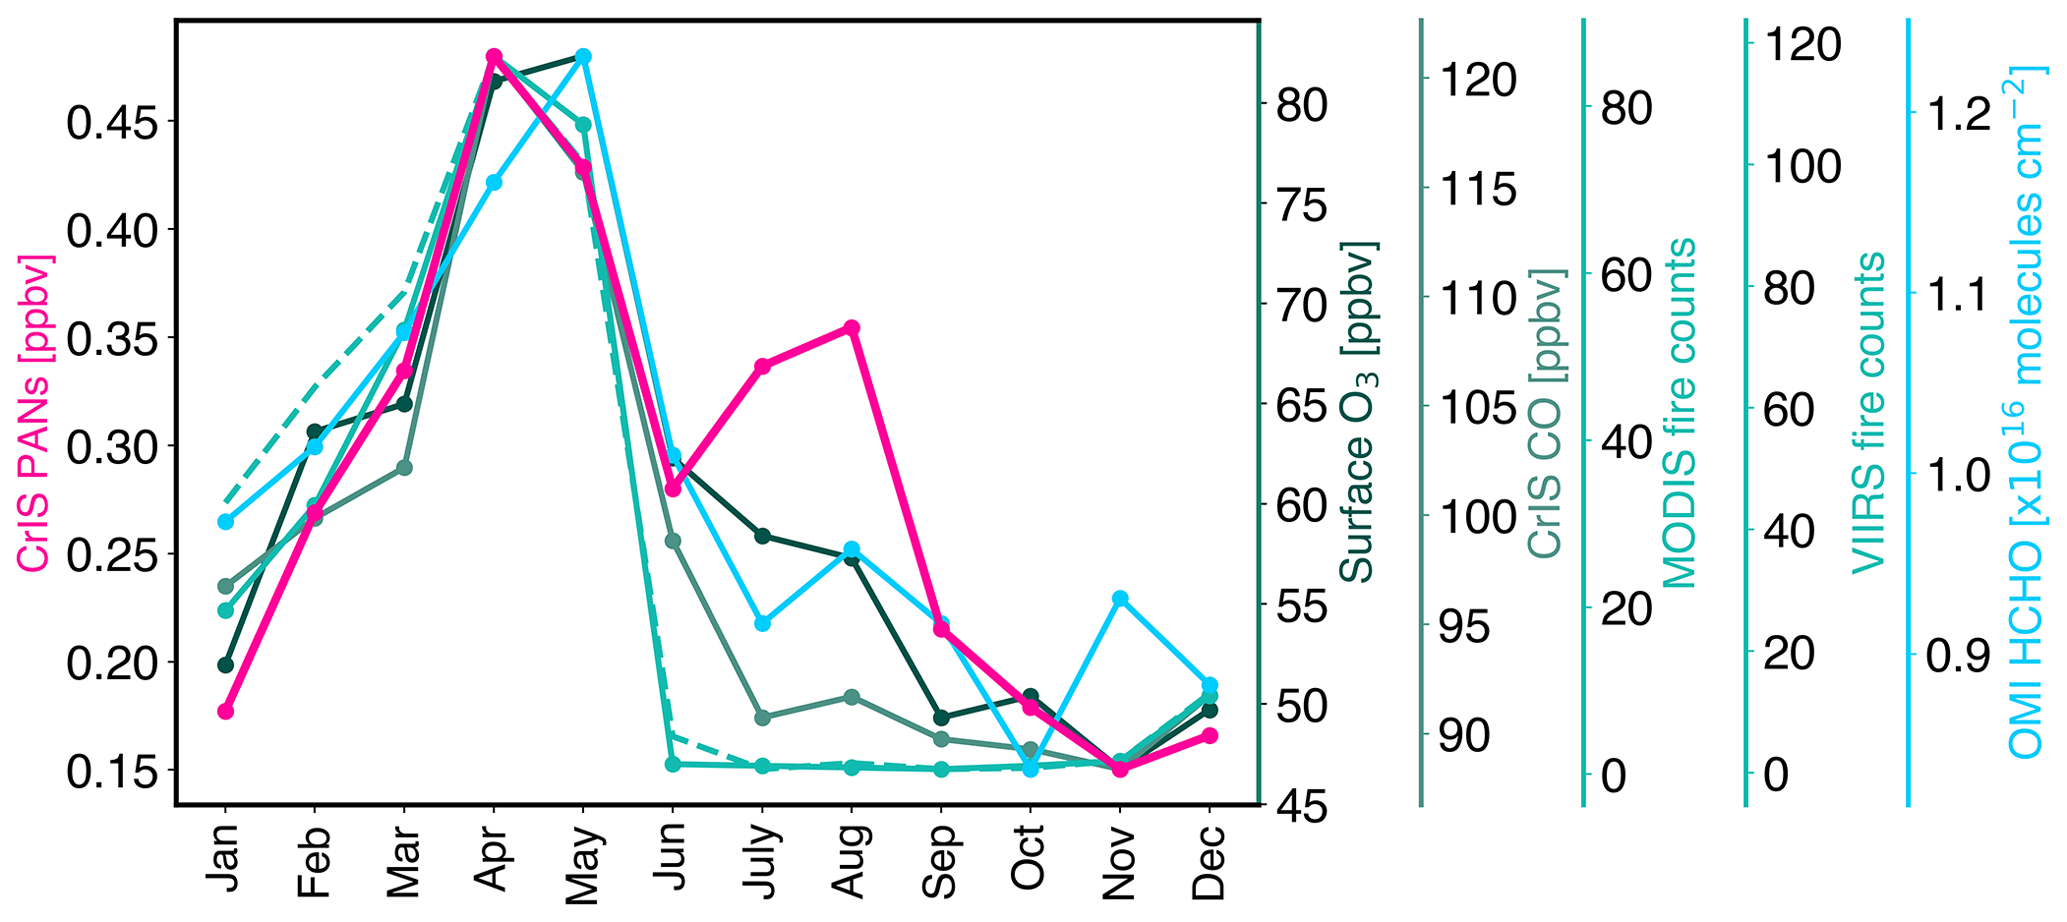
Figure 6Seasonal cycle of CrIS free-tropospheric PANs, RAMA surface O3, CrIS free-tropospheric CO, MODIS fire counts (solid: 2016–2020), VIIRS fire counts (dashed), and OMI HCHO columns for urban Mexico City from 2016 to 2021. MODIS and VIIRS fire counts are constrained by (20.12∘ N, 100.40∘ W, 18.36∘ N, 98.44∘ W). All other species are constrained by the urban Mexico City box defined in Fig. 5.
Figure 6 displays the seasonal cycle of PANs from 2016 to 2021. The maximum in PANs over urban Mexico City occurs in April. Surface O3, CrIS free-tropospheric column mean CO, MODIS and VIIRS fire counts, and tropospheric column OMI HCHO have co-occurring peaks in March, April, and May. Mexico City experiences a wet and a dry season. November through February is typically characterized by cool and dry conditions as anticyclonic westerly winds bring dry air to the region. This is followed by a warm, dry season from March to May, followed by a rainy season that typically lasts from May through October (Molina et al., 2009). The warm, dry season is characterized by high pressure systems with clear skies, weak wind, and intense solar radiation promoting photochemical production of O3 and other oxidants (Molina et al., 2019). Weak winds during the warm, dry season promote stagnation of pollutants near the southern area of the basin (Molina et al., 2019; Zavala et al., 2020). The observed seasonal maxima in surface O3 and tropospheric column OMI HCHO occur during this period (Fig. 6). Lei et al. (2009) show that secondary HCHO dominates the HCHO budget in the afternoon when the observations shown here were collected. Maxima in CrIS free-tropospheric CO and MODIS fire counts occur in April and May. Local fire activity during these months contribute to increased local tropospheric CO abundances (Tzompa-Sosa et al., 2016; Yokelson et al., 2007, 2009, 2011). Note that the region included in Fig. 6 may not encompass all the fires that impact the larger Mexico City region. It represents the local fire activity only. The rainy season is typically characterized by lower CO and O3 mixing ratios; however, O3 production continues throughout the year, as intense photochemical reactions can occur prior to afternoon precipitation in the rainy season (Molina et al., 2019). Elevated O3 mixing ratios can occur throughout the year in the MCMA due to its subtropical latitude and high elevation (Molina et al., 2009), though over 60 % of the O3 episodes in Mexico City (i.e., exceedances to the 1 h standard of 95 ppbv) occur during the warm, dry season (see Jaimes-Palomera et al., 2016 and references therein). Note that there is a secondary peak in PANs in July and August that is not associated with a similar increase in surface O3. This suggests that the PANs observed by CrIS over this region during July and August may not only be associated with local surface photochemistry, but PANs aloft (Fig. S1). Model results included in the Supplement (Figs. S1 and S2) indicate that there are multiple NOx sources, including anthropogenic, soil, biomass burning, and lightning, that contribute to this feature, and the PAN enhancement is located higher aloft (i.e., at 400 hPa versus 750 hPa).
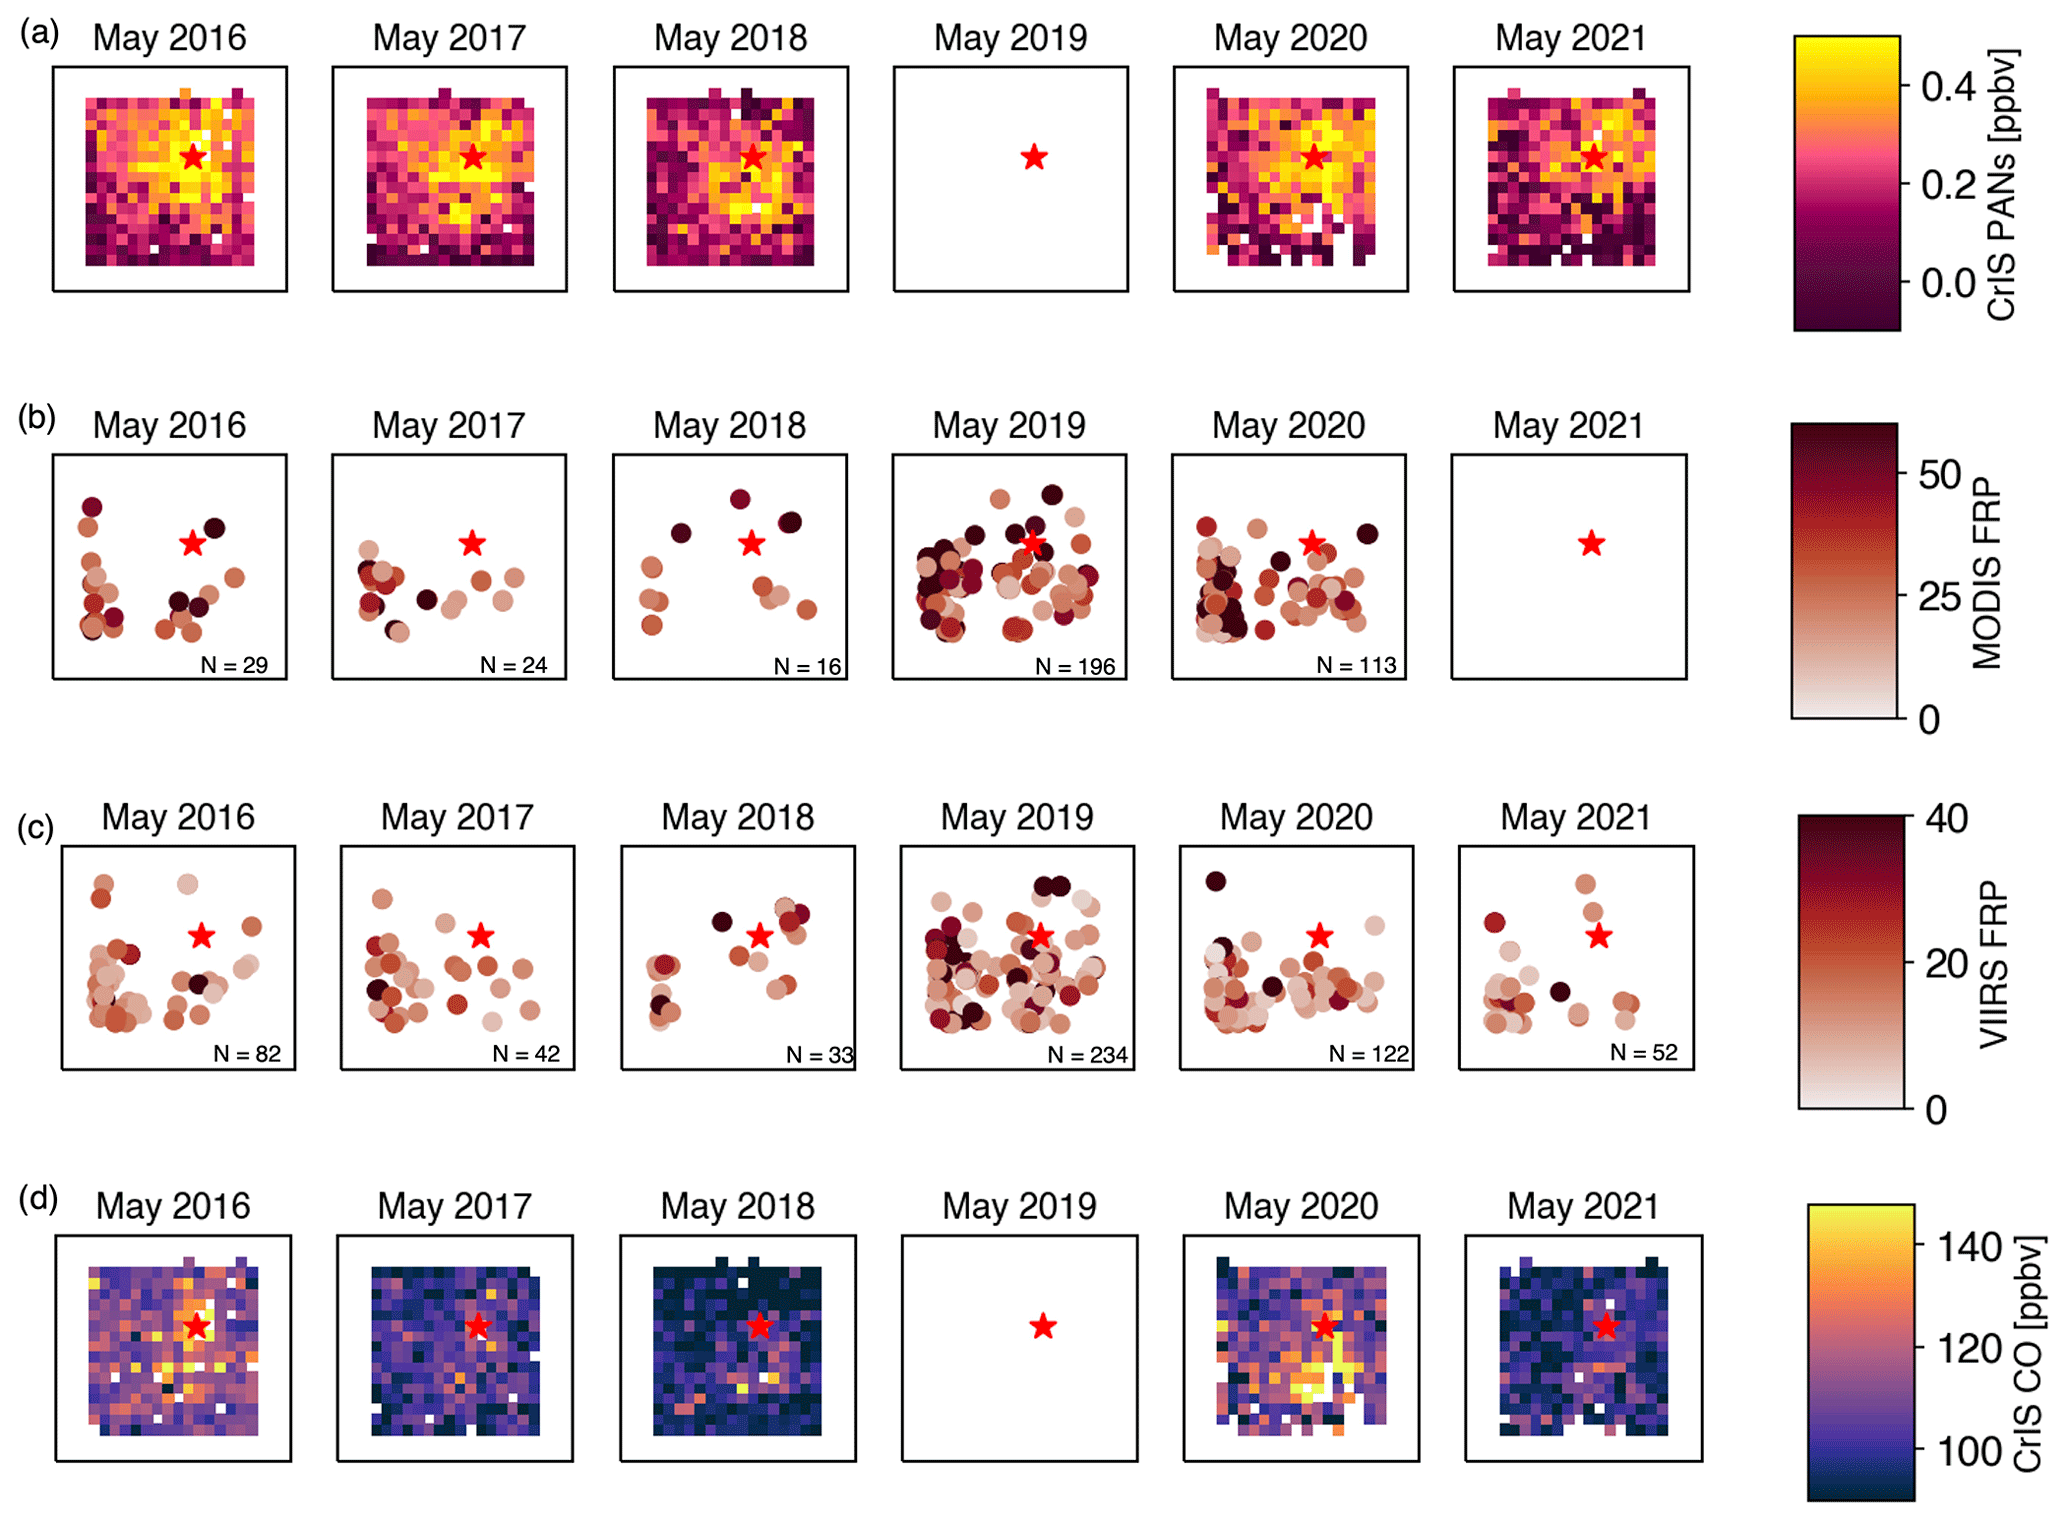
Figure 7(a) Gridded average PANs for the month of May for the region surrounding Mexico City for multiple years. The center of Mexico City is denoted by a red star. (b) MODIS fire radiative power (FRP) for the Mexico City region, (c) VIIRS fire radiative power (FRP) for the Mexico City region, and (d) gridded free-tropospheric average CrIS CO. This is the full region of available CrIS observations (21∘ N, 100.9∘ W, 18∘ N, 97.1∘ W).
3.3 Interannual variability in PANs over Mexico City
In addition to air pollution from the anthropogenic sources, air quality in the MCMA is impacted by local (Yokelson et al., 2007) and regional (Yokelson et al., 2009) biomass burning and agricultural residue and trash fires (Christian et al., 2010; Yokelson et al., 2011). March–April–May is the seasonal peak in regional biomass burning (Tzompa-Sosa et al., 2016; Yokelson et al., 2007, 2009, 2011). Biomass burning in Mexico and urban emissions from the MCMA heavily influence the springtime air quality in much of Mexico and the United States (Yokelson et al., 2009). Fires can contribute to a quarter of the CO production within the MCMA (Yokelson et al., 2007). Figure 7 displays monthly averaged gridded CrIS PANs (panel a) and CO (panel d) for May 2016–2021 and corresponding fire-related products in Fig. 7b and c. We focus on the month of May to demonstrate the interannual variability in free-tropospheric PANs over Mexico City during this month and their relationship to local fires. The free-tropospheric PAN enhancement in May 2017 located south of the urban enhancement is collocated with fires. There were 196 and 234 fires detected in the region during May 2019 by MODIS and VIIRS, respectively. S-NPP CrIS is missing data between 26 March 2019 and 24 June 2019. A hardware failure occurred in the S-NPP CrIS mid-wave signal processor, which led to a temporary halt in the L1b processing, but the issue was resolved by switching from the Side 1 electronics to the redundant Side 2 electronics. Note that JPSS-1 CrIS radiances are available over this time period, but targeted TROPESS/MUSES CrIS processing over megacities has not been performed for JPSS-1 at this time. The smallest number of fires were detected in May 2018 (N=16; 33), and the corresponding average free-tropospheric PANs and CO are both also lower than other years, though small enhancements in both exist collocated with fires to the south of the city. The relationships between monthly mean CO and VIIRS (R2=0.87) and MODIS fire counts (R2=0.60) are strong. We also found that total monthly fire counts (plotted in Fig. 7b and c) explain a substantial amount (>45 %) of the variability in monthly mean PAN during May; MODIS fire counts, using only 4 months of data, explain more of the variability in monthly mean PAN (R2=0.69; Fig. 7b) than VIIRS fire counts, which include all 5 months of available data (R2=0.47; Fig. 7c).
3.4 Recent changes in PANs, NOx, and HCHO
In response to substantial air quality degradation, the Mexican government developed and implemented successive air quality management programs that combined regulatory actions with technological advances (Molina, 2021; Molina et al., 2019). Reductions in O3 were attributed to aggressive emission controls of O3 precursor species. This included improving fuels, adopting catalytic converters, removing an oil refinery and heavy industrial facilities, shifting to natural gas for power generation and other industrial needs, reformulating liquefied petroleum gas (LPG) for cooling and water heating, introducing vehicle inspection and maintenance programs, and introducing a “no driving day” (Hoy no Circula) rule (Zavala et al., 2020 and references therein). These control strategies led to reductions in all criteria pollutants (Zavala et al., 2020 and references therein); however, the MCMA basin still experiences elevated levels of many of the air pollutants listed above (Cady-Pereira et al., 2017; Fast and Zhong, 1998; Gaffney et al., 1999; Jaimes-Palomera et al., 2016; Johansson et al., 2009; Molina et al., 2010; Osibanjo et al., 2021; Velasco et al., 2007; Zavala et al., 2020). There have been no substantial improvements in the concentration of O3 (or PM2.5 and PM10) since approximately 2006 (Molina et al., 2019; Zavala et al., 2020). The transport sector continues to have a large impact on VOC and NOx emissions in the MCMA. Solvents, fuel evaporation, and leaks are large sources of VOCs, dominating over biogenic VOC emissions (Molina et al., 2010; Velasco et al., 2007). The distribution of sources are highly inhomogeneous throughout the MCMA (Jaimes-Palomera et al., 2016; Zavala et al., 2020).
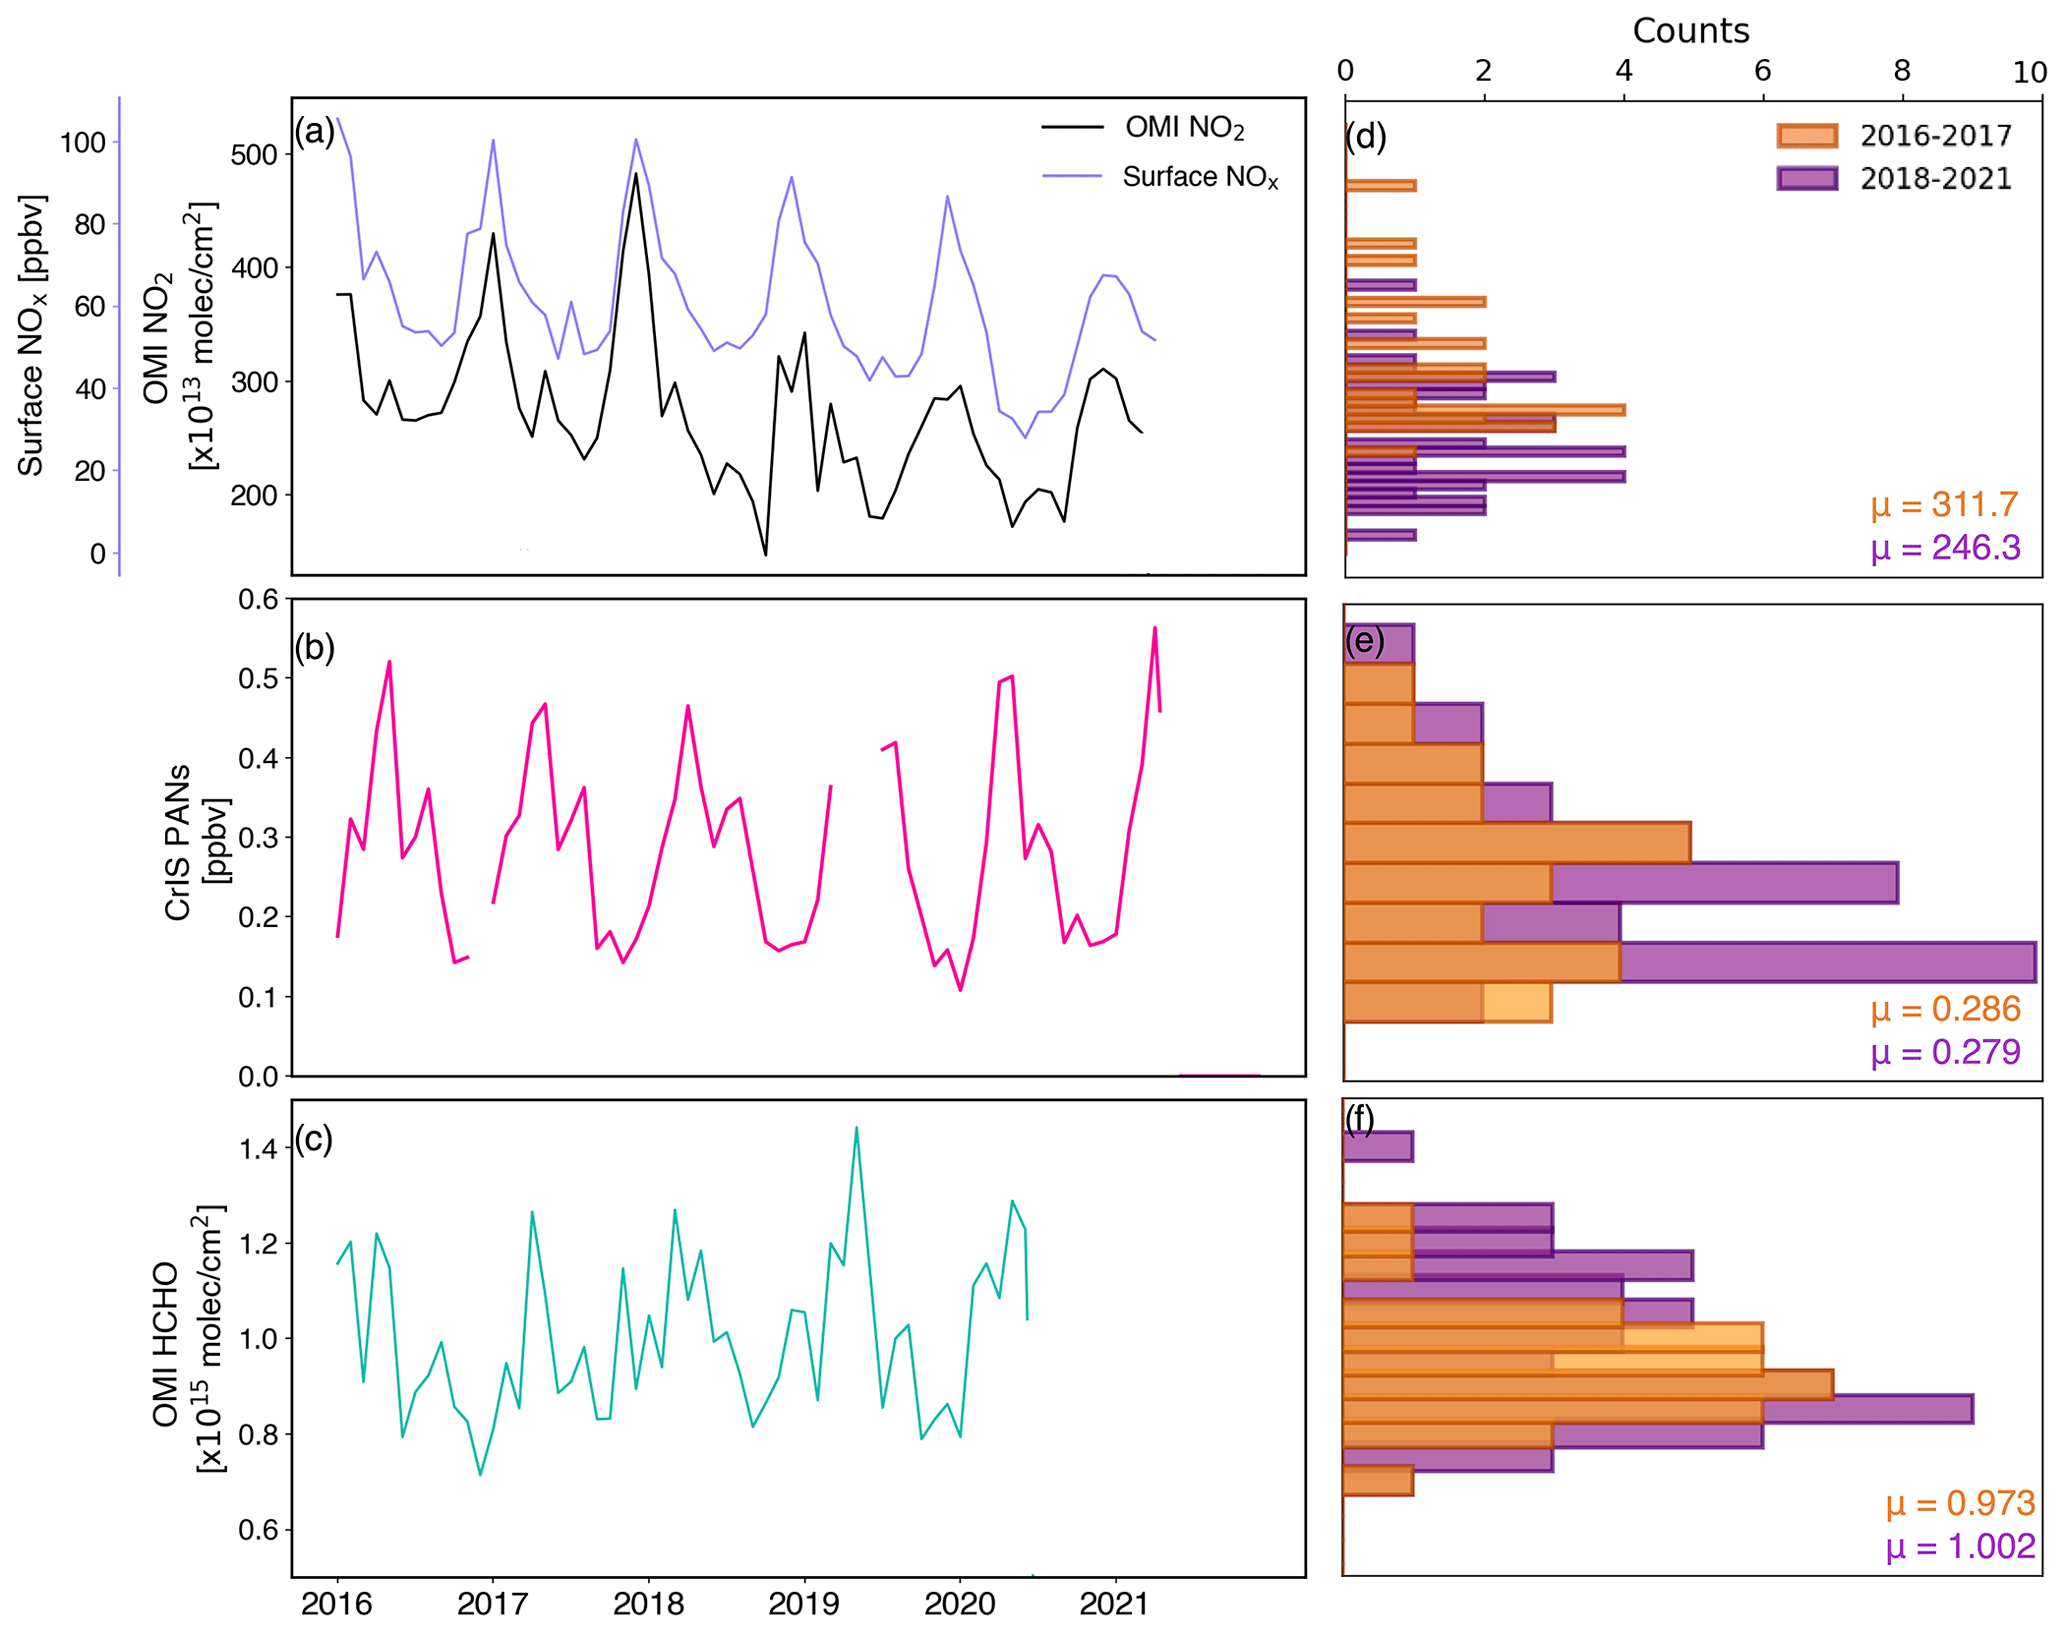
Figure 8(a) Monthly average of OMI NO2 (dark blue) and RAMA surface NOx observations (light blue), (b) CrIS free-tropospheric monthly average PANs, (c) OMI HCHO tropospheric columns for 2016–2021. Distribution of OMI NO2 (d), CrIS PANs (e), and OMI HCHO (f) from two populations: 2016–2017 (orange) and 2018–2021 (purple). Sample means (μ) are provided in their respective colors and units.
Figure 8 presents a time series and histograms of monthly averaged NOx species, CrIS PANs, and tropospheric column OMI HCHO for the CrIS measurement record period (2016–2021) for urban Mexico City. There is a statistically significant decrease in MCMA OMI NO2 between 2018 and 2019 (Mann–Whitney u test, p=0.0001). We separate the OMI NO2 into two sample populations to represent the higher value population (2018–2021, orange) and the lower value population (2016–2017, purple). Figure 8d shows that the more recent data (purple) peak towards lower values and the histogram representing the older population (orange) peaks towards higher values. This is further expressed in the sample means; the 2016–2017 and 2018–2021 means are 311×1013 and 246×1013 molec. cm−2, respectively (standard deviation: 63, 52×1013 molec. cm−2, respectively). These are statistically different. However, there is no statistically significant difference in the mean free-tropospheric PANs as observed by CrIS between 2016 to 2017 and 2018 to 2021. The sample means are 0.29 and 0.28 ppbv, respectively (standard deviation for both is 0.11 ppbv). We find that there is also no significant difference in OMI HCHO between the two time periods. HCHO can be emitted directly, and it is an intermediate product in the oxidation of many VOCs (Lei et al., 2009). MCMA has elevated levels of HCHO from both primary emissions and secondary photochemical formation (Baez et al., 1995; Garcia et al., 2006; Lei et al., 2009; Velasco et al., 2007). Lei et al. (2009) showed that secondary HCHO dominates the MCMA HCHO budget in the mid-morning and afternoon, coinciding with ascending satellite overpasses. HCHO is used as an indicator of VOC emissions (De Smedt et al., 2008; Shen et al., 2019) and changes in VOC emissions may not mirror changes in NOx (Gao et al., 2017; Shen et al., 2019; Simon et al., 2015).
The lack of a change in PANs is not surprising. PAN can be more sensitive to NMVOCs than to NOx emissions (Fischer et al., 2014), and the PANs observed by CrIS are not all formed from local anthropogenic NOx emissions (see Figs. S1 and S2). Surface PANs can also respond to changes in the environmental conditions that support photochemistry. For example, during the COVID-19 lockdown period, emissions of both NOx and VOCs were reduced by 60 % and 30 %, respectively, in the Beijing area, but Qiu et al. (2020) showed enhanced levels of surface PAN in this region. They showed that this enhanced PAN (2–3 times the concentrations of the pre-lockdown period) was the result of enhanced photochemistry, anomalous wind convergence leading to the accumulation of precursor species and accelerated VOC oxidation (i.e., further enhancing local photochemistry), and anomalously high temperatures in the area during the study period.
We use CrIS data from 2016 to 2021 to investigate the spatial and temporal variability of PANs in Mexico City. This is the first detailed analysis of satellite PAN observations over a megacity.
-
We use a period with densely spaced TES observations of megacities from 2013 to 2015 to investigate the cities with the largest mean detected PANs from this period. The mean TES free-tropospheric PAN mixing ratios for observations over Mexico City was 0.35 ppbv. Mexico City showed the highest mean PAN values of all the 19 megacities sampled by TES during this period.
-
S-NPP CrIS and TES observations show that PANs are enhanced around urban Mexico City with a strong seasonality. The largest difference between the urban enhancement and nearby background occurs in April and reaches a minimum in winter months (October, November, December). A seasonal maximum in PAN occurs in April and May. The seasonal peak in Mexico City PANs co-occurs with springtime seasonal maxima in surface O3, CrIS CO, MODIS fire counts, and tropospheric OMI HCHO. Seasonal maximums in local photochemistry and fire activity both contribute to the seasonal maxima in PANs.
-
We find that extreme fire years are associated with higher monthly mean PANs than low fire years. However, missing observations in 2019, which was a severe fire year, make it difficult to fully quantify the effect of fires on the observed interannual variability of PANs over Mexico City during the month of May. JPSS-1 radiances are available for this time period, but the JPSS-1 CrIS PANs retrievals for dense sampling over MCMA are not available at the time of this submission.
-
We use S-NPP CrIS data to probe the spatial outflow pattern of PANs produced within urban Mexico City during April. We show that outflow occurs to the northeast of the city and over the mountains south of the city. Outflow to the northwest appears infrequently.
-
We examine time series of surface NOx measurements alongside OMI tropospheric NO2 to analyze changes to Mexico City NO2 during our study period. We find a statistically significant difference (decrease) in NO2 between 2018 and 2019. CrIS PANs for the same period do not show the same significant decrease nor does tropospheric OMI HCHO. These results suggest that PAN is VOC-limited and not NOx-limited in the Mexico City basin.
-
We see a secondary peak in PANs in July and August that is not associated with an increase in surface O3. An analysis of model results indicates that there are multiple NOx sources that contribute to this feature, and the PAN enhancement is located higher aloft (i.e., at 400 hPa versus 750 hPa).
The work presented here provides new information on the seasonality and export pathways out of the Mexico City Metropolitan Area (MCMA) for a globally relevant pollutant. The analysis approach applied here has the potential to be applied to different megacities and regions of interest.
The full dataset for CrIS Mexico City megacity Summary Product data used in this study are available from https://doi.org/10.5067/YTO4AV07QQOW (Bowman, 2021a).
CrIS Mexico City megacity Standard Product data are available from https://doi.org/10.5067/PECEC1AZ5R1J (Bowman, 2021b).
All other datasets are publicly available as noted in the following:
-
TES PAN data were obtained from https://doi.org/10.5067/AURA/TES/TL2PANNS_L2.007 (NASA/LARC/SD/ASDC, 2017).
-
RAMA data were obtained from http://www.aire.cdmx.gob.mx/ (RAMA, 2020).
-
OMI NO2 and HCHO data were obtained from https://www.temis.nl/airpollution/no2.php and https://h2co.aeronomie.be/ (last access: August 2021; https://doi.org/10.21944/qa4ecv-no2-omi-v1.1, Boersma et al., 2017; https://doi.org/10.18758/71021031, De Smedt et al., 2017).
-
MODIS Collection 6 Hotspot/Active Fire Detections MCD14ML distributed from NASA FIRMS. Available online https://earthdata.nasa.gov/firms (last access: August 2021), https://doi.org/10.5067/FIRMS/MODIS/MCD14ML (LANCE FIRMS, 2021a).
-
NRT VIIRS 375 m Active Fire product VNP14IMGT distributed from NASA FIRMS. Available online https://earthdata.nasa.gov/firms (last access: August 2021), https://doi.org/10.5067/FIRMS/VIIRS/VNP14IMGT_NRT.002 (LANCE FIRMS, 2021b).
-
Data used to create the elevation map are from SRTM and are available at https://srtm.csi.cgiar.org (Jarvis et al., 2008).
The supplement related to this article is available online at: https://doi.org/10.5194/acp-23-2667-2023-supplement.
EVF, VHP, and SSK were responsible for the initial study design. MJS led the data analysis and writing with guidance from EVF, VHP, and SSK. VHP and SSK were responsible for algorithm development. KM was responsible for model simulations. All the authors edited the paper.
The contact author has declared that none of the authors has any competing interests.
Publisher’s note: Copernicus Publications remains neutral with regard to jurisdictional claims in published maps and institutional affiliations.
This work is funded under NASA award no. 80NSSC20K0947. Part of this work was carried out at the Jet Propulsion Laboratory, California Institute of Technology, under a contract with the National Aeronautics and Space Administration (80NM0018D0004). We are grateful for the use of data and/or imagery from NASA's Fire Information for Resource Management System (FIRMS) (https://earthdata.nasa.gov/firms, last access: 20 February 2023), part of NASA's Earth Observing System Data and Information System (EOSDIS). We thank Isabelle De Smedt and Folkert Boersma for collaborating on the proposal that led to this work and for answering questions regarding the OMI data.
This research has been supported by the National Aeronautics and Space Administration (grant no. 80NSSC20K0947).
This paper was edited by Qi Chen and reviewed by two anonymous referees.
Altshuller, A. P.: Assessment of the contribution of chemical species to the eye irritation potential of photochemical smog, JAPCA J. Air Waste Ma., 28, 594–598, https://doi.org/10.1080/00022470.1978.10470634, 1978.
Alvarado, M. J., Cady-Pereira, K. E., Xiao, Y., Millet, D. B., and Payne, V. H.: Emission ratios for ammonia and formic acid and observations of peroxy acetyl nitrate (PAN) and ethylene in biomass burning smoke as seen by the tropospheric emission spectrometer (TES), Atmosphere, 2, 633–654, https://doi.org/10.3390/atmos2040633, 2011.
Baez, A. P., Belmont, R., and Padilla, H.: Measurements of formaldehyde and acetaldehyde in the atmosphere of Mexico City, Environ. Pollut., 89, 163–167, https://doi.org/10.1016/0269-7491(94)00059-M, 1995.
Beer, R., Glavich, T. A., and Rider, D. M.: Tropospheric emission spectrometer for the Earth Observing System's Aura satellite, Appl. Optics, 40, 2356–2367, 2001.
Boersma, K. F., Eskes, H. J., Dirksen, R. J., van der A, R. J., Veefkind, J. P., Stammes, P., Huijnen, V., Kleipool, Q. L., Sneep, M., Claas, J., Leitão, J., Richter, A., Zhou, Y., and Brunner, D.: An improved tropospheric NO2 column retrieval algorithm for the Ozone Monitoring Instrument, Atmos. Meas. Tech., 4, 1905–1928, https://doi.org/10.5194/amt-4-1905-2011, 2011.
Boersma, K. F., Eskes, H., Richter, A., De Smedt, I., Lorente, A., Beirle, S., Van Geffen, J., Peters, E., Van Roozendael, M., and Wagner, T.: QA4ECV NO2 tropospheric and stratospheric vertical column data from OMI (Version 1.1) [L3 Monthly means], Royal Netherlands Meteorological Institute (KNMI) [data set], https://doi.org/10.21944/qa4ecv-no2-omi-v1.1, 2017.
Boersma, K. F., Eskes, H. J., Richter, A., De Smedt, I., Lorente, A., Beirle, S., van Geffen, J. H. G. M., Zara, M., Peters, E., Van Roozendael, M., Wagner, T., Maasakkers, J. D., van der A, R. J., Nightingale, J., De Rudder, A., Irie, H., Pinardi, G., Lambert, J.-C., and Compernolle, S. C.: Improving algorithms and uncertainty estimates for satellite NO2 retrievals: results from the quality assurance for the essential climate variables (QA4ECV) project, Atmos. Meas. Tech., 11, 6651–6678, https://doi.org/10.5194/amt-11-6651-2018, 2018.
Bowman, K. W.: TROPESS CrIS-SNPP L2 Peroxyacetyl Nitrate for Mexico City, Summary Product V1, Greenbelt, MD, USA, Goddard Earth Sciences Data and Information Services Center (GES DISC) [data set], https://doi.org/10.5067/YTO4AV07QQOW, 2021a.
Bowman, K. W.: TROPESS CrIS-SNPP L2 Peroxyacetyl Nitrate for Mexico City, Standard Product V1, Greenbelt, MD, USA, Goddard Earth Sciences Data and Information Services Center (GES DISC) [data set], https://doi.org/10.5067/PECEC1AZ5R1J, 2021b.
Bowman, K. W.: TROPESS CrIS-SNPP L2 Carbon Monoxide for Forward Stream, Standard Product V1, Greenbelt, MD, USA, Goddard Earth Sciences Data and Information Services Center (GES DISC) [data set], https://doi.org/10.5067/EA7G2TTV84RV, 2021c.
Bowman, K. W.: TROPESS CrIS-JPSS1 L2 Carbon Monoxide for Forward Stream, Standard Product V1, Greenbelt, MD, USA, Goddard Earth Sciences Data and Information Services Center (GES DISC) [data set], https://doi.org/10.5067/BYIIUV3PR9L6, 2021d.
Bowman, K. W.: TROPESS CrIS-JPSS1 L2 Peroxyacetyl 75 Nitrate for Forward Stream, Standard Product V1, Greenbelt, MD, USA, Goddard Earth Sciences Data and Information Services Center (GES DISC) [data set], https://doi.org/10.5067/W0W6L8M6J85X, 2021e.
Bowman, K. W., Rodgers, C. D., Sund-Kulawik, S., Worden, J., Sarkissian, E., Osterman, G., Steck, T., Luo, M., Eldering, A., Shephard, M. W., Worden, H., Clough, S. A., Brown, P. D., Rinsland, C. P., Lampel, M., Gunson, M., and Beer, R.: Tropospheric emission spectrometer: Retrieval method and error analysis, IEEE Geosci. Remote Sens., 44, 1297–1307, 2006.
Bravo, H. A., Perrin, F. G., Sosa, R. E., and Torres, R. J.: Results of an air pollution strategy (lead reduction in gasoline) on the air quality of Mexico City, in: Proceedings of the 8th Clean Air Congress, Man and his Ecosystem, Elseiver Science Publishers, BV The Hague, the Netherlands, 31–37, 1989.
Cady-Pereira, K. E., Payne, V. H., Neu, J. L., Bowman, K. W., Miyazaki, K., Marais, E. A., Kulawik, S., Tzompa-Sosa, Z. A., and Hegarty, J. D.: Seasonal and spatial changes in trace gases over megacities from Aura TES observations: two case studies, Atmos. Chem. Phys., 17, 9379–9398, https://doi.org/10.5194/acp-17-9379-2017, 2017.
Christian, T. J., Yokelson, R. J., Cárdenas, B., Molina, L. T., Engling, G., and Hsu, S.-C.: Trace gas and particle emissions from domestic and industrial biofuel use and garbage burning in central Mexico, Atmos. Chem. Phys., 10, 565–584, https://doi.org/10.5194/acp-10-565-2010, 2010.
Clarisse, L., R'Honi, Y., Coheur, P. F., Hurtmans, D., and Clerbaux, C.: Thermal infrared nadir observations of 24 atmospheric gases, Geophys. Res. Lett., 38, 1–5, https://doi.org/10.1029/2011GL047271, 2011
de Foy, B., Caetano, E., Magaña, V., Zitácuaro, A., Cárdenas, B., Retama, A., Ramos, R., Molina, L. T., and Molina, M. J.: Mexico City basin wind circulation during the MCMA-2003 field campaign, Atmos. Chem. Phys., 5, 2267–2288, https://doi.org/10.5194/acp-5-2267-2005, 2005.
de Foy, B., Varela, J. R., Molina, L. T., and Molina, M. J.: Rapid ventilation of the Mexico City basin and regional fate of the urban plume, Atmos. Chem. Phys., 6, 2321–2335, https://doi.org/10.5194/acp-6-2321-2006, 2006.
de Foy, B., Fast, J. D., Paech, S. J., Phillips, D., Walters, J. T., Coulter, R. L., Martin, T. J., Pekour, M. S., Shaw, W. J., Kastendeuch, P. P., Marley, N. A., Retama, A., and Molina, L. T.: Basin-scale wind transport during the MILAGRO field campaign and comparison to climatology using cluster analysis, Atmos. Chem. Phys., 8, 1209–1224, https://doi.org/10.5194/acp-8-1209-2008, 2008.
De Smedt, I., Müller, J.-F., Stavrakou, T., van der A, R., Eskes, H., and Van Roozendael, M.: Twelve years of global observations of formaldehyde in the troposphere using GOME and SCIAMACHY sensors, Atmos. Chem. Phys., 8, 4947–4963, https://doi.org/10.5194/acp-8-4947-2008, 2008.
De Smedt, I., Yu, H., Richter, A., Beirle, S., Eskes, H., Boersma, K. F., Van Roozendael, M., Van Geffen, J., Lorente, A., and Peters, E.: QA4ECV HCHO tropospheric column data from OMI (Version 1.1) [L3 Monthly Means], Royal Belgian Institute for Space Aeronomy [data set], https://doi.org/10.18758/71021031, 2017.
Doran, J. C. and Zhong, S.: Thermally driven gap winds into the Mexico City basin, J. Appl. Meteorol., 39, 1330–1340, https://doi.org/10.1175/1520-0450(2000)039<1330:TDGWIT>2.0.CO;2, 2000.
Emmons, L. K., Apel, E. C., Lamarque, J.-F., Hess, P. G., Avery, M., Blake, D., Brune, W., Campos, T., Crawford, J., DeCarlo, P. F., Hall, S., Heikes, B., Holloway, J., Jimenez, J. L., Knapp, D. J., Kok, G., Mena-Carrasco, M., Olson, J., O'Sullivan, D., Sachse, G., Walega, J., Weibring, P., Weinheimer, A., and Wiedinmyer, C.: Impact of Mexico City emissions on regional air quality from MOZART-4 simulations, Atmos. Chem. Phys., 10, 6195–6212, https://doi.org/10.5194/acp-10-6195-2010, 2010.
Fast, J. D. and Zhong, S.: Meteorological factors associated with inhomogeneous ozone concentrations within the Mexico City basin, J. Geophys. Res.-Atmos., 103, 18927–18946, https://doi.org/10.1029/98JD01725, 1998.
Fischer, E. V., Jacob, D. J., Yantosca, R. M., Sulprizio, M. P., Millet, D. B., Mao, J., Paulot, F., Singh, H. B., Roiger, A., Ries, L., Talbot, R. W., Dzepina, K., and Pandey Deolal, S.: Atmospheric peroxyacetyl nitrate (PAN): a global budget and source attribution, Atmos. Chem. Phys., 14, 2679–2698, https://doi.org/10.5194/acp-14-2679-2014, 2014.
Fischer, E. V., Zhu, L., Payne, V. H., Worden, J. R., Jiang, Z., Kulawik, S. S., Brey, S., Hecobian, A., Gombos, D., Cady-Pereira, K., and Flocke, F.: Using TES retrievals to investigate PAN in North American biomass burning plumes, Atmos. Chem. Phys., 18, 5639–5653, https://doi.org/10.5194/acp-18-5639-2018, 2018.
Franco, B., Clarisse, L., Stavrakou, T., Müller, J. F., Van Damme, M., Whitburn, S., Hadji-Lazaro, J., Hurtmans, D., Taraborrelli, D., Clerbaux, C., and Coheur, P. F.: A General Framework for Global Retrievals of Trace Gases From IASI: Application to Methanol, Formic Acid, and PAN, J. Geophys. Res.-Atmos., 123, 13963–13984, https://doi.org/10.1029/2018JD029633, 2018.
Fu, D., Worden, J. R., Liu, X., Kulawik, S. S., Bowman, K. W., and Natraj, V.: Characterization of ozone profiles derived from Aura TES and OMI radiances, Atmos. Chem. Phys., 13, 3445–3462, https://doi.org/10.5194/acp-13-3445-2013, 2013.
Fu, D., Bowman, K. W., Worden, H. M., Natraj, V., Worden, J. R., Yu, S., Veefkind, P., Aben, I., Landgraf, J., Strow, L., and Han, Y.: High-resolution tropospheric carbon monoxide profiles retrieved from CrIS and TROPOMI, Atmos. Meas. Tech., 9, 2567–2579, https://doi.org/10.5194/amt-9-2567-2016, 2016.
Fu, D., Kulawik, S. S., Miyazaki, K., Bowman, K. W., Worden, J. R., Eldering, A., Livesey, N. J., Teixeira, J., Irion, F. W., Herman, R. L., Osterman, G. B., Liu, X., Levelt, P. F., Thompson, A. M., and Luo, M.: Retrievals of tropospheric ozone profiles from the synergism of AIRS and OMI: methodology and validation, Atmos. Meas. Tech., 11, 5587–5605, https://doi.org/10.5194/amt-11-5587-2018, 2018.
Gaffney, J. S., Marley, N. A., and Prestbo, E. W.: Peroxyacyl Nitrates (PANs): Their Physical and Chemical Properties, Handbook of Environmental Chemistry, 4, 1–38, https://doi.org/10.1007/978-3-540-46113-5_1, 1989.
Gaffney, J. S., Marley, N. A., Cunningham, M. M., and Doskey, P. V.: Measurements of peroxyacyl nitrates (PANS) in Mexico City: Implications for megacity air quality impacts on regional scales, Atmos. Environ., 33, 5003–5012, https://doi.org/10.1016/S1352-2310(99)00263-0, 1999.
Gao, W., Tie, X., Xu, J., Huang, R., Mao, X., Zhou, G., and Chang, L.: Long-term trend of O3 in a mega City (Shanghai), China: Characteristics, causes, and interactions with precursors, Sci. Total Environ., 603–604, 425–433, https://doi.org/10.1016/j.scitotenv.2017.06.099, 2017.
Garcia, A. R., Volkamer, R., Molina, L. T., Molina, M. J., Samuelson, J., Mellqvist, J., Galle, B., Herndon, S. C., and Kolb, C. E.: Separation of emitted and photochemical formaldehyde in Mexico City using a statistical analysis and a new pair of gas-phase tracers, Atmos. Chem. Phys., 6, 4545–4557, https://doi.org/10.5194/acp-6-4545-2006, 2006.
Glatthor, N., von Clarmann, T., Fischer, H., Funke, B., Grabowski, U., Höpfner, M., Kellmann, S., Kiefer, M., Linden, A., Milz, M., Steck, T., and Stiller, G. P.: Global peroxyacetyl nitrate (PAN) retrieval in the upper troposphere from limb emission spectra of the Michelson Interferometer for Passive Atmospheric Sounding (MIPAS), Atmos. Chem. Phys., 7, 2775–2787, https://doi.org/10.5194/acp-7-2775-2007, 2007.
Gurjar, B. R. and Lelieveld, J.: New directions: Megacities and global change, Atmos. Environ., 39, 391–393, https://doi.org/10.1016/j.atmosenv.2004.11.002, 2005.
Jarvis, A., Reuter, H. I., Nelson, A., and Guevara, E.: Hole-filled seamless SRTM data V4, International Centre for Tropical Agriculture (CIAT), https://srtm.csi.cgiar.org (last access: September 2021), 2008.
Jaimes-Palomera, M., Retama, A., Elias-Castro, G., Neria-Hernández, A., Rivera-Hernández, O., and Velasco, E.: Non-methane hydrocarbons in the atmosphere of Mexico City: Results of the 2012 ozone-season campaign, Atmos. Environ., 132, 258–275, https://doi.org/10.1016/j.atmosenv.2016.02.047, 2016.
Jiang, Z., Worden, J. R., Payne, V. H., Zhu, L., Fischer, E., Walker, T., and Jones, D. B. A.: Ozone export from east asia: The role of PAN, J. Geophys. Res., 121, 6555–6563, https://doi.org/10.1002/2016JD024952, 2016.
Johansson, M., Rivera, C., de Foy, B., Lei, W., Song, J., Zhang, Y., Galle, B., and Molina, L.: Mobile mini-DOAS measurement of the outflow of NO2 and HCHO from Mexico City, Atmos. Chem. Phys., 9, 5647–5653, https://doi.org/10.5194/acp-9-5647-2009, 2009.
Juncosa Calahorrano, J. F., Payne, V. H., Kulawik, S., Ford, B., Flocke, F., Campos, T., and Fischer, E. V.: Evolution of Acyl Peroxynitrates (PANs) in Wildfire Smoke Plumes Detected by the Cross-Track Infrared Sounder (CrIS) Over the Western U.S. During Summer 2018, Geophys. Res. Lett., 48, e2021GL093405, https://doi.org/10.1029/2021gl093405, 2021.
Kleindienst, T. E., Shepson, P. B., Smith, D. F., Hudgens, E. E., Nero, C. M., Cupitt, L. T., Bufalini, J. J., Claxton, L. D., and Nestman, F. R.: Comparison of mutagenic activities of several peroxyacyl nitrates, Environ. Mol. Mutagen., 16, 70–80, https://doi.org/10.1002/em.2850160204, 1990.
LANCE FIRMS: MODIS/Aqua+Terra Thermal Anomalies/Fire locations 1km FIRMS V006 and V0061 (Vector data), NASA ESDIS [data set], https://doi.org/10.5067/FIRMS/MODIS/MCD14ML, 2021.
LANCE FIRMS: VIIRS (S-NPP) I Band 375 m Active Fire Product NRT (Vector data), NASA ESDIS [data set], https://doi.org/10.5067/FIRMS/VIIRS/VNP14IMGT_NRT.002, 2021b.
Lawrence, M. G., Butler, T. M., Steinkamp, J., Gurjar, B. R., and Lelieveld, J.: Regional pollution potentials of megacities and other major population centers, Atmos. Chem. Phys., 7, 3969–3987, https://doi.org/10.5194/acp-7-3969-2007, 2007.
Lei, W., de Foy, B., Zavala, M., Volkamer, R., and Molina, L. T.: Characterizing ozone production in the Mexico City Metropolitan Area: a case study using a chemical transport model, Atmos. Chem. Phys., 7, 1347–1366, https://doi.org/10.5194/acp-7-1347-2007, 2007.
Lei, W., Zavala, M., de Foy, B., Volkamer, R., and Molina, L. T.: Characterizing ozone production and response under different meteorological conditions in Mexico City, Atmos. Chem. Phys., 8, 7571–7581, https://doi.org/10.5194/acp-8-7571-2008, 2008.
Lei, W., Zavala, M., de Foy, B., Volkamer, R., Molina, M. J., and Molina, L. T.: Impact of primary formaldehyde on air pollution in the Mexico City Metropolitan Area, Atmos. Chem. Phys., 9, 2607–2618, https://doi.org/10.5194/acp-9-2607-2009, 2009.
Li, F., Zhang, X., Kondragunta, S., and Csiszar, I.: Comparison of Fire Radiative Power Estimates From VIIRS and MODIS Observations, J. Geophys. Res.-Atmos., 123, 4545–4563, https://doi.org/10.1029/2017JD027823, 2018.
Madronich, S.: Chemical evolution of gaseous air pollutants down-wind of tropical megacities: Mexico City case study, Atmos. Environ., 40, 6012–6018, https://doi.org/10.1016/j.atmosenv.2005.08.047, 2006.
Mage, D., Ozolins, G., Peterson, P., Webster, A., Orthofer, R., Vandeweerd, V., and Gwynne, M.: Urban air pollution in megacities of the world, Atmos. Environ., 30, 681–686, https://doi.org/10.1016/1352-2310(95)00219-7, 1996.
Mahieu, E., Fischer E., V., Franco, B., Palm, M., Wizenberg, T., Smale, D., Clarisse, L., Clerbaux, C., Coheur, P., Hannigan, J., W., Lutsch, E., Notholt, J., Cantos, I., P., Prignon, M., Servais, C., and Strong, K.: First retrievals of peroxyacetyl nitrate (PAN) from ground-based FTIR solar spectra recorded at remote sites, comparison with model and satellite data, Elementa, 9, 00027, https://doi.org/10.1525/elementa.2021.00027, 2021.
MARI: Mexico City Air Quality Initiative: Los Alamos National Laboratory and the Mexican Petroleum Institute, Los Alamos Report #LA-12699, 1994.
Marley, N. A., Gaffney, J. S., Ramos-Villegas, R., and Cárdenas González, B.: Comparison of measurements of peroxyacyl nitrates and primary carbonaceous aerosol concentrations in Mexico City determined in 1997 and 2003, Atmos. Chem. Phys., 7, 2277–2285, https://doi.org/10.5194/acp-7-2277-2007, 2007.
Mena-Carrasco, M., Carmichael, G. R., Campbell, J. E., Zimmerman, D., Tang, Y., Adhikary, B., D'allura, A., Molina, L. T., Zavala, M., García, A., Flocke, F., Campos, T., Weinheimer, A. J., Shetter, R., Apel, E., Montzka, D. D., Knapp, D. J., and Zheng, W.: Assessing the regional impacts of Mexico City emissions on air quality and chemistry, Atmos. Chem. Phys., 9, 3731–3743, https://doi.org/10.5194/acp-9-3731-2009, 2009.
Molina, L. T.: Introductory lecture: Air quality in megacities, Faraday Discuss., 226, 9–52, https://doi.org/10.1039/d0fd00123f, 2021.
Molina, L. T. and Molina, M.: Air quality in the Mexico megacity: An integrated assessment, EURE (Santiago), 32, 141–145, https://doi.org/10.4067/s0250-71612006000200009, 2002.
Molina, L. T., Kolb, C. E., de Foy, B., Lamb, B. K., Brune, W. H., Jimenez, J. L., Ramos-Villegas, R., Sarmiento, J., Paramo-Figueroa, V. H., Cardenas, B., Gutierrez-Avedoy, V., and Molina, M. J.: Air quality in North America's most populous city – overview of the MCMA-2003 campaign, Atmos. Chem. Phys., 7, 2447–2473, https://doi.org/10.5194/acp-7-2447-2007, 2007.
Molina, L. T., De Foy, B., Vázquez Martínez, O., Hugo, V., and Figueroa, P.: Title Air quality, weather and climate in Mexico City, WMO Bulletin, 8, 48–53, 2009.
Molina, L. T., Madronich, S., Gaffney, J. S., Apel, E., de Foy, B., Fast, J., Ferrare, R., Herndon, S., Jimenez, J. L., Lamb, B., Osornio-Vargas, A. R., Russell, P., Schauer, J. J., Stevens, P. S., Volkamer, R., and Zavala, M.: An overview of the MILAGRO 2006 Campaign: Mexico City emissions and their transport and transformation, Atmos. Chem. Phys., 10, 8697–8760, https://doi.org/10.5194/acp-10-8697-2010, 2010.
Molina, L. T., Velasco, E., Retama, A., and Zavala, M.: Experience from integrated air quality management in the Mexico City Metropolitan Area and Singapore, Atmosphere, 10, 512, https://doi.org/10.3390/atmos10090512, 2019.
Moore, D. P. and Remedios, J. J.: Seasonality of Peroxyacetyl nitrate (PAN) in the upper troposphere and lower stratosphere using the MIPAS-E instrument, Atmos. Chem. Phys., 10, 6117–6128, https://doi.org/10.5194/acp-10-6117-2010, 2010.
NASA/LARC/SD/ASDC: TES/Aura L2 Peroxyacyl Nitrate Nadir Special Observation V007, NASA Langley Atmospheric Science Data Center DAAC [data set], https://doi.org/10.5067/AURA/TES/TL2PANNS_L2.007, 2017.
Osibanjo, O. O., Rappenglück, B., and Retama, A.: Anatomy of the March 2016 severe ozone smog episode in Mexico-City, Atmos. Environ., 244, 117945, https://doi.org/10.1016/j.atmosenv.2020.117945, 2021.
Payne, V. H., Alvarado, M. J., Cady-Pereira, K. E., Worden, J. R., Kulawik, S. S., and Fischer, E. V.: Satellite observations of peroxyacetyl nitrate from the Aura Tropospheric Emission Spectrometer, Atmos. Meas. Tech., 7, 3737–3749, https://doi.org/10.5194/amt-7-3737-2014, 2014.
Payne, V. H., Fischer, E. V., Worden, J. R., Jiang, Z., Zhu, L., Kurosu, T. P., and Kulawik, S. S.: Spatial variability in tropospheric peroxyacetyl nitrate in the tropics from infrared satellite observations in 2005 and 2006, Atmos. Chem. Phys., 17, 6341–6351, https://doi.org/10.5194/acp-17-6341-2017, 2017.
Payne, V. H., Kulawik, S. S., Fischer, E. V., Brewer, J. F., Huey, L. G., Miyazaki, K., Worden, J. R., Bowman, K. W., Hintsa, E. J., Moore, F., Elkins, J. W., and Juncosa Calahorrano, J.: Satellite measurements of peroxyacetyl nitrate from the Cross-Track Infrared Sounder: comparison with ATom aircraft measurements, Atmos. Meas. Tech., 15, 3497–3511, https://doi.org/10.5194/amt-15-3497-2022, 2022.
Pope, R. J., Richards, N. A. D., Chipperfield, M. P., Moore, D. P., Monks, S. A., Arnold, S. R., Glatthor, N., Kiefer, M., Breider, T. J., Harrison, J. J., Remedios, J. J., Warneke, C., Roberts, J. M., Diskin, G. S., Huey, L. G., Wisthaler, A., Apel, E. C., Bernath, P. F., and Feng, W.: Intercomparison and evaluation of satellite peroxyacetyl nitrate observations in the upper troposphere–lower stratosphere, Atmos. Chem. Phys., 16, 13541–13559, https://doi.org/10.5194/acp-16-13541-2016, 2016.
Qiu, Y., Ma, Z., Li, K., Lin, W., Tang, Y., Dong, F., and Liao, H.: Markedly Enhanced Levels of Peroxyacetyl Nitrate (PAN) During COVID-19 in Beijing, Geophys. Res. Lett., 47, 1–10, https://doi.org/10.1029/2020GL089623, 2020.
RAMA: Secretaría de Medio Ambiente, Gobierno de la Ciudad de México: Red automática de Monitoreo atmosférico, http://www.aire.cdmx.gob.mx/ (last access: July 2021), 2020.
Roberts, J. M.: PAN and Related Compounds, in: Volatile Organic Compounds in the Atmosphere, edited by: Koppmann, R., Blackwell Publishing Ltd, 221–268, https://doi.org/10.1002/9780470988657.ch6, 2007.
Roy, D. P., Boschetti, L., Justice, C. O., and Ju, J.: The collection 5 MODIS burned area product – Global evaluation by comparison with the MODIS active fire product, Remote Sens. Environ., 112, 3690–3707, https://doi.org/10.1016/j.rse.2008.05.013, 2008.
Shen, L., Jacob, D. J., Zhu, L., Zhang, Q., Zheng, B., Sulprizio, M. P., Li, K., De Smedt, I., González Abad, G., Cao, H., Fu, T. M., and Liao, H.: The 2005–2016 Trends of Formaldehyde Columns Over China Observed by Satellites: Increasing Anthropogenic Emissions of Volatile Organic Compounds and Decreasing Agricultural Fire Emissions, Geophys. Res. Lett., 46, 4468–4475, https://doi.org/10.1029/2019GL082172, 2019.
Shepson, P. B., Kleindlenst, T. E., Nero, C. M., Hodges, D. N., Cupitt, L. T., and Claxton, L. D.: Allyl Chloride: The Mutagenic Activity of Its Photooxidation Products, Environ. Sci. Technol., 21, 568–573, https://doi.org/10.1021/es00160a007, 1987.
Sillman, S. and West, J. J.: Reactive nitrogen in Mexico City and its relation to ozone-precursor sensitivity: results from photochemical models, Atmos. Chem. Phys., 9, 3477–3489, https://doi.org/10.5194/acp-9-3477-2009, 2009.
Simon, H., Reff, A., Wells, B., Xing, J., and Frank, N.: Ozone trends across the United States over a period of decreasing NOx and VOC emissions, Environ. Sci. Technol., 49, 186–195, https://doi.org/10.1021/es504514z, 2015.
Singh, H. B. and Salas, L. J.: Global distribution of peroxyscetyl nitrate, Nature, 321, 588–591, 1986.
Singh, H. B, Park, M., Hanst, P. L., U.S. Environmental Agency, and Carolina, N.: Peroxyacetyl Nitrate (PAN) in the unpolluted atmosphere: an important reservoir for nitrogen oxides, Geophys. Res. Lett., 8, 941–944, 1981.
Smith, L. E.: Inhalation of the Photochemical Smog Compound Peroxyacetyl Nitrate, Am. J. Public Health N., 55, 1460–1468, https://doi.org/10.2105/AJPH.55.9.1460, 1965.
Song, J., Lei, W., Bei, N., Zavala, M., de Foy, B., Volkamer, R., Cardenas, B., Zheng, J., Zhang, R., and Molina, L. T.: Ozone response to emission changes: a modeling study during the MCMA-2006/MILAGRO Campaign, Atmos. Chem. Phys., 10, 3827–3846, https://doi.org/10.5194/acp-10-3827-2010, 2010.
Streit, G. E. and Guzman, F.: Mexico City air quality: Progress of an international collaborative project to define air quality management options, Atmos. Environ., 30, 723–733, https://doi.org/10.1016/1352-2310(95)00275-8, 1996.
Taylor, O. C.: Importance of peroxyacetyl nitrate (pan) as a phytotoxic air pollutant, JAPCA J. Air Waste Ma., 19, 347–351, https://doi.org/10.1080/00022470.1969.10466498, 1969
Tereszchuk, K. A., Moore, D. P., Harrison, J. J., Boone, C. D., Park, M., Remedios, J. J., Randel, W. J., and Bernath, P. F.: Observations of peroxyacetyl nitrate (PAN) in the upper troposphere by the Atmospheric Chemistry Experiment-Fourier Transform Spectrometer (ACE-FTS), Atmos. Chem. Phys., 13, 5601–5613, https://doi.org/10.5194/acp-13-5601-2013, 2013.
Tie, X., Madronich, S., Li, G. H., Ying, Z., Zhang, R., Garcia, A. R., Lee-Taylor, J., and Liu, Y.: Characterizations of chemical oxidants in Mexico City: A regional chemical dynamical model (WRF-Chem) study, Atmos. Environ., 41, 1989–2008, https://doi.org/10.1016/j.atmosenv.2006.10.053, 2007.
Tzompa-Sosa, Z. A., Sullivan, A. P., Retama, A., and Kreidenweis, S. M.: Contribution of biomass burning to carbonaceous aerosols in Mexico city during may 2013, Aerosol Air Qual. Res., 16, 114–124, https://doi.org/10.4209/aaqr.2015.01.0030, 2016.
UN/DESA: The World's Cities in 2018, World Urbanization Prospects: The 2018 Revision, 34 pp., https://www.un.org/en/development/desa/population/publications/pdf/urbanization/the_worlds_cities_in_2018_data_booklet.pdf (last access: 20 February 2023), 2018.
UNEP and WHO: Urban Air Pollution in Megacities of the World, Geogr. Rev., 84, 117, https://doi.org/10.2307/215790, 1992.
Ungermann, J., Ern, M., Kaufmann, M., Müller, R., Spang, R., Ploeger, F., Vogel, B., and Riese, M.: Observations of PAN and its confinement in the Asian summer monsoon anticyclone in high spatial resolution, Atmos. Chem. Phys., 16, 8389–8403, https://doi.org/10.5194/acp-16-8389-2016, 2016.
Velasco, E., Lamb, B., Westberg, H., Allwine, E., Sosa, G., Arriaga-Colina, J. L., Jobson, B. T., Alexander, M. L., Prazeller, P., Knighton, W. B., Rogers, T. M., Grutter, M., Herndon, S. C., Kolb, C. E., Zavala, M., de Foy, B., Volkamer, R., Molina, L. T., and Molina, M. J.: Distribution, magnitudes, reactivities, ratios and diurnal patterns of volatile organic compounds in the Valley of Mexico during the MCMA 2002 & 2003 field campaigns, Atmos. Chem. Phys., 7, 329–353, https://doi.org/10.5194/acp-7-329-2007, 2007.
Vyskocil, A., Viau, C., and Lamy, S.: Peroxyacetyl nitrate: review of toxicity, Hum. Exp. Toxicol., 17, 212–220, https://doi.org/10.1177/096032719801700403, 1998.
Wei, J., Sun, L., Huang, B., Bilal, M., Zhang, Z., and Wang, L.: Verification, improvement and application of aerosol optical depths in China Part 1: Inter-comparison of NPP-VIIRS and Aqua-MODIS, Atmos. Environ., 175, 221–233, https://doi.org/10.1016/j.atmosenv.2017.11.048, 2018.
Wiegele, A., Glatthor, N., Höpfner, M., Grabowski, U., Kellmann, S., Linden, A., Stiller, G., and von Clarmann, T.: Global distributions of C2H6, C2H2, HCN, and PAN retrieved from MIPAS reduced spectral resolution measurements, Atmos. Meas. Tech., 5, 723–734, https://doi.org/10.5194/amt-5-723-2012, 2012.
Worden, J. R., Kulawik, S. S., Fu, D., Payne, V. H., Lipton, A. E., Polonsky, I., He, Y., Cady-Pereira, K., Moncet, J.-L., Herman, R. L., Irion, F. W., and Bowman, K. W.: Characterization and evaluation of AIRS-based estimates of the deuterium content of water vapor, Atmos. Meas. Tech., 12, 2331–2339, https://doi.org/10.5194/amt-12-2331-2019, 2019.
Worden, H. M., Francis, G. L., Kulawik, S. S., Bowman, K. W., Cady-Pereira, K., Fu, D., Hegarty, J. D., Kantchev, V., Luo, M., Payne, V. H., Worden, J. R., Commane, R., and McKain, K.: TROPESS/CrIS carbon monoxide profile validation with NOAA GML and ATom in situ aircraft observations, Atmos. Meas. Tech., 15, 5383–5398, https://doi.org/10.5194/amt-15-5383-2022, 2022.
Yokelson, R. J., Urbanski, S. P., Atlas, E. L., Toohey, D. W., Alvarado, E. C., Crounse, J. D., Wennberg, P. O., Fisher, M. E., Wold, C. E., Campos, T. L., Adachi, K., Buseck, P. R., and Hao, W. M.: Emissions from forest fires near Mexico City, Atmos. Chem. Phys., 7, 5569–5584, https://doi.org/10.5194/acp-7-5569-2007, 2007.
Yokelson, R. J., Crounse, J. D., DeCarlo, P. F., Karl, T., Urbanski, S., Atlas, E., Campos, T., Shinozuka, Y., Kapustin, V., Clarke, A. D., Weinheimer, A., Knapp, D. J., Montzka, D. D., Holloway, J., Weibring, P., Flocke, F., Zheng, W., Toohey, D., Wennberg, P. O., Wiedinmyer, C., Mauldin, L., Fried, A., Richter, D., Walega, J., Jimenez, J. L., Adachi, K., Buseck, P. R., Hall, S. R., and Shetter, R.: Emissions from biomass burning in the Yucatan, Atmos. Chem. Phys., 9, 5785–5812, https://doi.org/10.5194/acp-9-5785-2009, 2009.
Yokelson, R. J., Burling, I. R., Urbanski, S. P., Atlas, E. L., Adachi, K., Buseck, P. R., Wiedinmyer, C., Akagi, S. K., Toohey, D. W., and Wold, C. E.: Trace gas and particle emissions from open biomass burning in Mexico, Atmos. Chem. Phys., 11, 6787–6808, https://doi.org/10.5194/acp-11-6787-2011, 2011.
Zavala, M., Brune, W. H., Velasco, E., Retama, A., Cruz-Alavez, L. A., and Molina, L. T.: Changes in ozone production and VOC reactivity in the atmosphere of the Mexico City Metropolitan Area, Atmos. Environ., 238, 117747, https://doi.org/10.1016/j.atmosenv.2020.117747, 2020.
Zhu, L., Fischer, E. V., Payne, V. H., Worden, J. R., and Jiang, Z.: TES observations of the interannual variability of PAN over Northern Eurasia and the relationship to springtime fires, Geophys. Res. Lett., 42, 7230–7237, https://doi.org/10.1002/2015GL065328, 2015.
Zhu, L., Payne, V. H., Walker, T. W., Worden, J. R., Jiang, Z., Kulawik, S. S., and Fischer, E. V.: PAN in the eastern Pacific free troposphere: A satellite view of the sources, seasonality, interannual variability, and timeline for trend detection, J. Geophys. Res., 122, 3614–3629, https://doi.org/10.1002/2016JD025868, 2017.