the Creative Commons Attribution 4.0 License.
the Creative Commons Attribution 4.0 License.
 | 24 Feb 2023
Effects of transport on a biomass burning plume from Indochina during EMeRGe-Asia identified by WRF-Chem
Wan-Chin Chen
Yi-Yun Chien
Charles C. K. Chou
Chian-Yi Liu
Helmut Ziereis
Hans Schlager
Eric Förster
Florian Obersteiner
Ovid O. Krüger
Bruna A. Holanda
Mira L. Pöhlker
Katharina Kaiser
Johannes Schneider
Birger Bohn
Klaus Pfeilsticker
Benjamin Weyland
Maria Dolores Andrés Hernández
John P. Burrows
The Indochina biomass burning (BB) season in springtime has a substantial environmental impact on the surrounding areas in Asia. In this study, we evaluated the environmental impact of a major long-range BB transport event on 19 March 2018 (a flight of the High Altitude and Long Range Research Aircraft (HALO; https://www.halo-spp.de, last access: 14 February 2023) research aircraft, flight F0319) preceded by a minor event on 17 March 2018 (flight F0317). Aircraft data obtained during the campaign in Asia of the Effect of Megacities on the transport and transformation of pollutants on the Regional to Global scales (EMeRGe) were available between 12 March and 7 April 2018. In F0319, results of 1 min mean carbon monoxide (CO), ozone (O3), acetone (ACE), acetonitrile (ACN), organic aerosol (OA), and black carbon aerosol (BC) concentrations were up to 312.0, 79.0, 3.0, and 0.6 ppb and 6.4 and 2.5 µg m−3, respectively, during the flight, which passed through the BB plume transport layer (BPTL) between the elevation of 2000–4000 m over the East China Sea (ECS). During F0319, the CO, O3, ACE, ACN, OA, and BC maximum of the 1 min average concentrations were higher in the BPTL by 109.0, 8.0, 1.0, and 0.3 ppb and 3.0 and 1.3 µg m−3 compared to flight F0317, respectively. Sulfate aerosol, rather than OA, showed the highest concentration at low altitudes (<1000 m) in both flights F0317 and F0319 resulting from the continental outflow in the ECS.
The transport of BB aerosols from Indochina and its impacts on the downstream area were evaluated using a Weather Research Forecasting with Chemistry (WRF-Chem) model. The modeling results tended to overestimate the concentration of the species, with examples being CO (64 ppb), OA (0.3 µg m−3), BC (0.2 µg m−3), and O3 (12.5 ppb) in the BPTL. Over the ECS, the simulated BB contribution demonstrated an increasing trend from the lowest values on 17 March 2018 to the highest values on 18 and 19 March 2018 for CO, fine particulate matter (PM2.5), OA, BC, hydroxyl radicals (OH), nitrogen oxides (NOx), total reactive nitrogen (NOy), and O3; by contrast, the variation of J(O1D) decreased as the BB plume's contribution increased over the ECS. In the lower boundary layer (<1000 m), the BB plume's contribution to most species in the remote downstream areas was <20 %. However, at the BPTL, the contribution of the long-range transported BB plume was as high as 30 %–80 % for most of the species (NOy, NOx, PM2.5, BC, OH, O3, and CO) over southern China (SC), Taiwan, and the ECS. BB aerosols were identified as a potential source of cloud condensation nuclei, and the simulation results indicated that the transported BB plume had an effect on cloud water formation over SC and the ECS on 19 March 2018. The combination of BB aerosol enhancement with cloud water resulted in a reduction of incoming shortwave radiation at the surface in SC and the ECS by 5 %–7 % and 2 %–4 %, respectively, which potentially has significant regional climate implications.
- Article
(8494 KB) - Full-text XML
-
Supplement
(1364 KB) - BibTeX
- EndNote


Biomass burning (BB) is one of the main sources of aerosols, greenhouse gases, and air pollutants (e.g., Ramanathan et al., 2007; Lin et al., 2009, 2014, Lin et al., 2013; Tang et al., 2003; Carmichael et al., 2003; Chi et al., 2010; Fu et al., 2012; Chuang et al., 2016). Reid et al. (2013) and Giglio et al. (2013) investigated the seasonal aerosol optical depth over Southeast Asia and have indicated that Indochina is a major contributor of carbon emissions in springtime. Galanter et al. (2000) estimated that BB accounts for 15 %–30 % of the entire tropospheric CO background. Huang et al. (2013) indicated that the contribution of BB in Southeast Asia to the aerosol optical depth (AOD) in Hong Kong and Taiwan could be in the range of 26 %–62 %. Moreover, BB emissions over Indochina are a significant contributor to black carbon (BC), organic carbon (OC), and O3 in East Asia (Lin et al., 2014). In their BB modeling study, Lin et al. (2014) identified a northeast (NE) to southwest (SW) zone stretching from southern China (SC) to Taiwan with a reduction in shortwave radiation of approximately 20 W m−2 at the ground surface. In addition, the total carbon emission from BB in Southeast Asia is approximately 91 Tg C yr−1, accounting for 4.9 % of the global total (Yadav et al., 2017). According to Xu et al. (2018), BB in Indochina leads to BC production at high concentrations of up to 2–6 µg m−3 in spring. The authors reported that BC particles were transported to the glaciers in the Tibetan Plateau, where it significantly affected the melting of the snow, causing some severe environmental problems, such as water resource depletion. Ding et al. (2021) indicated that BB aloft aerosols strongly increase the low cloud coverage over both land and ocean and affect the monsoon in the subtropical Southeast Asia.
Although many researchers have indicated the importance of BB emissions, their precise estimation and application in the modeling study remains challenging (Fu et al., 2012; Huang et al., 2013; Pimonstree et al., 2018; Marvin et al., 2021). For example, Heald et al. (2003) conducted an emission inventory in Southeast Asia and reported that the uncertainties of BB emission estimations could be a factor of 3 or even higher. Following an inverse model analysis, Palmer et al. (2003) also indicated the overestimation of regional BB emissions over Indochina. Shi and Yamaguchi (2014) pointed out BB emissions exhibited strong temporal interannual variability between 2001 and 2010 over Southeast Asia. Satellite data can be used to easily locate hotspots such as those where agricultural residual burning and forest wildfires are occurring worldwide. However, accurately quantifying the amount of BB emissions from satellite data is difficult, because anthropogenic pollutants and BB emissions are typically mixed in the atmosphere. During the NASA Transport and Chemical Evolution over the Pacific (TRACE-P) aircraft mission in the spring of 2001, Jacob et al. (2003) observed that warm conveyor belts (WCBs) lift both anthropogenic and BB (from SE Asia) air pollution to the free troposphere, resulting in complex chemical signatures. Wiedinmyer et al. (2011) demonstrated that the uncertainty of emission estimation could be as high as a factor of 2 because of the error introduced by estimates in fire hotspots, area burned, land cover maps, biomass consumption, and emission factors in the model. In this context, Lin et al. (2014) highlighted the uncertainty of emission estimation in the first version of the Fire Inventory from NCAR (Wiedinmyer et al., 2011).
The transport of BB pollution is strongly dependent on the atmospheric structure and weather conditions. Tang et al. (2003) noted that most BB aerosols, having their source in Indochina (mainly south of 25∘ N and aloft to an altitude of 2000–4000 m) during the TRACE-P campaign were associated with outflow in the WCB region after frontal passage. Lin et al. (2009) suggested a mountain lee-side trough as an important mechanism, resulting in BB product transport from the surface to >3000 m. BB pollution is often transported from its sources to the East China Sea (ECS), Taiwan, and the western North Pacific within a few days.
The airborne field experiment Effect of Megacities on the transport and transformation of pollutants on the Regional to Global scales (EMeRGe) over Asia was led by the University of Bremen, Germany, and conducted in collaboration with Academia Sinica during the intermonsoon period in 2018 (https://www.iup.uni-bremen.de/emerge/home/home.html, last access: 14 February 2023). The EMeRGe aircraft mission consists of two parts. The first mission phase was conducted in Germany in July 2017, and the second phase was conducted from Taiwan in 2018 (Andrés Hernández et al., 2022). EMeRGe in Asia aimed at investigating the long-range transport (LRT) of local and regional pollution originating in Asian major population centers (MPCs) from the Asian continent into the Pacific. A central part of the project was the airborne measurement of pollution plumes on board the High Altitude and Long Range Research Aircraft (HALO). The HALO platform was based in Tainan, Taiwan (Fig. 1a–b), and made optimized transects and vertical profiling in regions north or south of Taiwan, dependent on the relevant weather and emission conditions. HALO measurements additionally provide important information for the evaluation of the LRT of BB emissions and its potential environmental impact in East Asia between 12 March and 7 April 2018. During the EMeRGe-Asia campaign, HALO carried out 12 mission flights in Asia and 4 transfer flights from Europe to Asia with a total of 110 flight hours.
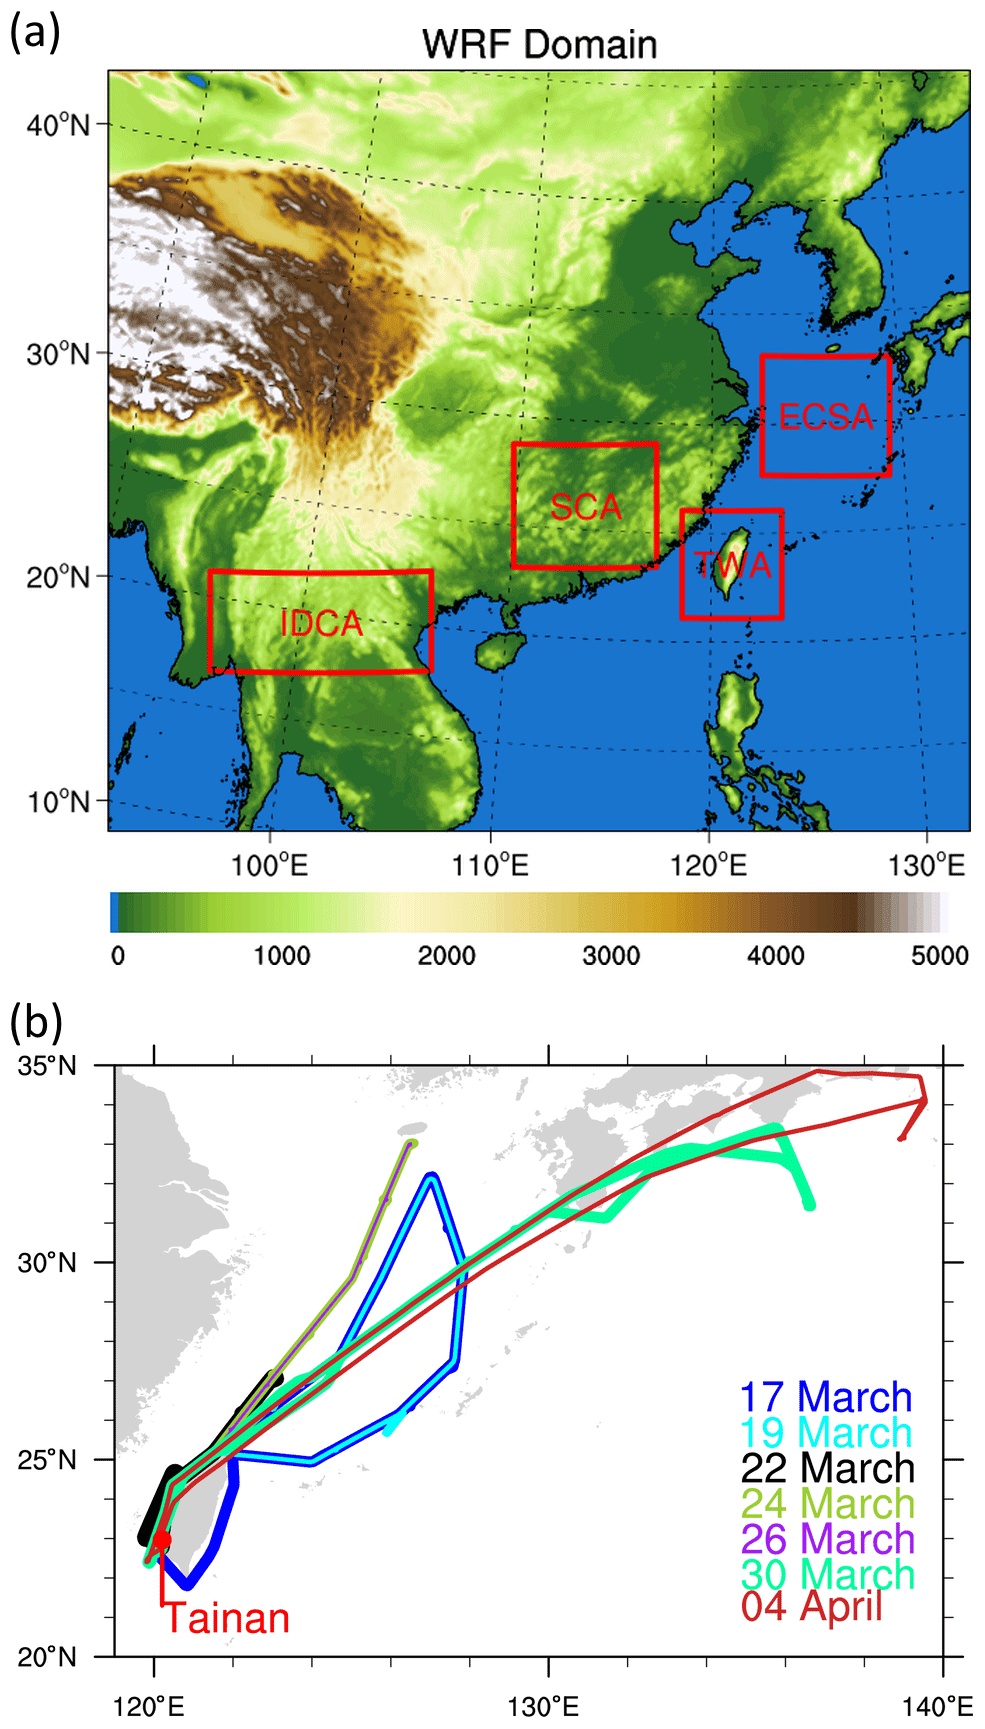
Figure 1(a) Configuration of the Weather Research and Forecasting model domain, topography, and location of proposed study areas in East Asia, namely Indochina area (IDCA), southern China area (SCA), Taiwan area (TWA), and East China Sea area (ECSA). (b) The HALO flights on 17, 19, 22, 24, 26, and 30 March and 4 April during the EMeRGe-Asia campaign. Different colors indicate different flights over East Asia. Maps and plots were produced using the NCAR Command Language (NCL) version 6.6.2.
This paper is organized as follows: the model configuration and BB emission analysis employed in the model simulation are described in Sect. 2, and the weather conditions and HALO measurement results are presented in Sect. 3. The model performance, as well as the evaluation of BB product transport and effects on East-Asia-selected regions, are discussed in Sects. 4 and 5, respectively.
2.1 HALO aircraft data
The HALO aircraft was equipped with a number of instruments, and a detailed description of the measurement systems on board the HALO was presented in Andrés Hernández et al. (2022). In this study, aerosol data (OA, BC, SO, NO, NH and trace gases such as CO, SO2, O3, NOx, NOy, acetone (ACE), acetonitrile (ACN), HCHO, HONO, and photolysis rate J(O1D), J(NO2) were employed in the analysis.
2.2 WRF-Chem model and model configuration
We used the Weather Research Forecasting with Chemistry (WRF-Chem) model (v4.1.1) (Grell et al., 2005; Powers et al., 2017) to study the LRT of air masses associated with BB pollutants in Indochina. The initial and boundary meteorological conditions for WRF-Chem were obtained from the National Centers for Environmental Prediction (NCEP) Global Data Assimilation System (GDAS) global analysis data sets at 6 h intervals. The Mellor–Yamada–Janjic planetary boundary layer scheme (Janjic, 1994) was applied. The horizontal resolution for the simulations performed was 10 km, and the grid box had 442×391 points in the east–west and north–south directions (Fig. 1a). A total of 41 vertical levels were included, with the lowest level at an elevation of approximately 50 m. To improve the accuracy of the meteorological fields, a grid nudging four-dimensional data assimilation scheme was applied using the NCEP-GDAS global analysis data.
The cloud microphysics used followed the Lin scheme (Morrison et al., 2005). The rapid radiative transfer model (Zhao et al., 2011) was used for both longwave and shortwave radiation schemes. Moreover, land surface processes are simulated using the Noah LSM scheme (Hong et al., 2009). In terms of transport processes, we considered advection by winds, convection by clouds, and diffusion by turbulent mixing. The removal processes in this study were gravitational settling, surface deposition, and wet deposition (scavenging in convective updrafts and rainout or washout in large-scale precipitation). The kinetic preprocessor (KPP) interface was used in both of the chemistry schemes of the Regional Atmospheric Chemistry Mechanism (RACM, Stockwell et al., 1990). The secondary organic aerosol formation module, the Modal Aerosol Dynamics Model for Europe (Ackermann et al., 1998) with the volatility basis set (VBS) approach (Ahmadov et al., 2012), was also employed in the WRF-Chem model. In RACM, the “KET” represents acetone and higher saturated ketones (KET) (Stockwell et al., 1997). According to Singh et al. (1994), BB and the primary anthropogenic emissions could contribute 26 % and 3 %, respectively, to the atmospheric acetone sources. The model configuration and physics and chemistry options are listed in Table 1.
Table 1WRF-Chem model configuration and physics and chemistry options in this study (rapid radiative transfer model for general circulation models: RRTMG; Fire Inventory from National Center for Atmospheric Research: FINN).

2.3 Emission inventories
Anthropogenic emissions, such as NOx, CO, SO2, nonmethane volatile organic compounds, sulfate, nitrate, PM10, and PM2.5, were adopted on the basis of the emission inventory in Asia – MICS-Asia III, which is the year in 2010 (Li et al., 2020; Kong et al., 2020). For BB emissions FINNv1.5 (https://www.acom.ucar.edu/Data/fire/, last access: 14 February 2023) was employed. FINN provided daily, 1000 m resolution global estimates of the trace gas and particle emissions from open BB, which included wildfires, agricultural fires, and prescribed burning but not biofuel use and trash burning (Wiedinmyer et al., 2011). The anthropogenic emissions in Taiwan were obtained from the Taiwan Emission Data System (TEDS) which is the emission inventory of the air-pollutant monitoring database of the Taiwan Environmental Protection Administration. The TEDS version used for this study was v9.0 (2013) and contained data on eight primary atmospheric pollutants: CO, NO, NO2, NOx, O3, PM10, PM2.5, and SO2.
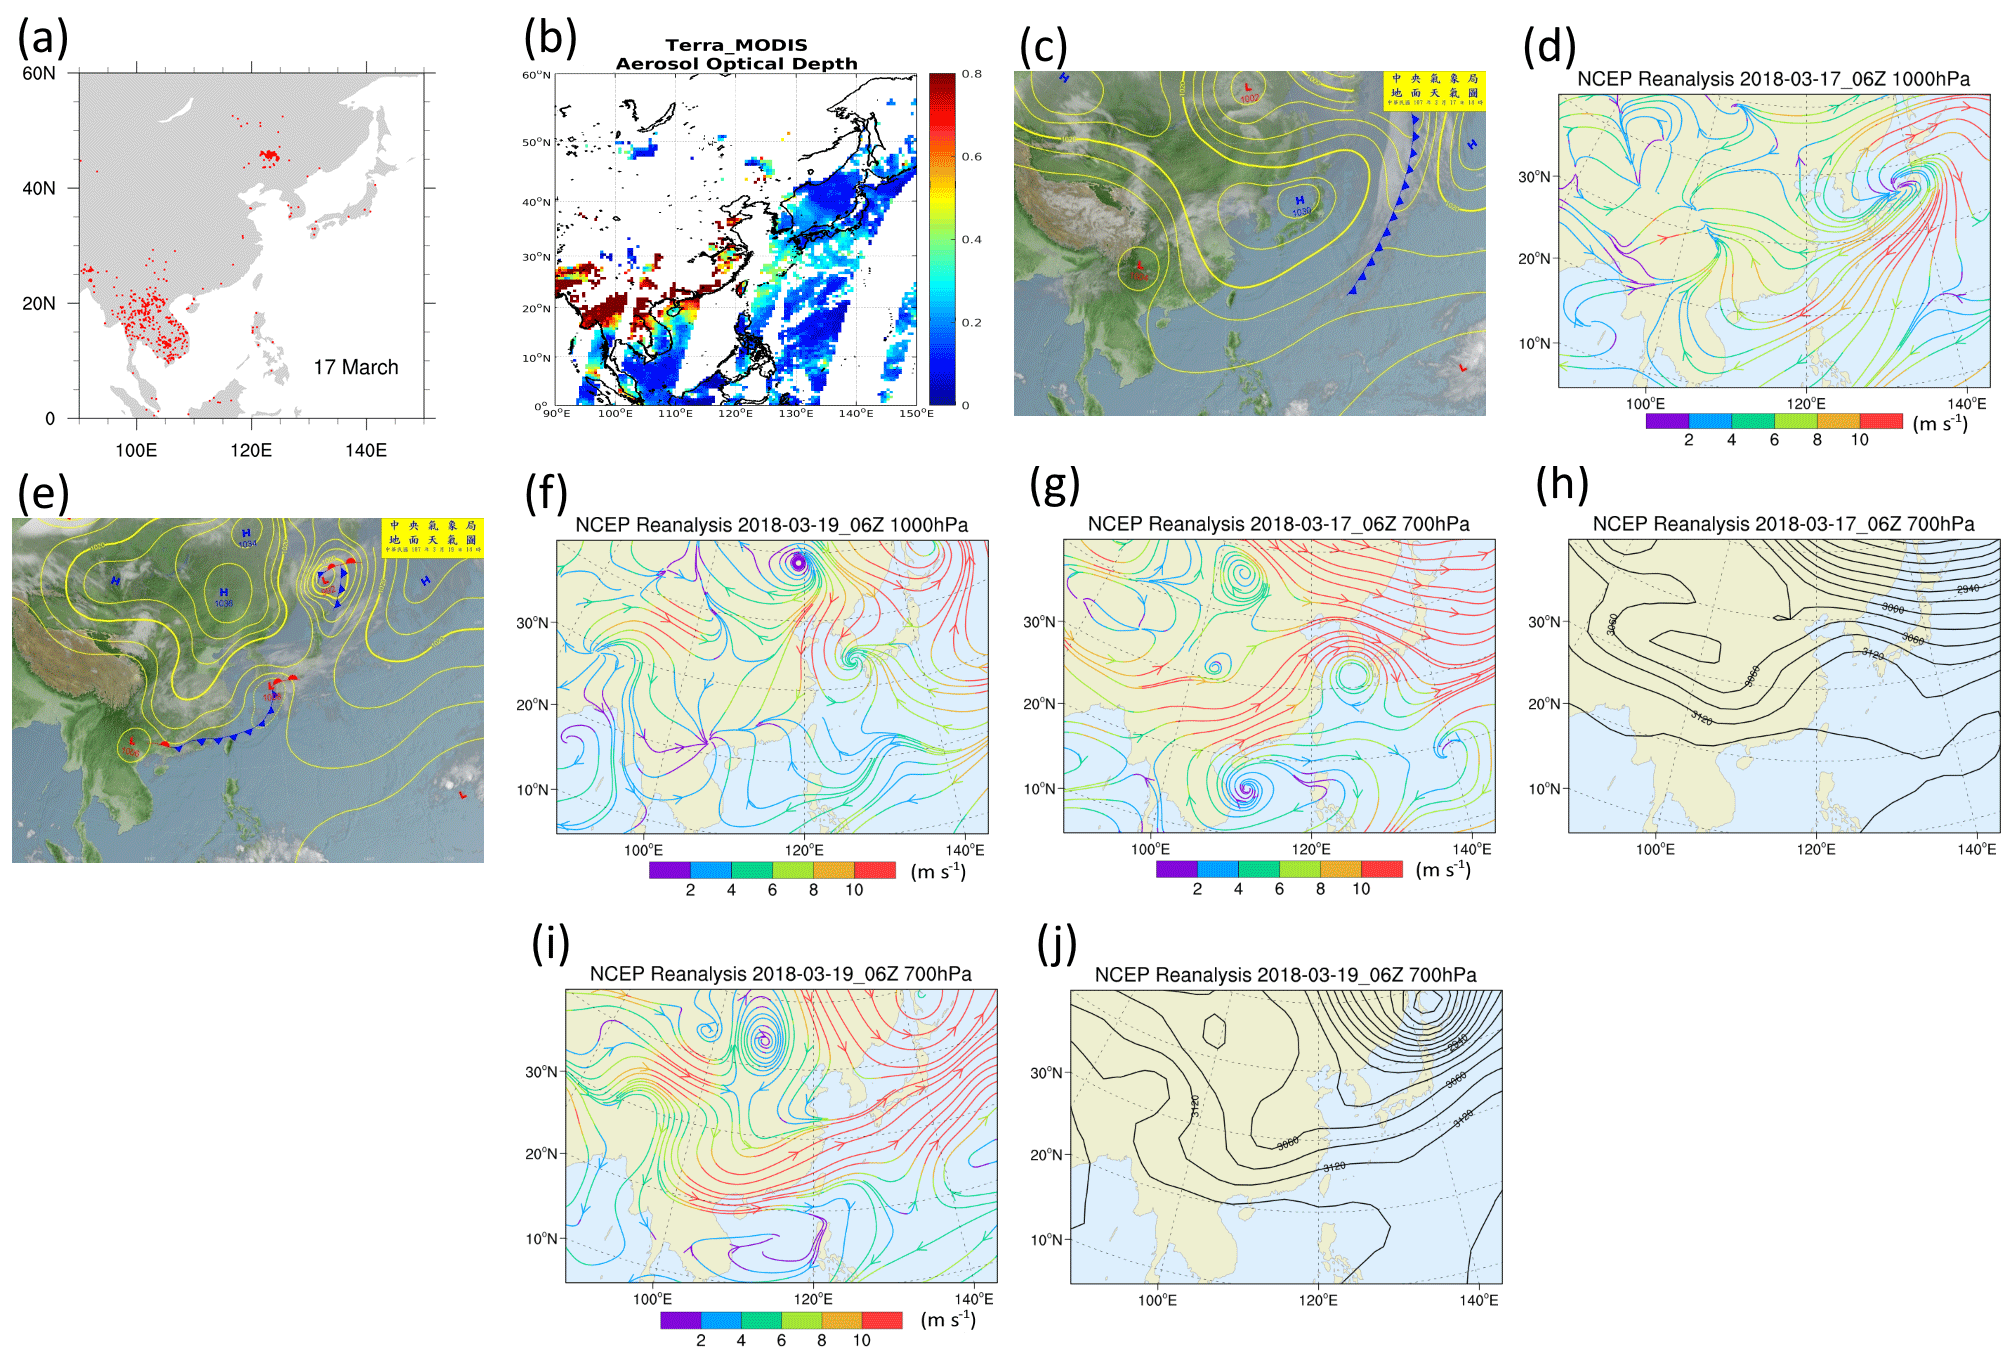
Figure 2(a) MODIS fire hotspots on 17 March 2018 (source: https://modis-fire.umd.edu/guides.html, last access: 14 February 2023) and (b) composited aerosol optical depth (AOD) from MODIS on board NASA's Terra satellite. The collection 6.1 AOD is downloaded from NASA's Earthdata website (https://www.earthdata.nasa.gov/learn/find-data, last access: 14 February 2023) and composted for 01:10, 01:15, 01:20, 01:25, 01:30, 02:50, 02:55, 03:00, 03:05, 03:10, 04:30, 04:35, 04:40, 04:45, 06:10, 06:15, 06:20, 07:45, and 07:50 UTC data granules on 17 March 2018. (c) Weather chart at 06:00 UTC on 17 March 2018, (d) 1000 hPa streamlines at 06:00 UTC on 17 March 2018, (e) and (f) are the same as (c) and (d) but on 19 March 2018, (g) 700 hPa streamlines at 06:00 UTC on 17 March 2018, (h) 700 hPa geopotential height at 06:00 UTC on 17 March 2018, (i) and (j) are the same as (g) and (h) but on 19 March 2018. Near-surface weather charts and satellite images were provided by the Central Weather Bureau (CWB), Taiwan. The near-surface and 700 hPa streamlines and geopotential height were deduced from NCEP Reanalysis data. Maps and plots were produced using the NCAR Command Language (NCL) version 6.6.2.
3.1 MODIS aerosol optical depth and weather conditions
Figure 2a and b visualize the numerous fire hotspots and high aerosol optical depth on 17 March 2018 registered by the MODIS satellite. Indeed, a large number of BB fire hotspots frequently occurred over Indochina during the springtime (Fig. S1a in the Supplement) and the EMeRGe-Asia campaign (Fig. S1b). Nevertheless, a relatively weaker forest fire activity in the year 2018 (Figure S1a) was observed over Indochina compared to the other years between 2011 and 2020. On 17 March 2018 at 06:00 UTC (14:00 LT; LT = UTC + 08:00) the weather data indicated a series of high-pressure systems in northern China and a separate high-pressure system over the Japan Sea (Fig. 2c). At 1000 hPa, a strong northerly continental outflow was identified over southern Japan, the ECS, and Taiwan (Fig. 2d). On 19 March 2018, a new frontal system was located from Korea to the Guangdong province in SC (Fig. 2e). On the same day at 06:00 UTC, a discontinued flow was identified at the frontal zone to the north of Taiwan in the ECS (Fig. 2f). In other words, Taiwan was located at the prefrontal and warm conveyor area due to the surrounding southerly flow on 19 March 2018 at 06:00 UTC (Fig. 2e and f, respectively). The southerly wind was gradually replaced by the northeasterly after another frontal passage on 20 March 2018 at 00:00 UTC (data not shown).
In the upper layer (700 hPa; Fig. 2g–j), the flow pattern differed from that at the near-ground surface (1000 hPa; Fig. 2d and f). A southwesterly strong wind, coming from the east side of the Tibetan Plateau in SC, moving to the northeast i.e., Korea, is converted to a polar front wave flow in northeastern China and Korea on 17 March 2018 (Fig. 2g). This high-elevation northward strong wind belt distribution at 700 hPa was associated with a corresponding lee-side trough at the east of the Tibetan Plateau, whereas a ridge was noted over the east coast of China on the same day (Fig. 2h). Consistent with the mechanism reported by Lin et al. (2009), once a significant lee-side trough formed, it provided favorable conditions for the upward motion over the lee side of the Tibetan Plateau and brought BB emissions to the free troposphere layer following the strong wind belt transport to the downwind area. After the weather system moved to the east, the north–south trough turned to SW–NE such that the strong wind belt was in an approximately SW–NE direction and located between 20 and 30∘ N on 19 March 2018 (Fig. 2i and j). In conclusion, the Indochina BB pollutants were driven by the strong wind belt from Indochina, northward to SC on 17 March 2018 and then eastward passing over Taiwan between 20 and 30∘ N to the south of Japan on 19 March 2018.
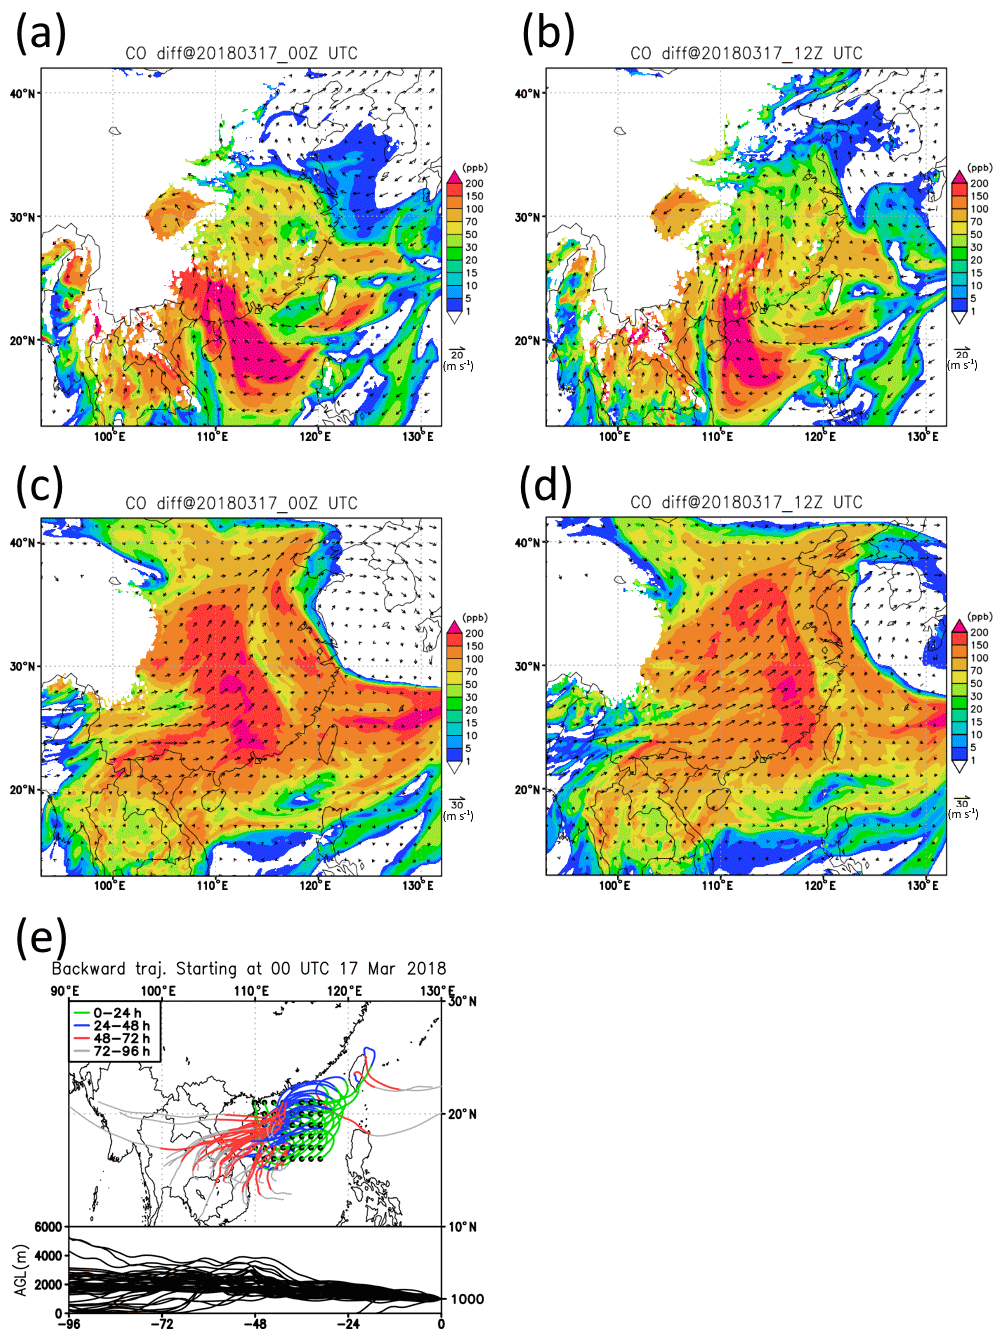
Figure 3Simulated wind field (m s−1) distribution and concentration (unit: ppb) difference with and without BB emission for CO on 17 March 2018 at 00:00 UTC (a, c) and 12:00 UTC (b, d) at a 1 km altitude (a, b) and 3 km altitude (c, d) (unit: ppb). (e) The results of the HYSPLIT model backward-trajectory analysis at 1000 m with multiple points by in the area (17.5–22.5∘ N, 110–115∘ E) of the East China Sea started at 00:00 UTC, 17 March 2018.
3.2 Characteristics of LRT BB to the ECS by the WRF-Chem model
Figure 3 shows latitude–longitude plots of the simulated CO concentration differences with and without BB emission at an elevation of 1000 m (Fig. 3a), mainly in Indochina, SC, and the South China Sea on 17 March 2018. The ambient flow was easterly and then northward from the South China Sea to SC at a 1000 m elevation between 00:00 and 12:00 UTC on 17 March 2018 (Fig. 3a–b). To identify the high CO concentration in the South China Sea at 1000 m in Fig. 3a and b, the HYSPLIT (Stein et al., 2021) backward trajectories with multiple points by in the area (17.5–22.5∘ N, 110–115∘ E) in the South China Sea started at 00:00 UTC, 17 March 2018, as shown in Fig. 3e. The locations and dates of fire hotspots were distributed randomly in the Indochina Peninsula as shown in Fig. S1c. The backward trajectories in the South China Sea indicated air masses mainly transported 48–72 h and even 96 h. In other words, there could be contributions by fires occurring between 12–20∘ N and 100–110∘ E (Myanmar, Laos, Thailand, and Vietnam) during 13–15 March 2018. The BB plume accumulated and persisted for an extended period in the lower part of the boundary layer on 17 and 19 March 2018 (Figs. 3a–b, and 4a–b). In contrast, the high CO concentration followed the southwesterly or westerly strong wind belt (Figs. 3c–d and 4c–d) and its weather conditions (Fig. 2) at an elevation of 3000 m (700 hPa). Following the movement of the ridge and trough at the 700 hPa geopotential height (Fig. 2h and j), the associated strong wind belt turned to move eastward in the SW–NE direction between 17 and 19 March 2018. The BB plume transport over Indochina was affected by a fast-moving strong flow at 700 hPa (Fig. 2g and i), shifting the plume toward Taiwan and the ECS, during 17–19 March 2018. The backward trajectories in the East China Sea (ECS) started at 04:00 UTC on 19 March 2018 at 3000 m, indicating air masses mainly transported 48–72 h and even 96 h (15–17 March) ago from Indochina as shown in Fig. 4e. The highest CO concentration contributed by the BB plume was >150 ppb, originally sourced from Indochina, and it was mainly transported northward on 17 March 2018 (Fig. 3c–d) and then covered a large area in East Asia at a CO concentration of >100 ppb on 19 March 2018 (Fig. 4c–d). Figure 5 indicates simulation differences for the contribution of BB along an E–W cross section at 30∘ N at 16:00 UTC on 18 March 2018 (Fig. 5a) and 06:00 UTC on 19 March 2018 (Fig. 5b). We noted a strong wind at 2000 m elevation and a high CO concentration (>70 ppb) due to BB at the BPTL. Moreover, the CO concentration attributed to BB was low at the elevation of >4000 m on 19 March at 06:00 UTC (Fig. 5b), showing that the BB pollutants mainly affect altitudes below 4000 m.
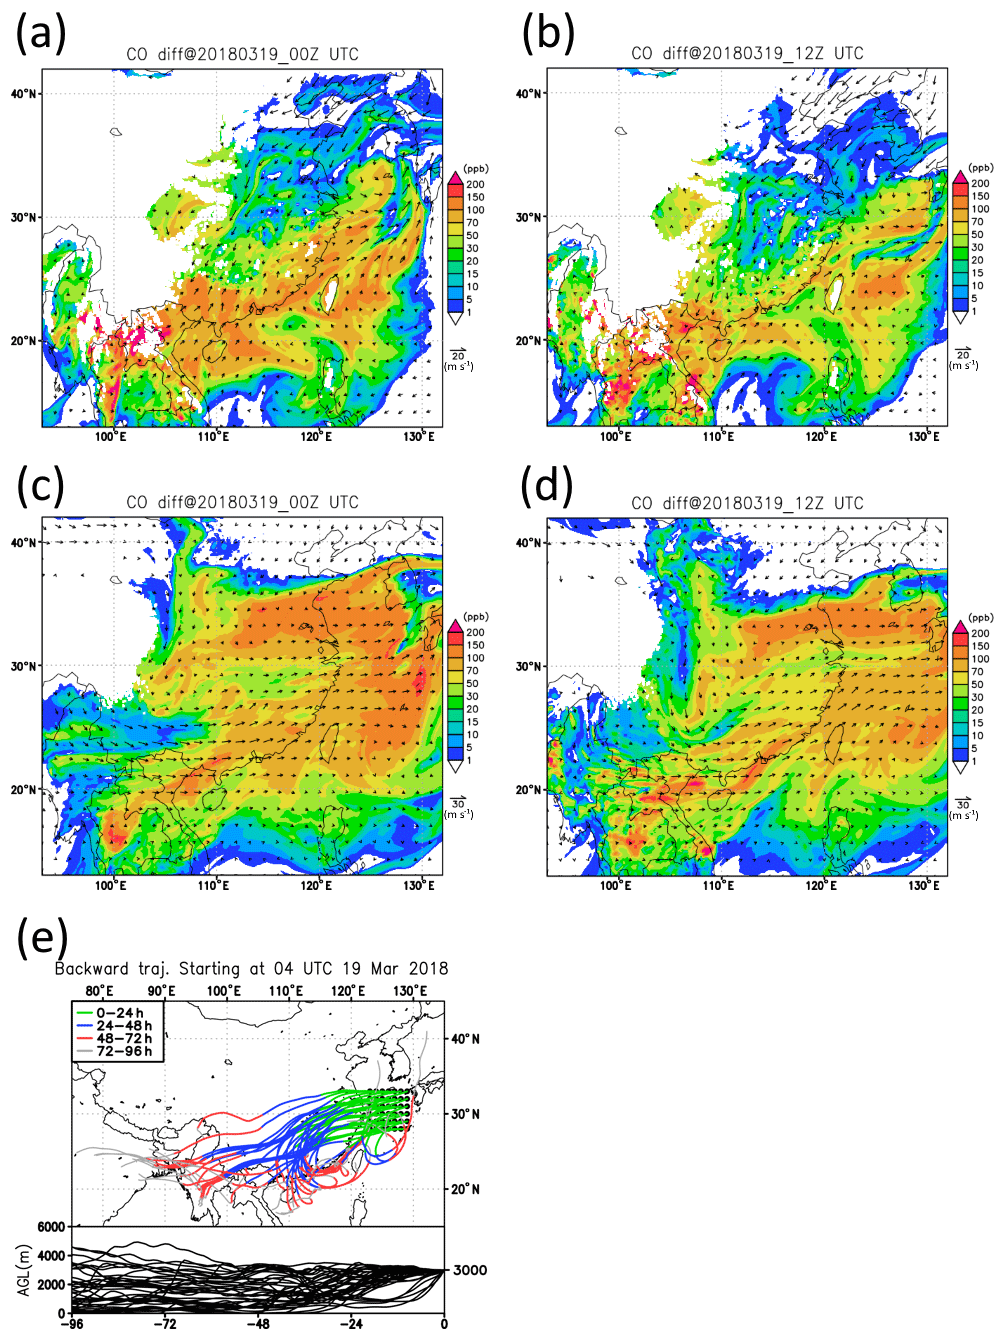
Figure 4Simulated wind field (m s−1) and concentration (unit: ppb) difference with and without BB emission for CO on 19 March 2018 at 00:00 UTC (e, g) and 12:00 UTC (f, h) at a 1 km altitude (e, f) and 3 km altitude (g, h). (e) The results of the HYSPLIT model backward-trajectory analysis at 300 m with multiple points by in the area (28–33∘ N, 122–130∘ E) of the East China Sea started at 04:00 UTC, 19 March 2018.

Figure 5Simulated wind field (m s−1) distribution and the concentration (ppb) difference with and without BB emission for CO at cross section 30∘ N, (a) 16:00 UTC, 18 March 2018 and (b) 06:00 UTC, 19 March 2018. Wind vectors represent along-section winds, with scales shown at the down-right corner of plot (unit: m s−1).
3.3 Aircraft measurements
Two HALO flights were scheduled to the ECS to measure the pollutants following the continental outflow; the flights departed on 17 (Fig. 6a) and 19 (Fig. 7a) March 2018 and followed similar tracks. To indicate the measurement results along the flight path, the 1 min average data are shown in Figs. 6b and 7b. On 17 March 2018, the flight departed from Tainan (Fig. 1b) at 01:09 UTC (09:09 LT) first southbound and then northward to the ECS (Fig. 6a). The elevation for sample collection was mainly <4000 m, where the CO concentration was found to be <200 ppb in most cases on that day (Fig. 6b). At elevations between 2000 and 4000 m, the concentration of the major aerosol components (i.e., OA, BC, SO, NO, and NH was mostly <2 µg m−3, except just above western Taiwan after 08:00 UTC (Fig. 6a–d). The peak concentrations for OA, BC, SO, NH, and NO were 3.4, 1.2, 2.1, and 0.7 µg m−3, respectively, at the altitude between 2000 and 4000 m. SO demonstrated the highest concentration among the aerosol components, especially during 04:00–04:37 and 05:48–06:15 UTC (peaking at 5.1 µg m−3) when the flight was north of 30∘ N and at an elevation of <1000 m (Fig. 6a–c). This result could be attributed to anthropogenic pollution from the continental outflow (C.-Y. Lin et al., 2012) or probably a part from Japan contributed to the high sulfate concentration in the boundary layer over the ECS. As for the trace gases such as ACE, ACN, and O3, their concentrations between 2000 and 4000 m were ranging between 1–2, 0.1–0.3, and 60–70 ppb (Fig. 6b), respectively, implying minor influence over the ECS by the BB plume in this flight. Figure 6e illustrates the 96 h backward trajectories, which identified the air mass origin starting at 02:00 UTC, followed by 04:00, 06:00, and 09:00 UTC. The continental outflow contributed to higher sulfate concentrations (3–5 µg m−3 at 33∘ N) at 04:00 and 06:00 UTC (Fig. 6b, c, and e) at <1000 m along the flight path. In contrast, south of 25∘ N and above Taiwan, the local pollution and continental outflow are dominating sources on 17 March 2018.
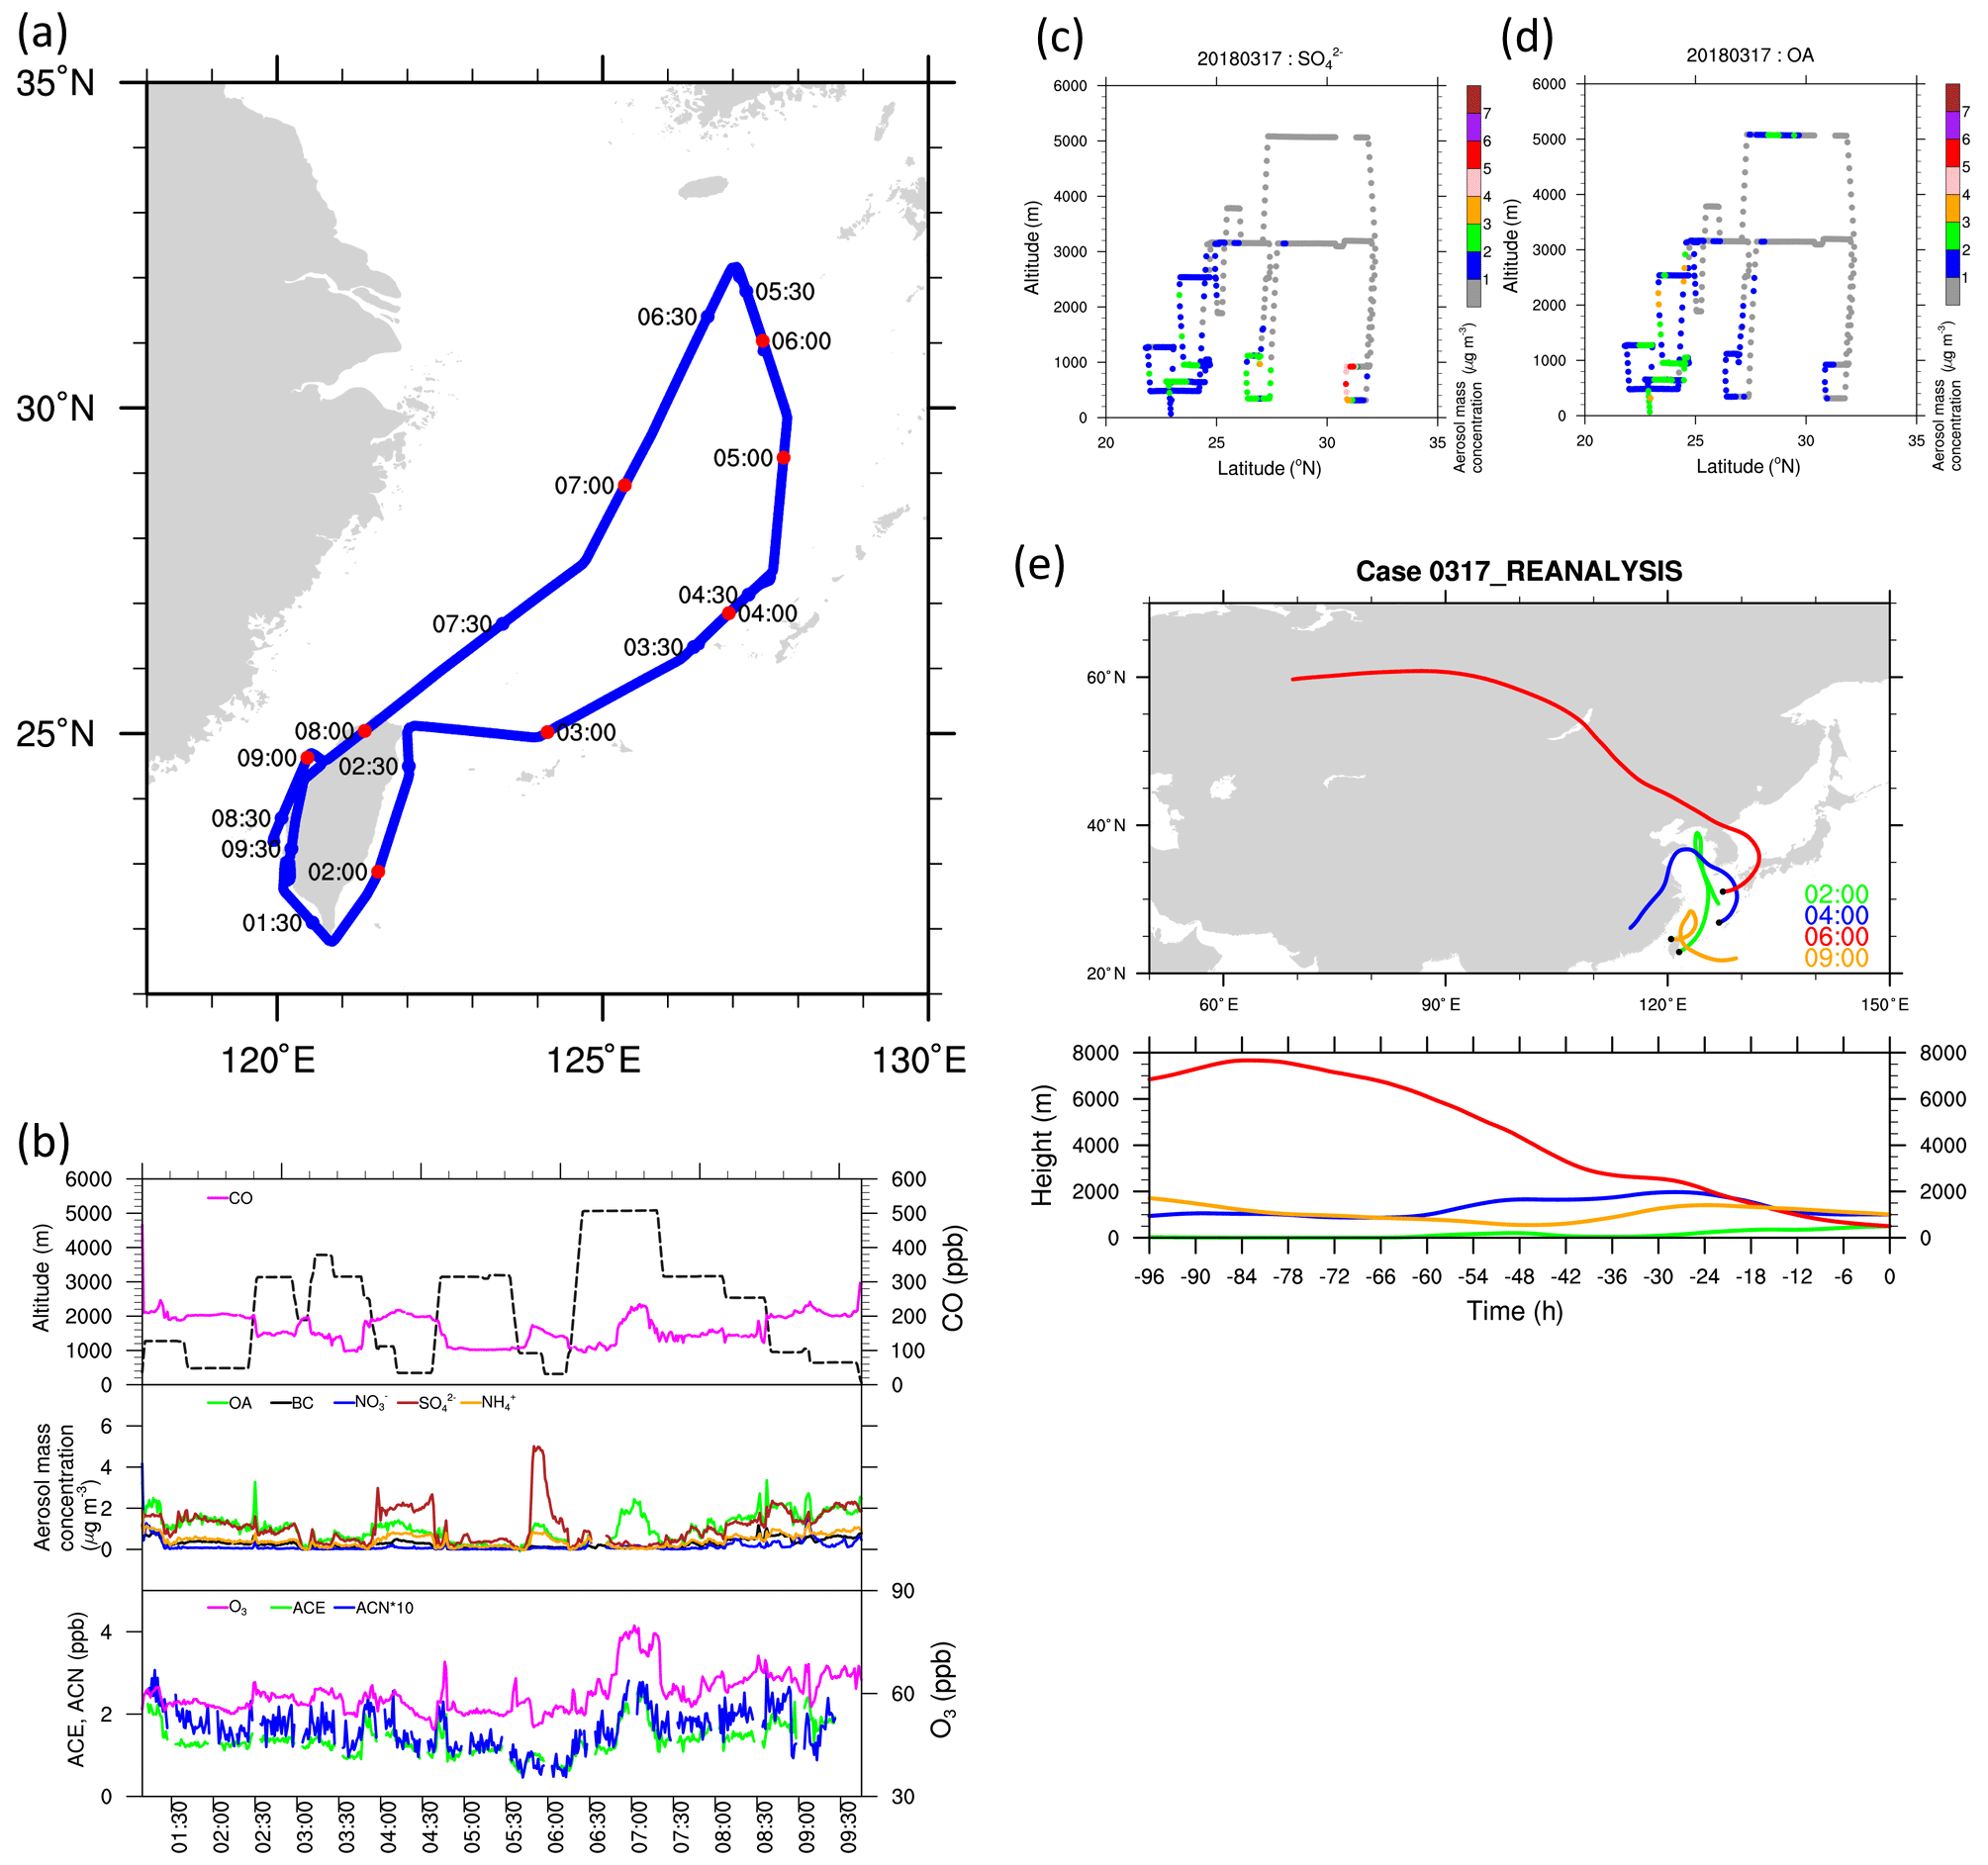
Figure 6(a) The HALO flight and detailed locations on 17 March 2018. (b) Flight altitude and 1 min mean of observed concentrations for CO (upper), organic aerosol (OA), BC aerosol (BC), SO, NO, NH (middle), O3, acetone (ACE), and acetonitrile (ACN) (bottom) on 17 March. (c) The observed SO mass concentration by HALO along with height–latitude variations on 17 March 2018. (d) The observed OA mass concentration by HALO along with height–latitude variations on 17 March 2018. (e) Result of the HYSPLIT model backward-trajectory analysis started at the location of the HALO flight path at 02:00, 04:00, 06:00, and 09:00 UTC on 17 March 2018.
The HALO flight on 19 March 2018 departed at 00:19 UTC (08:19 LT). It was bound northward and sampled air at an altitude of <4000 m most of the time, as shown in Fig. 7a and b. Figure 7c and d indicate the latitude–height variation of SO and OA mass concentrations along the flight path on 19 March 2018. As the flight left Taiwan, it maintained an elevation of 3000 m during 01:00–02:00 UTC (Fig. 7a, 121–126∘ E) and then descended to <1000 m during 02:00–02:40 UTC (Fig. 7b). The OA mass concentration was higher at 3000 m than at the low altitude during 01:00–03:00 UTC (Fig. 7b and d). In particular, CO, OA, and BC exhibited a substantial peak concentration of 312 ppb and 6.4 and 2.5 µg m−3 at 01:54 and 02:51 UTC at 26∘ N, 125–126∘ E and an altitude of 2000–4000 m, where a BPTL was observed. The trace gases such as ACE, ACN, and even O3 (Fig. 7b) have consistent peak times in the BPTL with concentrations of 3.0, 0.6, and 79 ppb, respectively. In this flight, SO had the second-highest concentration among the aerosol components (1–2.4 µg m−3; Fig. 7b and c) upstream of Taiwan (25–27∘ N) during 01:00–03:00 UTC.
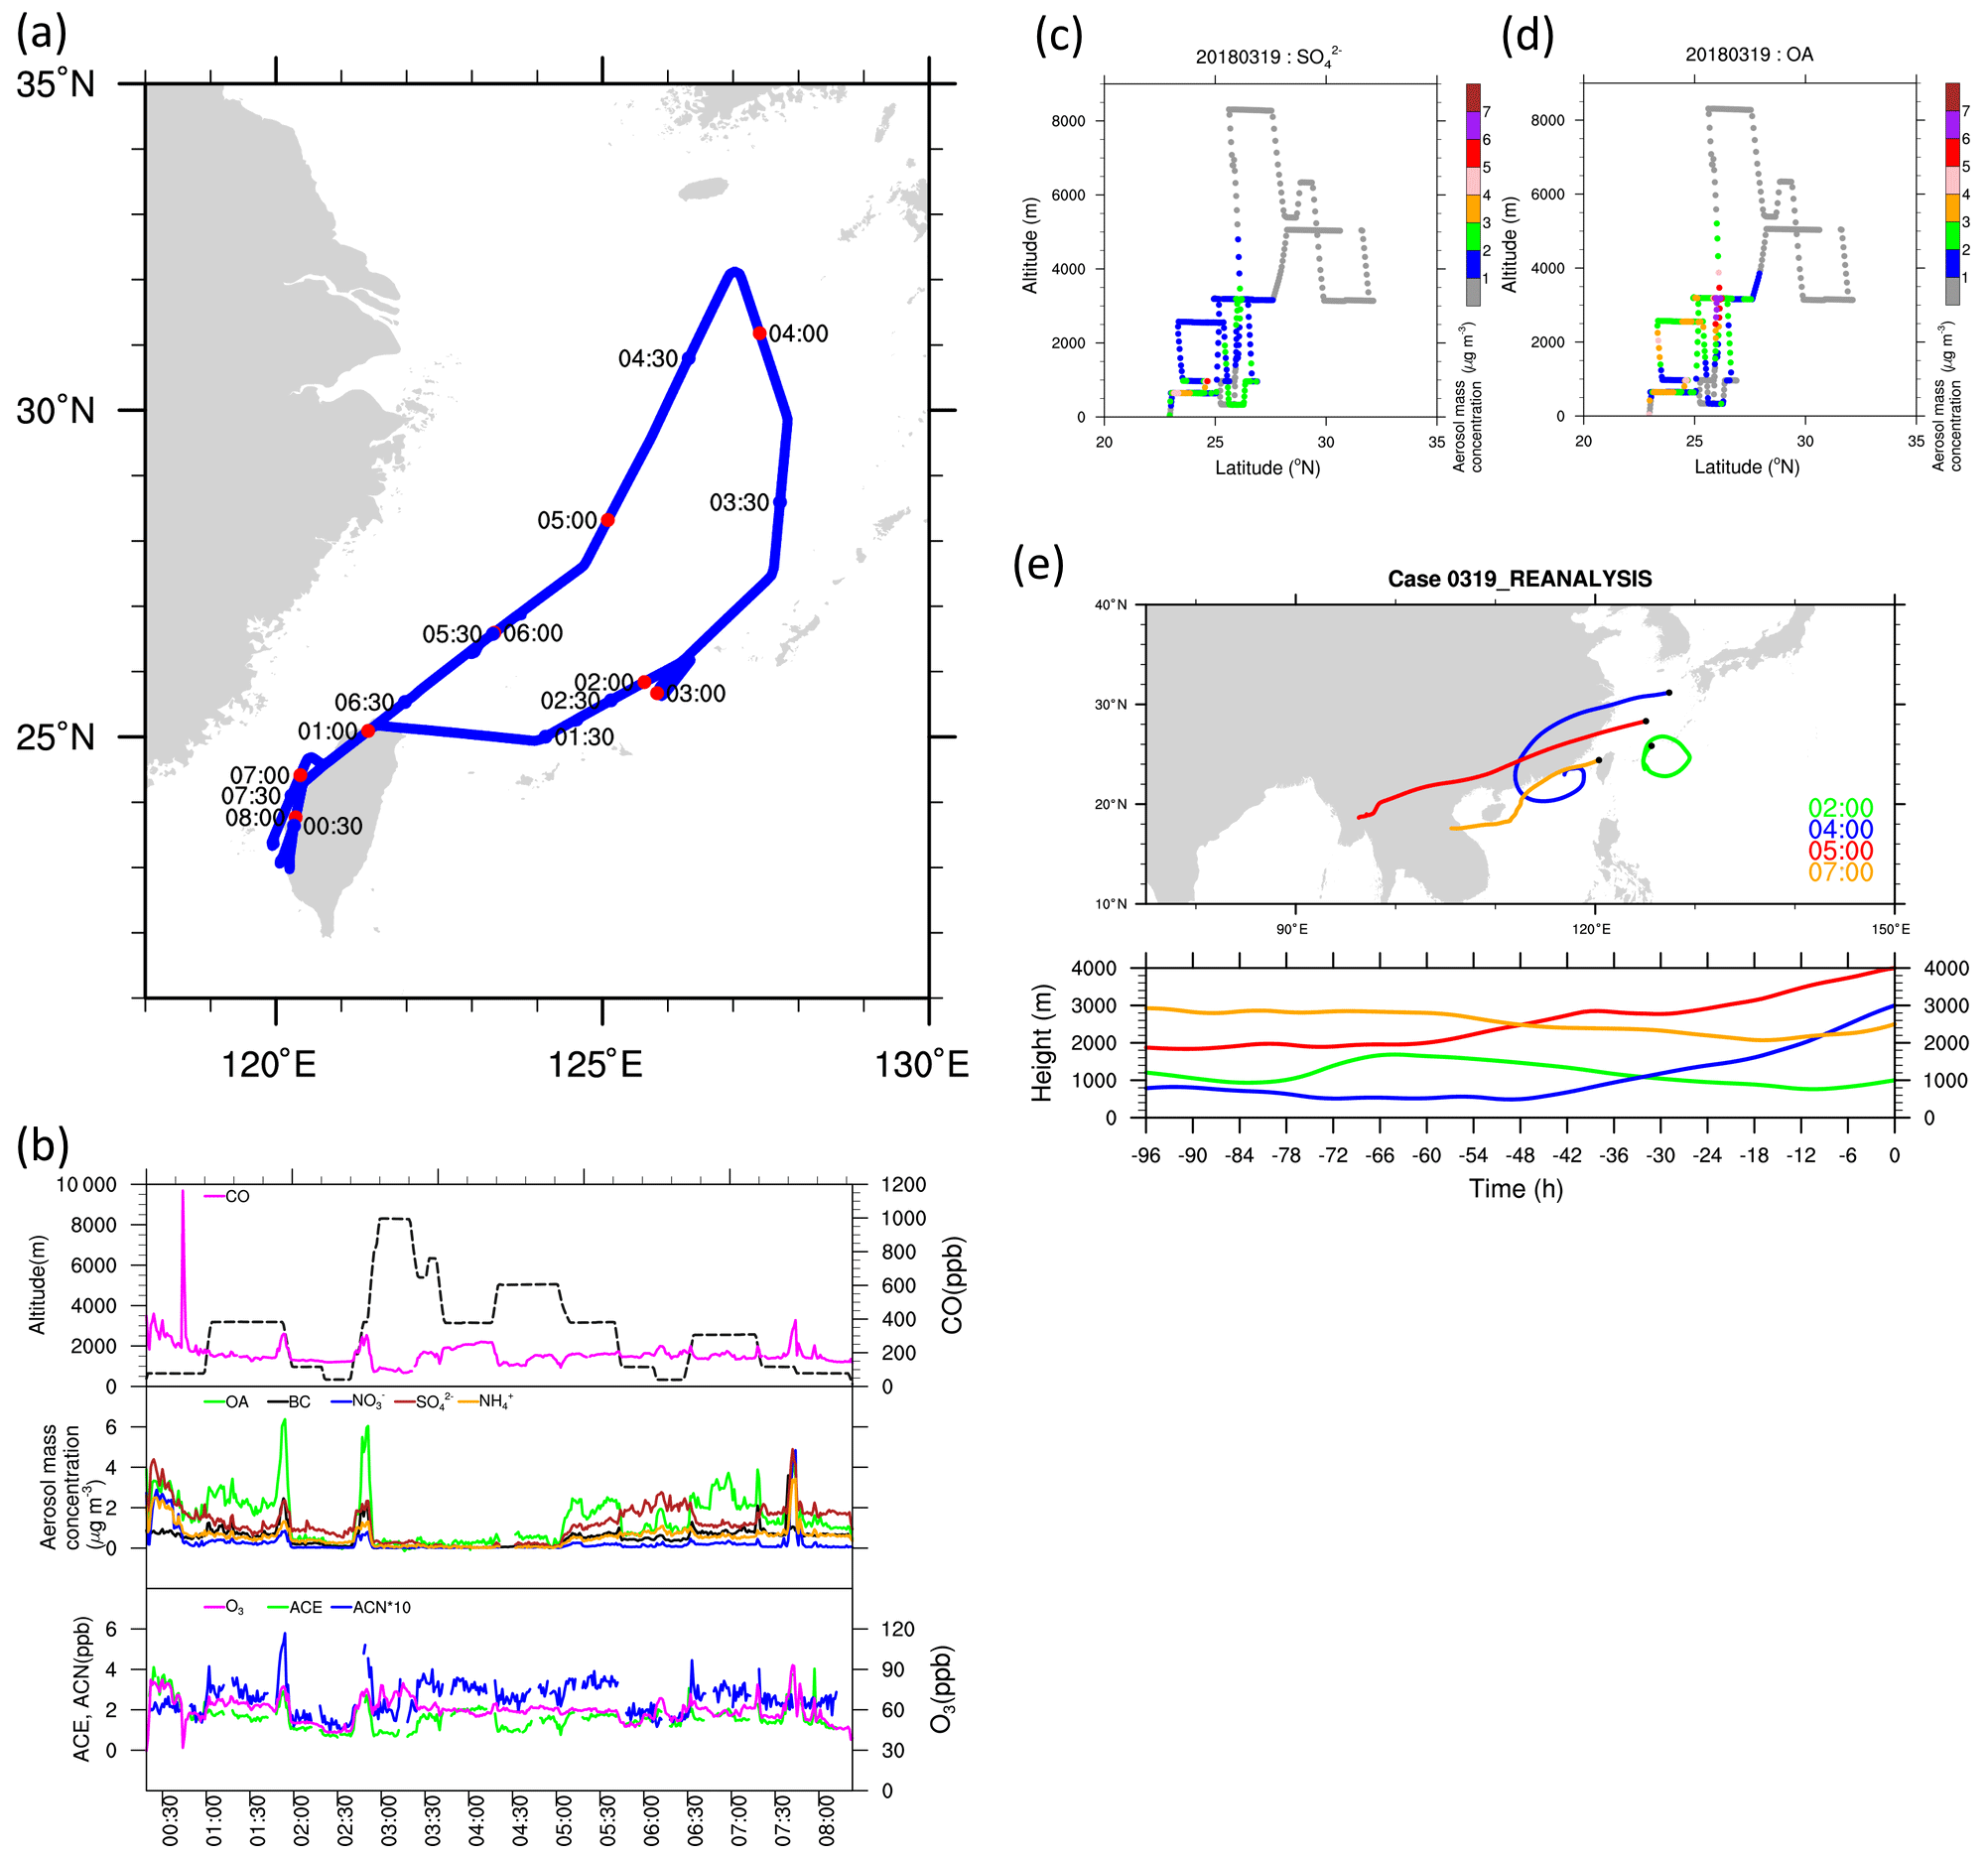
Figure 7(a) The HALO flight and detailed locations on 19 March. (b) Flight altitude and 1 min mean of observed concentrations for CO (upper), organic aerosol (OA), BC aerosol (BC), SO, NO, NH (middle), O3, acetone (ACE), and acetonitrile (ACN) (bottom) on 19 March 2018. (c) The observed SO mass concentration by HALO along with height–latitude variations on 19 March 2018. (d) The observed OA mass concentration by HALO along with height–latitude variations on 19 March 2018. (e) Result of the HYSPLIT model backward-trajectory analysis started at the location of the HALO flight path at 02:00, 04:00, 05:00, and 07:00 UTC on 19 March 2018.
In the northern part of the flight between 03:00 and 05:00 UTC at an elevation of >3000 m, the aerosol component concentrations were all at their lowest level (Fig. 7b–d). During 05:00–07:00 UTC, the HALO aircraft flew back southward to 25∘ N, where high OA mass concentrations appeared again between 2000 and 4000 m (Fig. 7a, b, and d). Sulfate was the species with the highest concentration between 05:30 and 06:30 UTC (Fig. 7b and c) when the flight's elevation was <1000 m in the lower boundary between 25 and 27∘ N (upstream of Taiwan). The reason for explaining this observation is that the transport of anthropogenic pollutants of continental origin takes place mainly in the boundary layer (Fig. 7b–d). Other aerosol species, such as NO and NH, demonstrated low concentrations, except when the elevation was <1000 m, where they ranged up to 1 µg m−3 (Fig. 7b).
The 96 h HYSPLIT backward trajectory starting from the flight locations at 02:00–07:00 UTC (Fig. 7e) indicated that the air masses at elevations between 2000 and 4000 m were potentially transported from Indochina. North of 30∘ N and at altitudes of >3000 m at 04:00 UTC, the concentrations of air pollutants (including OA, SO, NO, and NH were low (Fig. 7b and e) even though the air mass in the lower boundary was sourced from SC and the Taiwan Strait. In general, the BPTL was mainly located south of 30∘ N as presented by Carmichael et al. (2003) and Tang et al. (2003). However, the ACN still could be around 300 ppt or less as the flight at the north of 30∘ N (during 03:30–04:30 UTC) and could be recognized as the contribution of BB (Förster et al., 2022). In other words, it might still have BB products being transported to the north of 30∘ N under favorable weather conditions, although the ACN concentration was low compared to the south of it at the layer of the BPTL (between 2000 and 4000 m). The fact that higher OA was observed in the higher altitudes rather than in the lower boundary also demonstrated the vertical distribution over the ECS.
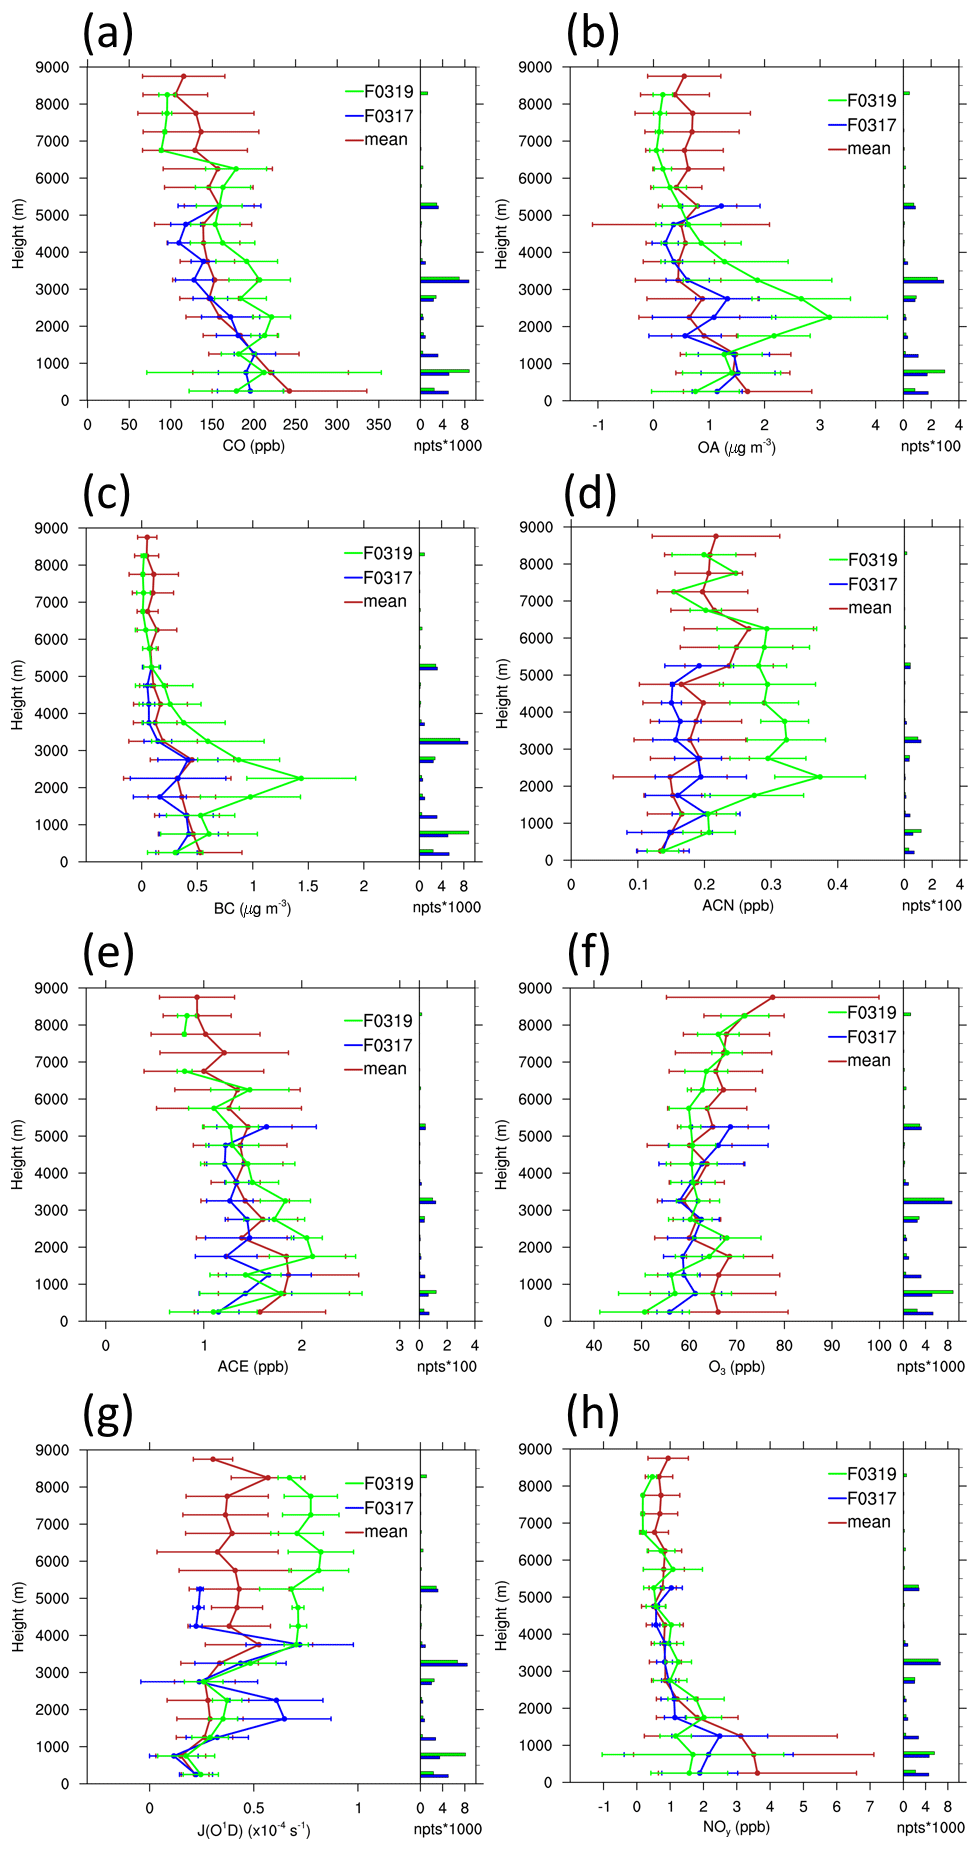
Figure 8Observed vertical distribution calculated as 1 min mean and 500 m interval with 1 standard deviation of the concentrations for the mean profiles (red) (including 17, 19, 22, 24, 26, and 30 March and 4 April 2018) and flights on 17 (blue) and 19 (green) March 2018. (a) CO, (b) OA, (c) BC, (d) acetonitrile (ACN), (e) acetone (ACE), (f) O3, (g) J(O1D), and (h) NOy. The number of data points is shown in the right panel.
Figure 8 displays the vertical distribution of the gases and major aerosol components found on the flights on 17 (blue) and 19 (green) March 2018, as well as the mean concentrations noted in the seven flights (on 17, 19, 22, 24, 26, and 30 March and 4 April 2018; red) to the ECS during EMeRGe-Asia. Figure 8 illustrates all profiles calculated as 1 min mean and every 500 m interval with 1 standard deviation (±σ). The number of the data points is displayed on the right side of each figure. The mean CO concentration profile demonstrated a decreasing trend from 240 ppb near the ground to 150 ppb at an altitude of 2500 m and 140–160 ppb at altitudes >6000 m (Fig. 8a). The concentration for 17 March 2018 (flight F0317) was similar to the mean concentration profile, except for that at the <1500 m elevation in the lower boundary. However, a higher CO concentration (40–80 ppb) enhancement was noted on 19 March 2018 (flight F0319) than in the mean profile and flight F0317. The mean difference in CO concentration between flights F0319 and F0317 was as high as 80 ppb at an elevation of 3000–3500 m (Fig. 8a). Similarly, OA concentration was significantly higher in the BPTL vertical distribution in flight F0319 than in the mean profile and flight F0317 (Fig. 8b). The mean OA concentration for flight F0319 peaked at an elevation of 2000–2500 m, increasing to 2 µg m−3 more than in the mean profile and flight F0317. Other aerosol components such as SO, NH, and NO (Fig. S2a–c) also had a similar vertical distribution trend, but the concentration differences were minor compared with OA concentrations. The magnitude of the maximum differences between flights F0319 and F0317 in the BPTL was 1.3, 0.7, and 0.4 µg m−3 for SO, NH, and NO, respectively. The maximum concentration difference of BC can be as high as 1.2 µg m−3 at 2000–2500 m between flights F0319 and F0317 (Fig. 8c). Regarding the variations in ACN (Fig. 8d) and ACE (Fig. 8e) in the BPTL, their maximum mean concentrations in flight F0319 were higher than those in the profile of flight F0317 by 0.18 and 0.9 ppb, respectively. In other words, flight F0319 had a more significant impact on the CO, OA, BC, and volatile organic compound (VOC) species such as ACN and ACE in the BPTL, which might account for the effect of BB emission transport from Indochina. The ozone concentration was lower in both flights F0317 and F0319 than in the mean profile at the elevations <2000 m (Fig. 8f). The ozone titration by NOx in the lower boundary might also play a role. However, it was approximately 5–7 ppb higher in flight F0319 than in flight F0317 between the elevations of 1500 and 3000 m. In their downwind area, LRT of BB emissions might increase this concentration further at the BPTL (Tang et al., 2003; Lin et al., 2014), and this is also discussed in Sect. 4. By contrast, the J value [J(O1D)] (Fig. 8g) was higher for flight F0317 than for F0319 in the elevation range 1000–3000 m, in line with high aerosol concentrations and associated cloud enhancement that typically lead to decreased photolysis frequencies (i.e., J(O1D)) (Tang et al., 2003). Figure S3 indicated the aircraft measurement for the J value (J(O1D)) and cloud condensation nuclei (CCN; at a constant instrument supersaturation of 0.38 %) along the flight on 19 March 2018. The CCN number concentration (per cm3) was consistently increased with the aerosol species (such as OA) as the flight passed through the BPTL (2000–4000 m). Consistently, at altitudes >4000 m the presence of clouds below the aircraft led to greater J values.
The concentrations of other species such as NOy (Fig. 8h) and HONO (Fig. S2d) were also greater in flight F0317 than in flight F0319 by 0.4–1.2 ppb and 10–34 ppt, respectively, in the lower boundary (<1500 m). At the BPTL, the concentration of NOy (1–2 ppb) in the flight F0319 was higher than in the flight F0317, but the difference was less than 0.6 ppb. The results from the TRACE-P campaign, which examined the Asian outflow of NOy, also demonstrated large increases in NOy concentrations (0.5–1 ppb) downwind from Asia. The NOy consisted mainly of HNO3 and peroxyacetyl nitrate (Miyazaki et al., 2003; Talbot et al., 2003).
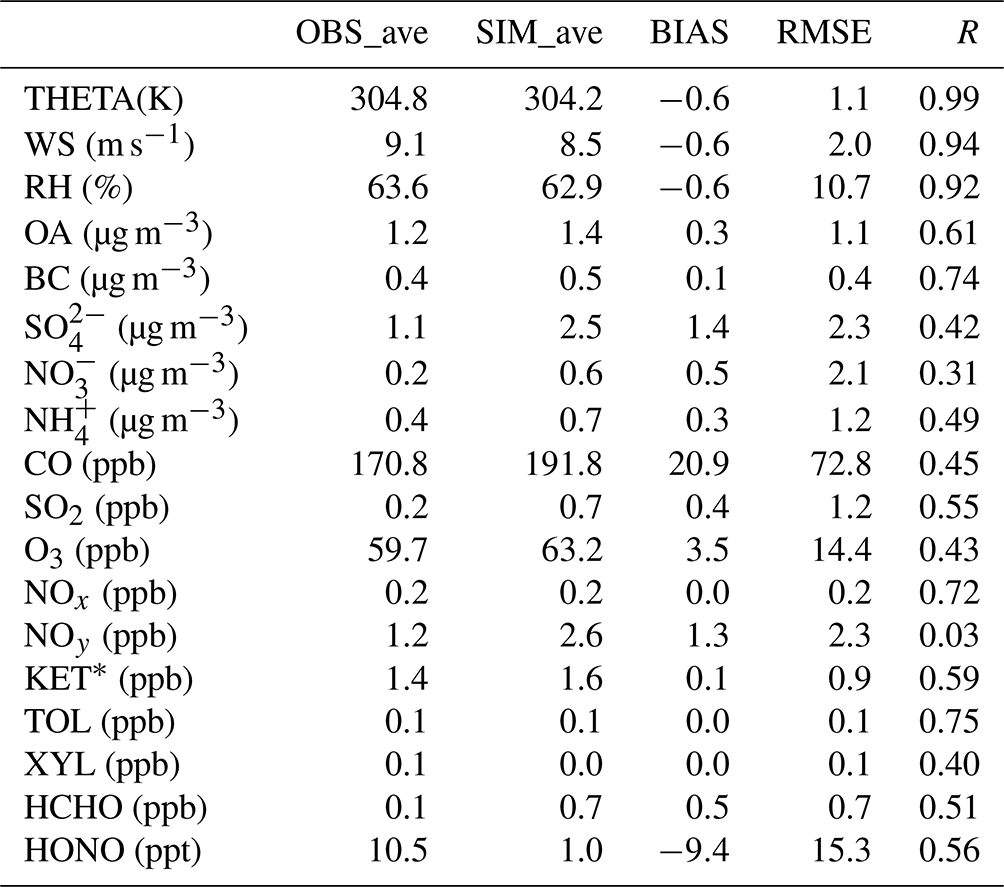
Table 2Observed (OBS_ave) and simulated (SIM_ave) mean values for bias (BIAS), root mean square error (RMSE), and correlation coefficients (R) for EMeRGe HALO flights on 17 and 19 March 2018. KET∗: the observed acetone is applied to compare with simulated ketones (KET).
4.1 Model performance and BB transport identification
Tables 2 and 3 and Fig. 9 plot the Pearson correlation coefficients between 5 min merged observations on board the HALO and the simulation for flights F0317 and F0319. Meteorological parameters such as potential temperature (theta), relative humidity (RH), and wind speed (WS) were all captured well by the model along the HALO flight path during the 2 d. The correlation coefficient (R) for meteorological parameters was high, ranging from 0.92 to 0.99 (Table 2). The strong correlation indicates the high representativeness of the reanalysis of meteorological data used in the simulation. Among the trace species and aerosol components, toluene (TOL), NOx, BC, OA, ketones (KET), HONO, SO2, and HCHO demonstrated an R of >0.5 (good correlation), and CO and O3 showed an R of nearly 0.5 (Table 2). The simulation performance was investigated in the BL (<1000 m; Fig. 9) at 2000–4000 m altitude (Table 3 and Fig. 9) and for the whole period of both flights (Table 2 and Fig. 9; blue dot). Even in the BPTL, the simulated meteorological parameters presented a good correlation (R>0.93), followed by OA, BC, KET, CO, O3, NOx, as well as NH and NOy (R>0.5) (Table 3). In other words, at the BPTL, the R for the simulation significantly increased for OA, BC, CO, O3, NOy, and KET (Tables 2 and 3 and Fig. 9), which are indicators for BB being a source of pollution in the model. In contrast, SO, NO, SO2, NOx, TOL, XYL, HCHO, and HONO had better correlation in the lower part of the boundary layer, at altitudes <1000 m (see Fig. 9) than in the BPTL. We explain this by the transport of anthropogenic pollutants in the continental outflow in the lower part of the boundary layer in the ECS.
Table 3Observed (OBS_ave) and simulated (SIM_ave) mean values at an elevation between 2 and 4 km for bias (BIAS), root mean square error (RMSE), and correlation coefficients (R) during EMeRGe HALO flights on 17 and 19 March 2018. KET∗: the observed acetone is applied to compare with simulated ketones (KET).
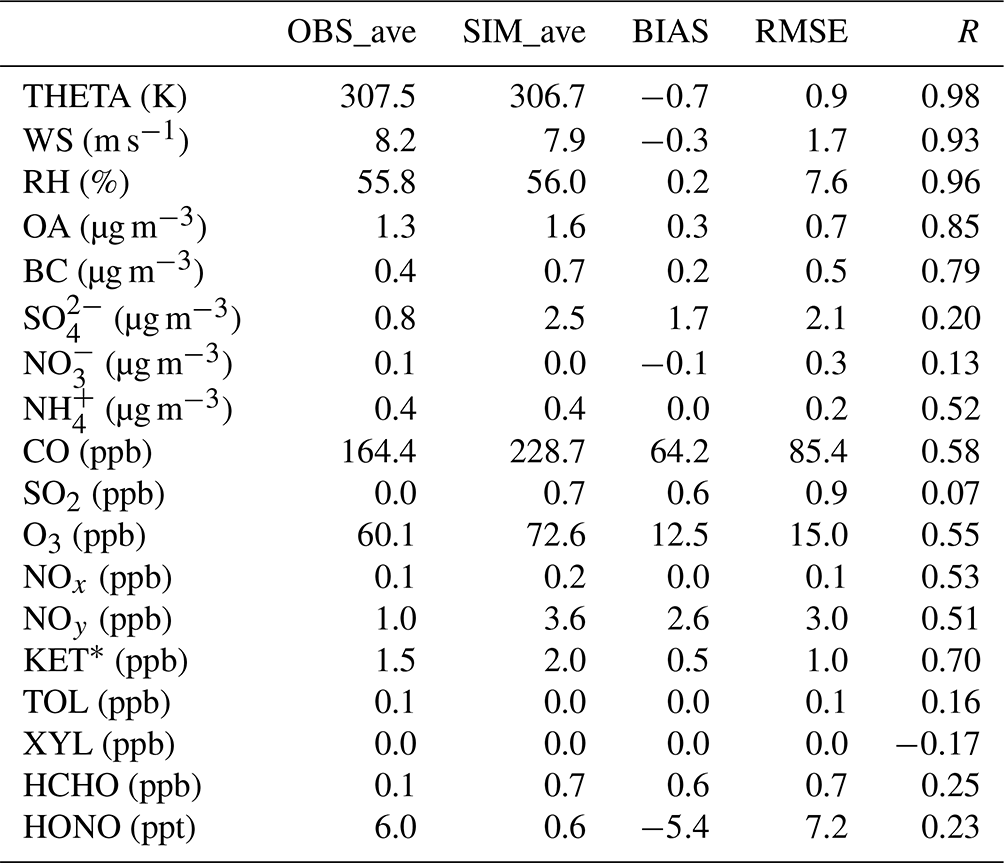
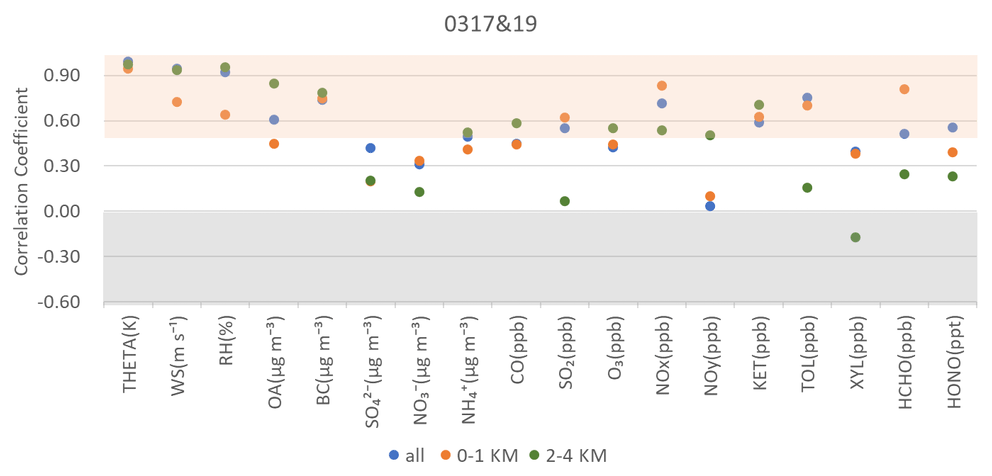
Figure 9Correlation coefficient (R) between observation and simulation along with the HALO flights at the elevations 0–1 km and 2–4 km and the whole track (all) on 17 and 19 March 2018.
The modeling results tended to overestimate the concentration of the species, with examples being CO (64 ppb), OA (0.3 µg m−3), BC (0.2 µg m−3), and O3 (12.5 ppb; Table 3) in the BPTL. Because high concentrations of CO, BC, and OA in the BPTL are accurate indicators of BB in the model, the BB emission from the source of FINN data is probably also overestimated (Lin et al., 2014). Except for OA and BC, the correlations for other aerosol components such as NO and SO were poor (0.13 and 0.2, respectively). The poor correlation for SO may result from the large uncertainty in the emission of SO2.
Because the meteorological parameters were simulated well, the simulation discrepancies for chemical species are either caused by the emission estimation uncertainties or by inaccuracies in the simulation of chemical oxidation processes during LRT. Because CO, OA, and BC are accurate indicators of simulated BB transport from Indochina (Carmichael et al., 2003), the airborne measurements on board the HALO are used as reference to evaluate the performance of the model for flight F0319 (Fig.10). The 5 min merged simulation of CO concentration with (blue line) and without (green line) BB was compared to that measured on board the HALO (red line); the concentration was mostly in the range of 100–200 ppb, with its peak approaching 300 ppb (at 01:50, 02:50, and 04:00 UTC) at the BPTL (Fig. 10a). In general, the simulation captured the CO variation along the flight path. However, it overestimated the observations by nearly 100 ppb for the simulation with BB at the BPTL during 01:00–02:00, 03:40–04:20, 05:00–05:40, and 06:30–07:20 UTC (Fig. 10a). Notably, the simulation difference was minor when the flight was in the lower part of the boundary layer (02:30 and 06:00 UTC) i.e., <1000 m or at elevations of >4000 m (03:00–03:30 and 04:20–05:00 UTC). The model underestimated CO concentration in the lower part of the boundary (<1000 m) (02:30 and 05:50–06:30 UTC) over the ECS. In conclusion, our model simulation overestimates BB emissions but underestimates continental CO emissions from China due to the underestimation of the emission inventory of the MICS-Asia III (Kong et al.,2020) that was adopted in this study.
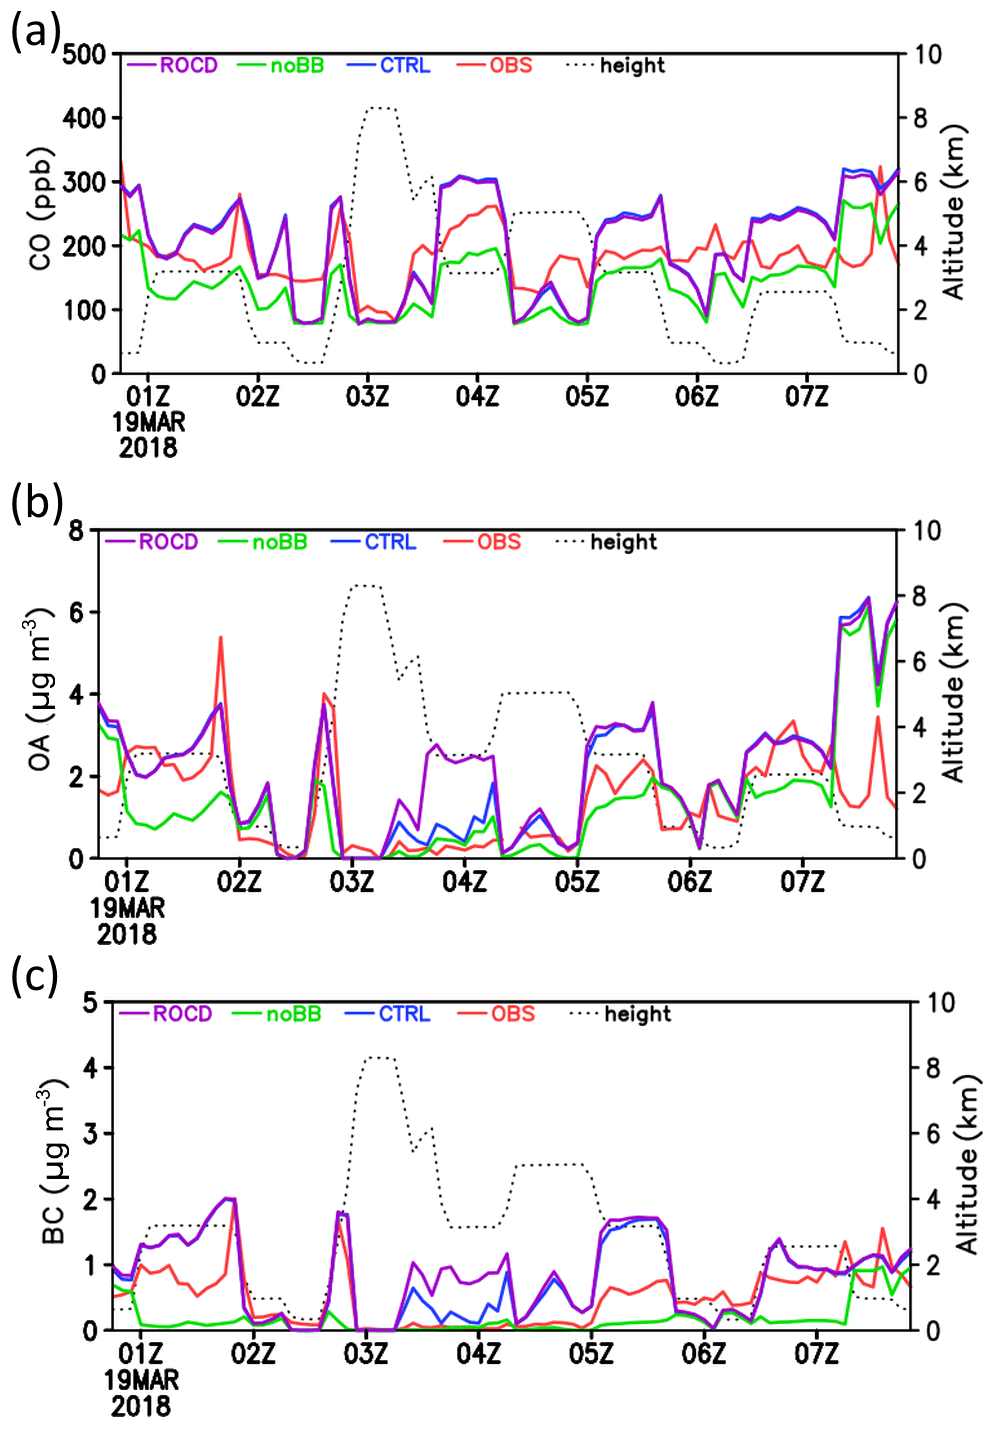
Figure 10Observed (OBS, red) and simulated concentrations (CTRL, blue) and the simulation without indirect effect (ROCD, purple), without BB emission (noBB, green) along with the flight altitude for (a) CO (ppb), (b) OA (µg m−3), and (c) BC (µg m−3) on 19 March 2018.
OA and BC are also important BB indicators and were reasonably captured by the model before 03:00 UTC when the flight was south of 28∘ N at elevations of <4000 m (Fig. 10b–c). The time series of simulated OA and BC has peak concentrations of nearly 4–5.5 and 2 µg m−3, respectively, during HALO shuttle flights passing through the BPTL (2000–4000 m) around 01:50 and 02:50 UTC. When BB emission was not included in the simulation, the concentration peaks were not observed (see Fig. 10b–c, green plot). Similar to the simulated CO results, the simulated OA and BC overestimate the amounts of these species to the north of 28∘ N during 03:30–04:20 UTC (Figs. 7a and 10). Furthermore, when the simulation only considered direct effect (case ROCD, purple), the overestimations were increased as shown in Fig. 10b–c. As mentioned earlier, a frontal system was just located from the ECS to SC (Fig. 2e) on 19 March 2018. In other words, the effect of wet scavenging reduced the aerosol concentration bias in the ECS and SC, as for the frontal system providing the moist air mass in the event flight F0319. After 07:30 UTC in Fig. 10, the simulation high concentration was related to local emissions over western Taiwan before HALO landed in Tainan. In general, our model simulation captured OA and BC reasonably well with an R of 0.61 and 0.74, respectively. A minor mean bias for OA (BC) is 0.3 µg m−3 (0.1 µg m−3), and the root mean square error (RMSE) of OA (BC) is 1.1 µg m−3 (0.4 µg m−3) (Table 2). The R for OA (BC) reached 0.85 (0.79), with an RMSE of 0.7 µg m−3 (0.5 µg m−3) when we calculated the BB transport layer only between 2000 and 4000 m (Table 3 and Fig. 9). In addition to OA and BC, simulated aerosol species such as SO were overestimated, whereas NO was underestimated, although their concentrations were low (Table 3). Because the BPTL was mainly between altitudes of 2000 and 4000 m, the subsequent discussion focuses on the influence of the BPTL from Indochina on the downstream areas, particularly the ECS and Taiwan.
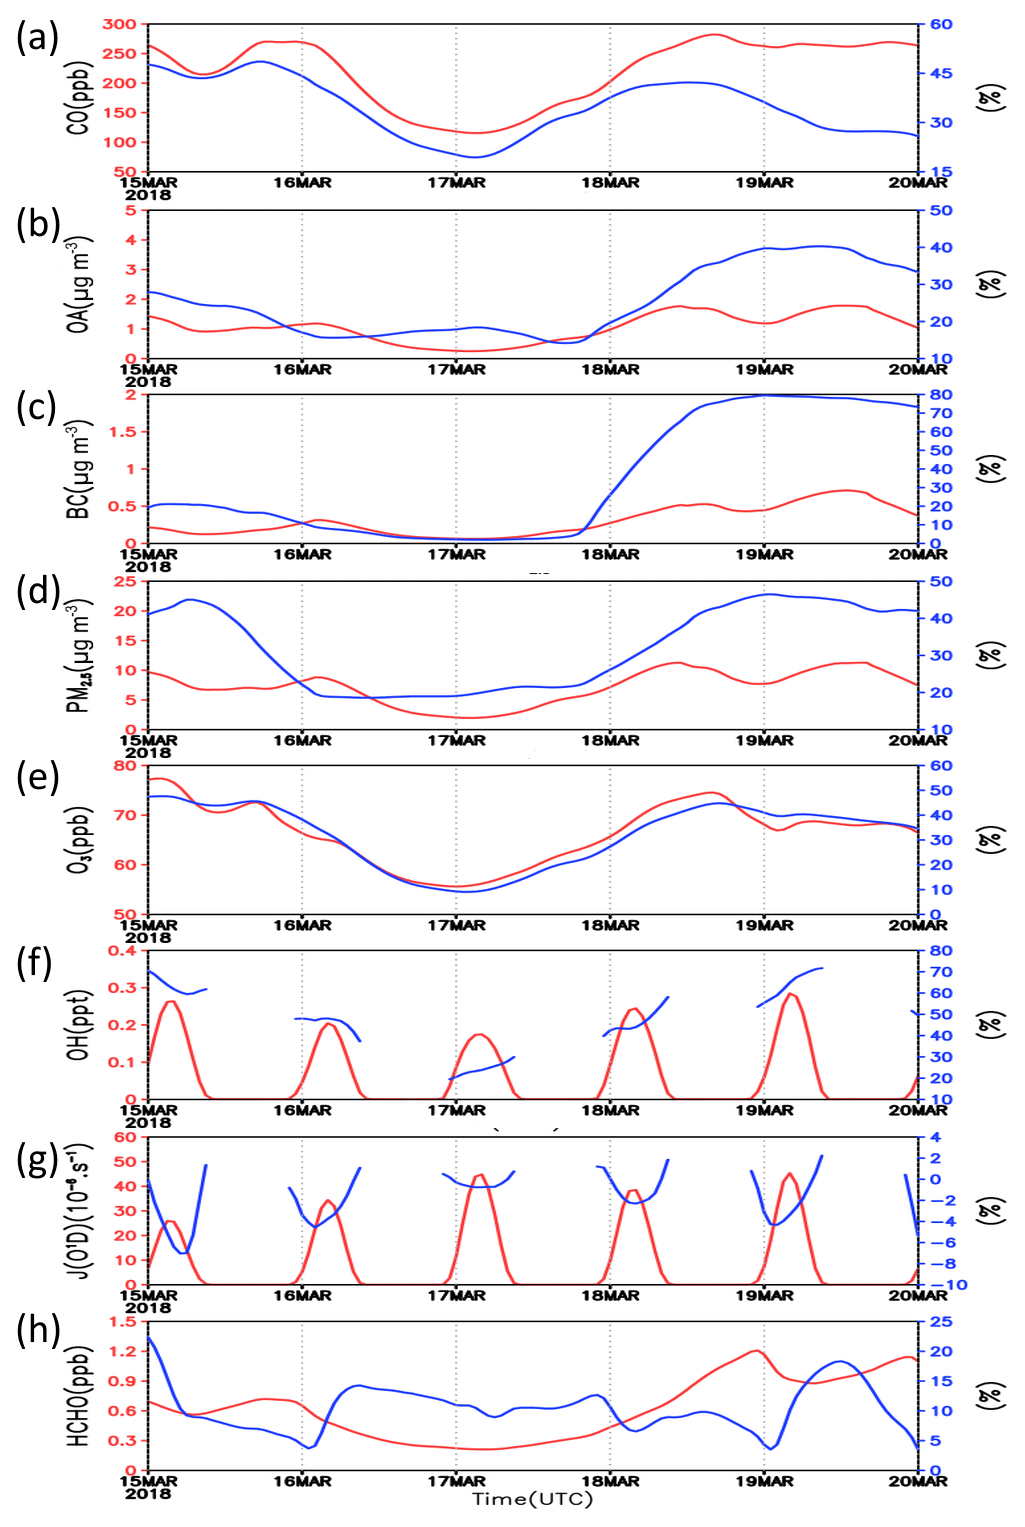
Figure 11Hourly variation of simulated mean concentration (red) and contribution by BB (%, blue) between 2 and 4 km over the region ECSA in Fig. 1a during 15–19 March 2018. (a) CO, (b) OA (c) BC, (d) PM2.5, (e) O3, (f) OH, (g) J(O1D), and (h) HCHO.
Table 4Simulated biomass burning contribution (with and without BB emission in Indochina) in percentage (%) on 17 and 19 March 2018 for different regions: SCA, TWA, and ECSA as shown in Fig. 1a.

4.2 Effects of LRT BB plume from Indochina on East Asia
To investigate the regional impacts of BB plume transport from Indochina, we compared the simulation with and without BB emission for the events on 17 and 19 March 2018. The analysis of the calculations focused on the impact over SC, Taiwan, and the ECS. These three selected regions are the SCA (in South China), TWA (covered the whole Taiwan), and ECSA (in the ECS) as shown in Fig. 1a. After being emitted the BB pollutants from Indochina were then transported northward to China and subsequently northeastward. The exact flow pattern depended on the weather conditions and flow types (ridge or trough) at 700 hPa (3000 m) between 17 and 19 March 2018 (see Fig. 2). Consequently, we investigated the hourly variation in the area mean concentrations or mixing ratios of air pollutant trace constituents to assess the importance of BB emissions from Indochina on the selected downstream region e.g., the ECSA (Fig. 11), SCA, TWA, and ECSA (Table 4). The contribution of CO (or other species) due to BB was estimated by the difference between simulations with and without the BB emission. These differences are then expressed as a fraction in percentage shown in Fig. 11 (blue line). The mean concentration of CO (red line) over the ECSA (Fig. 11a) was at its lowest (115 ppb) on 17 March 2018; it gradually increased to a peak concentration of 280 ppb on 18 March 2018 and then remained stable at 260 ppb on 19 March 2018. The contribution of CO from BB (blue line) ranged from 19 % (<22 ppb) on 17 March 2018 to a peak of 42 % (∼113 ppb) on 18 March 2018 and then gradually declined to 26 % on 19 March 2018 (Fig. 11a). As for OA (BC), the lowest percent contribution by BB was 14 %–16 % (<5 %) between 16 and 17 March 2018, while the highest could be more than 40 % (80 %) during 18 and 19 March 2018 (Fig. 11b and c). The BB contribution to PM2.5 was 19 % (0.39 µg m−3) on 17 March 2018 (Fig. 11d), increasing to 45 % (3.6 µg m−3) on 18–19 March 2018, because the BB plume was spread by the strong wind to the ECSA.
The variation of O3 (Fig. 11e) depends on transport and photochemistry, which involve the precursors NOx and VOC and the photolysis frequency of NO2, J(NO2). For the elevations between 2000–4000 m, O3 changes are similar to those of CO, NOx, and KET, which were mainly contributed by the LRT BB plume and related to the ozone precursor after 18 March 2018. The lowest and highest O3 concentrations on 17 and 18 March 2018 were 56 and 75 ppb, respectively, of which we estimate that 5.6 ppb (10 %) and 34 ppb (45 %) were BB's contributions, respectively. Although the mean NOx concentration was relatively small (0.06–0.18 ppb), the BB contributed 35 %–70 % (0.02–0.13 ppb) during 17–19 March 2018 (Fig. S4a). The KET concentration was in the range of 0.4 to 2.7 ppb, with BB contributing nearly 20 %–26 % (0.08–0.7 ppb) during 17–19 March 2018 (Fig. S4b).
The area mean OH contributed by BB increased from its lowest level (<30 %) on 17 March 2018 to its highest (nearly 70 %) on 19 March 2018 (Fig. 11f). HO2 also has an increasing trend from 10 % to 40 % during daytime over the period 17–19 March 2018 (Fig. S4c). The amounts of the oxidizing agent, OH, and the free radical HO2 depend on the amounts of trace gases, which produce and remove these radicals (e.g., NOx, water vapor, ozone, hydrocarbons), and the relevant photolysis frequencies J(O3→O1D), J(NO2) etc. However, BB's contribution to photolysis frequencies (O3→ O1D) (Fig. 10g), J(NO2) (Fig. S4d) etc. decreased as the mean BB aerosol concentration increased over the ECS during 17–19 March 2018. This is because photolysis calculation results used simulated aerosol and cloud formation, which increased over the ECSA (Fig. 13).
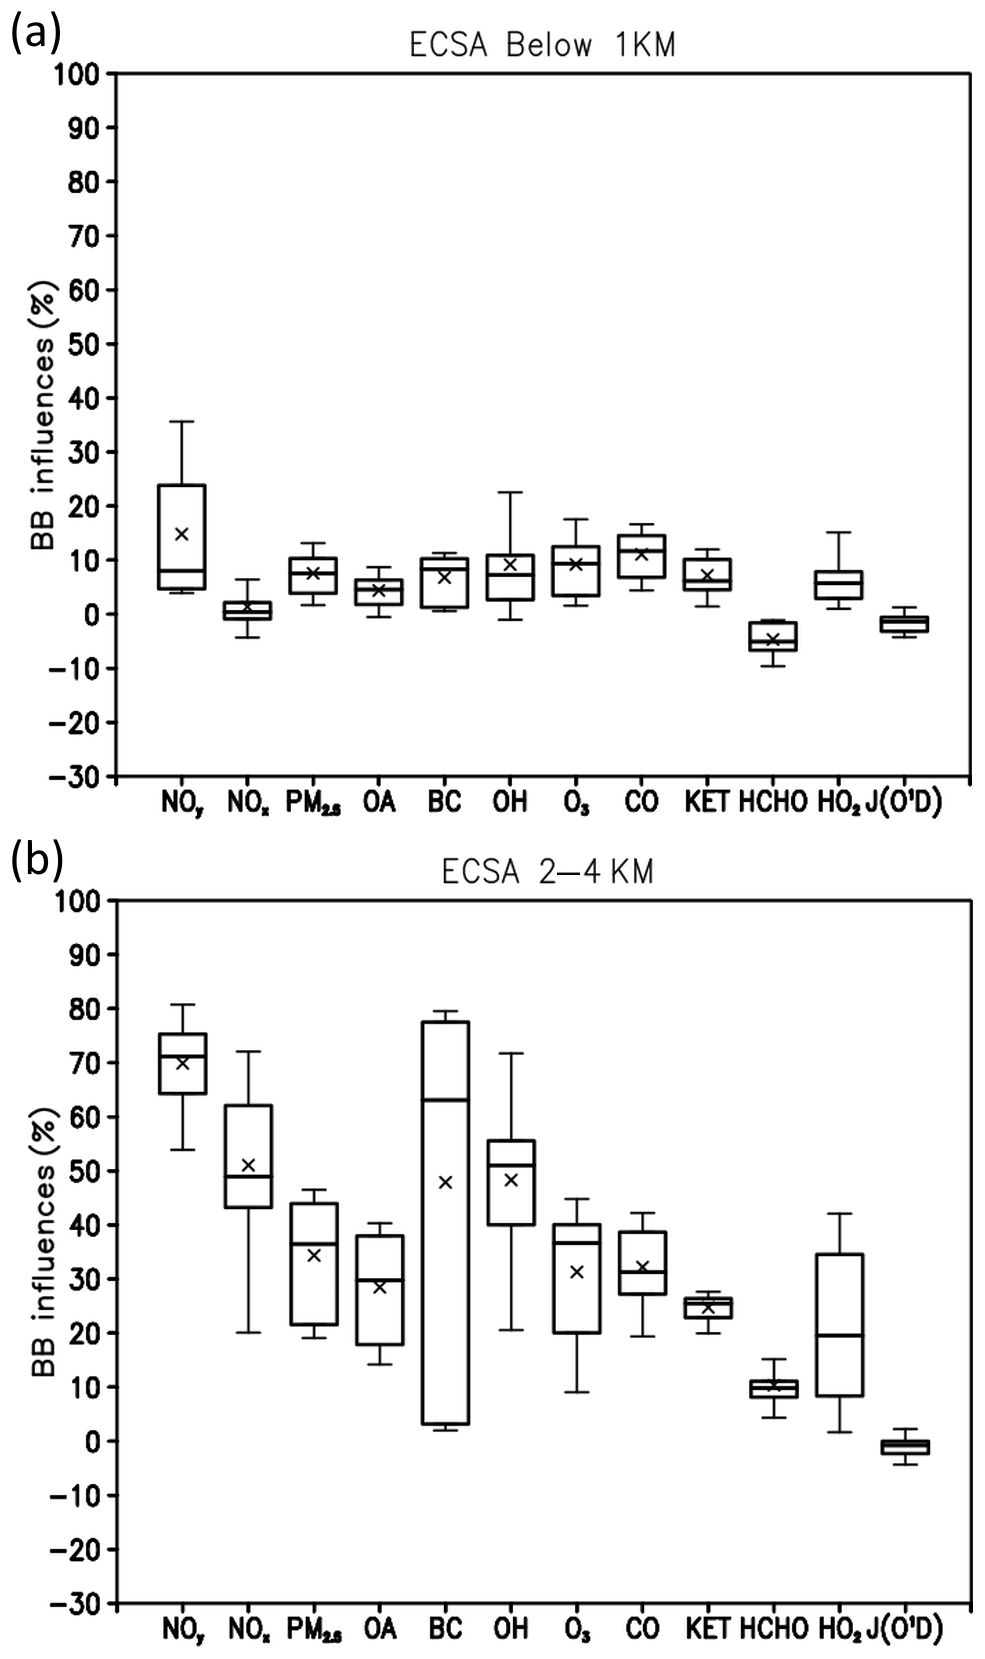
Figure 12Boxplots of simulated BB influences (%) on NOy, NOx, PM2.5, OA, BC, OH, O3, CO, KET, HCHO, HO2, and J(O1D) over the region ECSA in Fig. 1a on 17 and 19 March 2018. (a) Below 1 km and (b) between 2 and 4 km.
The NOy mean concentration ranged from 1.0 to 4.5 ppb, of which BB's contribution was from 55 % to 82 % (Fig. S4e). Such a high contribution from BB also demonstrated the effects of long-distance transport. Figure 11h indicates an increasing trend of HCHO concentration from 17 to 19 March 2018. HCHO formation and destruction depend on the rate of reaction of OH with HCHO precursors and the rate of reaction of HCHO with OH and the photolysis frequency of HCHO. As a result, HCHO production varied with OH concentration. The lowest and highest concentrations of HCHO were on 17 and 19 March 2018, respectively. In summary, the consistent variations in BB contributions to CO, OA, BC, PM2.5, OH, HCHO, NOx, NOy, and O3 peaked on 18 or 19 March 2018, whereas J(O1D) decreased between 17 and 19 March 2018.
Figure 12 displays the fraction in % that the long-range transported BB emission contributes to the amounts of NOx, NOy, PM2.5, OA, BC, OH, O3, CO, KET, HO2, HCHO, and J(O1D) over the ECSA on 17 and 19 March 2018. Except for NOy, BB contribution was generally <11 % at elevations of <1000 m over the ECSA. The scatter distribution of the simulation results indicates that the effect of BB emission at elevations of <1000 m (Fig. 12a) was significantly lower than that between the elevations of 2000 and 4000 m (Fig. 12b). For NOy, NOx, PM2.5, BC, OH, O3, and CO, the BB contribution was >30 % at the elevation of 2000–4000 m over the ECSA (Fig. 12b). Table 4 further summarizes the effect of BB emission on the downwind areas (SCA, TWA, and the ECSA) at the <1000 and 2000–4000 m elevations. The contribution of BB to NOy, NOx, PM2.5, BC, OH, O3, and CO was at least 30 %–80 % at the elevation of 2000–4000 m over the regions SCA, TWA, and the ECSA (Table 4). In the lower boundary layer (i.e., <1000 m), the BB contribution for most species at the remote downstream areas was <20 %, except for TWA. Because of the high mountains (Lin et al., 2021) present in TWA, the BB plume passing over Taiwan was potentially transported downward through mountain–valley circulation to the lower boundary layer (Ooi et al., 2021). The influence of BB over TWA was the highest among these three downstream regions (see Table 4), as its location was directly on the transport pathway of the BB plume on the major event day (flight F0319).
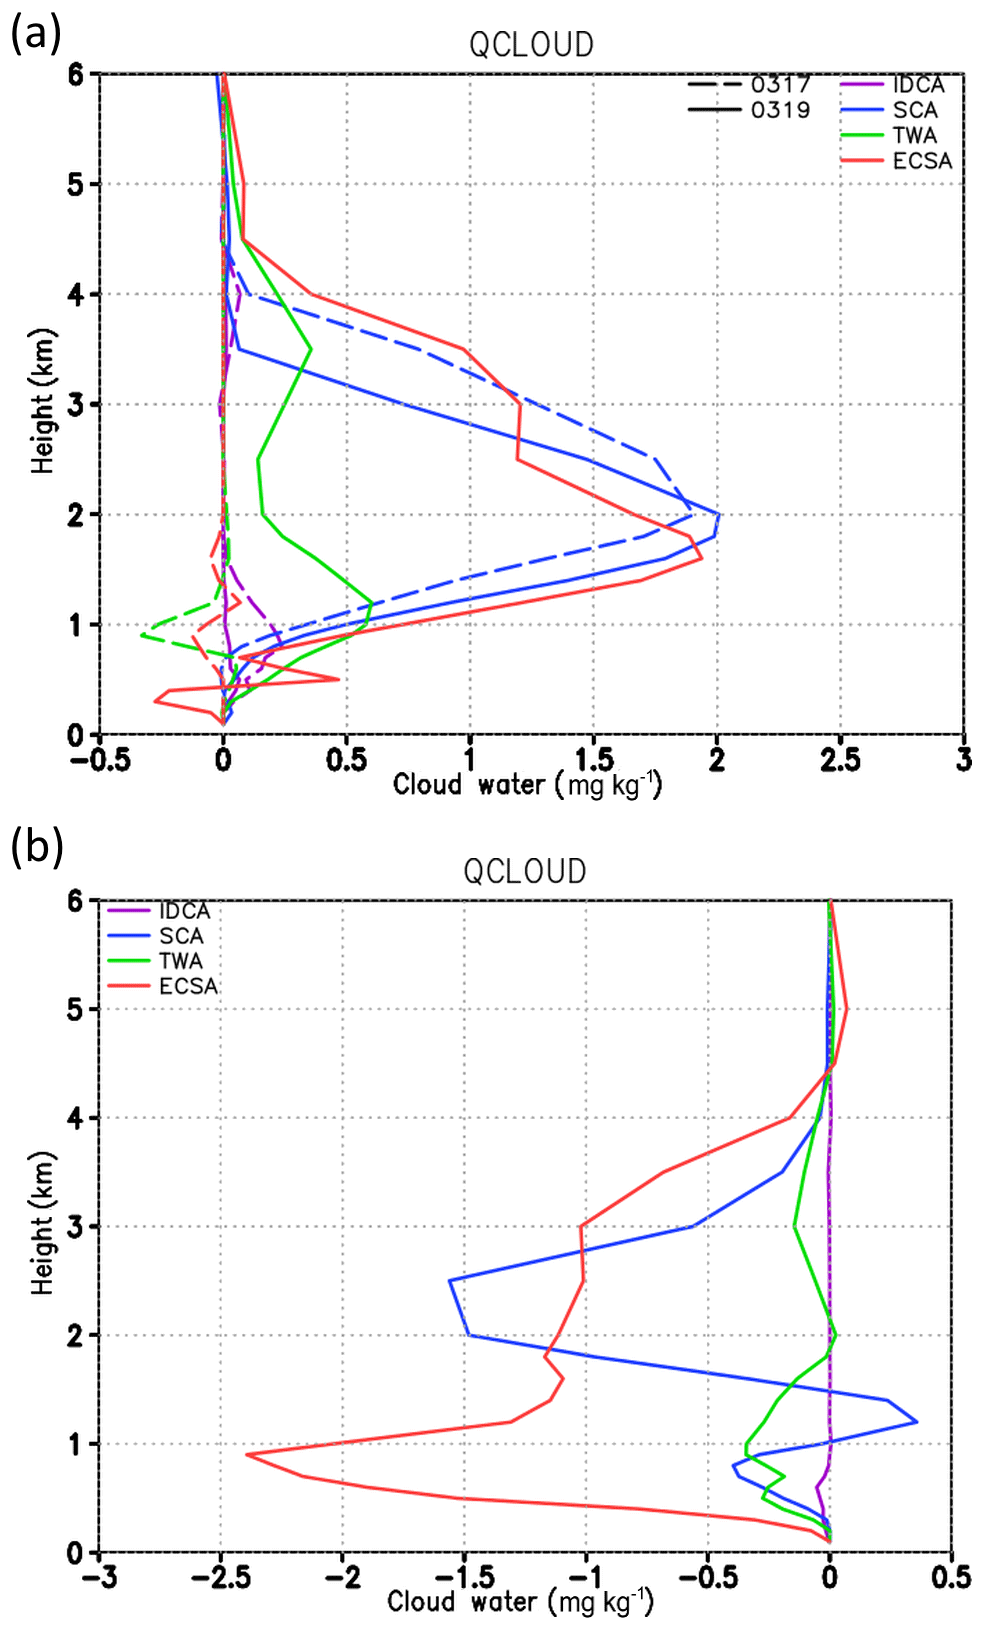
Figure 13(a) Simulated vertical distribution of BB influences on cloud water difference with and without BB emission on 17 (dash) and 19 (solid) March 2018. (b) Simulated vertical distribution of cloud water difference with and without indirect effect in the model on 19 March 2018. Regions include IDCA, SCA, TWA, and ECSA as shown in Fig. 1a.
Figure 13a displays the simulated cloud water difference with and without BB emission over different regions on 17 and 19 March 2018. BB aerosols are a potential source of cloud nuclei. The simulations show the impact of BB on cloud water enhancement (Fig. 13a) in the vertical distribution. Cloud water enhancement over SCA was associated with aerosol enhancement from the BB in the altitude range of 1000–4000 m: the peak being 1.8–2.0 mg kg−1 at 2000 m on these 2 d (Fig. 13a). The abundance of BB emissions transported from Indochina to SCA (Figs. 3 and 4) is expected to contribute to the high cloud water formation over SCA. Furthermore, the southerly flow (Figs. 3 and 4) that transports warm and moist air mass from the South China Sea may have favored cloud formation in flights F0317 and F0319. High cloud water related to BB can be seen in the simulations of these two days. In the remote ECSA regions, the cloud water substantially increased on 19 March 2018 (Fig. 13a) compared to 17 March 2018 because of a significant difference in BB emissions transported to the ECSA between 17 and 19 March 2018 (Figs. 3 and 4). Similarly, the cloud water enhancement over Taiwan also only appeared on 19 March 2018 (Fig. 13a). Furthermore, nearly no difference in the cloud water vertical distribution over the region IDCA (Fig. 1a) in Indochina was noted, because in the Indochina region, spring is the dry season (Lin et al., 2009) and is thus unfavorable for cloud water formation. Figure 13b shows the cloud water difference when the aerosol indirect effect turned off in the simulation over different regions on 19 March 2018. The significant cloud water shortage over the ECSA and SCA could be as high as 2.4 and 1.5 mg kg−1, respectively (Fig. 13b). In other words, the chemistry–microphysics interactions (indirect effect) plays an important role in the cloud water enhancement in the SCA and ECSA in this study.
The simulated downward shortwave flux at the noontime at the ground surface due to BB was 2 %–4 % and a 5 %–7 % reduction over the regions ECSA and SCA, respectively, (Fig. S5a–b, blue line) during 18–19 March 2018. However, a significant shortwave flux reduction at the noontime at the ground surface could be 15 %–20 % due to aerosol indirect effect in the region SCA during 18–19 March 2018 (Fig. S5a–b, dashed blue line). The combination of BB aerosol enhancement and increased cloud water results in shortwave radiation reduction, implying the possibility of regional climate change in East Asia driven by BB aerosols.
The BB during spring in Indochina has a significant impact on the chemistry and composition of the troposphere in the surrounding regions of East Asia. During the EMeRGe campaign in Asia, atmospheric pollutants were measured on board the HALO aircraft. In this study, a minor long-range BB transport event was observed from Indochina on 17 March 2018 (flight F0317), followed by a major long-range BB transport event on 19 March 2018 (flight F0319). The impact on tropospheric trace constituent composition and the environment has been investigated.
During the major BB transport event F0319, the 1 min mean of the peak concentrations of the trace constituents CO, O3, ACE, ACN, OA, and BC between the altitudes of 2000 and 4000 m over the ECS were 312.0, 79.0, 3.0, and 0.6 ppb, as well as 6.4 and 2.5 µg m−3, respectively. In comparison during the F0317 event CO, O3, ACE, ACN, OA, and BC were 203.0, 71.0, 2.0, and 0.3 ppb, as well as 3.4 and 1.2 µg m−3, respectively.
When the elevation was <1000 m for both the F0317 and F0319 events, the sulfates, rather than OA, had the highest concentrations. The peak concentration could be as high as 5.1 µg m−3 in the lower boundary for the event F0317 in the ECS. This observation is most likely explained by a continental outflow from regions having fossil fuel combustion in the lower boundary layer over the ECS.
In this study, the WRF-Chem model was employed to evaluate the BB plume transported from Indochina and its influence on the downstream areas including South China, Taiwan, and the ECS. The contribution of the BB plume for most species in the remote downstream areas was <20 % in the lower boundary layer (altitude <1000 m). In comparison, the contribution of long-range transported BB plume was 30 %–80 %, or even higher, for many of the trace constituents (NOy, NOx, CO, OH, O3, BC, and PM2.5) in the altitude range between 2000 and 4000 m for SC, Taiwan, and the ECS. The large influence of BB over Taiwan is most probably because the BB transport passes directly over Taiwan.
BB aerosols are potential sources of cloud nuclei. The WRF simulations estimate the effect of the BB plume on cloud water formation over SC and the ECS. We observe in the simulations cloud water enhancement over SC at elevations of 1000–4000 m. This increase of cloud water is consistent with an increase in aerosol, caused by BB emissions, transported from Indochina to SC. In remote regions of the ECS, the simulated cloud water was significantly larger during the major BB event on 19 March 2018 than the minor BB event on 17 March 2018. The simulated decrease of the photolysis frequency (J(O1D) and J(NO2)) is attributed to the difference in aerosol concentrations and associated cloud enhancement between the two events over the ECS. This we explain by the significant differences in BB emissions transported to the ECS between the two events. The simulated downward shortwave flux at the noontime at the ground surface due to BB was 2 %–4 % and a 5 %–7 % reduction over the regions ECS and SC, respectively. The combination of increased BB aerosol concentration and increased amounts of cloud water led to reductions in the amount of incoming shortwave radiation at the surface over the ECS and SC. This influences tropospheric chemistry and composition, regional climate, precipitation, ocean biogeochemistry, agriculture, and human health.
The EMeRGe data are available at the HALO database (https://doi.org/10.17616/R39Q0T, re3data.org, 2023) and can be accessed upon registration. Modeling data can be made available upon request to the corresponding author.
The supplement related to this article is available online at: https://doi.org/10.5194/acp-23-2627-2023-supplement.
CYL conceived the idea, analyzed the data, and wrote and edited the manuscript. WCC and YYC ran the model and analyzed the data. CKC joined the manuscript discussion. CYL provided the MODIS data. HZ and HS provided trace gas data. EF provided acetonitrile data. FO performed the ozone measurement. OOK, BAH, and MLP were responsible for the BC measurement. KK and JS were responsible for C-ToF-MS measurements. KP and BW provided HONO data. JPB and MDAH led the EMeRGe-Asia experiment. All authors have read and agree to the published version of the paper.
The contact author has declared that none of the authors has any competing interests.
Publisher's note: Copernicus Publications remains neutral with regard to jurisdictional claims in published maps and institutional affiliations.
This article is part of the special issue “Effect of Megacities on the Transport and Transformation of Pollutants at Regional and Global Scales (EMeRGe) (ACP/AMT inter-journal SI)”. It is not associated with a conference.
We thank the National Centre for High Performance Computing (NCHC) for providing computational and storage resources. The HALO deployment during EMeRGe was funded by a consortium comprising the German Research Foundation (DFG) Priority Program HALO-SPP 1294, the Institute of Atmospheric Physics of the DLR, the Max Planck Society (MPG), and the Helmholtz Association. Johannes Schneider and Katharina Kaiser acknowledge funding through the DFG (project no. 316589531). The authors gratefully acknowledge the NOAA Air Resources Laboratory (ARL) for the provision of the HYSPLIT transport and dispersion model and READY website (https://www.ready.noaa.gov, last access: 14 February 2023) used in this publication.
This research has been supported by the Ministry of Science and Technology, Taiwan (grant nos. MOST 108-2111-M-001-002, MOST 109-2111-M-001-004, and MOST 110-2111-M-001-013).
This paper was edited by Manabu Shiraiwa and reviewed by two anonymous referees.
Ackermann, I. J., Hass, H., Memmsheimer, M., Ebel, A., Binkowski, F. S., and Shankar, U.: Modal aerosol dynamics model for Europe: development and first applications, Atmos. Environ., 32, 2981–2999, https://doi.org/10.1016/S1352-2310(98)00006-5, 1998.
Ahmadov, R., McKeen, S. A., Robinson, A. L., Bahreini, R., Middlebrook, A. M., de Gouw, J. A., Meagher, J., Hsie, E.-Y. Edgerton, E., Shaw, S., and Trainer, M.: A volatility basis set model for summertime secondary organic aerosols over the eastern United States in 2006, J. Geophys. Res., 117, D06301, https://doi.org/10.1029/2011JD016831, 2012.
Andrés Hernández, M. D., Hilboll, A., Ziereis, H., Förster, E., Krüger, O. O., Kaiser, K., Schneider, J., Barnaba, F., Vrekoussis, M., Schmidt, J., Huntrieser, H., Blechschmidt, A.-M., George, M., Nenakhov, V., Harlass, T., Holanda, B. A., Wolf, J., Eirenschmalz, L., Krebsbach, M., Pöhlker, M. L., Kalisz Hedegaard, A. B., Mei, L., Pfeilsticker, K., Liu, Y., Koppmann, R., Schlager, H., Bohn, B., Schumann, U., Richter, A., Schreiner, B., Sauer, D., Baumann, R., Mertens, M., Jöckel, P., Kilian, M., Stratmann, G., Pöhlker, C., Campanelli, M., Pandolfi, M., Sicard, M., Gómez-Amo, J. L., Pujadas, M., Bigge, K., Kluge, F., Schwarz, A., Daskalakis, N., Walter, D., Zahn, A., Pöschl, U., Bönisch, H., Borrmann, S., Platt, U., and Burrows, J. P.: Overview: On the transport and transformation of pollutants in the outflow of major population centres – observational data from the EMeRGe European intensive operational period in summer 2017, Atmos. Chem. Phys., 22, 5877–5924, https://doi.org/10.5194/acp-22-5877-2022, 2022.
Carmichael, G. R., Tang, Y., Kurata, G., Uno, I., Streets, D., Woo, J.-H., Huang, H., Yienger, J., Lefer, B., Shetter, R., Blake, D., Atlas, E., Fried, A., Apel, E., Eisele, F., Cantrell, C., Avery, M., Barrick, J., Sachse, G., Brune, W., Sandholm, S., Kondo, Y., Singh, H., Talbot, R., Bandy, A., Thorton, D., Clarke, A., and Heikes, B.: Regional-scale chemical transport modeling in support of the analysis of observations obtained during the TRACE-P experiment, J. Geophys. Res., 108, 8823, https://doi.org/10.1029/2002JD003117, 2003.
Chuang, M. T., Fu, J. S., Lee, C. T., Lin, N. H., Gao, Y., Wang, S. H., Sheu, G. R., Hsiao, T. C., Wang, J. L., Yen, M. C., Lin, T. H., and Thongboonchoo, N.: The simulation of long-range transport of biomass burning plume and short-range transport of anthropogenic pollutants to a mountain observatory in East Asia during the 7-SEAS/2010 Dongsha Experiment, Aerosol Air Qual. Res., 16, 2933–2949, 2016.
Chi, K. H., Lin, C. Y., Ouyang, C. F., Lin, J., Lin, N. H., Sheu, G. R., and Lee, C. T.: PCDD/F Measurement at a High-altitude Station in Central Taiwan: Evaluation of Long-range Transport of PCDD/Fs during the Southeast Asia Biomass Burning Event, Environ. Sci. Technol., 44, 2954–2960, https://doi.org/10.1021/es1000984, 2010.
Ding, K., Huang, X., Ding, A., Wang, M., Su, H., Kerminen, V. M., Petäjä, T., Tan, Z., Wang, Z., Zhou, D., Sun, J., Liao, H., Wang, H., Carslaw, K., Wood, R., Zuidema, P., Rosenfeld, D., Kulmala, M., Fu, C., Pöschl, U., Cheng, Y., and Andreae, M. O.: Aerosol-boundary-layer-monsoon interactions amplify semi-direct effect of biomass smoke on low cloud formation in Southeast Asia, Nat. Commun., 12, 6416, https://doi.org/10.1038/s41467-021-26728-4, 2021.
Förster, E., Bönisch, H., Neumaier, M., Obersteiner, F., Zahn, A., Hilboll, A., Kalisz Hedegaard, A. B., Daskalakis, N., Poulidis, A. P., Vrekoussis, M., Lichtenstern, M., and Braesicke, P.: Chemical and dynamical identification of emission outflows during the HALO campaign EMeRGe in Europe and Asia, Atmos. Chem. Phys., 23, 1893–1918, https://doi.org/10.5194/acp-23-1893-2023, 2023.
Fu, J. S., Hsu, N. C., Gao, Y., Huang, K., Li, C., Lin, N.-H., and Tsay, S.-C.: Evaluating the influences of biomass burning during 2006 BASE-ASIA: a regional chemical transport modeling, Atmos. Chem. Phys., 12, 3837–3855, https://doi.org/10.5194/acp-12-3837-2012, 2012.
Galanter, M., Levy, H., and Carmichael, G. R.: Impacts of biomass burning on tropospheric CO, NOx, and O3, J. Geophys. Res.-Atmos., 105, 6633–6653, 2000.
Giglio, L., Randerson, J. T., and Werf, G. R. V. D.: Analysis of daily, monthly, and annual burned area using the fourth-generation global fire emissions database (GFED4), J. Geophys. Res.-Biogeo., 118, 317–328, 2013.
Grell, G. A., Peckham, S. E., Schmitz, R., McKeen, S. A., Frost, G., Skamarock, W. C., and Eder, B.: Fully coupled “online” chemistry within the WRF model, Atmos. Environ., 39, 6957–6975, https://doi.org/10.1016/j.atmosenv.2005.04.027, 2005.
Heald, C. L., Jacob, D. J., Fiore, A. M., Emmons, L. K., Gille, J. C., Deeter, M. N., Warner, J., Edwards, D. P., Crawford, J. H., Hamlin, A. J., Sachse, G. W., Browell, E. V., Avery, M. A., Vay, S. A., Westberg, D. J., Blake, D. R., Singh, H. B., Sandholm, S. T., Talbot, R. W., and Fuelberg, H. E.: Asian outflow and trans-Pacific transport of carbon monoxide and ozone pollution: An integrated satellite, aircraft, and model perspective, J. Geophys. Res., 108, 4804, https://doi.org/10.1029/2003JD003507, 2003.
Hong, S., Lakshmi V., Small, E. E., Chen, F., Tewari, M., and Manning, K. W.: Effects of vegetation and soil moisture on the simulated land surface processes from the coupled WRF/Noah model, J. Geophys. Res., 114, D18118, https://doi.org/10.1029/2008JD011249, 2009.
Huang, K., Fu, J. S., Hsu, N. C., Gao, Y., Dong, X., Tsay, S. C., and Lam, Y. F.: Impact assessment of biomass burning on air quality in Southeast and East Asia during BASE-ASIA, Atmos. Environ., 78, 291–302, https://doi.org/10.1016/j.atmosenv.2012.03.048, 2013.
Jacob, D. J., Crawford, J. H., Kleb, M. M., Connors, V. S., Bendura, R. J., Raper, J. L., Sachse, G. W., Gille, J. C., Emmons, L., and Heald, C. L.: The transport and chemical evolution over the pacific (trace-P) aircraft mission: design, execution, and first results, J. Geophys. Res.-Atmos., 108, 9000, doi:10.1029/2002JD003276, 2003.
Janjic, Z. I.: The step-mountain eta coordinate model: further developments of the convection,viscous layer, and turbulence closure schemes, Mon. Weather Rev., 122, 927–945, 1994.
Kong, L., Tang, X., Zhu, J., Wang, Z., Fu, J. S., Wang, X., Itahashi, S., Yamaji, K., Nagashima, T., Lee, H.-J., Kim, C.-H., Lin, C.-Y., Chen, L., Zhang, M., Tao, Z., Li, J., Kajino, M., Liao, H., Wang, Z., Sudo, K., Wang, Y., Pan, Y., Tang, G., Li, M., Wu, Q., Ge, B., and Carmichael, G. R.: Evaluation and uncertainty investigation of the NO2, CO and NH3 modeling over China under the framework of MICS-Asia III, Atmos. Chem. Phys., 20, 181–202, https://doi.org/10.5194/acp-20-181-2020, 2020.
Li, J., Nagashima, T., Kong, L., Ge, B., Yamaji, K., Fu, J. S., Wang, X., Fan, Q., Itahashi, S., Lee, H.-J., Kim, C.-H., Lin, C.-Y., Zhang, M., Tao, Z., Kajino, M., Liao, H., Li, M., Woo, J.-H., Kurokawa, J., Wang, Z., Wu, Q., Akimoto, H., Carmichael, G. R., and Wang, Z.: Model evaluation and intercomparison of surface-level ozone and relevant species in East Asia in the context of MICS-Asia Phase III – Part 1: Overview, Atmos. Chem. Phys., 19, 12993–13015, https://doi.org/10.5194/acp-19-12993-2019, 2019.
Lin, C.-Y., Hsu, H.-m., Lee, Y. H., Kuo, C. H., Sheng, Y.-F., and Chu, D. A.: A new transport mechanism of biomass burning from Indochina as identified by modeling studies, Atmos. Chem. Phys., 9, 7901–7911, https://doi.org/10.5194/acp-9-7901-2009, 2009.
Lin, C. Y., Chou, C.C.K, Wang, Z., Lung, S.C., Lee, C. T., Yuan, C.S., Chen, W. N., Chang, S. Y., Hsu, S. C., Chen, W. C., Liu, and Shaw, C.: Impact of different transport mechanisms of Asian dust and anthropogenic pollutants to Taiwan, Atmos. Environ., 60, 403–418, https://doi.org/10.1016/j.atmosenv.2012.06.049, 2012.
Lin, C. Y., Zhao, Liu, C. X, Lin, N. H., and Chen, W. N.: Modeling of long-range transport of Southeast Asia biomass burning pollutants to Taiwan and their radiative forcing over East Asia, Tellus B, 66, 1–17, https://doi.org/10.3402/tellusb.v66.23733, 2014.
Lin, C.-Y., Sheng, Y.-F., Chen, W.-C., Chou, C. C. K., Chien, Y.-Y., and Chen, W.-M.: Air quality deterioration episode associated with a typhoon over the complex topographic environment in central Taiwan, Atmos. Chem. Phys., 21, 16893–16910, https://doi.org/10.5194/acp-21-16893-2021, 2021.
Lin, N. H., Tsay, S. C., Maring, H.B., Yen, M. C., Sheu, G. R., Wang, S.H., Chi, K. H., Chuang, M. T., Ou-Yang, C. F., Fu, J.S., Reid, J. S., Lee, C. T., Wang, L. C., Wang, J. L., Hsu, C. N., Sayer, A. M., Holben, B. N., Chu Y. C., Nguyen, X. A., Sopajaree, K., Chen, S. J., Cheng, M. T., Tsuang, B. J., Tsai, C. J., Peng, C. M., Schnell, R. C., Conway, T., Chang C. T., Lin K. S., Tsai, Y. I., Lee, W. J., Chang, S. C., Liu, J. J., Chiang, W. L., Huang, S. J., Lin, T. H., and Liu, G. R.: An overview of regional experiments on biomass burning aerosols and related pollutants in Southeast Asia: From BASE-ASIA and Dongsha Experiment to 7-SEAS, Atmos. Environ., 78, 1–19, https://doi.org/10.1016/j.atmosenv.2013.04.066, 2013.
Marvin, M. R., Palmer, P. I., Latter, B. G., Siddans, R., Kerridge, B. J., Latif, M. T., and Khan, M. F.: Photochemical environment over Southeast Asia primed for hazardous ozone levels with influx of nitrogen oxides from seasonal biomass burning, Atmos. Chem. Phys., 21, 1917–1935, https://doi.org/10.5194/acp-21-1917-2021, 2021.
Miyazaki, Y., Kondo, Y., Koike, M., Fuelberg, H. E., Kiley, C. M., Kita, K., Takegawa, N., Sachse, G. W., Flocke, F., Weinheimer, A. J., Singh, H. B., Eisele, F. L., Zondlo, M., Talbot, R. W., Sandholm, S. T., Avery, M. A., and Blake, D. R.: Synoptic-scale transport of reactive nitrogen over the western Pacific in spring, J. Geophys. Res., 108, 8788, https://doi.org/10.1029/2002JD003248., 2003.
Morrison, H., Curry, J. A., and Khvorostyanov, V. I.: A new double-moment microphysics parameterization for application in cloud and climate model, Part I: Description, J. Atmos. Sci., 62, 1665–1676, 2005.
Neu, J. L. and Prather, M. J.: Toward a more physical representation of precipitation scavenging in global chemistry models: cloud overlap and ice physics and their impact on tropospheric ozone, Atmos. Chem. Phys., 12, 3289–3310, https://doi.org/10.5194/acp-12-3289-2012, 2012.
Palmer, P. I., Jacob, D. J., Jones, D. B. A., Heald, C. L., Yantosca, R. M., Logan, J. A., Sachse, G. W., and Streets, D. G.: Inverting for emissions of carbon monoxide from Asia using aircraft observations over the western Pacific, J. Geophys. Res., 108, 8828, https://doi.org/10.1029/2003JD003397, 2003.
Pimonsree, S., Vongruang, P., and Sumitsawan, S.: Modified biomass burning emission in modeling system with fire radiative power: Simulation of particulate matter in Mainland Southeast Asia during smog episode, Atmos. Pollut. Res., 9, 133–145, https://doi.org/10.1016/j.apr.2017.08.002, 2018.
Powers, G., Klemp, J. B., Skamarock, W. C., Davis, C. A., Dudhia, J., Gill, D. O., Coen, J. L., Gochis, D. J., Ahmadov, R., Peckham, S. E., Grell, G. A., Michalakes, J., Trahan, S., Benjamin, S. G., Alexander, C. R., Dimego, G. J., Wang, W., Schwartz, C. S., Romine, G. S., Liu, Z., Snyder, C., Chen, F., Barlage, M., J., Yu, W., and Duda. M. G.: The weather research and forecasting model Overview, System Efforts, and Future Directions, B. Am. Meteorol. Soc., 98, 1717–1737, 2017.
Ramanathan, V., Ramana, M. V., Roberts, G., Kim, D., Corrigan, C., Chung, C., and Winker, D.: Warming trends in Asia amplified by brown cloud solar absorption, Nature, 448, 575–575, 2007.
re3data.org: HALO database; editing status 2021-11-17; re3data.org – Registry of Research Data Repositories, https://doi.org/10.17616/R39Q0T, last access: 14 February 2023.
Reid, J. S., Hyer, E. J., Johnson, R. S., Holben, B. N., Yokelson, R.J., Zhang, J., Campbell, J. R., Christopher, S. A., Girolamo, L. D., Giglio, L., Holz, R. E., Kearney, C., Miettinen, J., Reid, E. A., Turk, F. J., Wang, J., Xian, P., Zhao, G., Balasubramanian, R., Chew, B. N., Janjai, S., Lagrosas, N., Lestari, P., Lin, N. H., Mahmud, M., Nguyen, A. X., Norris, B., Oanh, N. T. K., Oo, M., Salinas, S. V., Welton, E. J., and Liew, S. C.: Observing and understanding the Southeast Asian aeroslo system by remote sensing: An initial review and analysis for the Seven Southeast Asian Studies (7SEAS) program, Atmos. Res., 122, 403–468, 2013.
Shi, Y. and Yamaguchi, Y.: A high-resolution and multi-year emissions inventory for biomass burning in Southeast Asia during 2001–2010, Atmos. Environ., 98, 8–16, https://doi.org/10.1016/j.atmosenv.2014.08.050, 2014.
Singh, H. B., Hara, D. O., Herlth, D., Sachse, W., Blake, D. R., Bradshaw, J. D., Kanakidou, M., and Crutzen, P. J.: Acetone in the atmosphere: Distribution, sources, and sink, J. Geophys. Res., 99, 1805–1819, 1994.
Stein, A. F., Draxler, R. R., Rolph, G. D., Stunder, B. J. B., Cohen, M. D., and Ngan, F.: NOAA's HYSPLIT Atmospheric Transport and Dispersion Modeling System, B. Am. Meteorol. Soc., 96, 2059–2077, https://doi.org/10.1175/BAMS-D-14-00110.1, 2021.
Stockwell, W. R., Middleton, P., Chang, J. S., and Tang, X.: The second generation regional acid deposition model chemical mechanism for regional air quality modeling, J. Geophys. Res., 95, 16343–16367, 1990.
Stockwell, W. R., Kirchner F., and Kuhn M.: A new mechanism for regional atmospheric chemistry modeling, J. Geophys. Res., 102, 25847–25879, 1997.
Talbot, R., Dibb, J., Scheuer, E., Seid, G., Russo, R., Sandholm, S., Tan, D., Singh, H., Blake, D., Blake, N., Atlas, E., Sachse, G., Jordan, C., and Avery, M.: Reactive nitrogen in Asian continental outflow over the western Pacific: Results from the NASA Transport and Chemical Evolution over the Pacific (TRACE-P) airborne mission, J. Geophys. Res., 108, 8824, https://doi.org/10.1029/2002JD003110, 2003.
Tang, Y., Carmichael, G. R., Woo, J.-H., Thongboonchoo, N., Kurata, G., Uno, I., Streets, D. G., Blake, D. R., Weber, R.J., Talbot, R.W., Kondo, Y., Singh, H. B., and Wang, T.: Influences of biomass burning during the Transport and Chemical Evolution Over the Pacific (TRACE-P) experiment identified by the regional chemical transport model, J. Geophys. Res., 108, 8824, https://doi.org/10.1029/2002JD003110, 2003.
Wiedinmyer, C., Akagi, S. K., Yokelson, R. J., Emmons, L. K., Al-Saadi, J. A., Orlando, J. J., and Soja, A. J.: The Fire INventory from NCAR (FINN): a high resolution global model to estimate the emissions from open burning, Geosci. Model Dev., 4, 625–641, https://doi.org/10.5194/gmd-4-625-2011, 2011.
Xu, R., Tie, X., Li, G., Zhao, S., Cao, J., Feng T., Long X., Effect of biomass burning on black carbon (BC) in South Asia and Tibetan Plateau: The analysis of WRF-Chem modeling, Sci. Total Environ., 645, 901–912, 2018.
Yadav, I. C., Devi, N. L., Li, J., Syed, J. H., Zhang, G., and Watanabe, H.: Biomass burning in Indo-China peninsula and its impacts on regional air quality and global climate change-a review, Environ. Pollut., 227, 414–427, 2017.
Zhao, C., Liu, X., Ruby Leung, L., and Hagos, S.: Radiative impact of mineral dust on monsoon precipitation variability over West Africa, Atmos. Chem. Phys., 11, 1879–1893, https://doi.org/10.5194/acp-11-1879-2011, 2011.
- Abstract
- Introduction
- Aircraft data and model configuration
- Characteristics of the field experiment
- Simulation results and discussion
- Summary
- Data availability
- Author contributions
- Competing interests
- Disclaimer
- Special issue statement
- Acknowledgements
- Financial support
- Review statement
- References
- Supplement