the Creative Commons Attribution 4.0 License.
the Creative Commons Attribution 4.0 License.
 | 22 Feb 2023
Tropospheric NO2 vertical profiles over South Korea and their relation to oxidant chemistry: implications for geostationary satellite retrievals and the observation of NO2 diurnal variation from space
Laura Hyesung Yang
Daniel J. Jacob
Nadia K. Colombi
Shixian Zhai
Kelvin H. Bates
Viral Shah
Ellie Beaudry
Robert M. Yantosca
Haipeng Lin
Jared F. Brewer
Heesung Chong
Katherine R. Travis
James H. Crawford
Lok N. Lamsal
Ja-Ho Koo
Jhoon Kim
Nitrogen oxides (NOx≡ NO + NO2) are of central importance for air quality, climate forcing, and nitrogen deposition to ecosystems. The Geostationary Environment Monitoring Spectrometer (GEMS) is now providing hourly NO2 satellite observations over East Asia, offering the first direct measurements of NO2 diurnal variation from space to guide understanding of NOx emissions and chemistry. The NO2 retrieval requires independent vertical profile information from a chemical transport model (CTM) to compute the air mass factor (AMF) that relates the NO2 column measured along the line of sight to the NO2 vertical column. Here, we use aircraft observations from the Korea-United States Air Quality (KORUS-AQ) campaign over the Seoul metropolitan area (SMA) and around the Korean Peninsula in May–June 2016 to better understand the factors controlling the NO2 vertical profile, its diurnal variation, the implications for the AMFs, and the ability of the GEOS-Chem CTM to compute the NO2 vertical profiles used for AMFs. Proper representation of oxidant chemistry is critical for the CTM simulation of NO2 vertical profiles and is achieved in GEOS-Chem through new model developments, including aerosol nitrate photolysis, reduced uptake of hydroperoxy (HO2) radicals by aerosols, and accounting for atmospheric oxidation of volatile chemical products (VCPs). We find that the tropospheric NO2 columns measured from space in the SMA are mainly contributed by the planetary boundary layer (PBL) below 2 km altitude, reflecting the highly polluted conditions. Repeated measurements of NO2 vertical profiles over the SMA at different times of day show that diurnal change in mixing depth affecting the NO2 vertical profile induces a diurnal variation in AMFs of comparable magnitude to the diurnal variation in the NO2 column. GEOS-Chem captures this diurnal variation in AMFs and more generally the variability in the AMFs for the KORUS-AQ NO2 vertical profiles (2.7 % mean bias, 7.6 % precision), with some outliers in the morning due to errors in the timing of mixed-layer growth.
- Article
(3254 KB) - Full-text XML
-
Supplement
(868 KB) - BibTeX
- EndNote


Nitrogen oxides (NOx≡ NO + NO2) are emitted by fuel combustion and from natural sources such as lightning, wildfires, and soils. They play a critical role in driving atmospheric oxidant chemistry, with implications for air quality and health, climate forcing, and nitrogen deposition to ecosystems. Satellite-based retrievals of tropospheric NO2 columns have been used extensively to investigate NOx emissions and their trends (Richter et al., 2005; Stavrakou et al., 2008) and NOx atmospheric lifetime (de Foy et al., 2015; Laughner and Cohen, 2019). The retrievals require local NO2 vertical profile information to account for atmospheric scattering, but there can be large uncertainties in these profiles (Travis et al., 2016). The Geostationary Environment Monitoring Spectrometer (GEMS) launched in February 2020 is now providing continuous hourly NO2 column observations over East Asia (Kim et al., 2020; Park et al., 2022). Here we use observations from the Korea-United States Air Quality (KORUS-AQ) aircraft campaign together with GEOS-Chem chemical transport model (CTM) simulations to better understand the factors controlling NO2 vertical profiles over East Asia, their relations to the broader photochemical environment, and the implications for observing the diurnal variation of NO2 from GEMS.
Tropospheric NO2 has been measured from polar sun-synchronous low-earth-orbiting (LEO) satellite instruments since 1995 with the Global Ozone Monitoring Experiment (GOME) (1995–2003; Burrows and Chance, 1993; Martin et al., 2002) continued by the Scanning Imaging Spectrometer for Atmospheric Chartography (SCIAMACHY) (2002–2012; Bovensmann et al., 1999), GOME-2 (2006–present; Callies et al., 2000), the Ozone Monitoring Instrument (OMI) (2004–present; Levelt et al., 2018), the Ozone Mapping Profiler Suite (OMPS) (2011–present; Flynn et al., 2014), the Tropospheric Monitoring Instrument (TROPOMI) (2017–present; Veefkind et al., 2012), and the Environmental Trace Gases Monitoring Instrument (EMI) (2018–present; Zhang et al., 2018). GEMS is the first geostationary instrument to measure tropospheric NO2. The retrievals fit the backscattered solar spectra in the 400–470 nm wavelength range to obtain a NO2 slant column density (SCD) from which the stratospheric portion is removed to estimate the tropospheric SCD (Bucsela et al., 2013; Boersma et al., 2018). The tropospheric SCD is then converted to a vertical column density (VCD) with an air mass factor (AMF) for the scattering atmosphere that depends on the shape of the local NO2 vertical profile (Palmer et al., 2001; Eskes and Boersma, 2003). The vertical profile varies locally as a function of emissions, chemistry, and meteorology and must therefore be provided independently by a CTM. Model errors in that vertical profile can be a major contributor to the VCD error budget (Martin et al., 2002; Lin et al., 2012; Boersma et al., 2018).
The LEO instruments observe NO2 once a day at a particular local time of day, but tropospheric NO2 VCDs vary with the time of day as driven by emissions and chemistry. Previous studies obtained some sparse information on this diurnal variation by using the difference in overpass time between two LEO satellites. Boersma et al. (2008) used SCIAMACHY and OMI and found higher tropospheric NO2 VCDs in mid-morning than in the early afternoon over polluted regions, which they attributed to photochemical loss over the course of the day. Lin et al. (2010) used the combination of GOME-2 and OMI for a top–down estimate of NOx emissions over China including diurnal variation. Penn and Holloway (2020) found that NO2 column ratios between morning and afternoon are lower than surface NO2 concentration ratios, as would be expected from deeper vertical mixing in the afternoon but with large heterogeneity in the ratio at the urban scale. The hourly data from GEMS should enable a better understanding of the diurnal patterns of NO2 and an opportunity to better account for the diurnal variation of NOx emissions and chemical lifetime.
The role of oxidant chemistry in controlling NO2 concentration and its vertical profile is of particular interest. This chemistry involves ozone (O3), hydrogen oxide radicals (HOx≡ OH + peroxy radicals), and volatile organic compounds (VOCs), which control the NO NO2 partitioning and the atmospheric lifetime of NOx. CTM errors in describing oxidant chemistry can result in large errors in NO2 profiles (Travis et al., 2016; Silvern et al., 2018). Park et al. (2021) found that the O3 concentrations observed in KORUS-AQ were severely underestimated by CTMs, and this would affect the simulation of the ratio.
The KORUS-AQ campaign deployed the NASA DC-8 aircraft over and around the Korean Peninsula in May–June 2016 with vertical profiling at up to 7 km altitude (Crawford et al., 2021). The aircraft carried a large payload of instrumentation for oxidant chemistry. Previous relevant analyses of the KORUS-AQ data focused on comparisons to an ensemble of CTMs (Park et al., 2021), investigations of the factors controlling CO and O3 (Gaubert et al., 2020; Schroeder et al., 2020), heterogenous chemistry (Heim et al., 2020; Brune et al., 2022), VOC reactivity (Simpson et al., 2020), aerosol nitrate photolysis (Romer et al., 2018), and aerosol composition (Nault et al., 2018; Kim et al., 2018; Jordan et al., 2020), along with a number of GEOS-Chem-specific studies referenced in Sect. 2.
Here we conduct simulations of the KORUS-AQ observations using GEOS-Chem at 0.25∘ × 0.3125∘ resolution with recent chemical updates, including aerosol nitrate (NO) photolysis (Shah et al., 2023), coarse particulate matter uptake of nitric acid (HNO3) (Zhai et al., 2023), emissions of volatile chemical products (VCPs) (Bates et al., 2022), and revision of HO2 heterogeneous uptake by aerosols. As we will see, these updates enable a much-improved representation of oxidant chemistry relative to previous GEOS-Chem versions, which provides a basis for model evaluation with observed NO2 concentrations and ratios. We go on to examine the diurnal variation of NO2 vertical profiles and the resulting diurnal variation of AMFs as defined by the observations and by GEOS-Chem and from there quantify the AMF errors associated with retrieving NO2 diurnal variations from GEMS using GEOS-Chem vertical profiles.
2.1 KORUS-AQ observations
KORUS-AQ included 20 research flights with the NASA DC-8 aircraft, all based out of Osan Air Base and covering South Korea and the adjacent ocean with a particular focus on the Seoul metropolitan area (SMA) (Crawford et al., 2021). All flights were in the 08:00–16:00 local time (LT) window. We exclude observations made near Daesan (36.4–37.15∘ N, 126–126.88∘ E) that focused on sampling power plant plumes. We use a 60 s merged dataset of the aircraft observations (available at https://www-air.larc.nasa.gov/, last access: 15 February 2023). We sample the GEOS-Chem model along the flight tracks at the time of the observations. Comparisons of the model to observations are presented after averaging the observations along the flight tracks over the model grid.
Specific KORUS-AQ aircraft measurements used in this work include Thermal Dissociation Laser-Induced Fluorescence (TD-LIF) for NO2 concentrations (Thornton et al., 2000; Nault et al., 2015), National Center for Atmospheric Research (NCAR) four-channel NOxyO3Chemiluminescence for NO and O3 concentrations (Walega et al., 1991), the NCAR Charge-Coupled Device (CCD)-based Actinic Flux Spectrometer (CAFS) for NO2 photolysis frequencies (), the Airborne Tropospheric Hydrogen Oxides Sensor (ATHOS) for OH and HO2 concentrations and OH reactivity (OHR) (Faloona et al., 2004; Mao et al., 2009), Differential Absorption Carbon monOxide Measurement (DACOM) for CO concentrations (Sachse et al., 1987), the High-Resolution Time-of-Flight Aerosol Mass Spectrometer (CU HR-ToF-AMS) for sulfate, nitrate, and ammonium aerosols (DeCarlo et al., 2006; Nault et al., 2018), and the CF3O− Chemical Ionization Time-of-Flight Mass Spectrometer (CIT-ToF-CIMS) for H2O2 concentrations (Crounse et al., 2006). The stated uncertainties for these measurements are 5 % for NO2, 30 pptv + 20 % for NO, 5 ppbv + 10 % for O3, 12 % for , 32 % for HOx, 0.8 s−1 for OHR, 2 % (or 2 ppbv) for CO, 34 % for sulfate, nitrate, and ammonium aerosols, and 30 % for H2O2. Both TD-LIF and NOxyO3Chemiluminescence measured NO2 concentrations, and both are known for positive interferences at high altitudes from CH3O2NO2 and HNO4 dissociation (Reed et al., 2016; Nussbaumer et al., 2021). We use the TD-LIF measurements in this work since they detect NO2 directly and attempt to correct for positive interference (Nault et al., 2015). We also use surface NO2 concentrations from a Teledyne T500U Cavity-Attenuated Phase Shift (CAPS) analyzer located at Olympic Park in the SMA.
2.2 GEOS-Chem model
We use GEOS-Chem version 13.3.4 (v13.3.4; https://doi.org/10.5281/zenodo.5764874, The International GEOS-Chem User Community, 2021) driven by the Goddard Earth Observing System – Forward Processing (GEOS-FP) assimilated meteorological data with a horizontal resolution of 0.25∘ × 0.3125∘ and 72 vertical levels up to the mesopause, including 14 levels below 2 km altitude. The native resolution is used over the Korean Peninsula and the surrounding ocean (29–40∘ N, 120–135∘ E) with dynamic boundary conditions updated every 3 h from a global 4∘ × 5∘ simulation. The simulation is conducted for April–June 2016 following 6 months of initialization. Emissions in GEOS-Chem are calculated by the Harmonized Emissions Component (HEMCO) (Lin et al., 2021). Global anthropogenic emissions are from the Community Emissions Data System (CEDSv2) (McDuffie et al., 2021), superseded in China by the Multi-resolution Emission Inventory (MEIC; Zheng et al., 2018), and for the rest of Asia including shipping by the KORUSv5 inventory (Woo et al., 2020). We apply a diurnal profile of NOx emission rates derived from an emission inventory for the SMA (Goldberg et al., 2019). Natural emissions are from Guenther et al. (2012) for biogenic VOCs (MEGANv2), Murray et al. (2012) for lightning NOx, Hudman et al. (2012) for soil NOx, and Jaeglé et al. (2011) for sea-salt aerosol (SSA) as Na+. GEOS-Chem v13.3.4 includes a detailed oxidant–aerosol chemical mechanism with recent updates for halogen chemistry (Wang et al., 2021), NOx heterogeneous and cloud chemistry (Holmes et al., 2019), isoprene chemistry (Bates and Jacob, 2019), and aromatic chemistry (Bates et al., 2021). We introduce additional updates as described below.
Several previous studies have used GEOS-Chem to simulate and interpret KORUS-AQ observations. Choi et al. (2019) studied local and transboundary sources of fine particulate matter (PM2.5). Zhai et al. (2021) analyzed aerosol vertical profiles for the interpretation of satellite aerosol optical depth (AOD) observations. Travis et al. (2022) found a large model overestimate of nitrate and an underestimate of sulfate aerosols. Park et al. (2021) showed systematic low biases in simulated CO and O3 concentrations at all altitudes. Oak et al. (2019) found that correcting the daytime planetary boundary layer (PBL) height and increasing NOx emission (since corrected in the KORUSv5 inventory) led to a more accurate simulation of surface O3 concentration. Kim et al. (2022) found that simulated OHR was too low and attributed this to underestimates of CO and oxygenated VOC (OVOC) emissions. Model comparison to formaldehyde (HCHO) observations from the aircraft also found an underestimate in emissions of anthropogenic VOCs (aVOCs) (Kwon et al., 2021).
Here we make four updates to the standard GEOS-Chem model to better represent the oxidant chemistry over South Korea: (1) addition of NO photolysis, (2) uptake of HNO3 by coarse anthropogenic dust, (3) VCP emissions, and (4) HO2 heterogeneous uptake by aerosols. We describe each of them in order.
We incorporate NO photolysis into the model following Shah et al. (2023). Observations in marine air show high nitrous acid (HONO) concentrations that have been attributed to NO photolysis, with support from laboratory experiments, in particular for Cl-containing aerosol (Zhou et al., 2008; Ye et al., 2016; Reed et al., 2017). Kasibhatla et al. (2018) initially added NO photolysis in coarse SSA as an option in GEOS-Chem. Shah et al. (2023) extended this to all NO aerosols to correct a low model bias for NOx concentrations in the remote troposphere. They express the NO photolysis frequency () as the HNO3 photolysis frequency () multiplied by an enhancement factor (EF): . An EF of 100 is applied for coarse-mode (>1 µm) sea-salt NO aerosol. For fine-mode NO aerosol, which in GEOS-Chem is an internal mixture of sulfate–nitrate–ammonium (SNA) and fine sea salt, the EF is calculated using Eq. (1):
[ ] denotes a molar concentration and [SSA] = 2.39[Na+] (Na+ is the inert SSA tracer in GEOS-Chem). Our resulting mean EF value for the fine-mode NO aerosol along the KORUS-AQ flight tracks is 15. Romer et al. (2018) inferred a non-SSA EF value in the range of 1–30 from the ratio of NOx to total inorganic nitrate concentrations measured in KORUS-AQ over the Yellow Sea.
We add HNO3 uptake by anthropogenic coarse particulate matter (PM10–PM2.5) following Zhai et al. (2023). Coarse particulate matter measured by the surface air quality network in South Korea is on average 20 µg m−3, and most is anthropogenic fugitive dust that would take up HNO3 similarly to natural dust (Fairlie et al., 2010). Zhai et al. (2023) found that they could correct in this manner most of the previously identified high model biases for HNO3 and NO during KORUS-AQ.
Non-industrial VCPs (e.g., adhesives, cleaning agents, coatings, pesticides, printing inks, and personal care products) are missing from the KORUSv5 emission inventory. We add them here based on per capita emission estimates from McDonald et al. (2018) and Coggon et al. (2021), as incorporated into GEOS-Chem by Bates et al. (2022). Observations in the SMA suggest that these VCP emissions are important (Kim et al., 2016; Simpson et al., 2020), and we find in GEOS-Chem that they account for 97 % of ethanol anthropogenic emissions, 94 % of acetone, 31 % of toluene, and 90 % of methanol. The VCPs are emitted following a diurnal emission profile from Coggon et al. (2021). Oxidation of VCP ethanol is a major source of acetaldehyde for the conversion of NOx into peroxyacetyl nitrate (PAN) (Zhai et al., 2022). Oak et al. (2019) and Schroeder et al. (2020) found toluene to dominate O3 production in the SMA.
Finally, we decrease the reactive uptake coefficient γ of HO2 () by aerosols to 0.1, as compared to 0.2 in the standard GEOS-Chem model (Martin et al., 2003; Mao et al., 2010). As we will show in Sect. 3, gives a better fit to the HO2 observations and their relationship with aerosol concentrations in KORUS-AQ. Brune et al. (2022) used a box model to show that is too high for simulating HO2 observations in KORUS-AQ. A value of 0.1 is within the range of current knowledge (Lakey et al., 2015; Zou et al., 2019; Taketani et al., 2012). Reactive uptake of HO2 by aerosol can have either H2O or H2O2 as a product, and GEOS-Chem assumes H2O by default to avoid overestimation of H2O2 observations (Mao et al., 2010, 2013). This is supported for the KORUS-AQ conditions by previous model studies finding that the assumption of H2O2 as a product of HO2 heterogeneous uptake leads to a large overestimate of observed H2O2 concentrations (Miyazaki et al., 2019; Gaubert et al., 2020).
Underestimation of CO in the Northern Hemisphere is a common problem for CTMs (Shindell et al., 2006; Huijnen et al., 2010), and this was also found for GEOS-Chem in KORUS-AQ throughout the tropospheric column (Park et al., 2021; Kim et al., 2022). This could be due to missing CO sources in East Asia (Gaubert et al., 2020; Park et al., 2021), missing VOC emissions (Huijnen et al., 2010), and/or excessive OH concentrations (Naik et al., 2013). Here we find that a 50 % increase at all altitudes in the GEOS-Chem CO concentrations used as boundary conditions corrects the model bias for simulating KORUS-AQ observations. We adopt this correction in our simulation.
2.3 Air mass factor calculation
The AMF is a crucial component of satellite retrievals of the tropospheric NO2 VCD Ωv (molecules cm−2). Spectral fitting of backscattered radiances along the line of sight of the instrument measures a total atmospheric SCD, from which the stratospheric contribution is removed to yield a tropospheric NO2 SCD Ωs. The AMF then applies a radiative transfer model together with independent information on the NO2 vertical profile to derive Ωv:
The AMF depends on the viewing geometry, the scattering properties of the surface and the atmosphere, and the vertical distribution of NO2, as given by Palmer et al. (2001):
Here AMFG is the geometric AMF assuming no atmospheric scattering and is a function of solar zenith angle (SZA) and viewing zenith angle (VZA). w(z) is a scattering weight that measures the relative sensitivity of the backscattered radiance measured from space to the NO2 optical depth at altitude z, averaged over the wavelength range of the spectral fitting window (Lamsal et al., 2021). is a shape factor for the vertical distribution of the NO2 number density n(z), and the integration is from the surface to the tropopause zT. The scattering weights are such that w(z)=1 for all z in a non-scattering atmosphere, in which case AMF = AMFG is solely defined by the geometric light path from the sun to the satellite as reflected by the surface. We will refer to in what follows as the scattering correction factor.
Here we use shape factors S(z) from the KORUS-AQ vertical profiles, either observed from the aircraft or simulated with GEOS-Chem, to compute the AMF. The scattering weights w(z) are obtained from the OMI NO2 retrieval lookup table (LUT) as a function of SZA, VZA, relative azimuth angle (RAA), surface pressure, and albedo (Bucsela et al., 2006, 2013). We compute SZA, VZA, and RAA for the locations and times of the KORUS-AQ aircraft profiles and the geostationary location of the GEMS satellite instrument (128∘ E longitude, 0∘ latitude, 35 786 km mean altitude). We assume a surface pressure of 1013 hPa. The surface albedo is determined from OMI Level-3 Lambertian-equivalent reflectivity (LER) climatology (OMLER; Kleipool et al., 2008) for June and the locations of the KORUS-AQ profiles. The tropopause is assumed to be at 12 km altitude, but results are insensitive to that assumption because the bulk of the NO2 tropospheric column is in the PBL.
Our specific interest in computing AMFs for the KORUS-AQ conditions is for application to GEMS retrievals. The spectral retrieval windows for OMI (402–465 nm) and GEMS (432–450 nm) have a sufficient overlap that we can assume the scattering weights to be similar for our analysis, considering that the wavelength dependence of scattering weights is weak (Palmer et al., 2001). We focus our attention on clear-sky scenes for a Rayleigh atmosphere without aerosol scattering. Retrieval for partly cloudy scenes in the GEMS algorithm uses a cloud albedo (0.8) instead of the surface albedo for the cloudy fraction of the scene, assumes w(z)=0 below the cloud top, and weighs the clear-sky and cloudy scattering weights by their relative contributions to the backscattered radiances (Martin et al., 2002; Lee et al., 2020). Our focus on clear-sky scenes does not detract from the generality of our results, since the extension to partly cloudy scenes is straightforward, except for the possible role of the cloud in altering the NO2 vertical profile, but this is generally not considered in retrieval algorithms.

Figure 1Relationship of HO2 and sulfate–nitrate–ammonium (SNA) aerosol concentrations below 2 km altitude during KORUS-AQ. Panel (a) shows the ensemble of observations from the ATHOS and AMS instruments. Panels (b) and (c) show GEOS-Chem model results with HO2 reactive uptake coefficients () of 0.2 (b) and 0.1 (c).
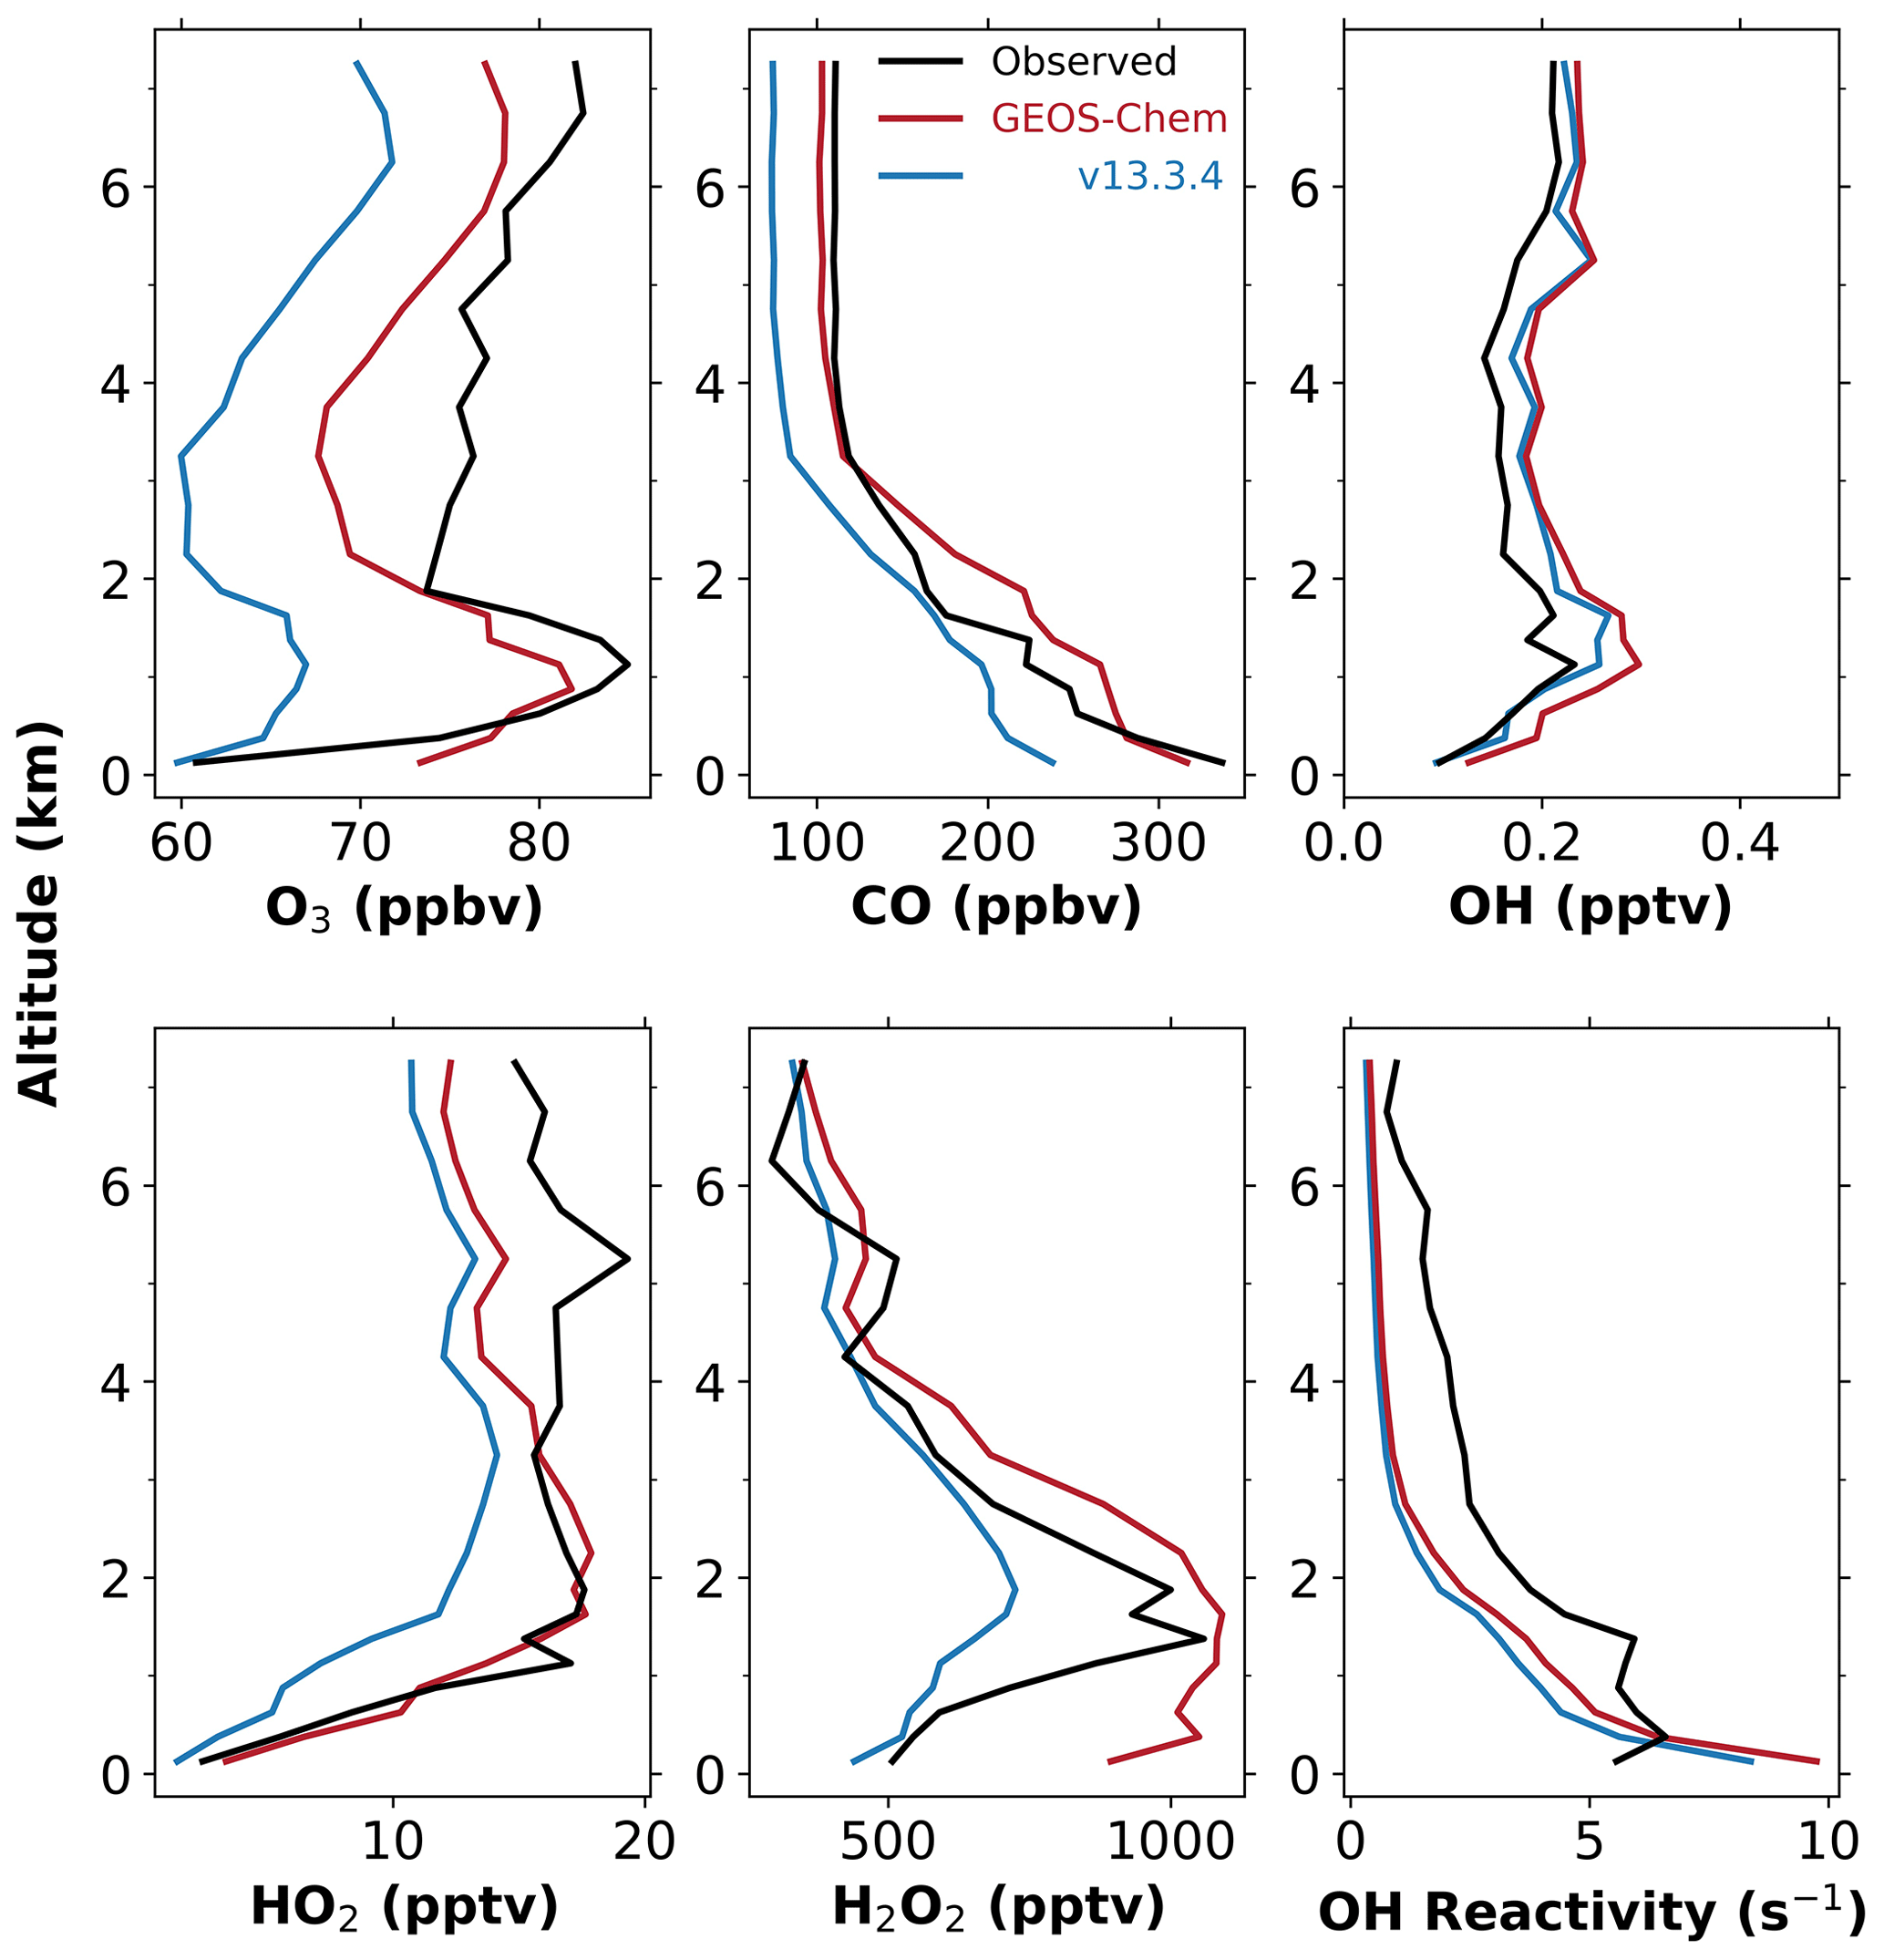
Figure 2Median vertical profiles of species concentrations and OH reactivity (OHR) in the Seoul metropolitan area (SMA; 37–37.6∘ N, 126.6–127.7∘ E) during KORUS-AQ. Observations are compared to our GEOS-Chem simulation and to the standard version 13.3.4 of the model. Here and in the following figures, vertical profiles are constructed by binning the data into 0.25 km vertical intervals below 2 km altitude and 1 km vertical intervals above 2 km altitude.
3.1 Oxidant chemistry and NOx vertical profiles during KORUS-AQ
Figure 1 shows the relationship between HO2 and SNA aerosol concentrations as observed in KORUS-AQ (panel a) and simulated by GEOS-Chem (panels b and c). The model with (panel b) shows depression of HO2 concentrations at high aerosol concentrations when uptake by aerosol is the dominant HOx sink, but that depression is not seen in the observations. The model with (panel c) corrects this behavior. Figure 2 shows the median simulated (red line) and observed (black line) vertical profiles of oxidants and related quantities in the SMA during KORUS-AQ, highlighting the effects of model updates on the standard GEOS-Chem v13.3.4 (blue line). Results outside the SMA are in Fig. S1 and show similar behavior.
We see from Fig. 2 that the low-O3 background bias previously reported by Park et al. (2021) is largely corrected, mainly from the inclusion of NO photolysis in the global simulation used as boundary conditions (Shah et al., 2023). The simulated O3 enhancement in the PBL below 2 km matches observations much better than GEOS-Chem v13.3.4, and this is mostly driven by higher HO2 concentrations, with some additional contribution from VCPs and higher CO reflected in the OHR. The higher HO2 concentrations relative to GEOS-Chem v13.3.4 are due to a combination of slower heterogeneous uptake, the addition of VCP emissions, feedback from increasing O3, and an increase in CO concentrations. Sensitivity simulations show that each of these factors contributes a 1–2 pptv increase in HO2 concentration. An increase in HO2 concentration drives an increase in H2O2 concentration, which was previously underestimated by 21 % in the PBL (averaging over altitudes below 2 km) and is now overestimated by 42 %. An increase in the H2O2 deposition velocity could reconcile the model and observations (Allen et al., 2022). Simulated OH concentrations are 31 % higher than observed (averaging over all altitudes), which is still within the accuracy of the measurement; there is little difference between our simulation and GEOS-Chem v13.3.4 for OH because higher HOx concentrations are offset by an increase in the OHR. The OHR is still lower than observed (Kim et al., 2022).

Figure 3Median vertical profiles of NO and NO2 concentrations (a, b) and concentration ratios (c) in the SMA (37–37.6∘ N, 126.6–127.7∘ E) during the KORUS-AQ campaign. Observations are compared to our GEOS-Chem simulation and the standard version 13.3.4 of the model. PSS for the ratio denotes a photochemical steady state as given by Eq. (4) and is computed mainly from observed quantities. Observed ratios and PSS are computed only if both species are more than 2 times above the limit of detection.
Figure 3 shows the median simulated (red line for GEOS-Chem; blue line for GEOS-Chem v13.3.4) and observed (black line) vertical profiles of NO (panel a) and NO2 (panel b) concentrations in the SMA together with the concentration ratios (panel c). The same plot outside the SMA is shown in Fig. S2, and the conclusions regarding the ratio are similar. NO and NO2 are mainly in the PBL. The model underestimates NO2 concentrations slightly in the SMA, which could have to do with the 25 km spatial resolution since that underestimate is not seen outside the SMA. There is no significant difference in simulated NO2 concentrations between our updated GEOS-Chem model and the standard GEOS-Chem version 13.3.4, but our updated model provides a better simulation of the observed ratio. The ratio is expected to be governed in the daytime by a photostationary steady state (PSS) between the fast oxidation of NO and photolysis of NO2:
RO2 denotes organic peroxy radicals and X denotes halogens. PSS is then defined by
[ ] denotes number density, k denotes rate constants (Burkholder et al., 2020), and the summations Σ are applied to all RO2 or XO species. Figure 3c shows the PSS (gold line) computed from aircraft measurements, except for [XO] and [RO2], which are from GEOS-Chem but contribute generally less than 4 % of the conversion from NO to NO2.
We see from Fig. 3c that the ratio increases with altitude, which largely reflects the temperature dependence of the NO + O3 reaction (Burkholder et al., 2020). Our updated model closely tracks the PSS, but the observations deviate above 5 km. This may be attributed to positive artifacts in the TD-LIF NO2 instrument at low temperatures (Shah et al., 2023). We conclude that the PSS assumption applied to the more accurate NO concentration measurements provides a better estimate of NO2 concentrations above that altitude. Hereafter, we replace the NO2 observations above 5 km altitude with values inferred from the observed NO concentrations and PSS.

Figure 4Sensitivity of the tropospheric NO2 column measured from space to the vertical distribution of NO2. Panel (a) shows the mean clear-sky scattering weights (w(z) in Eq. 3) for the ensemble of observed vertical profiles over the SMA during KORUS-AQ. The scattering weights represent the altitude-dependent sensitivity of the detected slant column to NO2 optical depth, which is proportional to number density. Panel (b) shows observed and simulated median vertical profiles of NO2 number density in the SMA during KORUS-AQ. Panel (c) shows the fractional cumulative contribution to the NO2 slant tropospheric column density (SCD; Ωs in Eq. 2) from NO2 below a given altitude in the SMA. The air mass factors (AMFs; Eq. 3) given in the inset are obtained by applying the scattering weights from panel (a) to the shape factors from panel (b) and including a mean geometric AMFG of 2.70. Observed NO2 number densities between 5 and 7 km are inferred from NO observations and by applying PSS (Eq. 4). No observations were made above 7 km, and GEOS-Chem values are used there instead.
3.2 Air mass factors for satellite NO2 retrievals and their diurnal variation
Figure 4 shows the median vertical profile of simulated (red line), observed (black line), and standard GEOS-Chem v13.3.4 (blue line) NO2 number density in the SMA during KORUS-AQ (panel b) along with the scattering weights for satellite retrievals (panel a) and the cumulative vertical contributions to the tropospheric slant column, as would be detected from a satellite instrument (panel c). No observations are available above 7 km, and GEOS-Chem is used there instead. The differences between our updated GEOS-Chem simulation and the standard GEOS-Chem v13.3.4 are minuscule. The clear-sky scattering weights (panel a) represent the sensitivity of the instrument to NO2 as a function of altitude and increase by a factor of 2.4 from the surface to 6 km altitude because of Rayleigh scattering. The fractional cumulative contribution to the tropospheric slant column density (Ωs in Eq. 2) is calculated as and represents the fraction of the measured column contributed by NO2 below altitude z. NO2 in the PBL below 2 km contributes 95 % of the SCD over the SMA and 80 % of the SCD for the ensemble of KORUS-AQ observations, reflecting the highly polluted conditions (panel c). Previous work over the southeastern US in the summer found that the PBL contributed only 20 %–35 % of the SCD (Travis et al., 2016), complicating the inference of NOx emissions from NO2 satellite observations (Silvern et al., 2019; Qu et al., 2021). This is much less of an issue for South Korea. The AMF inferred from the median observed NO2 vertical profile in the SMA during KORUS-AQ is 1.18, in close agreement with the corresponding value of 1.22 from GEOS-Chem.
GEMS offers the first opportunity to directly observe the diurnal variation of NO2 from space, but it is important to understand how much the AMF contributes to this diurnal variation and how well this is resolved by the model used to obtain shape factors. During the KORUS-AQ campaign, repeated flights in the morning (08:00–09:00 LT), at midday (12:00–13:00 LT), and in the afternoon (15:00–16:00 LT) were conducted on 10 d over two supersites: Olympic Park (37.5232∘ N, 127.1260∘ E) and Mt. Taewha (37.3123∘ N, 127.3106∘ E) (Crawford et al., 2021). Olympic Park is in the SMA, and Mt. Taewha is a research forest site 29 km southeast of Olympic Park. Mt. Taewha is affected by SMA air pollution through downwind transport. The flight patterns involved missed landing approaches to very low flight altitudes over Olympic Park followed by spiral ascents to the east of Mt. Taewha up to 7 km altitude (Crawford et al., 2021). To construct the diurnal variation of the NO2 vertical profile over the SMA and its implication for the AMF, we combine the Olympic Park vertical profiles (typically z<2 km) with the spirals east of Mt. Taewha. A similar approach was taken to investigate HCHO AMFs using KORUS-AQ campaign data (Spinei et al., 2018). We also use the surface NO2 data from Olympic Park.
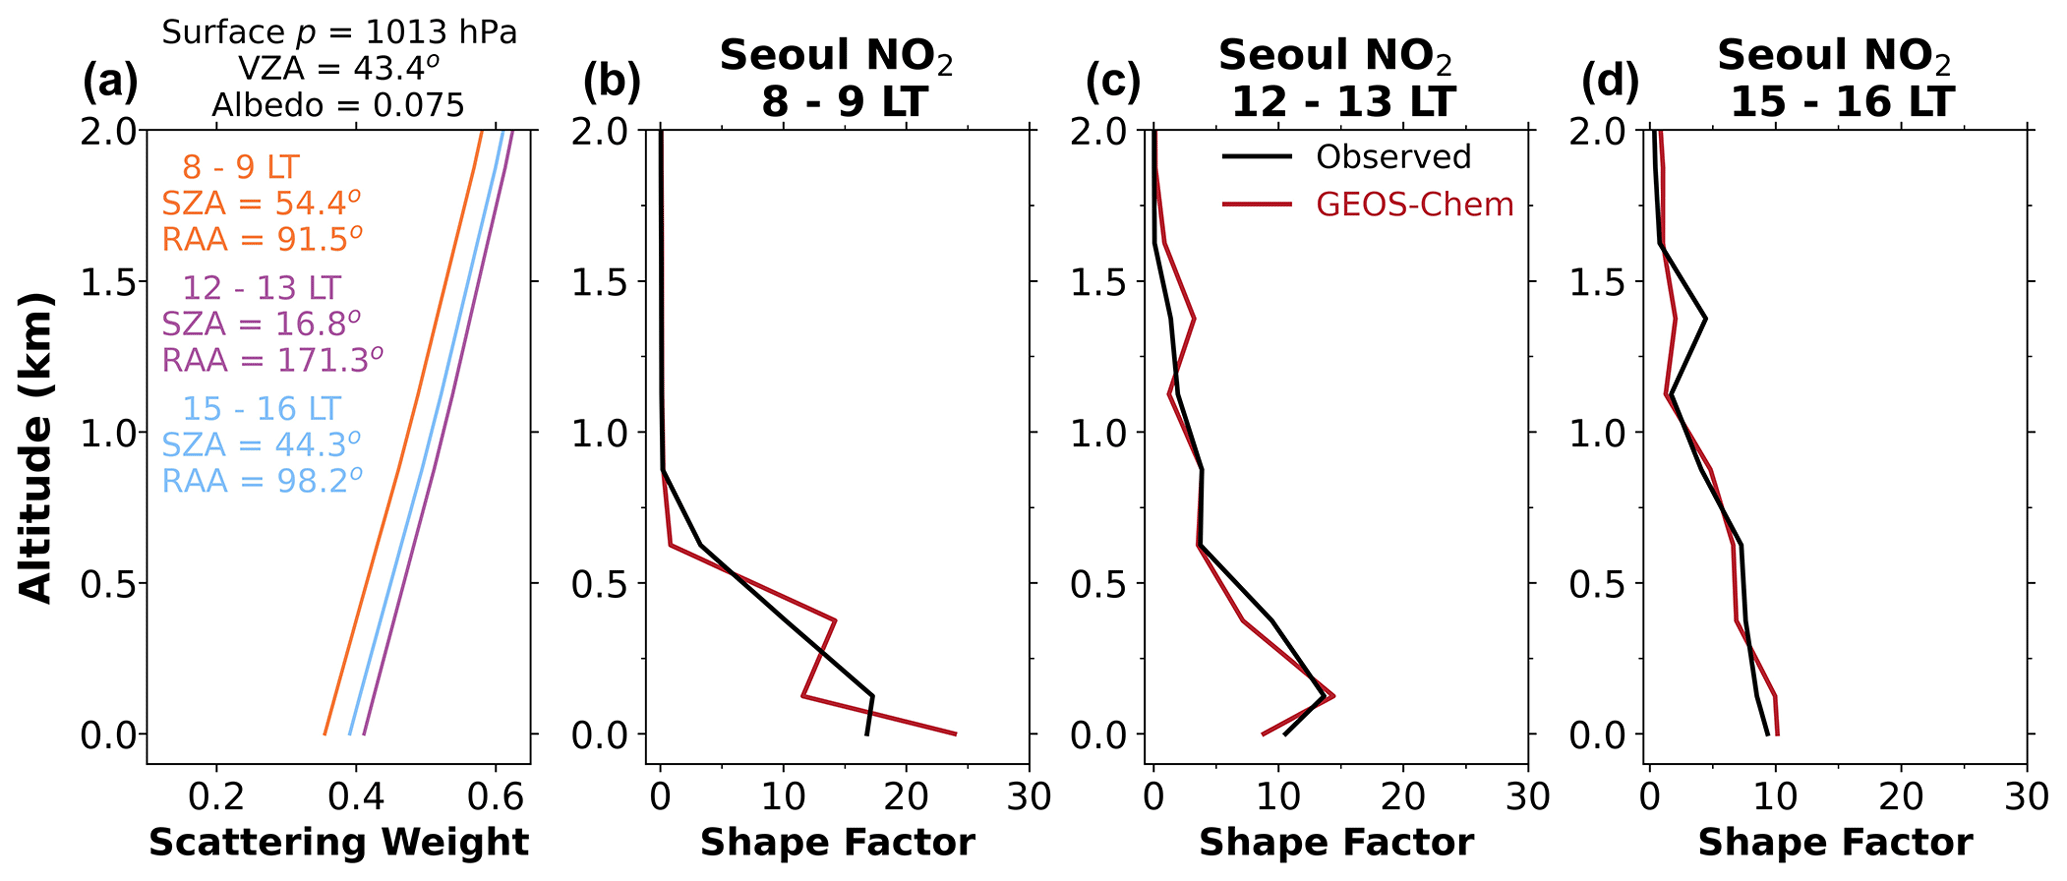
Figure 5Factors controlling the diurnal variation of the air mass factor (AMF) for GEMS satellite retrieval of tropospheric NO2 over the SMA. The figure shows clear-sky scattering weights w(z) over Olympic Park in the SMA at different times of day with the GEMS viewing geometry (a) and vertical shape factors S(z) computed from median vertical profiles of NO2 number densities at different times of day (a–c). Observations are from 10 KORUS-AQ flights that repeated the same flight pattern of vertical profiling under clear-sky conditions (4, 7, 17, 18, 30, 31 May; 2, 3, 9, 10 June) at 08:00–09:00 local time (LT), 12:00–13:00 LT, and 15:00–16:00 LT. SZA and RAA are averaged over the corresponding vertical profiles. The clear-sky scattering weights are taken from the OMI TOMRAD lookup table. The shape factor is extended to the surface by using the surface air NO2 concentration measured at Olympic Park station.
Figure 5a shows the clear-sky scattering weights w(z) at 08:00–09:00 LT (orange line), 12:00–13:00 LT (purple line), and 15:00–16:00 LT (light-blue line). In addition to the dependence on altitude, the scattering weights show a dependence on the time of day driven by the SZA and RAA, such that the sensitivity to near-surface NO2 at 08:00–09:00 LT is 14 % lower than at 12:00–13:00 LT. Figure 5 also shows the vertical shape factors S(z) computed from the median vertical distributions of simulated (red line) and observed (black line) NO2 number densities at 08:00–09:00 LT (panel b), 12:00–13:00 LT (panel c), and 15:00–16:00 LT (panel d). The NO2 vertical profiles follow the rise in the mixed layer from early morning to early afternoon in response to surface heating, with higher near-surface concentrations in the morning when the mixed layer is shallow and lower surface concentrations in the afternoon due to deeper vertical mixing. Observations during KORUS-AQ indicated a mean mixed-layer height at 08:00–09:00 LT of about 0.6 km, rising to about 1.7 km in the early afternoon (Travis et al., 2022).
Although surface NO2 peaks strongly in the morning (Fig. 5b), the NO2 VCDs observed from ground-based sun-staring column measurements in the SMA from Chong et al. (2018) and Crawford et al. (2021) show an increase from early morning to 11:00 LT, steady concentrations until 14:00 LT, and a slight decrease afterward. Vertical mixing would not directly affect the column, and the increase in the column over the morning could reflect the effect of accumulating emissions. An important difference between the ground-based and satellite measurements of NO2 columns is that there is no vertical dependence of NO2 sensitivity for the former.
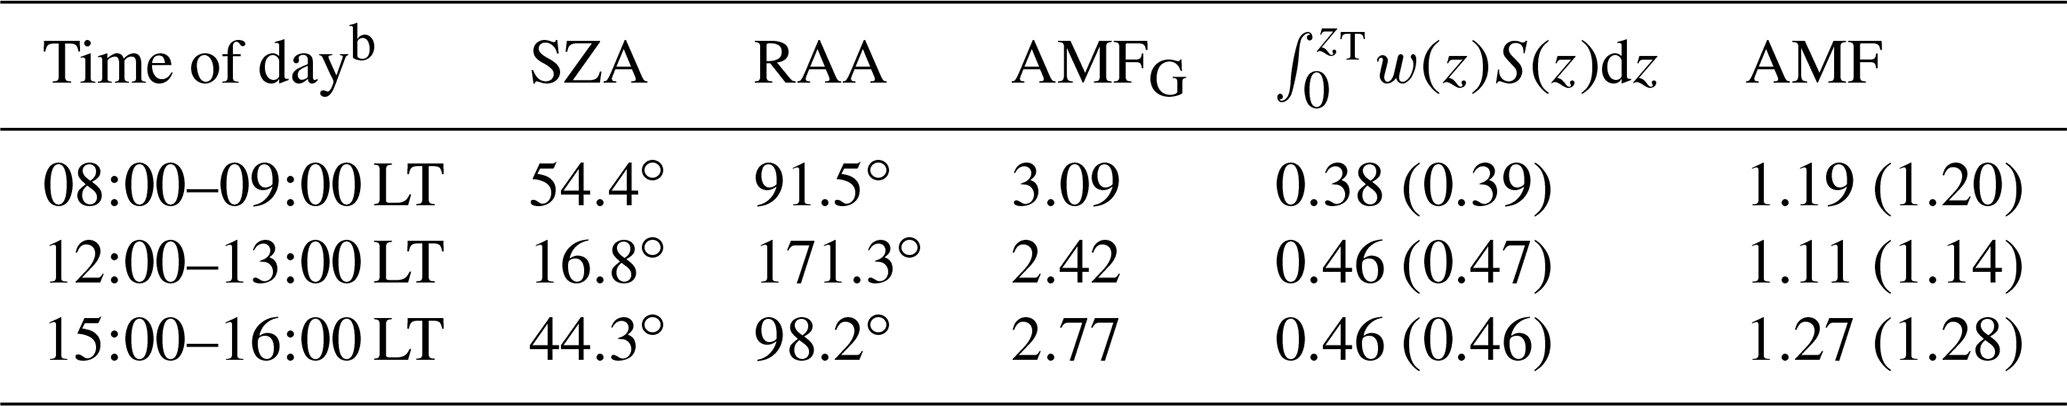
Table 1Diurnal variation of the air mass factor (AMF) for satellite NO2 retrievalsa.
a Inferred from the median observed vertical profiles of NO2
concentrations over the SMA taken during KORUS-AQ at different times of day (Fig. 5). GEOS-Chem model values are in parentheses. The table shows the AMF as computed from Eq. (3) and the contributions from the diurnally
varying factors affecting its computation at the three different times of
the day, including solar zenith angle (SZA), relative azimuth angle (RAA), geometric AMF (AMFG), and scattering correction factor
(, with the scattering
weights computed for clear sky). All computations use a surface albedo of
0.075, a viewing zenith angle (VZA) of 43.4∘, and a surface
pressure of 1013 hPa invariant with the time of day.
b Local time (LT) is Korean Standard Time (KST). Solar noon was at 12:20 KST during the KORUS-AQ period.
Table 1 shows the AMF diurnal variation inferred from the NO2 vertical profiles in Fig. 5 for the three different times of day (panels b, c, and d). This diurnal variation is driven by three factors: (1) the dependence of the light path on SZA (AMFG), (2) the dependence of the scattering weights w(z) on SZA and RAA, and (3) the dependence of the shape factors S(z) on the diurnal cycle of mixed-layer growth. The scattering correction factor in Table 1 captures the combined effects of w(z) and S(z). From a purely geometric perspective (non-scattering atmosphere), as measured by AMFG, the measurement would be 28 % more sensitive in the morning than at midday because of the longer light path. However, this effect is offset by the scattering correction factor, which is 17 % smaller in the morning than at midday, because NO2 in the morning is closer to the surface and therefore harder to detect. As a result, the AMF is only 7 % higher in the morning than at midday. There is no such offsetting effect from midday to afternoon since the NO2 vertical profiles are similar at midday and in the afternoon. Thus, the AMF in the afternoon is 14 % larger than at midday.
The relative diurnal variations of the tropospheric NO2 VCDs (22 %; Crawford et al., 2021) and of the scattering correction factor (21 %) are of comparable magnitude, indicating that the diurnal variation in the NO2 vertical profile affecting the AMF is of critical importance when interpreting the diurnal variation of VCDs from the satellite. We see from Table 1 that GEOS-Chem (given in parentheses) reproduces closely the observed diurnal variation of the shape factor and thus of the scattering correction factor and the AMF.
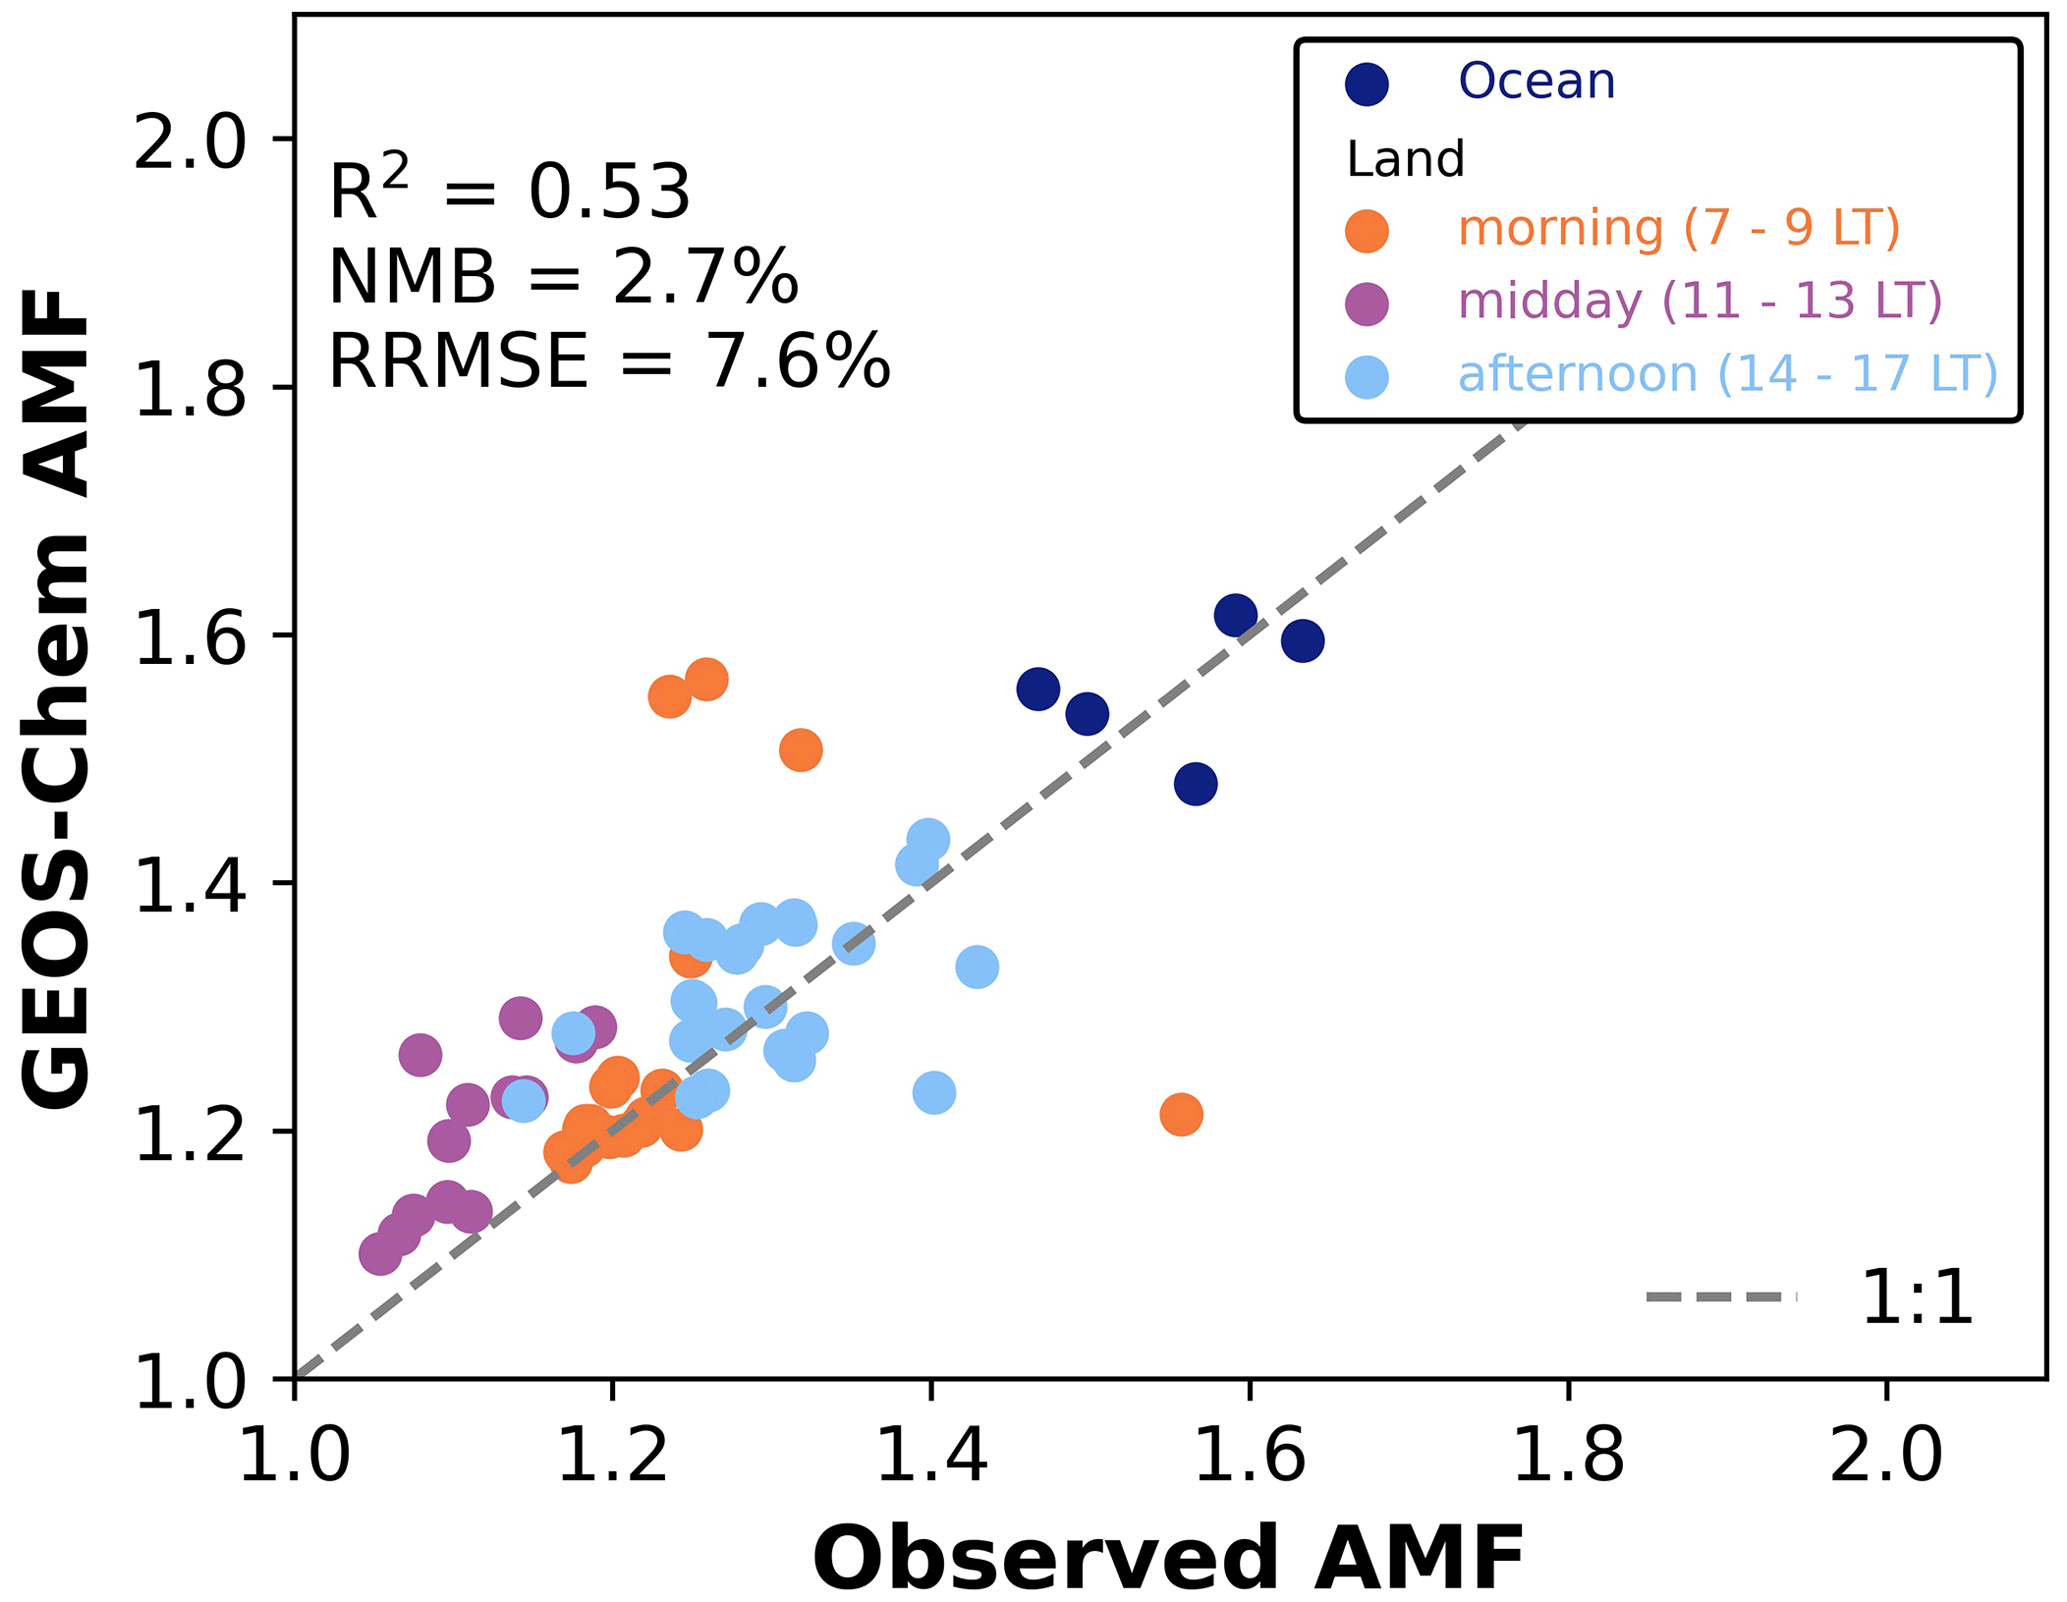
Figure 6Variability of the air mass factor (AMF) for tropospheric NO2 VCD retrievals from satellites as seen in 63 individual KORUS-AQ vertical profiles. The figure compares GEOS-Chem and the observed AMF calculated from Eq. (3). The coefficient of determination (R2), normalized mean bias (NMB), and relative root-mean-square error (RRMSE) are given in the inset. The 1:1 line is shown dashed.
We investigate more broadly in Fig. 6 the observed variability of the AMF, and the ability of GEOS-Chem to reproduce it, for the 63 vertical profiles collected during KORUS-AQ. These include 41 vertical profiles that combine flights over Olympic Park and Mt. Taewha spirals at different times of day, 17 vertical profiles that combine flights over Osan (just south of Seoul) and Mt. Taewha spirals, and 5 vertical profiles over the ocean. All individual profiles extend from below 0.5 km to above 6.5 km. For the Osan and ocean profiles, we extend the aircraft observations from the lowest altitude to the surface as there are no surface measurements. Oceanic data are shown in navy, and the land data are colored by the time of day (07:00–09:00 LT in orange, 11:00–13:00 LT in purple, and 14:00–17:00 LT in light blue).
The observed AMF in Fig. 6 ranges from 1.05 to 1.63, representing a major factor of variability in the retrieved tropospheric NO2 VCDs. The two main drivers of this observed AMF variability are NO2 profile shape, determined by the presence or absence of local sources (ocean versus land), and time of day for land. Oceanic profiles have higher AMFs (mean: 1.55, SD: 0.068) than land (mean: 1.23, SD: 0.097) because the NO2 PBL enhancement is weaker or absent. All KORUS-AQ vertical profiles over land have large NO2 PBL enhancements, and time of day is then the principal driver of variability, as previously discussed. GEOS-Chem captures 53 % of the variance in the observed AMF for individual profiles, and its overall error in computing the AMF is relatively small, with a normalized mean bias (NMB) of 2.7 % and a relative root-mean-square error (RRMSE) of 7.6 %. The largest discrepancies are for four early-morning profiles (07:00–09:00 LT), which are attributable to a model error in the timing of mixed-layer growth (Travis et al., 2022), being either too early (AMF overestimate) or too late (AMF underestimate).
The AMF RRMSE from using GEOS-Chem model NO2 shape factors (Fig. 6) can be placed in the context of other contributions to the AMF error. Boersma et al. (2007) estimated that the AMF contributes a 30 % error to OMI tropospheric NO2 VCD retrievals, but this included contributions from uncertainties in clouds and surface albedo. Uncertainty in the shape factors as computed from the TM4 CTM accounted for 30 % of the AMF error or 9 % of the overall error in the tropospheric NO2 VCD. Our RRMSE of 7.6 % from the use of GEOS-Chem shape factors to compute the AMF under KORUS-AQ conditions is consistent with their results and extends them to observations at different times of the day. Considering that the satellite observations are typically averaged over many days for analysis, which would reduce the RRMSE, a more important consideration is the NMB, which we find to be only 2.7 % with GEOS-Chem. Of most concern is that the interpretation of the diurnal variability of tropospheric NO2 VCDs from space could be affected by large AMF errors in the morning hours due to incorrect model timing of mixed-layer growth. In GEOS-Chem at least, this error does not appear to be systematic, so averaging over multiple days would dampen it.
Our analysis focused on clear-sky conditions. Clouds may dominate the AMF error budget for cloud fractions larger than 20 % corresponding to more than 50 % of the observed radiance originating from the cloudy fraction of the satellite pixel (Boersma et al., 2007). The GEMS algorithm (Lee et al., 2020) computes the AMF for cloudy conditions by assuming scattering weights of zero below the cloud top. The AMF for a partly cloudy scene with radiance-weighted cloud fraction f is then obtained as
zc is the cloud-top altitude and the scattering weights wc above the cloud top are computed using the cloud albedo. Although clouds would be expected to affect the NO2 vertical profile through photolysis, chemistry, and vertical motions, these effects are complex, and we do not find obvious cloud-driven differences in the model or observed NO2 profiles. From a diurnal variability perspective, the afternoon formation of fair-weather cumuli would decrease the sensitivity of the satellite measurement to the PBL (which would not be detected in the cloudy fraction of the scene) and therefore alias the observed diurnal variation of NO2. The exploitation of GEMS data to interpret diurnal variations of tropospheric NO2 VCDs in terms of emissions or chemistry will need to focus on conditions with small cloud fractions.
We used extensive observations of NO2 vertical profiles and related chemistry from the KORUS-AQ aircraft campaign over and around South Korea in May–June 2016 to better understand how the diurnal changes in the vertical distribution of NO2 affect the diurnal variation of air mass factors (AMFs) used for satellite retrievals of tropospheric NO2 vertical column density (VCD) in the polluted East Asian chemical environment. This was motivated by the recent launch of the GEMS geostationary instrument over East Asia, enabling the first direct measurements of the diurnal variation of NO2 from space, and by interest in using the GEOS-Chem chemical transport model (CTM) to provide the NO2 relative vertical profiles (shape factors) needed for the NO2 VCD retrievals. We examined more broadly the role of oxidant chemistry in controlling NO2 concentrations in GEOS-Chem through the photostationary steady-state (PSS) ratio and the lifetime of NOx.
We introduced several updates to GEOS-Chem to improve the model representation of oxidant chemistry over East Asia, drawing on previous evaluations of the standard version of the model with the KORUS-AQ data. The inclusion of aerosol nitrate photolysis in the model corrects the previous underestimate of the O3 background. The standard model depleted HO2 under highly polluted conditions due to uptake by aerosol particles, but this was not seen in observations. Decreasing the HO2 reactive uptake coefficient corrects this model behavior, and model HO2 is further brought into agreement with observations by the addition of volatile chemical product (VCP) chemistry and an increase in CO. The HO2 correction in turn allows the model to simulate the observed O3 enhancement in the planetary boundary layer (PBL) below 2 km altitude. Increasing O3 and HO2 in the model improves the simulation of the PSS ratio.
The KORUS-AQ vertical profiles indicate that 95 % of the cumulative slant column density (SCD) detected from space over the Seoul metropolitan area (SMA) originates from the PBL, despite the much higher sensitivity to NO2 in the free troposphere, reflecting the highly polluted conditions. The diurnal variation of NO2 VCD observed by GEMS should thus provide direct insights into NOx emissions and PBL chemistry in urban areas of East Asia, but this requires correct accounting of the diurnal variation in AMFs. KORUS-AQ offered a unique dataset for addressing this issue, with repeated diurnal vertical profiles over the SMA at different times of the day. We find that the diurnal evolution of the NO2 shape factor resulting from mixed-layer growth drives a 21 % increase in the scattering correction factor from 08:00–09:00 to 12:00–13:00 LT, offsetting the geometric decrease in the resulting AMF from the shorter light path. GEOS-Chem can capture this diurnal variability in the shape factor driven by mixed-layer growth with no significant mean error. Incorrect timing of mixed-layer growth can lead to large errors for individual morning profiles, but averaging over a number of days dampens the error. Unbiased timing of mixed-layer morning growth is important for the computation of the diurnal variation of the AMF.
The AMF values inferred from the collection of KORUS-AQ vertical profiles range from 1.05 to 1.63, with most of that variability driven by ocean versus land and by the time of day over land. GEOS-Chem captures 53 % of this variability in the AMF, with a relative root-mean-square error (RRMSE) of 7.6 % and a normalized mean bias (NMB) of 2.7 %. These errors are relatively small compared to other sources of retrieval errors and support the use of GEOS-Chem vertical profiles in GEMS retrievals. Further evaluation of the GEOS-Chem NO2 profiles over East Asia should be conducted with aircraft campaigns for other regions and seasons, and opportunities will arise with the ASIA-AQ campaign over Korea in the winter of 2024 (NASA, 2021).
The model code used in this work is available at https://doi.org/10.5281/zenodo.5764874 (The International GEOS-Chem User Community, 2021).
The KORUS-AQ data archive is available at https://www-air.larc.nasa.gov/ (last access: 15 February 2023; NASA, 2023) and includes both the ground-based and aircraft-based measurements (https://doi.org/10.5067/Suborbital/KORUSAQ/DATA01; KORUS-AQ Science Team, 2019).
The supplement related to this article is available online at: https://doi.org/10.5194/acp-23-2465-2023-supplement.
The original draft preparation was done by LHY, with review and editing by DJJ, KRT, JHC, JHK, and JK. DJJ contributed to project conceptualization. Modeling was done by LHY with additional support from NKC, SZ, KHB, VS, EB, RMY, and HL. The formal analysis was conducted by LHY with additional support from DJJ, JFB, HC, KRT, and JHC. The LUT used for the scattering weights is provided by LL.
The contact author has declared that none of the authors has any competing interests.
Publisher's note: Copernicus Publications remains neutral with regard to jurisdictional claims in published maps and institutional affiliations.
This material is based upon work supported by the National Science Foundation Graduate Research Fellowship under grant no. DGE 2140743. The authors would like to thank the KORUS-AQ data providers, including Ronald Cohen for TD-LIF, Andrew Weinheimer for NOxyO3Chemiluminescence, Samuel Hall for CAFS, William Brune for ATHOS, Glenn Diskin for DACOM, Benjamin Nault, Pedro Campuzano-Jost, and Jose Jimenez for AMS, Paul Wennberg for CIT-CIMS, and Russell Long for CAPS.
This research has been supported by the Samsung Advanced Institute of Technology.
This paper was edited by Barbara Ervens and reviewed by three anonymous referees.
Allen, H. M., Bates, K. H., Crounse, J. D., Kim, M. J., Teng, A. P., Ray, E. A., and Wennberg, P. O.: H2O2 and CH3OOH (MHP) in the Remote Atmosphere: 2. Physical and Chemical Controls, J. Geophys. Res.-Atmos., 127, e2021JD035702, https://doi.org/10.1029/2021JD035702, 2022.
Bates, K. H. and Jacob, D. J.: A new model mechanism for atmospheric oxidation of isoprene: global effects on oxidants, nitrogen oxides, organic products, and secondary organic aerosol, Atmos. Chem. Phys., 19, 9613–9640, https://doi.org/10.5194/acp-19-9613-2019, 2019.
Bates, K. H., Jacob, D. J., Li, K., Ivatt, P. D., Evans, M. J., Yan, Y., and Lin, J.: Development and evaluation of a new compact mechanism for aromatic oxidation in atmospheric models, Atmos. Chem. Phys., 21, 18351–18374, https://doi.org/10.5194/acp-21-18351-2021, 2021.
Bates, K. H., Specht, I., Jacob, D., Hornbrook, R., and Apel, E.: Sources and chemistry of ethanol, International GEOS-Chem Conference 10, St. Louis, USA, 6–10 June 2022, https://geos-chem.seas.harvard.edu/files/acmg-geos/files/igc10-d1-p07-bates.pdf (last access: 15 February 2023), 2022.
Boersma, K. F., Eskes, H. J., Veefkind, J. P., Brinksma, E. J., van der A, R. J., Sneep, M., van den Oord, G. H. J., Levelt, P. F., Stammes, P., Gleason, J. F., and Bucsela, E. J.: Near-real time retrieval of tropospheric NO2 from OMI, Atmos. Chem. Phys., 7, 2103–2118, https://doi.org/10.5194/acp-7-2103-2007, 2007.
Boersma, K. F., Jacob, D. J., Eskes, H. J., Pinder, R. W., Wang, J., and van der A, R. J.: Intercomparison of SCIAMACHY and OMI tropospheric NO2 columns: Observing the diurnal evolution of chemistry and emissions from space, J. Geophys. Res., 113, D16S26, https://doi.org/10.1029/2007JD008816, 2008.
Boersma, K. F., Eskes, H. J., Richter, A., De Smedt, I., Lorente, A., Beirle, S., van Geffen, J. H. G. M., Zara, M., Peters, E., Van Roozendael, M., Wagner, T., Maasakkers, J. D., van der A, R. J., Nightingale, J., De Rudder, A., Irie, H., Pinardi, G., Lambert, J.-C., and Compernolle, S. C.: Improving algorithms and uncertainty estimates for satellite NO2 retrievals: results from the quality assurance for the essential climate variables (QA4ECV) project, Atmos. Meas. Tech., 11, 6651–6678, https://doi.org/10.5194/amt-11-6651-2018, 2018.
Bovensmann, H., Burrows, J. P., Buchwitz, M., Frerick, J., Noël, S., Rozanov, V. V., Chance, K. V., and Goede, A. P. H.: SCIAMACHY: Mission Objectives and Measurement Modes, J. Atmos. Sci., 56, 127–150, https://doi.org/10.1175/1520-0469(1999)056<0127:SMOAMM>2.0.CO;2, 1999.
Brune, W. H., Miller, D. O., Thames, A. B., Brosius, A. L., Barletta, B., Blake, D. R., Blake, N. J., Chen, G., Choi, Y., Crawford, J. H., Digangi, J. P., Diskin, G., Fried, A., Hall, S. R., Hanisco, T. F., Huey, G. L., Hughes, S. C., Kim, M., Meinardi, S., Montzka, D. D., Pusede, S. E., Schroeder, J. R., Teng, A., Tanner, D. J., Ullmann, K., Walega, J., Weinheimer, A., Wisthaler, A., and Wennberg, P. O.: Observations of atmospheric oxidation and ozone production in South Korea, Atmos. Environ., 269, 118854, https://doi.org/10.1016/j.atmosenv.2021.118854, 2022.
Bucsela, E. J., Celarier, E. A., Wenig, M. O., Gleason, J. F., Veefkind, J. P., Boersma, K. F., and Brinksma, E. J.: Algorithm for NO2 vertical column retrieval from the ozone monitoring instrument, IEEE T. Geosci. Remote, 44, 1245–1258, https://doi.org/10.1109/TGRS.2005.863715, 2006.
Bucsela, E. J., Krotkov, N. A., Celarier, E. A., Lamsal, L. N., Swartz, W. H., Bhartia, P. K., Boersma, K. F., Veefkind, J. P., Gleason, J. F., and Pickering, K. E.: A new stratospheric and tropospheric NO2 retrieval algorithm for nadir-viewing satellite instruments: applications to OMI, Atmos. Meas. Tech., 6, 2607–2626, https://doi.org/10.5194/amt-6-2607-2013, 2013.
Burkholder, J. B., Sander, S. P., Abbatt, J. P. D., Barker, J. R., Cappa, C., Crounse, J. D., and Dibble, T. S.: Chemical kinetics and photochemical data for use in atmospheric studies; evaluation number 19, NASA Jet Propulsion Laboratory, http://hdl.handle.net/2014/49199 (last access: 15 February 2023), 2020.
Burrows, J. P. and Chance, K. V.: SCIAMACHY and GOME: The scientific objectives, Optical Methods in Atmospheric Chemistry, 1715, 502–512, https://doi.org/10.1117/12.140201, 1993.
Callies, J., Corpaccioli, E., Eisinger, M., Hahne, A., and Lefebvre, A.: GOME-2-Metop's Second-Generation Sensor for Operational Ozone Monitoring, ESA bulletin, 102, 28–36, 2000.
Choi, J., Park, R. J., Lee, H.-M., Lee, S., Jo, D. S., Jeong, J. I., Henze, D. K., Woo, J.-H., Ban, S.-J., Lee, M.-D., Lim, C.-S., Park, M.-K., Shin, H. J., Cho, S., Peterson, D., and Song, C.-K.: Impacts of local vs. trans-boundary emissions from different sectors on PM2.5 exposure in South Korea during the KORUS-AQ campaign, Atmos. Environ., 203, 196–205, https://doi.org/10.1016/j.atmosenv.2019.02.008, 2019.
Chong, H., Lee, H., Koo, J.-H., Kim, J., Jeong, U., Kim, W., Kim, S.-W., Herman, J. R., Abuhassan, N. K., Ahn, J.-Y., Park, J.-H., Kim, S.-K., Moon, K.-J., Choi, W.-J., and Park, S. S.: Regional Characteristics of NO2 Column Densities from Pandora Observations during the MAPS-Seoul Campaign, Aerosol Air Qual. Res., 18, 2207–2219, https://doi.org/10.4209/aaqr.2017.09.0341, 2018.
Coggon, M. M., Gkatzelis, G. I., McDonald, B. C., Gilman, J. B., Schwantes, R. H., Abuhassan, N., Aikin, K. C., Arend, M. F., Berkoff, T. A., Brown, S. S., Campos, T. L., Dickerson, R. R., Gronoff, G., Hurley, J. F., Isaacman-VanWertz, G., Koss, A. R., Li, M., McKeen, S. A., Moshary, F., Peischl, J., Pospisilova, V., Ren, X., Wilson, A., Wu, Y., Trainer, M., and Warneke, C.: Volatile chemical product emissions enhance ozone and modulate urban chemistry, P. Natl. Acad. Sci. USA, 118, e2026653118, https://doi.org/10.1073/pnas.2026653118, 2021.
Crawford, J. H., Ahn, J.-Y., Al-Saadi, J., Chang, L., Emmons, L. K., Kim, J., Lee, G., Park, J.-H., Park, R. J., Woo, J. H., Song, C.-K., Hong, J.-H., Hong, Y.-D., Lefer, B. L., Lee, M., Lee, T., Kim, S., Min, K.-E., Yum, S. S., Shin, H. J., Kim, Y.-W., Choi, J.-S., Park, J.-S., Szykman, J. J., Long, R. W., Jordan, C. E., Simpson, I. J., Fried, A., Dibb, J. E., Cho, S., and Kim, Y. P.: The Korea–United States Air Quality (KORUS-AQ) field study, Elem. Sci. Anth., 9, 00163, https://doi.org/10.1525/elementa.2020.00163, 2021.
Crounse, J. D., McKinney, K. A., Kwan, A. J., and Wennberg, P. O.: Measurement of gas-phase hydroperoxides by chemical ionization mass spectrometry (CIMS), Anal. Chem., 78, 6726–6732, https://doi.org/10.1021/ac0604235, 2006.
DeCarlo, P. F., Kimmel, J. R., Trimborn, A., Northway, M. J., Jayne, J. T., Aiken, A. C., Gonin, M., Fuhrer, K., Horvath, T., Docherty, K. S., Worsnop, D. R., and Jimenez, J. L.: Field-Deployable, High-Resolution, Time-of-Flight Aerosol Mass Spectrometer, Anal. Chem., 78, 8281–8289, https://doi.org/10.1021/ac061249n, 2006.
de Foy, B., Lu, Z., Streets, D. G., Lamsal, L. N., and Duncan, B. N.: Estimates of power plant NOx emissions and lifetimes from OMI NO2 satellite retrievals, Atmos. Environ., 116, 1–11, https://doi.org/10.1016/j.atmosenv.2015.05.056, 2015.
Eskes, H. J. and Boersma, K. F.: Averaging kernels for DOAS total-column satellite retrievals, Atmos. Chem. Phys., 3, 1285–1291, https://doi.org/10.5194/acp-3-1285-2003, 2003.
Fairlie, T. D., Jacob, D. J., Dibb, J. E., Alexander, B., Avery, M. A., van Donkelaar, A., and Zhang, L.: Impact of mineral dust on nitrate, sulfate, and ozone in transpacific Asian pollution plumes, Atmos. Chem. Phys., 10, 3999–4012, https://doi.org/10.5194/acp-10-3999-2010, 2010.
Faloona, I. C., Tan, D., Lesher, R. L., Hazen, N. L., Frame, C. L., Simpas, J. B., Harder, H., Martinez, M., Di Carlo, P., Ren, X., and Brune, W. H.: A Laser-induced Fluorescence Instrument for Detecting Tropospheric OH and HO2: Characteristics and Calibration, J. Atmos. Chem., 47, 139–167, https://doi.org/10.1023/B:JOCH.0000021036.53185.0e, 2004.
Flynn, L., Long, C., Wu, X., Evans, R., Beck, C. T., Petropavlovskikh, I., McConville, G., Yu, W., Zhang, Z., Niu, J., Beach, E., Hao, Y., Pan, C., Sen, B., Novicki, M., Zhou, S., and Seftor, C.: Performance of the Ozone Mapping and Profiler Suite (OMPS) products, J. Geophys. Res.-Atmos., 119, 6181–6195, https://doi.org/10.1002/2013JD020467, 2014.
Gaubert, B., Emmons, L. K., Raeder, K., Tilmes, S., Miyazaki, K., Arellano Jr., A. F., Elguindi, N., Granier, C., Tang, W., Barré, J., Worden, H. M., Buchholz, R. R., Edwards, D. P., Franke, P., Anderson, J. L., Saunois, M., Schroeder, J., Woo, J.-H., Simpson, I. J., Blake, D. R., Meinardi, S., Wennberg, P. O., Crounse, J., Teng, A., Kim, M., Dickerson, R. R., He, H., Ren, X., Pusede, S. E., and Diskin, G. S.: Correcting model biases of CO in East Asia: impact on oxidant distributions during KORUS-AQ, Atmos. Chem. Phys., 20, 14617–14647, https://doi.org/10.5194/acp-20-14617-2020, 2020.
Goldberg, D. L., Saide, P. E., Lamsal, L. N., de Foy, B., Lu, Z., Woo, J.-H., Kim, Y., Kim, J., Gao, M., Carmichael, G., and Streets, D. G.: A top-down assessment using OMI NO2 suggests an underestimate in the NOx emissions inventory in Seoul, South Korea, during KORUS-AQ, Atmos. Chem. Phys., 19, 1801–1818, https://doi.org/10.5194/acp-19-1801-2019, 2019.
Guenther, A. B., Jiang, X., Heald, C. L., Sakulyanontvittaya, T., Duhl, T., Emmons, L. K., and Wang, X.: The Model of Emissions of Gases and Aerosols from Nature version 2.1 (MEGAN2.1): an extended and updated framework for modeling biogenic emissions, Geosci. Model Dev., 5, 1471–1492, https://doi.org/10.5194/gmd-5-1471-2012, 2012.
Heim, E. W., Dibb, J., Scheuer, E., Jost, P. C., Nault, B. A., Jimenez, J. L., Peterson, D., Knote, C., Fenn, M., Hair, J., Beyersdorf, A. J., Corr, C., and Anderson, B. E.: Asian dust observed during KORUS-AQ facilitates the uptake and incorporation of soluble pollutants during transport to South Korea, Atmos. Environ., 224, 117305, https://doi.org/10.1016/j.atmosenv.2020.117305, 2020.
Holmes, C. D., Bertram, T. H., Confer, K. L., Graham, K. A., Ronan, A. C., Wirks, C. K., and Shah, V.: The Role of Clouds in the Tropospheric NOx Cycle: A New Modeling Approach for Cloud Chemistry and Its Global Implications, Geophys. Res. Lett., 46, 4980–4990, https://doi.org/10.1029/2019GL081990, 2019.
Hudman, R. C., Moore, N. E., Mebust, A. K., Martin, R. V., Russell, A. R., Valin, L. C., and Cohen, R. C.: Steps towards a mechanistic model of global soil nitric oxide emissions: implementation and space based-constraints, Atmos. Chem. Phys., 12, 7779–7795, https://doi.org/10.5194/acp-12-7779-2012, 2012.
Huijnen, V., Williams, J., van Weele, M., van Noije, T., Krol, M., Dentener, F., Segers, A., Houweling, S., Peters, W., de Laat, J., Boersma, F., Bergamaschi, P., van Velthoven, P., Le Sager, P., Eskes, H., Alkemade, F., Scheele, R., Nédélec, P., and Pätz, H.-W.: The global chemistry transport model TM5: description and evaluation of the tropospheric chemistry version 3.0, Geosci. Model Dev., 3, 445–473, https://doi.org/10.5194/gmd-3-445-2010, 2010.
Jaeglé, L., Quinn, P. K., Bates, T. S., Alexander, B., and Lin, J.-T.: Global distribution of sea salt aerosols: new constraints from in situ and remote sensing observations, Atmos. Chem. Phys., 11, 3137–3157, https://doi.org/10.5194/acp-11-3137-2011, 2011.
Jordan, C. E., Crawford, J. H., Beyersdorf, A. J., Eck, T. F., Halliday, H. S., Nault, B. A., Chang, L.-S., Park, J., Park, R., Lee, G., Kim, H., Ahn, J., Cho, S., Shin, H. J., Lee, J. H., Jung, J., Kim, D.-S., Lee, M., Lee, T., Whitehill, A., Szykman, J., Schueneman, M. K., Campuzano-Jost, P., Jimenez, J. L., DiGangi, J. P., Diskin, G. S., Anderson, B. E., Moore, R. H., Ziemba, L. D., Fenn, M. A., Hair, J. W., Kuehn, R. E., Holz, R. E., Chen, G., Travis, K., Shook, M., Peterson, D. A., Lamb, K. D., and Schwarz, J. P.: Investigation of factors controlling PM2.5 variability across the South Korean Peninsula during KORUS-AQ, Elem. Sci. Anth., 8, 28, https://doi.org/10.1525/elementa.424, 2020.
Kasibhatla, P., Sherwen, T., Evans, M. J., Carpenter, L. J., Reed, C., Alexander, B., Chen, Q., Sulprizio, M. P., Lee, J. D., Read, K. A., Bloss, W., Crilley, L. R., Keene, W. C., Pszenny, A. A. P., and Hodzic, A.: Global impact of nitrate photolysis in sea-salt aerosol on NOx, OH, and O3 in the marine boundary layer, Atmos. Chem. Phys., 18, 11185–11203, https://doi.org/10.5194/acp-18-11185-2018, 2018.
Kim, H., Zhang, Q., and Heo, J.: Influence of intense secondary aerosol formation and long-range transport on aerosol chemistry and properties in the Seoul Metropolitan Area during spring time: results from KORUS-AQ, Atmos. Chem. Phys., 18, 7149–7168, https://doi.org/10.5194/acp-18-7149-2018, 2018.
Kim, H., Park, R. J., Kim, S., Brune, W. H., Diskin, G. S., Fried, A., Hall, S. R., Weinheimer, A. J., Wennberg, P., Wisthaler, A., Blake, D. R., and Ullmann, K.: Observed versus simulated OH reactivity during KORUS-AQ campaign: Implications for emission inventory and chemical environment in East Asia, Elem. Sci. Anth., 10, 00030, https://doi.org/10.1525/elementa.2022.00030, 2022.
Kim, J., Jeong, U., Ahn, M.-H., Kim, J. H., Park, R. J., Lee, H., Song, C. H., Choi, Y.-S., Lee, K.-H., Yoo, J.-M., Jeong, M.-J., Park, S. K., Lee, K.-M., Song, C.-K., Kim, S.-W., Kim, Y. J., Kim, S.-W., Kim, M., Go, S., Liu, X., Chance, K., Chan Miller, C., Al-Saadi, J., Veihelmann, B., Bhartia, P. K., Torres, O., Abad, G. G., Haffner, D. P., Ko, D. H., Lee, S. H., Woo, J.-H., Chong, H., Park, S. S., Nicks, D., Choi, W. J., Moon, K.-J., Cho, A., Yoon, J., Kim, S., Hong, H., Lee, K., Lee, H., Lee, S., Choi, M., Veefkind, P., Levelt, P. F., Edwards, D. P., Kang, M., Eo, M., Bak, J., Baek, K., Kwon, H.-A., Yang, J., Park, J., Han, K. M., Kim, B.-R., Shin, H.-W., Choi, H., Lee, E., Chong, J., Cha, Y., Koo, J.-H., Irie, H., Hayashida, S., Kasai, Y., Kanaya, Y., Liu, C., Lin, J., Crawford, J. H., Carmichael, G. R., Newchurch, M. J., Lefer, B. L., Herman, J. R., Swap, R. J., Lau, A. K. H., Kurosu, T. P., Jaross, G., Ahlers, B., Dobber, M., McElroy, C. T., and Choi, Y.: New Era of Air Quality Monitoring from Space: Geostationary Environment Monitoring Spectrometer (GEMS), B. Am. Meteorol. Soc., 101, E1–E22, https://doi.org/10.1175/BAMS-D-18-0013.1, 2020.
Kim, S., Sanchez, D., Wang, M., Seco, R., Jeong, D., Hughes, S., Barletta, B., Blake, D. R., Jung, J., Kim, D., Lee, G., Lee, M., Ahn, J., Lee, S.-D., Cho, G., Sung, M.-Y., Lee, Y.-H., Kim, D. B., Kim, Y., Woo, J.-H., Jo, D., Park, R., Park, J.-H., Hong, Y.-D., and Hong, J.-H.: OH reactivity in urban and suburban regions in Seoul, South Korea – an East Asian megacity in a rapid transition, Faraday Discuss., 189, 231–251, https://doi.org/10.1039/C5FD00230C, 2016.
Kleipool, Q. L., Dobber, M. R., de Haan, J. F., and Levelt, P. F.: Earth surface reflectance climatology from 3 years of OMI data, J. Geophys. Res., 113, D18308, https://doi.org/10.1029/2008JD010290, 2008.
KORUS-AQ Science Team: KORUS-AQ Data, NASA Langley Research Center [data set], https://doi.org/10.5067/Suborbital/KORUSAQ/DATA01, 2019.
Kwon, H.-A., Park, R. J., Oak, Y. J., Nowlan, C. R., Janz, S. J., Kowalewski, M. G., Fried, A., Walega, J., Bates, K. H., Choi, J., Blake, D. R., Wisthaler, A., and Woo, J.-H.: Top-down estimates of anthropogenic VOC emissions in South Korea using formaldehyde vertical column densities from aircraft during the KORUS-AQ campaign, Elem. Sci. Anth., 9, 00109, https://doi.org/10.1525/elementa.2021.00109, 2021.
Lakey, P. S. J., George, I. J., Whalley, L. K., Baeza-Romero, M. T., and Heard, D. E.: Measurements of the HO2 Uptake Coefficients onto Single Component Organic Aerosols, Environ. Sci. Technol., 49, 4878–4885, https://doi.org/10.1021/acs.est.5b00948, 2015.
Lamsal, L. N., Krotkov, N. A., Vasilkov, A., Marchenko, S., Qin, W., Yang, E.-S., Fasnacht, Z., Joiner, J., Choi, S., Haffner, D., Swartz, W. H., Fisher, B., and Bucsela, E.: Ozone Monitoring Instrument (OMI) Aura nitrogen dioxide standard product version 4.0 with improved surface and cloud treatments, Atmos. Meas. Tech., 14, 455–479, https://doi.org/10.5194/amt-14-455-2021, 2021.
Laughner, J. L. and Cohen, R. C.: Direct observation of changing NOx lifetime in North American cities, Science, 366, 723–727, https://doi.org/10.1126/science.aax6832, 2019.
Lee, H., Park, J., and Hong, H.: Geostationary Environment Monitoring Spectrometer (GEMS) NO2 retrieval Algorithm Theoretical Basis Document (ATBD) Version 1.0., National Institute of Environmental Research, South Korea, 2020.
Levelt, P. F., Joiner, J., Tamminen, J., Veefkind, J. P., Bhartia, P. K., Stein Zweers, D. C., Duncan, B. N., Streets, D. G., Eskes, H., van der A, R., McLinden, C., Fioletov, V., Carn, S., de Laat, J., DeLand, M., Marchenko, S., McPeters, R., Ziemke, J., Fu, D., Liu, X., Pickering, K., Apituley, A., González Abad, G., Arola, A., Boersma, F., Chan Miller, C., Chance, K., de Graaf, M., Hakkarainen, J., Hassinen, S., Ialongo, I., Kleipool, Q., Krotkov, N., Li, C., Lamsal, L., Newman, P., Nowlan, C., Suleiman, R., Tilstra, L. G., Torres, O., Wang, H., and Wargan, K.: The Ozone Monitoring Instrument: overview of 14 years in space, Atmos. Chem. Phys., 18, 5699–5745, https://doi.org/10.5194/acp-18-5699-2018, 2018.
Lin, H., Jacob, D. J., Lundgren, E. W., Sulprizio, M. P., Keller, C. A., Fritz, T. M., Eastham, S. D., Emmons, L. K., Campbell, P. C., Baker, B., Saylor, R. D., and Montuoro, R.: Harmonized Emissions Component (HEMCO) 3.0 as a versatile emissions component for atmospheric models: application in the GEOS-Chem, NASA GEOS, WRF-GC, CESM2, NOAA GEFS-Aerosol, and NOAA UFS models, Geosci. Model Dev., 14, 5487–5506, https://doi.org/10.5194/gmd-14-5487-2021, 2021.
Lin, J.-T., McElroy, M. B., and Boersma, K. F.: Constraint of anthropogenic NOx emissions in China from different sectors: a new methodology using multiple satellite retrievals, Atmos. Chem. Phys., 10, 63–78, https://doi.org/10.5194/acp-10-63-2010, 2010.
Lin, J.-T., Liu, Z., Zhang, Q., Liu, H., Mao, J., and Zhuang, G.: Modeling uncertainties for tropospheric nitrogen dioxide columns affecting satellite-based inverse modeling of nitrogen oxides emissions, Atmos. Chem. Phys., 12, 12255–12275, https://doi.org/10.5194/acp-12-12255-2012, 2012.
Mao, J., Ren, X., Brune, W. H., Olson, J. R., Crawford, J. H., Fried, A., Huey, L. G., Cohen, R. C., Heikes, B., Singh, H. B., Blake, D. R., Sachse, G. W., Diskin, G. S., Hall, S. R., and Shetter, R. E.: Airborne measurement of OH reactivity during INTEX-B, Atmos. Chem. Phys., 9, 163–173, https://doi.org/10.5194/acp-9-163-2009, 2009.
Mao, J., Jacob, D. J., Evans, M. J., Olson, J. R., Ren, X., Brune, W. H., Clair, J. M. St., Crounse, J. D., Spencer, K. M., Beaver, M. R., Wennberg, P. O., Cubison, M. J., Jimenez, J. L., Fried, A., Weibring, P., Walega, J. G., Hall, S. R., Weinheimer, A. J., Cohen, R. C., Chen, G., Crawford, J. H., McNaughton, C., Clarke, A. D., Jaeglé, L., Fisher, J. A., Yantosca, R. M., Le Sager, P., and Carouge, C.: Chemistry of hydrogen oxide radicals (HOx) in the Arctic troposphere in spring, Atmos. Chem. Phys., 10, 5823–5838, https://doi.org/10.5194/acp-10-5823-2010, 2010.
Mao, J., Fan, S., Jacob, D. J., and Travis, K. R.: Radical loss in the atmosphere from Cu-Fe redox coupling in aerosols, Atmos. Chem. Phys., 13, 509–519, https://doi.org/10.5194/acp-13-509-2013, 2013.
Martin, R. V., Chance, K., Jacob, D. J., Kurosu, T. P., Spurr, R. J. D., Bucsela, E., Gleason, J. J., Palmer, P. I., Bey, I., Fiore, A. M., Li, Q., Yantosca, R. M., and Koelemeijer, R. B. A.: An improved retrieval of tropospheric nitrogen dioxide from GOME, J. Geophys. Res., 107, 4437, https://doi.org/10.1029/2001JD001027, 2002.
Martin, R. V., Jacob, D. J., Yantosca, R. M., Chin, M., and Ginoux, P.: Global and regional decreases in tropospheric oxidants from photochemical effects of aerosols, J. Geophys. Res., 108, D3, https://doi.org/10.1029/2002JD002622, 2003.
McDonald, B. C., de Gouw, J. A., Gilman, J. B., Jathar, S. H., Akherati, A., Cappa, C. D., Jimenez, J. L., Lee-Taylor, J., Hayes, P. L., McKeen, S. A., Cui, Y. Y., Kim, S.-W., Gentner, D. R., Isaacman-VanWertz, G., Goldstein, A. H., Harley, R. A., Frost, G. J., Roberts, J. M., Ryerson, T. B., and Trainer, M.: Volatile chemical products emerging as largest petrochemical source of urban organic emissions, Science, 359, 760–764, https://doi.org/10.1126/science.aaq0524, 2018.
McDuffie, E. E., Martin, R. V., Spadaro, J. V., Burnett, R., Smith, S. J., O'Rourke, P., Hammer, M. S., van Donkelaar, A., Bindle, L., Shah, V., Jaeglé, L., Luo, G., Yu, F., Adeniran, J. A., Lin, J., and Brauer, M.: Source sector and fuel contributions to ambient PM2.5 and attributable mortality across multiple spatial scales, Nat. Commun., 12, 3594, https://doi.org/10.1038/s41467-021-23853-y, 2021.
Miyazaki, K., Sekiya, T., Fu, D., Bowman, K. W., Kulawik, S. S., Sudo, K., Walker, T., Kanaya, Y., Takigawa, M., Ogochi, K., Eskes, H., Boersma, K. F., Thompson, A. M., Gaubert, B., Barre, J., and Emmons, L. K.: Balance of Emission and Dynamical Controls on Ozone During the Korea-United States Air Quality Campaign From Multiconstituent Satellite Data Assimilation, J. Geophys. Res-Atmos., 124, 387–413, https://doi.org/10.1029/2018JD028912, 2019.
Murray, L. T., Jacob, D. J., Logan, J. A., Hudman, R. C., and Koshak, W. J.: Optimized regional and interannual variability of lightning in a global chemical transport model constrained by LIS/OTD satellite data, J. Geophys. Res., 117, D20, https://doi.org/10.1029/2012JD017934, 2012.
Naik, V., Voulgarakis, A., Fiore, A. M., Horowitz, L. W., Lamarque, J.-F., Lin, M., Prather, M. J., Young, P. J., Bergmann, D., Cameron-Smith, P. J., Cionni, I., Collins, W. J., Dalsøren, S. B., Doherty, R., Eyring, V., Faluvegi, G., Folberth, G. A., Josse, B., Lee, Y. H., MacKenzie, I. A., Nagashima, T., van Noije, T. P. C., Plummer, D. A., Righi, M., Rumbold, S. T., Skeie, R., Shindell, D. T., Stevenson, D. S., Strode, S., Sudo, K., Szopa, S., and Zeng, G.: Preindustrial to present-day changes in tropospheric hydroxyl radical and methane lifetime from the Atmospheric Chemistry and Climate Model Intercomparison Project (ACCMIP), Atmos. Chem. Phys., 13, 5277–5298, https://doi.org/10.5194/acp-13-5277-2013, 2013.
NASA: Airborne and Satellite Investigation of Asian Air Quality (ASIA-AQ) White Paper, NASA Earth Science Project Office, https://espo.nasa.gov/sites/default/files/documents/Draft Planning Document for ASIA-AQ_20210802.pdf, 2021.
NASA: Homepage, https://www-air.larc.nasa.gov/, last access: 15 February 2023.
Nault, B. A., Garland, C., Pusede, S. E., Wooldridge, P. J., Ullmann, K., Hall, S. R., and Cohen, R. C.: Measurements of CH3O2NO2 in the upper troposphere, Atmos. Meas. Tech., 8, 987–997, https://doi.org/10.5194/amt-8-987-2015, 2015.
Nault, B. A., Campuzano-Jost, P., Day, D. A., Schroder, J. C., Anderson, B., Beyersdorf, A. J., Blake, D. R., Brune, W. H., Choi, Y., Corr, C. A., de Gouw, J. A., Dibb, J., DiGangi, J. P., Diskin, G. S., Fried, A., Huey, L. G., Kim, M. J., Knote, C. J., Lamb, K. D., Lee, T., Park, T., Pusede, S. E., Scheuer, E., Thornhill, K. L., Woo, J.-H., and Jimenez, J. L.: Secondary organic aerosol production from local emissions dominates the organic aerosol budget over Seoul, South Korea, during KORUS-AQ, Atmos. Chem. Phys., 18, 17769–17800, https://doi.org/10.5194/acp-18-17769-2018, 2018.
Nussbaumer, C. M., Parchatka, U., Tadic, I., Bohn, B., Marno, D., Martinez, M., Rohloff, R., Harder, H., Kluge, F., Pfeilsticker, K., Obersteiner, F., Zöger, M., Doerich, R., Crowley, J. N., Lelieveld, J., and Fischer, H.: Modification of a conventional photolytic converter for improving aircraft measurements of NO2 via chemiluminescence, Atmos. Meas. Tech., 14, 6759–6776, https://doi.org/10.5194/amt-14-6759-2021, 2021.
Oak, Y. J., Park, R. J., Schroeder, J. R., Crawford, J. H., Blake, D. R., Weinheimer, A. J., Woo, J.-H., Kim, S.-W., Yeo, H., Fried, A., Wisthaler, A., and Brune, W. H.: Evaluation of simulated O3 production efficiency during the KORUS-AQ campaign: Implications for anthropogenic NOx emissions in Korea, Elem. Sci. Anth., 7, 56, https://doi.org/10.1525/elementa.394, 2019.
Palmer, P. I., Jacob, D. J., Chance, K., Martin, R. V., Spurr, R. J. D., Kurosu, T. P., Bey, I., Yantosca, R., Fiore, A., and Li, Q.: Air mass factor formulation for spectroscopic measurements from satellites: Application to formaldehyde retrievals from the Global Ozone Monitoring Experiment, J. Geophys. Res., 106, 14539–14550, https://doi.org/10.1029/2000JD900772, 2001.
Park, J., Lee, H., Hong, H., Yang, J., van Roozendael, M., Kim, S., Kim, J., Lee, D., Fayt, C., Ko, D. H., Lee, S.-H., A. Krotkov, N., Wagner, T., Richter, A., and N. Lamsal, L.: First results of diurnal NO2 column variation over Asia from the Geostationary Environment Monitoring Spectrometer (GEMS), EGU General Assembly 2022, Vienna, Austria, 23–27 May 2022, EGU22-3280, https://doi.org/10.5194/egusphere-egu22-3280, 2022.
Park, R. J., Oak, Y. J., Emmons, L. K., Kim, C.-H., Pfister, G. G., Carmichael, G. R., Saide, P. E., Cho, S.-Y., Kim, S., Woo, J.-H., Crawford, J. H., Gaubert, B., Lee, H.-J., Park, S.-Y., Jo, Y.-J., Gao, M., Tang, B., Stanier, C. O., Shin, S. S., Park, H. Y., Bae, C., and Kim, E.: Multi-model intercomparisons of air quality simulations for the KORUS-AQ campaign, Elem. Sci. Anth., 9, 00139, https://doi.org/10.1525/elementa.2021.00139, 2021.
Penn, E. and Holloway, T.: Evaluating current satellite capability to observe diurnal change in nitrogen oxides in preparation for geostationary satellite missions, Environ. Res. Lett., 15, 034038, https://doi.org/10.1088/1748-9326/ab6b36, 2020.
Qu, Z., Jacob, D. J., Silvern, R. F., Shah, V., Campbell, P. C., Valin, L. C., and Murray, L. T.: US COVID-19 Shutdown Demonstrates Importance of Background NO2 in Inferring NOx Emissions from Satellite NO2 Observations, Geophys. Res. Lett., 48, e2021GL092783, https://doi.org/10.1029/2021GL092783, 2021.
Reed, C., Evans, M. J., Di Carlo, P., Lee, J. D., and Carpenter, L. J.: Interferences in photolytic NO2 measurements: explanation for an apparent missing oxidant?, Atmos. Chem. Phys., 16, 4707–4724, https://doi.org/10.5194/acp-16-4707-2016, 2016.
Reed, C., Evans, M. J., Crilley, L. R., Bloss, W. J., Sherwen, T., Read, K. A., Lee, J. D., and Carpenter, L. J.: Evidence for renoxification in the tropical marine boundary layer, Atmos. Chem. Phys., 17, 4081–4092, https://doi.org/10.5194/acp-17-4081-2017, 2017.
Richter, A., Burrows, J. P., Nüß, H., Granier, C., and Niemeier, U.: Increase in tropospheric nitrogen dioxide over China observed from space, Nature, 437, 129–132, https://doi.org/10.1038/nature04092, 2005.
Romer, P. S., Wooldridge, P. J., Crounse, J. D., Kim, M. J., Wennberg, P. O., Dibb, J. E., Scheuer, E., Blake, D. R., Meinardi, S., Brosius, A. L., Thames, A. B., Miller, D. O., Brune, W. H., Hall, S. R., Ryerson, T. B., and Cohen, R. C.: Constraints on Aerosol Nitrate Photolysis as a Potential Source of HONO and NOx, Environ. Sci. Technol., 52, 13738–13746, https://doi.org/10.1021/acs.est.8b03861, 2018.
Sachse, G. W., Hill, G. F., Wade, L. O., and Perry, M. G.: Fast-response, high-precision carbon monoxide sensor using a tunable diode laser absorption technique, J. Geophys. Res., 92, 2071, https://doi.org/10.1029/JD092iD02p02071, 1987.
Schroeder, J. R., Crawford, J. H., Ahn, J.-Y., Chang, L., Fried, A., Walega, J., Weinheimer, A., Montzka, D. D., Hall, S. R., Ullmann, K., Wisthaler, A., Mikoviny, T., Chen, G., Blake, D. R., Blake, N. J., Hughes, S. C., Meinardi, S., Diskin, G., Digangi, J. P., Choi, Y., Pusede, S. E., Huey, G. L., Tanner, D. J., Kim, M., and Wennberg, P.: Observation-based modeling of ozone chemistry in the Seoul metropolitan area during the Korea-United States Air Quality Study (KORUS-AQ), Elem. Sci. Anth., 8, 3, https://doi.org/10.1525/elementa.400, 2020.
Shah, V., Jacob, D. J., Dang, R., Lamsal, L. N., Strode, S. A., Steenrod, S. D., Boersma, K. F., Eastham, S. D., Fritz, T. M., Thompson, C., Peischl, J., Bourgeois, I., Pollack, I. B., Nault, B. A., Cohen, R. C., Campuzano-Jost, P., Jimenez, J. L., Andersen, S. T., Carpenter, L. J., Sherwen, T., and Evans, M. J.: Nitrogen oxides in the free troposphere: implications for tropospheric oxidants and the interpretation of satellite NO2 measurements, Atmos. Chem. Phys., 23, 1227–1257, https://doi.org/10.5194/acp-23-1227-2023, 2023.
Shindell, D. T., Faluvegi, G., Stevenson, D. S., Krol, M. C., Emmons, L. K., Lamarque, J.-F., Pétron, G., Dentener, F. J., Ellingsen, K., Schultz, M. G., Wild, O., Amann, M., Atherton, C. S., Bergmann, D. J., Bey, I., Butler, T., Cofala, J., Collins, W. J., Derwent, R. G., Doherty, R. M., Drevet, J., Eskes, H. J., Fiore, A. M., Gauss, M., Hauglustaine, D. A., Horowitz, L. W., Isaksen, I. S. A., Lawrence, M. G., Montanaro, V., Müller, J.-F., Pitari, G., Prather, M. J., Pyle, J. A., Rast, S., Rodriguez, J. M., Sanderson, M. G., Savage, N. H., Strahan, S. E., Sudo, K., Szopa, S., Unger, N., van Noije, T. P. C., and Zeng, G.: Multimodel simulations of carbon monoxide: Comparison with observations and projected near-future changes, J. Geophys. Res., 111, D19306, https://doi.org/10.1029/2006JD007100, 2006.
Silvern, R. F., Jacob, D. J., Travis, K. R., Sherwen, T., Evans, M. J., Cohen, R. C., Laughner, J. L., Hall, S. R., Ullmann, K., Crounse, J. D., Wennberg, P. O., Peischl, J., and Pollack, I. B.: Observed Ratios in the Upper Troposphere Imply Errors in NO-NO2-O3 Cycling Kinetics or an Unaccounted NOx Reservoir, Geophys. Res. Lett., 45, 4466–4474, https://doi.org/10.1029/2018GL077728, 2018.
Silvern, R. F., Jacob, D. J., Mickley, L. J., Sulprizio, M. P., Travis, K. R., Marais, E. A., Cohen, R. C., Laughner, J. L., Choi, S., Joiner, J., and Lamsal, L. N.: Using satellite observations of tropospheric NO2 columns to infer long-term trends in US NOx emissions: the importance of accounting for the free tropospheric NO2 background, Atmos. Chem. Phys., 19, 8863–8878, https://doi.org/10.5194/acp-19-8863-2019, 2019.
Simpson, I. J., Blake, D. R., Blake, N. J., Meinardi, S., Barletta, B., Hughes, S. C., Fleming, L. T., Crawford, J. H., Diskin, G. S., Emmons, L. K., Fried, A., Guo, H., Peterson, D. A., Wisthaler, A., Woo, J.-H., Barré, J., Gaubert, B., Kim, J., Kim, M. J., Kim, Y., Knote, C., Mikoviny, T., Pusede, S. E., Schroeder, J. R., Wang, Y., Wennberg, P. O., and Zeng, L.: Characterization, sources and reactivity of volatile organic compounds (VOCs) in Seoul and surrounding regions during KORUS-AQ, Elem. Sci. Anth., 8, 37, https://doi.org/10.1525/elementa.434, 2020.
Spinei, E., Whitehill, A., Fried, A., Tiefengraber, M., Knepp, T. N., Herndon, S., Herman, J. R., Müller, M., Abuhassan, N., Cede, A., Richter, D., Walega, J., Crawford, J., Szykman, J., Valin, L., Williams, D. J., Long, R., Swap, R. J., Lee, Y., Nowak, N., and Poche, B.: The first evaluation of formaldehyde column observations by improved Pandora spectrometers during the KORUS-AQ field study, Atmos. Meas. Tech., 11, 4943–4961, https://doi.org/10.5194/amt-11-4943-2018, 2018.
Stavrakou, T., Müller, J.-F., Boersma, K. F., De Smedt, I., and van der A, R. J.: Assessing the distribution and growth rates of NOx emission sources by inverting a 10-year record of NO2 satellite columns, Geophys. Res. Lett., 35, https://doi.org/10.1029/2008GL033521, 2008.
Taketani, F., Kanaya, Y., Pochanart, P., Liu, Y., Li, J., Okuzawa, K., Kawamura, K., Wang, Z., and Akimoto, H.: Measurement of overall uptake coefficients for HO2 radicals by aerosol particles sampled from ambient air at Mts. Tai and Mang (China), Atmos. Chem. Phys., 12, 11907–11916, https://doi.org/10.5194/acp-12-11907-2012, 2012.
The International GEOS-Chem User Community: geoschem/GCClassic: GEOS-Chem 13.3.4 (13.3.4), Zenodo [code], https://doi.org/10.5281/zenodo.5764874, 2021.
Thornton, J. A., Wooldridge, P. J., and Cohen, R. C.: Atmospheric NO2: In Situ Laser-Induced Fluorescence Detection at Parts per Trillion Mixing Ratios, Anal. Chem., 72, 528–539, https://doi.org/10.1021/ac9908905, 2000.
Travis, K. R., Jacob, D. J., Fisher, J. A., Kim, P. S., Marais, E. A., Zhu, L., Yu, K., Miller, C. C., Yantosca, R. M., Sulprizio, M. P., Thompson, A. M., Wennberg, P. O., Crounse, J. D., St. Clair, J. M., Cohen, R. C., Laughner, J. L., Dibb, J. E., Hall, S. R., Ullmann, K., Wolfe, G. M., Pollack, I. B., Peischl, J., Neuman, J. A., and Zhou, X.: Why do models overestimate surface ozone in the Southeast United States?, Atmos. Chem. Phys., 16, 13561–13577, https://doi.org/10.5194/acp-16-13561-2016, 2016.
Travis, K. R., Crawford, J. H., Chen, G., Jordan, C. E., Nault, B. A., Kim, H., Jimenez, J. L., Campuzano-Jost, P., Dibb, J. E., Woo, J.-H., Kim, Y., Zhai, S., Wang, X., McDuffie, E. E., Luo, G., Yu, F., Kim, S., Simpson, I. J., Blake, D. R., Chang, L., and Kim, M. J.: Limitations in representation of physical processes prevent successful simulation of PM2.5 during KORUS-AQ, Atmos. Chem. Phys., 22, 7933–7958, https://doi.org/10.5194/acp-22-7933-2022, 2022.
Veefkind, J. P., Aben, I., McMullan, K., Förster, H., de Vries, J., Otter, G., Claas, J., Eskes, H. J., de Haan, J. F., Kleipool, Q., van Weele, M., Hasekamp, O., Hoogeveen, R., Landgraf, J., Snel, R., Tol, P., Ingmann, P., Voors, R., Kruizinga, B., Vink, R., Visser, H., and Levelt, P. F.: TROPOMI on the ESA Sentinel-5 Precursor: A GMES mission for global observations of the atmospheric composition for climate, air quality and ozone layer applications, Remote Sens. Environ., 120, 70–83, https://doi.org/10.1016/j.rse.2011.09.027, 2012.
Walega, J. G., Dye, J. E., Grahek, F. E., and Ridley, B. K.: Compact measurement system for the simultaneous determination of NO, NO2, NOy, and O3 using a small aircraft, in: Measurement of Atmospheric Gases, P. Soc. Photo-opt. Ins., 232–241, https://doi.org/10.1117/12.46167, 1991.
Wang, X., Jacob, D. J., Downs, W., Zhai, S., Zhu, L., Shah, V., Holmes, C. D., Sherwen, T., Alexander, B., Evans, M. J., Eastham, S. D., Neuman, J. A., Veres, P. R., Koenig, T. K., Volkamer, R., Huey, L. G., Bannan, T. J., Percival, C. J., Lee, B. H., and Thornton, J. A.: Global tropospheric halogen (Cl, Br, I) chemistry and its impact on oxidants, Atmos. Chem. Phys., 21, 13973–13996, https://doi.org/10.5194/acp-21-13973-2021, 2021.
Woo, J.-H., Kim, Y., Kim, H.-K., Choi, K.-C., Eum, J.-H., Lee, J.-B., Lim, J.-H., Kim, J., and Seong, M.: Development of the CREATE Inventory in Support of Integrated Climate and Air Quality Modeling for Asia, Sustainability, 12, 7930, https://doi.org/10.3390/su12197930, 2020.
Ye, C., Zhou, X., Pu, D., Stutz, J., Festa, J., Spolaor, M., Tsai, C., Cantrell, C., Mauldin, R. L., Campos, T., Weinheimer, A., Hornbrook, R. S., Apel, E. C., Guenther, A., Kaser, L., Yuan, B., Karl, T., Haggerty, J., Hall, S., Ullmann, K., Smith, J. N., Ortega, J., and Knote, C.: Rapid cycling of reactive nitrogen in the marine boundary layer, Nature, 532, 489–491, https://doi.org/10.1038/nature17195, 2016.
Zhai, S.: Factors Controlling Peroxyacetyl Nitrate (PAN) in Polluted and Remote Atmospheres: Insights from the KORUS-AQ and ATom Campaigns, American Meteorological Society (AMS) 102nd Annual Meeting, Houston, Texas, 23–27 January 2022, https://acmg.seas.harvard.edu/files/acmg/files/shixian_ams2022_pan.pdf (last access: 15 February 2023), 2022.
Zhai, S., Jacob, D. J., Brewer, J. F., Li, K., Moch, J. M., Kim, J., Lee, S., Lim, H., Lee, H. C., Kuk, S. K., Park, R. J., Jeong, J. I., Wang, X., Liu, P., Luo, G., Yu, F., Meng, J., Martin, R. V., Travis, K. R., Hair, J. W., Anderson, B. E., Dibb, J. E., Jimenez, J. L., Campuzano-Jost, P., Nault, B. A., Woo, J.-H., Kim, Y., Zhang, Q., and Liao, H.: Relating geostationary satellite measurements of aerosol optical depth (AOD) over East Asia to fine particulate matter (PM2.5): insights from the KORUS-AQ aircraft campaign and GEOS-Chem model simulations, Atmos. Chem. Phys., 21, 16775–16791, https://doi.org/10.5194/acp-21-16775-2021, 2021.
Zhai, S., Jacob, D. J., Pendergrass, D. C., Colombi, N. K., Shah, V., Yang, L. H., Zhang, Q., Wang, S., Kim, H., Sun, Y., Choi, J.-S., Park, J.-S., Luo, G., Yu, F., Woo, J.-H., Kim, Y., Dibb, J. E., Lee, T., Han, J.-S., Anderson, B. E., Li, K., and Liao, H.: Coarse particulate matter air quality in East Asia: implications for fine particulate nitrate, EGUsphere [preprint], https://doi.org/10.5194/egusphere-2022-1485, 2023.
Zhang, C., Liu, C., Wang, Y., Si, F., Zhou, H., Zhao, M., Su, W., Zhang, W., Chan, K. L., Liu, X., Xie, P., Liu, J., and Wagner, T.: Preflight Evaluation of the Performance of the Chinese Environmental Trace Gas Monitoring Instrument (EMI) by Spectral Analyses of Nitrogen Dioxide, IEEE T. Geosci. Remote, 56, 3323–3332, https://doi.org/10.1109/TGRS.2018.2798038, 2018.
Zheng, B., Tong, D., Li, M., Liu, F., Hong, C., Geng, G., Li, H., Li, X., Peng, L., Qi, J., Yan, L., Zhang, Y., Zhao, H., Zheng, Y., He, K., and Zhang, Q.: Trends in China's anthropogenic emissions since 2010 as the consequence of clean air actions, Atmos. Chem. Phys., 18, 14095–14111, https://doi.org/10.5194/acp-18-14095-2018, 2018.
Zhou, X., Davis, A. J., Kieber, D. J., Keene, W. C., Maben, J. R., Maring, H., Dahl, E. E., Izaguirre, M. A., Sander, R., and Smoydzyn, L.: Photochemical production of hydroxyl radical and hydroperoxides in water extracts of nascent marine aerosols produced by bursting bubbles from Sargasso seawater, Geophys. Res. Lett., 35, L20803, https://doi.org/10.1029/2008GL035418, 2008.
Zou, Q., Song, H., Tang, M., and Lu, K.: Measurements of HO2 uptake coefficient on aqueous (NH4)2SO4 aerosol using aerosol flow tube with LIF system, Chinese Chem. Lett., 30, 2236–2240, https://doi.org/10.1016/j.cclet.2019.07.041, 2019.