the Creative Commons Attribution 4.0 License.
the Creative Commons Attribution 4.0 License.
 | 22 Feb 2023
The impacts of dust aerosol and convective available potential energy on precipitation vertical structure in southeastern China as seen from multisource observations
Hongxia Zhu
Rui Li
Shuping Yang
Chun Zhao
Zhe Jiang
Chen Huang
The potential impacts of dust aerosols and atmospheric convective available potential energy (CAPE) on the vertical development of precipitating clouds in southeastern China (20–30∘ N, 110–125∘ E) in June, July, and August from 2000 to 2013 were studied using multisource observations. In southeastern China, heavy-dust conditions are coupled with strong northerly winds that transport air masses containing high concentrations of mineral dust particles, with cold temperatures, and with strong wind shear. This leads to weaker CAPE on dusty days compared with that on pristine days. Based on satellite observations, precipitating drops under dusty conditions grow faster in the middle atmospheric layers (with a temperature of between −5 and +2 ∘C) but slower in the upper and lower layers compared with their pristine counterparts. For a given precipitation top height (PTH), the precipitation rate under dusty conditions is lower in the upper layer but higher in the middle and lower layers. Moreover, the associated latent heating rate released by precipitation in the middle layer is higher. The precipitation top temperature (PTT) shows a fairly good linear relationship with the near-surface rain rate (NSRR): the linear regression slope between the PTT and NSRR is stable under dusty and pristine conditions. However, the PTT0 (the PTT related to rain onset) at the onset of precipitation is highly affected by both the CAPE and aerosol conditions. On pristine days, a stronger CAPE facilitates the vertical development of precipitation and leads to a decrease in PTT0, at a rate of −0.65 ∘C per 100 J kg−1 of CAPE for deep convective precipitation (with a variation of 15 %) and at a rate of −0.41 ∘C per 100 J kg−1 of CAPE for stratiform precipitation (with variation of 12 %). After removing the impacts of CAPE on PTT, dust aerosols led to an increase in PTT0, at a rate of +4.19 ∘C per unit aerosol optical depth (AOD) for deep convective precipitation and at a rate of +0.35 ∘C per unit AOD for stratiform precipitation. This study showed clear evidence that meteorological conditions and aerosol conditions combine to impact the vertical development of precipitation clouds. A quantitative estimation of the sensitivity of PTT to CAPE and dust was also provided.
- Article
(2073 KB) - Full-text XML
-
Supplement
(1916 KB) - BibTeX
- EndNote


Dust aerosols are widely distributed in the troposphere and can scatter and absorb solar shortwave radiation and terrestrial longwave radiation, thereby directly affecting the global radiation budget (Bellouin et al., 2005; Huang et al., 2014). On the other hand, dust aerosols can act as ice nuclei (IN) (Demott et al., 2003; Atkinson et al., 2013; Li et al., 2017a) to enhance the heterogeneous freezing process, which leads to ice formation at a relatively higher temperature and lower vapor saturation ratio. In addition, dust particles coated with water-soluble pollutants can serve as cloud condensation nuclei (CCN) (Yin and Chen, 2007; Li et al., 2010), decreasing the effective radius of cloud droplets for a given liquid water content and indirectly modulating the warm-rain process. The mechanisms by which dust aerosols affect atmospheric hydrometers are distinct at different temperatures and altitudes.
Observational studies of dust aerosols affecting clouds and precipitation in different vertical layers have received increasing attention in recent years. In particular, the observation of the vertical structure of precipitation by spaceborne precipitation radar instruments has made it possible to investigate the impacts of atmospheric dynamics and aerosols on the formation of cloud and rain at different heights and temperatures in detail. Previous studies have shown that the vertical structure of precipitation is influenced by aerosols and atmospheric dynamics (Min et al., 2009; Li and Min, 2010; Fan et al., 2013, 2018; Rosenfeld et a1., 2014; Gibbons et al., 2018; Chen et al., 2016; Guo et al., 2018; Wall et al., 2015). In a case study on the interaction between Saharan dust and a mesoscale convective system over the equatorial Atlantic Ocean, Min et al. (2009) found that the convective precipitation rate in the dust-laden sector was weaker than that in the pristine environment; moreover, they reported that the radar echoes of stratiform precipitation influenced by dust were stronger in the upper levels than those in the pristine environment. Li and Min (2010) further analyzed the variation in the precipitation rate with height and found that the impacts of mineral dust on tropical clouds and precipitation systems are highly dependent on rain type. The convective rain rate weakened at all heights, but stratiform precipitation showed an enhanced rain rate above 6 km in dust-laden areas, indicating that dust aerosols enhanced the heterogeneous ice nucleation process. In their study, variation in precipitation related to meteorological conditions was constrained by a fixed rain type, the precipitation top height, etc. Gibbons et al. (2018) used cloud-resolving model simulations to reveal that more and smaller ice particles release more latent heat (LH) during depositional growth and riming after being affected by dust, thereby promoting convective development. During diffusional growth, more particle competition for available water vapor reduces the particle growth rate, shifting the formation of precipitation to higher heights during the heterogeneous nucleation regime. In addition, Guo et al. (2018) found that convective precipitation under polluted conditions had deeper and stronger radar reflectivity patterns, whereas stratiform and shallow precipitation had shallower and weaker patterns than those under pristine conditions. Observational and model simulation studies have shown different results for aerosol effects on deep convection, suggesting that aerosols may either invigorate or inhibit precipitation, depending on the type and concentration of aerosols and the environmental conditions (Jiang et al., 2018; Khain, 2009; Fan et al., 2009, 2013; Rosenfeld et al., 2008, 2014).
The precipitation top height/ precipitation top temperature (PTH/PTT) is one of the most important parameters used to represent the vertical structure of precipitation. It is mainly controlled by the strength of the updraft (Nasuno and Satoh, 2011). In addition, a colder PTT (higher PTH) for a precipitation system results in a longer falling path for precipitation drops and a stronger rain rate at the surface being reached (Cao and Qi, 2014; Liu and Fu, 2001). For mixed-phase clouds, Li et al. (2011b) found that the cloud top height increases with the concentration of condensation nuclei, whereas the cloud top height is insensitive to condensation nuclei for water clouds. Dong et al. (2018) studied the effect of Saharan dust aerosols on the PTH in the equatorial Atlantic Ocean and found that, for a given near-surface rain rate (NSRR), the PTH of stratiform precipitation under dusty conditions was significantly higher than its pristine counterpart. In that study, it was found that the variation in the rainfall vertical structure was dominated by atmospheric dynamics, which can explain about 90 % of the variance. Guo et al. (2018) found that the mean top heights of the 30 dBZ radar reflectivity of polluted convective (stratiform) precipitation increased (decreased) by ∼29 % (∼10.8 %) compared with that under pristine conditions.
The spatial distribution of aerosols was significantly affected by meteorological conditions (Oshima et al., 2012), including convective transport (Prospero and Mayol-Bracero, 2013), wet-removal processes (Park and Allen, 2015), the boundary layer height, and evolution processes (Li et al., 2017b). Aerosol–cloud–precipitation interactions also largely depend on meteorological conditions, including wind shear (Fan et al., 2009, 2013), atmospheric stability (Huang et al., 2014), relative humidity (Li et al., 2019b), and the altitude of the aerosol layer (Yin et al., 2012; Lee et al., 2023).
A great challenge in observational studies of the indirect effects of aerosols is to distinguish the isolated contributions of weather conditions (dynamic conditions) and aerosol microphysical effects to the observed macro- and micro-features of clouds and precipitation (Stevens and Feingold, 2009; Tao et al., 2012; Rosenfeld et a1., 2014; Li et al., 2017b). This is especially true for mesoscale convective systems (MCSs) that are heavily affected by large-scale atmospheric circulation. Some studies have adopted ideals to constrain the variation in dynamic factors, cloud type, stages of cloud precipitation development, etc. and, in turn, to analyze the influence of aerosols (Rosenfeld et al., 2008; Fan et al., 2013, 2018; Li et al., 2011b; Min et al., 2009; Li and Min, 2010; Gibbons et al., 2018). For example, Fan et al. (2013) found that the thermodynamic effect of aerosols (freezing of cloud water to release additional LH) is responsible for up to 27 % of the increase in cloud cover during the growth stage of deep convective clouds in summer, while the microphysical effect of aerosols (freezing of large amounts of cloud droplets to produce more and smaller ice particles) increases cloud cover and cloud top height during the mature and dissipation stages.
For areas far from the source of a certain type of aerosol (such as mineral dust), the occurrence of high aerosol concentrations is often accompanied by specific atmospheric circulation conditions (for the long-distance transport of aerosols). Under these circumstances, the observed cloud and precipitation characteristics are jointly determined by the combination of obviously different aerosol conditions and weather conditions; thus, if we want to understand the pure indirect effects of aerosols, we need to untangle these two different effects.
To this end, this study specifically selected southeastern China as the research area. This region is relatively far from the original source of dust; therefore, relatively fixed atmospheric circulation conditions (northwesterly wind) are required to transport dust to this area, creating an ideal test bed for us to investigate the combined effects of dust aerosols and meteorological conditions on precipitation. Moreover, we attempt to isolate the impacts of meteorological conditions and aerosol conditions on the vertical structure of precipitation and LH by analyzing multiple satellite observations using a new mathematic treatment. Specifically, this study investigates the effects of convective available potential energy (CAPE) and dust aerosols on precipitation particle formation and LH release processes as well as on the macrophysical vertical features of precipitation in southeastern China. In addition, the sensitivity of the PTT to CAPE and the aerosol optical depth were quantitatively studied.
Southeastern China (20–30∘ N, 110–125∘ E) was selected as the study area in this work. The region experiences strong and frequent summer precipitation and is far from original terrestrial dust sources. Therefore, potential dust–precipitation interactions must occur under specific weather conditions. This is useful for us to investigate the separate effects of aerosols and thermodynamics on clouds. This work focused on precipitation in June, July, and August (JJA) from 2000 to 2013.
The standard 2A25 product from the Tropical Rainfall Measuring Mission (TRMM), which has a 4.3 km horizontal resolution and a 250 m vertical resolution at nadir, was utilized in this study (Iguchi et al., 2000). From the top down, the height of the first three continuous vertical bins with echoes detectable by precipitation radar (PR) is defined as the precipitation top. The associated air temperature (see the following data co-location method) is defined as the PTT. Each precipitation profile has a certain defined rain type: convective, stratiform, or other (Awaka et al., 1997). Because the dynamic conditions associated with convective and stratiform precipitation are different (Houze, 1997), the potential dust-related effects are also distinct (Li et al., 2017a; Li and Min, 2010); thus the abovementioned two precipitation types are investigated separately in this study. In addition, warm rain, defined as a PTT warmer than 0 ∘C, is separated from the aforementioned two precipitation types.
Based on satellite radar observations (Liu and Fu, 2001), from the top of the precipitation profile to the surface, the logarithm of the precipitation rate (R, in mm h−1), i.e., log R, changes linearly with decreasing height (H) in three respective vertical layers. At the highest level, precipitation particle growth relies primarily on the water vapor deposition process, the growth rate is slow, and the linear regression slope of the logR to H is small. In the layer from about 1.5 to 2 km above and below the freezing level, precipitation particles rely on the processes of aggregation and riming to grow rapidly, and the corresponding linear regression slope is large. In the lower layer, the convective precipitation rate shows a further slight increase due to coalescence with cloud droplets, resulting in a very small linear regression slope. The stratiform precipitation rate in this layer is unchanged or slightly decreases toward the surface due to the lack of cloud droplets. Both the convective and stratiform precipitation rates may decrease towards the ground due to particle breakup and evaporation. Li et al. (2011a) found that the abovementioned phenomenon are also valid when the vertical coordinate is changed from height (H) to temperature (T). They further defined the associated log R–T linear regression slopes (dlogRdT−1) as (1) SlopeA in the layer with temperatures colder than −5 ∘C, (2) SlopeB in the middle layer with temperatures between −5 and 2 ∘C, and (3) SlopeC in the lowest layer with temperatures higher than 2 ∘C. It was found that the three slopes respond to variations in atmospheric dynamics and thermodynamics related to El Niño conditions. In this study, we adopted the definitions of SlopeA, SlopeB, and SlopeC to study the growth rate in the upper, middle, and lower layers, respectively.
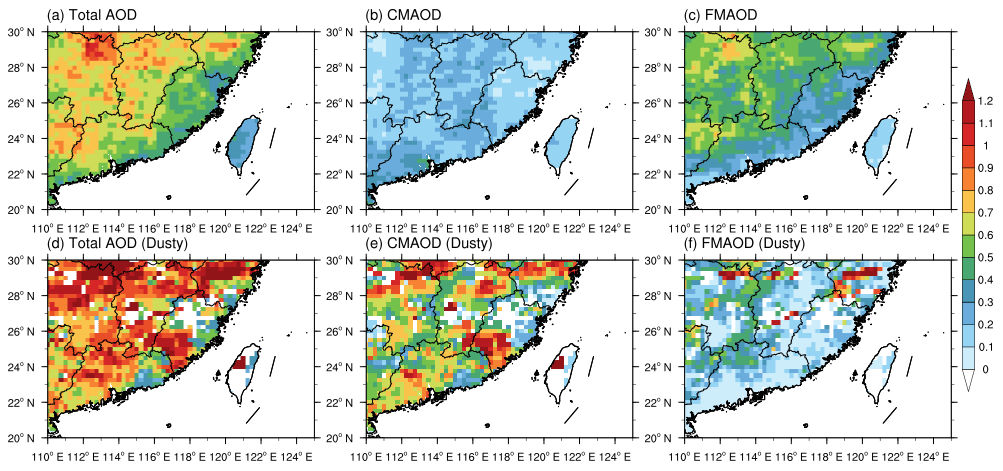
Figure 1The (a, d) total aerosol optical depth (AOD), (b, e) coarse-mode aerosol optical depth (CMAOD), and (c, f) fine-mode aerosol optical depth (FMAOD) on (a, b, c) all days and (d, e, f) dusty days in June, July, and August (JJA) from 2000 to 2013 using data retrieved from Terra MODIS.
The formation of precipitation is accompanied by the release or depletion of latent heat (LH), which plays an important role in maintaining the global energy balance (Houze, 1997; Li et al., 2019a). The standard TRMM 2A25 base LH products, derived using the convective–stratiform heating (CSH) algorithm (Tao et al., 1993, 2010), the spectrum latent heating (SLH) algorithm (Shige et al., 2004, 2007), and the recently developed vertical profile heating (VPH) algorithm (Li et al., 2011a, 2019a), were used in this study to investigate the possible impacts of aerosols on precipitation LH.
The standard 3 km horizontal resolution MOD04_3K aerosol optical depth (AOD) product from the Moderate Resolution Imaging Spectroradiometer (MODIS) on the Terra satellite was used in this study. The retrieved AOD, the fine-mode fraction (FMF), and the coarse-mode AOD (CMAOD = AOD × (1 − FMF)) were combined to define dusty and pristine conditions. Because the AOD is not available under cloudy-sky conditions, for each 1×1 grid where precipitation was detected by the TRMM PR, the averaged AOD and CMAOD from the surrounding eight grids were assigned to the 1×1 grid. If the AOD values of all eight grids were missing, the precipitating grids' AOD values were recorded as missing, and such grids were excluded from this study. Otherwise, the averaged AOD from the eight grids' AOD values was assigned to the precipitating grid, although it was not required that all eight grids had AOD observations. The mean CMAOD values from all precipitating grids on the same day were then calculated. If the mean CMAOD value was larger than 0.5, the day was defined as a “dusty day”, and all rain samples on that day were defined as “polluted rain”. If the mean total AOD was less than 0.2, the day was defined as a “pristine day”, and all rain samples on that day were defined as “pristine rain”. Using these classification criteria for convective (stratiform) precipitation, over 83 % (84 %) of precipitating grids on pristine days showed total AOD values lower than 0.2 and over 87 % (79 %) of precipitating grids on dusty days showed CMAOD values greater than 0.5. In another words, a method such as this can represent the main features of the aerosol conditions and has the advantage of being able to show the large-scale atmospheric circulation as an “ensemble”, compared with the method of defining the aerosol conditions for each precipitation grid separately.
The atmospheric thermodynamic conditions in pristine or dusty environments were derived from hourly ERA5 reanalysis data at a 0.25∘ × 0.25∘ horizontal resolution (Hersbach et al., 2020). Parameters including the air temperature (T), zonal wind field (U), and meridional wind field (V) at the upper (300 hPa), middle (500 hPa), and lower (750 hPa) levels as well as the convective available potential energy (CAPE) were investigated. Each TRMM-PR-detected raining pixel was assigned the daily averaged ERA5 variables (averaged from all grids ±0.5∘ surrounding the raining pixel).
3.1 Coupling between the aerosol and meteorological conditions
In recent decades, the selected study area has undergone fast economic development. In summer, the area is generally dominated by anthropogenic-emission-related fine-mode aerosols (see the total AOD, CMAOD, and FMAOD on all days in Fig. 1a, b, and c, respectively). However, there are still some days on which heavy-dust aerosol in this area can be observed by satellite instruments, with high coarse-mode AOD values (Fig. 1d, e, f). During JJA in the 2000–2013 period, there were 46 raining days that were defined as dusty conditions, with CMAOD values exceeding 0.5 averaged from raining pixels; during the same period, 92 raining days were defined as pristine conditions, with area mean total AOD values smaller than 0.2.
The chosen study area is not an emission source for mineral dust; thus, the satellite-observed dust was transported from remote desert areas. Specific large-scale atmospheric circulation conditions are required to cause significant dust aerosol in this area. For example, on 12 June 2006, a typical precipitation day with dusty conditions, about half of the study area was covered by heavy dust (Fig. 2), with a satellite-observed CMAOD of up to 1. The back-trajectory analysis using the Hybrid Single-Particle Lagrangian Integrated Trajectory (HYSPLIT) (Fig. 2) showed that the dusty air mass was from the Gobi Desert and/or Taklamakan Desert. We also examined the backward trajectories of other dusty days, such as 20 June 2010 (Fig. S1 in the Supplement), 11 June 2012 (Fig. S2), and 16 June 2012 (Fig. S3), and the dusty air masses were from the Gobi Desert and/or Taklamakan Desert in these cases as well. This suggests that the backward trajectory of the dusty air mass on 12 June 2006 is representative of the whole study period. Furthermore, Liu et al. (2011) found that dust in southeastern China originated from the Gobi and Taklamakan deserts in northwestern China.
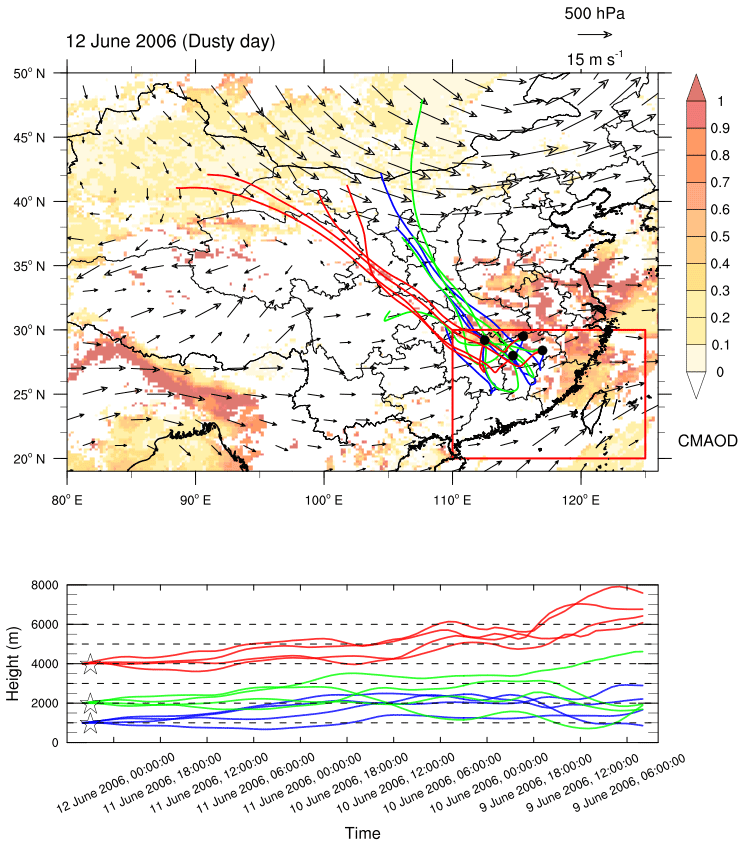
Figure 2The horizontal distribution of coarse-mode aerosol optical depth derived from Terra MODIS, wind fields at 500 hPa, and 72 h back trajectories from the HYSPLIT model on 12 June 2006. The red box indicates the study area, and the geolocations of the four starting points are at 29.5∘ N, 115.5∘ E; 28∘ N, 114.7∘ E; 28.4∘ N, 117∘ E; and 29.2∘ N, 112.5∘ E, with altitudes of 1000 m (blue line), 2000 m (green line), and 4000 m (red line), extrapolated from 12 June 2006 at 04:00 UTC.
Large-scale circulations at 300, 500, and 750 hPa were analyzed for dusty and pristine days (Figs. 3, S4). Generally, the dust emission source area in northern China is influenced by westerly winds. When the selected study area was affected by dusty conditions, the southward wind component was significantly strengthened in the 35–50 ∘ N belt and transported dust aerosol southward into the study area (Fig. S4). It also concurrently transported colder air masses from the north to the south, resulting in a temperature at 500 hPa that was about 1 ∘C colder than that under pristine conditions. In addition, when the study area was experiencing dusty conditions, the 1000–500 hPa layer U wind shear was about 2 times that reported under pristine conditions (5.1 m s−1 vs. 2.9 m s−1). Finally, as an overall measure of the regional mean atmospheric insatiability, regional CAPE was 600 J kg−1 under dusty conditions and 743 J kg−1 under pristine conditions.

Figure 3The fields of wind and temperature at 500 hPa (a, b, c), the U wind shear (d, e, f), and the CAPE (g, h, i) averaged from 46 selected dusty days (a, d, g) and 92 selected pristine days (b, e, h) in JJA during the 2000–2013 period, based on ERA5 reanalysis data at a 0.25∘ × 0.25∘ horizontal resolution; panels (c), (f), and (i) show the associated differences (dusty minus pristine) between the two conditions for each variable.
In summary, in southeastern China, heavy-dust conditions are generally accompanied by a certain synoptic pattern which is dominated by strong northerly wind. The spatial correlation coefficients between variables are as follows: CMAOD against CAPE is −0.07, CMAOD against T (700 hPa) is −0.08, CMAOD against U wind shear is 0.09, and CMAOD against U wind at 700 hPa is 0.07. Comparing dusty conditions with pristine conditions, the CAPE is lower, the air temperature is colder, the U wind shear is stronger, and the northerly wind is enhanced. On both dusty and pristine precipitation days, the synoptic forcing conditions favor the lifting of air masses and convection initiation compared with the conditions on non-precipitating days. Statistically, pristine precipitation events feature relatively higher CAPE values and lower wind shear, which may enhance the vertical development of the precipitating clouds. In the following discussion, the CAPE was used as an overall indicator to investigate the impacts of meteorological conditions on precipitation features. It should be emphasized that the difference in CAPE should mainly be determined by synoptic conditions rather than by aerosols.
3.2 Differences in the vertical profiles of precipitation
The precipitation vertical profiles, i.e., the function of the precipitation rate change with vertical height (temperature), contains information on the precipitating particles' growing mechanisms and speed during the path of precipitation from the top of the storm to the surface (Liu and Fu, 2001). Li et al. (2011a) further discussed how these profiles can be affected by large-scale circulations, such as those in the different phases of the El Niño–Southern Oscillation. Li et al. (2019a) directly used the vertical gradient of the precipitation rate to estimate the latent heating rate in clouds. However, few studies have reported the possible effects of dust aerosols on the shape of precipitation profiles.
It is expected that changes in the dynamic conditions will lead to changes in the precipitation profile. As shown in Fig. 4a and b, for a given NSRR, the PTT/PTH values under pristine conditions (dotted curves) are colder (higher) than those under dusty conditions (solid curves) for deep stratiform and convective precipitation. In the layer from the precipitation top to between about −10 and −5 ∘C, the mean precipitation rates under pristine conditions are higher than those under dusty conditions. However, in next layer, which ranges from about −5 to 2 ∘C, the precipitation rate under dusty conditions increases much faster than that under pristine conditions. The effect is so significant that the precipitation rate under dusty conditions exceeds the precipitation rate under pristine conditions at about 0 ∘C and keeps rapidly increasing. In the lowest layer, close to the surface, the precipitation rate under dusty conditions increases more slowly.
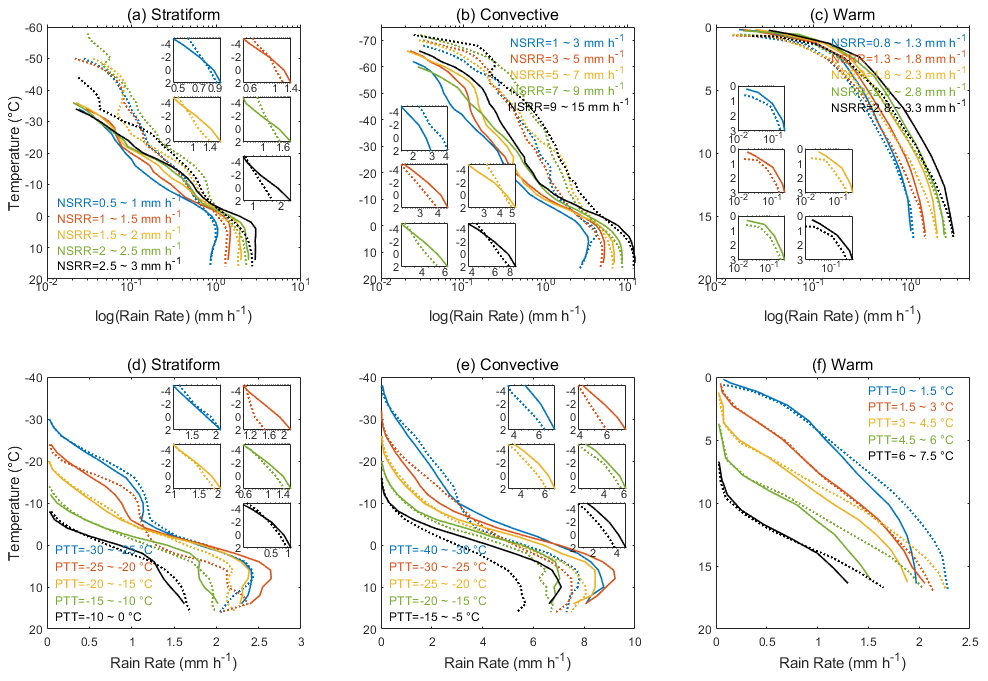
Figure 4Differences in the vertical profiles of stratiform (a, d), convective (b, e), and warm (c, f) precipitation for pristine (dashed lines) and dusty (solid lines) conditions for a given NSRR (a, b, c) or PTT (d, e, f). Different colors denote different NSRR or PTT values. Each panel focuses on the rain rate in the mixed layer (temperatures between −5 and 2 ∘C).
From another angle, when dropping from the same PTT (Fig. 4d, e), precipitating particles under dusty conditions grow more slowly than their pristine counterparts in the upmost layer. Starting from a temperature of around −10 to −5 ∘C, the precipitating particles under dusty conditions grow faster and obtain a large water mass in the middle layer. Although followed by a layer of slower growth, the final NSRR for a given PTT under dusty conditions (solid curve) is still higher than that of pristine rain (dotted curve). Such an effect is weak for stratiform rain, particularly that with relatively warm PTTs (e.g., black and green curves in Fig. 4d). This is because the proposed dust's IN effect generally works for ice-phase microphysical process; thus, for stratiform rain starting from warm PTTs, there is an insufficient water content and the temperatures are too warm for heterogeneous freezing take place.
For warm rain without ice-phase microphysical processes, for a given NSRR, a colder PTT is required for rain under dusty conditions (Fig. 4c). When dropping from the same PTT, the rain rate under dusty conditions increases more slowly than that of pristine rain and is weaker near the surface (Fig. 4f). This indicates the possible suppression of warm-rain growth by dusty conditions. During the long-range transport of dust from northern to southeastern China, it is very likely that the dust particles were coated by soluble aerosols and became active CCN (Li et al., 2010) in warm rain. For a given condensed liquid water content, these additional CCN lead to a smaller cloud effective radius and, thus, decrease the coalescence efficiency, which is the main mechanism for warm-rain growth (Rosenfeld et al., 2008; Min et al., 2009; Yin and Chen, 2007; Li et al., 2010).
Accompanying the changes in the vertical profiles, the latent heat released from precipitation under dusty conditions is also altered compared with pristine precipitation. Figure 5 represents the contoured frequency by altitude diagrams (CFADs) of LH (retrieved using the VPH method) for deep stratiform rain and convective rain, respectively. Under dusty conditions, stratiform and convective rain events exhibit an increase in positive heating near 5 km altitude and a decrease in negative heating (cooling) in the higher layer. Based on the difference between the CFADs of LH (Fig. 5c, f), negative difference values all appear around 5 km, where the heterogeneous freezing process dominates. The presence of dust intensifies the heterogeneous freezing process, making it easier for ice to form and resulting in an increase in positive heating and a decrease in cooling. The LH vertical structures of stratiform and convective rain events have a similar feedback to dust aerosol. Meanwhile, the cooling (i.e., negative LH) in the layer below 5 km is also enhanced (based on Fig. 5c, f).

Figure 5Contoured frequency by altitude diagrams (CFADs) of LH (retrieved using the VPH method) under pristine conditions (a, d), under dusty conditions (b, e), and the differences between the two conditions for (c, f) stratiform (a, b, c) and convective (d, e, f) precipitation.
Figure 6 shows the mean LH profiles for stratiform and convective precipitation derived from the three different LH algorithms (i.e., SLH, CSH, and VPH). For stratiform rain, there is no significant difference between the SLH and CSH algorithms for precipitation under pristine and dusty conditions at all heights, whereas the VPH method shows stronger latent heating under dusty conditions near 5–6 km.
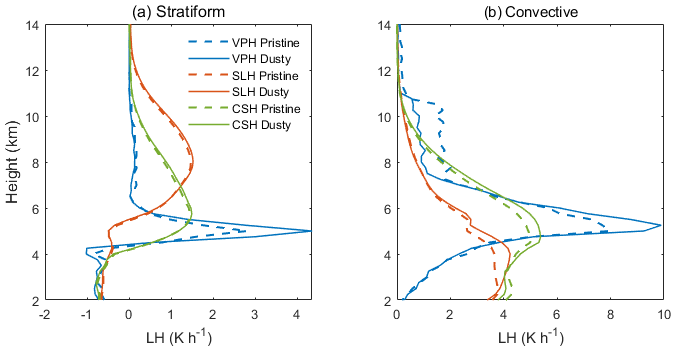
Figure 6The mean latent heating (LH) profiles retrieved using the VPH (blue), SLH (red), and CSH (green) algorithms for (a) stratiform precipitation and (b) convective precipitation under pristine (dashed lines) and dusty (solid lines) conditions.
For deep convective rain, the VPH method showed that the LH under dusty conditions was weaker than that in the pristine environment in the upper layers (above 8 km), whereas it was stronger in the middle layers (around 5–6 km). Both the CSH and SLH algorithms showed neglectable differences in the upper layer but also showed a stronger LH under dusty conditions in the middle and lower layers compared with pristine conditions.
There are significant differences in the mean LH profiles among the three algorithms, indicating large uncertainties in the satellite retrieval of LH. However, all three products agree that the LH in deep convective precipitation in the middle layer (around 5–6 km) under dusty conditions should be stronger than that under pristine conditions.
Validation of the satellite-retrieved LH is still a very challenging task (Tao et al., 2022), as there is no directly measured LH ground truth available. Intercomparison among different LH products is one useful indirect means of evaluating their accuracy. Based on Li et al. (2019a), the VPH product showed a reasonable LH structure over the Tibetan Plateau with both similarities and dissimilarities compared to CSH and SLH. In this study, the VPH product was chosen because it is directly related to the variation in the precipitation rate at each altitude, whereas the CSH and SLH retrievals use constraints with respect to the precipitation rate at the surface, the precipitation top height, the precipitation type, etc. However, it should be emphasized that the LH-related results did not receive rigorous validation in this study area and, thus, should be treated with caution.
3.3 Differences in the growth rate of precipitation
In this section, we adopt the same method as Li et al. (2011a) in that we use the linear regression slope of the precipitation rate (at logarithm) against the temperature (i.e., dlogR dT−1) to quantify the differences in the growth rate in different layers between dusty and pristine conditions.
In a PTT–NSRR space, the mean SlopeA (upper layer), SlopeB (middle layer), and SlopeC (lower layer) under pristine and dusty conditions were compared, as shown in Figs. 7, 8, and S5.
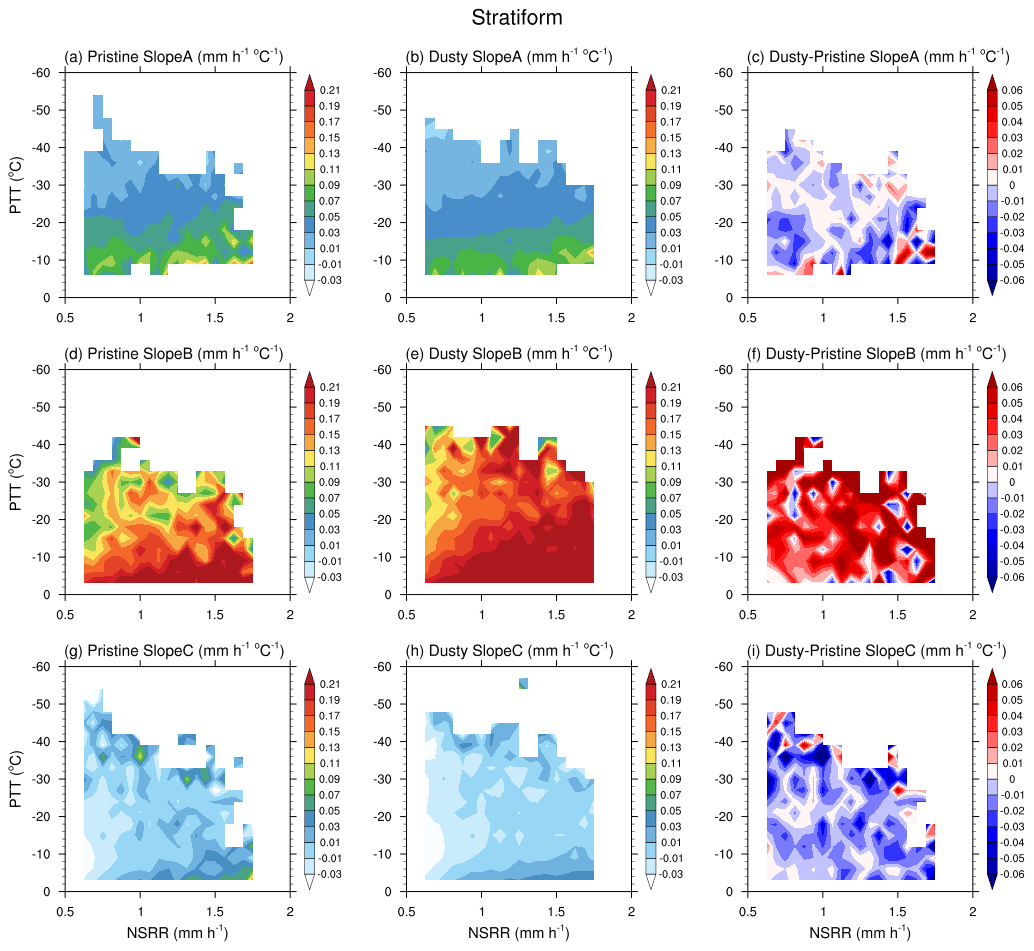
Figure 7The mean SlopeA (a, b, c), SlopeB (d, e, f), and SlopeC (g, h, i) for stratiform precipitation as functions of the near-surface rain rate (NSRR) and precipitation top temperature (PTT) under pristine (a, d, g) and dusty (b, e, h) conditions; panels (c), (f), and (i) show the differences (dusty minus pristine) between the two conditions for each layer.
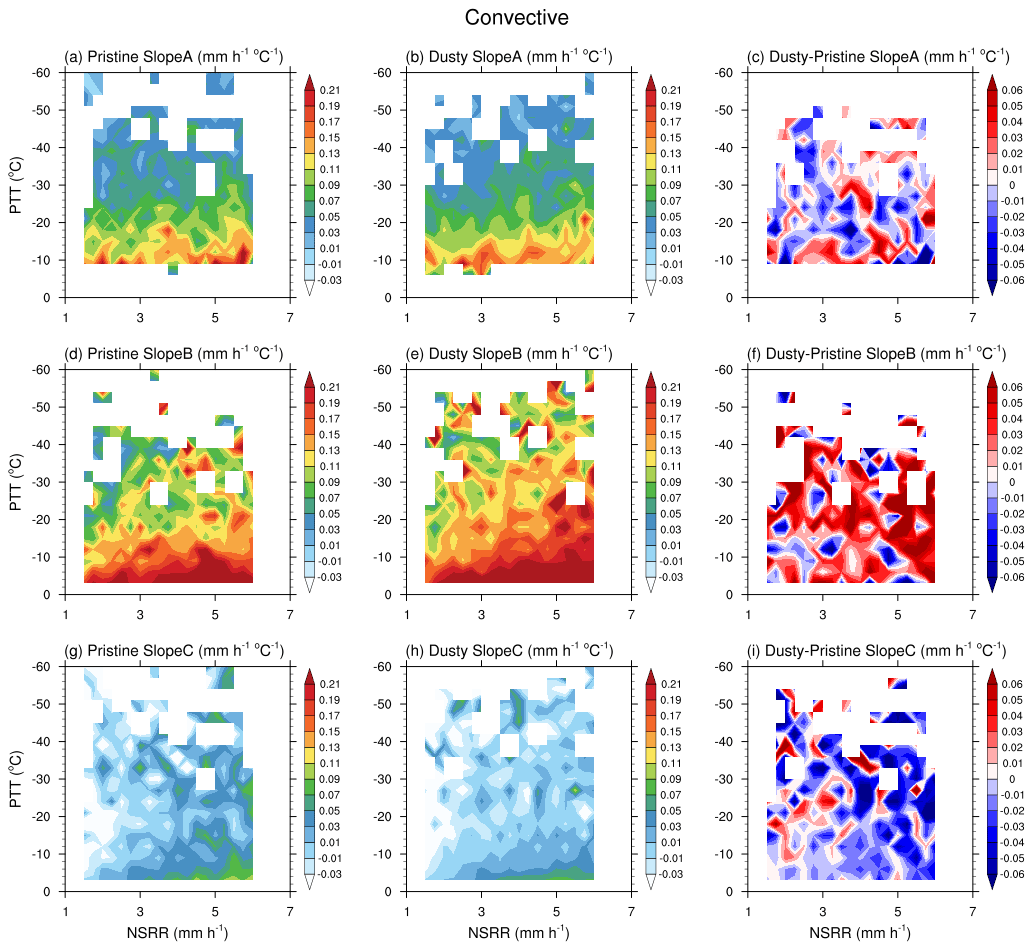
For stratiform and convective precipitation (Figs. 7 and 8, respectively), for a given NSRR, all slopes decrease with decreasing PTT (i.e., increasing PTH). For a given PTT, SlopeA and SlopeB increase with NSRR, whereas SlopeC is almost insensitive to NSRR. This indicates that the growth rate in the upper and middle layers is critical to the determination of the final surface rain rate. It should be noted that, although both the PTT and NSRR are constrained, SlopeB is still significantly stronger under dusty conditions than under pristine conditions (Figs. 7f, 8f); moreover, SlopeA is not significantly different, and SlopeC is weaker under dusty conditions than under pristine conditions.

Figure 9The precipitation top temperature (PTT) against the near-surface rain rate (NSRR) for (a, d) stratiform, (b, e) convective, and (c, f) warm precipitation under (a, b, c) pristine (dotted curves) and dusty (solid curves) conditions and (d, e, f) with different CAPE values (black line: weak CAPE; gray line: strong CAPE) under pristine conditions.
With respect to warm rain (Fig. S5), for a given NSRR, SlopeC increases with increasing PTT. For a given PTT, SlopeC also increases with NSRR. Even if both the PTT and NSRR are constrained, SlopeC is still significantly weaker under dusty conditions than under pristine conditions (Fig. S5c).
For a given PTT, the mean SlopeA of pristine stratiform precipitation (dashed curve in Fig. S6a) is slightly greater than that for precipitation under dusty conditions. However, SlopeB for both convective and stratiform rain under dusty conditions is remarkably greater than its pristine counterpart (Fig. S6c, d). Moreover, a t test showed that most differences in the SlopeB exceeded the 95 % or 99 % confidence level (Fig. S7). This finding strongly supports the hypothesis that dust aerosol enhanced the heterogeneous freezing process at temperatures much higher than −38 ∘C (the threshold for homogeneous freezing). Under dusty conditions, there are more ice-phase hydrometeors in the middle layer to favor the aggregation and rimming processes; thus, precipitation drops can grow faster under dusty conditions than under pristine conditions. Furthermore, the slightly weaker SlopeA under dusty conditions can be explained by the fact that the fast formation of cloud and precipitation in the middle layer exhausted water vapor in the middle layer, meaning that little water vapor in the upper layer can be used for precipitation growth under dusty conditions.
In the lowest layer, when precipitation particles fall to the ground, the SlopeC of stratiform precipitation is basically negative (Fig. S6e), which corresponds to the evaporative and/or breakup processes of raindrops. From the analysis in Sect. 3.1, it is known that dusty conditions correspond to a stronger U wind shear (Fig. 3d, e, f) and that the stronger wind shear may enhance the evaporative and/or breakup processes (Fan et al., 2009, 2013; Li et at., 2010). Figure S6 in the Supplement confirms that SlopeC of stratiform rain under dusty conditions is more negative than that under pristine conditions. During convective precipitation in the lowest layer, raindrops can still slightly increase through the coalescence of cloud droplets. Based on the observations, SlopeC of convective rain under dusty conditions is smaller than that under pristine conditions, indicating that the coalescence process of cloud droplets was suppressed. The strong wind shear under dusty conditions may cause this suppression. With respect to warm rain, SlopeC under dusty conditions is significantly smaller than that under pristine conditions, and a t test showed that differences in SlopeC exceeded the 99 % confidence level (Fig. S8), indicating that dust suppresses warm rain. In addition, polluted dust particles may also act as CCN, decreasing the effective radius of cloud droplets and inhibiting the coalescence efficiency (warm rain), as suggested by Rosenfeld (2008), Li et al. (2010), Min et al. (2009), and Yin and Chen (2007).
It is interesting to note that the dependence of the slope on the PTT becomes stronger from SlopeC to SlopeA (Fig. S6). The precipitation particle growth rates in the upper layer (water vapor deposition process) and middle layer (aggregation and riming processes) are critical to the determination of the final surface rain rate. SlopeA and SlopeB are more sensitive to the PTT. With respect to SlopeC in the lower layer, the convective precipitation rate shows a slight increase due to coalescence with cloud droplets. However, in the layer very close to the surface, the rain rate no longer increases; instead, it decreases due to breakup and/or evaporation. For stratiform precipitation, the rain rate in this layer does not increase due to the lack of updraft. Therefore, SlopeC is not sensitive to the PTT.
3.4 The sensitivity of the PTT to CAPE and aerosol
The PTT has a close relationship with the near-surface rain rate (NSRR): a higher PTT is related to a longer falling pathway over which more cloud droplets can be collected and, thus, a heavier NSRR can be reached. However, the formation of ice and liquid cloud droplets, the growing mechanisms, and the collision efficiencies can all be modified by dynamic, thermodynamic, and microphysical processes. Aerosols, acting as either CCN or IN, also have the potential capability to modulate the quantitative relationship between the PTT and NSRR.
The PTT–NSRR relationships for stratiform, convective, and warm rain under pristine (dotted line) and dusty (solid line) conditions as well as for different levels of CAPE are shown in Fig. 9. For a given NSRR, the PTT under pristine conditions is colder than that under dusty conditions (i.e., the precipitation top is higher). For a given PTT, the precipitation rate NSRR under dusty conditions is stronger than that under pristine conditions. This confirms that the changes in the microphysical processes (e.g., Figs. 7 and 8) induced by dust aerosol can lead to measurable changes in the precipitation characteristics at the macroscopic scale.
The CAPE is one of the most representative parameters of atmospheric dynamic conditions, can reflect the overall stability of the atmosphere, and has been widely used to quantify the dynamic constraints on convection development in aerosol–cloud interaction studies (e.g., Doswell and Rasmussen, 1994). We tested the impacts of the CAPE on the PTT–NSRR relationship in pristine samples to alleviate any confounding effects from aerosols.
All pristine stratiform and convective rain samples are divided into two groups – those with strong CAPE (i.e., over 700 J kg−1 for stratiform rain and over 1100 J kg−1 for convective rain) and those with weak CAPE (i.e., weaker than 350 J kg−1 for stratiform rain and weaker than 700 J kg−1 for convective rain) – in order to explore the impacts of dynamic conditions on the PTT–NSRR relationship. There were two criteria for the selection of the CAPE thresholds: (1) the differences between the defined strong and weak CAPE groups should be great enough and (2) it is required that both groups have a large enough sample size. After the experiment, it was found that a threshold of 25 % (55 %) of the cumulative probability of CAPE for weak (strong) CAPE was more appropriate for pristine rain samples. As shown in Fig. 9d, e, and f, the CAPE changed the relationship between the NSRR and PTT. For a given NSRR, PTTs under stronger CAPE conditions (gray curves) were about 5–6 (2.0) ∘C colder than those under weaker CAPE conditions (black curves) for both stratiform and convective rain (warm rain) events under pristine conditions. The significance of the difference, calculated using a t test, exceeded the 99 % confidence level (Fig. S9). This indicates that strong dynamic conditions will favor raindrops reaching high altitudes with colder PTTs. Meanwhile, it was found that the linear regression slopes of K in Eq. (1) are similar for different CAPE values (Fig. 9d, e, f). This indicates that the final rain rate reaching the Earth surface (NSRR) is proportional to the PTT with the same coefficient of 1/K. In other words, the growth rates of rain drops along the falling path are similar under pristine environmental conditions.
As the satellite observations showed that the PTT has a good linear relationship with the NSRR (Fig. 9), the PTT can be expressed as a linear function of NSRR as follows:
where PTT is the precipitation top temperature (∘C), NSRR is the near-surface rain rate (mm h−1), K is the linear regression slope, and PTT0 is the intercept when NSRR equals zero. Physically, PTT0 represents the PTT related to rain onset (when NSRR equals to zero), and K represents the sensitivity of PTT to NSRR. Previous investigations have demonstrated that K is relatively stable for different CAPE values or aerosol conditions (Dong et al., 2018; Li et al., 2011a); thus, we mainly focus on the variation in PTT0.
Cloud dynamics and aerosol-related microphysics have a combined effect on the PTT–NSRR relationship. For the difference in PTT0 between two groups of samples with different CAPE and dust AOD values, we separate the difference in PTT0 as follows:
where represents the sensitivity of PTT0 to CAPE and represents the sensitivity of PTT0 to aerosols.
Therefore,
To determine the sensitivity of , we randomly selected 70 % of the pristine precipitation samples (to avoid potential contamination from aerosol effects) to investigate the relationship between PTT0 and CAPE. All of the samples were sorted into six bins with increasing CAPE values, and the sample sizes for each bin were generally the same. For each bin, a linear regression was conducted to determine K and PTT0, following Eq. (1). To determine the uncertainty in this estimation, we repeated the random selection processes 40 times. All of the results are shown in Fig. 10.
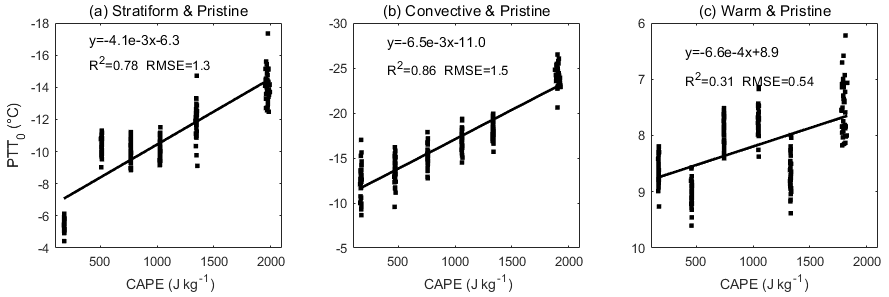
Figure 10The variation in the PTT0 with CAPE under pristine conditions for (a) deep stratiform precipitation, (b) deep convective precipitation, and (c) warm precipitation. The results are derived from a randomly selected 70 % of the pristine precipitation samples.
As can be seen, the PTT0 shows a very strong linear correlation with CAPE. The determining factors are 0.78, 0.86, and 0.31 for deep stratiform, convective, and warm precipitation, respectively. With an increasing CAPE, cloud drops are easily elevated to a higher altitude (low PTT0), and precipitation embryos start to form in this region.
Quantitatively, it was estimated that the PTT0 decreases by 0.41 ∘C per 100 J kg−1 of CAPE (see the linear regression slope in Fig. 10) for deep stratiform precipitation with a variation of 12 % (standard deviation of 40 times the estimations of divided by the mean . Moreover, PTT0 decreases by 0.65 ∘C per 100 J kg−1 of CAPE for deep convective precipitation with a variation of 15 %. For warm rain, PTT0 only decreases by 0.066 ∘C per 100 J kg−1 of CAPE but with a large variation of 38 %, indicating that this method did not work well in this case.
Finally, substituting the estimated , the mean values of ΔPTT0, ΔAOD, and ΔCAPE between dusty and pristine samples, into Eq. (3), the sensitivity of PTT0 to the AOD was obtained. The PTT0 increases by 4.19 ∘C per unit AOD for deep convective precipitation and by 0.35 ∘C per unit AOD for stratiform precipitation. The results for warm rain are not shown here due to their large uncertainties.
Mineral dust is the aerosol type with the largest proportion of mass on land and can act as both IN and CCN to affect clouds and precipitation. At present, the study of the indirect effects of dust aerosols on climate has shifted from qualitative to quantitative. It is expected that the effects of dust aerosols on clouds and precipitation can be accurately described in numerical models. A typical example of this is seen in Demott et al. (2010), who directly wrote the number density of aerosols with an effective radius greater than 0.5 µm (mainly dust) into the IN parameterization formulas in cloud-resolution mode. However, the effectiveness of such model parameterizations is hard to assess with large-scale satellite observations. The physical characteristics of clouds or precipitation in real observations are affected by both aerosol indirect effects (if there are any) and atmospheric thermodynamic and dynamic effects. Unfortunately, isolating these two types of effects is the most difficult part of observational study on the cloud–aerosol interaction.
In this study, we selected southeastern China, which is far removed from the study area's original source of dust. Here, heavy-dust conditions are often accompanied by strong northwesterly winds, strong wind shear, cold air temperatures, and a weak CAPE. Such relatively fixed weather conditions facilitate the isolation of aerosol indirect effects from dynamic effects. In order to study the IN effect of dust, we selected the vertical profile of precipitation observed by spaceborne rain radar measurements as the basic data. By coupling multisource satellite data and reanalysis data, dust-affected and pristine precipitation samples in June, July, and August (JJA) from 2000 to 2013 were separated for comparative analysis.
First, it was found that there was a difference in the averaged vertical profile between dust-affected and pristine samples. For the same PTT, the precipitation rate under dusty conditions was weaker than that of pristine precipitation in the upper layer. In the middle layer, the precipitation rate under dusty conditions was significantly larger than that of pristine precipitation. Moreover, the precipitation rate near surface was also larger under dusty conditions. By quantifying the rate of precipitation growth, it was found that the growth of precipitation under dusty conditions is slower in the upper layers. However, in the middle layer, the growth rate of precipitation under dusty conditions is remarkably faster than that of pristine precipitation. Qualitatively, these phenomena confirmed that mineral dust can enhance the heterogeneous freezing process and lead to observable changes in the precipitation rate.
In the chosen study area, heavy-dust conditions are always coupled with strong wind shear, which favors evaporation process in the lower layers (temperatures higher than 2 ∘C) of stratiform precipitation, corresponding to a stronger cooling. Stronger wind shear is also unfavorable to the warm-rain process due to the suppression of cloud droplet coalescence. Dust aerosols may delay the onset of weak precipitation in the lower layers; thus, more water droplets are lifted to the middle layers (temperature between −5 and 2 ∘C) where dust aerosols can act as additional IN to enhance heterogeneous freezing. Consequently, in the middle layer, precipitation particles grow rapidly through aggregation and riming, releasing large amounts of additional latent heat.
As a macroscopic manifestation of the above microphysical processes, we found that, for a certain surface precipitation rate, the PTT of precipitation under dusty conditions is higher than that of pristine precipitation. This is a combination of specific weather conditions and potential aerosol indirect effects on dust days. Through data analysis, we found that the onset PTT of convective precipitation and stratiform precipitation will increase by 0.65 and 0.41 ∘C, respectively, for every 100 J kg−1 decrease in CAPE. This is the first reason for the higher PTT on dusty days. In addition, for every unit increase in the AOD of dust aerosols in the atmosphere, the PTT of convective precipitation and stratiform precipitation will increase by 4.19 and 0.35 ∘C, respectively. This is the second reason for the higher temperature of the precipitation rain top on dusty days.
To our knowledge, this is the first study that has attempted to separate the contribution of aerosols from satellite-observed PTT using real satellite observations. The results of this work can be used to evaluate cloud-resolving model simulations and to assess the performance of model parametrizations related to the dust aerosol IN effect.
Although heavy-dust days in southeastern China are not frequent, the area's general synoptical pattern provided us with an ideal test bed to isolate dust aerosol effects from dynamic effects on precipitation. Moreover, the associated mechanism and effects should be valid in other regions where the dynamic effects may not be easily isolated. The method of isolating the influence of dynamic and aerosol conditions on cloud precipitation can also be applied to other regions.
It should be noted that there are several uncertainties in this study: there are uncertainties in the MODIS retrieval of aerosols over land (Chu et al., 2002), and the uncertainty in the FMF retrieval is about ±0.2 (Tanre et al., 1996, 1997). There is also still no long-term, large-scale dust observation product to solve this problem precisely. Instead, multiple studies have been conducted based on MODIS-retrieved FMF information. For example, Kaufman et al. (2002, 2005) and Gao et al. (2001) utilized the FMF-derived CMAOD to represent dust in order to study the transport and deposition of dust and the related impact on the climate system. Min et al. (2009) and Li et al. (2010) applied the MODIS-derived coarse-mode AOD to classify dust aerosols over Atlantic Ocean in order to study their impacts on cloud and precipitation profiles. The Cloud-Aerosol Lidar and Infrared Pathfinder Satellite Observations (CALIPSO) Level 2 lidar vertical feature mask (VFM) data product uses the particle depolarization ratio to determine the dust. However, CALIPSO only has nadir observations, and the data obtained from narrow orbits are very limited. Therefore, we did not use the CALIPSO data as the basis for judging dust in this study. However, it can be used as supporting evidence for the adoption of CMAOD by MODIS in order to determine dust. For example, CMAOD shows typical dusty precipitation days on 25 June 2011 and 9 July 2011, and CALIPSO's VFM product likewise shows that the aerosols on that day were indeed predominantly dust (Fig. S10). We performed a sensitivity test assuming that there is a random error of up to ±20 % in CMAOD and that the PTT–NSRR relationships for the new data (Fig. S11) and the original data (Fig. 9) remain unchanged; that is, there is some error in CMAOD, but it does not subvert the conclusions of this study. In addition, in this work, we have not considered the aerosol humidification effect in the presence of precipitation, which may increase the retrieval error of the FMF in the MODIS aerosol product. Firstly, the MODIS algorithm filters out pixels within 1 km of detectable clouds, where the effect of aerosol humidification will be the greatest (Martins et al., 2002). Furthermore, this algorithm significantly reduces the effect of relative humidity on AOD retrievals (Remer et al., 2005). Secondly, Altaratz et al. (2013) performed radiative transfer calculations using 12 years of June–August radiosonde measurements and found that, at continental stations, the AOD increased by 4 % and 5 % for the 1 and 2 km layers, respectively, for an aerosol hygroscopicity of 0.3, whereas it increased by 5 % and 4 % for the 1 and 2 km layer, respectively, for an aerosol hygroscopicity of 0.7. Thus, the effect of changes in the relative humidity on AOD is limited. In our study, assuming a 5 % hygroscopic growth of AOD, the relative increase in for stratiform (convective) precipitation is 2.8 % (3.3 %). Such an effect will not significantly change our conclusion. In addition, the relationship between NSRR and PTT is influenced by multiple dynamic factors. Sensitivity tests of PTT0 to updraft velocity (W), water vapor (relative humidity), and wind shear were conducted using the same method as for CAPE (Figs. S12, S13, S14). The relationship of PTT0 to the abovementioned variables at 750 and 500 hPa is not as stable and significant as that for CAPE. This is because the PTH varied from case to case and is sensitive to multiple factors at various altitudes. The CAPE, as a measure of the convective instability energy, has the best representativeness with respect to the dynamic effects on the precipitation vertical structure. Therefore, in this study, we mainly focused on CAPE.
Precipitation data were obtained from the Tropical Rainfall Measuring Mission (TRMM) satellite product (https://gpm.nasa.gov/missions/trmm, last access: 1 July 2022, NASA, 2023a). The standard TRMM 2A25 base latent heat products, derived using the convective–stratiform heating (CSH) and spectrum latent heating (SLH) algorithms, are available from https://search.earthdata.nasa.gov/search?q=TRMM (last access: 1 July 2022, EarthData, 2023). The latent heat products, derived using the vertical profile heating (VPH) algorithm, are available from Hongxia Zhu (zhx227@mail.ustc.edu.cn). Aerosol optical depth data were obtained from the Moderate Resolution Imaging Spectroradiometer (MODIS) on the Terra satellite (https://modis.gsfc.nasa.gov/, last access: 1 July 2022, NASA, 2023b). The data for the back-trajectory analysis were obtained from the Hybrid Single-Particle Lagrangian Integrated Trajectory (HYSPLIT) model (https://www.ready.noaa.gov/hypub-bin/trajtype.pl?runtype=archive, last access: 8 January 2023, NOAA, 2023). The Cloud-Aerosol Lidar and Infrared Pathfinder Satellite Observations (CALIPSO) Level 2 lidar vertical feature mask (VFM) data products are available from https://subset.larc.nasa.gov/calipso/ (last access: 10 November 2022, NASA, 2023c). Hourly meteorological data were obtained from European Centre for Medium-Range Weather Forecasts ERA5 reanalysis (https://www.ecmwf.int/, last access: 1 July 2022, ECMWF, 2023).
The supplement related to this article is available online at: https://doi.org/10.5194/acp-23-2421-2023-supplement.
RL designed the experiments, and HZ and SY carried them out. SY and CH conducted the latent heat retrieval. HZ and RL prepared the manuscript with contributions from all co-authors.
The contact author has declared that none of the authors has any competing interests.
Publisher’s note: Copernicus Publications remains neutral with regard to jurisdictional claims in published maps and institutional affiliations.
This work was supported by the National Natural Science Foundation of China (grant nos. 41830104, 42275139, and 41375148), the National Key Research and Development Program of China (grant no. 2021YFC3000300), and the Jiangsu provincial 2011 Program (Collaborative Innovation Center of Climate Change).
This research has been supported by the National Natural Science Foundation of China (grant nos. 41830104, 42275139, 41375148) and the National Key Research and Development Program of China (grant no. 2021YFC3000300).
This paper was edited by Zhanqing Li and reviewed by four anonymous referees.
Altaratz, O., Bar-Or, R. Z., Wollner, U., and Koren, I.: Relative humidity and its effect on aerosol optical depth in the vicinity of convective clouds, Environ. Res. Lett., 8, 034025, https://doi.org/10.1088/1748-9326/8/3/034025, 2013.
Atkinson, J. D., Murray, B. J., Woodhouse, M. T., Whale, T. F., Baustian, K. J., Carslaw, K. S., Dobbie, S., O'Sullivan, D., and Malkin, T. L.: The importance of feldspar for ice nucleation by mineral dust in mixed-phase clouds, Nature, 498, 355–358, https://doi.org/10.1038/nature12278, 2013.
Awaka, J., Iguchi, T., Kumagai, H., Okamoto, K., and Ieee: Rain type classification algorithm for TRMM precipitation radar, 1997 International Geoscience and Remote Sensing Symposium (IGARSS 97) on Remote Sensing – A Scientific Vision for Sustainable Development, Singapore, Singapore, 3–8 August 1997, WOS:A1997BJ48Y00499, 1633–1635, 1997.
Bellouin, N., Boucher, O., Haywood, J., and Reddy, M. S.: Global estimate of aerosol direct radiative forcing from satellite measurements, Nature, 438, 1138–1141, https://doi.org/10.1038/nature04348, 2005.
Cao, Q. and Qi, Y.: The variability of vertical structure of precipitation in Huaihe River Basin of China: Implications from long-term spaceborne observations with TRMM precipitation radar, Water Resour. Res., 50, 3690–3705, https://doi.org/10.1002/2013wr014555, 2014.
Chen, T., Guo, J., Li, Z., Zhao, C., and He, J.: A cloudsat perspective on the cloud climatology and its association with aerosol perturbations in the vertical over eastern china, J. Atmos. Sci., 73, 9, https://doi.org/10.1175/JAS-D-15-0309.1, 2016.
Chu, D. A., Kaufman, Y. J., Ichoku, C., Remer, L. A., Tanre, D., and Holben, B. N.: Validation of MODIS aerosol optical depth retrieval over land, Geophys. Res. Lett., 29, 1617, https://doi.org/10.1029/2001gl013205, 2002.
DeMott, P. J., Sassen, K., Poellot, M. R., Baumgardner, D., Rogers, D. C., Brooks, S. D., Prenni, A. J., and Kreidenweis, S. M.: African dust aerosols as atmospheric ice nuclei, Geophys. Res. Lett., 30, 1732, https://doi.org/10.1029/2003gl017410, 2003.
DeMott, P. J., Prenni, A. J., Liu, X., Kreidenweis, S. M., Petters, M. D., Twohy, C. H., Richardson, M. S., Eidhammer, T., and Rogers, D. C.: Predicting global atmospheric ice nuclei distributions and their impacts on climate, P. Natl. Acad. Sci. USA, 107, 11217–11222, https://doi.org/10.1073/pnas.0910818107, 2010.
Dong, X., Li, R., Wang, Y., Fu, Y., and Zhao, C.: Potential Impacts of Sahara Dust Aerosol on Rainfall Vertical Structure Over the Atlantic Ocean as Identified From EOF Analysis, J. Geophys. Res.-Atmos, 123, 8850–8868, https://doi.org/10.1029/2018jd028500, 2018.
Doswell, C. A. and Rasmussen, E. N.: THE EFFECT OF NEGLECTING THE VIRTUAL TEMPERATURE CORRECTION ON CAPE CALCULATIONS, Weather Forecast., 9, 625–629, https://doi.org/10.1175/1520-0434(1994)009<0625:Teontv>2.0.Co;2, 1994.
EarthData: TRMM, Earth Data Search [data set], https://search.earthdata.nasa.gov/search?q=TRMM (last access: 1 July 2022), 2023.
ECMWF: Advancing global NWP through international collaboration, ECMWF [data set], https://www.ecmwf.int/ (last access: 1 July 2022), 2023.
Fan, J., Yuan, T., Comstock, J. M., Ghan, S., Khain, A., Leung, L. R., Li, Z., Martins, V. J., and Ovchinnikov, M.: Dominant role by vertical wind shear in regulating aerosol effects on deep convective clouds, J. Geophys. Res.-Atmos., 114, D22206, https://doi.org/10.1029/2009jd012352, 2009.
Fan, J., Leung, L. R., Rosenfeld, D., Chen, Q., Li, Z., Zhang, J., and Yan, H.: Microphysical effects determine macrophysical response for aerosol impacts on deep convective clouds, P. Natl. Acad. Sci. USA, 110, E4581–E4590, https://doi.org/10.1073/pnas.1316830110, 2013.
Fan, J., Rosenfeld, D., Zhang, Y., Giangrande, S. E., Li, Z., Machado, L. A. T., Martin, S. T., Yang, Y., Wang, J., Artaxo, P., Barbosa, H. M. J., Braga, R. C., Comstock, J. M., Feng, Z., Gao, W., Gomes, H. B., Mei, F., Poehlker, C., Poehlker, M. L., Poeschl, U., and de Souza, R. A. F.: Substantial convection and precipitation enhancements by ultrafine aerosol particles, Science, 359, 411 pp., https://doi.org/10.1126/science.aan8461, 2018.
Gao, Y., Kaufman, Y. J., Tanre, D., Kolber, D., and Falkowski, P. G.: Seasonal distributions of aeolian iron fluxes to the global ocean, Geophys. Res. Lett., 28, 29–32, https://doi.org/10.1029/2000gl011926, 2001.
Gibbons, M., Min, Q., and Fan, J.: Investigating the impacts of Saharan dust on tropical deep convection using spectral bin microphysics, Atmos. Chem. Phys., 18, 12161–12184, https://doi.org/10.5194/acp-18-12161-2018, 2018.
Guo, J., Liu, H., Li, Z., Rosenfeld, D., Jiang, M., Xu, W., Jiang, J. H., He, J., Chen, D., Min, M., and Zhai, P.: Aerosol-induced changes in the vertical structure of precipitation: a perspective of TRMM precipitation radar, Atmos. Chem. Phys., 18, 13329–13343, https://doi.org/10.5194/acp-18-13329-2018, 2018.
Hersbach, H., Bell, B., Berrisford, P., Hirahara, S., Horanyi, A., Munoz-Sabater, J., Nicolas, J., Peubey, C., Radu, R., Schepers, D., Simmons, A., Soci, C., Abdalla, S., Abellan, X., Balsamo, G., Bechtold, P., Biavati, G., Bidlot, J., Bonavita, M., De Chiara, G., Dahlgren, P., Dee, D., Diamantakis, M., Dragani, R., Flemming, J., Forbes, R., Fuentes, M., Geer, A., Haimberger, L., Healy, S., Hogan, R. J., Holm, E., Janiskova, M., Keeley, S., Laloyaux, P., Lopez, P., Lupu, C., Radnoti, G., de Rosnay, P., Rozum, I., Vamborg, F., Villaume, S., and Thepaut, J.-N.: The ERA5 global reanalysis, Q. J. Roy. Meteorol. Soc., 146, 1999–2049, https://doi.org/10.1002/qj.3803, 2020.
Houze, R. A.: Stratiform precipitation in regions of convection: A meteorological paradox?, B. Am. Meteorol. Soc., 78, 2179–2196, https://doi.org/10.1175/1520-0477(1997)078<2179:Spiroc>2.0.Co;2, 1997.
Huang, J., Wang, T., Wang, W., Li, Z., and Yan, H.: Climate effects of dust aerosols over East Asian arid and semiarid regions, J. Geophys. Res.-Atmos, 119, 11398–11416, https://doi.org/10.1002/2014jd021796, 2014.
Iguchi, T., Meneghini, R., Awaka, J., Kozu, T., and Okamoto, K.: Rain profiling algorithm for TRMM precipitation radar data, in: Remote Sensing and Applications: Earth, Atmosphere and Oceans, edited by: Igarashi, T., Nakamura, K., Shimoda, H., Tanaka, T., Burrows, J. P., Nakajima, T., Talagrand, O., and Naeije, M. C., Adv. Space Res.-Series, 5, 973–976, https://doi.org/10.1016/s0273-1177(99)00933-3, 2000.
Jiang, J. H., Su, H., Huang, L., Wang, Y., Massie, S., Zhao, B., Omar, A., and Wang, Z.: Contrasting effects on deep convective clouds by different types of aerosols, Nat. Commun., 9, 3874, https://doi.org/10.1038/s41467-018-06280-4, 2018.
Kaufman, Y. J., Tanre, D., and Boucher, O.: A satellite view of aerosols in the climate system, Nature, 419, 215–223, https://doi.org/10.1038/nature01091, 2002.
Kaufman, Y. J., Koren, I., Remer, L. A., Tanre, D., Ginoux, P., and Fan, S.: Dust transport and deposition observed from the Terra-Moderate Resolution Imaging Spectroradiometer ( MODIS) spacecraft over the Atlantic ocean, J. Geophys. Res.-Atmos., 110, D10s12, https://doi.org/10.1029/2003jd004436, 2005.
Khain, A. P.: Notes on state-of-the-art investigations of aerosol effects on precipitation: a critical review, Environ. Res. Lett., 4, 015004, https://doi.org/10.1088/1748-9326/4/1/015004, 2009.
Lee, S. S., Um, J., Choi, W. J., Ha, K. J., Jung, C. H., Guo, J. P., and Zheng, Y. T.: Impacts of an aerosol layer on a midlatitude continental system of cumulus clouds: how do these impacts depend on the vertical location of the aerosol layer?, Atmos. Chem. Phys, 23, 273–286, https://doi.org/10.5194/acp-23-273-2023, 2023.
Li, R. and Min, Q. L.: Impacts of mineral dust on the vertical structure of precipitation, J. Geophys. Res.-Atmos, 115, D09203, https://doi.org/10.1029/2009jd011925, 2010.
Li, R., Min, Q. L., and Harrison, L. C.: A Case Study: The Indirect Aerosol Effects of Mineral Dust on Warm Clouds, J. Atmos. Sci., 67, 805–816, https://doi.org/10.1175/2009jas3235.1, 2010.
Li, R., Min, Q., and Fu, Y.: 1997/98 El Nino-Induced Changes in Rainfall Vertical Structure in the East Pacific, J. Climate, 24, 6373–6391, https://doi.org/10.1175/jcli-d-11-00002.1, 2011a.
Li, Z., Niu, F., Fan, J., Liu, Y., Rosenfeld, D., and Ding, Y.: Long-term impacts of aerosols on the vertical development of clouds and precipitation, Nat. Geosci., 4, 888–894, https://doi.org/10.1038/ngeo1313, 2011b.
Li, R., Dong, X., Guo, J., Fu, Y., Zhao, C., Wang, Y., and Min, Q.: The implications of dust ice nuclei effect on cloud top temperature in a complex mesoscale convective system, Sci. Rep., 7, 13826, https://doi.org/10.1038/s41598-017-12681-0, 2017a.
Li, Z., Guo, J., Ding, A., Liao, H., Liu, J., Sun, Y., Wang, T., Xue, H., Zhang, H., and Zhu, B.: Aerosol and boundary-layer interactions and impact on air quality, Natl. Sci. Rev., 4, 810–833, https://doi.org/10.1093/nsr/nwx117, 2017b.
Li, R., Shao, W., Guo, J., Fu, Y., Wang, Y., Liu, G., Zhou, R., and Li, W.: A Simplified Algorithm to Estimate Latent Heating Rate Using Vertical Rainfall Profiles Over the Tibetan Plateau, J. Geophys. Res.-Atmos, 124, 942–963, https://doi.org/10.1029/2018jd029297, 2019a.
Li, Z., Wang, Y., Guo, J., Zhao, C., Cribb, M., Dong, X., Fan, J., Gong, D., Huang, J., Jiang, M., Jiang, Y., Lee, S. S., Li, H., Li, J., Liu, J., Qian, Y., Rosenfeld, D., Shan, S., Sun, Y., Wang, H., Xin, J., Yan, X., Yang, X., Yang, X.-q., Zhang, F., and Zheng, Y.: East Asian Study of Tropospheric Aerosols and their Impact on Regional Clouds, Precipitation, and Climate (EAST-AIR(CPC)), J. Geophys. Res.-Atmos, 124, 13026–13054, https://doi.org/10.1029/2019jd030758, 2019b.
Liu, G. S. and Fu, Y. F.: The characteristics of tropical precipitation profiles as inferred from satellite radar measurements, J. Meteorol. Soc. Jpn., 79, 131–143, https://doi.org/10.2151/jmsj.79.131, 2001.
Liu, J. J., Zheng, Y. F., Li, Z. Q., Flynn, C., Welton, E. J., and Cribb, M.: Transport, vertical structure and radiative properties of dust events in southeast China determined from ground and space sensors, Atmos. Environ., 45, 6469–6480, https://doi.org/10.1016/j.atmosenv.2011.04.031, 2011.
Martins, J. V., Tanre, D., Remer, L., Kaufman, Y., Mattoo, S., and Levy, R.: MODIS Cloud screening for remote sensing of aerosols over oceans using spatial variability, Geophys. Res. Lett., 29, 1619, https://doi.org/10.1029/2001gl013252, 2002.
Min, Q.-L., Li, R., Lin, B., Joseph, E., Wang, S., Hu, Y., Morris, V., and Chang, F.: Evidence of mineral dust altering cloud microphysics and precipitation, Atmos. Chem. Phys., 9, 3223–3231, https://doi.org/10.5194/acp-9-3223-2009, 2009.
NASA: The Tropical Rainfall Measuring Mission (TRMM), NASA [data set], https://gpm.nasa.gov/missions/trmm (last access: 1 July 2022), 2023a.
NASA: MODIS, Massive and Deadly Wildfire Outbreak in Chile, NASA [data set], https://modis.gsfc.nasa.gov/ (last access: 1 July 2022), 2023b.
NASA: CALIPSO Search and Subsetting Web Application, NASA [data set], https://subset.larc.nasa.gov/calipso/ (last access: 10 November 2022), 2023c.
Nasuno, T. and Satoh, M.: Properties of Precipitation and In-Cloud Vertical Motion in a Global Nonhydrostatic Aquaplanet Experiment, J. Meteorol. Soc. Jpn., 89, 413–439, https://doi.org/10.2151/jmsj.2011-502, 2011.
NOAA: Type of Trajectory(ies), NOAA [data set], https://www.ready.noaa.gov/hypub-bin/trajtype.pl?runtype=archive, last access: 8 January 2023.
Oshima, N., Kondo, Y., Moteki, N., Takegawa, N., Koike, M., Kita, K., Matsui, H., Kajino, M., Nakamura, H., Jung, J. S., and Kim, Y. J.: Wet removal of black carbon in Asian outflow: Aerosol Radiative Forcing in East Asia (A-FORCE) aircraft campaign, J. Geophys. Res.-Atmos, 117, D03204, https://doi.org/10.1029/2011jd016552, 2012.
Park, S. and Allen, R. J.: Understanding influences of convective transport and removal processes on aerosol vertical distribution, Geophys. Res. Lett., 42, 10438–10444, https://doi.org/10.1002/2015gl066175, 2015.
Prospero, J. M. and Mayol-Bracero, O. L.: UNDERSTANDING THE TRANSPORT AND IMPACT OF AFRICAN DUST ON THE CARIBBEAN BASIN, B. Am. Meteorol. Soc., 94, 1329–1337, https://doi.org/10.1175/bams-d-12-00142.1, 2013.
Remer, L. A., Kaufman, Y. J., Tanre, D., Mattoo, S., Chu, D. A., Martins, J. V., Li, R. R., Ichoku, C., Levy, R. C., Kleidman, R. G., Eck, T. F., Vermote, E., and Holben, B. N.: The MODIS aerosol algorithm, products, and validation, J. Atmos. Sci., 62, 947–973, https://doi.org/10.1175/jas3385.1, 2005.
Rosenfeld, D., Lohmann, U., Raga, G. B., O'Dowd, C. D., Kulmala, M., Fuzzi, S., Reissell, A., and Andreae, M. O.: Flood or drought: How do aerosols affect precipitation?, Science, 321, 1309–1313, https://doi.org/10.1126/science.1160606, 2008.
Rosenfeld, D., Andreae, M. O., Asmi, A., Chin, M., de Leeuw, G., Donovan, D. P., Kahn, R., Kinne, S., Kivekas, N., Kulmala, M., Lau, W., Schmidt, K. S., Suni, T., Wagner, T., Wild, M., and Quaas, J.: Global observations of aerosol-cloud-precipitation-climate interactions, Rev. Geophys., 52, 750–808, https://doi.org/10.1002/2013rg000441, 2014.
Shige, S., Takayabu, Y. N., Tao, W. K., and Johnson, D. E.: Spectral retrieval of latent heating profiles from TRMM PR data. Part I: Development of a model-based algorithm, J. Appl. Meteorol., 43, 1095–1113, https://doi.org/10.1175/1520-0450(2004)043<1095:Srolhp>2.0.Co;2, 2004.
Shige, S., Takayabu, Y. N., Tao, W.-K., and Shie, C.-L.: Spectral retrieval of latent heating profiles from TRMM PR data. Part II: Algorithm improvement and heating estimates over Tropical Ocean regions, J. Appl. Meteorol. Climatol., 46, 1098–1124, https://doi.org/10.1175/jam2510.1, 2007.
Stevens, B. and Feingold, G.: Untangling aerosol effects on clouds and precipitation in a buffered system, Nature, 461, 607–613, https://doi.org/10.1038/nature08281, 2009.
Tanre, D., Herman, M., and Kaufman, Y. J.: Information on aerosol size distribution contained in solar reflected spectral radiances, J. Geophys. Res.-Atmos., 101, 19043–19060, https://doi.org/10.1029/96jd00333, 1996.
Tanre, D., Kaufman, Y. J., Herman, M., and Mattoo, S.: Remote sensing of aerosol properties over oceans using the MODIS/EOS spectral radiances, J. Geophys. Res.-Atmos., 102, 16971–16988, https://doi.org/10.1029/96jd03437, 1997.
Tao, W. K., Lang, S., Simpson, J., and Adler, R.: RETRIEVAL ALGORITHMS FOR ESTIMATING THE VERTICAL PROFILES OF LATENT-HEAT RELEASE – THEIR APPLICATIONS FOR TRMM, J. Meteorol. Soc. Jpn., 71, 685–700, https://doi.org/10.2151/jmsj1965.71.6_685, 1993.
Tao, W.-K., Lang, S., Zeng, X., Shige, S., and Takayabu, Y.: Relating Convective and Stratiform Rain to Latent Heating, J. Climate, 23, 1874–1893, https://doi.org/10.1175/2009jcli3278.1, 2010.
Tao, W.-K., Chen, J.-P., Li, Z., Wang, C., and Zhang, C.: Impact of aerosols on convective clouds and precipitation, Rev. Geophys., 50, Rg2001, https://doi.org/10.1029/2011rg000369, 2012.
Tao, W. K., Iguchi, T., Lang, S., Li, X., Mohr, K., Matsui, T., van den Heever, S. C., and Braun, S.: Relating Vertical Velocity and Cloud/Precipitation Properties: A Numerical Cloud Ensemble Modeling Study of Tropical Convection, J. Adv. Model. Earth Syst., 14, e2021MS002677, https://doi.org/10.1029/2021ms002677, 2022.
Wall, C., Zipser, E., and Liu, C.: An Investigation of the Aerosol Indirect Effect on Convective Intensity Using Satellite Observations, J. Atmos. Sci., 71, 430–447, 2015.
Yin, Y. and Chen, L.: The effects of heating by transported dust layers on cloud and precipitation: a numerical study, Atmos. Chem. Phys., 7, 3497–3505, https://doi.org/10.5194/acp-7-3497-2007, 2007.
Yin, Y., Chen, Q., Jin, L., Chen, B., Zhu, S., and Zhang, X.: The effects of deep convection on the concentration and size distribution of aerosol particles within the upper troposphere: A case study, J. Geophys. Res.-Atmos, 117, D22202, https://doi.org/10.1029/2012jd017827, 2012.