the Creative Commons Attribution 4.0 License.
the Creative Commons Attribution 4.0 License.
 | 17 Feb 2023
Measurement report: Emission factors of NH3 and NHx for wildfires and agricultural fires in the United States
Laura Tomsche
Felix Piel
Tomas Mikoviny
Claus J. Nielsen
Hongyu Guo
Pedro Campuzano-Jost
Benjamin A. Nault
Melinda K. Schueneman
Jose L. Jimenez
Hannah Halliday
Glenn Diskin
Joshua P. DiGangi
John B. Nowak
Elizabeth B. Wiggins
Emily Gargulinski
Amber J. Soja
Armin Wisthaler
During the 2019 Fire Influence on Regional to Global Environments and Air Quality (FIREX-AQ) study, the NASA DC-8 carried out in situ chemical measurements in smoke plumes emitted from wildfires and agricultural fires in the contiguous United States. The DC-8 payload included a modified proton-transfer-reaction time-of-flight mass spectrometer (PTR-ToF-MS) for the fast measurement of gaseous ammonia (NH3) and a high-resolution time-of-flight aerosol mass spectrometer (AMS) for the fast measurement of submicron particulate ammonium (). We herein report data collected in smoke plumes emitted from 6 wildfires in the Western United States, 2 prescribed grassland fires in the Central United States, 1 prescribed forest fire in the Southern United States, and 66 small agricultural fires in the Southeastern United States. Smoke plumes contained double to triple digit ppb levels of NH3. In the wildfire plumes, a significant fraction of NH3 had already been converted to at the time of sampling (≥2 h after emission). Substantial amounts of were also detected in freshly emitted smoke from corn and rice field fires. We herein present a comprehensive set of emission factors of NH3 and NHx, with . Average NH3 and NHx emission factors for wildfires in the Western United States were 1.86±0.75 g kg−1 and 2.47±0.80 g kg−1 of fuel burned, respectively. Average NH3 and NHx emission factors for agricultural fires in the Southeastern United States were 0.89±0.58 and 1.74±0.92 g kg−1, respectively. Our data show no clear inverse correlation between modified combustion efficiency (MCE) and NH3 emissions. The observed NH3 emissions were significantly higher than measured in previous laboratory experiments in the FIREX FireLab 2016 study.
- Article
(2862 KB) - Full-text XML
-
Supplement
(532 KB) - BibTeX
- EndNote


Ammonia (NH3) is an important trace gas in the Earth's atmosphere that is mostly emitted from agriculture, traffic, the oceans and biomass burning. In the presence of acids, NH3 rapidly partitions to aerosol particles, which in turn impact air quality and climate (Seinfeld and Pandis, 2016). In much of the atmosphere, NH3 exhibits a major influence on particle acidity (pH), which is a major controlling parameter for many important aerosol physical and chemical processes (e.g., Pye et al., 2020; Nault et al., 2021). NH3 is also the largest contributor to deposition of nitrogen from the atmosphere to soil and vegetation, causing surface water eutrophication, soil acidification, and ultimately biodiversity loss (e.g., Bobbink and Higgs, 2014).
Fires emit NH3 predominantly during smoldering combustion, which occurs at low temperatures (e.g., Lobert et al., 1990; Yokelson et al., 1996, 1997; Goode et al., 1999; McMeeking et al., 2009; Burling et al., 2010; Roberts et al., 2020). NH3 is typically the third most abundant nitrogen compound (after N2 and NO) and the most abundant reduced nitrogen compound emitted from fires (Lobert et al., 1990; Roberts et al., 2020; Lindaas et al., 2021).
An important parameter for investigating the atmospheric impact of NH3 is the emission factor, , which is the mass of NH3 (in g) that is emitted per mass of fuel burned (in kg). Several literature reviews (Andreae and Merlet, 2001; Akagi et al., 2011; Andreae, 2019; Prichard et al., 2020) report values for different types of fire fuels. A closer look at the literature reveals that emissions from fuels that are typical of the United States have mostly been studied in the laboratory (e.g., Yokelson et al., 1996; McMeeking et al., 2009; Burling et al., 2010; Stockwell et al., 2015; Selimovic et al., 2018; Roberts et al., 2020). Previous work has shown that laboratory fires may not realistically simulate fires occurring in the real world due to different burning conditions and the lack of heterogeneity in fuels (e.g., Yokelson et al., 2013; Hodshire et al., 2019). Only very few studies have reported derived from measurements carried out in the field (e.g., Lindaas et al., 2021).
The limited availability of field data is mostly because NH3 is difficult to measure. NH3 is a “sticky” molecule that easily adsorbs onto inlet and instrumental surfaces. This makes fast airborne measurements of NH3 particularly challenging. Müller et al. (2014; see Supplement) have shown that a proton-transfer-reaction time-of-flight mass spectrometer (PTR-ToF-MS) can be used for airborne NH3 measurements, although with some limitations tied to a relatively slow time response and a poor detection limit due to a large intrinsic background. The conventional PTR-ToF-MS instrument of the University of Innsbruck has measured NH3 with such constraints in previous airborne studies (Sun et al., 2015; Kelly et al., 2018; Guo et al., 2021; Pan et al., 2021).
The Fire Influence on Regional to Global Environments and Air Quality (FIREX-AQ) study was a joint NOAA and NASA effort to investigate the atmospheric impact of wildfires and agricultural fires in the contiguous United States (Warneke et al., 2022). In summer 2019, the NASA DC-8 Airborne Science Laboratory performed in situ measurements in smoke plumes emitted from wildfires in the Western United States and agricultural fires in the Southeastern United States. The aircraft payload included a modified PTR-ToF-MS instrument that was optimized for the fast measurement of NH3. It also included an aerosol mass spectrometer (AMS) for fast measurement of submicron particulate ammonium (). This allowed us to measure and report a set of emission factors of NH3 and NHx, where , for different types of fires.
2.1 FIREX-AQ
The FIREX-AQ experiment has been described in detail by Warneke et al. (2022). During the 2019 field campaign, NH3 and were measured aboard the NASA DC-8 in smoke plumes emitted from six wildfires in the Western United States (Shady, Williams Flats, Castle, Ridge Top, Mica and Lick Creek, Horsefly), two prescribed grassland fires in the Central United States (Hickory Ridge State Wildlife Management Area, Tallgrass Prairie National Preserve), and one prescribed forest fire in the Southern United States (Black Water River State Forest) (Fig. 1).
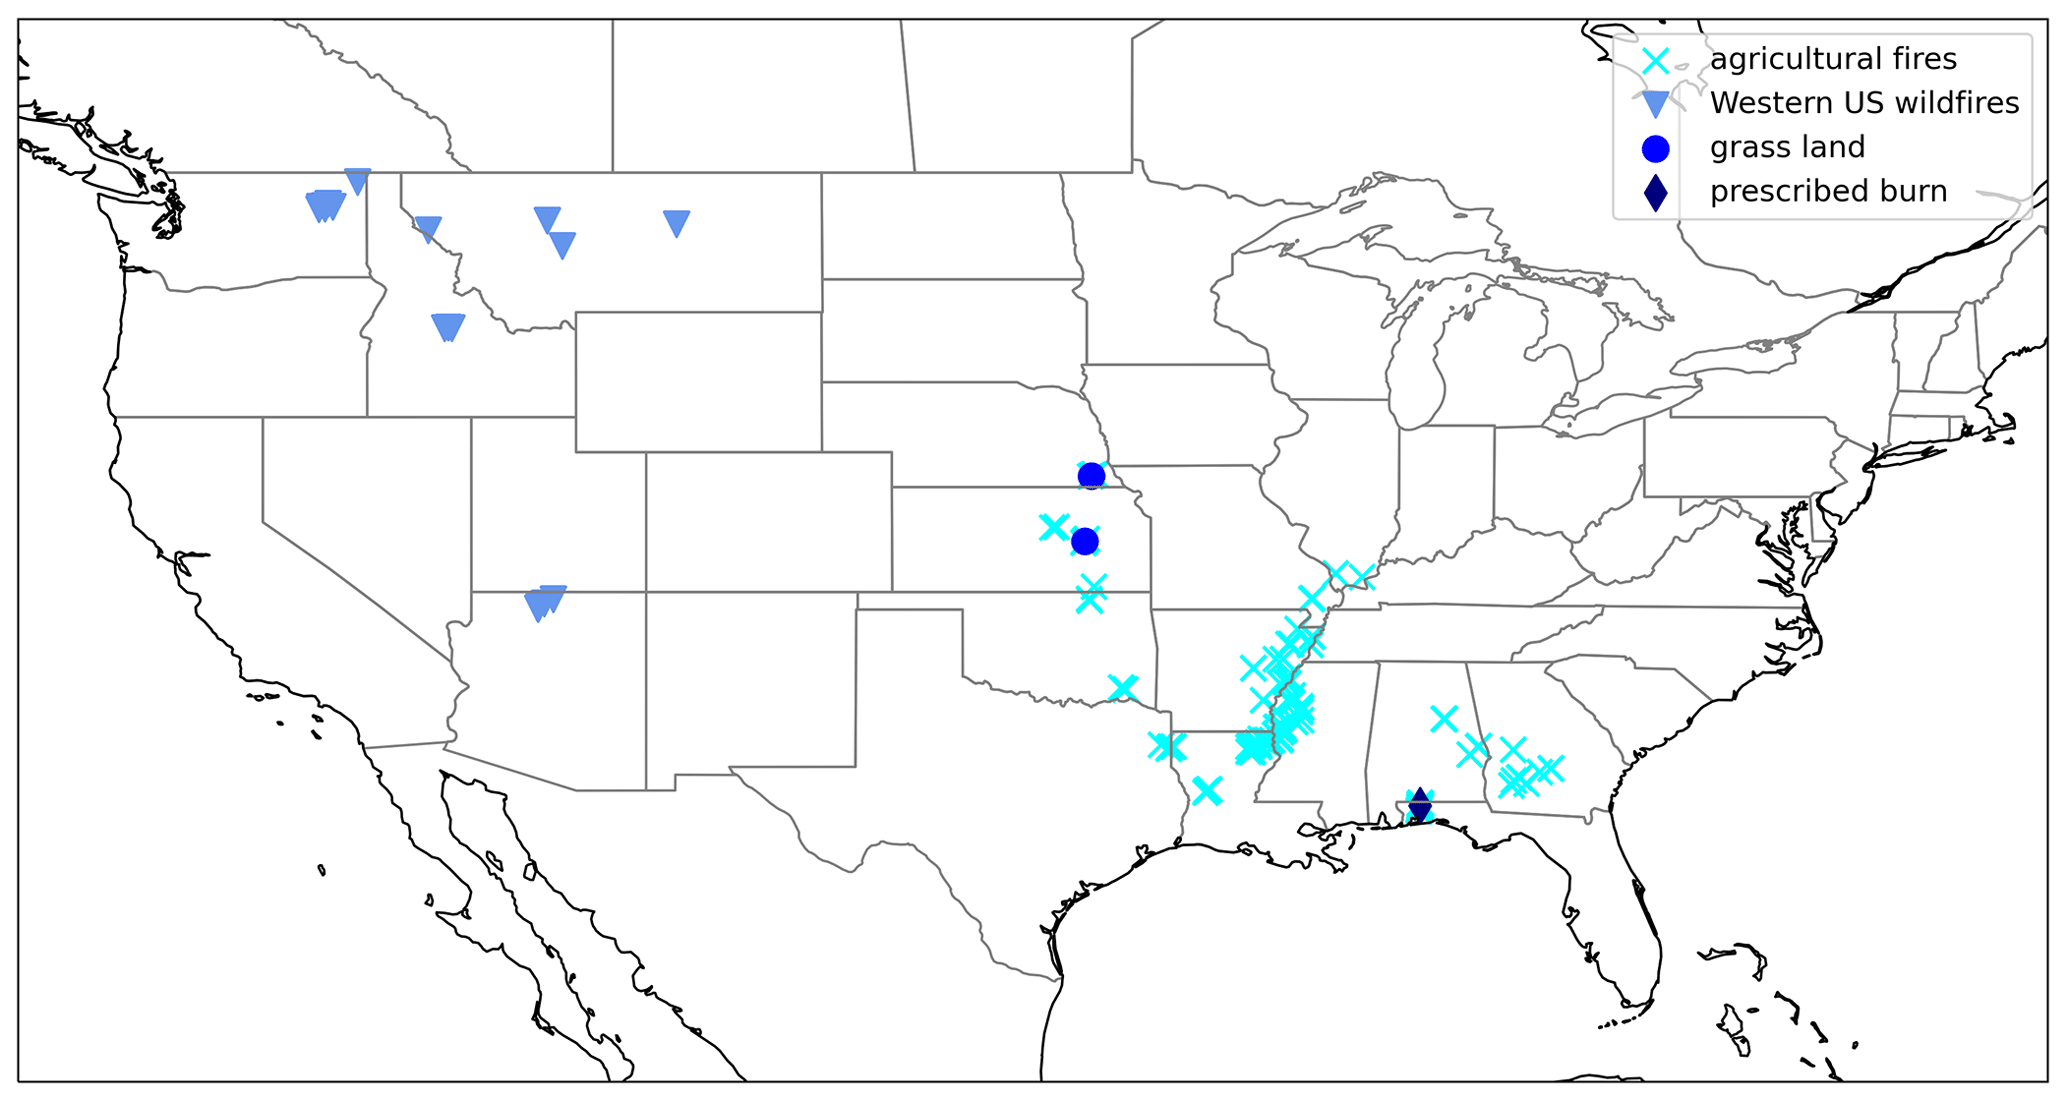
Figure 1Location of the fires that were sampled by the NASA DC-8 during the 2019 FIREX-AQ campaign and for which NH3 and data were obtained.
Several downwind transects were typically flown in the smoke plumes emitted from the wildfires. In addition, the NASA DC-8 sampled smoke plumes from a large number of agricultural fires in the Southeastern United States. These small plumes were typically sampled twice in perpendicular direction. We successfully measured NH3 and in plumes emitted from 66 agricultural fires.
Vegetation and fuel type information is summarized in Table S1 in the Supplement. Information about fuel types was obtained from the 30 m Fuel Characteristic Classification System (FCCS; Ottmar et al., 2007), the 30 m 2019 dataset of the Cropland Data Layer (CDL) classification, and ground intelligence.
2.2 Instrumentation
A modified PTR-ToF-MS instrument was used for fast-response measurements of NH3 aboard the NASA DC-8 during FIREX-AQ. The conventional airborne PTR-ToF-MS analyzer has been described in detail by Müller et al. (2014). Only the modifications pertinent to the fast measurement of NH3 are thus described here.
For reducing the instrumental NH3 background, 12–25 sccm (standard cubic centimeters per minute; “standard” herein means referenced to a temperature of 273.15 K and a pressure of 101 325 Pa) of ultra-pure helium (6.0; Praxair Inc., Danbury, CT, USA) was introduced into the source drift region between the drift tube and the ion source. This reduced the backflow of nitrogen into the plasma region and suppressed NH3 formation in the plasma (Müller et al., 2020, and references therein).
For improving the instrumental time response to NH3, all stainless-steel parts in the drift tube were surface-passivated with a functionalized hydrogenated amorphous silicon coating (Piel et al., 2021), and the drift tube was heated to 120 ∘C. Surface passivation and heating significantly reduces the adsorption of NH3 to instrumental surfaces, lowering the instrumental response time to ∼2 s (see Fig. 4 of Piel et al., 2021).
A series of inlet configurations were tested during the initial phase of the FIREX-AQ campaign. The fastest response to NH3 was achieved when air was sampled at a flow rate of ∼60 slpm (standard liters per minute) through a heated Teflon PFA tube (length: ∼2 m, inner diameter: 3.96 mm, wall temperature: 60 ∘C). Evaporation of ammonium nitrate particles in the main sampling line was not investigated, but it is believed to be small due to the short sample residence time (<25 ms). For inertially separating particles from the analyte air, a small flow was subsampled from the main inlet line in rearward direction and directed into the drift tube through a Teflon PFA tube (length: ∼10 cm, outer diameter: 3.175 mm, temperature: 120 ∘C). The subsampling flow was set to ∼250 sccm via a pinch valve applied on the PFA tube. An NH3 time response of a few seconds was ultimately achieved (see Sect. 3).
We performed three types of calibrations in the field: (i) periodic in-flight calibrations using a dynamically diluted calibration standard in a pressurized cylinder (10 ppm NH3 in N2; Praxair Distribution Inc., Lancaster, CA, USA), (ii) a ground-based calibration using a dynamically diluted calibration standard in a pressurized cylinder (2.7 ppm NH3 in N2; provided by NOAA's Chemical Sciences Laboratory) and (iii) a ground-based calibration using an NH3 permeation source (provided by NOAA's Chemical Sciences Laboratory). While results from the cylinder-based calibrations were in good agreement, the permeation-tube-based calibration yielded an instrumental response factor that was a factor of 2 higher. For resolving this inconsistency, we carried out an extensive post-mission NH3 calibration in the laboratory. For that purpose, an artificial atmosphere (NH3 in air) was generated in a 250 L environmental (“smog”) chamber equipped with a Fourier transform infrared (FTIR) spectrometer (Bruker IFS 66v/S). The concentrations of NH3 (accuracy: ±5 %) were determined from the FT-IR spectra (120 m path length, 0.125 cm−1 spectral resolution) in a global nonlinear least squares spectral fitting procedure (Griffith, 1996) employing the absolute cross sections of NH3 (Gordon et al., 2017). The instrumental response factor derived from the post-mission calibration agreed to within ±15 % with the response factors obtained during the in-flight calibrations. We concluded that the permeation rate determined in pre-campaign laboratory measurements had changed in the field. The estimated accuracy of the reported NH3 mixing ratios is ±15 %. We note that this accuracy estimate is not valid when NH3 mixing ratios abruptly changed and inlet and instrument surfaces were not equilibrated.
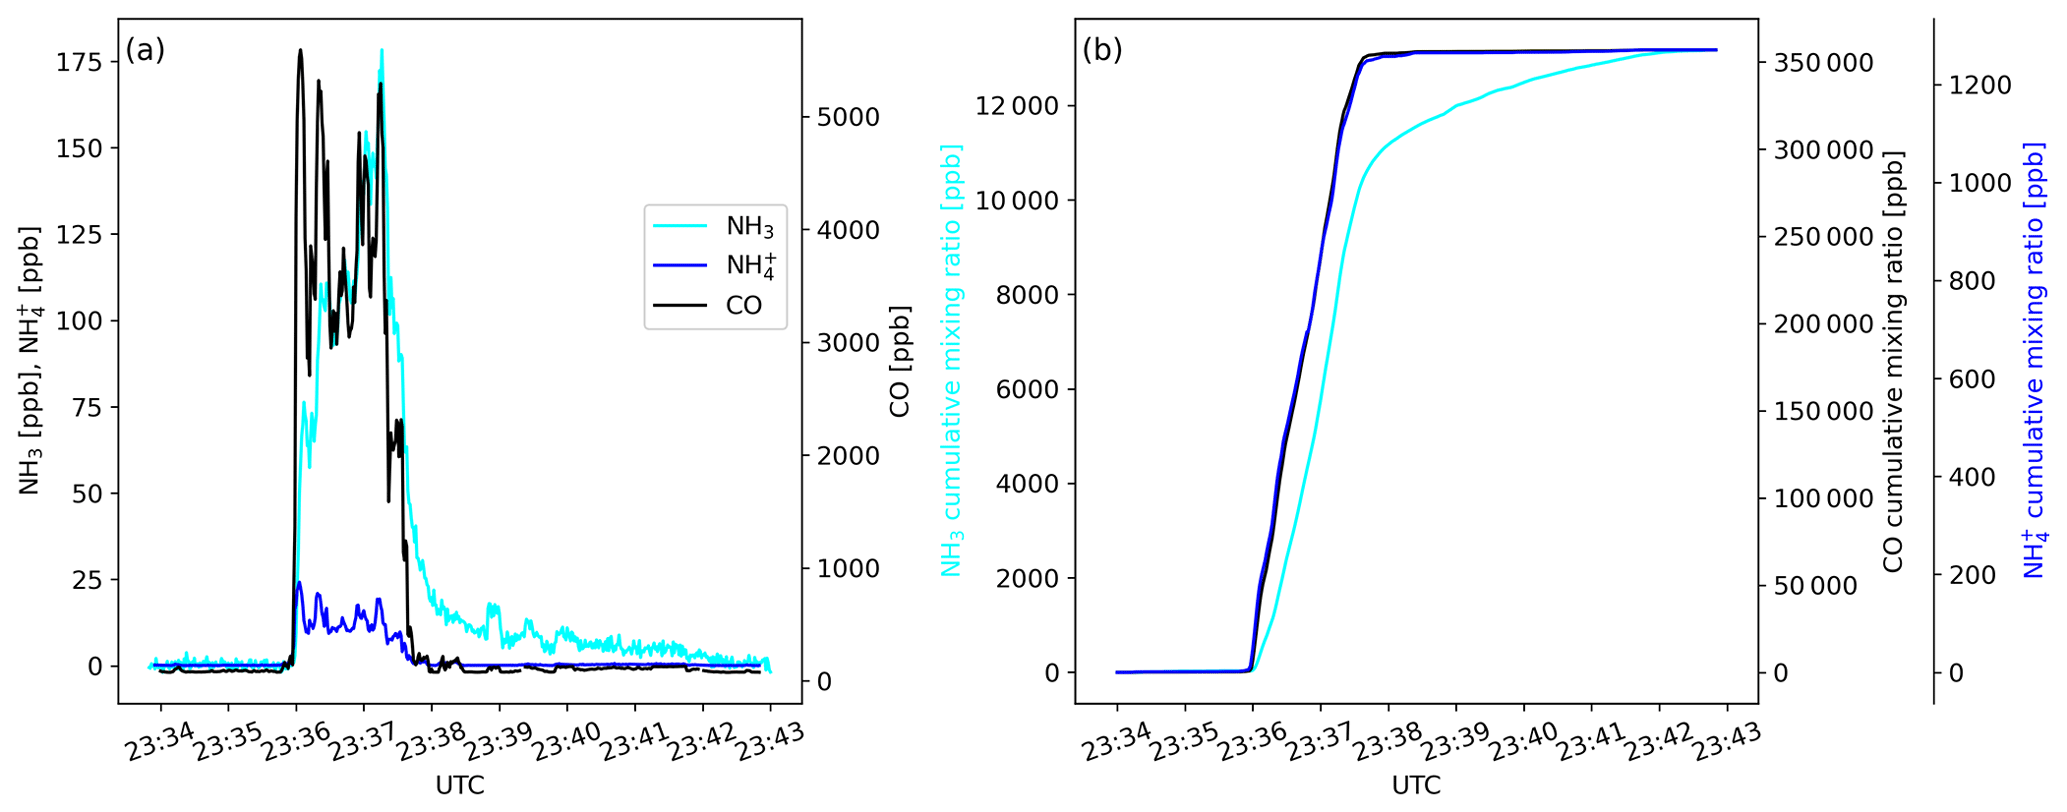
Figure 2Time traces of (a) mixing ratios of NH3, and CO and of (b) cumulative mixing ratios of NH3, and CO as measured during a transect of the Williams Flats Fire plume on 7 August 2019.
Submicrometer (50 % cutoff size for a vacuum aerodynamic diameter ∼1 µm, about 850 nm geometric diameter for most fire plumes based on in-field calibrations) was measured by an Aerodyne high-resolution time-of-flight AMS instrument (DeCarlo et al., 2006; Canagaratna et al., 2007), with a time resolution of up to 10 Hz. The accuracy (2σ) of the data is estimated to be ±34 % (Bahreini et al., 2009), while the detection limit was typically much smaller (25 ppt at 1 Hz in clean air, ∼200 ppt in fire plumes). The inlet flow was optimized to allow for near-real-time sampling (0.3 s residence time) and to minimize particle volatilization in the inlet. We note that, based on the current state of knowledge, the AMS data collected in fresh smoke plumes suffer from a minor (≤20 %) positive interference from reduced organic nitrogen compounds, which are known to be abundant constituents of biomass burning particles (e.g., Mace et al., 2003). A general correction is still under development based on a positive matrix factorization (PMF) analysis.
Carbon monoxide (CO) and methane (CH4) were measured by the differential absorption carbon monoxide measurement (DACOM) instrument (Sachse et al., 1991), which is based on mid-infrared wavelength modulation spectroscopy. The uncertainty in the CO data is 2.1±0.2 ppb; the uncertainty for CH4 is about 1 %. Carbon dioxide (CO2) was measured by a LICOR model 7000 analyzer (Vay et al., 2009), which is based on nondispersive infrared absorption spectroscopy. For CO2 <500 ppm, the accuracy is 0.25 ppm and the precision is 0.1 ppm, while for higher mixing ratios, the total uncertainty is about 2 %.
2.3 Emission factor, modified combustion efficiency
We used the carbon mass balance method for calculating (Yokelson et al., 1996, 1999). The underlying assumption is that the carbon in the fire fuel is predominantly emitted as CO2, CO and CH4. (in g kg−1) is thus described by the simplified Eq. (1):
where Δ is the above background mixing ratio in the plume of the respective trace gas, 17 is the molar mass of NH3 (in g mol−1), and 12 is the molar mass of carbon (in g mol−1). The fraction of carbon in the fuel is denoted as Fc, which is typically in the 0.45–0.55 range (Akagi et al., 2011). We assumed Fc to be 0.50 and note here that the resulting 10 % of uncertainty in is small compared to the natural variability of . A problem in the calculation of arises from the fact that NH3 is a “sticky” compound. When the aircraft first penetrates a smoke plume, NH3 molecules typically adsorb onto inlet and instrumental surfaces, thereby delaying the signal response of the analyzer. When the airplane exits the plume, the desorbing NH3 molecules cause a signal tailing (Fig. 2a). For calculating Δ, we thus applied the method described in the Supplement of Müller et al. (2016) and calculated cumulative volume mixing ratios including the immediate period (10 s) before the plume was encountered (background) and the period after the plume encounter (seconds to minutes) when the NH3 signal tailed off (Fig. 2b). The signal tailing was particularly pronounced during the initial phase of the campaign (before 24 August 2019) when the inlet configuration had not yet been optimized. During the later phase of the campaign, only a few seconds of tailing were observed. NHx is the sum of NH3 and ; was calculated as the sum of and . The modified combustion efficiency (MCE) was calculated as ).
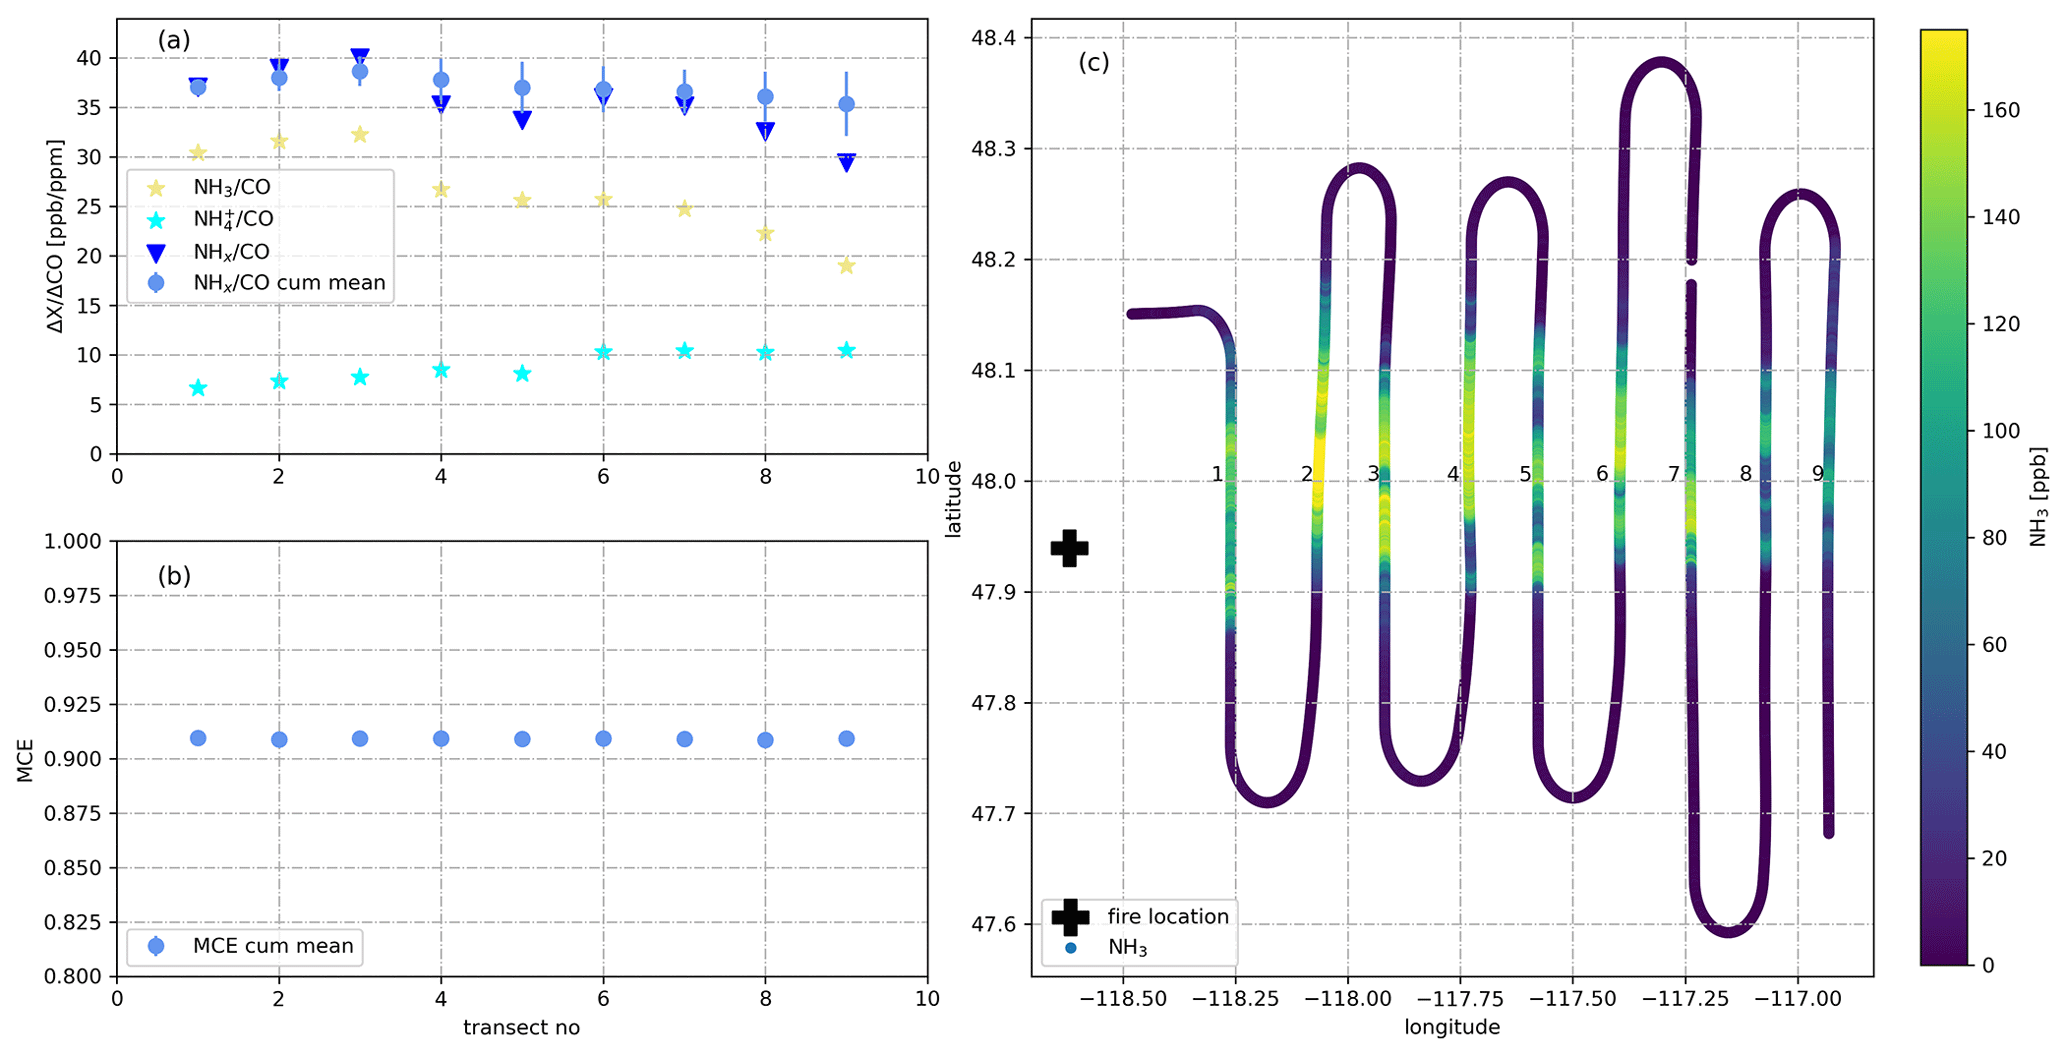
Figure 3(a) NH3/CO, /CO, NHx/CO and cumulative mean NHx/CO as measured during nine downwind transects of the plume emitted from the Williams Flats Fire on 7 August 2019. NH3/CO increases during the first three transects which were thus used for determining and . (b) Mean MCE as measured for the same nine downwind transects. MCE remains stable at ∼0.91 indicating stable burning conditions. (c) Latitude–longitude plot showing the location of the fire (black cross) and the color-coded flight track in the NH3 mixing ratio.
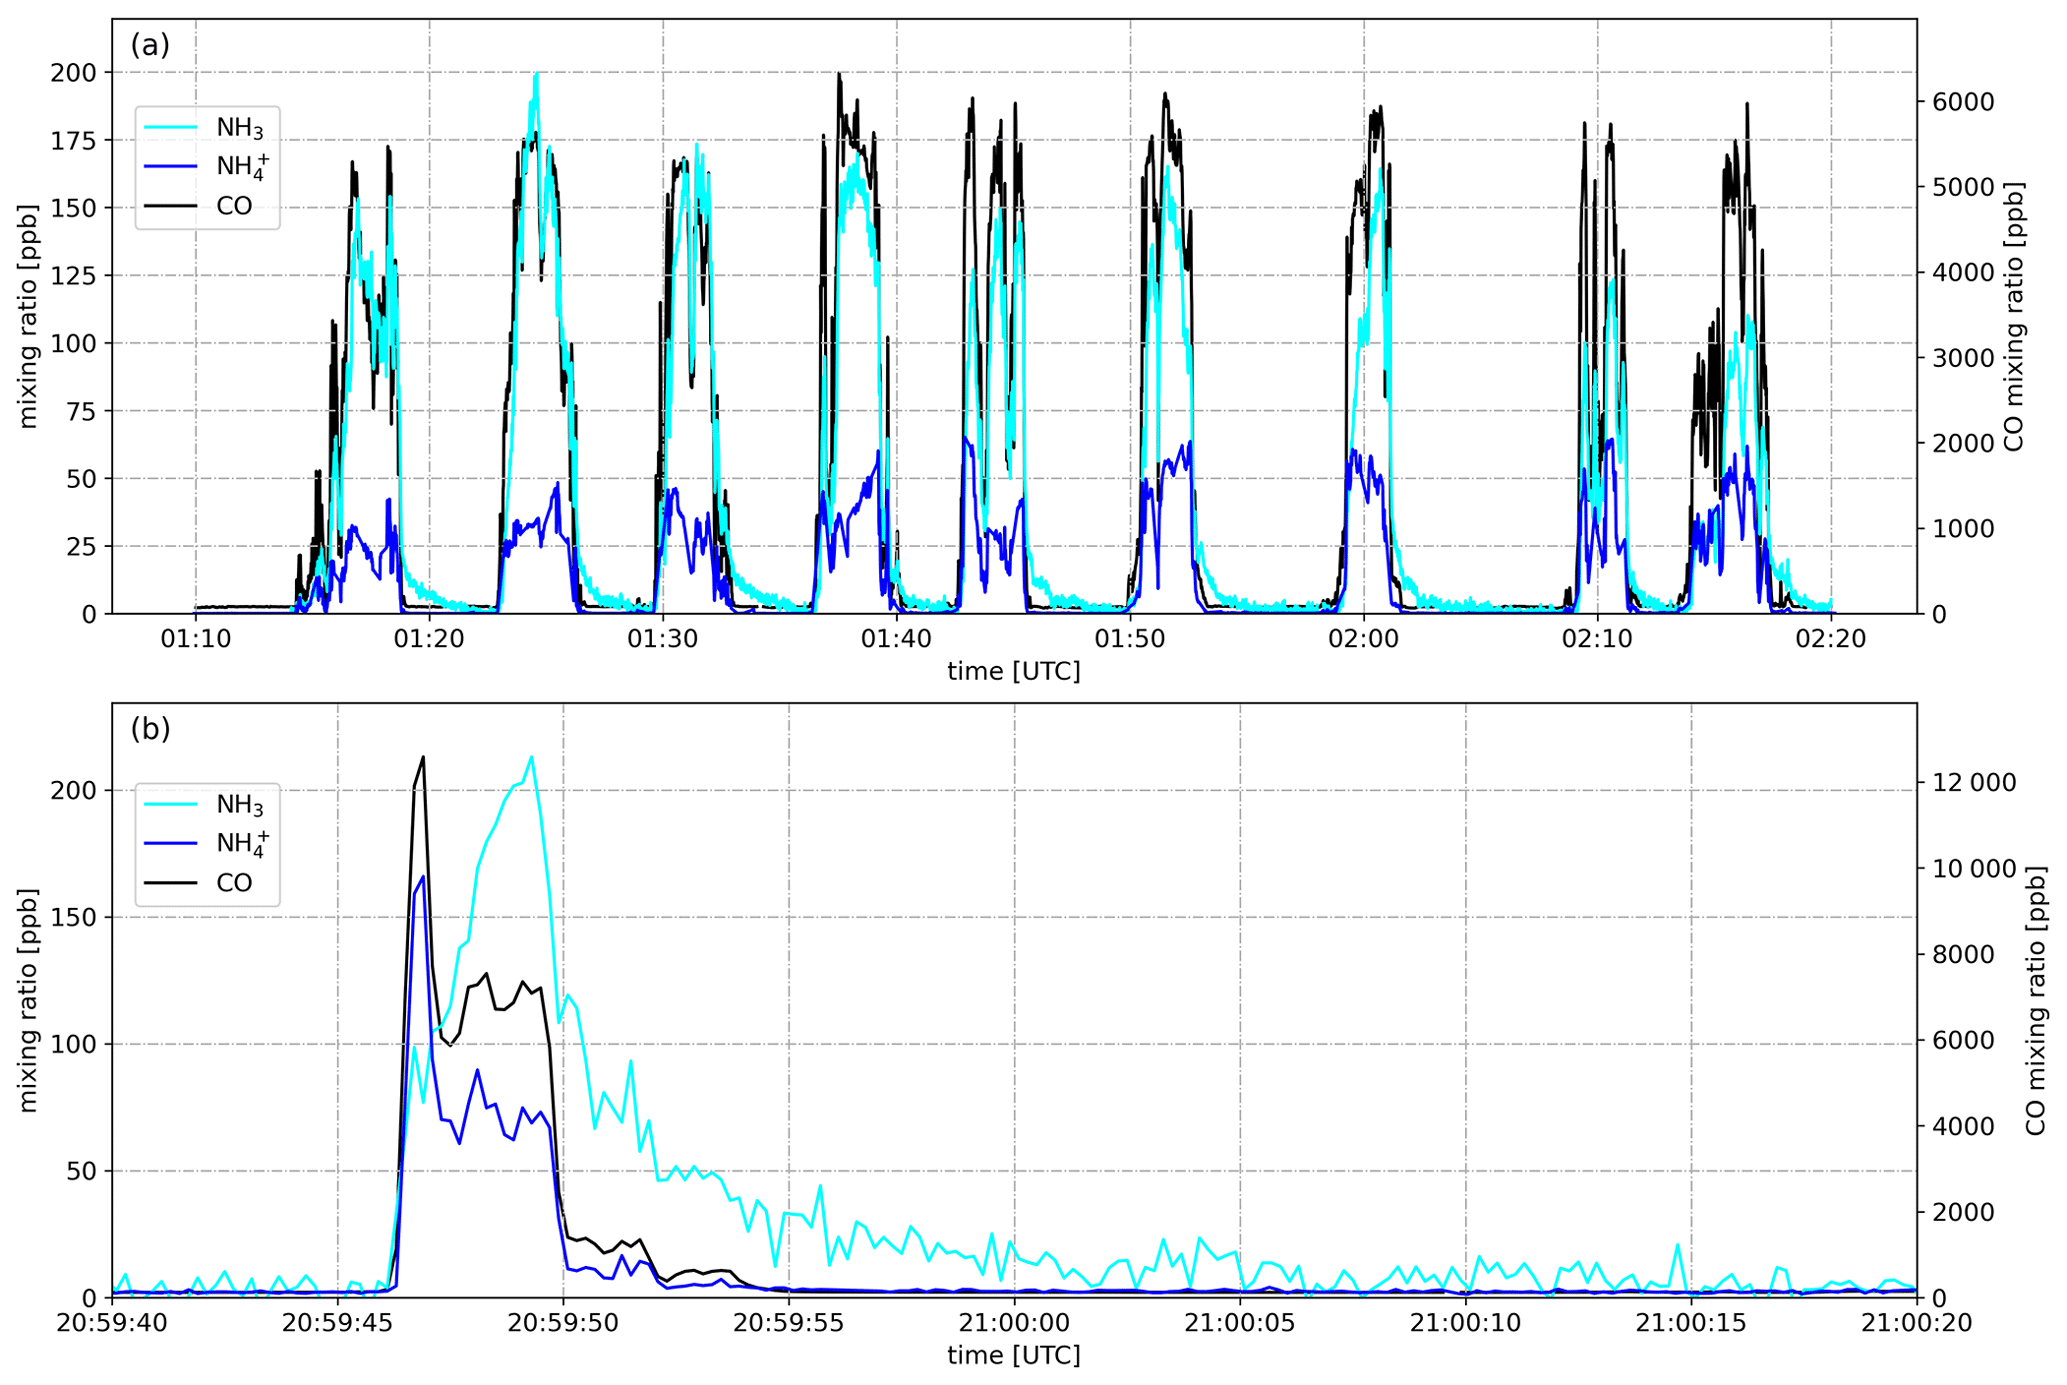
Figure 4Mixing ratios of NH3, , and CO as measured when the NASA DC-8 transected (a) the plume emitted from the Williams Flats Fire on 7 August 2019 in downwind direction and (b) the plume emitted from a small corn field fire in the Mississippi River valley on 26 August 2019.
Data from 180 plume transects were included in our analysis of the wildfire emissions. We only used data from plume transects in which CO mixing ratios exceeded 300 ppb for more than 20 s and from plumes in which MCE values were stable (standard deviation of MCE < 0.05). Data from seven plume transects were excluded due to missing NH3, or CH4 data. Our emission factor (EF) analysis was not based on a single plume transect in closest proximity to the wildfire, as we observed in several plumes that increased during a few initial downwind transects (Fig. 3). The reason for this increase (typically <15 %) is unclear. We included all plume transects in our analysis, up to where reached its maximum and derived an average and (± standard deviation, SD). All SDs reported herein only reflect the measured variability and do not include measurement uncertainties in the underlying variables (NH3, , CO2, CO, CH4). Data from 164 plume transects were included in our analysis of the agricultural fire emissions. Data from 12 plume transects were excluded due to missing NH3 or data.
3.1 Airborne measurements of NH3 in smoke plumes
Figure 4a shows the mixing ratio of NH3 as measured by the PTR-ToF-MS instrument on 7 August 2019 aboard the NASA DC-8. The aircraft flew nine downwind transects at an altitude of 5160 m a.s.l. (above sea level) for sampling the plume emitted from the Williams Flats Fire in Washington, DC. The NH3 signal increased with CO when the aircraft entered the plume, exhibited a similar time trend as CO within the plume and decreased to background levels outside the plume, although with some tailing (few minutes). NH3 maxima ranged from 110 to 200 ppb, which were typical maximum NH3 levels measured in fire plumes throughout the 2019 FIREX-AQ field campaign. Additionally, Fig. 4a shows the time trace of as measured by the AMS instrument, with maximum mixing ratios ranging from 42 to 65 ppb. The observation of significant amounts of indicates that was primarily emitted (as for example observed by Lewis et al., 2009) and/or gaseous NH3 had been partly converted to particulate by the time of sampling (≥2 h after emission). A rapid conversion can be caused by the fast reaction of NH3 with primarily emitted acids such as hydrochloric acid (HCl), nitric acid (HNO3) and organic acids or occur more slowly downwind via the reaction of NH3 with secondary formed acids. As stated in Sect. 2.2, the measurement suffered from a minor (≤20 %) positive interference from reduced organic nitrogen compounds.
Figure 4b shows the mixing ratios of NH3, and CO as observed when the NASA DC-8 crossed a plume emitted from a small cornfield fire in the Mississippi River valley on 26 August 2019 at an altitude of 325 m a.s.l. All data are shown at the frequency they were recorded (5 Hz) which resulted in an increased noise for NH3. The tailing was however reduced to a few seconds with the improved PTR-ToF-MS inlet. We show the 5 Hz data for demonstrating that we succeeded in measuring such small fire plumes from a jet aircraft. For further analysis, we used the 1 s integrated data. Notably, the AMS instrument detected significant amounts of in this very fresh plume, indicating that either direct emission from the fire or a rapid conversion of NH3 to had occurred. The latter could be caused by the fast reaction of NH3 with HCl, which is emitted in significant amounts from agricultural fires (Liu et al., 2017). Another plausible explanation is the resuspension of recently applied ammonium nitrate fertilizer.
Due to the fact that was already present in very fresh smoke (due to direct emission or rapid conversion), we will herein also report , as suggested in previous work by Hegg et al. (1990). In Fig. 5a, we plot against for the six wildfires in the Western United States that were investigated during the 2019 FIREX-AQ field campaign. The two EFs are highly correlated (R2=0.96), with the slope of the linear regression curve being close to unity (1.07±0.05). This regression analysis suggests that added ∼0.5 g kg−1 (offset of the regression line: 0.47±0.11) to throughout the campaign. The offset may be interpreted as the typical direct emission factor (or fast conversion of NH3).
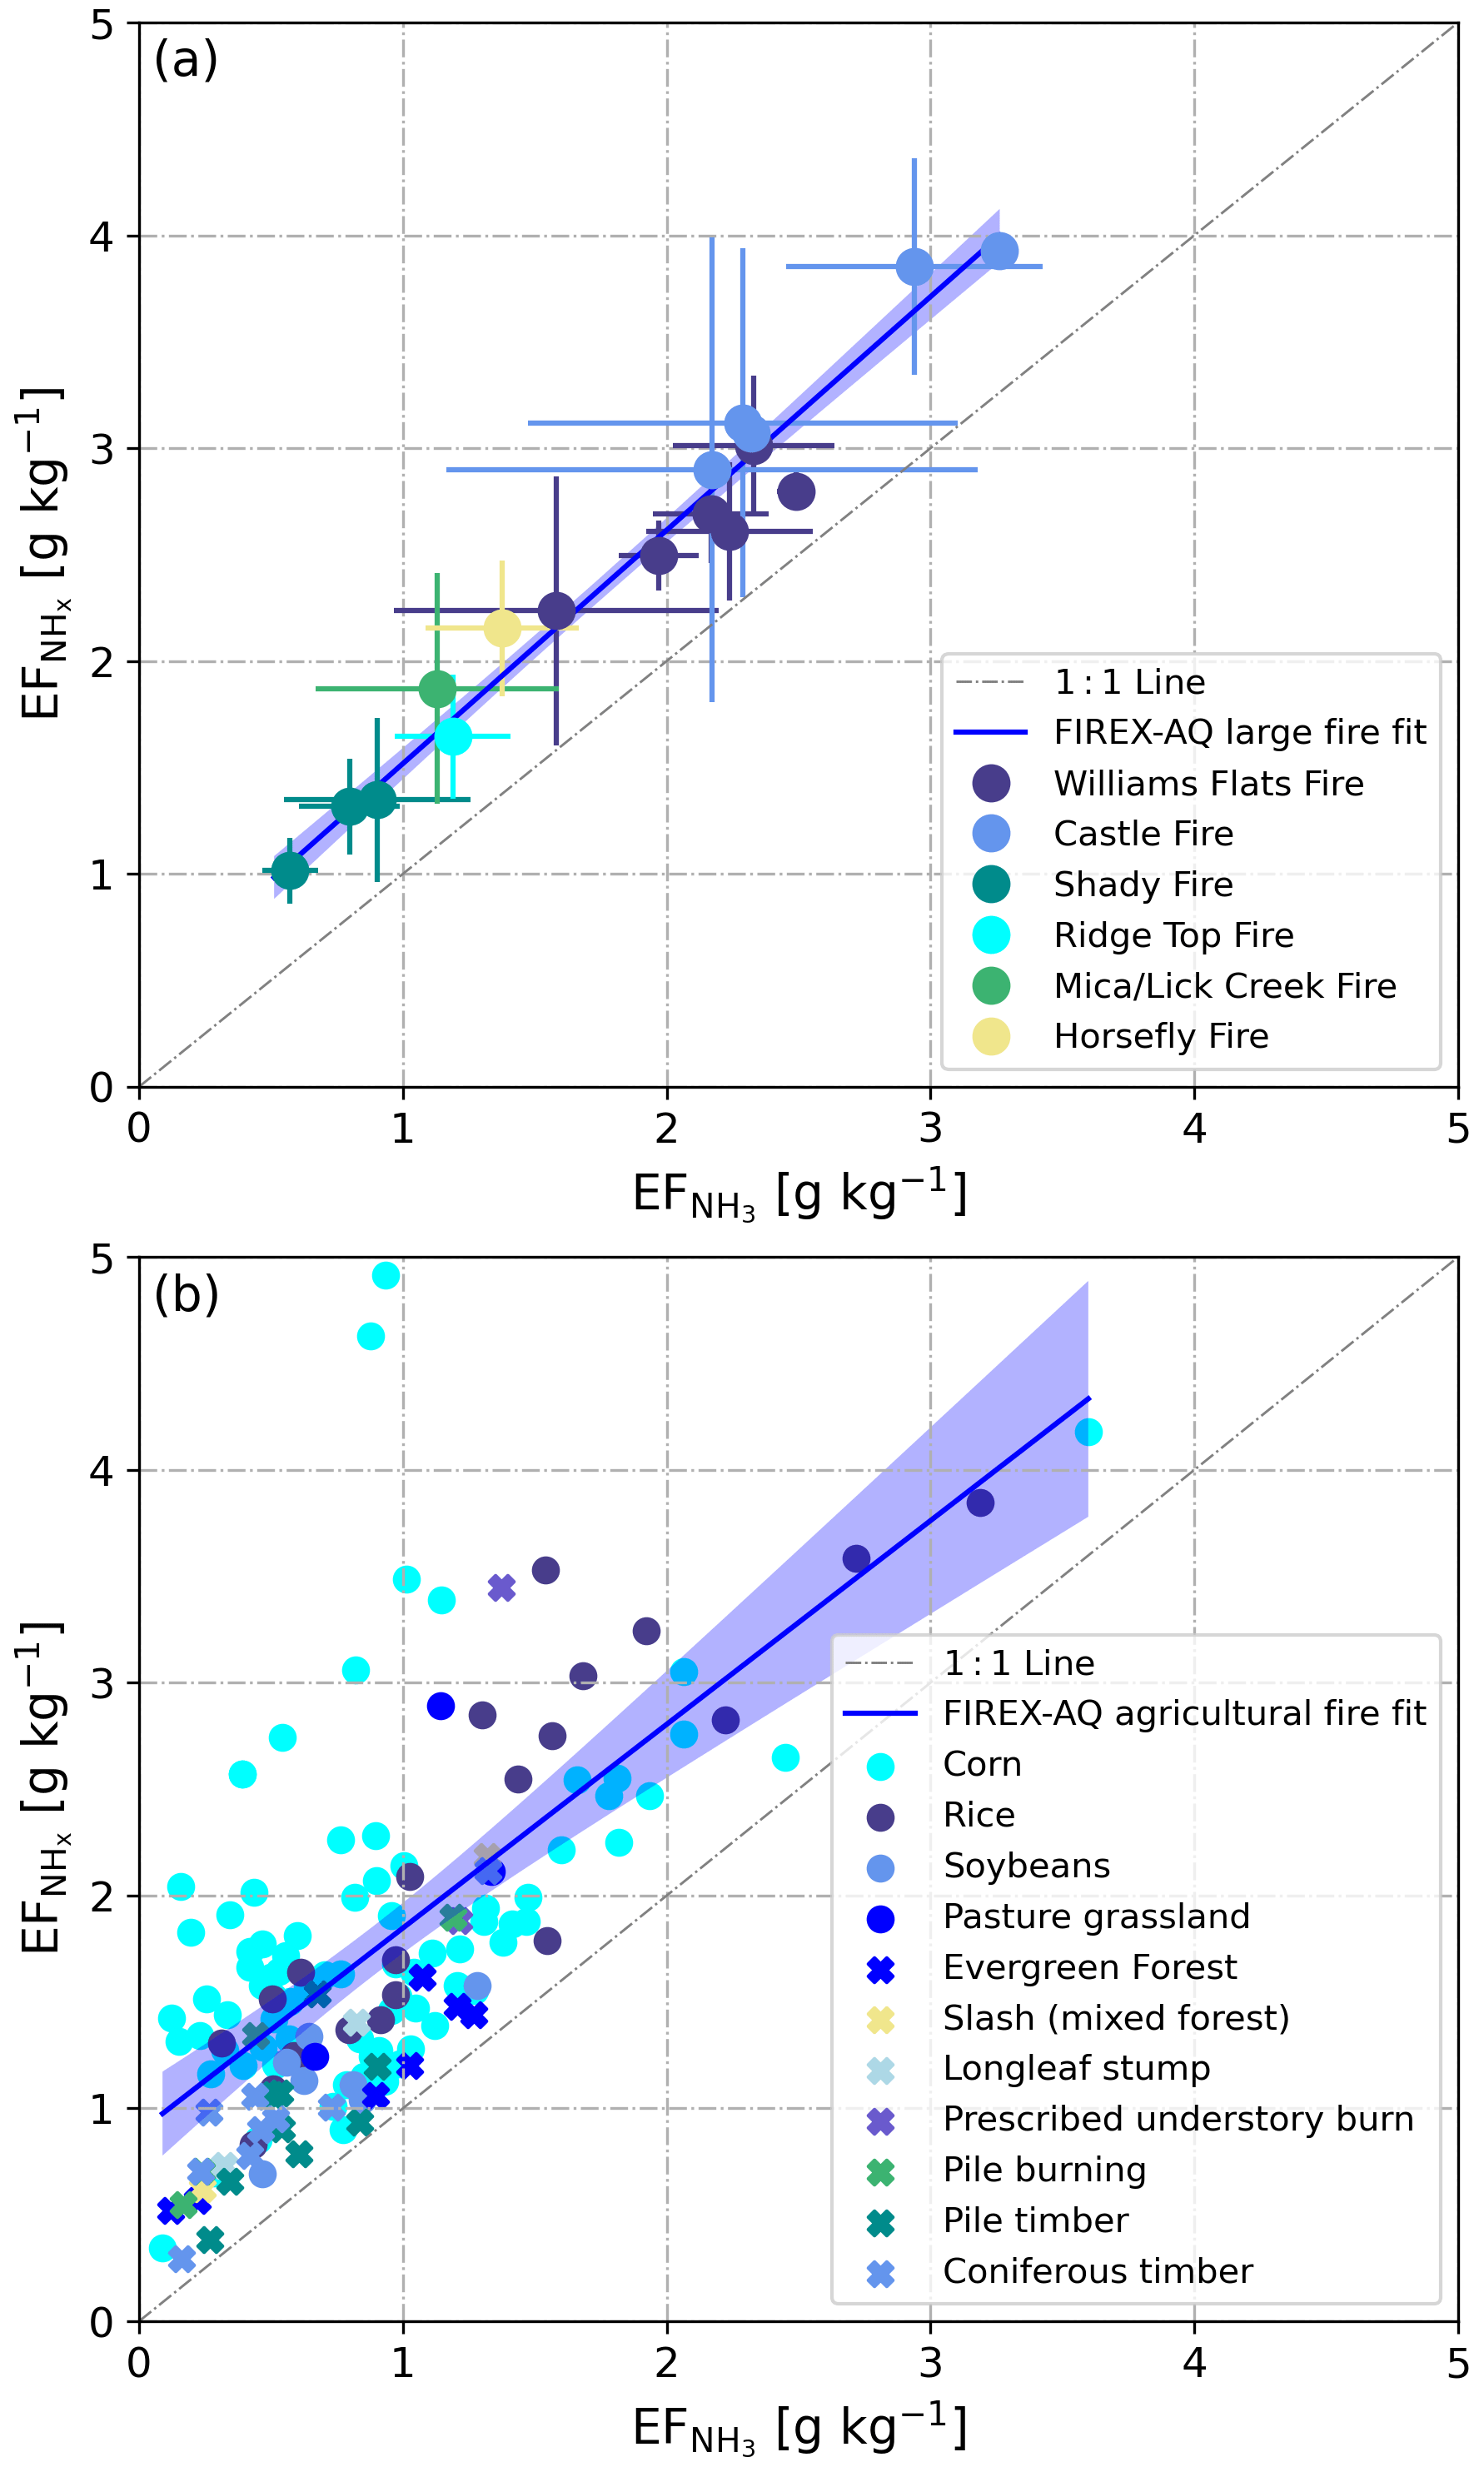
Figure 5 vs. as derived from in situ measurements in the plumes of (a) 6 wildfires and (b) 66 small agricultural fires. In panel (a), SD bars represent the observed natural variability (measurement uncertainties in NH3 and NHx not included). In panel (b), circles represent field-dominated fuels and crosses represent timber-dominated fuels (see Sect. 3.3). The blue lines represent linear regression curves of the average values for wildfires (a) and of all agricultural data in (b). Shaded areas are 95 % confidence bands.
In the case of the agricultural burns, the NASA DC-8 sampled the plumes in very close proximity to the fires. and had again a regression slope of ∼1. The offset was mainly caused by elevated emissions and low NH3 emissions from some of the cornfield fires (Fig. 5b).
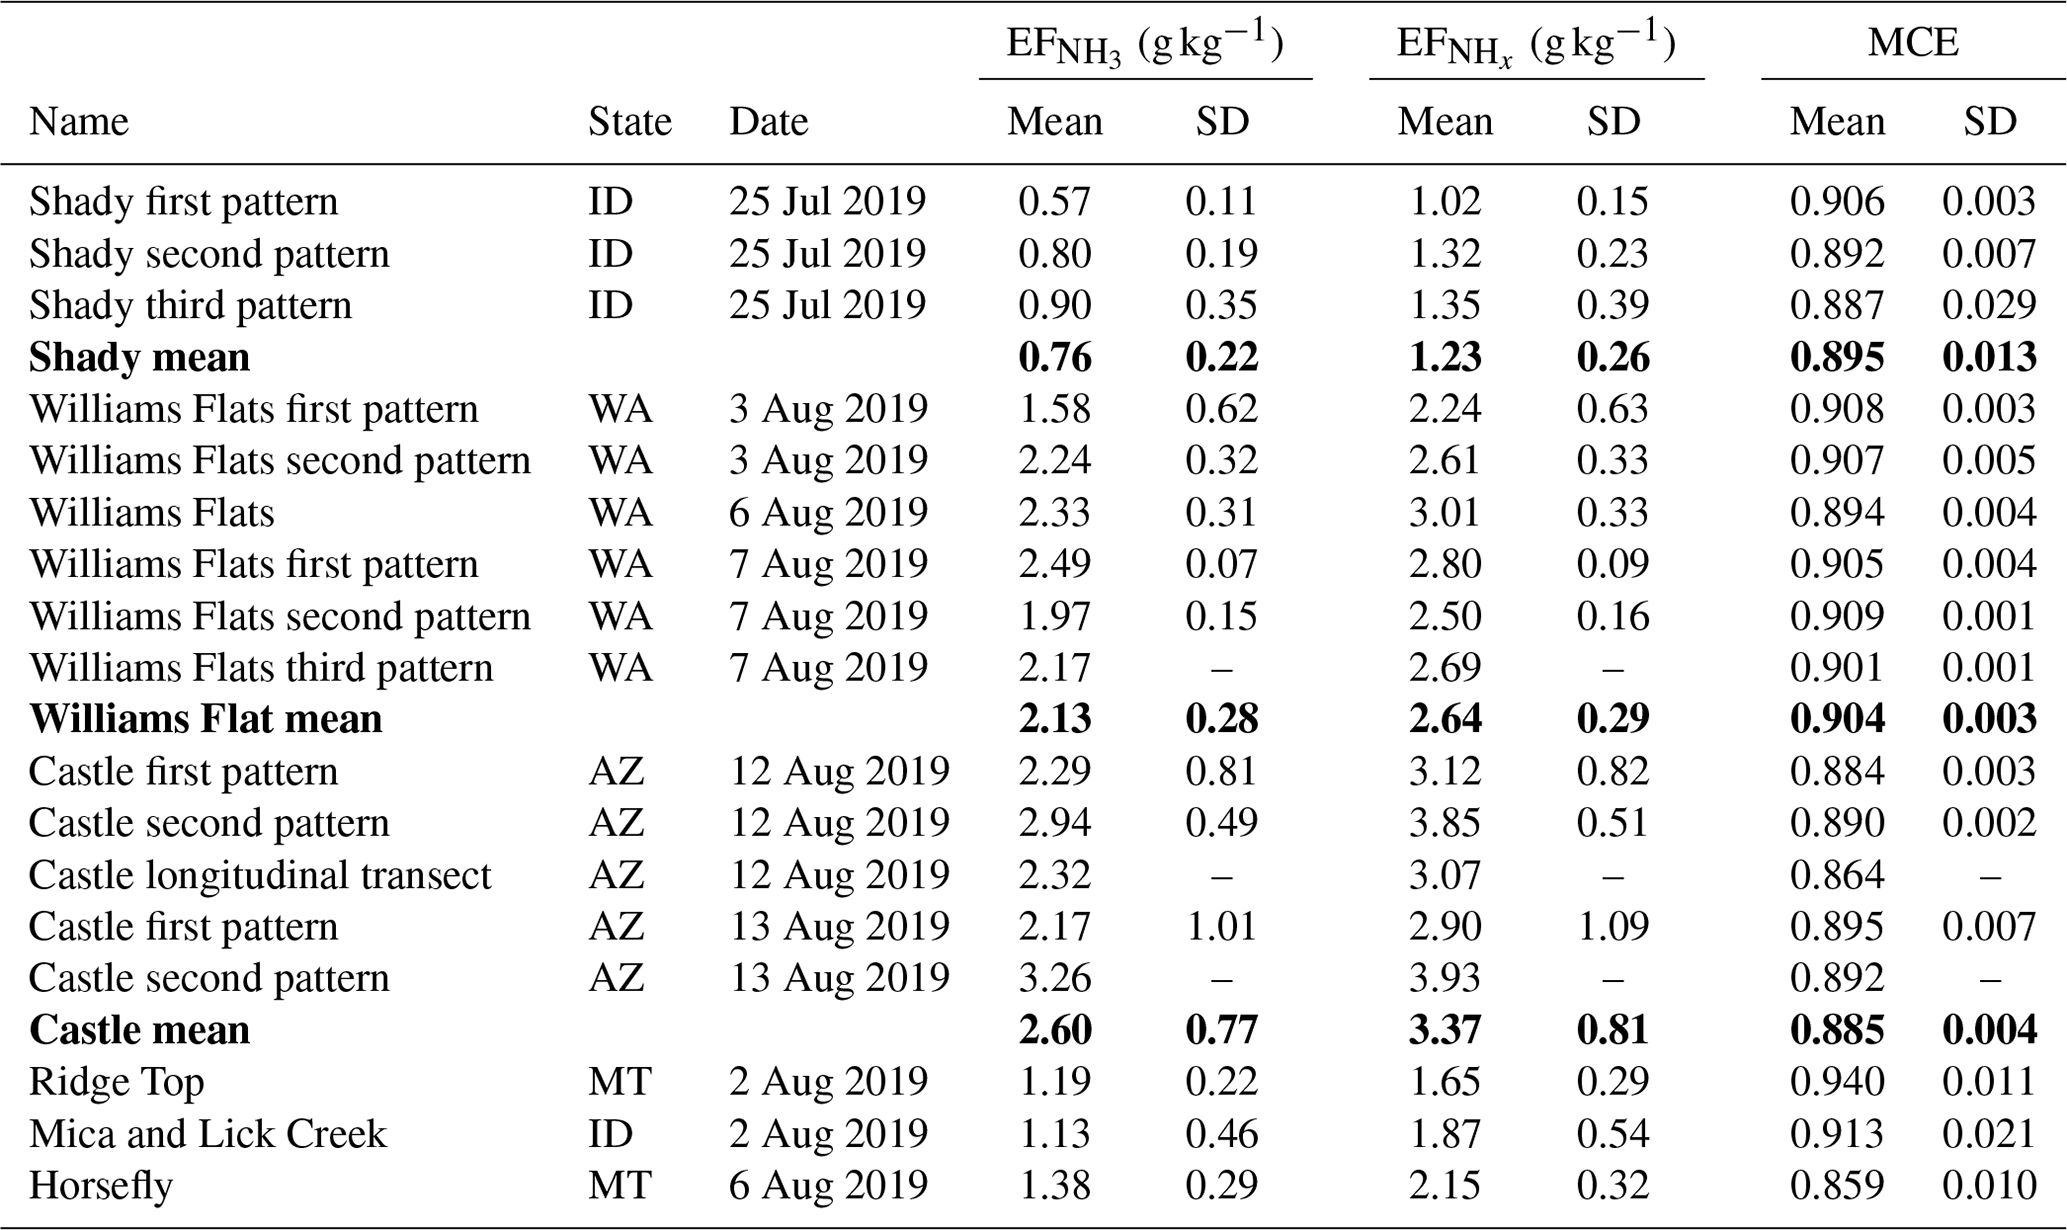
Table 1 and derived from in situ measurements in the plumes of six wildfires in the Western United States. The lines in bold are average values of the above-listed data for the respective fire.
3.2 NH3 and NHx emissions from wildfires in the Western US
In situ measurements of NH3 and were made in smoke plumes emitted from six wildfires in the Western United States. Table 1 provides a detailed overview of and derived from these measurements. Plumes from the Shady, Williams Flats and Castle fires were sampled multiple times, and we list the data from each of the sampling patterns as well as the average value. and were lowest for the Shady Fire. The low emissions may be caused by the difference in fuels, which in the case of the Shady Fire was modified or managed xeric understory (see Table S1).
Average and values for the six wildfires in the Western United States were 1.86±0.75 and 2.47±0.80 g kg−1, respectively. We compare our results to those obtained in two recent studies. Lindaas et al. (2021) investigated NH3 emissions from wildfires in the Western United States during the 2018 WE-CAN campaign. We calculated an average of 1.48±0.91 g kg−1 for the WE-CAN data. This is slightly lower than the average reported herein but within the combined uncertainties of the two methods: ±12 % for the quantum-cascade tunable infrared laser direct absorption spectrometer (QC-TILDAS) used during WE-CAN and ±15 % for the PTR-ToF-MS analyzer used during FIREX-AQ. Selimovic et al. (2018) investigated emissions from fires fueled by a wide range of US vegetation types in the FIREX FireLab 2016 laboratory study. We only used the data for fuels relevant to FIREX-AQ (see Table S1) and obtained a significantly lower average of 0.67±0.38 g kg−1 for the FIREX FireLab data. This finding seems to confirm that laboratory fires do not realistically simulate wildfires (e.g., Yokelson et al., 2013; Hodshire et al., 2019) and thereby underestimate real-world emissions of NH3.
In Fig. 6, we plot the measured values (six wildfires, multiple sampling of three fires) as a function of MCE along with trends from the WE-CAN and FIREX FireLab studies. In the case of the FIREX-AQ data (regression line and confidence band in blue), and MCE correlated poorly, with Pearson's coefficient of determination (R2) being only 0.04. As opposed to the WE-CAN study (regression line and confidence band in black) and the FIREX FireLab experiments (regression line and confidence band in green), we did not find a clear inversion correlation between MCE and NH3 emissions.

Figure 6Scatter plot of (as measured for six wildfires in the Western United States during FIREX-AQ and obtained from two literature sources) vs. MCE.
3.3 NH3 and NHx emissions from agricultural fires in the Southeastern US
In situ measurements of NH3 and were made in smoke plumes emitted from 66 small agricultural fires in the Southeastern United States. Values of varied widely, covering a range from 0.09 to 3.60 g kg−1. The following average values and standard deviations were derived: g kg−1, g kg−1, .
Table 2, and MCE as measured during FIREX-AQ for small agricultural fires in the Southeastern United States burning on different types of fuel. The lines in bold are average values of the above-listed data for field-dominated fuels and timber-dominated fuels, respectively.
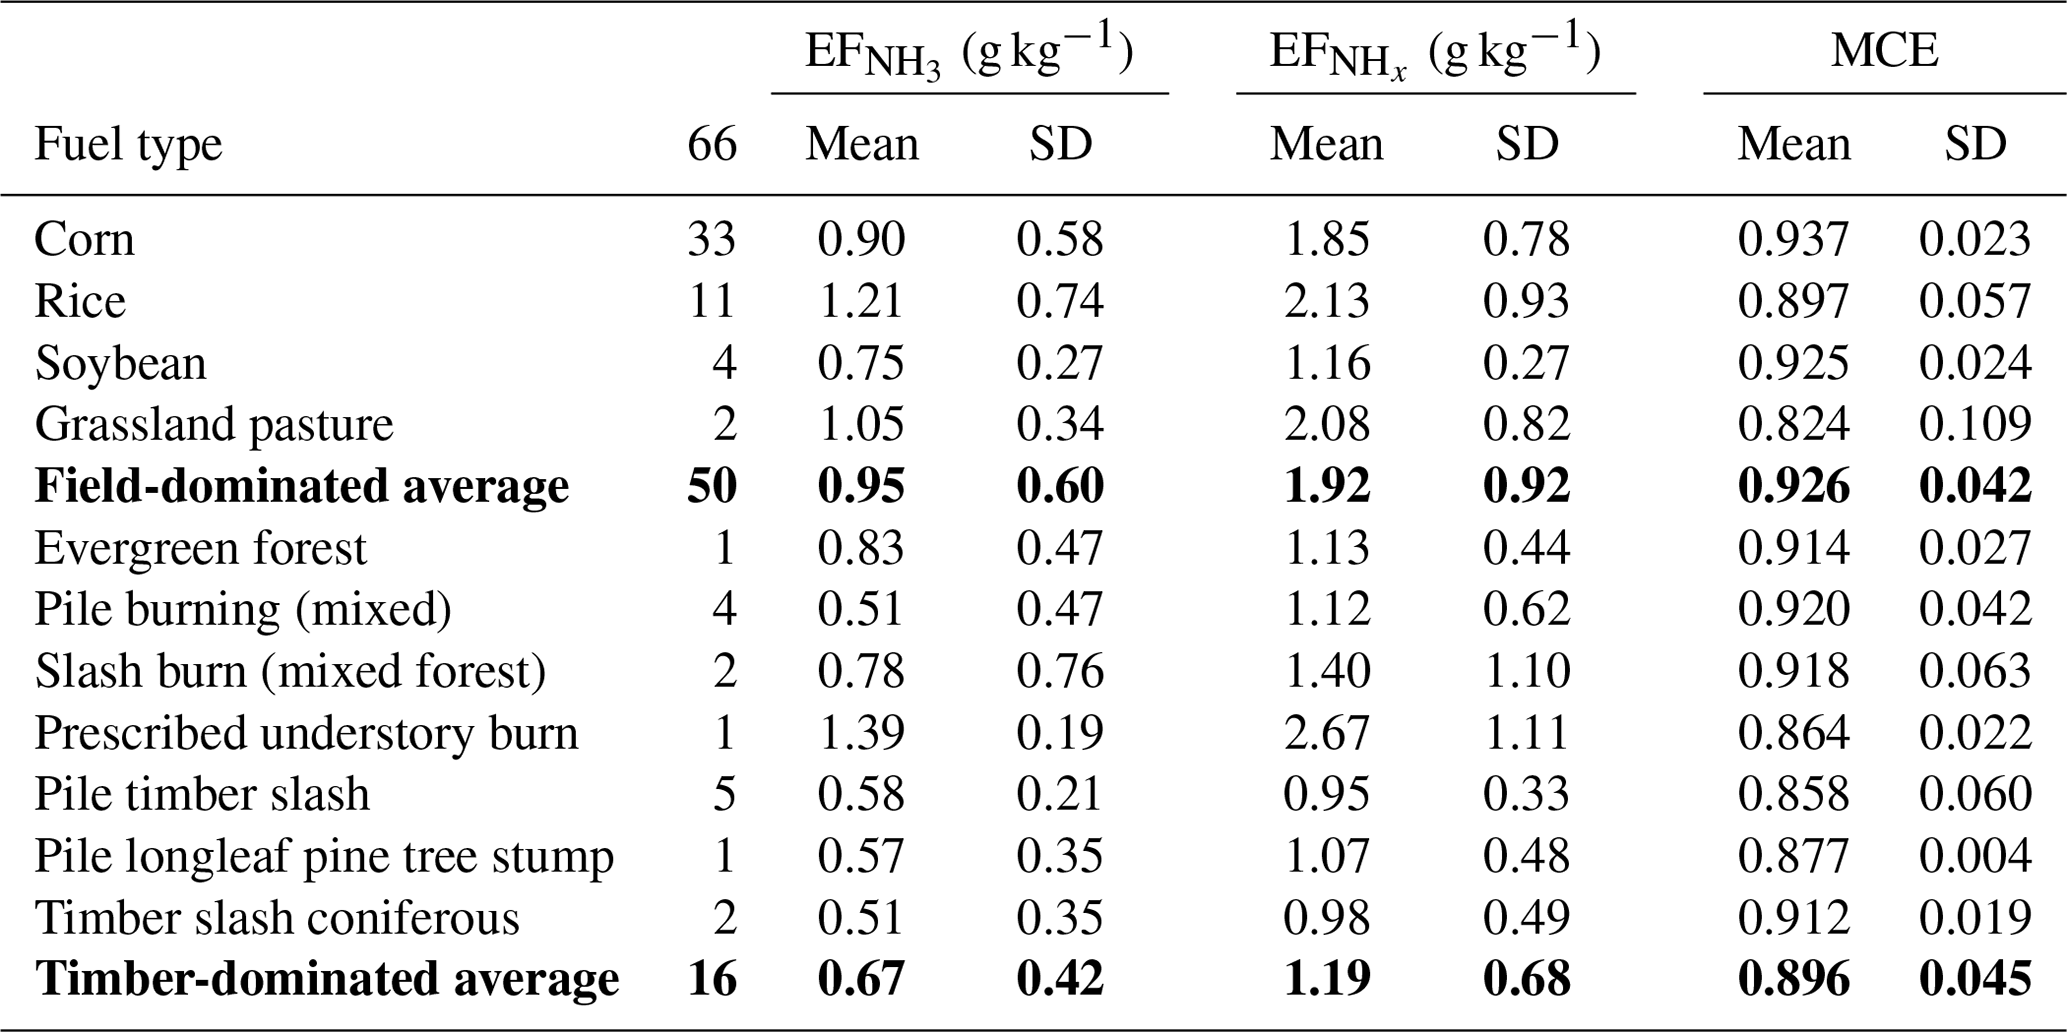
We grouped the agricultural fuels into field-dominated and timber-dominated fuels. The field-dominated fuels include corn, rice, soybeans and grassland pasture. The timber-dominated fuels include evergreen forest, coniferous timber, prescribed understory fire, pile burning, slash burning, pile timber slash mixture burns and pile burning of longleaf pine tree stumps. Table 2 lists , and MCE for the two main categories and 11 subcategories.
The data listed in Table 2 indicate that field-dominated fuels emit more NH3 and NHx than timber-dominated fuels. Agricultural areas are usually nitrogen-fertilized, which may cause increased NH3 emissions. is roughly a factor of 2 higher than , which indicates higher primary emissions and/or a very rapid NH3 to conversion in these fresh plumes.
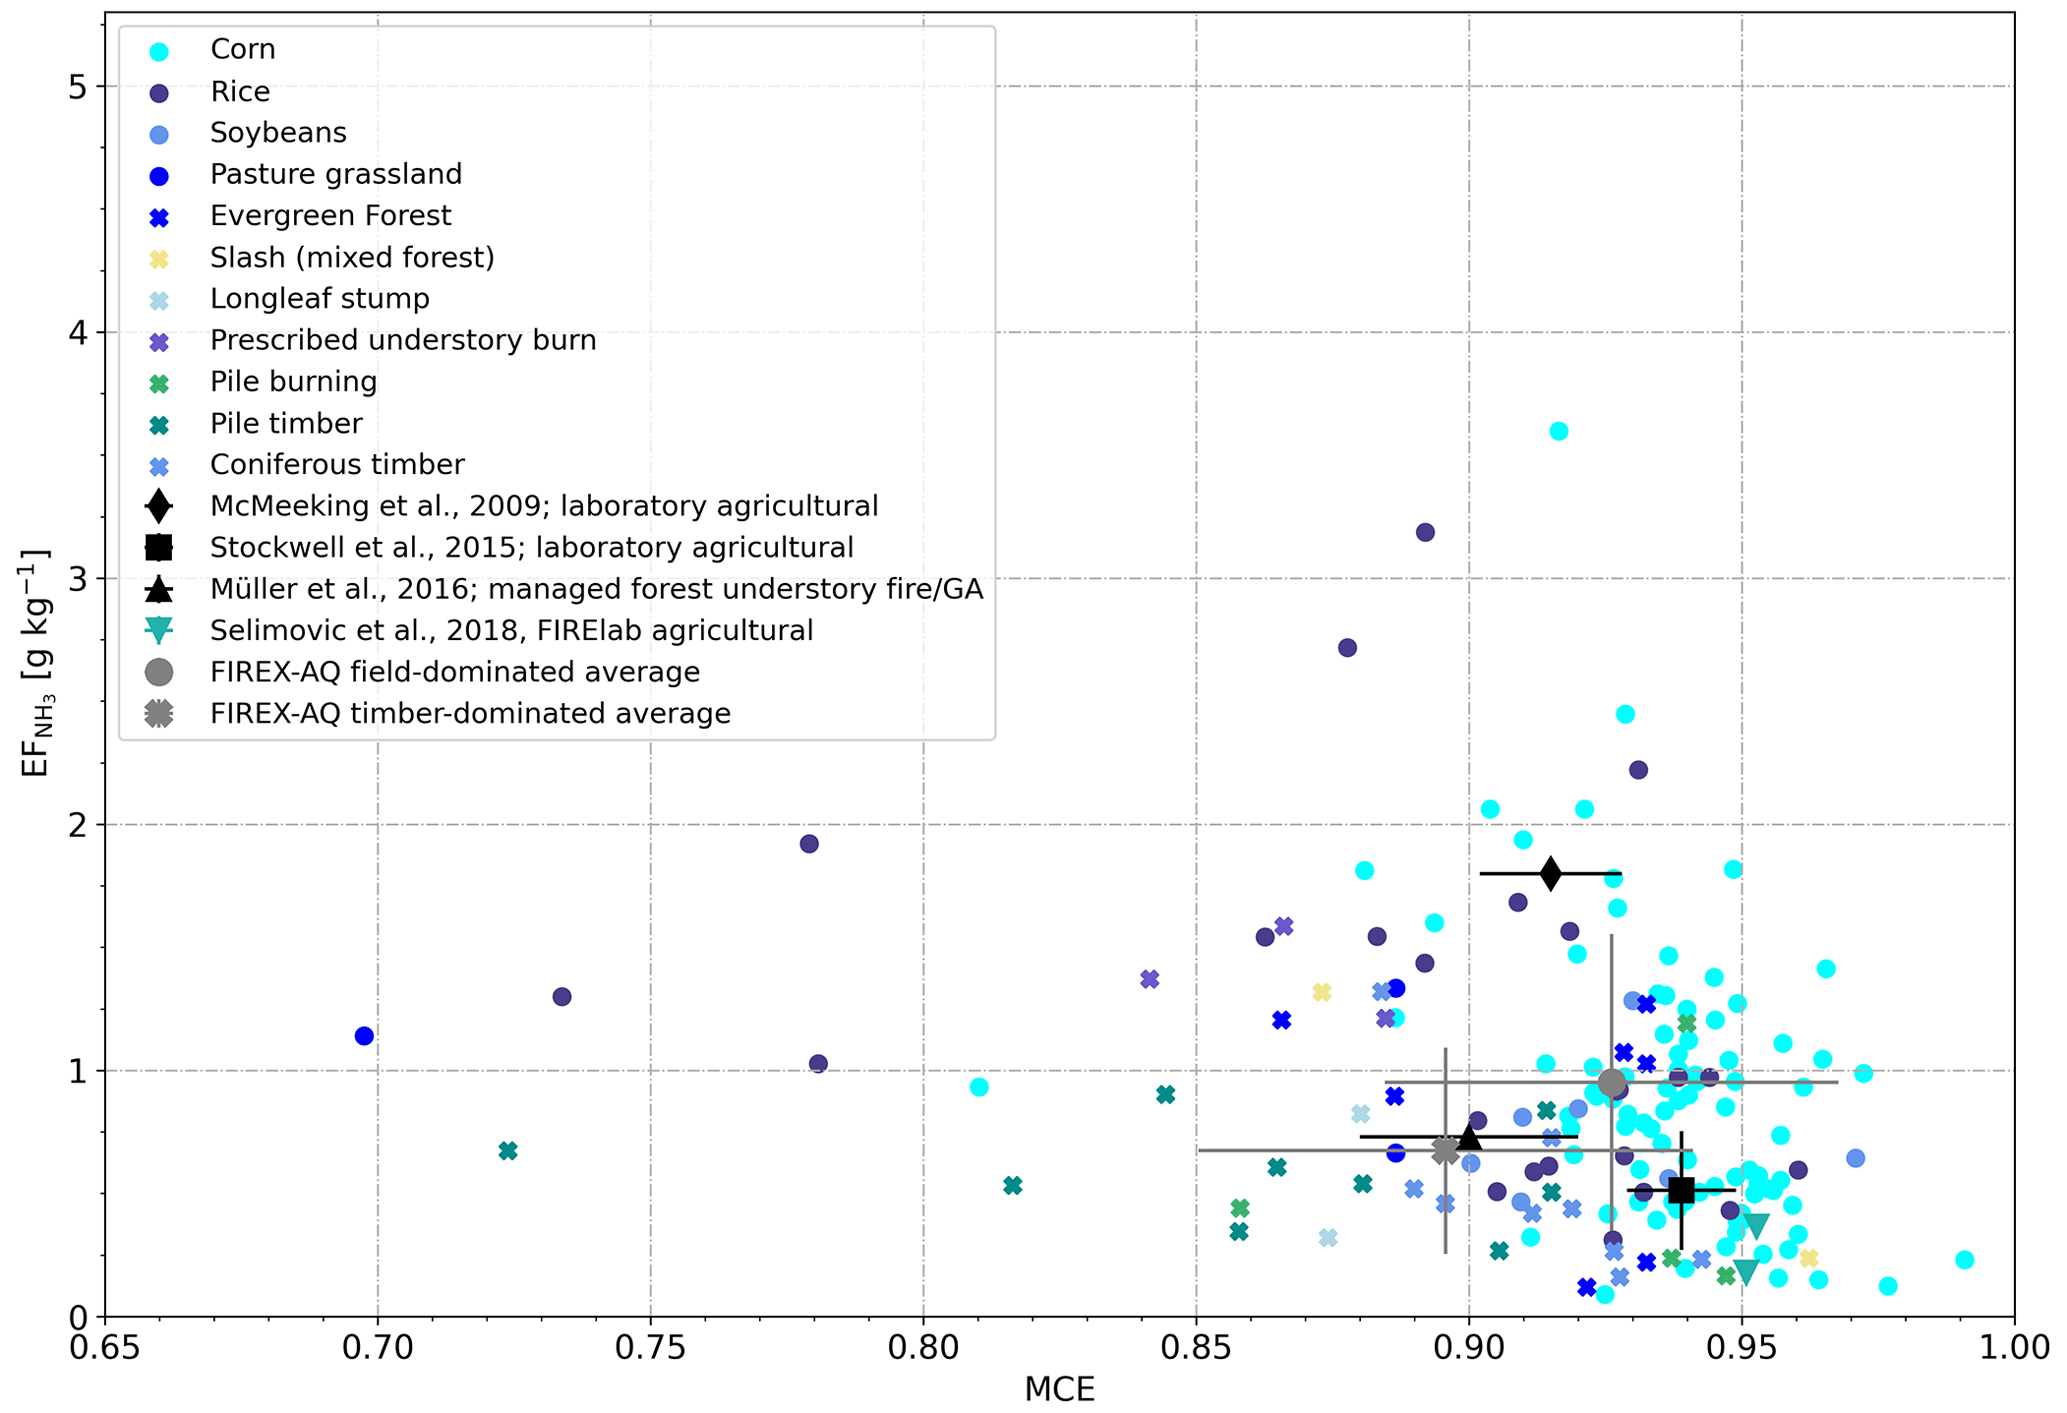
Figure 7Scatter plot of vs. MCE as measured for 66 agricultural fires (circles: field-dominated fuels, crosses: timber-dominated fuels) and obtained from four literature sources.
Table 3, and MCE as measured during FIREX-AQ for two prescribed grassland fires in the Central United States and one prescribed forest fire in the Southern United States.

Figure 7 shows as a function of MCE for different fuels (as measured in individual fires), the averages derived for field-dominated fuels and timber-dominated fuels and the results from four previous studies (McMeeking et al., 2009; Stockwell et al., 2015; Müller et al., 2016; Selimovic et al., 2018). Also in this case, and MCE correlated poorly with R2 being 0.05. The literature values match the low NH3 emissions (<1 g kg−1) we observed for most agricultural fires, but the high NH3 emissions from burning rice and corn residues have not been reported before.
3.4 NH3 and NHx emissions from other fires
We also measured NH3 and in smoke plumes emanating from two prescribed grassland fires in the Central United States and one prescribed forest fire in the Southern United States. These fires do not fall within the two main categories discussed in the previous two sections and are thus separately presented here. Table 3 lists the fire details, , and MCE for these three fires.
During the 2019 FIREX-AQ field campaign, we measured NH3 and aboard the NASA DC-8 in wildfire and agricultural fire plumes. We found that was either directly emitted from the fire (consistent with past laboratory experiments) and/or NH3 had already partially partitioned to particulate at the time of sampling. We thus also evaluated emissions of NHx and produced a comprehensive set of and for wildfires in the Western United States and agricultural fires in the Southeastern United States. Our data show no clear inverse correlation between MCE and . Values of measured in plumes of large wildfires were similar to those observed during the 2018 WE-CAN field campaign, but significantly higher than observed in the FIREX FireLab 2016 laboratory study. We also report the first extensive set of field-measurement-derived and values for different types of agricultural fires in the Southeastern United States. Emissions of NH3 were highest from fires of corn and rice residues. Substantial amounts of were detected in freshly emitted smoke from some of the corn and rice field fires, which warrants further investigation.
All the FIREX-AQ data are available at NASA's Atmospheric Science Data Center (https://doi.org/10.5067/SUBORBITAL/FIREXAQ2019/DATA001) (NASA Atmospheric Science Data Center, 2019).
The supplement related to this article is available online at: https://doi.org/10.5194/acp-23-2331-2023-supplement.
LT supported the PTR-ToF-MS instrument development, performed the field measurements, performed the data analysis and interpretation, and wrote the manuscript draft. TM built and characterized the modified PTR-ToF-MS instrument and performed field measurements. FP performed field and laboratory measurements and supported the data analysis as well as the PTR-ToF-MS instrument development. CJN supported the post-mission calibration experiments. PCJ, HG, BAN, MSK and JLJ provided the data. HH, GD, JPD, JBN provided the CO2, CO and CH4 data. EBW, EG and AJS provided the fuel characterization information. AW conceived the modified PTR-ToF-MS instrument, supervised the measurements and data analysis, performed field measurements and finalized the paper. All authors commented and accepted the final version of the paper.
The contact author has declared that none of the authors has any competing interests.
Publisher's note: Copernicus Publications remains neutral with regard to jurisdictional claims in published maps and institutional affiliations.
Laura Tomsche's research was supported by an appointment to the NASA Postdoctoral Program at the NASA Langley Research Center, administered by Universities Space Research Association under contract with NASA. The FIREX AQ project was funded by the NASA Tropospheric Composition Program (TCP). The University of Innsbruck PTR-ToF-MS instrument was partially funded by the Austrian Federal Ministry for Transport, Innovation and Technology (bmvit, FFG, ASAP). Felix Piel received funding from the European Union's Horizon 2020 research and innovation program under grant agreement no. 674911 (IMPACT). Pedro Campuzano-Jost, Hongyu Guo, Benjamin A. Nault, Melinda K. Schueneman, and Jose L. Jimenez were supported by NASA grants 80NSSC18K0630 and 80NSSC21K1451.
This research has been supported by the National Aeronautics and Space Administration (Tropospheric Chemistry Program, NASA Postdoctoral Program (grant nos. 80NSSC21K1451, 80NSSC19K0124, and 80NSSC18K0630)), the Bundesministerium für Verkehr, Innovation und Technologie (Austrian Space Applications Programme), and the FP7 People: Marie-Curie Actions (grant no. 674911).
This paper was edited by Alex Lee and reviewed by two anonymous referees.
Akagi, S. K., Yokelson, R. J., Wiedinmyer, C., Alvarado, M. J., Reid, J. S., Karl, T., Crounse, J. D., and Wennberg, P. O.: Emission factors for open and domestic biomass burning for use in atmospheric models, Atmos. Chem. Phys., 11, 4039–4072, https://doi.org/10.5194/acp-11-4039-2011, 2011.
Andreae, M. O.: Emission of trace gases and aerosols from biomass burning – an updated assessment, Atmos. Chem. Phys., 19, 8523–8546, https://doi.org/10.5194/acp-19-8523-2019, 2019.
Andreae, M. O. and Merlet, P.: Emission of trace gases and aerosols from biomass burning, Global Biogeochem. Cy., 15, 955–966, https://doi.org/10.1029/2000GB001382, 2001.
Bahreini, R., Ervens, B., Middlebrook, A. M., Warneke, C., de Gouw, J. A., DeCarlo, P. F., Jimenez, J. L., Brock, C. A., Neuman, J. A., Ryerson, T. B., Stark, H., Atlas, E., Brioude, J., Fried, A., Holloway, J. S., Peischl, J., Richter, D., Walega, J., Weibring, P., Wollny, A. G., and Fehsenfeld, F. C.: Organic aerosol formation in urban and industrial plumes near Houston and Dallas, Texas, J. Geophys. Res.-Atmos., 114, D00F16, https://doi.org/10.1029/2008JD011493, 2009.
Bobbink, R. and Hicks, W. K.: Factors Affecting Nitrogen Deposition Impacts on Biodiversity: An Overview, in: Nitrogen Deposition, Critical Loads and Biodiversity, edited by: Sutton, M. A., Mason, K. E., Sheppard, L. J., Sverdrup, H., Haeuber, R., and Hicks, W. K., Springer Netherlands, Dordrecht, 127–138, https://doi.org/10.1007/978-94-007-7939-6_14, 2014.
Burling, I. R., Yokelson, R. J., Griffith, D. W. T., Johnson, T. J., Veres, P., Roberts, J. M., Warneke, C., Urbanski, S. P., Reardon, J., and Weise, D. R.: Laboratory measurements of trace gas emissions from biomass burning of fuel types from the southeastern and southwestern United States, Atmos. Chem. Phys., 10, 11115–11130, https://doi.org/10.5194/acp-10-11115-2010, 2010.
Canagaratna, M. R., Jayne, J. T., Jimenez, J. L., Allan, J. D., Alfarra, M. R., Zhang, Q., Onasch, T. B., Drewnick, F., Coe, H., Middlebrook, A., Delia, A., Williams, L. R., Trimborn, A. M., Northway, M. J., DeCarlo, P. F., Kolb, C. E., Davidovits, P., and Worsnop, D. R.: Chemical and microphysical characterization of ambient aerosols with the aerodyne aerosol mass spectrometer, Mass Spectrom. Rev., 26, 185–222, https://doi.org/10.1002/mas.20115, 2007.
DeCarlo, P. F., Kimmel, J. R., Trimborn, A., Northway, M. J., Jayne, J. T., Aiken, A. C., Gonin, M., Fuhrer, K., Horvath, T., Docherty, K. S., Worsnop, D. R., and Jimenez, J. L.: Field-Deployable, High-Resolution, Time-of-Flight Aerosol Mass Spectrometer, Anal. Chem., 78, 8281–8289, https://doi.org/10.1021/ac061249n, 2006.
Goode, J. G., Yokelson, R. J., Susott, R. A., and Ward, D. E.: Trace gas emissions from laboratory biomass fires measured by open-path Fourier transform infrared spectroscopy: Fires in grass and surface fuels, J. Geophys. Res.-Atmos., 104, 21237–21245, https://doi.org/10.1029/1999JD900360, 1999.
Gordon, I. E., Rothman, L. S., Hill, C., Kochanov, R. V., Tan, Y., Bernath, P. F., Birk, M., Boudon, V., Campargue, A., Chance, K. V., Drouin, B. J., Flaud, J. M., Gamache, R. R., Hodges, J. T., Jacquemart, D., Perevalov, V. I., Perrin, A., Shine, K. P., Smith, M. A. H., Tennyson, J., Toon, G. C., Tran, H., Tyuterev, V. G., Barbe, A., Csaszar, A. G., Devi, V. M., Furtenbacher, T., Harrison, J. J., Hartmann, J. M., Jolly, A., Johnson, T. J., Karman, T., Kleiner, I., Kyuberis, A. A., Loos, J., Lyulin, O. M., Massie, S. T., Mikhailenko, S. N., Moazzen-Ahmadi, N., Muller, H. S. P., Naumenko, O. V., Nikitin, A. V., Polyansky, O. L., Rey, M., Rotger, M., Sharpe, S. W., Sung, K., Starikova, E., Tashkun, S. A., Vander Auwera, J., Wagner, G., Wilzewski, J., Wcislo, P., Yu, S., and Zak, E. J.: The HITRAN2016 molecular spectroscopic database, J. Quant. Spectrosc. Ra., 203, 3–69, https://doi.org/10.1016/j.jqsrt.2017.06.038, 2017.
Griffith, D. W.: Synthetic calibration and quantitative analysis of gas-phase FT-IR spectra, Appl. Spectrosc., 50, 59–70, 1996.
Guo, H., Campuzano-Jost, P., Nault, B. A., Day, D. A., Schroder, J. C., Kim, D., Dibb, J. E., Dollner, M., Weinzierl, B., and Jimenez, J. L.: The importance of size ranges in aerosol instrument intercomparisons: a case study for the Atmospheric Tomography Mission, Atmos. Meas. Tech., 14, 3631–3655, https://doi.org/10.5194/amt-14-3631-2021, 2021.
Hegg, D. A., Radke, L. F., Hobbs, P. V., Rasmussen, R. A., and Riggan, P.: Emissions of some trace gases from biomass fires, J. Geophys. Res.-Atmos., 95, 5669–5675, https://doi.org/10.1029/JD095iD05p05669, 1990.
Hodshire, A. L., Akherati, A., Alvarado, M. J., Brown-Steiner, B., Jathar, S. H., Jimenez, J. L., Kreidenweis, S. M., Lonsdale, C. R., Onasch, T. B., Ortega, A. M., and Pierce, J. R.: Aging Effects on Biomass Burning Aerosol Mass and Composition: A Critical Review of Field and Laboratory Studies, Environ. Sci. Technol., 53, 10007–10022, https://doi.org/10.1021/acs.est.9b02588, 2019.
Kelly, J. T., Parworth, C. L., Zhang, Q., Miller, D. J., Sun, K., Zondlo, M. A., Baker, K. R., Wisthaler, A., Nowak, J. B., Pusede, S. E., Cohen, R. C., Weinheimer, A. J., Beyersdorf, A. J., Tonnesen, G. S., Bash, J. O., Valin, L. C., Crawford, J. H., Fried, A., and Walega, J. G.: Modeling NH4NO3 Over the San Joaquin Valley During the 2013 DISCOVER-AQ Campaign, J. Geophys. Res.-Atmos., 123, 4727–4745, https://doi.org/10.1029/2018JD028290, 2018.
Lewis, K. A., Arnott, W. P., Moosmüller, H., Chakrabarty, R. K., Carrico, C. M., Kreidenweis, S. M., Day, D. E., Malm, W. C., Laskin, A., Jimenez, J. L., Ulbrich, I. M., Huffman, J. A., Onasch, T. B., Trimborn, A., Liu, L., and Mishchenko, M. I.: Reduction in biomass burning aerosol light absorption upon humidification: roles of inorganically-induced hygroscopicity, particle collapse, and photoacoustic heat and mass transfer, Atmos. Chem. Phys., 9, 8949–8966, https://doi.org/10.5194/acp-9-8949-2009, 2009.
Lindaas, J., Pollack, I. B., Garofalo, L. A., Pothier, M. A., Farmer, D. K., Kreidenweis, S. M., Campos, T. L., Flocke, F., Weinheimer, A. J., Montzka, D. D., Tyndall, G. S., Palm, B. B., Peng, Q., Thornton, J. A., Permar, W., Wielgasz, C., Hu, L., Ottmar, R. D., Restaino, J. C., Hudak, A. T., Ku, I-T., Zhou, Y., Sive, B. C., Sullivan, A., Collett Jr., J. L., and Fischer, E. V.: Emissions of Reactive Nitrogen From Western U.S. Wildfires During Summer 2018, J. Geophys. Res.-Atmos., 126, e2020JD032657, https://doi.org/10.1029/2020JD032657, 2021.
Liu, X., Huey, L. G., Yokelson, R. J., Selimovic, V., Simpson, I. J., Müller, M., Jimenez, J. L., Campuzano-Jost, P., Beyersdorf, A. J., Blake, D. R., Butterfield, Z., Choi, Y., Crounse, J. D., Day, D. A., Diskin, G. S., Dubey, M. K., Fortner, E., Hanisco, T. F., Hu, W., King, L. E., Kleinman, L., Meinardi, S., Mikoviny, T., Onasch, T. B., Palm, B. B., Peischl, J., Pollack, I. B., Ryerson, T. B., Sachse, G. W., Sedlacek, A. J., Shilling, J. E., Springston, S., St. Clair, J. M., Tanner, D. J., Teng, A. P., Wennberg, P. O., Wisthaler, A., and Wolfe, G. M.: Airborne measurements of western U.S. wildfire emissions: Comparison with prescribed burning and air quality implications, J. Geophys. Res.-Atmos., 122, 6108–6129, https://doi.org/10.1002/2016jd026315, 2017.
Lobert, J. M., Scharffe, D. H., Hao, W. M., and Crutzen, P. J.: Importance of biomass burning in the atmospheric budgets of nitrogen-containing gases, Nature, 346, 552–554, https://doi.org/10.1038/346552a0, 1990.
Mace, K. A., Artaxo, P., and Duce, R. A.: Water-soluble organic nitrogen in Amazon Basin aerosols during the dry (biomass burning) and wet seasons, J. Geophys. Res.-Atmos., 108, 4512, https://doi.org/10.1029/2003JD003557, 2003.
McMeeking, G. R., Kreidenweis, S. M., Baker, S., Carrico, C. M., Chow, J. C., Collett, J. L., Hao, W. M., Holden, A. S., Kirchstetter, T. W., Malm, W. C., Moosmüller, H., Sullivan, A. P.,and Wold, C. E.: Emissions of trace gases and aerosols during the open combustion of biomass in the laboratory, J. Geophys. Res., 114, D19210, https://doi.org/10.1029/2009jd011836, 2009.
Müller, M., Mikoviny, T., Feil, S., Haidacher, S., Hanel, G., Hartungen, E., Jordan, A., Märk, L., Mutschlechner, P., and Schottkowsky, R.: A compact PTR-ToF-MS instrument for airborne measurements of volatile organic compounds at high spatiotemporal resolution, Atmos. Meas. Tech., 7, 3763–3772, https://doi.org/10.5194/amt-7-3763-2014, 2014.
Müller, M., Mikoviny, T., Feil, S., Haidacher, S., Hanel, G., Hartungen, E., Jordan, A., Märk, L., Mutschlechner, P., Schottkowsky, R., Anderson, B. E., Beyersdorf, A. J., Crawford, J. H., Diskin, G. S., Eichler, P., Fried, A., Keutsch, F. N., Mikoviny, T., Thornhill, K. L., Walega, J. G., Weinheimer, A. J., Yang, M., Yokelson, R. J., and Wisthaler, A.: In situ measurements and modeling of reactive trace gases in a small biomass burning plume, Atmos. Chem. Phys., 16, 3813–3824, https://doi.org/10.5194/acp-16-3813-2016, 2016.
Müller, M., Piel, F., Gutmann, R., Sulzer, P., Hartungen, E., and Wisthaler, A.: A novel method for producing NH4+ reagent ions in the hollow cathode glow discharge ion source of PTR-MS instruments, Int. J. Mass Spectrom., 447, 116254, https://doi.org/10.1016/j.ijms.2019.116254, 2020.
NASA Atmospheric Science Data Center: FIREX-AQ – Fire Influence on Regional to Global Environments and Air Quality, NASA Airborne Science Data for Atmospheric Composition [data set], https://doi.org/10.5067/SUBORBITAL/FIREXAQ2019/DATA001, 2019.
Nault, B. A., Campuzano-Jost, P., Day, D. A., Jo, D. S., Schroder, J. C., Allen, H. M., Bahreini, R., Bian, H., Blake, D. R., Chin, M., Clegg, S. L., Colarco, P. R., Crounse, J. D., Cubison, M. J., DeCarlo, P. F., Dibb, J. E., Diskin, G. S., Hodzic, A., Hu, W., Katich, J. M., Kim, M. J., Kodros, J. K., Kupc, A., Lopez-Hilfiker, F. D., Marais, E. A., Middlebrook, A. M., Neuman,A. J., Nowak, J. B., Palm, B. B., Paulot, F., Pierce, J. R., Schill, G. P., Scheuer, E., Thornton, J. A., Tsigaridis, K., Wennberg, P. O., Williamson, C. J., and Jimenez, J. L.: Chemical transport models often underestimate inorganic aerosol acidity in remote regions of the atmosphere, Commun. Earth Environ., 2, 93, https://doi.org/10.1038/s43247-021-00164-0, 2021.
Ottmar, R. D., Sandberg, D. V., Riccardi, C. L., and Prichard, S. J.: An overview of the Fuel Characteristic Classification System – Quantifying, classifying, and creating fuelbeds for resource planning, Can. J. Forest Res., 37, 2383–2393, https://doi.org/10.1139/x07-077, 2007.
Pan, D., Benedict, K. B., Golston, L. M., Wang, R., Collett, J. L., Tao, L., Sun, K., Guo, X., Ham, J., Prenni, A. J., Schichtel, B. A., Mikoviny, T., Müller, M., Wisthaler, A., and Zondlo, M. A.: Ammonia Dry Deposition in an Alpine Ecosystem Traced to Agricultural Emission Hotpots, Environ. Sci. Technol., 55, 7776–7785, https://doi.org/10.1021/acs.est.0c05749, 2021.
Piel, F., Müller, M., Winkler, K., Skytte af Sätra, J., and Wisthaler, A.: Introducing the extended volatility range proton-transfer-reaction mass spectrometer (EVR PTR-MS), Atmos. Meas. Tech., 14, 1355–1363, https://doi.org/10.5194/amt-14-1355-2021, 2021.
Prichard, S. J., O'Neill, S. M., Eagle, P., Andreu, A. G., Drye, B., Dubowy, J., Urbanski, S., and Strand, T. M.: Wildland fire emission factors in North America: synthesis of existing data, measurement needs and management applications, Int. J. Wildland Fire, 29, 132–147, https://doi.org/10.1071/WF19066, 2020.
Pye, H. O. T., Nenes, A., Alexander, B., Ault, A. P., Barth, M. C., Clegg, S. L., Collett Jr, J. L., Fahey, K. M., Hennigan, C. J., Herrmann, H., Kanakidou, M., Kelly, J. T., Ku, I. T., McNeill, V. F., Riemer, N., Schaefer, T., Shi, G., Tilgner, A., Walker, J. T., Wang, T., Weber, R., Xing, J., Zaveri, R. A., and Zuend, A.: The acidity of atmospheric particles and clouds, Atmos. Chem. Phys., 20, 4809–4888, https://doi.org/10.5194/acp-20-4809-2020, 2020.
Roberts, J. M., Stockwell, C. E., Yokelson, R. J., de Gouw, J., Liu, Y., Selimovic, V., Koss, A. R., Sekimoto, K., Coggon, M. M., Yuan, B., Zarzana, K. J., Brown, S. S., Santin, C., Doerr, S. H., and Warneke, C.: The nitrogen budget of laboratory-simulated western US wildfires during the FIREX 2016 Fire Lab study, Atmos. Chem. Phys., 20, 8807–8826, https://doi.org/10.5194/acp-20-8807-2020, 2020.
Sachse, G., Collins, J., Hill, G., Wade, L., Burney, L., and Ritter, J.: Airborne tunable diode laser sensor for high-precision concentration and flux measurements of carbon monoxide and methane, in: Measurement of atmospheric gases, Proc. SPIE, Los Angeles, CA, USA, https://doi.org/10.1117/12.46162, 1991.
Seinfeld, J. H. and Pandis, S. N.: Atmospheric Chemistry and Physics: From Air Pollution to Climate Change, John Wiley & Sons, ISBN 978-1-118-94740-1, 2016.
Selimovic, V., Yokelson, R. J., Warneke, C., Roberts, J. M., de Gouw, J., Reardon, J., and Griffith, D. W. T.: Aerosol optical properties and trace gas emissions by PAX and OP-FTIR for laboratory-simulated western US wildfires during FIREX, Atmos. Chem. Phys., 18, 2929–2948, https://doi.org/10.5194/acp-18-2929-2018, 2018.
Stockwell, C. E., Veres, P. R., Williams, J., and Yokelson, R. J.: Characterization of biomass burning emissions from cooking fires, peat, crop residue, and other fuels with high-resolution proton-transfer-reaction time-of-flight mass spectrometry, Atmos. Chem. Phys., 15, 845–865, https://doi.org/10.5194/acp-15-845-2015, 2015.
Sun, K., Cady-Pereira, K., Miller, D. J., Tao, L., Zondlo, M. A., Nowak, J. B., Neuman, J. A., Mikoviny, T., Müller, M., Wisthaler, A., Scarino, A. J., and Hostetler, C. A.: Validation of TES ammonia observations at the single pixel scale in the San Joaquin Valley during DISCOVER-AQ, J. Geophys. Res.-Atmos., 120, 5140–5154, https://doi.org/10.1002/2014JD022846, 2015.
Vay, S. A., Tyler, S. C., Choi, Y., Blake, D. R., Blake, N. J., Sachse, G. W., Diskin, G. S., and Singh, H. B.: Sources and transport of Δ14C in CO2 within the Mexico City Basin and vicinity, Atmos. Chem. Phys., 9, 4973–4985, https://doi.org/10.5194/acp-9-4973-2009, 2009.
Warneke, C., Schwarz, J. P., Dibb, J. E., Kalashnikova, O., Frost, G., Al-Saadi,J., Brown, S. S., Brewer, W. A., Soja, A., Seidel, F. C., Washenfelder, R. A., Wiggins, E. B., Moore, R. H., Anderson, B. E., Jordan, C., Yacovitch, T. I., Herndon, S. C., Liu, S., Kuwayama, T., Jaffe, D., Johnston, N., Selimovic, V., Yokelson, R., Giles, D. M., Holben, B. N., Goloub, P., Popovici, I., Trainer, M., Kumar, A., Pierce, R. B., Fahey, D., Roberts, J., Gargulinski, E. M., Peterson, D. A., Ye, X., Thapa, L. H., Saide, P. E., Fite, C. H., Holmes, C. D., Wang, S., Coggon, M. M., Decker, Z. C. J., Stockwell, C. E., Xu, L., Gkatzelis, G., Aikin, K., Lefer, B., Kaspari, J., Griffin, D., Zeng, L., Weber, R., Hastings, M., Chai, J., Wolfe, G. M., Hanisco, T. F., Liao, J., Campuzano-Jost, P., Guo, H., Jimenez, J. L., and Crawford, J.: Fire Influence on Regional to Global Environments and Air Quality (FIREX-AQ), J. Geophys. Res.-Atmos., 128, e2022JD037758, https://doi.org/10.1029/2022JD037758, 2022.
Yokelson, R. J., Griffith, D. W. T., and Ward, D. E.: Open-path Fourier transform infrared studies of large-scale laboratory biomass fires, J. Geophys. Res.-Atmos., 101, 21067–21080, https://doi.org/10.1029/96JD01800, 1996.
Yokelson, R. J., Susott, R., Ward, D. E., Reardon, J., and Griffith, D. W. T.: Emissions from smoldering combustion of biomass measured by open-path Fourier transform infrared spectroscopy, J. Geophys. Res.-Atmos., 102, 18865–18877, https://doi.org/10.1029/97JD00852, 1997.
Yokelson, R. J., Goode, J. G., Ward, D. E., Susott, R. A., Babbitt, R. E., Wade, D. D., Bertschi, I., Griffith, D. W. T., and Hao, W. M.: Emissions of formaldehyde, acetic acid, methanol, and other trace gases from biomass fires in North Carolina measured by airborne Fourier transform infrared spectroscopy, J. Geophys. Res.-Atmos., 104, 30109–30125, https://doi.org/10.1029/1999JD900817, 1999.
Yokelson, R. J., Burling, I. R., Gilman, J. B., Warneke, C., Stockwell, C. E., de Gouw, J., Akagi, S. K., Urbanski, S. P., Veres, P., Roberts, J. M., Kuster, W. C., Reardon, J., Griffith, D. W. T., Johnson, T. J., Hosseini, S., Miller, J. W., Cocker III, D. R., Jung, H., and Weise, D. R.: Coupling field and laboratory measurements to estimate the emisand sion factors of identified and unidentified trace gases for prescribed fires, Atmos. Chem. Phys., 13, 89–116, https://doi.org/10.5194/acp-13-89-2013, 2013.