the Creative Commons Attribution 4.0 License.
the Creative Commons Attribution 4.0 License.
 | 14 Feb 2023
Collective geographical ecoregions and precursor sources driving Arctic new particle formation
James Brean
David C. S. Beddows
Roy M. Harrison
Congbo Song
Peter Tunved
Johan Ström
Radovan Krejci
Eyal Freud
Andreas Massling
Henrik Skov
Eija Asmi
Angelo Lupi
The Arctic is a rapidly changing ecosystem, with complex ice–ocean–atmosphere feedbacks. An important process is new particle formation (NPF), from gas-phase precursors, which provides a climate forcing effect. NPF has been studied comprehensively at different sites in the Arctic, ranging from those in the High Arctic and those at Svalbard to those in the continental Arctic, but no harmonised analysis has been performed on all sites simultaneously, with no calculations of key NPF parameters available for some sites. Here, we analyse the formation and growth of new particles from six long-term ground-based stations in the Arctic (Alert, Villum, Tiksi, Zeppelin Mountain, Gruvebadet, and Utqiaġvik). Our analysis of particle formation and growth rates in addition to back-trajectory analysis shows a summertime maxima in the frequency of NPF and particle formation rate at all sites, although the mean frequency and particle formation rates themselves vary greatly between sites, with the highest at Svalbard and lowest in the High Arctic. The summertime growth rate, condensational sinks, and vapour source rates show a slight bias towards the southernmost sites, with vapour source rates varying by around an order of magnitude between the northernmost and southernmost sites. Air masses back-trajectories during NPF at these northernmost sites are associated with large areas of sea ice and snow, whereas events at Svalbard are associated with more sea ice and ocean regions. Events at the southernmost sites are associated with large areas of land and sea ice. These results emphasise how understanding the geographical variation in surface type across the Arctic is key to understanding secondary aerosol sources and providing a harmonised analysis of NPF across the Arctic.
- Article
(5646 KB) - Full-text XML
-
Supplement
(3045 KB) - BibTeX
- EndNote


Earth's changing climate is substantially increasing temperatures in the Arctic (IPCC, 2014), resulting in loss of sea ice and unprecedented melting of the Greenland ice sheet. Atmospheric aerosols are known to impact the Arctic radiation balance directly (e.g. Sand et al., 2017; Najafi et al., 2015) and alter Arctic clouds (Garrett et al., 2002; Garrett and Zhao, 2006). The impact of aerosol over the last century has been to cool the Arctic (Shindell and Faluvegi, 2009; Acosta Navarro et al., 2016). Thus, there is an urgent need to accurately model this Arctic aerosol to constrain climate sensitivity estimates and predict future patterns in aerosol distribution and sources within the Arctic. However, atmospheric chemical transport and climate models consistently fail to replicate much of the observed variation in aerosol concentrations observed at ground-based stations (Sand et al., 2017), and recently, there has been shown a different temporal trend in predicted and observed cloud cover at a High Arctic site (Gryning et al., 2021), continuing a historical overestimation of low-level clouds in the Arctic by climate models, particularly in the wintertime, most particularly in the daily data). Uncertainties also exist in cloud coverage retrieved by satellites, arising from similarities between clouds and ice–snow surfaces, and frequent temperature and humidity inversions (Browse et al., 2012). Different measurements at Arctic sites show a strong annual cycle in aerosol characteristics, largely dictated by new particle formation (NPF; Tunved et al., 2013; Dall'Osto et al., 2017a, 2018a, b), a process characterised by a sudden burst of nanometre sizes particles in the atmosphere, followed by their growth to larger sizes. The initial formation of these particles is driven by the clustering of gases in the atmosphere to form clusters at a rate faster than their losses due to evaporation or condensation. The second step is driven by both the coagulation and condensation of vapours with sufficiently low vapour pressures to condense down on new particles (Lee et al., 2019). NPF is estimated to be responsible for around half of the global cloud condensation nuclei (CCN) concentrations when neutral and ion-induced mechanisms of particle formation from sulfuric acid, ammonia, and organics are considered (Gordon et al., 2017). These models neglect mechanisms such as iodine nucleation, which has shown to be important in the High Arctic (Baccarini et al., 2020), amines as stabilisers, also important in Antarctica (Brean et al., 2021), and particle formation involving nitric acid, which is important in the upper troposphere (Wang et al., 2022). Other models neglect all mechanisms except those involving sulfuric acid (Liu et al., 2012). As particle concentrations in the Arctic are generally very low, cloud properties in the region are sensitive to small perturbations in CCN counts (Birch et al., 2012). Early measurements of particle size distributions in the Arctic pointed towards an important and highly variable source of nucleation-mode aerosol (Covert et al., 1996), with the indication that these particles were produced above or in the upper layers of the marine boundary layer or from precursors emitted by the open sea (Wiedensohler et al., 1996). Prior research points towards NPF as being a summertime phenomenon (Asmi et al., 2016; Croft et al., 2016; Freud et al., 2017; Leaitch et al., 2013; Nguyen et al., 2016; Tunved et al., 2013). Recently, two papers using online mass spectrometric instrumentation to probe the first steps of cluster formation in Arctic NPF have been published and showed NPF as being driven by iodine oxoacids at Villum Research Station and the central Arctic ocean (Baccarini et al., 2020; Beck et al., 2021), while NPF at Svalbard was driven by the oxidation products of dimethylsulfide (DMS) and ammonia with a contribution of oxygenated organic molecules in the summertime (Beck et al., 2021). Moschos et al. (2022) recently performed a pan-Arctic analysis of organic aerosol (OA), highlighting an annual cycle in which decreasing anthropogenic emissions in the summer are replaced by natural aerosol sources, leading to a relative uniformity in annual OA concentrations. These natural aerosol sources are largely secondary, and they show that the biogenic secondary organic aerosol concentrations are highly sensitive to temperature changes.
NPF events are dependent upon the precursor vapour concentrations, temperature, the ion pair production rate, and the surface area of pre-existing aerosols, and thus, this CCN contribution varies regionally and is a result of an interplay between these factors (Lee et al., 2019). The key parameters driving NPF in the Arctic are not well understood. In polluted locations, the surface area of pre-existing particles often dictates NPF occurrence (Lee et al., 2019). However, in remote locations, condensation sinks are consistently low (Sellegri et al., 2019), and concentrations of precursors and solar radiation intensity may be key in dictating the NPF frequency and intensity. However, with multiple potential mechanisms and many poorly understood sources of precursors from the many and varied ecoregions, Arctic NPF demands further study. Broadly, here we define an ecoregion as being an ecologically and geographically defined area that captures not only the distribution of biological communities but also the environmental conditions (including climate variables) such as ice sheet, marginal sea ice zone, tundra, snow-covered land, sea-ice-influenced open ocean, permanent open ocean, animal-colonised shores and islands, and so on (Barry et al., 2013; Meltofte et al., 2013; CAFF, 2017; Schmale et al., 2021). Research at different sites has, for example, pointed towards sea ice (Allan et al., 2015; Baccarini et al., 2020; Dall'Osto et al., 2017b, 2018b; Heintzenberg et al., 2015) and open water (Dall'Osto et al., 2018b; Croft et al., 2019; Wiedensohler et al., 1996; Willis et al., 2017) regions as being sources of new particle precursors.
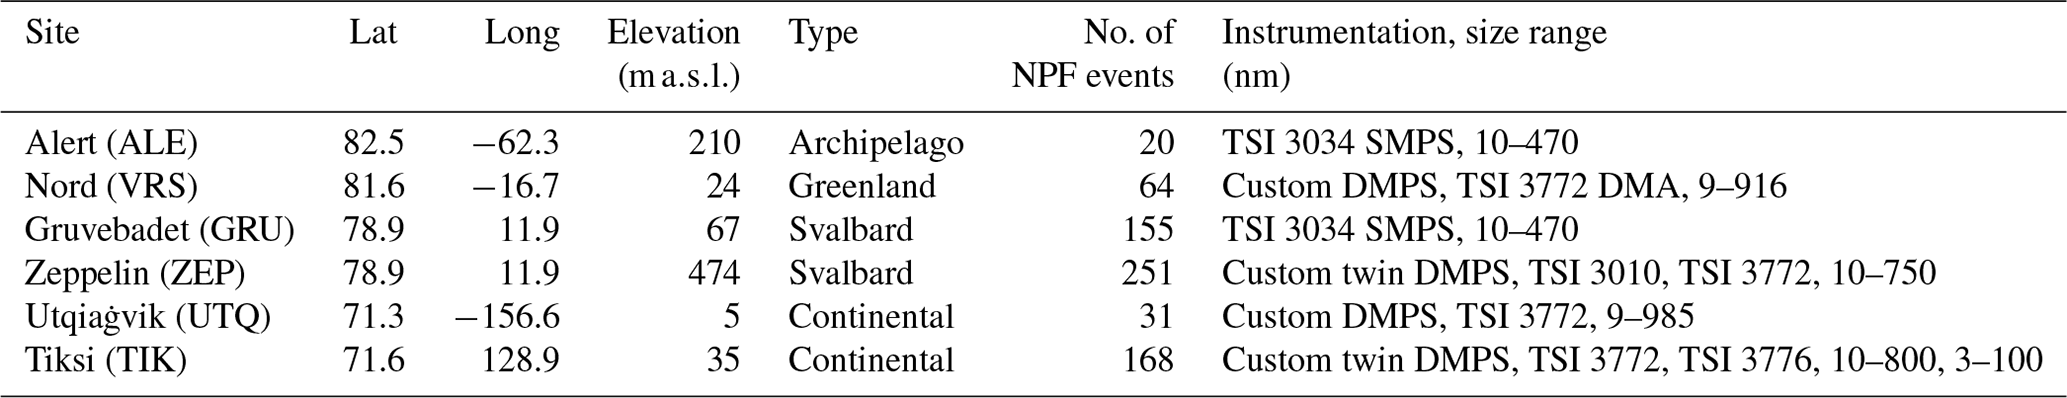
Table 1List of sampling sites and NPF events (689 in total). We separate the sites into types based upon the classification given by Schmale et al. (2021). Two ranges for the size range are given for Tiksi, as the second condensation particle counter (CPC) was changed from the TSI 3772 model to the TSI 3776 model. SMPS is a scanning mobility particle sizer, DMPS is a differential mobility particle sizer, and DMA is a differential mobility analyser.
Linking ecoregions and new particle formation highlights that an emphasis on source processes, and their interplay with atmospheric physical and photochemical conditions, is crucial to understand the driving forces behind Arctic NPF. Despite the numerous long-term measurements which have been conducted for many years, comparisons of NPF events between many Arctic sites remain sparse (Freud et al., 2017; Dall'Osto et al., 2019). Motivated by the lack of studies comparing NPF at these sites simultaneously, and following in the stead of previous publications studying multiple sites in different environments (e.g. Sellegri et al., 2019) with calculations of the key parameters of particle formation and growth rates, we used long-term coordinated field measurement studies of aerosol size distribution to manually identify NPF events by the time evolution of the particle size distribution across the Arctic and investigated the rates of particle formation and growth. We further used back-trajectory analysis to determine the air masses associated with NPF events, how strongly each trajectory contributed to NPF, and the surface types these air masses flowed over prior to NPF occurrence (open ocean, sea ice, land, or snow). Our results show that bursts of newly formed particles in different Arctic regions are associated with different source regions, indicating the likelihood of multiple mechanisms being at play.
2.1 Sampling sites
Aerosol particle size distributions were collected from six Arctic long-term sites summarised in Table 1, with data coverage shown in Fig. 1 after being filtered for anthropogenic influences based on either the shape of the size distribution or the air mass direction (Asmi et al., 2016; Freud et al., 2017; Dall'Osto et al., 2018a, b). There is a limited data overlap between the sites, with best overlap occurring during 2015, where data are measured for several months at all sites except one. The mean size distribution from each site for this period, alongside the mean across all time periods, is plotted in Fig. S1 in the Supplement. The location of each site is highlighted in Fig. S2. Data from the Dr. Neil Trivett Global Atmosphere Watch Observatory at Alert (ALE) were collected using a TSI 3034 SMPS (scanning mobility particle sizer; Steffen et al., 2014), representing the northernmost site, 8 km from the shore of Ellesmere Island. This site represents the Canadian Arctic Archipelago. The Villum Research Station is located near Station Nord (VRS) and is located in northeastern Greenland, 3 km from the shore. A Vienna-type DMA (differential mobility analyser) attached to a TSI 3772 condensation particle counter (CPC) collects the size distribution. These are the two northernmost sites, and these sites spend most of the year surrounded by sea ice. The measurement site at Tiksi (TIK) is in the Russian Arctic, 500 m from the shore and 5 km from the town of Tiksi itself. A twin DMPS (differential mobility particle sizer) system collects the size distribution here. The Utqiaġvik measurement site (UTQ; formerly known as Barrow) is 3 km from the shore, and 5 km northeast of the nearest town in Alaska, where a custom-built DMPS connected to a TSI 3772 CPC collects the size distribution data. Data coverage here is relatively low (25 %) due to regular anthropogenic influence. Together, TIK and UTQ represent the continental Arctic. The measurement site at Gruvebadet (GRU) is in the proximity of the village of Ny-Ålesund, southeast of the main agglomerate of the village. A TSI 3034 SMPS measures the size distribution here. Measurements at Zeppelin Mountain (ZEP) are conducted at a height of 474 m, adjacent to the GRU measurement site. A size distribution is collected here using a custom twin-DMPS system, with one Vienna-type medium DMA coupled to a TSI 3010 CPC and a Vienna-type short DMA coupled to a TSI 3772 CPC. The aerosol dynamics at both GRU and ZEP sites are quite dissimilar due to the ∼ 400 m elevation difference and differing prevailing winds (Dall'Osto et al., 2019). Intercomparison workshops have shown differences between instruments measuring particle size distributions to be within 10 %, increasing at smaller diameters (Wiedensohler et al., 2012). This produces some uncertainty when we are comparing particle formation rates and growth rates of particles in these smaller size regimes, but this uncertainty is substantially smaller than the differences in particle concentrations between sites.
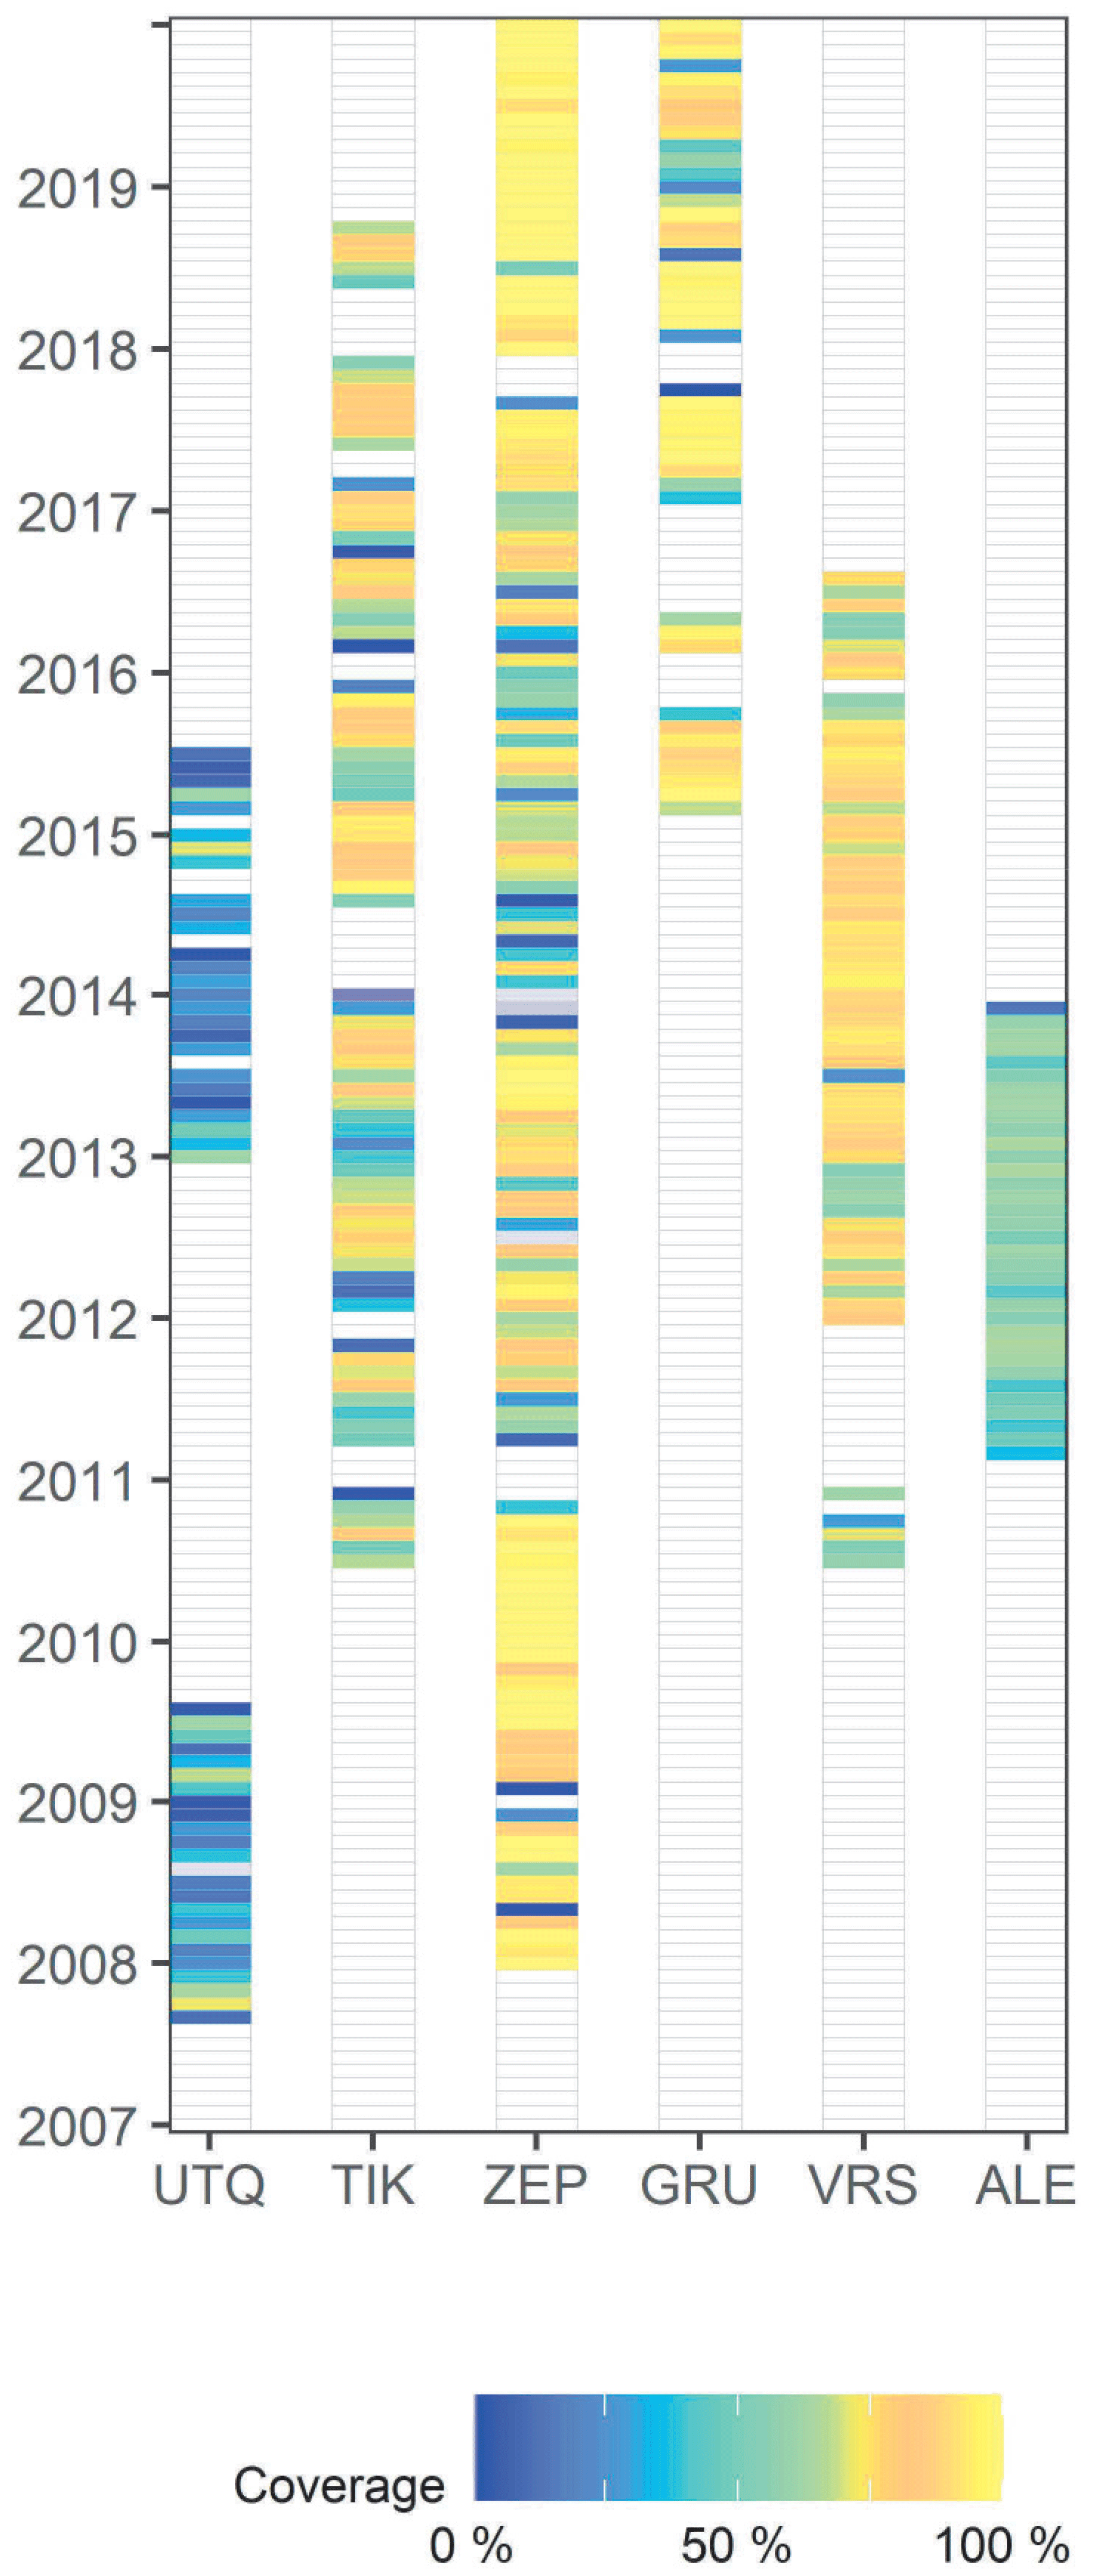
Figure 1Data coverage for each of the sites. Each individual cell corresponds to 1 full month of measurements. The fill colour corresponds to the total amount of available hourly data as a percentage of the total hours within that month. The abbreviations along the bottom axis correspond to Utqiaġvik, Tiksi, Zeppelin Mountain, Gruvebadet, Villum research station, and Alert.
Throughout this text, the seasons are defined as spring (March–May, MAM), summer (June–August, JJA), autumn (September–November, SON), and winter (December–February, DJF). All times are in local time. All data were cleaned and filtered, as described in Asmi et al. (2016), Freud et al. (2017), and Dall'Osto et al. (2017b, 2018a, b). Overall, our large dataset is composed of 9765 d of SMPS size distributions collected at ALE (972 d), UTQ (594 d), GRU (1019 d), ZEP (3356 d), VRS (1735 d), and TIK (1999 d). The size distribution from 10 nm is used for all sites. At the TIK site, there is occasionally missing data in the 10–16 nm range. Formation and growth rates derived from these data are not used here.
2.2 NPF parameters
The condensation sink (CS; s−1) represents the rate at which a vapour-phase molecule will collide with pre-existing particle surface. It was calculated from the size distribution data, as follows (Kulmala et al., 2012):
where D is the diffusion coefficient of the diffusing vapour (assumed to be sulfuric acid), βm is a transition regime correction (Kulmala et al., 2012), dp is the particle diameter, and is the number of particles at diameter dp. The formation rate of new particles at size dp () is calculated as follows, presuming a homogeneous air mass:
where the first term on the right-hand side comprises the rate at which particles enter the size dp, and the second term refers to losses from this size by coagulation (with being the coagulation sink at size dp, and being the number of particles at size dp; calculated according to Cai and Jiang, 2017). The third term refers to losses from this size by growth, where the growth rate (GR) of new particles is as follows:
This was calculated through the lognormal distribution method outlined in Kulmala et al. (2012). If it is presumed that all particle growth is driven by sulfuric acid condensation, then the condensing vapour concentration needed to describe the observed particle growth rates (Cvap) can be calculated thus (Nieminen et al., 2010):
where ρp is the particle-phase density, Dv is the diffusivity of vapour (sulfuric acid), mv is the mass of one molecule of vapour, dp and dp0 are the particle diameters at times t and 0, respectively, λ is the mean free path of the condensing vapour (sulfuric acid), and α is the mass accommodation coefficient (presumed to be 1). The steady-state production rate (Q) of this vapour is therefore described, as follows, by the product of the concentration and loss terms (Dal Maso et al., 2005):
In Eqs. (4) and (5), the assumption is, of course, that sulfuric acid is the sole vapour driving particle growth. Across the Arctic, methane sulfonic acid (MSA), sulfuric acid, ammonia, and iodine oxides have all been shown to contribute to particle growth (Beck et al., 2021), however, as the condensed-phase density and molecular masses of these molecules vary widely. Thus, for these calculations, we make the assumption that sulfuric acid drives all growth, but note that this is a source of uncertainty.
2.3 Analysis of NPF events
NPF events, identified visually based on the time evolution of the time evolution and here plotted as contour plots using the criteria of Dal Maso et al. (2005), were separated into three types by manual inspection. Type A represents events with formation and particle growth (banana-type events), Type B represents events with limited growth (particles do not make it to 30 nm), and Type C represents events where the particles appear at > 10 nm, here presumed to be particles advected from a nearby location where new particles have formed, and the new mode of particles is growing at the time of measurement. Only Types A and B are used in our data analysis. The formation of particles at the smallest measured sizes is a key characteristic of NPF and is required to calculate formation rates reliably. There is also a chance that Type C events include particles not formed secondarily, but just show the growth of primary particles, and thus we neglect to include Type C events in these analyses. These events were isolated and classified by the shape of their size distributions. Examples are shown in Fig. S3, and NPF event start and stop points are shown in Fig. S4.
2.4 Back-trajectories and concentration-weighted trajectories
The National Oceanic and Atmospheric Administration (NOAA) Hybrid Single-Particle Lagrangian Integrated Trajectory (HYSPLIT) model was used to calculate 3 d back-trajectories for air masses arriving at the sampling sites. Each back-trajectory data point was assigned to a surface type (land, sea, ice, or snow over land). A cell is considered to be ice-covered if more than 40 % of the cell is covered with ice on a 24 km grid from the daily Interactive Multisensor Snow and Ice Mapping System (IMS; Anon, US National Ice Center, 2008). To investigate the sources leading to particle growth, these 72 h back-trajectories were gridded to 1 × 1 grid cells of 1∘ each and linked back to the steady-state production rate of equivalent sulfuric acid by the following equation:
where is the concentration-weighted trajectory at cell i,j, N is the total number of trajectories, ck is the value of Q associated with the arrival of trajectory k, and τijk is the residence time of trajectory k in grid cell i,j. therefore describes the source strength of condensable vapour that drives particle growth from any particular grid cell (Hsu et al., 2003; Lupu and Maenhaut, 2002). This was done using the trajLevel function in the openair package in R 3.4.3. Trajectories more than 1000 (above ground level) were not considered in these analyses, excluding 2.2 % of trajectories that were mostly at ZEP. The time of 72 h lies somewhere between the long atmospheric lifetime of SO2 (von Glasow et al., 2009) and the shorter lifetime of reactive volatile organic compounds (VOCs), MSA, and iodine compounds (Fuentes et al., 2000; Sherwen et al., 2016; Kloster et al., 2006).
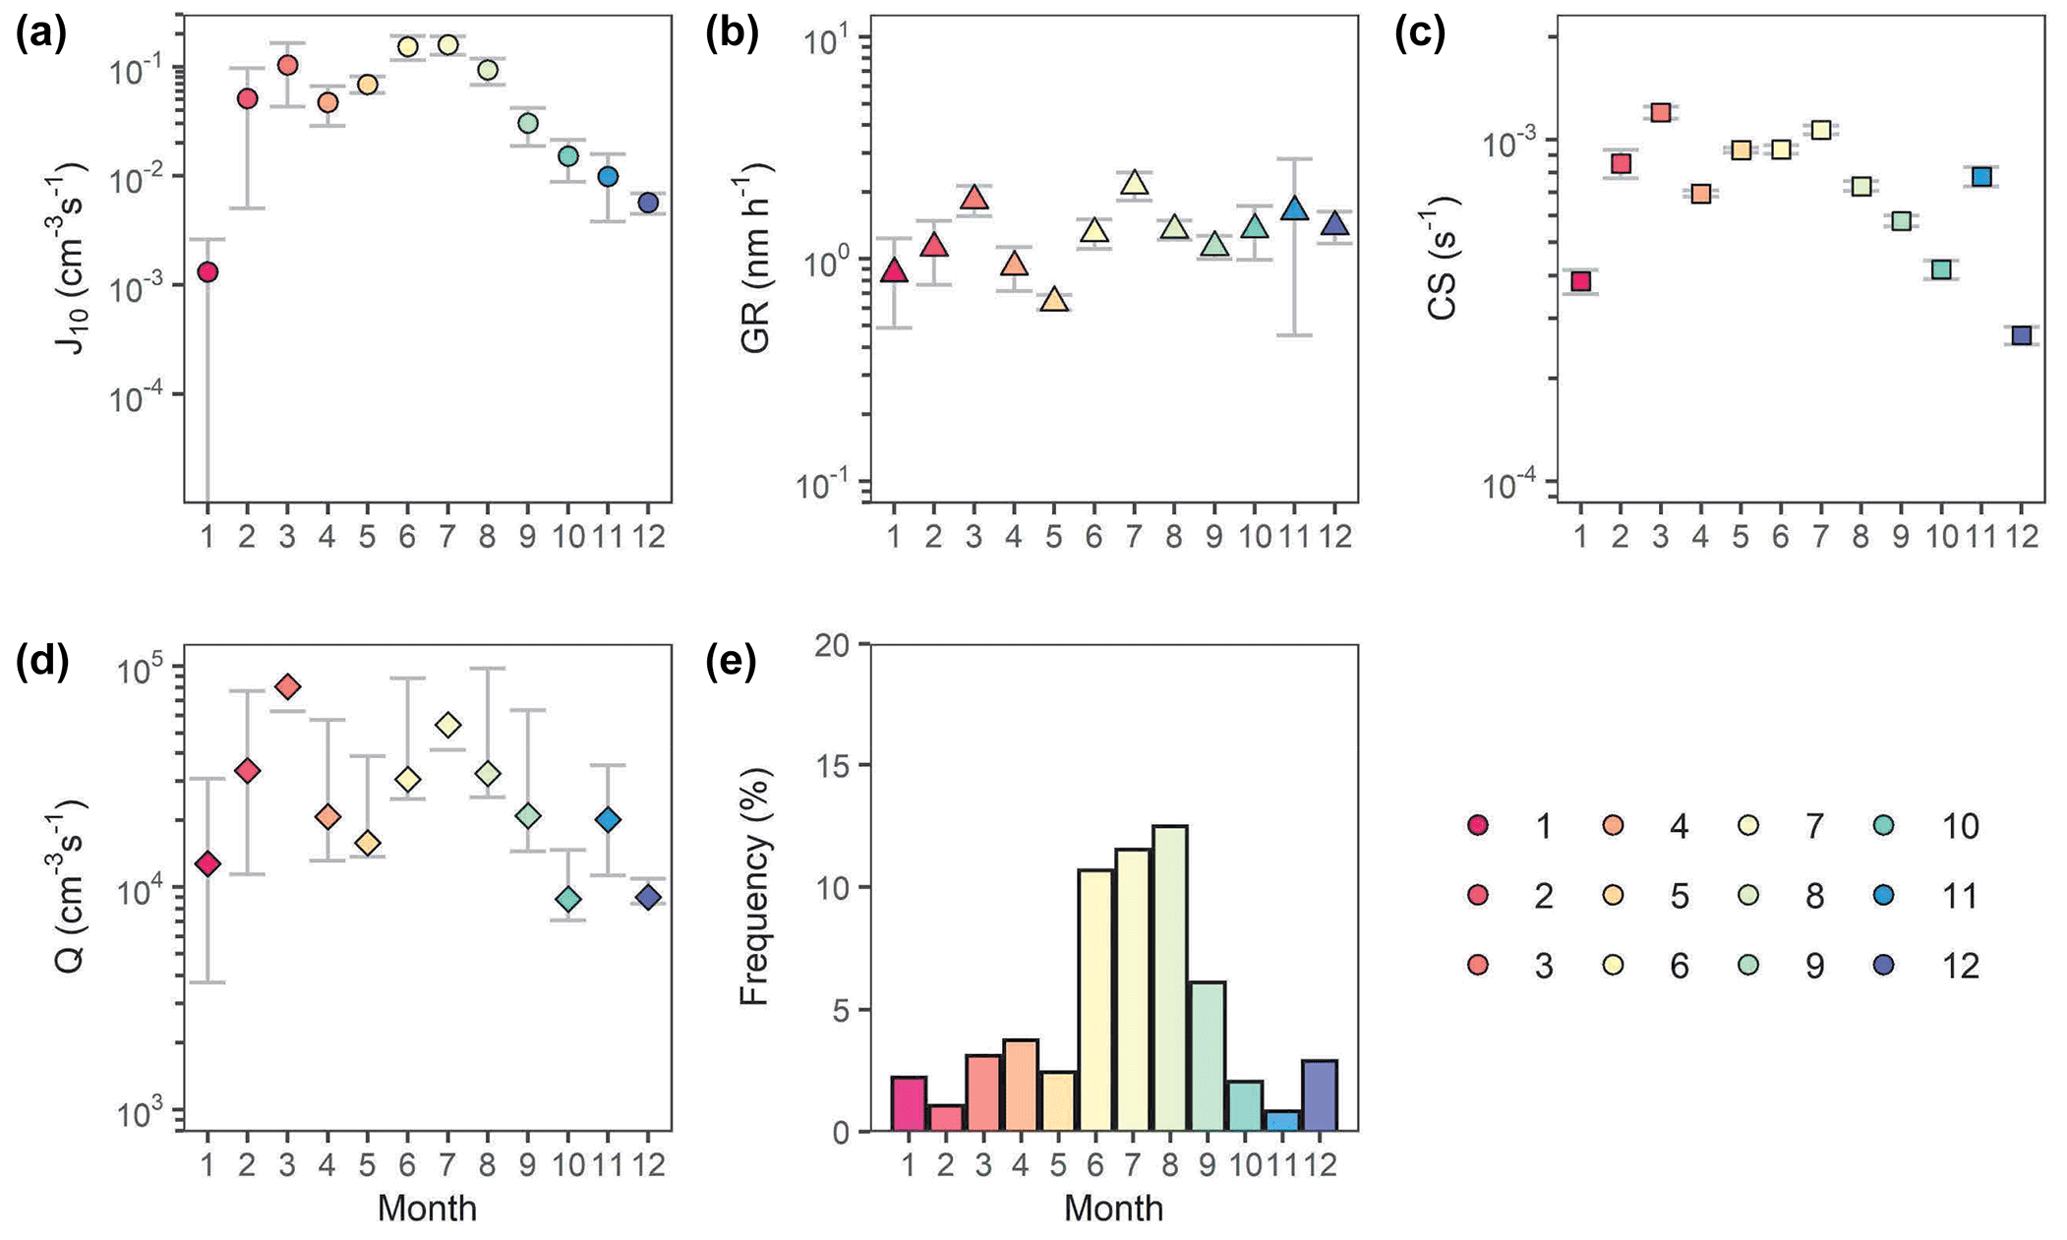
Figure 2Mean seasonal characteristics of NPF events from six Arctic sites, showing the (a) formation rates at 10 nm, (b) growth rates, (c) condensation sinks during NPF events, (d) vapour source rates, and (e) NPF event frequency. Data points show the mean, and error bars show one standard error in the mean. Data have been normalised to the size of the dataset relative to the average size of datasets to avoid favouring datasets with longer runs of data. Colours represent each month.
3.1 Seasonal variation in NPF
Figure 2 shows the characteristics of NPF events by month for all sites, and each site is weighted by the span of data available. J10 values peak in the summertime, with summertime means being significantly greater than the mean for other seasons (0.14 in summer and 0.054 through other seasons; frequency of > 10 % for JJA), which is coincidental with the months of highest insolation and likely those of highest photochemical activity. GRs are also higher in summer months compared to the mean for other seasons (1.6 nm h−1 in summer and 0.93 nm h−1 through other seasons). While winter and springtime periods are typically associated with higher accumulation-mode loading due to Arctic haze (Abbatt et al., 2019; Asmi et al., 2016; Heintzenberg et al., 2015), no significant difference is seen in CS between seasons during NPF periods, although individual months vary by over a factor of 3 (Fig. 2). CS between NPF and non-NPF events across the whole year is also similar (mean CS is 8.6 × 10⁻⁴ and 8.9 × 10⁻⁴ s−1 during NPF and non-NPF periods, respectively). It is worth noting that wintertime NPF, although making up a small number of total NPF events, tends to occur under a 15 % lower mean CS than the seasonal average.
In contrast to particle formation rates, source vapour rates do not have a clear seasonal trend, but when averaged across seasons, source vapour rates do show lower source rates in winter (3.2 × 10⁴ compared to 1.6 × 10⁴ through other seasons). Wintertime events were observed at all sites except the two most northerly ones (ALE and VRS). The southernmost sites experience more wintertime insolation, possibly explaining the lack of NPF at these northern sites. Events most frequently started between 09:00 and 12:00 LT (local time), with the visual signature of an ongoing NPF event visible in the measured size distributions for slightly under 12 h (median; Fig. S4), despite the fact that these sites often have 24 h of sunlight.
As J10 measures the rate of particles forming at 10 nm, it is also highly sensitive to the rates of coagulation between 1.5 and 10 nm. Coagulation rates in this range are much greater than coagulation rates at larger sizes and must be out-competed by particle GRs for an NPF event to be visible in the datasets analysed here. Events where particles fail to reach 10 nm will not be measured by the particle counting systems employed here. Such events have been reported during iodine-driven NPF events at similar latitudes (Baccarini et al., 2020; Beck et al., 2021); thus, NPF frequency at these sites may well be higher than what is reported here.

Figure 3Characteristics of NPF events per site in the months of May through August inclusive, showing (a) formation rates at 10 nm, (b) growth rates, (c) condensation sinks, (d) vapour source rates, and (e) NPF event frequency. Box plots show median (centre line), mean (diamond), upper and lower quartiles (box limits), 1.5 times the interquartile range (whiskers), and any outliers as points. Colours represent each site.
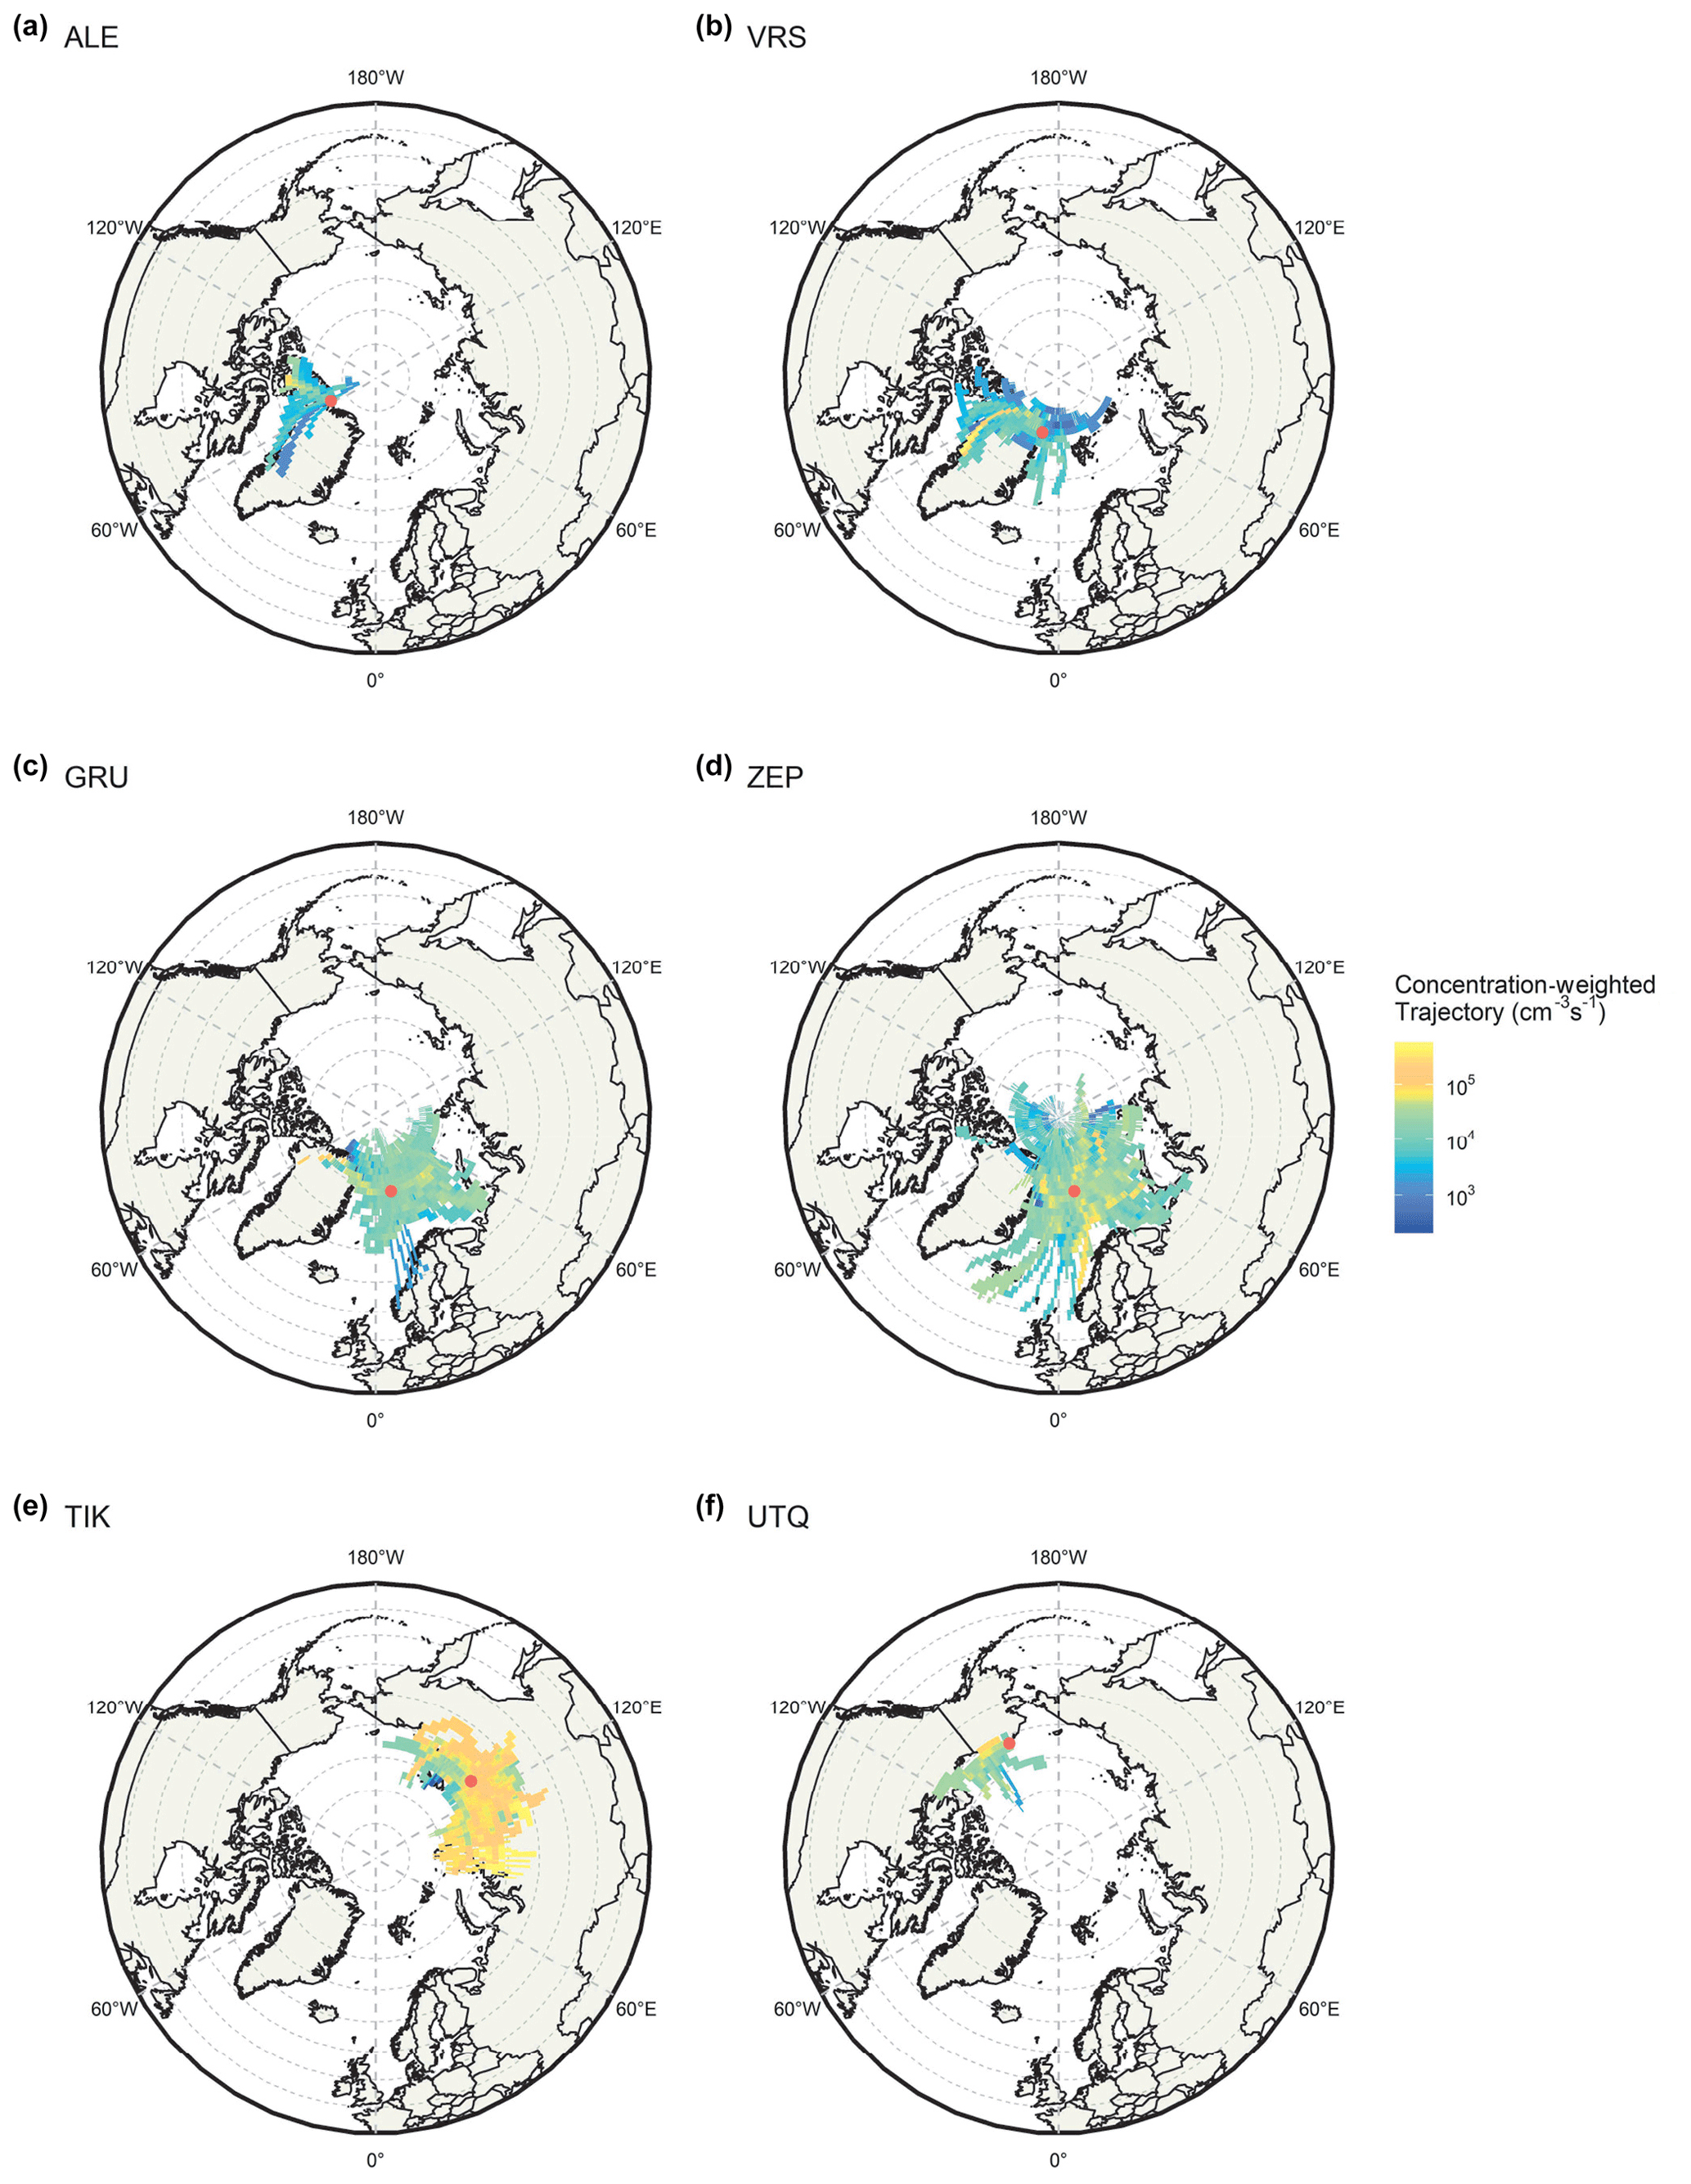
Figure 4The 72 h back-trajectories plotted on a grid, weighted by the source rate of equivalent sulfuric acid vapour driving particle growth, for (a) ALE, (b) VRS, (c) GRU, (d) ZEP, (e) TIK, and (f) UTQ.
3.2 Spatial variation in summertime NPF features
The site-by-site variation in summertime NPF event characteristics is shown in Fig. 3. The concentration weighted trajectories (CWTs) weighted by Q for each site are plotted in Fig. 4 (CWTs across the whole Arctic region are shown in Fig. S5), indicating source regions of equivalent sulfuric acid vapour leading to particle growth. Equation (5) essentially gives the interplay between the concentration of equivalent sulfuric acid driving particle growth (Cvap, calculated from the particle GR) and the loss of this vapour (CS). The land surface types (land, sea, ice, or snow over land), which 72 h back trajectory points arriving at the site during NPF events flow over, are plotted in Fig. 5, showing the surface types that air masses flow over that led to NPF events. Here, ALE and VRS are discussed together as the High Arctic, as both of these sites are high-latitude sites with similarly low J10, GR, and CS values (Fig. 3). GRU and ZEP are talked about together as Svalbard sites, as they are collocated and surrounded by the same open and ice-containing ocean, with similar J10, GR, and CS, and although dissimilar in J10, GR, and CS, the low-latitude sites of TIK and UTQ are seen to represent the continental Arctic. Figure S1 shows the average size distribution during the period of March–July 2015, where data were being collected at all sites except ALE, for which the data for March–July 2013 are shown. All sites have two distinct modes, namely an Aitken mode peaking somewhere between 20 and 50 nm and an accumulation mode peaking somewhere from 100 to 200 nm. The average across all periods for which the distributions are similar is also shown, except ZEP, which, compared to the whole period of data availability, has a substantially larger mode at ∼ 20 nm in this 2015 period. The size distribution at ALE and VRS shows overall low particle counts, especially at ALE. The two Svalbard sites, GRU and ZEP, have similar size distributions, while those at TIK show a large Aitken mode, and UTQ shows a large accumulation mode.
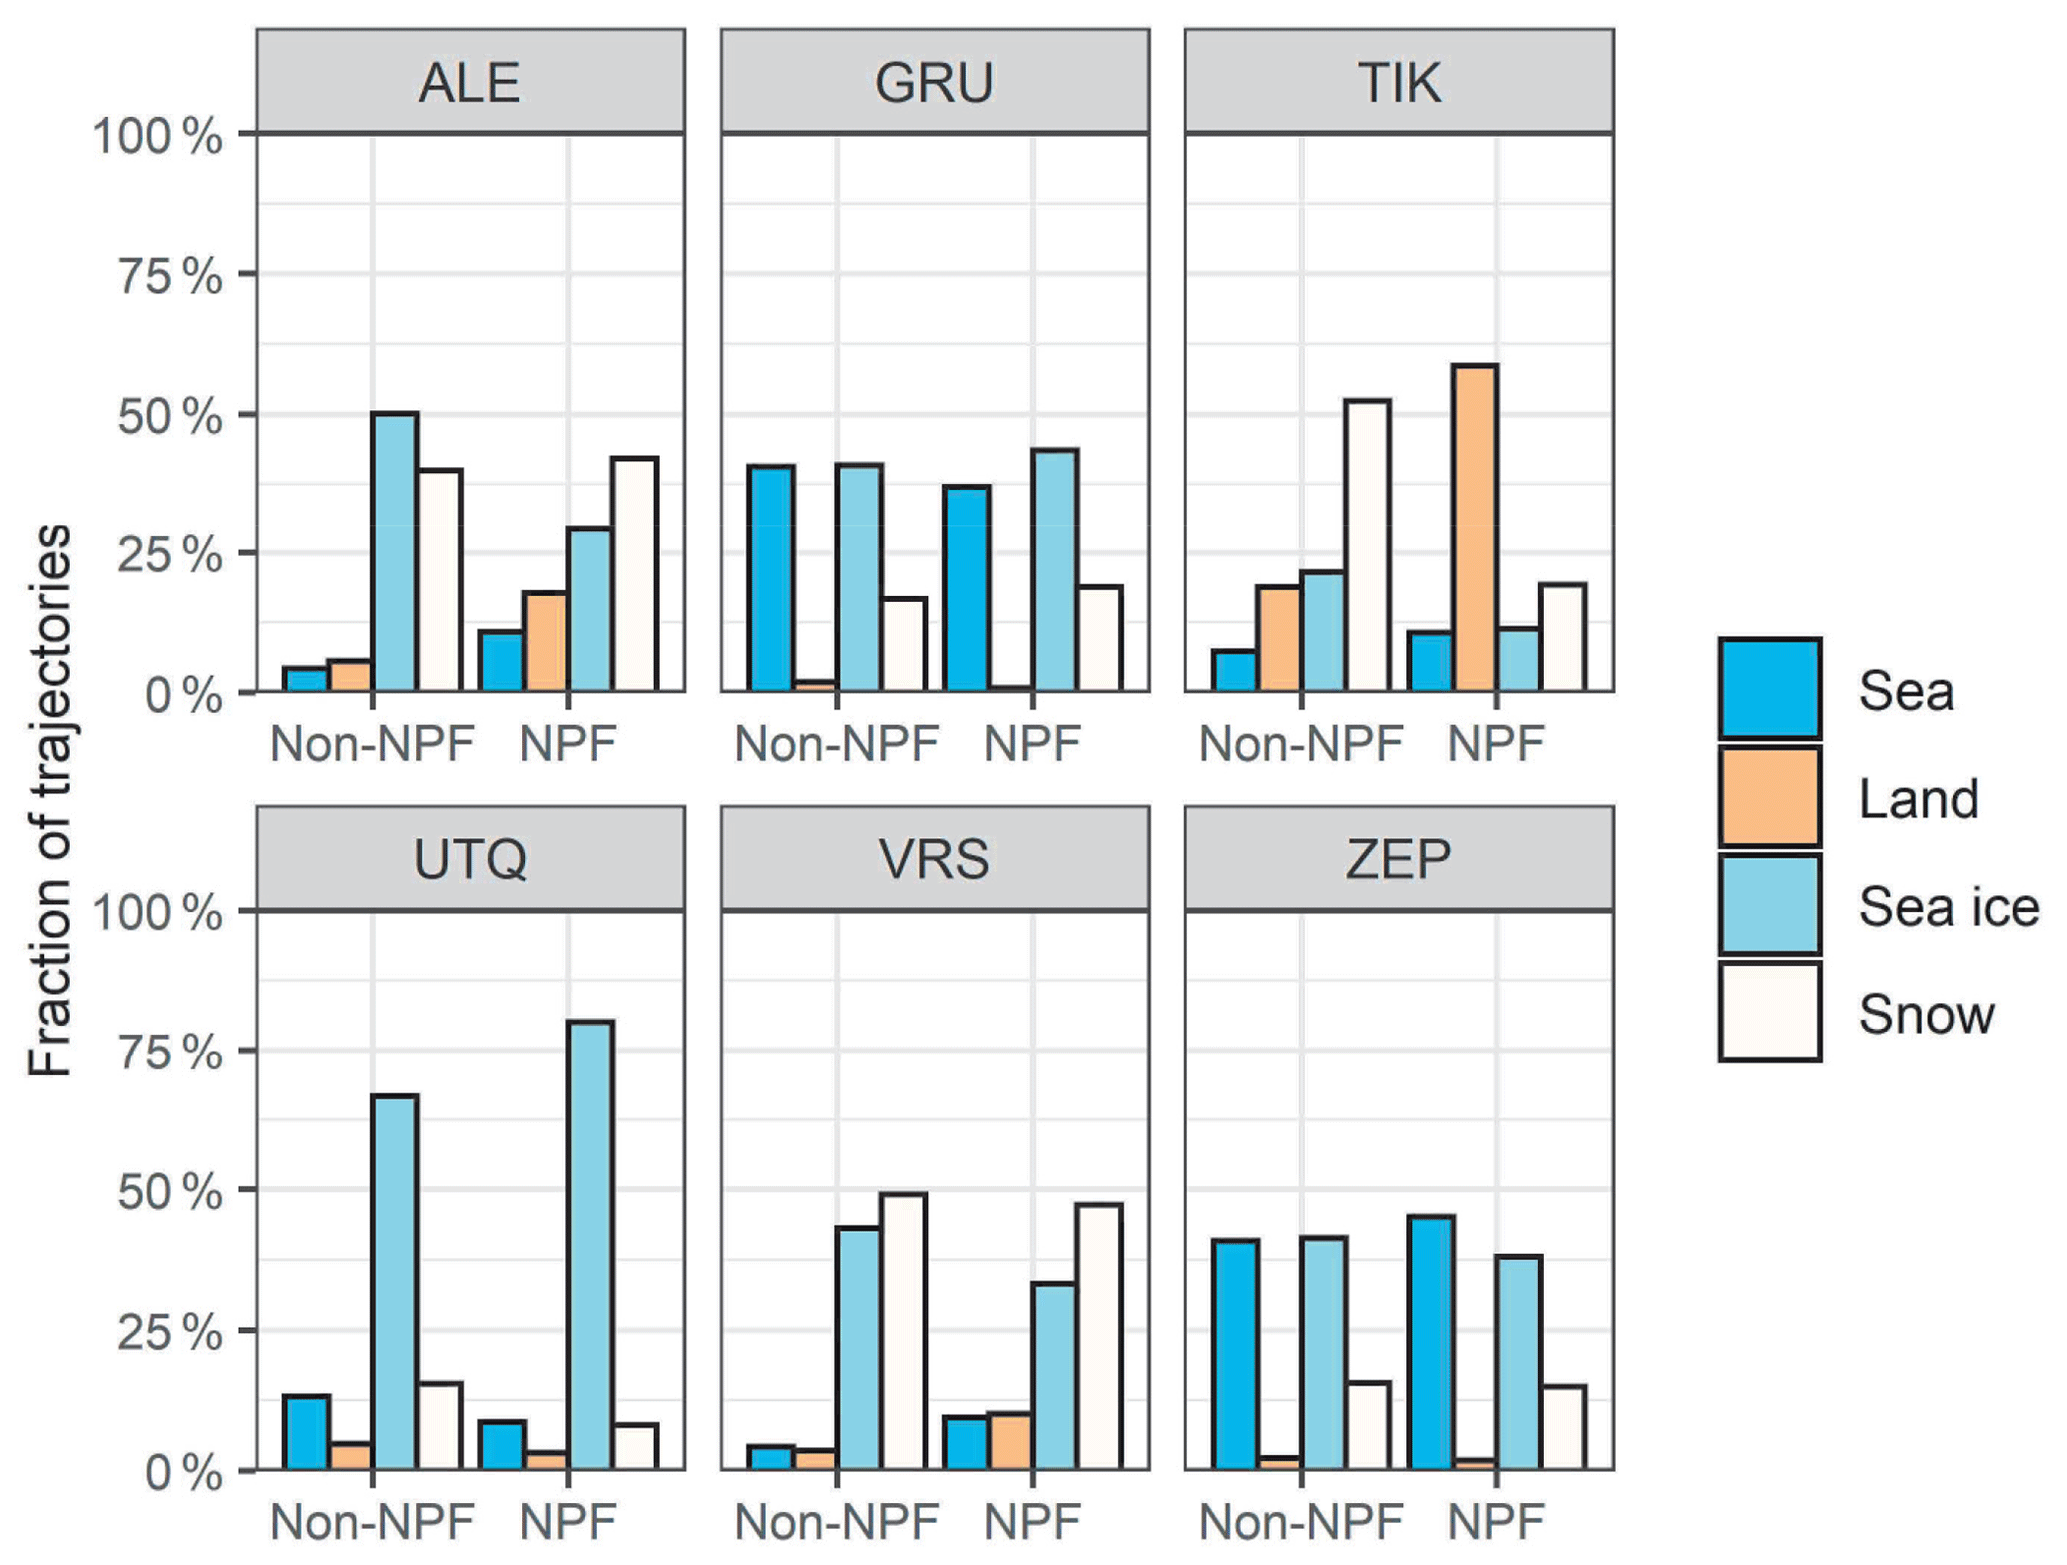
Figure 5Link between surface type and 72 h HYSPLIT back trajectory points during NPF events and outside of NPF events. Air masses were assigned a surface type based upon a 24 km grid of IMS data.
3.2.1 High Arctic sites
Figure 3 shows that NPF occurs at lower J10 at the high-latitude site of ALE compared to the four lower-latitude sites but similarly to VRS compared to these other sites (1.9 × 10⁻² and 5.0 × 10⁻² at ALE and VRS, respectively, with the average for other sites being 4.9 × 10⁻² ). These two sites show lower GRs (0.69 and 0.73 nm h−1 at ALE and VRS, respectively, with the average for other sites being 1.35 nm h−1) and lower CS than the other sites (1.8 × 10⁻⁴ and 3.0 × 10⁻⁴ s−1 at ALE and VRS, respectively, with the average for other sites being 7.5 × 10⁻⁴ s−1), resulting in substantially lower Q values (2.3 × 10³ and 4.2 × 10³ at ALE and VRS, respectively, with the average for other sites being 2.6 × 104 cm3 s−1). NPF at ALE occurs on 5.1 % of the days, and particle formation at VRS occurs on 8.6 % of the days (the mean NPF frequency across all other sites is 17.1 %). Of all Arctic sites, NPF is most infrequent at these High Arctic sites. Previous reports of Arctic iodine NPF events report similarly low GRs (Baccarini et al., 2020; Beck et al., 2021). Particle formation at GRU has been shown to be driven by the clustering of H2SO4, methane sulfonic acid (MSA), and NH3, with rapid particle growth driven by highly oxygenated organic molecules in the summertime (Beck et al., 2021).
The CWTs show that air masses associated with high Q values at ALE arise from the surrounding Canadian Arctic Archipelago and the western coast of Greenland, and those for particle growth at VRS have a strong source from the western coast of Greenland also, with some sources from mainland Greenland and the surrounding iced and non-iced oceans (Figs. 4, 5, and S5). Back-trajectory analyses show that NPF at both of these sites occur under air masses flowing over regions of snow and sea ice (71.4 % and 80.4 % of NPF 72 h back-trajectory data points flowing over sea and ice combined for ALE and VRS, respectively). Notably, air masses arriving at ALE during NPF events are associated with markedly more sea ice surface than in non-NPF events (29 % during non-NPF periods versus 50 % during NPF periods). Air mass surface types for VRS do not change much between NPF and non-NPF periods.
3.2.2 Svalbard sites
At the two sites located at Svalbard, particle GRs were similar to one another (0.92 and 1.0 nm h−1 at GRU and ZEP, respectively), and other sites had a mean GR range of 0.8–2.6 nm h−1, with an average of 1.2 nm h−1. J10 is higher at the Svalbard sites than other sites (6.9 × 10⁻² and 6.1 × 10⁻² at GRU and ZEP, respectively, with the average for other sites being 3.4 × 10⁻² ). Q here is greater than the High Arctic sites but lower than the lower-latitude continental Arctic sites (1.5 × 10⁴ and 1.6 × 10⁴ at GRU and ZEP, respectively, with the average for other sites being 2.0 × 10⁴ ). Similarly, CS is greater than the High Arctic sites and TIK and is similar to UTQ (7.1 × 10⁻⁴ and 6.3 × 10⁻⁴ s−1 at GRU and ZEP, respectively, with the average for other sites being 5.4 × 10⁻⁴ s−1). The NPF frequency is lower at the higher-altitude ZEP (18.3 %) site compared to GRU (23.4 %). The average NPF frequency at the other sites is 11.8 %. This Svalbard region is surrounded by open water due to advection of warm Atlantic water, and the CWTs for Q point to potential source regions of precursor vapours for particle growth from all the surrounding open-ocean and sea ice regions (37.0 % and 42.8 % for open-ocean and 43.5 % and 40.3 % for sea ice regions for GRU and ZEP, respectively; Figs. 4, 5, and S5), indicating that air masses driving NPF are not from one ocean region.
3.2.3 Continental sites
The sites TIK and UTQ represent the continental Arctic, which forms the southernmost sites (71.6 and 71.3∘; located in Russia and Alaska, respectively). J10 at these southern sites do not differ greatly from the mean (3.9 × 10⁻² and 2.9 × 10⁻² at TIK and UTQ, respectively, with the average for other sites being 5.0 × 10⁻² ). Particle GRs at these continental sites are the highest of all Arctic sites, especially at TIK (2.2 and 1.1 nm h−1 at TIK and UTQ, respectively, with the average for other sites being 0.84 nm h−1). These high GRs make TIK a distinct site in the Arctic, and CS during NPF events at TIK are greatest in the entire dataset. CS at UTQ is comparable to the Svalbard sites (1.0 × 10⁻³ and 6.9 × 10⁻⁴ s−1 at TIK and UTQ, respectively, with the average for other sites being 4.5 × 10⁻⁴ s−1). Q values at these sites (especially TIK) are due to the high particle GRs (5.4 × 10⁴ and 2.0 × 10⁴ at TIK and UTQ, respectively, with the average for other sites being 9.4 × 10³ ).
The CWT and land type analysis indicates that the source region most strongly associated with high values of Q at TIK is the continental region surrounding the sampling site and air masses during NPF spending 58.6 % of time over land regions, which have elevated greatly from 18.9 % during non-NPF event periods, indicating terrestrial sources of NPF precursors rather than the marine sources. These events are unique compared to the open water and coastal and sea-ice-influenced NPF events observed at the other sites. This is shown in Fig. 5, showing that events are dominated by snow-free, land-based sources. Similarly, at UTQ, the strongest vapour source is in the direction of the closest oil fields to the west. This region has been shown to be a driver of particle growth (Kolesar et al., 2017), although the back-trajectory analysis shows that most of the air masses during NPF events are sea ice dominated (80.1 %).
The Arctic is a highly geographically and biologically diverse region, and understanding the drivers of NPF involves understanding a vast network of gas and aerosol sources and sinks. The results reported in this paper highlight the seasonal variation in the Arctic NPF (Fig. 2) and the variation between different measurement sites during the summertime, with J10, GR, CS, and Q varying by orders of magnitude between sites (Fig. 3). The site-by-site variation in CS, J, and Q was tabulated recently in a review paper by Schmale and Baccarini (2021), to which our calculated values are similar where similar numbers are available (Figs. 2 and 3). For the sites where figures are not available, we provide the first reports of key NPF parameters. These results cover a multiyear period across the Arctic. We highlight that some of these sites have limited data coverage (Fig. 1), and the periods of data overlap between sites are limited, although the size distributions for these periods of overlap are similar to the average across all periods (Fig. S1). We also note the inherent uncertainty in particle size distribution measurements between sites, especially in both the < 20 nm size range, which is particularly important to these NPF studies (Wiedensohler et al., 2012).
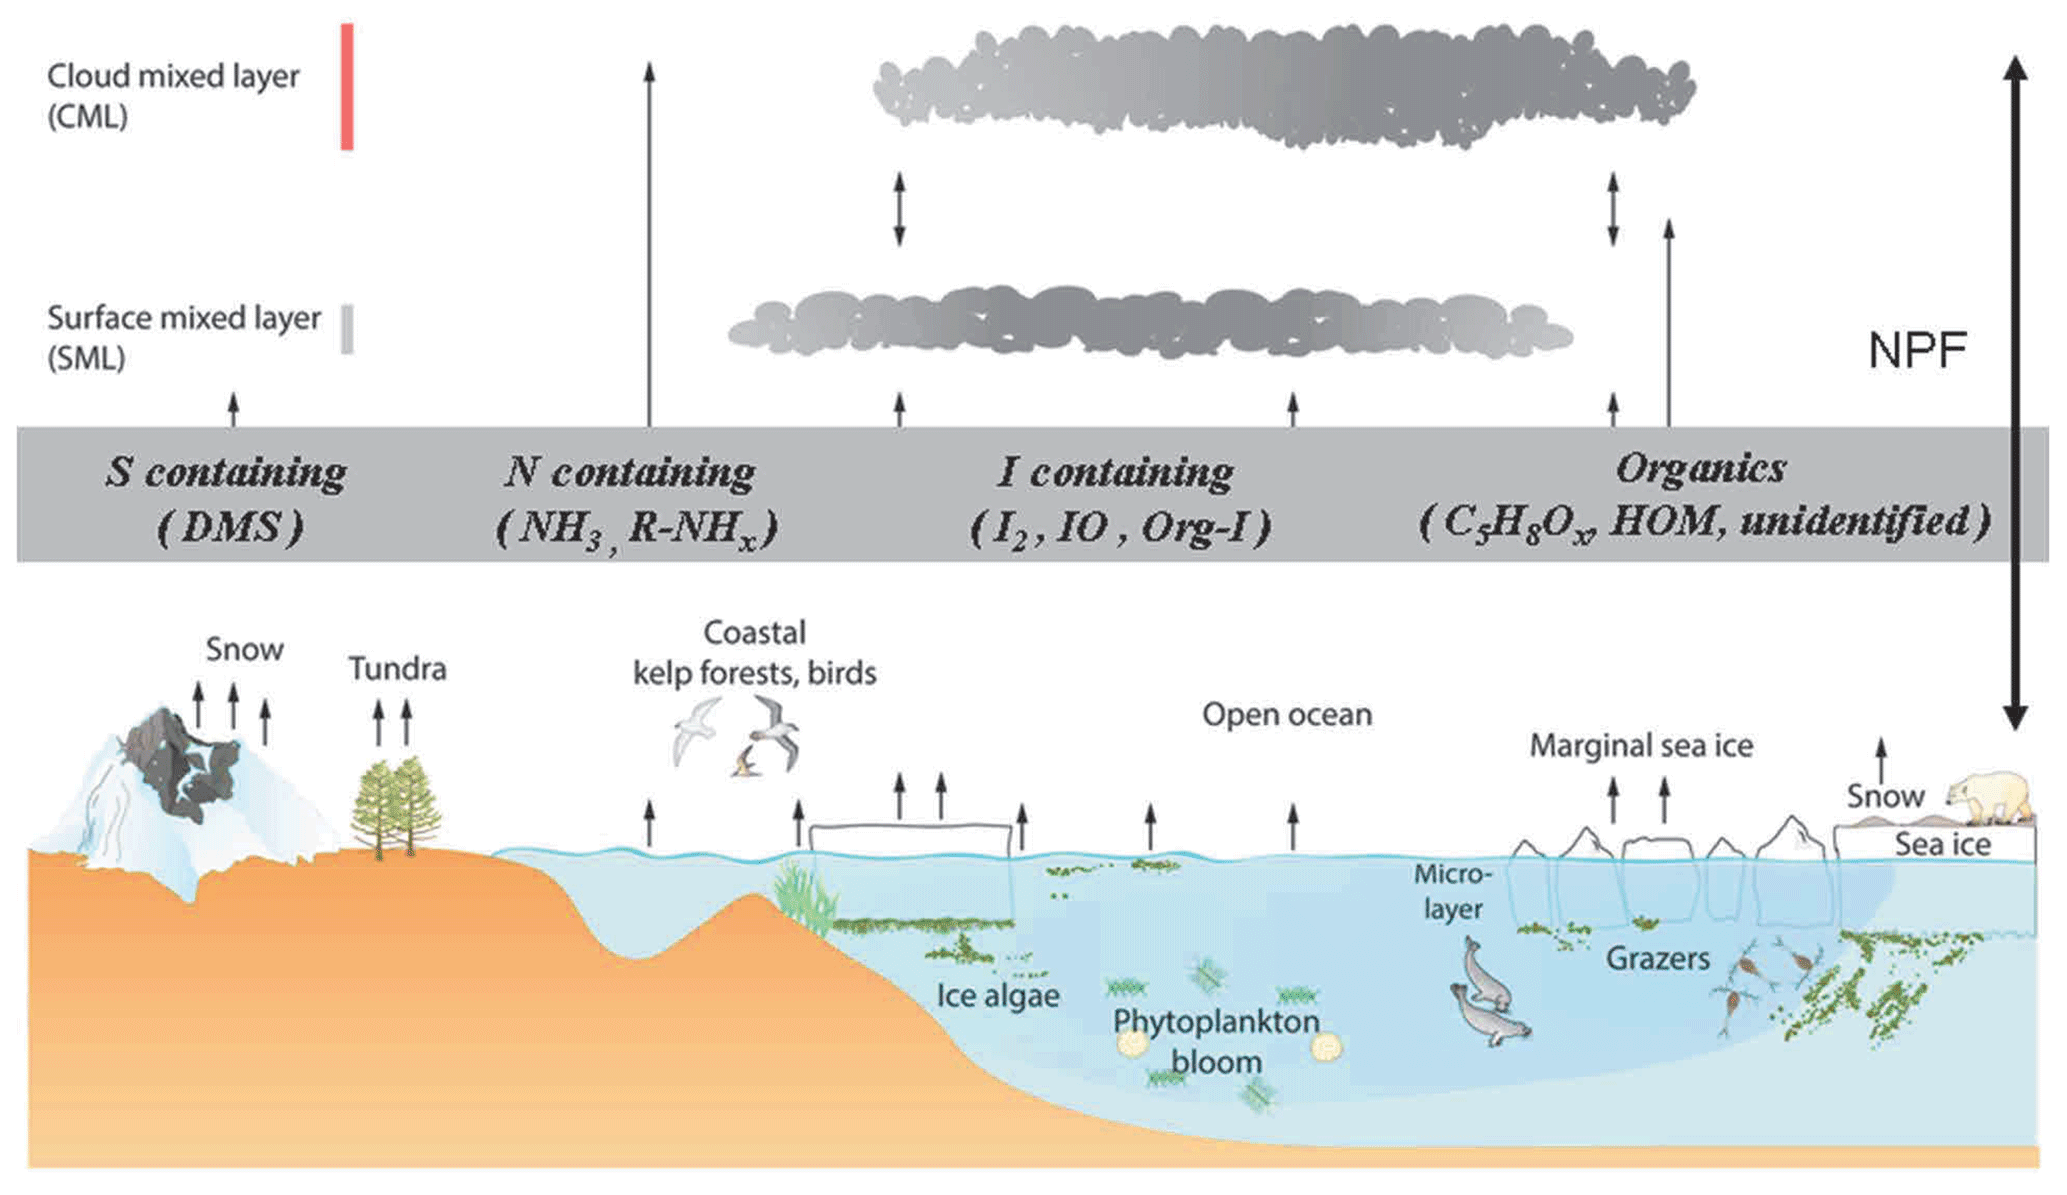
Figure 6Schematic illustrations of the sea ice, microbiota, sea-to-air emissions, and new particle formation (NPF) occurring in the typical summertime stratus-topped Arctic boundary layer. Vertical red and grey bars broadly indicate the cloud mixed layer (CML) and surface mixed layer (SML), as inspired by Brooks et al. (2017). The grey box indicates known possible gas-phase NPF precursors from the potential Arctic natural terrestrial and marine sources drawn below.
We show that the vapours which drive particle growth at each of these sites often (but not always) coincide with air masses flowing over particular directional source regions (Fig. 4). NPF in the Arctic atmospheric boundary layer is occurring within air masses flowing over vastly different Arctic ecoregions, including regions of open-ocean water, consolidated and open-pack ice, snow-covered land, and non-snow-covered land (Fig. 5), which is reflected in the variety of mechanisms to be seen in molecular-scale measurements of new particle formation and growth (Baccarini et al., 2020; Beck et al., 2021). This variability, as it relates to NPF mechanisms, has been highlighted in recent papers (Schmale and Baccarini, 2021). We highlight this complex network of NPF precursor sources in Fig. 6.
NPF at the northernmost sites (VRS and ALE) occurs when air masses arriving at the site have flown over regions of ice and snow. The slower rates of particle formation here are consistent with the recent detailed reports of particle formation and growth in this region using online mass spectrometry (Baccarini et al., 2020; Beck et al., 2021) showing NPF driven by iodine oxoacids. Iodine has been shown to accumulate in algae (Küpper et al., 2008), which may be plentiful in the microalgal aggregates within the iced sympagic Arctic regions (Assmy et al., 2013; Boetius et al., 2013). Thinning of sea ice has already caused an increase in atmospheric iodine levels (Cuevas et al., 2018). Future sea ice melt may accelerate NPF in this region due to enhanced precursor emissions. The CWT analysis here also shows a strong vapour source arising from the coast of Greenland. Source apportionment studies applied to highly time-resolved VOC data show coastal Greenland to be a dominant source of DMS (Pernov et al., 2021) and ammonia from seabird colonies (Riddick et al., 2012). Arctic melt ponds, leads, and melting ice are also sources of DMS (Levasseur 2013); thus, a further influence of DMS oxidation products is feasible. If iodine oxoacids are not the species responsible for the particle formation observed in this dataset, then these low formation rates may be related to low concentrations of alternative precursors and weak solar radiation reducing both the rates of photochemistry and ion pair production.
Events at the Svalbard sites (ZEP and GRU) occur within air masses flowing over regions of open ocean and iced ocean. NPF in this region has been shown to be driven by sulfuric acid, ammonia, and oxygenated organic molecules (Beck et al., 2021). A main aerosol precursor from the open ocean is DMS. Emissions of DMS are increasing due to reductions in the sea ice extent (Galí et al., 2019), with DMS being an important source of both methanesulfonic acid (CH3SO3H; MSA) and sulfuric acid (H2SO4; Hoffmann et al., 2016; Park et al., 2017; Kecorius et al., 2019; Park et al., 2021; Jang et al., 2021; Lee et al., 2020); furthermore, open-water regions are a source of oxygenated organic compounds (Mungall et al., 2017). Modelling studies demonstrate a contribution of marine secondary organic aerosol to the total size distribution (Croft et al., 2019).
NPF at the Russian continental TIK site is heavily influenced by air masses flowing over land. Recent biogenic volatile organic compound emission data from Arctic tundra and sub-Arctic wetland, underlain by discontinuous permafrost, have been reported (Holst et al., 2010; Kramshøj et al., 2016). Different biogenic VOC may be related to pinenes from the boreal forest (Tarvainen et al., 2005) and sabinene from Siberian larches (Ruuskanen et al., 2007), while the snowpack is a potential source of organic compounds (Grannas et al., 2007) and iodine oxide precursors (Raso et al., 2017). As particle GRs at TIK are more rapid than at other Arctic sites, it is probable that these terrestrial VOC sources play an important role. Particle mass loadings at TIK have also been shown to be especially high compared to other sites, and in the summertime, these are dominated by biogenic secondary aerosols (Moschos et al., 2022). The Alaskan continental UTQ site is most influenced by sea-ice-related air masses, with the CWT pointing towards the west as a strong source of particle growth driving vapour. This region has been shown to be a driver of particle growth (Kolesar et al., 2017), and although the data were cleaned, an influence of anthropogenic gas emissions on the NPF at this site at unavoidable.
The back-trajectory analyses performed here emphasise the influence of sea ice on NPF in the Arctic. Increased melting of sea ice in these regions, alongside thawing permafrost and precipitation changes related to warming will undoubtedly have profound effects on the NPF processes occurring. Prior long-term analyses in the Arctic have shown regions of open water and melting sea ice to be related to NPF occurrence (Dall'Osto et al., 2017b, 2018b), In the Antarctic, melting sea ice is a source of amines in secondary aerosols (Dall'Osto et al., 2017a; Brean et al., 2021), and should sympagic conditions in the Arctic be similar, gas-phase amines from sea ice melt will also accelerate particle formation rates by orders of magnitude. Furthermore, increasing temperatures cause clear changes in continental emissions, such as the increases in biogenic emissions from tundra vegetation and changes in vegetation cover (Faubert et al., 2010; Peñuelas and Staudt, 2010; Potosnak et al., 2013; Lindwall et al., 2016). Increases to total aerosol surface area from increased sea spray due to sea ice melt may act as an efficient sink for low-volatility vapours, suppressing future NPF (Browse et al., 2014). Taking all this into account, future Arctic melting can cause increases in emissions of multiple important new particle precursors. Thus, an acceleration of future Arctic NPF is possible. The complex interplay between the sources and sinks of new aerosols must be understood in detail if the Arctic climate is to be predicted reliably in models.
Our results highlight the complex, multi-mechanistic system driving Arctic NPF. We show that particle formation and GRs vary tremendously across the Arctic region, with vastly differing source regions producing vapour source rates spanning orders of magnitude in difference between the sites. NPF frequency and intensity peak in the Arctic summer, with wintertime NPF being an infrequent phenomenon. Air masses from different Arctic ecoregions promote NPF at each of the sites (except those which are co-located), with gas-phase precursors from different source regions likely varying substantially, in addition to with sources of organic and inorganic iodine and sulfur and various organic compounds contributing to new particle formation, as shown by Beck et al. (2021), between Svalbard and the High Arctic. We present the first synchronous analysis of NPF at all of the longest-term Arctic aerosol measurement stations. While back-trajectory analyses can point towards these source regions over the long term, we still do not know the driving force behind NPF at these sites, as it is likely a combination of precursor emissions, photochemistry, ion pair production, temperature, and the pre-existing surface area of aerosol. Measurements of particle size distributions down to critical cluster size and detailed chemical measurements are required to properly understand NPF at these sites.
The code and data used to produce all non-illustrative figures are available from the corresponding authors under reasonable request.
The supplement related to this article is available online at: https://doi.org/10.5194/acp-23-2183-2023-supplement.
JB performed the data analyses and prepared the first version of the paper. Scripts to perform data analyses were provided by DCSB and PT. The study was conceived by RMH and MDO. Data were collected, cleaned, and provided by PT, JS, RK, EF, AM, HS, EA, and AL. All authors were involved in the preparation of the final paper.
The contact author has declared that none of the authors has any competing interests.
Publisher's note: Copernicus Publications remains neutral with regard to jurisdictional claims in published maps and institutional affiliations.
The aerosol and meteorological data for Utqiaġvik and Tiksi were downloaded from the International Arctic Systems for Observing the Atmosphere (https://www.iasoa.org, last access: 21 August 2021) consortium website. For the Alert observations, we are grateful to the Canadian Department of National Defence, Andrew Platt, Sangeeta Sharma, Desiree Toom, Dan Veber, and the Alert operators. Funding from the European Union's Horizon 2020 programmes of ACTRIS (grant no. 654109) and INTAROS (project no. 727890) are acknowledged (Eija Asmi). Observations at Zeppelin Mountain observatory were supported by Swedish Environmental Protection agency (Naturvårdsverket) and by the ACAS project funded by Knut and Alice Wallenberg Foundation. The study has been supported by the UK Natural Environment Research Council (SEANA; grant no. NE/S00579X/1), the Spanish Ministry of Economy through projects BIOeNUC (grant no. CGL2013–49020-R) and PI-ICE (grant no. CTM2017–89117-R) and the Ramón y Cajal fellowship (grant no. RYC-2012-11922). The authors also acknowledge financial support (to David C. S. Beddows) from the National Centre for Atmospheric Science (NCAS; grant no. R8/H12/83/011), funded by UK Natural Environment Research Council. Finally, the authors from Aarhus University have been financially supported by the Danish Environmental Protection Agency and Danish Ministry for Climate Energy and Utilities via the MIKA/DANCEA funds for Environmental Support to the Arctic Region. As stressed in Freud et al. (2017), we would also like to express our appreciation and gratitude for the work and effort of all the scientists and engineers involved in setting up and maintaining the Arctic aerosol sites. The figures were created using the R software (R Core Team, 2022).
This research has been supported by the Ministerio de Economía y Competitividad (grant nos. CTM2017-89117-R, CGL2013-49020-R, and RYC-2012-11922), the Natural Environment Research Council (grant no. NE/S00579X/1), and the National Centre for Atmospheric Science funded by the Natural Environment Research Council.
We acknowledge support of the publication fee by the CSIC Open Access Publication Support Initiative through its Unit of Information Resources for Research (URICI).
This paper was edited by Veli-Matti Kerminen and reviewed by two anonymous referees.
Abbatt, J. P. D., Leaitch, W. R., Aliabadi, A. A., Bertram, A. K., Blanchet, J.-P., Boivin-Rioux, A., Bozem, H., Burkart, J., Chang, R. Y. W., Charette, J., Chaubey, J. P., Christensen, R. J., Cirisan, A., Collins, D. B., Croft, B., Dionne, J., Evans, G. J., Fletcher, C. G., Galí, M., Ghahreman, R., Girard, E., Gong, W., Gosselin, M., Gourdal, M., Hanna, S. J., Hayashida, H., Herber, A. B., Hesaraki, S., Hoor, P., Huang, L., Hussherr, R., Irish, V. E., Keita, S. A., Kodros, J. K., Köllner, F., Kolonjari, F., Kunkel, D., Ladino, L. A., Law, K., Levasseur, M., Libois, Q., Liggio, J., Lizotte, M., Macdonald, K. M., Mahmood, R., Martin, R. V., Mason, R. H., Miller, L. A., Moravek, A., Mortenson, E., Mungall, E. L., Murphy, J. G., Namazi, M., Norman, A.-L., O'Neill, N. T., Pierce, J. R., Russell, L. M., Schneider, J., Schulz, H., Sharma, S., Si, M., Staebler, R. M., Steiner, N. S., Thomas, J. L., von Salzen, K., Wentzell, J. J. B., Willis, M. D., Wentworth, G. R., Xu, J.-W., and Yakobi-Hancock, J. D.: Overview paper: New insights into aerosol and climate in the Arctic, Atmos. Chem. Phys., 19, 2527–2560, https://doi.org/10.5194/acp-19-2527-2019, 2019.
Acosta Navarro, J. C., Varma, V., Riipinen, I., Seland, Ø., Kirkevåg, A., Struthers, H., Iversen, T., Hansson, H.-C., and Ekman, A. M. L.: Amplification of Arctic warming by past air pollution reductions in Europe, Nat. Geosci., 9, 277–281, 2016.
Allan, J. D., Williams, P. I., Najera, J., Whitehead, J. D., Flynn, M. J., Taylor, J. W., Liu, D., Darbyshire, E., Carpenter, L. J., Chance, R., Andrews, S. J., Hackenberg, S. C., and McFiggans, G.: Iodine observed in new particle formation events in the Arctic atmosphere during ACCACIA, Atmos. Chem. Phys., 15, 5599–5609, https://doi.org/10.5194/acp-15-5599-2015, 2015.
Asmi, E., Kondratyev, V., Brus, D., Laurila, T., Lihavainen, H., Backman, J., Vakkari, V., Aurela, M., Hatakka, J., Viisanen, Y., Uttal, T., Ivakhov, V., and Makshtas, A.: Aerosol size distribution seasonal characteristics measured in Tiksi, Russian Arctic, Atmos. Chem. Phys., 16, 1271–1287, https://doi.org/10.5194/acp-16-1271-2016, 2016.
Assmy P, Ehn JK, Fernández-Méndez M, Hop H, Katlein C, Sundfjord, A., Bluhm, K., Daase, M., Engel, A., Fransson, A., Granskog, M. A., Hudson, S. R., Kristiansen, S., Nicolaus, M., Peeken, I., Renner, A. H. H., Spreen, G., Tatarek, A., Wiktor, J. Floating Ice-Algal Aggregates below Melting Arctic Sea Ice, PLOS ONE, 8, e76599, https://doi.org/10.1371/journal.pone.0076599, 2013.
Baccarini, A., Karlsson, L., Dommen, J., Duplessis, P., Vüllers, J., Brooks, I. M., Saiz-Lopez, A., Salter, M., Tjernström, M., Baltensperger, U., Zieger, P., and Schmale, J.: Frequent new particle formation over the high Arctic pack ice by enhanced iodine emissions, Nat. Commun., 11, 4924, https://doi.org/10.1038/s41467-020-18551-0, 2020.
Barry, T., Christensen, T., Payne, J., and Gill, M.: CBMP Strategic Plan 2013-2017: Phase 2 implementation of the Circumpolar Biodiversity Monitoring Program, CAFF Monitoring Series No. 8, Conservation of Arctic Flora and Fauna International Secretariat, Akureyri, Iceland. 2013.
Beck, L. J., Sarnela, N., Junninen, H., Hoppe, C. J. M., Garmash, O., Bianchi, F., Riva, M., Rose, C., Peräkylä, O., Wimmer, D., Kausiala, O., Jokinen, T., Ahonen, L., Mikkilä, J., Hakala, J., He, X., Kontkanen, J., Wolf, K. K. E., Cappelletti, D., Mazzola, M., Traversi, R., Petroselli, C., Viola, A. P., Vitale, V., Lange, R., Massling, A., Nøjgaard, J. K., Krejci, R., Karlsson, L., Zieger, P., Jang, S., Lee, K., Vakkari, V., Lampilahti, J., Thakur, R. C., Leino, K., Kangasluoma, J., Duplissy, E., Siivola, E., Marbouti, M., Tham, Y. J., Saiz-Lopez, A., Petäjä, T., Ehn, M., Worsnop, D. R., Skov, H., Kulmala, M., Kerminen, V., and Sipilä, M.: Differing mechanisms of new particle formation at two Arctic sites, Geophys. Res. Lett., 48, 1–11, https://doi.org/10.1029/2020gl091334, 2021.
Birch, C. E., Brooks, I. M., Tjernström, M., Shupe, M. D., Mauritsen, T., Sedlar, J., Lock, A. P., Earnshaw, P., Persson, P. O. G., Milton, S. F., and Leck, C.: Modelling atmospheric structure, cloud and their response to CCN in the central Arctic: ASCOS case studies, Atmos. Chem. Phys., 12, 3419–3435, https://doi.org/10.5194/acp-12-3419-2012, 2012.
Boetius, A., Albrecht, S., Bakker, K., Bienhold, C., Felden, J., Fernández-Méndez, M., Hendricks, S., Katlein, C., Lalande, C., Krumpen, T., Nicolaus, M., Peeken, I., Rabe, B., Rogacheva, A., Rybakova, E., Somavilla, R., Wenzhöfer, F., and Felden, J.: Export of algal biomass from the melting arctic sea ice, Science, 339, 1430–1432, https://doi.org/10.1126/science.1231346, 2013.
Brean, J., Dall'Osto, M., Simó, R., Shi, Z., Beddows, D. C. S., and Harrison, R. M.: Open ocean and coastal new particle formation from sulfuric acid and amines around the Antarctic Peninsula, Nat. Geosci., 14, 383–388, https://doi.org/10.1038/s41561-021-00751-y, 2021.
Brooks, I. M., Tjernström, M., Persson, P. O. G., Shupe, M. D., Atkinson, R. A., and Brooks, B. J.: The turbulent structure of the Arctic summer boundary layer during The Arctic Summer Cloud-Ocean Study, J. Geophys. Res.-Atmos., 122, 9685–9704, https://doi.org/10.1002/2017JD027234, 2017.
Browse, J., Carslaw, K. S., Arnold, S. R., Pringle, K., and Boucher, O.: The scavenging processes controlling the seasonal cycle in Arctic sulphate and black carbon aerosol, Atmos. Chem. Phys., 12, 6775–6798, https://doi.org/10.5194/acp-12-6775-2012, 2012.
Browse, J., Carslaw, K. S., Mann, G. W., Birch, C. E., Arnold, S. R., and Leck, C.: The complex response of Arctic aerosol to sea-ice retreat, Atmos. Chem. Phys., 14, 7543–7557, https://doi.org/10.5194/acp-14-7543-2014, 2014.
Cai, R. and Jiang, J.: A new balance formula to estimate new particle formation rate: reevaluating the effect of coagulation scavenging, Atmos. Chem. Phys., 17, 12659–12675, https://doi.org/10.5194/acp-17-12659-2017, 2017.
CAFF: State of the Arctic Marine Biodiversity Report, Conservation of Arctic Flora and Fauna International Secretariat, Akureyri, Iceland, ISBN 978-9935-431-63-9, 2017.
Covert, D. S., Wiedensohler, A., Aalto, P., Heintzenberg, J., Mcmurry, P. H., and Leck, C.: Aerosol number size distributions from 3 to 500 nm diameter in the arctic marine boundary layer during summer and autumn, Tellus B, 48, 197–212, https://doi.org/10.3402/tellusb.v48i2.15886, 1996.
Croft, B., Martin, R. V., Leaitch, W. R., Tunved, P., Breider, T. J., D'Andrea, S. D., and Pierce, J. R.: Processes controlling the annual cycle of Arctic aerosol number and size distributions, Atmos. Chem. Phys., 16, 3665–3682, https://doi.org/10.5194/acp-16-3665-2016, 2016.
Croft, B., Martin, R. V., Leaitch, W. R., Burkart, J., Chang, R. Y.-W., Collins, D. B., Hayes, P. L., Hodshire, A. L., Huang, L., Kodros, J. K., Moravek, A., Mungall, E. L., Murphy, J. G., Sharma, S., Tremblay, S., Wentworth, G. R., Willis, M. D., Abbatt, J. P. D., and Pierce, J. R.: Arctic marine secondary organic aerosol contributes significantly to summertime particle size distributions in the Canadian Arctic Archipelago, Atmos. Chem. Phys., 19, 2787–2812, https://doi.org/10.5194/acp-19-2787-2019, 2019.
Cuevas, C. A., Maffezzoli, N., Corella, J. P., Spolaor, A., Vallelonga, P., Kjær, H. A., Simonsen, M., Winstrup, M., Vinther, B., Horvat, C., Fernandez, R. P., Kinnison, D., Lamarque, J.-F., Barbante, C., and Saiz-Lopez, A.: Rapid increase in atmospheric iodine levels in the North Atlantic since the mid-20th century, Nat. Commun., 9, 1452, https://doi.org/10.1038/s41467-018-03756-1, 2018.
Dal Maso, M., Kulmala, M., Riipinen, I., Wagner, R., Hussein, T., Aalto, P. P., and Lehtinen, K. E. J.: Formation and growth of fresh atmospheric aerosols: Eight years of aerosol size distribution data from SMEAR II, Hyytiälä, Finland, Boreal Environ. Res., 10, 323–336, 2005.
Dall'Osto, M., Ovadnevaite, J., Paglione, M., Beddows, D. C. S., Ceburnis, D., Cree, C., Cortés, P., Zamanillo, M., Nunes, S. O., Pérez, G. L., Ortega-Retuerta, E., Emelianov, M., Vaqué, D., Marrasé, C., Estrada, M., Sala, M. M., Vidal, M., Fitzsimons, M. F., Beale, R., Airs, R., Rinaldi, M., Decesari, S., Facchini, M. C., Harrison, R. M., O'Dowd, C., and Simó, R.: Antarctic sea ice region as a source of biogenic organic nitrogen in aerosols, Sci. Rep.-UK, 7, 1–10, https://doi.org/10.1038/s41598-017-06188-x, 2017a.
Dall'Osto, M., Beddows, D. C. S., Tunved, P., Krejci, R., Ström, J., Hansson, H. C., Yoon, Y. J., Park, K. T., Becagli, S., Udisti, R., Onasch, T., O'dowd, C. D., Simó, R., and Harrison, R. M.: Arctic sea ice melt leads to atmospheric new particle formation, Sci. Rep.-UK, 7, 1–10, https://doi.org/10.1038/s41598-017-03328-1, 2017b.
Dall'Osto, M., Simo, R., Harrison, R., Beddows, D., Saiz-Lopez, A., Lange, R., Skov, H., Nøjgaard, J. K., Nielsen, I. E., and Massling, A.: Abiotic and biotic sources influencing spring new particle formation in North East Greenland, Atmos. Environ., 190, 126–134, https://doi.org/10.1016/j.atmosenv.2018.07.019, 2018a.
Dall'Osto, M., Geels, C., Beddows, D. C. S., Boertmann, D., Lange, R., Nøjgaard, J. K., Harrison, R. M., Simo, R., Skov, H., and Massling, A.: Regions of open water and melting sea ice drive new particle formation in North East Greenland OPEN, Sci. Rep.-UK, 8, 6109, https://doi.org/10.1038/s41598-018-24426-8, 2018b.
Dall'Osto, M., Beddows, D. C. S., Tunved, P., Harrison, R. M., Lupi, A., Vitale, V., Becagli, S., Traversi, R., Park, K.-T., Yoon, Y. J., Massling, A., Skov, H., Lange, R., Strom, J., and Krejci, R.: Simultaneous measurements of aerosol size distributions at three sites in the European high Arctic, Atmos. Chem. Phys., 19, 7377–7395, https://doi.org/10.5194/acp-19-7377-2019, 2019.
Faubert, P., Tiiva, P., Rinnan, Å., Michelsen, A., Holopainen, J. K., and Rinnan, R.: Doubled volatile organic compound emissions from subarctic tundra under simulated climate warming, New Phytol.,, 187, 199–208, https://doi.org/10.1111/j.1469-8137.2010.03270.x, 2010.
Freud, E., Krejci, R., Tunved, P., Leaitch, R., Nguyen, Q. T., Massling, A., Skov, H., and Barrie, L.: Pan-Arctic aerosol number size distributions: seasonality and transport patterns, Atmos. Chem. Phys., 17, 8101–8128, https://doi.org/10.5194/acp-17-8101-2017, 2017.
Fuentes, J. D., Lerdau, M., Atkinson, R., Baldocchi, D., Bottenheim, J. W., Ciccioli, P., Lamb, B., Geron, C., Gu, L., Guenther, A., Sharkey, T. D., and Stockwell, W.: Biogenic Hydrocarbons in the Atmospheric Boundary Layer: A Review, B. Am. Meteorol. Soc., 81, 1537–1575, https://doi.org/10.1175/1520-0477(2000)081<1537:BHITAB>2.3.CO;2, 2000.
Galí, M., Devred, E., Babin, M., and Levasseur, M.: Decadal increase in Arctic dimethylsulfide emission, P. Natl. Acad. Sci. USA, 116, 19311–19317, https://doi.org/10.1073/pnas.1904378116, 2019.
Garrett, T. J. and C. Zhao, Increased Arctic cloud longwave emissivity associated with pollution from mid-latitudes, Nature, 440, 787–789, https://doi.org/10.1038/nature04636, 2006.
Garrett, T. J., Radke, L. F., and Hobbs, P. V.: Aerosol effects on the cloud emissivity and surface longwave heating in the Arctic, J. Atmos. Sci., 59, 769–778, https://doi.org/10.1175/1520-0469(2002)059<0769:AEOCEA>2.0.CO;2, 2002.
Gordon, H., Kirkby, J., Baltensperger, U., Bianchi, F., Breitenlechner, M., Curtius, J., Dias, A., Dommen, J., Donahue, N. M., Dunne, E. M., Duplissy, J., Ehrhart, S., Flagan, R. C., Frege, C., Fuchs, C., Hansel, A., Hoyle, C. R., Kulmala, M., Kürten, A., Lehtipalo, K., Makhmutov, V., Molteni, U., Rissanen, M. P., Stozkhov, Y., Tröstl, J., Tsagkogeorgas, G., Wagner, R., Williamson, C., Wimmer, D., Winkler, P. M., Yan, C., and Carslaw, K. S.: Causes and importance of new particle formation in the present-day and preindustrial atmospheres, J. Geophys. Res. Atmos., 122, 8739–8760, https://doi.org/10.1002/2017JD026844, 2017.
Grannas, A. M., Jones, A. E., Dibb, J., Ammann, M., Anastasio, C., Beine, H. J., Bergin, M., Bottenheim, J., Boxe, C. S., Carver, G., Chen, G., Crawford, J. H., Dominé, F., Frey, M. M., Guzmán, M. I., Heard, D. E., Helmig, D., Hoffmann, M. R., Honrath, R. E., Huey, L. G., Hutterli, M., Jacobi, H. W., Klán, P., Lefer, B., McConnell, J., Plane, J., Sander, R., Savarino, J., Shepson, P. B., Simpson, W. R., Sodeau, J. R., von Glasow, R., Weller, R., Wolff, E. W., and Zhu, T.: An overview of snow photochemistry: evidence, mechanisms and impacts, Atmos. Chem. Phys., 7, 4329–4373, https://doi.org/10.5194/acp-7-4329-2007, 2007.
Gryning, S. E., Batchvarova, E., Floors, R., Münkel, C., Skov, H., and Sørensen, L. L.: Observed and modelled cloud cover up to 6 km height at Station Nord in High Arctic, Int. J. Climatol., 41, 1584–1598, https://doi.org/10.1002/joc.6894, 2021.
Heintzenberg, J., Leck, C., and Tunved, P.: Potential source regions and processes of aerosol in the summer Arctic, Atmos. Chem. Phys., 15, 6487–6502, https://doi.org/10.5194/acp-15-6487-2015, 2015.
Hoffmann, E. H., Tilgner, A., Schrödner, R., Bräuer, P., Wolke, R., and Herrmann, H.: An advanced modeling study on the impacts and atmospheric implications of multiphase dimethyl sulfide chemistry, P. Natl. Acad. Sci. USA, 113, 11776–11781, https://doi.org/10.1073/pnas.1606320113, 2016.
Holst, T., Arneth, A., Hayward, S., Ekberg, A., Mastepanov, M., Jackowicz-Korczynski, M., Friborg, T., Crill, P. M., and Bäckstrand, K.: BVOC ecosystem flux measurements at a high latitude wetland site, Atmos. Chem. Phys., 10, 1617–1634, https://doi.org/10.5194/acp-10-1617-2010, 2010.
Hsu, Y., Holsen, T. M., and Hopke, P. K.: Comparison of hybrid receptor models to locate PCB sources in Chicago, Atmos. Environ., 37, 545–562, 2003.
IPCC: Climate Change 2013: The Physical Science Basis. Contribution of Working Group I to the Fifth Assessment Report of the Intergovernmental Panel on Climate Change, edited by: Stocker, T. F., Qin, D., Plattner, G.-K., Tignor, M., Allen, S. K., Boschung, J., Nauels, A., Xia, Y., Bex, V., and Midgley, P. M., Cambridge University Press, Cambridge, 2014.
Jang, S., Park, K.-T., Lee, K., Yoon, Y. J., Kim, K., Chung, H. Y., Jang, E., Becagli, S., Lee, B. Y., Traversi, R., Eleftheriadis, K., Krejci, R., and Hermansen, O.: Large seasonal and interannual variations of biogenic sulfur compounds in the Arctic atmosphere (Svalbard; 78.9∘ N, 11.9∘ E), Atmos. Chem. Phys., 21, 9761–9777, https://doi.org/10.5194/acp-21-9761-2021, 2021.
Kecorius, S., Vogl, T., Paasonen, P., Lampilahti, J., Rothenberg, D., Wex, H., Zeppenfeld, S., van Pinxteren, M., Hartmann, M., Henning, S., Gong, X., Welti, A., Kulmala, M., Stratmann, F., Herrmann, H., and Wiedensohler, A.: New particle formation and its effect on cloud condensation nuclei abundance in the summer Arctic: a case study in the Fram Strait and Barents Sea, Atmos. Chem. Phys., 19, 14339–14364, https://doi.org/10.5194/acp-19-14339-2019, 2019.
Kloster, S., Feichter, J., Maier-Reimer, E., Six, K. D., Stier, P., and Wetzel, P.: DMS cycle in the marine ocean-atmosphere system – a global model study, Biogeosciences, 3, 29–51, https://doi.org/10.5194/bg-3-29-2006, 2006.
Kolesar, K. R., Cellini, J., Peterson, P. K., Jefferson, A., Tuch, T., Birmili, W., Wiedensohler, A., and Pratt, K. A.: Effect of Prudhoe Bay emissions on atmospheric aerosol growth events observed in Utqiaġvik (Barrow), Alaska, Atmos. Environ., 152, 146–155, https://doi.org/10.1016/j.atmosenv.2016.12.019, 2017.
Kramshøj, M., Vedel-Petersen, I., Schollert, M., Rinnan, Å., Nymand, J., Ro-Poulsen, H., and Rinnan, R.: Large increases in Arctic biogenic volatile emissions are a direct effect of warming, Nat. Geosci., 9, 349–353, https://doi.org/10.1038/NGEO2692, 2016.
Kulmala, M., Petäjä, T., Nieminen, T., Sipilä, M., Manninen, H. E., Lehtipalo, K., Dal Maso, M., Aalto, P. P., Junninen, H., Paasonen, P., Riipinen, I., Lehtinen, K. E. J., Laaksonen, A., and Kerminen, V.-M.: Measurement of the nucleation of atmospheric aerosol particles, Nat. Protoc., 7, 1651–1667, https://doi.org/10.1038/nprot.2012.091, 2012.
Küpper, F. C., Woitsch, S., Weiller, M., Abela, R., Grolimund, D., Potin, P., Butler, A., Luther, G. W., Kroneck, P. M. H., Meyer-Klaucke, W., and Feiters, M. C.: Iodide accumulation provides kelp with an inorganic antioxidant impacting atmospheric chemistry, P. Natl. Acad. Sci. USA, 105, 6954–6958, 2008.
Leaitch, W. R., Sharma, S., Huang, L., Toom-Sauntry, D., Chivulescu, A., Macdonald, A. M., von Salzen, K., Pierce, J. R., Bertram, A. K., Schroder, J. C., Shantz N. C., Chang, R. Y.-W., and Norman, A. L.: Dimethyl sulfide control of the clean summertime Arctic aerosol and cloud, Elementa: Science of the Anthropocene, 1, 000017, https://doi.org/10.12952/journal.elementa.000017, 2013.
Lee, H., Lee, K., Lunder, C. R., Krejci, R., Aas, W., Park, J., Park, K.-T., Lee, B. Y., Yoon, Y. J., and Park, K.: Atmospheric new particle formation characteristics in the Arctic as measured at Mount Zeppelin, Svalbard, from 2016 to 2018, Atmos. Chem. Phys., 20, 13425–13441, https://doi.org/10.5194/acp-20-13425-2020, 2020.
Lee, S.-H., Gordon, H., Yu, H., Lehtipalo, K., Haley, R., Li, Y., and Zhang, R. New particle formation in the atmosphere: From molecular clusters to global climate, J. Geophys. Res.-Atmos., 124, 7098–7146. https://doi.org/10.1029/2018JD029356, 2019.
Levasseur, M.: Impact of Arctic meltdown on the microbial cycling of sulphur, Nat. Geosci., 6, 691–700, https://doi.org/10.1038/ngeo1910, 2013.
Lindwall, F., Schollert, M., Michelsen, A., Blok, D., and Rinnan, R.: Fourfold higher tundra volatile emissions due to arctic summer warming, J. Geophys. Res.-Biogeo., 121, 895–902, https://doi.org/10.1002/2015JG003295, 2016.
Liu, X., Easter, R. C., Ghan, S. J., Zaveri, R., Rasch, P., Shi, X., Lamarque, J.-F., Gettelman, A., Morrison, H., Vitt, F., Conley, A., Park, S., Neale, R., Hannay, C., Ekman, A. M. L., Hess, P., Mahowald, N., Collins, W., Iacono, M. J., Bretherton, C. S., Flanner, M. G., and Mitchell, D.: Toward a minimal representation of aerosols in climate models: description and evaluation in the Community Atmosphere Model CAM5, Geosci. Model Dev., 5, 709–739, https://doi.org/10.5194/gmd-5-709-2012, 2012.
Lupu, A. and Maenhaut, W.: Application and comparison of two statistical trajectory techniques for identification of source regions of atmospheric aerosol species, Atmos. Environ., 36, 5607–5618, 2002.
Meltofte, H. (Ed.): Arctic Biodiversity Assessment Status and Trends in Arctic Biodiversity, Conservation of Arctic Flora and Fauna, Akureyri, Iceland, 2013.
Moschos, V., Dzepina, K., Bhattu, D., Lamkaddam, H., Casotto, R., Daellenbach, K. R., Canonaco, F., Rai, P., Aas, W., Becagli, S., Calzolai, G., Eleftheriadis, K., Moffett, C. E., Schnelle-Kreis, J., Severi, M., Sharma, S., Skov, H., Vestenius, M., Zhang, W., Hakola, H., Hellén, H., Huang, L., Jaffrezo, J. L., Massling, A., Nøjgaard, J. K., Petäjä, T., Popovicheva, O., Sheesley, R. J., Traversi, R., Yttri, K. E., Schmale, J., Prévôt, A. S. H., Baltensperger, U., and El Haddad, I.: Equal abundance of summertime natural and wintertime anthropogenic Arctic organic aerosols, Nat. Geosci., 15, 196–202, https://doi.org/10.1038/s41561-021-00891-1, 2022.
Mungall, E. L., Abbatt, J. P. D., Wentzell, J. J. B., Lee, A. K. Y., Thomas, J. L., Blais, M., Gosselin, M., Miller, L. A., Papakyriakou, T., Willis, M. D., and Liggio, J.: Microlayer source of oxygenated volatile organic compounds in the summertime marine Arctic boundary layer, P. Natl. Acad. Sci. USA, 114, 6203–6208, https://doi.org/10.1073/pnas.1620571114, 2017.
Najafi, M. R., Zwiers, F. W., and Gillett, N. P.: Attribution of Arctic temperature change to greenhouse-gas and aerosol influences, Nat. Clim. Change, 5, 246–249, https://doi.org/10.1038/nclimate2524, 2015.
Nguyen, Q. T., Glasius, M., Sørensen, L. L., Jensen, B., Skov, H., Birmili, W., Wiedensohler, A., Kristensson, A., Nøjgaard, J. K., and Massling, A.: Seasonal variation of atmospheric particle number concentrations, new particle formation and atmospheric oxidation capacity at the high Arctic site Villum Research Station, Station Nord, Atmos. Chem. Phys., 16, 11319–11336, https://doi.org/10.5194/acp-16-11319-2016, 2016.
Nieminen, T., Lehtinen, K. E. J., and Kulmala, M.: Sub-10 nm particle growth by vapor condensation – effects of vapor molecule size and particle thermal speed, Atmos. Chem. Phys., 10, 9773–9779, https://doi.org/10.5194/acp-10-9773-2010, 2010.
Park, K.-T., Jang, S., Lee, K., Yoon, Y. J., Kim, M.-S., Park, K., Cho, H.-J., Kang, J.-H., Udisti, R., Lee, B.-Y., and Shin, K.-H.: Observational evidence for the formation of DMS-derived aerosols during Arctic phytoplankton blooms, Atmos. Chem. Phys., 17, 9665–9675, https://doi.org/10.5194/acp-17-9665-2017, 2017.
Park, K.-T., Yoon, Y. J., Lee, K., Tunved, P., Krejci, R., Ström, J., Jang, E., Kang, H. J., Jang, S., Park, J., Lee, B. Y., Traversi, R., Becagli, S., and Hermansen, O.: Dimethyl sulfide-induced increase in cloud condensation nuclei in the Artic atmosphere, Global Biogeochem. Cy., 35, e2021GB006969, https://doi.org/10.1029/2021GB006969, 2021.
Peñuelas, J. and Staudt, M: BVOCs and global change, Trends Plant Sci., 3, 133–144, https://doi.org/10.1016/j.tplants.2009.12.005, 2010.
Pernov, J. B., Bossi, R., Lebourgeois, T., Nøjgaard, J. K., Holzinger, R., Hjorth, J. L., and Skov, H.: Atmospheric VOC measurements at a High Arctic site: characteristics and source apportionment, Atmos. Chem. Phys., 21, 2895–2916, https://doi.org/10.5194/acp-21-2895-2021, 2021. blackboxPlease notice. ACP update inserted.
Potosnak, M. J., Baker, B. M., LeStourgeon, L., Disher, S. M., Griffin, K. L., Bret-Harte, M. S., and Starr, G.: Isoprene emissions from a tundra ecosystem, Biogeosciences, 10, 871–889, https://doi.org/10.5194/bg-10-871-2013, 2013.
Qian, Y., Long, C. N., Wang, H., Comstock, J. M., McFarlane, S. A., and Xie, S.: Evaluation of cloud fraction and its radiative effect simulated by IPCC AR4 global models against ARM surface observations, Atmos. Chem. Phys., 12, 1785–1810, https://doi.org/10.5194/acp-12-1785-2012, 2012.
R Core Team: R: A Language and Environment for Statistical Computing, R Foundation for Statistical Computing, Vienna, Austria, https://www.r-project.org/, last access: 17 September 2022.
Raso, A. R. W., Custard, K. D., May, N. W., Tanner, D., Newburn, M. K., Walker, L., Moore, R. J., Huey, L. G., Alexander, L., Shepson, P. B., and Pratt, K. A.: Active molecular iodine photochemistry in the Arctic, P. Natl. Acad. Sci. USA, 114, 10053–10058, https://doi.org/10.1073/pnas.1702803114, 2017.
Riddick, S. N., Dragosits, U., Blackall, T. D., Daunt, F., Wanless, S., and Sutton, M. A.: The global distribution of ammonia emissions from seabird colonies, Atmos. Environ., 55, 319–327, https://doi.org/10.1016/j.atmosenv.2012.02.052, 2012.
Ruuskanen, T. M., Hakola, H., Kajos, M. K., Hellén, H., Tarvainen, V., and Rinne, J.: Volatile organic compound emissions from Siberian larch, Atmos. Environ., 41, 5807–5812, https://doi.org/10.1016/j.atmosenv.2007.05.036, 2007.
Sand, M., Samset, B. H., Balkanski, Y., Bauer, S., Bellouin, N., Berntsen, T. K., Bian, H., Chin, M., Diehl, T., Easter, R., Ghan, S. J., Iversen, T., Kirkevåg, A., Lamarque, J.-F., Lin, G., Liu, X., Luo, G., Myhre, G., Noije, T. V., Penner, J. E., Schulz, M., Seland, Ø., Skeie, R. B., Stier, P., Takemura, T., Tsigaridis, K., Yu, F., Zhang, K., and Zhang, H.: Aerosols at the poles: an AeroCom Phase II multi-model evaluation, Atmos. Chem. Phys., 17, 12197–12218, https://doi.org/10.5194/acp-17-12197-2017, 2017.
Schmale, J. and Baccarini, A.: Progress in Unraveling Atmospheric New Particle Formation and Growth Across the Arctic, Geophys. Res. Lett., 48, e2021GL094198, https://doi.org/10.1029/2021GL094198, 2021.
Schmale, J., Zieger, P., and Ekman, A. M. L.: Aerosols in current and future Arctic climate, Nat. Clim. Change, 11, 95–105, https://doi.org/10.1038/s41558-020-00969-5, 2021.
Sellegri, K., Rose, C., Marinoni, A., Lupi, A., Wiedensohler, A., Andrade, M., Bonasoni, P., and Laj, P.: New Particle Formation: A Review of Ground-Based Observations at Mountain Research Stations, Atmosphere (Basel), 10, 493, https://doi.org/10.3390/atmos10090493, 2019.
Sherwen, T., Evans, M. J., Carpenter, L. J., Andrews, S. J., Lidster, R. T., Dix, B., Koenig, T. K., Sinreich, R., Ortega, I., Volkamer, R., Saiz-Lopez, A., Prados-Roman, C., Mahajan, A. S., and Ordóñez, C.: Iodine's impact on tropospheric oxidants: a global model study in GEOS-Chem, Atmos. Chem. Phys., 16, 1161–1186, https://doi.org/10.5194/acp-16-1161-2016, 2016.
Shindell, D. and Faluvegi, G.: Climate response to regional radiative forcing during the twentieth century, Nat. Geosci., 2, 294–300, https://doi.org/10.1038/ngeo473, 2009.
Steffen, A., Bottenheim, J., Cole, A., Ebinghaus, R., Lawson, G., and Leaitch, W. R.: Atmospheric mercury speciation and mercury in snow over time at Alert, Canada, Atmos. Chem. Phys., 14, 2219–2231, https://doi.org/10.5194/acp-14-2219-2014, 2014.
Tarvainen, V., Hakola, H., Hellén, H., Bäck, J., Hari, P., and Kulmala, M.: Temperature and light dependence of the VOC emissions of Scots pine, Atmos. Chem. Phys., 5, 989–998, https://doi.org/10.5194/acp-5-989-2005, 2005.
Tunved, P., Ström, J., and Krejci, R.: Arctic aerosol life cycle: linking aerosol size distributions observed between 2000 and 2010 with air mass transport and precipitation at Zeppelin station, Ny-Ålesund, Svalbard, Atmos. Chem. Phys., 13, 3643–3660, https://doi.org/10.5194/acp-13-3643-2013, 2013.
US National Ice Center: IMS Daily Northern Hemisphere Snow and Ice Analysis at 1 km, 4 km, and 24 km Resolutions, Version 1, NSIDC: National Snow and Ice Data Center, US Nationll Ice Center, Boulder, Colorado, USA, https://doi.org/10.7265/N52R3PMC, 2008.
von Glasow, R., Bobrowski, N., and Kern, C.: The effects of volcanic eruptions on atmospheric chemistry, Chem. Geol., 263, 131–142, https://doi.org/10.1016/j.chemgeo.2008.08.020, 2009.
Wang, M., Xiao, M., Bertozzi, B., Marie, G., Rörup, B., Schulze, B., Bardakov, R., He, X.-C., Shen, J., Scholz, W., Marten, R., Dada, L., Baalbaki, R., Lopez, B., Lamkaddam, H., Manninen, H. E., Amorim, A., Ataei, F., Bogert, P., Brasseur, Z., Caudillo, L., De Menezes, L.-P., Duplissy, J., Ekman, A. M. L., Finkenzeller, H., Carracedo, L. G., Granzin, M., Guida, R., Heinritzi, M., Hofbauer, V., Höhler, K., Korhonen, K., Krechmer, J. E., Kürten, A., Lehtipalo, K., Mahfouz, N. G. A., Makhmutov, V., Massabò, D., Mathot, S., Mauldin, R. L., Mentler, B., Müller, T., Onnela, A., Petäjä, T., Philippov, M., Piedehierro, A. A., Pozzer, A., Ranjithkumar, A., Schervish, M., Schobesberger, S., Simon, M., Stozhkov, Y., Tomé, A., Umo, N. S., Vogel, F., Wagner, R., Wang, D. S., Weber, S. K., Welti, A., Wu, Y., Zauner-Wieczorek, M., Sipilä, M., Winkler, P. M., Hansel, A., Baltensperger, U., Kulmala, M., Flagan, R. C., Curtius, J., Riipinen, I., Gordon, H., Lelieveld, J., El-Haddad, I., Volkamer, R., Worsnop, D. R., Christoudias, T., Kirkby, J., Möhler, O., and Donahue, N. M.: Synergistic HNO3–H2SO4–NH3 upper tropospheric particle formation, Nature, 605, 483–489, https://doi.org/10.1038/s41586-022-04605-4, 2022.
Wiedensohler, A., Covert, D. S., Swietlicki, E., Aalto, P., Heintzenberg, J., and Leck, C.: Occurrence of an ultrafine particle mode less than 20 nm in diameter in the marine boundary layer during Arctic summer and autumn, Tellus B, 48, 213–222, https://doi.org/10.3402/tellusb.v48i2.15887, 1996.
Wiedensohler, A., Birmili, W., Nowak, A., Sonntag, A., Weinhold, K., Merkel, M., Wehner, B., Tuch, T., Pfeifer, S., Fiebig, M., Fjäraa, A. M., Asmi, E., Sellegri, K., Depuy, R., Venzac, H., Villani, P., Laj, P., Aalto, P., Ogren, J. A., Swietlicki, E., Williams, P., Roldin, P., Quincey, P., Hüglin, C., Fierz-Schmidhauser, R., Gysel, M., Weingartner, E., Riccobono, F., Santos, S., Grüning, C., Faloon, K., Beddows, D., Harrison, R., Monahan, C., Jennings, S. G., O'Dowd, C. D., Marinoni, A., Horn, H.-G., Keck, L., Jiang, J., Scheckman, J., McMurry, P. H., Deng, Z., Zhao, C. S., Moerman, M., Henzing, B., de Leeuw, G., Löschau, G., and Bastian, S.: Mobility particle size spectrometers: harmonization of technical standards and data structure to facilitate high quality long-term observations of atmospheric particle number size distributions, Atmos. Meas. Tech., 5, 657–685, https://doi.org/10.5194/amt-5-657-2012, 2012.
Willis, M. D., Köllner, F., Burkart, J., Bozem, H., Thomas, J. L., Schneider, J., Aliabadi, A. A., Hoor, P. M., Schulz, H., Herber, A. B., Leaitch, W. R., and Abbatt, J. P. D.: Evidence for marine biogenic influence on summertime Arctic aerosol, Geophys. Res. Lett., 44, 6460–6470, https://doi.org/10.1002/2017GL073359, 2017.