the Creative Commons Attribution 4.0 License.
the Creative Commons Attribution 4.0 License.
 | 05 Jan 2023
Isothermal evaporation of α-pinene secondary organic aerosol particles formed under low NOx and high NOx conditions
Angela Buchholz
Luis M. F. Barreira
Arttu Ylisirniö
Liqing Hao
Iida Pullinen
Siegfried Schobesberger
Annele Virtanen
Many recent secondary organic aerosol (SOA) studies mainly focus on biogenic SOA particles formed under low NOx conditions and thus are applicable to pristine environments with minor anthropogenic influence. Although interactions between biogenic volatile organic compounds and NOx are important in, for instance, suburban areas, there is still a lack of knowledge about the volatility and processes controlling the evaporation of biogenic SOA particles formed in the presence of high concentrations of NOx. Here we provide detailed insights into the isothermal evaporation of α-pinene SOA particles that were formed under low NOx and high NOx conditions to investigate the evaporation process and the evolution of particle composition during the evaporation in more detail. We coupled Filter Inlet for Gases and AEROsols-Chemical Ionization Mass Spectrometer (FIGAERO-CIMS) measurements of the molecular composition and volatility of the particle phase with isothermal evaporation experiments conducted under a range of relative humidity (RH) conditions from low RH (<7 % RH) to high RH (80 % RH). Very similar changes were observed in particle volatility at any set RH during isothermal evaporation for the α-pinene SOA particles formed under low NOx and high NOx conditions. However, there were distinct differences in the initial composition of the two SOA types, possibly due to the influence of NOx on the RO2 chemistry during SOA formation. Such compositional differences consequently impacted the primary type of aqueous-phase processes in each type of SOA particle in the presence of particulate water.
- Article
(4573 KB) - Full-text XML
-
Supplement
(3476 KB) - BibTeX
- EndNote


Biogenic secondary organic aerosol (SOA) affects the climate by scattering solar radiation (Lihavainen et al., 2015) and acting as cloud condensation nuclei (Sporre et al., 2014; Yli-Juuti et al., 2021). Overall, it causes a negative radiative forcing on climate and potentially offsets approximately 13 % of the warming effect due to a doubling of CO2 (Sporre et al., 2019). Nonetheless, due to its short atmospheric lifetime (i.e., days to weeks; Hodzic et al., 2016), biogenic SOA cannot be simply regarded as a long-term offset to the warming impact from the long-lived CO2 (i.e., a lifetime of years; Myhre et al., 2013). Accurate assessments of the radiative forcing from biogenic SOA require a comprehensive understanding about the key processes affecting its atmospheric lifetime. As one of those processes controlling aerosol lifetime, evaporation governs the gas–particle partitioning of organic compounds. The recent findings of evaporation studies are primarily applicable to pristine forest areas (Vaden et al., 2011; Yli-Juuti et al., 2017; Buchholz et al., 2019; Li et al., 2019, 2021); hence, there is still a lack of information about the evaporation behavior of biogenic SOA particles in polluted areas where anthropogenic–biogenic interactions are important. Here, we investigate the isothermal evaporation of biogenic SOA particles which are derived from oxidizing one representative biogenic volatile organic compound (BVOC) precursor in the presence of nitrogen oxides (NO) that are important gaseous pollutants. The results of this study will help redefine the atmospheric lifetime of biogenic SOA in, for instance, suburban areas that have experienced a rapid growth of CO2 emissions in the recent decade (Mitchell et al., 2018).
BVOCs account for up to 90 % of the global budget of non-methane volatile organic compounds (Guenther et al., 1995). Atmospheric oxidation of BVOCs produces condensable vapors and subsequently contributes to the formation of biogenic SOA (Ehn et al., 2014; Jokinen et al., 2015). With annual emissions of approximately 157–177 Tg, monoterpenes (C10H16) have been considered to be an important class of BVOCs (Guenther et al., 2012) and are recognized as a significant source of biogenic SOA, not only in boreal forest areas (Tunved et al., 2006; Mohr et al., 2019; Barreira et al., 2021) but also in certain isoprene-dominated regions (Zhang et al., 2018; Lee et al., 2020). As a monoterpene with the highest emissions from terrestrial vegetation, α-pinene has been commonly used as a proxy for monoterpenes. Oxidizing α-pinene with ozone (O3) or hydroxyl radicals (OH) produces SOA particles with high particle viscosities (Virtanen et al., 2010; Saukko et al., 2012) and substantial amounts of oxidation products of low volatility (Lopez-Hilfiker et al., 2015; Ylisirniö et al., 2020). Compared to semi-volatile organic mixtures, α-pinene SOA particles display slower evaporation rates, which are attributed to the existence of compounds of low volatility, high particle viscosity, and possible particle-phase reactions (Vaden et al., 2011; Yli-Juuti et al., 2017; D'Ambro et al., 2018). While kinetic limitations arising from particle viscosity hinder particle evaporation, especially under low RH conditions, the volatility distributions of particulate constituents primarily control the particle evaporation rate at high relative humidity (RH). On the one hand, particulate water content acts a plasticizer accelerating the bulk–surface diffusion (Yli-Juuti et al., 2017; Li et al., 2019). On the other hand, it behaves as a catalyst to induce aqueous-phase processes which form organic compounds of low volatility, especially for SOA particles with high oxidation levels (Buchholz et al., 2019; Li et al., 2021). All of these findings primarily advance our knowledge about the evaporation processes of biogenic SOA particles but are limited to those in remote forest areas lacking in anthropogenic influence.
Over the past few decades, increasing NOx emissions have been released into the atmosphere due to rapid economic growth and urbanization (Duncan et al., 2016). In recent years, increasing attention has been paid to the chemical interactions between NOx and BVOC emissions and, especially, monoterpenes in suburban areas. In the southern United States, increasing amounts of daytime NOx were suggested to enhance the formation of monoterpene SOA and increase the likelihood of the fragmentation chemistry that forms oxidation products with a carbon number (Cnum) smaller than 10 (Zhang et al., 2018). In the same location, the large nighttime production of monoterpene SOA was attributed to oxidation induced by NO3, which is a product of NO2 and O3 (Xu et al., 2015). In southwestern Germany, NOx that accumulated at night drove the large production of multifunctional organic nitrates (ONs) via the nocturnal chemistry between monoterpenes and NOx, contributing up to 25 % in mass to the particulate organics (Huang et al., 2019). Furthermore, hydrolysis which converts ONs into HNO3 has been suggested as an efficient sink for ONs in the particle phase (Zare et al., 2018, 2019). Depending on the alkyl substitutions, functional groups, and carbon backbones, the hydrolysis mechanism and rates can vary between different monoterpene-derived ONs (Wang et al., 2021). Overall, the addition of NOx affects the formation of monoterpene SOA, the types of oxidation products, and potentially the properties of the resultant particles. For monoterpene SOA particles produced in the presence of NOx, there is very limited knowledge about the evolution of particle properties during the isothermal evaporation process.
In this study, we investigated the isothermal evaporation of SOA particles from oxidizing α-pinene under low NOx and high NOx conditions at room temperature with a wide range of RH. We examined the volume change in addition to the evolution of the molecular composition of α-pinene SOA particles during isothermal evaporation. While most recent laboratory studies focusing on the evaporation process of biogenic SOA particles represent conditions relevant for pristine environments with minor anthropogenic influence, our work would be one of the few providing insights into the SOA evaporation under suburban settings involving anthropogenic–biogenic interactions.
2.1 Isothermal evaporation of SOA particles
An oxidation flow tube reactor (OFR) of 13.3 L was used to generate α-pinene SOA particles at ∼40 RH % and 25 ∘C with a residence time of 160 s (Kang et al., 2007; Lambe et al., 2011). The experimental conditions and results of SOA generation are summarized in Table S1 in the Supplement. The operation procedure of this OFR has been described previously (Buchholz et al., 2019; Li et al., 2021). Briefly, α-pinene was continuously injected into a heated flow of N2 with a syringe pump (Kari et al., 2018) and then mixed with a humidified flow of N2, O2, O3, and N2O before entering into the OFR. Before being mixed with O3, the mixing ratio of α-pinene was constantly monitored by a proton transfer reaction time-of-flight mass spectrometer (PTR-ToF 8000; Ionicon Analytik GmbH) using hydronium (H3O+) ions. Overall, 5 L min−1 of the total flow containing α-pinene (250–300 ppb, parts per billion) and O3 (∼13 ppm, parts per million) was introduced into the OFR for photooxidation. Inside the OFR, SOA was formed by oxidizing α-pinene by OH radicals, which were produced by photolyzing O3 (∼13 ppm) with 254 nm UV lamps in the presence of water vapor. In the high NOx case, N2O (99.5 % purity; mixing ratio inside OFR was 1.85 % in volume) was injected into the OFR for NOx production. NO and NO2 were produced via the reactions N2O + O(1D) → 2NO and under the illumination of the same 254 nm UV lamps inside the OFR (Lambe et al., 2017). For the two NOx cases, the voltage of the 254 nm UV lamps was adjusted to ensure similar OH exposure. We indirectly determined the photon fluxes for each experiment using the measured O3 decay without any α-pinene and N2O in the OFR. With the KinSim model developed by Peng and Jimenez (2019), we estimated the photon flux by varying the model input photon flux until the model output O3 concentration agreed with the measured one. The estimated photon fluxes were and photons cm−2 s−1 for the low NOx and high NOx cases, respectively. Furthermore, we used the KinSim model (Peng and Jimenez, 2019), and additionally implemented the reactions of RO2 (Peng et al., 2019), to simulate the OFR chemistry. The OH exposure was estimated to be and molec. cm−3 s−1 for low NOx and high NOx conditions. Under low NOx conditions, OH and O3 contributed to 96 % and 4 % of the loss of α-pinene. Under high NOx conditions, NO3 radicals were produced from the reaction and also contributed to the oxidation of α-pinene. The fractional loss of α-pinene to OH, O3, and NO3 was 50 %, 1 %, and 49 %. For the high NOx case, the estimated ratio between the [RO2] + [NO] and [RO2] + [HO2] pathways ( was 0.84 ± 0.19. For each experiment under one NOx condition, similar aerosol mass concentration in the OFR was ensured. Assuming a particle density of 1.5 g cm−3, which was estimated on the basis of the elemental ratios of the molecular compositions in aerosol particles (Kuwata et al., 2012), the mass concentrations of polydisperse α-pinene SOA were 442 ± 30 and 139 ± 29 µg m−3 under low NOx and high NOx conditions, respectively. Between experiments, the OFR was flushed with purified air overnight with the same RH and illumination as the following experiment but without adding α-pinene and N2O. Afterwards, the background particle number and the volatile organic compound (VOC) mixing ratio were reduced to be below 2000 cm−3 (mass concentration <0.1 µg m−3) and under the instrument limit of detection, respectively. Despite the careful cleaning procedure, we cannot exclude a small contamination of the system with N2O (e.g., in tubing before the OFR) and/or HONO (a byproduct of the in situ NOx production from N2O), which may lead to a small production of NOx in the experiment where no N2O was added ([NOx] <8 ppb at the outlet of OFR). Hence, we labeled the experiments with a no N2O addition as “low NOx” and expect a very small contribution of NOx-related compounds.
After the OFR, 2 L min−1 of the generated α-pinene SOA was passed through an ozone denuder coated with potassium iodide and then size selected with two parallel nanometer aerosol differential mobility analyzers (NanoDMA, model 3085; TSI Incorporated) operated in an open-loop setting with a sample-to-sheath flow ratio of 1:8 or 1:10. During the size selection, the gas-phase compounds were diluted by at least 2 orders of magnitude so that particle evaporation was initiated (Li and Chen, 2005). By varying the ratio of dry and humidified flows for the sheath flow of the NanoDMAs, the RH of particle samples was set to one of three desired conditions, namely low RH (<7 % RH), intermediate RH (40 % RH), or high RH (80 % RH). Afterwards, the size-selected SOA particles with 80 nm electrical mobility diameters were fed into either bypass lines with varying length or stainless-steel residence time chambers (RTCs) with volumes of 25 or 100 L for isothermal evaporation, allowing residence times (tR) from seconds to hours. The vapor wall losses in the RTCs were sufficiently fast, with a vapor wall loss coefficient greater than 10−2 s−1, ensuring negligibly low concentrations of gas-phase compounds in the RTCs (Yli-Juuti et al., 2017). After each isothermal evaporation experiment, the NanoDMAs, bypass lines and RTCs were flushed for at least 12 h with purified air under the same RH condition as in the following experiment.
2.2 Physical and chemical characterization of SOA particles
2.2.1 SMPS analysis
Particle size changes due to isothermal evaporation were periodically measured with a scanning mobility particle sizer (SMPS; TSI Incorporated; classifier model 3080, CPC 3775). We quantified the extent of particle isothermal evaporation using the volume fraction remaining (VFR) under the assumption of particle sphericity. Independent of changes in particle number or mass concentration, the VFR was determined as , where Dp,t and Dp,0 are the measured size after residence time t of isothermal evaporation and the selected sizes at the start of isothermal evaporation, respectively. The selected size Dp,0 was calibrated against ammonium sulfate particles under the experimental RH conditions.
2.2.2 HR-ToF-AMS analysis
Elemental composition measurements of particle samples were conducted using a high-resolution time-of-flight aerosol mass spectrometer (HR-ToF-AMS; Aerodyne Research Inc.). The oxidation state () of the particle samples was calculated with the improved ambient parameterizations (Canagaratna et al., 2015). Following the Eqs. (1)–(2) presented in Kiendler-Scharr et al. (2016), we estimated the mass concentration of ON moieties on the basis of the ratio of NO and NO+. The values of for ammonium nitrate (i.e., from the ionization efficiency calibration) and ONs were correspondingly set to 0.51 and 0.1. We also estimated the upper bound of the ONs by assuming all observed nitrates are in the organic form. When sampling from the RTCs during evaporation, particle mass concentration was not sufficient to derive reliable elemental composition values from the AMS measurements. Thus, we only presented the elemental composition data from particle samples right after the size selection which experienced the least amount of particle evaporation.
2.2.3 FIGAERO-CIMS analysis
The composition and volatility of particle samples were characterized with a custom-built Filter Inlet for Gases and AEROsols (FIGAERO; Ylisirniö et al., 2021), in combination with a high-resolution time-of-flight chemical ionization mass spectrometer (CIMS; Aerodyne Research Inc.), using the iodide ionization scheme (Lopez-Hilfiker et al., 2014). The operation of FIGAERO-CIMS has been detailed in previous studies (Lopez-Hilfiker et al., 2014; Ylisirniö et al., 2021). The FIGAERO inlet allows sequential gas and particle measurements using two individual inlets leading to the CIMS. Since we were interested in the changes in particle composition and volatility, the system was only deployed for measuring particle-phase compounds. The mass resolution of CIMS was between 4000 and 5000, and the ion molecule reaction chamber was actively controlled at a pressure of 100 mbar. Due to the lack of a reliable sensitivity and transmission calibration for the relevant compounds detected with FIGAERO-CIMS, ion signals are presented in counts per second (ct s−1), i.e., variabilities in sensitivity and transmission between compounds were not accounted for.
During sample collection, particles were sampled either after the size selection (i.e., fresh stages with average tR=0.25 h) or after isothermal evaporation in the RTCs (i.e., RTC stages with average tR=4.25 h) onto a polytetrafluorethylene (PTFE) filter (2 µm pore; Zefluor, Pall Corporation) for 0.5 h. The collected particles were thermally desorbed from the filter into the CIMS using a temperature-controlled dry N2 flow. The temperature of the N2 flow was linearly increased from 25 to ∼200 ∘C within 20 min (i.e., desorption period) and then kept at ∼200 ∘C for an extra 15 min (i.e., soak period) so that organic residuals, if any, could evaporate from the filter. Apart from particle samples, we also performed two different types of blank measurements to identify instrument background and potential contamination from the sampling process. The instrument background was investigated by measuring clean FIGAERO filters with no particle collection, while additional contamination was determined by analyzing samples which were collected through the NanoDMAs with a set voltage of 0 V (i.e., no selected particles) and 0.5 h collection time.
For each observed ion, the change in signal intensity with desorption temperature (Tdesorp) is called a thermogram. The desorption temperature with the maximum signal (Tmax) is proportional to the saturation vapor concentration (C∗, defined at 25 ∘C) of a compound (Lopez-Hilfiker et al., 2014). In this study, the relationship was calibrated using a homologous series of polyethylene glycol compounds (PEG 4–8) as reference compounds (Ylisirniö et al., 2021). According to the volatility classification defined by Donahue et al., 2012), the range of Tdesorp was divided into semi-volatile organic compounds (SVOCs), low volatility organic compounds (LVOCs), and extremely low volatility organic compounds (ELVOCs). Note that the conducted calibration is sufficient to reliably identify the SVOC and LVOC ranges, despite uncertainties in extrapolating the calibration towards lower C∗ values (Hyttinen et al., 2022). The measured calibration parameters are listed in the Supplement.
Table 1Mass contribution of CHO compounds and ONs to the α-pinene SOA particle samples formed under high NOx conditions in the OFR.
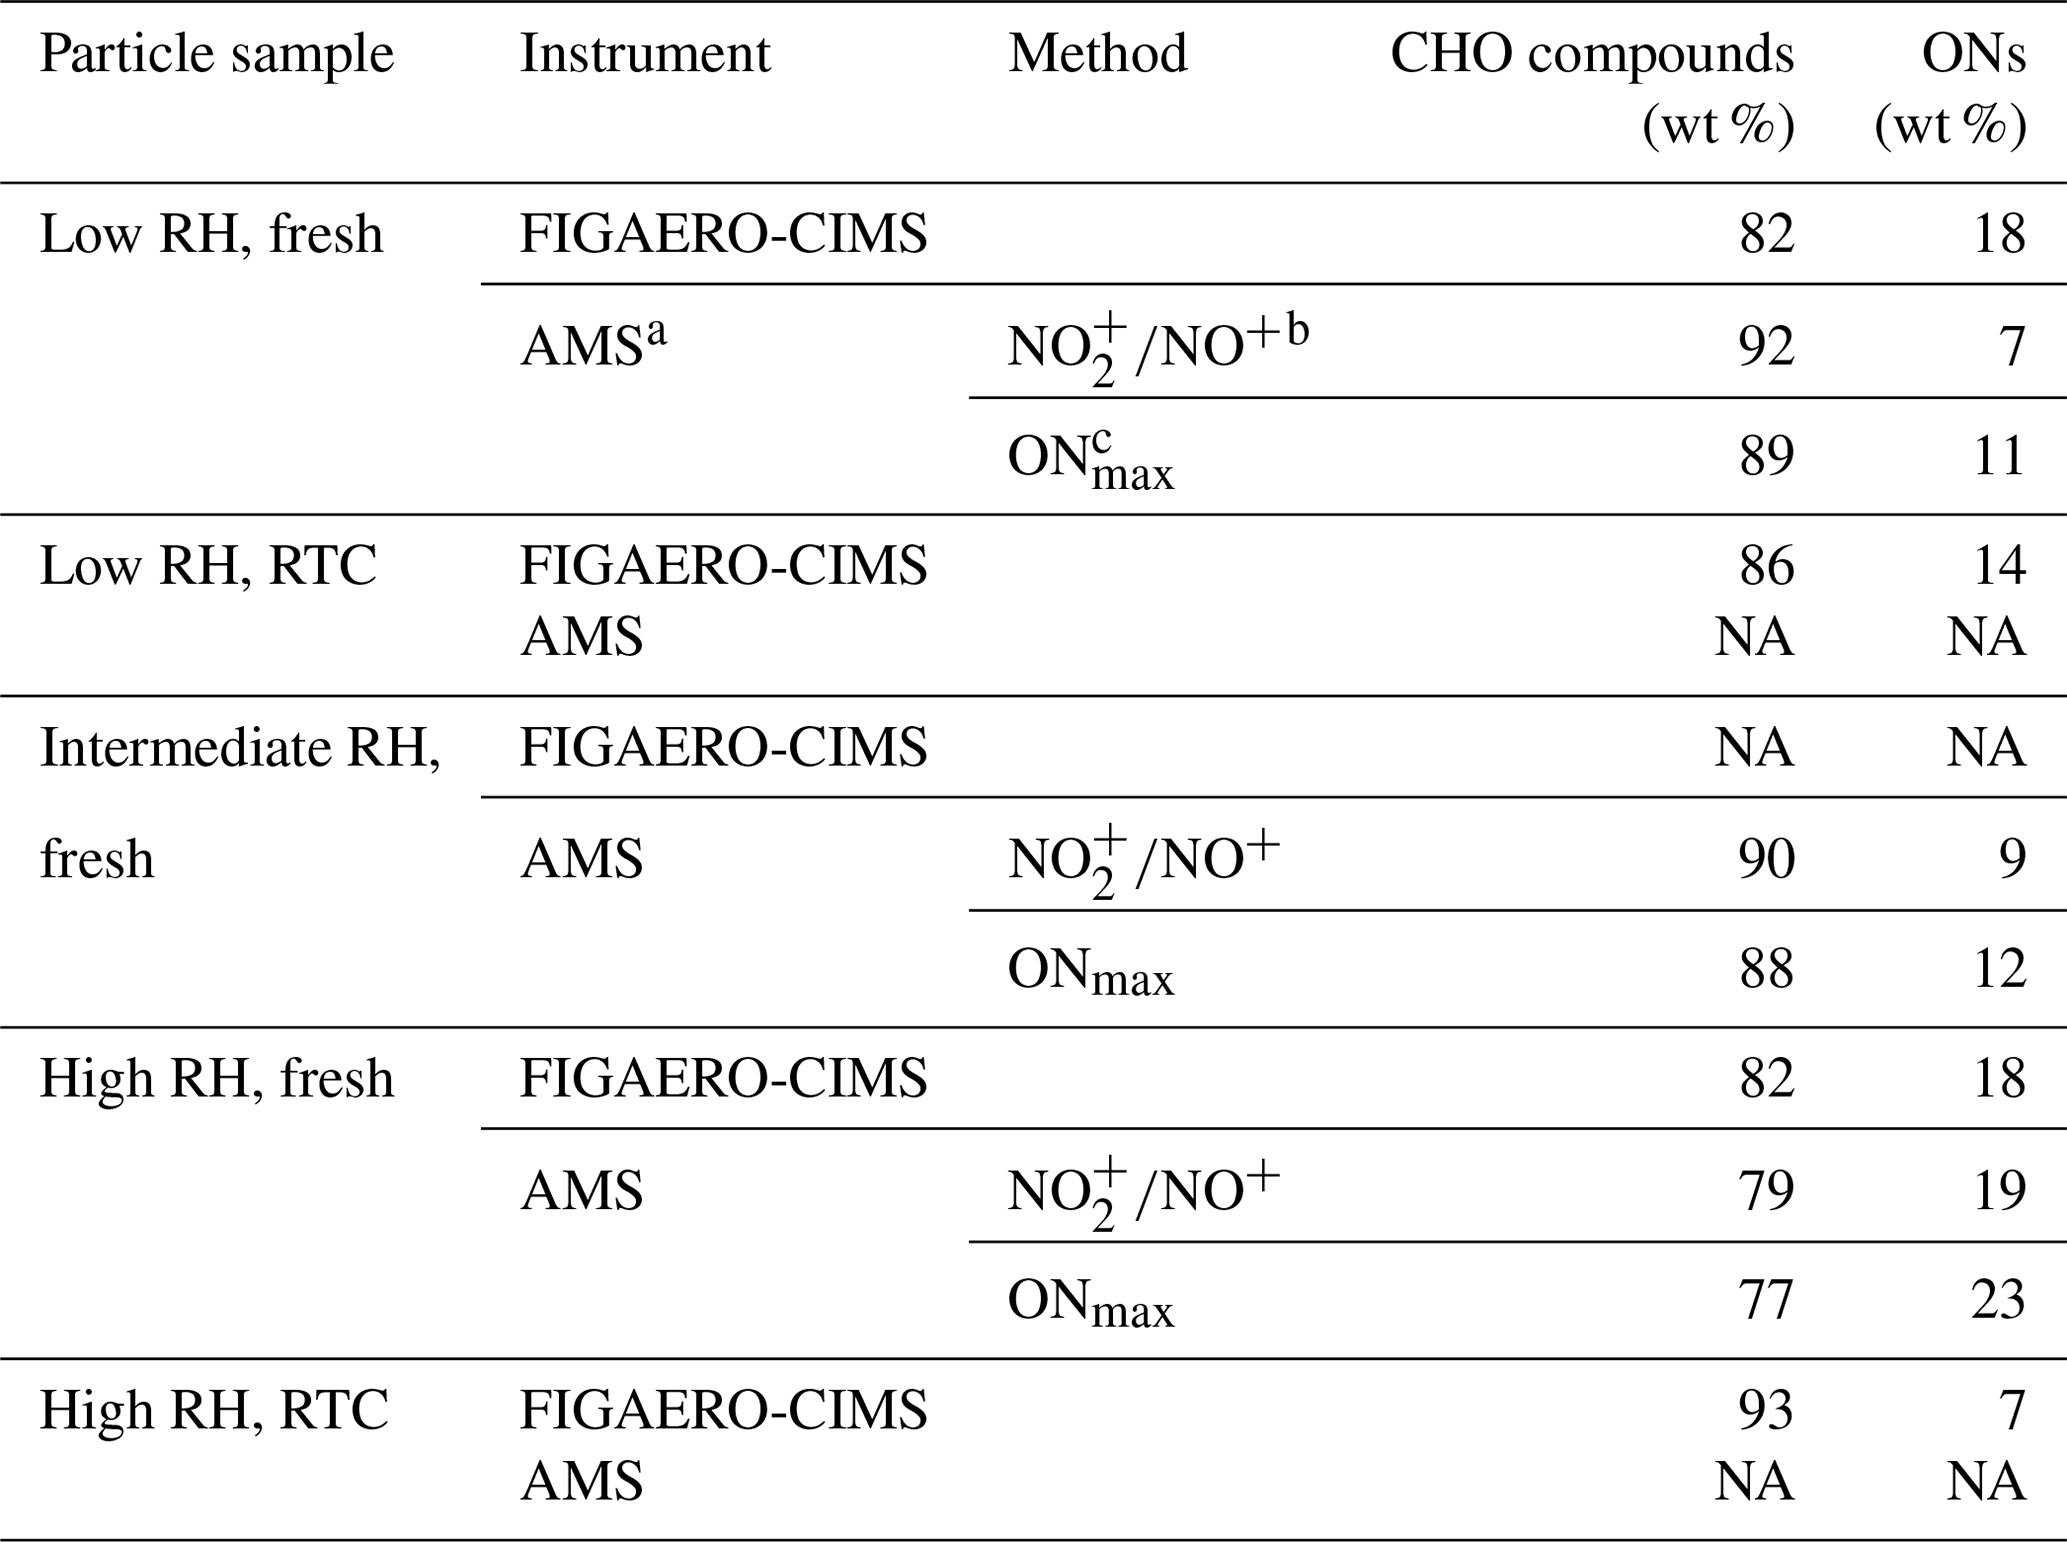
a For AMS methods, the average molecular weight of ONs estimated from the FIGAERO-CIMS data was used. b is calculated by estimating the ON contribution using the difference in fragmentation between organic and inorganic nitrate species (Kiendler-Scharr et al., 2016). c ONmax is calculated by assuming that all nitrate moieties detected in the AMS were from organic nitrates. Note: NA is for not available.
2.2.4 Positive matrix factorization analysis
Positive matrix factorization (PMF; Paatero and Tapper, 1994) was deployed to analyze the mass spectra data collected by the FIGAERO-CIMS (Buchholz et al., 2020; Li et al., 2021). Organic compounds which have similar temporal behavior (i.e., similar thermal desorption behavior and/or aqueous-phase process) during isothermal evaporation were grouped into a single factor. Blank samples were also included in the data sets for PMF analysis to determine background factors. Error matrices were prepared using the constant-error scheme (Buchholz et al., 2020) without any down-weighting, and the PMF results were evaluated with the PMF Evaluation Tool (PET v3.05; Ulbrich et al., 2009). Due to the predominance of non-nitrated organic compounds (labeled as “CHO compounds”) in all particle samples (Table 1), the PMF analysis was independently applied to CHO compounds and ONs (labeled as “ONs”) so that the ONs could be better resolved into factors. This approach also allowed us to investigate potential similarities between the low NOx and high NOx experiments regarding the CHO compounds. After careful comparisons between multiple PMF solutions, we decided to select PMF solutions with 12 and 8 factors for the data set of CHO compounds and the one of ONs, respectively. We defined each PMF factor as a sample or background factor according to its contribution in the particle and filter blank samples. For the data set of CHO compounds, five sample and seven background factors were found. For the ONs data set, three out of the eight factors were identified as sample factors. In the following discussion, only the sample factors will be considered, but the factor thermograms and mass spectra of all factors are shown in the Supplement. Note that the seemingly large number of background factors is due to changes in the exact composition of the instrument background between different experiment days (e.g., due to changing the PTFE filter in the FIGAERO inlet), i.e., each sample has contributions from only two or three out of all background factors. Detailed information on the PMF solution diagnostics can be found in the Supplement.
3.1 Isothermal evaporation and thermal desorption behavior of SOA particles
Changes in the VFR of particles as a function of tR at different RH are presented for low NOx (gray) and high NOx (orange) conditions in Fig. 1. The particle evaporation rates were almost identical between the two NOx conditions at any set RH. We acknowledge that certain amounts of inorganic nitrates (e.g., NH4NO3 and HNO3) were formed under high NOx conditions due to the high levels of gaseous HNO3 and HONO, which were byproducts of the NO production via the reaction between N2O and O(1D) (Lambe et al., 2017). However, as estimated from the AMS data, the produced inorganic nitrates contributed approximately 1 % to the particle mass (Table 1) and would only lead to very minor changes in particle volume during isothermal evaporation (i.e., smaller than the measurement uncertainty). To compare VFR values between studies, it is important to take particle composition into account (i.e., precursor compounds and oxidation level). The observed evaporation behavior fell between the medium and high cases, reported in Buchholz et al. (2019; see Fig. S1 in the Supplement), as expected from the measured levels in this study.
With increasing RH, the particle evaporation rate became faster (Fig. 1), and a larger fraction of compounds was removed during isothermal evaporation. As previous particle evaporation studies have suggested (Vaden et al., 2011; Yli-Juuti et al., 2017; Buchholz et al., 2019; Li et al., 2019, 2021; Zaveri et al., 2020), considerable kinetic limitations exist in SOA particles at low RH, and thus the evaporation of compounds is slowed down due to the substantially high particle viscosity. With increasing RH, particulate water acts as a plasticizer for the bulk–surface diffusion and therefore enhances particle evaporation. In addition, the almost identical particle evaporation rates between intermediate RH (40 % RH; diamonds) and high RH (80 % RH; circles) conditions suggest that the particle evaporation at 40 % RH can be already approximated as a liquid-like process (Fig. 1).
To investigate if particulate water acted also as a catalyzer for aqueous-phase processes for the low NOx and high NOx cases, we calculated the expected isothermal evaporation behavior based on the particle-phase volatility distribution from the PMF analysis of the FIGAERO measurements (see Sect. 3.2) by using a liquid-like evaporation model (LLEVAP; Lehtinen and Kulmala, 2003; Yli-Juuti et al., 2017), which assumes particle volatility to be the only driver for particle size change during particle evaporation (see Sect. S1.1). With this method, Tikkanen et al. (2020) could reproduce the observed isothermal evaporation under high RH conditions for α-pinene SOA particles if no substantial aqueous-phase processes occurred, and particulate water acted primarily as a plasticizer. But, in this study, we found a clear discrepancy between the observed isothermal evaporation and the LLEVAP simulations, even when considering the interquartile range of the volatility distribution (see Fig. S2). The volatility distribution derived from the FIGAERO measurement was too far in the LVOC and ELVOC range, i.e., using this volatility distribution always underestimates the amount of isothermal evaporation. This behavior can be interpreted as a sign for aqueous-phase processes. Water acted as a catalyst for reactions by creating products of higher volatility which then evaporate from the particle, thus leading to more isothermal evaporation than expected from the original volatility distribution. We discuss more details about the changes in the composition of the residual particles and possible reaction pathways in Sect. 3.4.

Figure 1Volume fraction remaining (VFR) derived from particle size measurements as function of residence time (tR) in the RTCs for α-pinene SOA particles which were formed under low NOx (gray) and high NOx (orange) conditions in the OFR and evaporated under low RH (<7 % RH; squares), intermediate RH (40 % RH; diamonds), and high RH (80 % RH; circles) conditions. The blue and brown areas indicate the collection periods of FIGAERO-CIMS corresponding to fresh and RTC samples.
In Fig. 2, we show the thermal desorption profiles for the high NOx case at fresh and RTC evaporation stages under low RH (Fig. 2c, d) and high RH (Fig. 2a, b) conditions. The thermal desorption behavior of particle samples is usually illustrated with sum thermograms (STGs) in which the total sum of organic signals is plotted against Tdesorp (Lopez-Hilfiker et al., 2015; D'Ambro et al., 2017). Note that the appearances of STGs are impacted by both the total number of molecules collected onto the filters and the underlying volatility distributions. To allow feasible comparisons between fresh and RTC samples at the same RH, all STGs were first normalized to the total ion signals of each individual sample. Following the same procedure described by Li et al. (2021), we then scaled the normalized STGs of the RTC samples with the changes in the average VFR (VFRavg) between fresh and RTC stages to account for the expected particle volume change due to isothermal evaporation. To enhance readability, we will hereafter call both – the normalized STGs for the fresh samples and the scaled normalized STGs of the RTC samples – STGs, since they are now directly comparable.
The difference between STGs of fresh and RTC samples (Fig. 2b, d; indicated as gray-striped areas) became larger when particulate water was present. Overall, ONs accounted for up to 20 % of the total organic signals of FIGAERO samples under high NOx conditions, which broadly agrees with the values estimated from the AMS data under the same conditions (Table 1). Since thermal losses of nitrate moieties from ONs during FIGAERO desorption are possible (Francisco and Krylowski, 2005), the estimated fraction of ONs here represents the lower bound. We also examine changes in the median desorption temperature values (T50) for the total organics, CHO compounds, and ONs between different samples, as shown in Fig. 2e. On average, the ONs were slightly more volatile and had lower values of T50, as compared to the CHO compounds. In line with the faster particle evaporation rate at high RH (Fig. 1) and the larger removal of volatile compounds (Fig, 2a–d), changes in T50 were more noticeable in the high RH samples than the low RH ones for all compositional categories (Fig. 2e). Very similar changes in STGs and T50 were observed in the low NOx case in the Supplement.
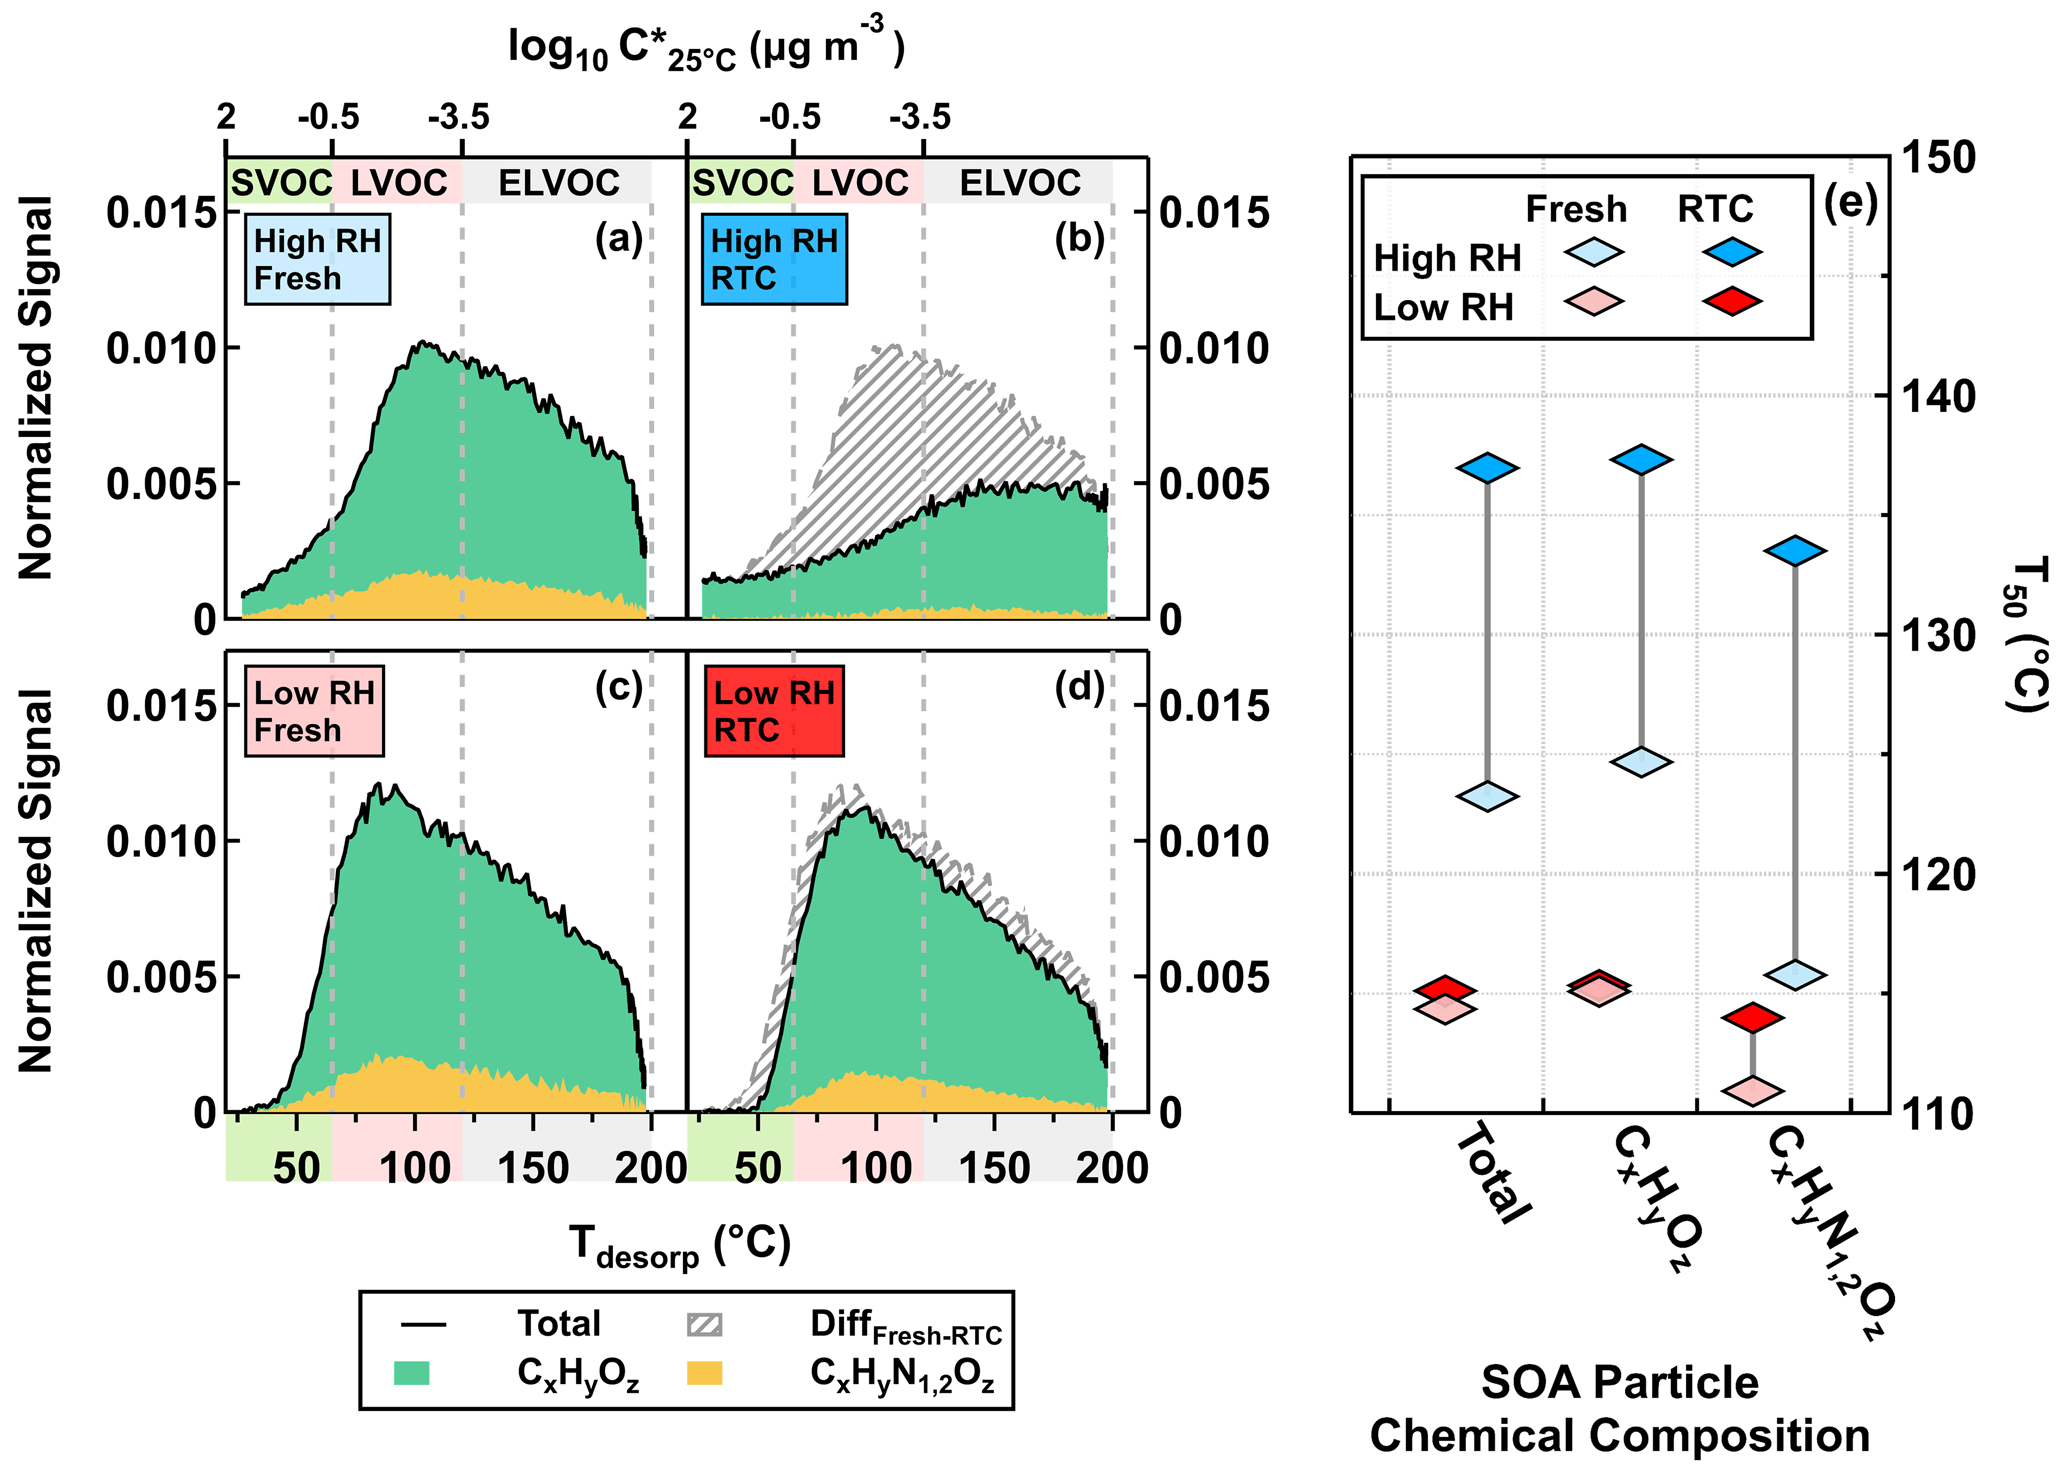
Figure 2FIGAERO-CIMS sum thermograms (STGs) (a–d) plotted against the desorption temperature (Tdesorp) and the corresponding median desorption temperature (T50; diamonds) (e) for the high NOx case under low RH (<7 % RH) and high RH (80 % RH) conditions. CHO compounds and ONs are indicated by CxHyOz and CxHyN1,2Oz, respectively. (a–d) The solid black lines indicate the total signals of STGs, with the green and yellow areas marking the contributions of CxHyOz and CxHyN1,2Oz to the STGs, respectively. The gray-striped areas represent the differences in STGs between fresh and RTC stages. The color bands on the abscissa indicate volatility classes. Note that we presented the STGs of RTC stages after accounting for changes in the average VFR (VFRavg) between fresh and RTC stages during the FIGAERO sample time.
3.2 PMF of SOA particles
In the following sections, we present the independent PMF analysis results for the CHO compounds and ONs. The integrated mass spectra showing the overall composition for each particle sample are presented in the Supplement.

Figure 3Factor thermograms of the five sample factors from the 12-factor PMF solution of CHO compounds in α-pinene SOA particles that were formed under low NOx (a) and high NOx (b) conditions in the OFR. In addition, thermograms of the sum of ONs (sum of NF1–3) are shown as purple areas in panel (b). In both panels, the ranges of different volatility classes are highlighted as color bands on the abscissa.
Table 2Summary of CHO factors in the α-pinene SOA particle formed under low NOx and high NOx conditions in the OFR.
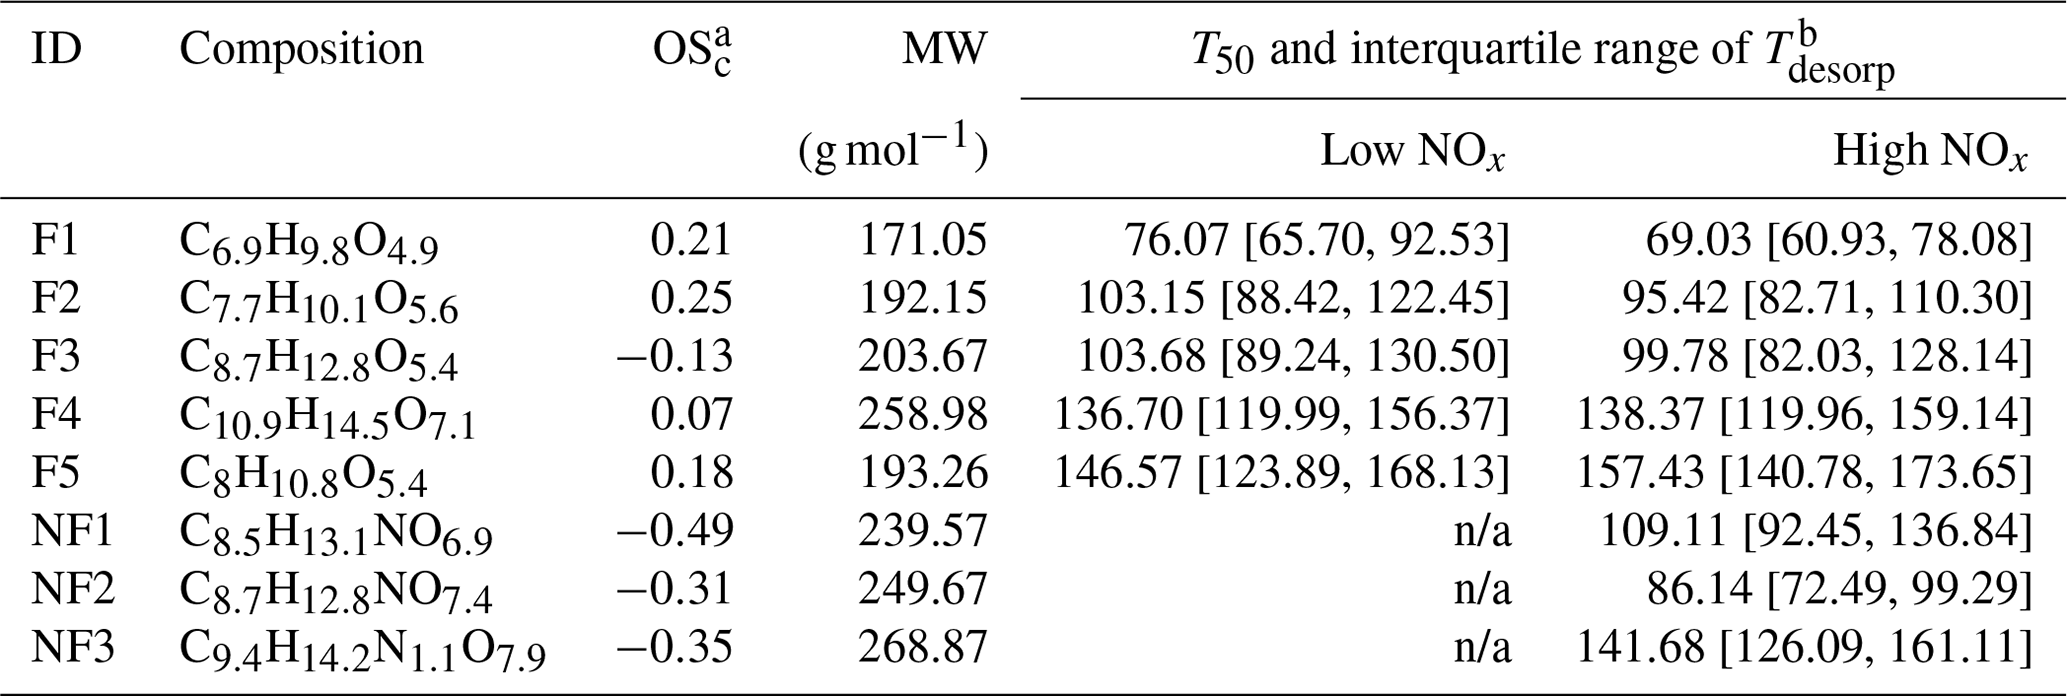
a Values of OSc for NF1–3 were calculated under the assumption that all nitrogen existed in the form of alkyl nitrates (Priestley et al., 2021). b Values of T50 and the interquartile range of Tdesorp were determined with the low RH and fresh samples. Note: n/a is not applicable.
3.2.1 Characterization of CHO compounds
As shown in Fig. 3, five sample factors (i.e., F1–5) were identified for CHO compounds. Ratios between sample factors changed when NOx was present during SOA formation in the OFR. Compared with CHO factors in the high NOx samples, overall the ONs (in purple; sum of the sample factors of the ON data set; see Sect. 3.2.2) spanned a volatility range similar to F2 and F3. Note that small amounts of ONs were observed in the low NOx sample with a signal contribution of 2 % or less to the particle sample. This was probably caused by small contaminations of the OFR system with N2O from the preceding high NOx experiments. All CHO factors, except F4, mainly consisted of compounds with a molecular weight (MW) of less than 250 Da and with Cnum of 10 or less (Fig. 4). For the factors F1–4, the factor volatility, which is indicated by the T50 values (Table 2), exhibited stronger dependence on the signal-weighted MW rather than the signal-weighted OSc. Moreover, contributions of compounds with Cnum of 10 or more to the factor spectra become more important with increased values of T50. Since the increase in oxygen and hydrogen atoms counterbalances the simultaneous extension of carbon backbones, OSc does not reflect the effect of MW on the factor volatility in this case. Even though F5 is the least-volatile sample factor, the range of MW and Cnum of the compounds grouped into F5 was very similar to that of F2. The combination of high T50 and the dominance of compounds with Cnum of 10 or less in F5 very likely suggests that these compounds are largely the products from the thermal decomposition of (extremely) low volatility parent compounds during the FIGAERO desorption. During a FIGAERO desorption cycle, a thermally labile compound starts to decompose into smaller compounds at desorption temperatures that are above its threshold temperature of decomposition. When the desorption temperature increases, thermal decomposition is enhanced, and more signal is detected for the decomposition products. For F5 specifically, the position of its T50 depends on the balance between the increasing decomposition and the availability of the decomposing compounds. Thus, the T50 value only provides a general idea about the temperature range in which the thermal decomposition of the compounds grouped into the F5 occurs. The thermal decomposition very likely happens at temperatures below the (theoretical) desorption temperature of the parent compounds. Thus, we can only obtain an apparent volatility with the use of the T50 value of F5.

Figure 4Normalized factor mass spectra of the five sample factors from the 12-factor PMF solution of CHO compounds in α-pinene SOA particles that were formed under two NOx conditions in the OFR. For readability, C10HyOz ions are shown as negative values. For each factor mass spectrum, its signal-weighted molecular composition, molecular weight (MW), and oxidation state (OSc) are shown on the right. Right next to each factor label, the squares are shown in the same color scheme as the factor thermograms in Fig. 3 to indicate different sample factors. The blue dashed line indicates the average MW of each factor.
3.2.2 Characterization of ONs
We identified three sample factors (i.e., NF1–3) from the ONs, as shown in Fig. 5 and described in Table 2. While NF1–3 only occurred in the high NOx samples, an additional sample factor was found in the low NOx ones. The formation of this unique sample factor in the low NOx samples was possibly due to the very small amount of NOx being formed in the low NOx experiments. Since the total contribution of the ONs in the low NOx samples was no more than 2 %, we here only focus on the analysis of the high NOx samples, of which up to 20 % of particle mass were attributed to ONs (Table 1). Accounting for the nitrogen content of ONs, we calculated the OSc (i.e., of each nitrogen-containing compound under the assumption that all nitrogen existed in the form of alkyl nitrates (Priestley et al., 2021). While NF2 and NF3 appeared under all conditions, the contribution of NF1 to particle samples became significant only in the high RH samples (Fig. 5a), suggesting that the formation pathway of NF1 was different from the other two ON factors. All the mass spectra of NF1–3 were dominated by compounds with Cnum of 10 or less, although noticeable amounts of compounds with Cnum>10 were observed in NF3 (Fig. 5b), consistent with its overall high value of T50, suggesting the lowest volatility among the ON factors.
3.3 Effect of NOx on the α-pinene SOA formation
The signal contributions of CHO sample factors to the total sum of organics were compared between low NOx (in gray) and high NOx cases (in orange) in Fig. 6a. Here, only the low RH particle samples collected at the fresh stages were chosen for analysis, as they were subject to the least amount of isothermal evaporation during the FIGAERO sample collection. Substantially large differences in the signal contributions were observed for multiple sample factors. Under low NOx conditions, F1, F2, and F5 were the three major factors. For the high NOx samples, F3 was the dominant factor, followed by approximately equal contributions from the other factors. Small but noticeable differences in the factor contributions were observed for F4 between the two NOx conditions. The observed difference in the factor mass contribution between the investigated particle samples could be induced by the enhancement or suppression of formation pathways for certain compounds (Kroll and Seinfeld, 2008) and/or the gas–particle equilibrium partitioning which follows Raoult's law (Donahue et al., 2006).
The total mass concentration in gas and particle phase for each sample factor (Gk+Pk) (see Sect. S1.3 for more details of the estimation) is shown in Fig. 6b. The addition of NOx during SOA formation inside the OFR decreased the production (i.e., the sum of gas and particle mass concentrations) of the compounds grouped into F1, F2, and F5, and increased the production of ONs. Therefore, changes in their individual contributions to the high NOx sample were primarily caused by the effect of NOx on the formation of the compounds in these factor groups. Furthermore, it should be noted that, for F3 and F4, their individual productions were comparable between the low NOx and high NOx cases. Thus, in comparison with the low NOx sample, the enhanced contributions of F3 and F4 to the high NOx sample were most likely due to the decreased contributions of other factors in the particle phase.
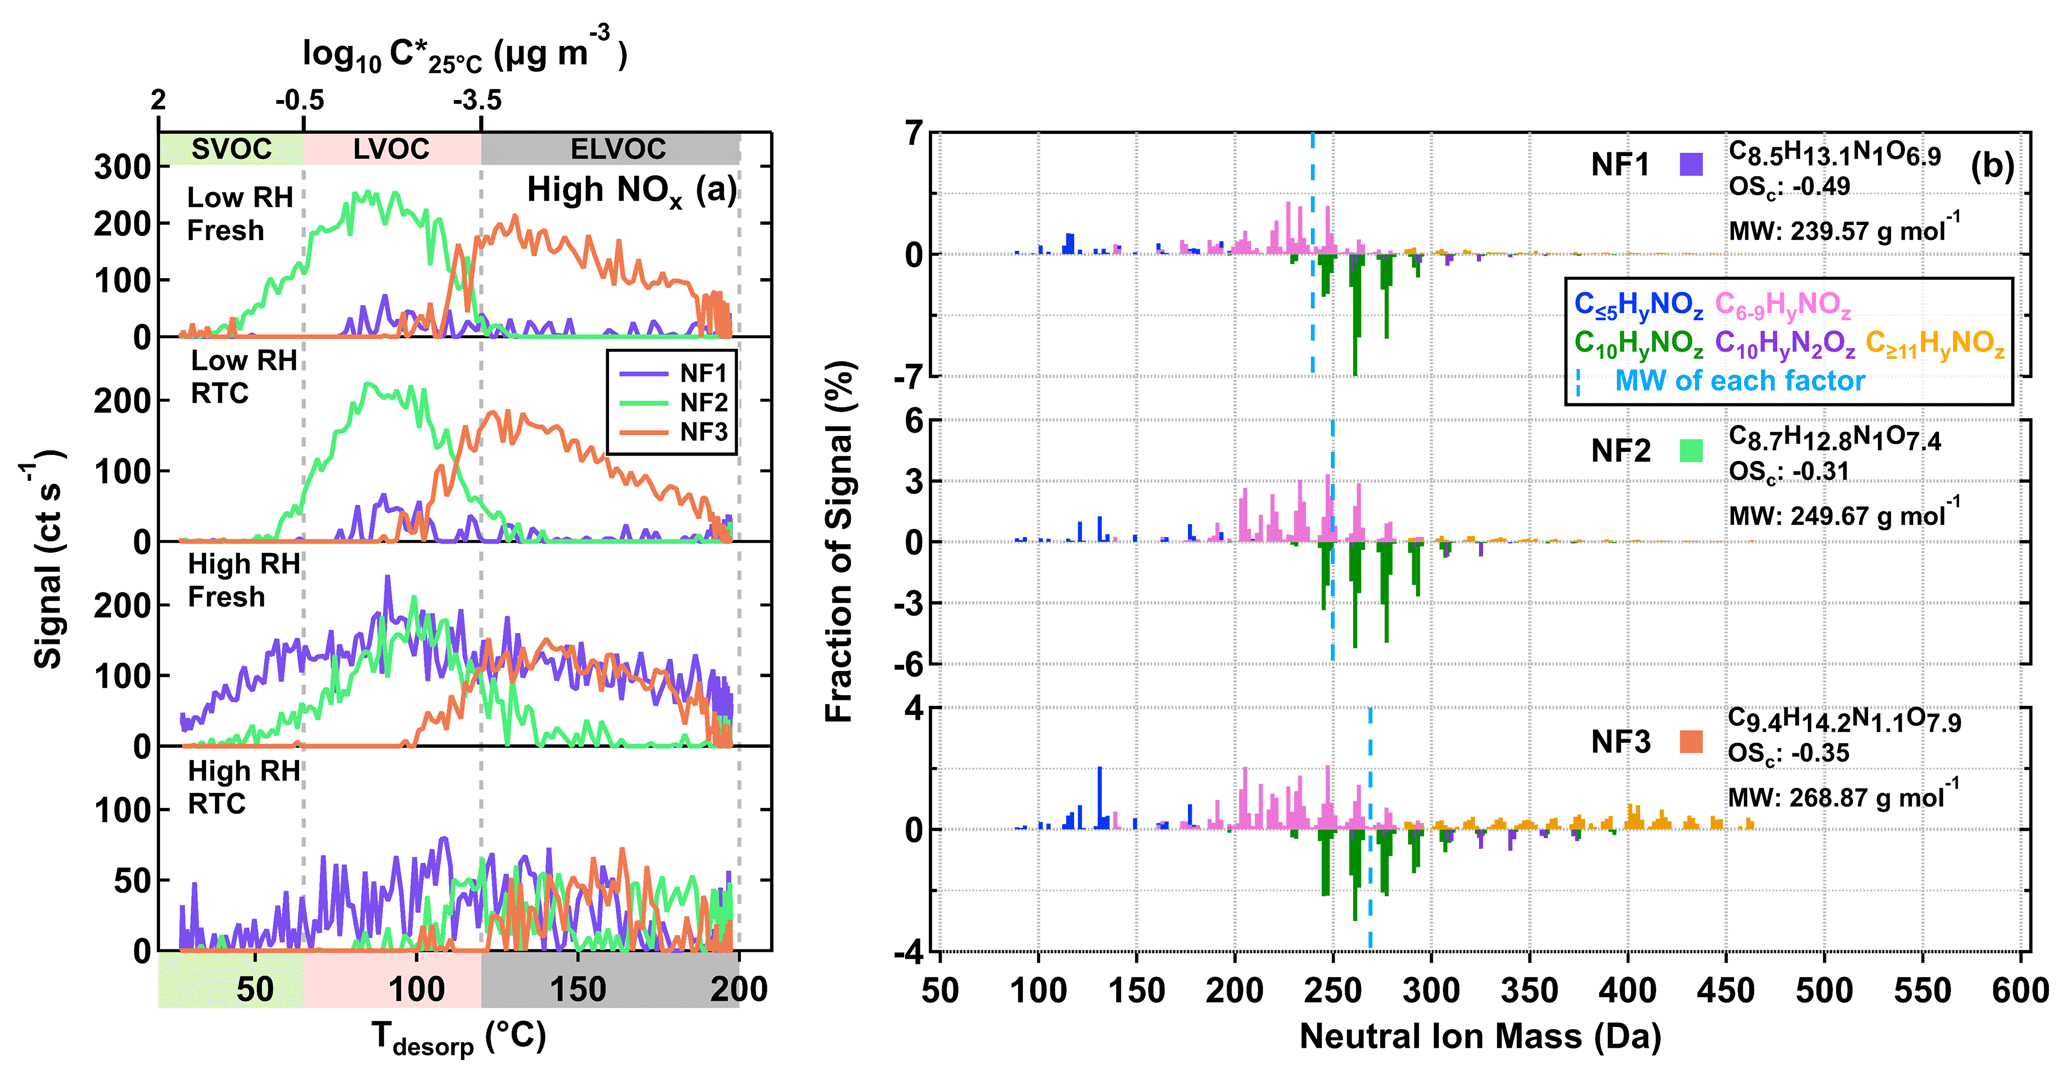
Figure 5Factor thermograms (a) and normalized mass spectra (b) for the three sample factors from the eight-factor solution of ONs in the α-pinene SOA particles that were formed under high NOx conditions in the OFR. (a) The ranges of different volatility classes are indicated in color bands on the abscissa. In panel (b), the bottom portion of each mass spectra represents C10HyN1,2Oz. The signal-weighted molecular composition, molecular weight (MW), and oxidation state (OSc) for each factor are shown on the right. Right next to each factor label in panel (b), the squares are shown in the same color scheme as the factor thermograms in panel (a) to identify different sample factors. The blue dashed line indicates the average MW of each factor.
Note that the total mass concentration estimated in Eq. (S2) was under the assumption of the gas–particle equilibrium during the timescale of the OFR. Since particles were always produced at 40 % RH, where negligible kinetic limitation exists, equilibrium should be reached between the gas and particle phase during the minutes of residence in the OFR (Li and Shiraiwa, 2019). Another caveat to the discussion above is the potential occurrence of particle-phase reactions during SOA formation inside the OFR. Many of these reactions can be acid-catalyzed. Note that HNO3 is formed as a byproduct when using N2O to generate NOx in the OFR (Lambe et al., 2017). Due to the lack of a direct gaseous HNO3 measurement, we used the KinSim model to estimate the concentration of gaseous HNO3 produced under high NOx conditions in the OFR. The gaseous HNO3 concentration was estimated to be 927 ppb. Based on the coefficient for partitioning of gaseous HNO3 to SOA described by Ranney and Ziemann (2016), the estimated particulate nitrate (i.e., ) concentration is 0.20 µg m−3 for the polydisperse SOA (139±29 µg m−3) that was formed under the high NOx condition in the OFR. With a similar gaseous concentration of HNO3 (∼1 ppm), Ranney and Ziemann (2016) observed 7.5 µg m−3 particulate nitrate in the presence of 3000 µg m−3 dry SOA that was formed from n-pentadecane with OH radicals. They also found that, under such condition, 40 % of the cyclic hemiacetals in the SOA can undergo particle-phase dehydration within 3 h, with a dehydration rate constant (kd) of 0.25 h−1. Note that the α-pinene SOAs in our study are highly oxidized and thus exhibit much higher polarity than the n-pentadecane SOA. It is likely that the kd for the hemiacetals in the α-pinene SOA in our study is several orders of magnitude smaller than the value reported for the cyclic hemiacetals in the n-pentadecane SOA (Ranney and Ziemann, 2016). For non-catalyzed reactions, their reaction rates depend on their own reaction rate constants in addition to both gas vapor concentration and condensation rate (Peng and Jimenez, 2020). Since information on the kinetics of non-catalyzed reactions is still rare, their importance for the SOA formation in the OFR is difficult to estimate.

Figure 6Signal contributions of sample factors to their total sum (a) and the corresponding estimated mass concentrations in the gas and particle phase (b) for α-pinene SOA particles that were formed under low NOx and high NOx conditions in the OFR and evaporated under the low RH and fresh condition. Note that here ON indicates the sum of the ON sample factors. The fraction is calculated by normalizing the measured sum from a PMF sample factor to the total sum of sample factors in the low RH and fresh samples under low NOx and high NOx conditions.
3.4 Evolution of PMF factors during isothermal evaporation
By coupling the sample factor contributions from the FIGAERO measurement with changes in the VFRavg retrieved from the SMPS measurements during isothermal evaporation, we are able to derive the net change ratio (NCR) to evaluate the net transformation (i.e., material loss vs. production) of individual sample factors during isothermal evaporation (Li et al., 2021). Each factor in each particle sample is compared to its reference case (i.e., its contribution in the low RH and fresh condition). If a low volatility factor simply remains in the particle phase (i.e., no change) or the formation and removal processes are equal to each other (i.e., no net change), then NCR is equal to 1. NCR values >1 mean that the contribution of the factor increases due to an actual formation process. NCR values <1 indicate that the contribution of the factor decreases either due to evaporation or because the compounds grouped into this factor were consumed in particle-phase reactions. To determine if evaporation is the likely cause for the change, we use the characteristic desorption temperature (characteristic Tdesorp) of the factor which is the desorption temperature at which 25 %, 50 %, and 75 % of the factor thermogram signal is reached. This measure gives a deeper insight into the shape of the thermogram than just using T50 and is a better representation of the volatility range of a factor.
3.4.1 NCR of CHO compounds
The changes in NCR were minor in the low RH samples for most sample factors (Fig. 7b), which is consistent with the small change in VFR (Fig. 1), STGs (Fig. 2a–d), and particle composition (Fig. 3). Only F1, the sample factor with the lowest characteristic Tdesorp (Fig. 7a), displayed a different trend between the low NOx and high NOx cases, with a decrease in the NCR in the low NOx sample but almost no change in the high NOx one (Fig. 7b). The NCR of ONs (i.e., sum of NF1–3) decreased with isothermal evaporation under low RH conditions. Loss due to evaporation seems to be unlikely, as they spanned a volatility range from LVOCs to ELVOCs. It is possible that, when ONs were able to decompose into HNO3 and CHO products during isothermal evaporation, the remaining organics might still be retained in the low RH particle samples due to high particle viscosity and possibly contributed to F1 in the high NOx sample.

Figure 7Volatility and changes in factor contribution for the five CHO and three ON sample factors and total ONs (sum of ON sample factors). (a) Characteristic desorption temperature (characteristic Tdesorp). The marker indicates the T50 values, and the horizontal lines mark the interquartile range of the factor thermograms. (b) Net change ratio (NCR) with error bars indicating the uncertainty stemming from the estimated range in molecular weight and particle density. (c) Average volume fraction remaining during sample collection (VFRavg), with error bars indicating the minimum and maximum values. In all panels, the values for the high NOx case are shown with colored markers, while the low NOx ones are displayed in gray. The colors indicate the sample type. The order of samples is identical for the low NOx and high NOx data. (a) The range of volatility classes is highlighted with background colors. (b) The dashed line at NCR equal to 1 indicates that any loss is counterbalanced by production or that no change occurs. The two dotted lines at NCR equal to 0.5 and 2 represent significant net loss and production. For F1, its factor thermogram contributes less than 5 % to the total sample signal and does not show a clear maximum under the high RH and RTC condition. Therefore, its characteristic Tdesorp value was not estimated in panel (a), and its NCR was be indicated by a cross close to the 0.1 in panel (b).
When particulate water was present, i.e., under high RH conditions, the evolution of NCR became more complex. F1 already showed a lower value of NCR at the fresh stage compared to the low RH conditions, and it was no longer present in the particle after isothermal evaporation in the RTC (indicated by cross symbols in Fig. 7b). As the volatility of F1 was high enough to allow significant evaporation within 4.25 h, its decreasing NCR can still be primarily caused by evaporation. Similar to the case of F1, F2 and F4 also showed lower values of NCR in the presence of water as compared to the low RH conditions. Contrary to the low RH conditions, a clear decreasing trend in the NCR of these factors with decreasing VFRavg was already observed under high RH conditions at the fresh stage. Since little evaporation is expected for compounds in the volatility range of LVOCs and ELVOCs to which F2 and F4 were assigned (Li et al., 2019), there must be another mechanism (i.e., aqueous-phase processes) primarily driving the loss of these compounds at the fresh stage with a timescale of the order of minutes. With increasing evaporation time at high RH, the evolution pattern of the NCR for either F2 or F4 differed between the two SOA types. In the high NOx case, the NCR values of F2 and F4 further decreased with evaporation time, which suggests that the material loss mechanism continued as the dominant pathway controlling their evolution during isothermal evaporation. In the low NOx case, however, their NCR values showed an increasing trend during isothermal evaporation, indicating that the chemical production of the grouped compounds outweighed the loss pathway at this stage. Although the NCR trends of F2 were different between the low NOx and high NOx cases under high RH conditions, the characteristic Tdesorp increased in both cases (Fig. 7a). Such an increase was interpreted as an indication for aqueous-phase chemistry in a previous study (Buchholz et al., 2020). This may indicate that, for both cases, the presence of particulate water was crucial, but the extent or speed of the transformation varied.
When investigating F3 at high RH, the change in its NCR was dependent on the NOx condition during SOA formation. Already for the fresh stage at high RH, the NCR of F3 showed a pronounced increase and became much larger than 1 in the low NOx case. However, the NCR of F3 stayed more or less at 1 in the high NOx case. As F3 falls in the range of LVOCs and ELVOCs (similar to F2), only a little evaporation is expected within the time span of that case (average tR=0.25 h; Li et al., 2019). Consequently, there must be an efficient production pathway, under the high RH condition, that contributes to compounds assigned to F3 already at the fresh stage. The corresponding thermograms (red in Fig. 3; third row) are alike in the low NOx and high NOx cases, suggesting that this production had occurred in both samples but was more dependent on particulate water in the low NOx sample than in the high NOx one. A small but noticeable decrease due to isothermal evaporation is expected for compounds within the range of LVOCs for the timescale of 4.5 h (Li et al., 2019). When the low NOx particles continued to evaporate at high RH, the NCR of F3 indeed decreased. Considering the change in its factor thermogram shape (Fig. 3a) and the minor shift in its characteristic Tdesorp (Fig. 7a) in the low NOx case at high RH, it is very likely that the decrease in the NCR of F3 during isothermal evaporation was mostly driven by the evaporation of its volatile content with high C∗. In the high NOx samples, on the other hand, the NCR of F3 barely changed with evaporation time, even under high RH. In this case, there must be a production pathway, which compensated for the material loss for F3 in the high NOx sample.
Unlike the low RH conditions, F5 already showed noticeable changes in its NCR at the fresh stage under high RH condition. Since little evaporation was expected for compounds in the ELVOC range in the time span of hours (Li et al., 2019), the observed changes in the NCR of F5 in either NOx case would suggest the existence of aqueous-phase processes already at the fresh stage. Similar to F3, the evolution of F5 with increasing evaporation also varied between the two particle types at high RH. With a decreasing VFRavg (i.e., increasing isothermal evaporation), F5 showed a decrease in its NCR in the low NOx samples but exhibited an increase in its NCR in the high NOx ones. Such different evolution trends of the NCR of F5 between the two NOx levels at high RH indicate that the competition between production and loss reactions in the aqueous phase varied with the SOA formation conditions.
3.4.2 NCR of ONs
Already under low RH conditions, decreasing values of NCR were observed for NF2 and NF3 after isothermal evaporation in the RTC. As some compounds grouped into NF2 desorbed in the SVOC range (Fig. 5a; first and second rows), loss due to evaporation is a possible explanation for the behavior of NF2. However, the volatility of NF3 was in the ELVOC range, and so little evaporation is expected, even under high RH (Li et al., 2019). Thus, the decreasing NCR for NF3 under low RH conditions can possibly be attributed to the chemical decomposition of the ONs. When particles were conditioned to RH below 10 % in the low RH experiments, it is possible that a small amount of water was retained in the particle phase (Ghorai et al., 2011; Lin et al., 2021) and available for catalyzing the decomposition of organic nitrates. Due to the diffusion limitations caused by high particle viscosity under low RH conditions, some of the remaining organics after the decomposition of NF3 might stay in the samples and be grouped into any of the CHO factors. As the CHO factor F1 was in the volatility range between SVOCs and LVOCs, moderate evaporation could still take place in the timescale of 4.25 h, even when the particle viscosity is high (Li et al., 2019). Therefore, the negligible change in the NCR of F1 (Fig. 7b; red) cannot be explained without considering the additional formation of compounds (i.e., products from the decomposition of NF2 and/or NF3).
When large amounts of particulate water were present, the NCR values of NF1–3 distinctly changed with increasing evaporation. While NF1 displayed a significant increase in its NCR at the fresh stage under high RH conditions, NF2 and NF3 showed notable decreases in their NCR. Since both NF2 and NF3 belonged to the LVOC and ELVOC ranges, very minor evaporation would be expected for them within the average timescale of 0.25 h at the fresh stage (Li et al., 2019). Thus, the pronounced reductions in their NCR were mostly driven by aqueous-phase processes. When SOA particles continued to evaporate in the timescale of 4.25 h at high RH, compounds within the range of SVOCs could possibly be removed by evaporation due to their high C∗ values. However, significant removal primarily due to evaporation would not be expected for those compounds in the range of LVOCs and ELVOCs (Li et al., 2019), unless other loss mechanisms (i.e., aqueous-phase process) exist.
3.4.3 Possible aqueous-phase processes affecting NCR of CHO compounds and ONs
When compounds dissociate (here, they mostly hydrolyze) into smaller molecules, the products of this process can either evaporate from or stay in the particle phase and possibly participate in further reactions with other molecules. Note that products that evaporate do not contribute anymore to any of the factors. Linking two or more molecules via chemical bonds (accretion reactions) produces larger compounds of lower volatility which are less likely to evaporate. These products can undergo further reactions with increasing isothermal evaporation time, especially in the presence of water. Note that if they have sufficiently low volatility, newly formed compounds from aqueous-phase processes will remain in the particle phase and contribute to other factors.
In the high NOx samples, only decreasing or constant NCR values were observed for factors F2–F5 at the fresh stage under high RH conditions. The formation pathways for products grouping into F3 and F5 are minor, since there was no increase in either of their NCR values. This additionally suggests that the reactions consuming F2 and F4 are mostly hydrolysis-type processes and create products that do not remain in the particle phase. This formation of more volatile compounds may increase the observed isothermal evaporation of the particles. Under the same condition, NF2 and NF3 showed decreasing NCR values, but NF1 exhibited an increase in its NCR. Even though the NCR of NF2 and NF3 also showed a decreasing trend with increasing evaporation at the RTC stage under low RH conditions, we did not observe any production of compounds grouped into NF1 (Fig. 5a) or an increase in its NCR (Fig. 7b). One explanation for the difference in the NCR of NF1 could be that the functional groups involved in the decomposition process vary between the two evaporation stages (low RH and RTC, vs. high RH and fresh). As the ONs produced in the OFR are multifunctional, hydrolysis is not necessarily restricted to the nitrate groups under high RH conditions. Other functional groups like peroxides and esters can undergo hydrolysis as well. Compounds in NF1 could be products from the decomposition of NF2 and NF3. It is also possible that compounds in NF1 could be formed via the nitration of alcohols in the presence of HNO3 (Wang et al., 2021). While alcohols could be from CHO sample factors (e.g., F2, F4, and F5) that displayed decreasing NCR values, HNO3 could be produced from the decomposition of NF2 and NF3 or already be present in the particles from uptake during the SOA formation in the OFR under high NOx conditions.
In the low NOx case, we observed factors with increasing NCR (F3 and F5) and with decreasing NCR (F2 and F4) when RH increased. It is likely that the particle-phase reactions involving compounds in F2 and/or F4 result in low volatility products contributed to F3 and F5. Hence, accretion-type reactions must be the dominant pathway for this SOA type. Products from such accretion reactions could have sufficiently low volatility and slow down the particle evaporation, possibly resulting in the slightly larger VFRavg in the low NOx case (Fig. 7c). One possible type of accretion reaction could be the Baeyer–Villiger reaction of peroxides (e.g., peroxycarboxylic acid and hydroperoxide; Lim and Turpin, 2015; Claflin et al., 2018), which are expected to be relatively more abundant for the low NOx samples, of which RO2 + HO2 reactions were favored during SOA formation, compared to the high NOx samples (Ziemann and Atkinson, 2012; Peng and Jimenez, 2020). Note that RO2 + HO2 reactions can also lead to the production of carboxylic acids. Although we cannot rule out the occurrence of Fischer esterification requiring carboxylic acids, such a reaction could not be observed even in extremely acidic particles for the relevant timescales of hours (Birdsall et al., 2013; Kristensen et al., 2014).
When particles continued to evaporate in the RTC under high RH conditions, there were again differences in the evolution of F2–F5 for low NOx and high NOx conditions. While F2 and F4 experienced increases in their NCR in the low NOx samples, these two factors displayed continuous decreases in their NCR in the high NOx ones. For the three ON factors in the high NOx samples, they consistently showed decreasing NCR values and also exhibited more significant decreases in their NCR values as compared with most of the CHO factors. As a majority of compounds in each ON factor were desorbed in the volatility range of LVOCs and ELVOCs, their decreasing NCR values were highly likely caused by aqueous-phase process instead of evaporation. Very likely, hydrolysis and accretion were the underlying reactions for the high NOx case, and those resultant products of sufficient low volatility possibly contributed to the constant and increasing NCR values of F3 and F5. For the high NOx samples, the important role of accretion at the RTC stage, but not at the fresh stage, might indicate the timescale required for such reaction to be of the order of hours. Kinetic measurements have suggested that, while the peroxy hemiacetal formation involving peroxides and carbonyls has a timescale from 1 min to 2 h, the formation of hemiacetal from reactions between alcohol and carbonyls is at least 1 order of magnitude slower (i.e., timescale of 10 h; Ziemann and Atkinson, 2012). Furthermore, the increasing NCR of F2 and F4 in the low NOx case was driven by the net production of compounds. This was likely attributed to the decomposition of compounds with short lifetime (e.g., acyl peroxy hemiacetals and peroxy hemiacetals), originally (i.e., at the fresh stage) grouped into F3 and F5 (Claflin et al., 2018). Figure S13 shows a graphical representation of the described processes occurring during the isothermal evaporation of α-pinene SOA particles under two high RH evaporation stages (fresh vs. RTC).
Many studies have focused on the impact of NOx on the aerosol yield in addition to gaseous and particulate products during SOA formation (Zhao et al., 2018; Pullinen et al., 2020). Our study is one of the few studies providing molecular-level information about particle-phase processes in SOA that were formed in the presence of NOx. We examined the changes in volume and molecular composition of α-pinene SOA particles that were formed under low NOx and high NOx conditions during isothermal evaporation.
In the high NOx case, up to 20 wt % of the particle-phase material could be attributed to ONs. In general, ONs showed approximately 5 ∘C lower T50 and slightly higher volatility compared to CHO compounds in the high NOx samples. Although the signal contribution of ONs differed between the SOA particles that were formed under low NOx and high NOx conditions in the OFR, the overall particle volatility derived from isothermal evaporation and from FIGAERO-CIMS measurements was very similar for the two SOA types. Applying PMF to analyze the FIGAERO-CIMS thermal desorption data revealed distinct differences in the initial composition of both the particle and gas phase of the two SOA types for the CHO compounds. These observations may be explained by the fact that the effect of high NOx concentrations during the oxidation of α-pinene goes beyond the formation of ONs. High NOx concentrations could also suppress the formation of organic compounds (e.g., peroxide-containing compounds) from the RO2 + HO2 reaction pathways. Apart from competing with RO2 + HO2 reactions, recent work suggests that, with increased NOx emissions, the RO2 + NO pathway can also surpass autoxidation reactions during the photooxidation of α-pinene and thus decrease the yield of highly oxygenated molecules (HOMs; Pye et al., 2019). The majority of them partition into the particle phase due to their low volatilities (Mutzel et al., 2015). This change in HOM formation will both decrease the aerosol yield and change the composition of the formed SOA. HOMs often contain multiple peroxide functional groups (Bianchi et al., 2019). Thus, a reduction in HOM production will further lower the overall peroxide content of SOA particles together with the suppression of RO2 + HO2 reactions under high NOx conditions.
At higher RH, both SOA types exhibited faster particle evaporation rates and lost a larger fraction of materials as compared to low RH conditions. This agrees with previous studies showing that higher RH enhances particle evaporation (Yli-Juuti et al., 2017; Buchholz et al., 2019; Li et al., 2019). But, in our study, we find that although the enhancement in isothermal evaporation was similar for both SOA types, the dominant aqueous-phase processes occurring in the particle phase were indeed different. That is, the differences in the initial particle composition (e.g., the lower peroxide content for the high NOx conditions) led to different chemical reactions occurring in the particle phase when particulate water was present. Many of the compounds involved in the aqueous-phase processes were of low or extremely low volatility and hence did not evaporate in the RTC within the average experimental timescale of 4.25 h. This suggests that the observed process-level differences are potentially important for the fate of individual organic molecules in the particle phase, but their impact on overall particle volatility under ambient conditions might be negligible.
Interactions of BVOC emissions with high concentrations of NOx are especially relevant in suburban areas. In such environments, the particle composition and aqueous-phase processes may be different from those found in low NOx environments, for instance, in pristine forest areas where particulate samples should have higher peroxide contents (Surratt et al., 2006). In addition, particulate ON is highly prevalent in suburban areas, contributing on average 21 % of non-refractory submicron particulate matter in mass (Kiendler-Scharr et al., 2016). ON can have sufficiently low volatility to remain in the particle phase. On the other hand, ON is effectively water labile and very likely undergoes hydrolysis at the atmospheric-relevant RH (>40 %). Therefore, ON which has low volatility can still be removed from the particle phase when being hydrolyzed into smaller products that have higher volatility. As our findings are limited to the aqueous-phase process in α-pinene SOA particles, future studies on other BVOC systems and even emissions from urban vegetation are needed to estimate the overall importance of these processes and how they may affect other physicochemical properties of SOA particles.
The data set is available upon request from Annele Virtanen (annele.virtanen@uef.fi).
The supplement related to this article is available online at: https://doi.org/10.5194/acp-23-203-2023-supplement.
ZL, AB, and AV designed the study. ZL, AB, LMFB, AY, and LH carried out laboratory experiments. ZL, AB, LH, IP, SS, and AV performed the data analysis and did the interpretation. ZL wrote the paper, with contributions from all co-authors.
The contact author has declared that none of the authors has any competing interests.
Publisher’s note: Copernicus Publications remains neutral with regard to jurisdictional claims in published maps and institutional affiliations.
The authors would like to thank Taina Yli-Juuti, for the helpful discussion on the use of the liquid-like evaporation model.
This research has been supported by the European Research Council, FP7 Ideas: European Research Council (QAPPA; grant no. 335478), the Academy of Finland (grant nos. 299544, 310682, 307331, and 317373), and the Itä-Suomen Yliopisto (doctoral program in Environmental Physics, Health, and Biology).
This paper was edited by Nga Lee Ng and reviewed by Andrew Lambe and one anonymous referee.
Barreira, L. M. F., Ylisirniö, A., Pullinen, I., Buchholz, A., Li, Z., Lipp, H., Junninen, H., Hõrrak, U., Noe, S. M., Krasnova, A., Krasnov, D., Kask, K., Talts, E., Niinemets, Ü., Ruiz-Jimenez, J., and Schobesberger, S.: The importance of sesquiterpene oxidation products for secondary organic aerosol formation in a springtime hemiboreal forest, Atmos. Chem. Phys., 21, 11781–11800, https://doi.org/10.5194/acp-21-11781-2021, 2021.
Bianchi, F., Kurten, T., Riva, M., Mohr, C., Rissanen, M. P., Roldin, P., Berndt, T., Crounse, J. D., Wennberg, P. O., Mentel, T. F., Wildt, J., Junninen, H., Jokinen, T., Kulmala, M., Worsnop, D. R., Thornton, J. A., Donahue, N., Kjaergaard, H. G., and Ehn, M.: Highly oxygenated organic molecules (HOM) from gas-phase autoxidation involving peroxy radicals: A key contributor to atmospheric aerosol, Chem. Rev., 119, 3472–3509, https://doi.org/10.1021/acs.chemrev.8b00395, 2019.
Birdsall, A. W., Zentner, C. A., and Elrod, M. J.: Study of the kinetics and equilibria of the oligomerization reactions of 2-methylglyceric acid, Atmos. Chem. Phys., 13, 3097–3109, https://doi.org/10.5194/acp-13-3097-2013, 2013.
Buchholz, A., Lambe, A. T., Ylisirniö, A., Li, Z., Tikkanen, O.-P., Faiola, C., Kari, E., Hao, L., Luoma, O., Huang, W., Mohr, C., Worsnop, D. R., Nizkorodov, S. A., Yli-Juuti, T., Schobesberger, S., and Virtanen, A.: Insights into the O : C-dependent mechanisms controlling the evaporation of α-pinene secondary organic aerosol particles, Atmos. Chem. Phys., 19, 4061–4073, https://doi.org/10.5194/acp-19-4061-2019, 2019.
Buchholz, A., Ylisirniö, A., Huang, W., Mohr, C., Canagaratna, M., Worsnop, D. R., Schobesberger, S., and Virtanen, A.: Deconvolution of FIGAERO–CIMS thermal desorption profiles using positive matrix factorisation to identify chemical and physical processes during particle evaporation, Atmos. Chem. Phys., 20, 7693–7716, https://doi.org/10.5194/acp-20-7693-2020, 2020.
Canagaratna, M. R., Jimenez, J. L., Kroll, J. H., Chen, Q., Kessler, S. H., Massoli, P., Hildebrandt Ruiz, L., Fortner, E., Williams, L. R., Wilson, K. R., Surratt, J. D., Donahue, N. M., Jayne, J. T., and Worsnop, D. R.: Elemental ratio measurements of organic compounds using aerosol mass spectrometry: characterization, improved calibration, and implications, Atmos. Chem. Phys., 15, 253–272, https://doi.org/10.5194/acp-15-253-2015, 2015.
Claflin, M. S., Krechmer, J. E., Hu, W., Jimenez, J. L., and Ziemann, P. J.: Functional group composition of secondary organic aerosol formed from ozonolysis of á-pinene under high VOC and autoxidation conditions, ACS Earth Space Chem., 2, 1196–1210, 2018.
D'Ambro, E. L., Lee, B. H., Liu, J., Shilling, J. E., Gaston, C. J., Lopez-Hilfiker, F. D., Schobesberger, S., Zaveri, R. A., Mohr, C., Lutz, A., Zhang, Z., Gold, A., Surratt, J. D., Rivera-Rios, J. C., Keutsch, F. N., and Thornton, J. A.: Molecular composition and volatility of isoprene photochemical oxidation secondary organic aerosol under low- and high-NOx conditions, Atmos. Chem. Phys., 17, 159–174, https://doi.org/10.5194/acp-17-159-2017, 2017.
D'Ambro, E. L., Schobesberger, S., Zaveri, R. A., Shilling, J. E., Lee, B. H., Lopez-Hilfiker, F. D., Mohr, C., and Thornton, J. A.: Isothermal evaporation of á-Pinene ozonolysis SOA: Volatility, phase state, and oligomeric composition, ACS Earth Space Chem., 2, 1058–1067, https://doi.org/10.1021/acsearthspacechem.8b00084, 2018.
Donahue, N. M., Robinson, A. L., Stanier, C. O., and Pandis, S. N.: Coupled partitioning, dilution, and chemical aging of semivolatile organics, Environ. Sci. Technol., 40, 2635–2643, https://doi.org/10.1021/es052297c, 2006.
Donahue, N. M., Kroll, J. H., Pandis, S. N., and Robinson, A. L.: A two-dimensional volatility basis set – Part 2: Diagnostics of organic-aerosol evolution, Atmos. Chem. Phys., 12, 615–634, https://doi.org/10.5194/acp-12-615-2012, 2012.
Duncan, B. N., Lamsal, L. N., Thompson, A. M., Yoshida, Y., Lu, Z., Streets, D. G., Hurwitz, M. M., and Pickering, K. E.: A space based, high resolution view of notable changes in urban NOx pollution around the world (2005–2014), J. Geophys. Res.-Atmos., 121, 976–996, 2016.
Ehn, M., Thornton, J. A., Kleist, E., Sipila, M., Junninen, H., Pullinen, I., Springer, M., Rubach, F., Tillmann, R., Lee, B., Lopez-Hilfiker, F., Andres, S., Acir, I. H., Rissanen, M., Jokinen, T., Schobesberger, S., Kangasluoma, J., Kontkanen, J., Nieminen, T., Kurten, T., Nielsen, L. B., Jorgensen, S., Kjaergaard, H. G., Canagaratna, M., Maso, M. D., Berndt, T., Petaja, T., Wahner, A., Kerminen, V. M., Kulmala, M., Worsnop, D. R., Wildt, J., and Mentel, T. F.: A large source of low-volatility secondary organic aerosol, Nature, 506, 476–479, https://doi.org/10.1038/nature13032, 2014.
Francisco, M. A. and Krylowski, J.: Chemistry of organic nitrates: Thermal chemistry of linear and branched organic nitrates, Ind. Eng. Chem. Res., 44, 5439–5446, https://doi.org/10.1021/ie049380d, 2005.
Ghorai, S., Laskin, A., and Tivanski, A. V.: Spectroscopic evidence of keto-enol tautomerism in deliquesced malonic acid particles, J. Phys. Chem. A, 115, 4373–4380, https://doi.org/10.1021/jp112360x, 2011.
Guenther, A., Hewitt, C. N., Erickson, D., Fall, R., Geron, C., Graedel, T., Harley, P., Klinger, L., Lerdau, M., Mckay, W. A., Pierce, T., Scholes, B., Steinbrecher, R., Tallamraju, R., Taylor, J., and Zimmerman, P.: A global-model of natural volatile organic-compound emissions, J. Geophys. Res.-Atmos, 100, 8873–8892, https://doi.org/10.1029/94jd02950, 1995.
Guenther, A. B., Jiang, X., Heald, C. L., Sakulyanontvittaya, T., Duhl, T., Emmons, L. K., and Wang, X.: The Model of Emissions of Gases and Aerosols from Nature version 2.1 (MEGAN2.1): an extended and updated framework for modeling biogenic emissions, Geosci. Model Dev., 5, 1471–1492, https://doi.org/10.5194/gmd-5-1471-2012, 2012.
Hodzic, A., Kasibhatla, P. S., Jo, D. S., Cappa, C. D., Jimenez, J. L., Madronich, S., and Park, R. J.: Rethinking the global secondary organic aerosol (SOA) budget: stronger production, faster removal, shorter lifetime, Atmos. Chem. Phys., 16, 7917–7941, https://doi.org/10.5194/acp-16-7917-2016, 2016.
Huang, W., Saathoff, H., Shen, X., Ramisetty, R., Leisner, T., and Mohr, C.: Chemical characterization of highly functionalized organonitrates contributing to night-time organic aerosol mass loadings and particle growth, Environ. Sci. Technol., 53, 1165–1174, https://doi.org/10.1021/acs.est.8b05826, 2019.
Hyttinen, N., Pullinen, I., Nissinen, A., Schobesberger, S., Virtanen, A., and Yli-Juuti, T.: Comparison of saturation vapor pressures of α-pinene + O3 oxidation products derived from COSMO-RS computations and thermal desorption experiments, Atmos. Chem. Phys., 22, 1195–1208, https://doi.org/10.5194/acp-22-1195-2022, 2022.
Jokinen, T., Berndt, T., Makkonen, R., Kerminen, V. M., Junninen, H., Paasonen, P., Stratmann, F., Herrmann, H., Guenther, A. B., Worsnop, D. R., Kulmala, M., Ehn, M., and Sipila, M.: Production of extremely low volatile organic compounds from biogenic emissions: Measured yields and atmospheric implications, P. Natl. Acad. Sci. USA, 112, 7123–7128, https://doi.org/10.1073/pnas.1423977112, 2015.
Kang, E., Root, M. J., Toohey, D. W., and Brune, W. H.: Introducing the concept of Potential Aerosol Mass (PAM), Atmos. Chem. Phys., 7, 5727–5744, https://doi.org/10.5194/acp-7-5727-2007, 2007.
Kari, E., Miettinen, P., Yli-Pirila, P., Virtanen, A., and Faiola, C. L.: PTR-ToF-MS product ion distributions and humidity-dependence of biogenic volatile organic compounds, Int. J. Mass Spectrom., 430, 87–97, https://doi.org/10.1016/j.ijms.2018.05.003, 2018.
Kiendler-Scharr, A., Mensah, A. A., Friese, E., Topping, D., Nemitz, E., Prevot, A. S. H., Aijala, M., Allan, J., Canonaco, F., Canagaratna, M., Carbone, S., Crippa, M., Dall Osto, M., Day, D. A., De Carlo, P., Di Marco, C. F., Elbern, H., Eriksson, A., Freney, E., Hao, L., Herrmann, H., Hildebrandt, L., Hillamo, R., Jimenez, J. L., Laaksonen, A., McFiggans, G., Mohr, C., O'Dowd, C., Otjes, R., Ovadnevaite, J., Pandis, S. N., Poulain, L., Schlag, P., Sellegri, K., Swietlicki, E., Tiitta, P., Vermeulen, A., Wahner, A., Worsnop, D., and Wu, H. C.: Ubiquity of organic nitrates from nighttime chemistry in the European submicron aerosol, Geophys. Res. Lett., 43, 7735–7744, 10.1002/2016gl069239, 2016.
Kristensen, K., Cui, T., Zhang, H., Gold, A., Glasius, M., and Surratt, J. D.: Dimers in α-pinene secondary organic aerosol: effect of hydroxyl radical, ozone, relative humidity and aerosol acidity, Atmos. Chem. Phys., 14, 4201–4218, https://doi.org/10.5194/acp-14-4201-2014, 2014.
Kroll, J. H. and Seinfeld, J. H.: Chemistry of secondary organic aerosol: Formation and evolution of low-volatility organics in the atmosphere, Atmos. Environ., 42, 3593–3624, https://doi.org/10.1016/j.atmosenv.2008.01.003, 2008.
Kuwata, M., Zorn, S. R., and Martin, S. T.: Using elemental ratios to predict the density of organic material composed of carbon, hydrogen, and oxygen, Environ. Sci. Technol., 46, 787–794, https://doi.org/10.1021/es202525q, 2012.
Lambe, A., Massoli, P., Zhang, X., Canagaratna, M., Nowak, J., Daube, C., Yan, C., Nie, W., Onasch, T., Jayne, J., Kolb, C., Davidovits, P., Worsnop, D., and Brune, W.: Controlled nitric oxide production via O(1D)+ N2O reactions for use in oxidation flow reactor studies, Atmos. Meas. Tech., 10, 2283–2298, https://doi.org/10.5194/amt-10-2283-2017, 2017.
Lambe, A. T., Onasch, T. B., Massoli, P., Croasdale, D. R., Wright, J. P., Ahern, A. T., Williams, L. R., Worsnop, D. R., Brune, W. H., and Davidovits, P.: Laboratory studies of the chemical composition and cloud condensation nuclei (CCN) activity of secondary organic aerosol (SOA) and oxidized primary organic aerosol (OPOA), Atmos. Chem. Phys., 11, 8913–8928, https://doi.org/10.5194/acp-11-8913-2011, 2011.
Lee, B. H., D'Ambro, E. L., Lopez-Hilfiker, F. D., Schobesberger, S., Mohr, C., Zawadowicz, M. A., Liu, J., Shilling, J. E., Hu, W., Palm, B. B., Jimenez, J. L., Hao, L., Virtanen, A., Zhang, H., Goldstein, A. H., Pye, H. O. T., and Thornton, J. A.: Resolving ambient organic aerosol formation and aging pathways with simultaneous molecular composition and volatility observations, ACS Earth Space Chem., 4, 391–402, https://doi.org/10.1021/acsearthspacechem.9b00302, 2020.
Lehtinen, K. E. J. and Kulmala, M.: A model for particle formation and growth in the atmosphere with molecular resolution in size, Atmos. Chem. Phys., 3, 251–257, https://doi.org/10.5194/acp-3-251-2003, 2003.
Li, W. L. and Chen, D. R.: Performance of Nano-DMA operated with different gases for sheath and aerosol carrier flows, Aerosol Sci. Technol., 39, 931–940, https://doi.org/10.1080/02786820500346520, 2005.
Li, Y. and Shiraiwa, M.: Timescales of secondary organic aerosols to reach equilibrium at various temperatures and relative humidities, Atmos. Chem. Phys., 19, 5959–5971, https://doi.org/10.5194/acp-19-5959-2019, 2019.
Li, Z., Tikkanen, O.-P., Buchholz, A., Hao, L., Kari, E., Yli-Juuti, T., and Virtanen, A.: Effect of decreased temperature on the evaporation of á-Pinene secondary organic aerosol particles, ACS Earth Space Chem., 3, 2775–2785, https://doi.org/10.1021/acsearthspacechem.9b00240, 2019.
Li, Z., Buchholz, A., Ylisirniö, A., Barreira, L., Hao, L., Schobesberger, S., Yli-Juuti, T., and Virtanen, A.: Evolution of volatility and composition in sesquiterpene-mixed and α-pinene secondary organic aerosol particles during isothermal evaporation, Atmos. Chem. Phys., 21, 18283–18302, https://doi.org/10.5194/acp-21-18283-2021, 2021.
Lihavainen, H., Asmi, E., Aaltonen, V., Makkonen, U., and Kerminen, V. M.: Direct radiative feedback due to biogenic secondary organic aerosol estimated from boreal forest site observations, Environ. Res. Lett., 10, 104005, https://doi.org/10.1088/1748-9326/10/10/104005, 2015.
Lim, Y. B. and Turpin, B. J.: Laboratory evidence of organic peroxide and peroxyhemiacetal formation in the aqueous phase and implications for aqueous OH, Atmos. Chem. Phys., 15, 12867–12877, https://doi.org/10.5194/acp-15-12867-2015, 2015.
Lin, J. J., Raj R, K., Wang, S., Kokkonen, E., Mikkelä, M.-H., Urpelainen, S., and Prisle, N. L.: Pre-deliquescent water uptake in deposited nanoparticles observed with in situ ambient pressure X-ray photoelectron spectroscopy, Atmos. Chem. Phys., 21, 4709–4727, https://doi.org/10.5194/acp-21-4709-2021, 2021.
Lopez-Hilfiker, F. D., Mohr, C., Ehn, M., Rubach, F., Kleist, E., Wildt, J., Mentel, Th. F., Lutz, A., Hallquist, M., Worsnop, D., and Thornton, J. A.: A novel method for online analysis of gas and particle composition: description and evaluation of a Filter Inlet for Gases and AEROsols (FIGAERO), Atmos. Meas. Tech., 7, 983–1001, https://doi.org/10.5194/amt-7-983-2014, 2014.
Lopez-Hilfiker, F. D., Mohr, C., Ehn, M., Rubach, F., Kleist, E., Wildt, J., Mentel, Th. F., Carrasquillo, A. J., Daumit, K. E., Hunter, J. F., Kroll, J. H., Worsnop, D. R., and Thornton, J. A.: Phase partitioning and volatility of secondary organic aerosol components formed from α-pinene ozonolysis and OH oxidation: the importance of accretion products and other low volatility compounds, Atmos. Chem. Phys., 15, 7765–7776, https://doi.org/10.5194/acp-15-7765-2015, 2015.
Mitchell, L. E., Lin, J. C., Bowling, D. R., Pataki, D. E., Strong, C., Schauer, A. J., Bares, R., Bush, S. E., Stephens, B. B., Mendoza, D., Mallia, D., Holland, L., Gurney, K. R., and Ehleringer, J. R.: Long-term urban carbon dioxide observations reveal spatial and temporal dynamics related to urban characteristics and growth, P. Natl. Acad. Sci. USA, 115, 2912–2917, https://doi.org/10.1073/pnas.1702393115, 2018.
Mohr, C., Thornton, J. A., Heitto, A., Lopez-Hilfiker, F. D., Lutz, A., Riipinen, I., Hong, J., Donahue, N. M., Hallquist, M., Petaja, T., Kulmala, M., and Yli-Juuti, T.: Molecular identification of organic vapors driving atmospheric nanoparticle growth, Nat. Commun., 10, 4442, https://doi.org/10.1038/s41467-019-12473-2, 2019.
Mutzel, A., Poulain, L., Berndt, T., Iinuma, Y., Rodigast, M., Boge, O., Richters, S., Spindler, G., Sipila, M., Jokinen, T., Kulmala, M., and Herrmann, H.: Highly oxidized multifunctional organic compounds observed in tropospheric particles: A field and laboratory study, Environ. Sci. Technol., 49, 7754–7761, https://doi.org/10.1021/acs.est.5b00885, 2015.
Myhre, G., Shindell, D., Bréon, F., Collins, W., Fuglestvedt, J., Huang, J., Koch, D., Lamarque, J., Lee, D., and Mendoza, B.: Anthropogenic and natural radiative forcing, in: Climate change 2013: The physical science basis. Contribution of working group i to the fifth assessment report of the Intergovernmental Panel on Climate Change, Cambridge University Press, Cambridge, United Kingdom and New York, NY, USA, 659–740, 2013.
Paatero, P. and Tapper, U.: Positive matrix factorization: A non negative factor model with optimal utilization of error estimates of data values, Environmetrics, 5, 111–126, 1994.
Peng, Z. and Jimenez, J. L.: Kinsim: A research-grade, user-friendly, visual kinetics simulator for chemical-kinetics and environmental-chemistry teaching, J. Chem. Educ., 96, 806–811, https://doi.org/10.1021/acs.jchemed.9b00033, 2019.
Peng, Z. and Jimenez, J. L.: Radical chemistry in oxidation flow reactors for atmospheric chemistry research, Chem. Soc. Rev., 49, 2570–2616, https://doi.org/10.1039/c9cs00766k, 2020.
Peng, Z., Lee-Taylor, J., Orlando, J. J., Tyndall, G. S., and Jimenez, J. L.: Organic peroxy radical chemistry in oxidation flow reactors and environmental chambers and their atmospheric relevance, Atmos. Chem. Phys., 19, 813–834, https://doi.org/10.5194/acp-19-813-2019, 2019.
Priestley, M., Bannan, T. J., Le Breton, M., Worrall, S. D., Kang, S., Pullinen, I., Schmitt, S., Tillmann, R., Kleist, E., Zhao, D., Wildt, J., Garmash, O., Mehra, A., Bacak, A., Shallcross, D. E., Kiendler-Scharr, A., Hallquist, Å. M., Ehn, M., Coe, H., Percival, C. J., Hallquist, M., Mentel, T. F., and McFiggans, G.: Chemical characterisation of benzene oxidation products under high- and low-NOx conditions using chemical ionisation mass spectrometry, Atmos. Chem. Phys., 21, 3473–3490, https://doi.org/10.5194/acp-21-3473-2021, 2021.
Pullinen, I., Schmitt, S., Kang, S., Sarrafzadeh, M., Schlag, P., Andres, S., Kleist, E., Mentel, T. F., Rohrer, F., Springer, M., Tillmann, R., Wildt, J., Wu, C., Zhao, D., Wahner, A., and Kiendler-Scharr, A.: Impact of NOx on secondary organic aerosol (SOA) formation from α-pinene and β-pinene photooxidation: the role of highly oxygenated organic nitrates, Atmos. Chem. Phys., 20, 10125–10147, https://doi.org/10.5194/acp-20-10125-2020, 2020.
Pye, H. O. T., D'Ambro, E. L., Lee, B. H., Schobesberger, S., Takeuchi, M., Zhao, Y., Lopez-Hilfiker, F., Liu, J., Shilling, J. E., Xing, J., Mathur, R., Middlebrook, A. M., Liao, J., Welti, A., Graus, M., Warneke, C., de Gouw, J. A., Holloway, J. S., Ryerson, T. B., Pollack, I. B., and Thornton, J. A.: Anthropogenic enhancements to production of highly oxygenated molecules from autoxidation, P. Natl. Acad. Sci. USA, 116, 6641–6646, https://doi.org/10.1073/pnas.1810774116, 2019.
Ranney, A. P. and Ziemann, P. J.: Kinetics of acid-catalyzed dehydration of cyclic hemiacetals in organic aerosol particles in equilibrium with nitric acid vapor, J. Phys. Chem. A, 120, 2561–2568, https://doi.org/10.1021/acs.jpca.6b01402, 2016.
Saukko, E., Lambe, A. T., Massoli, P., Koop, T., Wright, J. P., Croasdale, D. R., Pedernera, D. A., Onasch, T. B., Laaksonen, A., Davidovits, P., Worsnop, D. R., and Virtanen, A.: Humidity-dependent phase state of SOA particles from biogenic and anthropogenic precursors, Atmos. Chem. Phys., 12, 7517–7529, https://doi.org/10.5194/acp-12-7517-2012, 2012.
Sporre, M. K., Swietlicki, E., Glantz, P., and Kulmala, M.: A long-term satellite study of aerosol effects on convective clouds in Nordic background air, Atmos. Chem. Phys., 14, 2203–2217, https://doi.org/10.5194/acp-14-2203-2014, 2014.
Sporre, M. K., Blichner, S. M., Karset, I. H. H., Makkonen, R., and Berntsen, T. K.: BVOC–aerosol–climate feedbacks investigated using NorESM, Atmos. Chem. Phys., 19, 4763–4782, https://doi.org/10.5194/acp-19-4763-2019, 2019.
Surratt, J. D., Murphy, S. M., Kroll, J. H., Ng, N. L., Hildebrandt, L., Sorooshian, A., Szmigielski, R., Vermeylen, R., Maenhaut, W., Claeys, M., Flagan, R. C., and Seinfeld, J. H.: Chemical composition of secondary organic aerosol formed from the photooxidation of isoprene, J. Phys. Chem. A, 110, 9665–9690, https://doi.org/10.1021/jp061734m, 2006.
Tikkanen, O.-P., Buchholz, A., Ylisirniö, A., Schobesberger, S., Virtanen, A., and Yli-Juuti, T.: Comparing secondary organic aerosol (SOA) volatility distributions derived from isothermal SOA particle evaporation data and FIGAERO–CIMS measurements, Atmos. Chem. Phys., 20, 10441–10458, https://doi.org/10.5194/acp-20-10441-2020, 2020.
Tunved, P., Hansson, H. C., Kerminen, V. M., Strom, J., Maso, M. D., Lihavainen, H., Viisanen, Y., Aalto, P. P., Komppula, M., and Kulmala, M.: High natural aerosol loading over boreal forests, Science, 312, 261–263, https://doi.org/10.1126/science.1123052, 2006.
Ulbrich, I. M., Canagaratna, M. R., Zhang, Q., Worsnop, D. R., and Jimenez, J. L.: Interpretation of organic components from Positive Matrix Factorization of aerosol mass spectrometric data, Atmos. Chem. Phys., 9, 2891–2918, https://doi.org/10.5194/acp-9-2891-2009, 2009.
Vaden, T. D., Imre, D., Beranek, J., Shrivastava, M., and Zelenyuk, A.: Evaporation kinetics and phase of laboratory and ambient secondary organic aerosol, P. Natl. Acad. Sci. USA, 108, 2190–2195, https://doi.org/10.1073/pnas.1013391108, 2011.
Virtanen, A., Joutsensaari, J., Koop, T., Kannosto, J., Yli-Pirila, P., Leskinen, J., Makela, J. M., Holopainen, J. K., Poschl, U., Kulmala, M., Worsnop, D. R., and Laaksonen, A.: An amorphous solid state of biogenic secondary organic aerosol particles, Nature, 467, 824–827, https://doi.org/10.1038/nature09455, 2010.
Wang, Y., Piletic, I. R., Takeuchi, M., Xu, T., France, S., and Ng, N. L.: Synthesis and hydrolysis of atmospherically relevant monoterpene-derived organic nitrates, Environ. Sci. Technol., 55, 14595–14606, https://doi.org/10.1021/acs.est.1c05310, 2021.
Xu, L., Guo, H., Boyd, C. M., Klein, M., Bougiatioti, A., Cerully, K. M., Hite, J. R., Isaacman-VanWertz, G., Kreisberg, N. M., Knote, C., Olson, K., Koss, A., Goldstein, A. H., Hering, S. V., de Gouw, J., Baumann, K., Lee, S. H., Nenes, A., Weber, R. J., and Ng, N. L.: Effects of anthropogenic emissions on aerosol formation from isoprene and monoterpenes in the southeastern united states, P. Natl. Acad. Sci. USA, 112, 37–42, https://doi.org/10.1073/pnas.1417609112, 2015.
Yli-Juuti, T., Pajunoja, A., Tikkanen, O. P., Buchholz, A., Faiola, C., Vaisanen, O., Hao, L., Kari, E., Perakyla, O., Garmash, O., Shiraiwa, M., Ehn, M., Lehtinen, K., and Virtanen, A.: Factors controlling the evaporation of secondary organic aerosol from alpha-pinene ozonolysis, Geophys. Res. Lett., 44, 2562–2570, https://doi.org/10.1002/2016GL072364, 2017.
Yli-Juuti, T., Mielonen, T., Heikkinen, L., Arola, A., Ehn, M., Isokaanta, S., Keskinen, H. M., Kulmala, M., Laakso, A., Lipponen, A., Luoma, K., Mikkonen, S., Nieminen, T., Paasonen, P., Petaja, T., Romakkaniemi, S., Tonttila, J., Kokkola, H., and Virtanen, A.: Significance of the organic aerosol driven climate feedback in the boreal area, Nat. Commun., 12, 5637, https://doi.org/10.1038/s41467-021-25850-7, 2021.
Ylisirniö, A., Buchholz, A., Mohr, C., Li, Z., Barreira, L., Lambe, A., Faiola, C., Kari, E., Yli-Juuti, T., Nizkorodov, S. A., Worsnop, D. R., Virtanen, A., and Schobesberger, S.: Composition and volatility of secondary organic aerosol (SOA) formed from oxidation of real tree emissions compared to simplified volatile organic compound (VOC) systems, Atmos. Chem. Phys., 20, 5629–5644, https://doi.org/10.5194/acp-20-5629-2020, 2020.
Ylisirniö, A., Barreira, L. M. F., Pullinen, I., Buchholz, A., Jayne, J., Krechmer, J. E., Worsnop, D. R., Virtanen, A., and Schobesberger, S.: On the calibration of FIGAERO-ToF-CIMS: importance and impact of calibrant delivery for the particle-phase calibration, Atmos. Meas. Tech., 14, 355–367, https://doi.org/10.5194/amt-14-355-2021, 2021.
Zare, A., Romer, P. S., Nguyen, T., Keutsch, F. N., Skog, K., and Cohen, R. C.: A comprehensive organic nitrate chemistry: insights into the lifetime of atmospheric organic nitrates, Atmos. Chem. Phys., 18, 15419–15436, https://doi.org/10.5194/acp-18-15419-2018, 2018.
Zare, A., Fahey, K. M., Sarwar, G., Cohen, R. C., and Pye, H. O. T.: Vapor-pressure pathways initiate but hydrolysis products dominate the aerosol estimated from organic nitrates, ACS Earth Space Chem., 3, 1426–1437, https://doi.org/10.1021/acsearthspacechem.9b00067, 2019.
Zaveri, R. A., Shilling, J. E., Zelenyuk, A., Zawadowicz, M. A., Suski, K., China, S., Bell, D. M., Veghte, D., and Laskin, A.: Particle-phase diffusion modulates partitioning of semivolatile organic compounds to aged secondary organic aerosol, Environ. Sci. Technol., 54, 2595–2605, https://doi.org/10.1021/acs.est.9b05514, 2020.
Zhang, H., Yee, L. D., Lee, B. H., Curtis, M. P., Worton, D. R., Isaacman-VanWertz, G., Offenberg, J. H., Lewandowski, M., Kleindienst, T. E., Beaver, M. R., Holder, A. L., Lonneman, W. A., Docherty, K. S., Jaoui, M., Pye, H. O. T., Hu, W., Day, D. A., Campuzano-Jost, P., Jimenez, J. L., Guo, H., Weber, R. J., de Gouw, J., Koss, A. R., Edgerton, E. S., Brune, W., Mohr, C., Lopez-Hilfiker, F. D., Lutz, A., Kreisberg, N. M., Spielman, S. R., Hering, S. V., Wilson, K. R., Thornton, J. A., and Goldstein, A. H.: Monoterpenes are the largest source of summertime organic aerosol in the southeastern united states, P. Natl. Acad. Sci. USA, 115, 2038–2043, https://doi.org/10.1073/pnas.1717513115, 2018.
Zhao, D., Schmitt, S. H., Wang, M., Acir, I.-H., Tillmann, R., Tan, Z., Novelli, A., Fuchs, H., Pullinen, I., Wegener, R., Rohrer, F., Wildt, J., Kiendler-Scharr, A., Wahner, A., and Mentel, T. F.: Effects of NOx and SO2 on the secondary organic aerosol formation from photooxidation of α-pinene and limonene, Atmos. Chem. Phys., 18, 1611–1628, https://doi.org/10.5194/acp-18-1611-2018, 2018.
Ziemann, P. J. and Atkinson, R.: Kinetics, products, and mechanisms of secondary organic aerosol formation, Chem. Soc. Rev., 41, 6582–6605, https://doi.org/10.1039/c2cs35122f, 2012.