the Creative Commons Attribution 4.0 License.
the Creative Commons Attribution 4.0 License.
 | 06 Feb 2023
Validation of the TROPOMI/S5P aerosol layer height using EARLINET lidars
Konstantinos Michailidis
Maria-Elissavet Koukouli
Dimitris Balis
J. Pepijn Veefkind
Martin de Graaf
Lucia Mona
Nikolaos Papagianopoulos
Gesolmina Pappalardo
Ioanna Tsikoudi
Vassilis Amiridis
Eleni Marinou
Anna Gialitaki
Rodanthi-Elisavet Mamouri
Argyro Nisantzi
Daniele Bortoli
Maria João Costa
Vanda Salgueiro
Alexandros Papayannis
Maria Mylonaki
Lucas Alados-Arboledas
Salvatore Romano
Maria Rita Perrone
Holger Baars
The purpose of this study is to investigate the ability of the Sentinel-5P TROPOspheric Monitoring Instrument (TROPOMI) to derive accurate geometrical features of lofted aerosol layers, selecting the Mediterranean Basin as the study area. Comparisons with ground-based correlative measurements constitute a key component in the validation of passive and active satellite aerosol products. For this purpose, we use ground-based observations from quality-controlled lidar stations reporting to the European Aerosol Research Lidar Network (EARLINET). An optimal methodology for validation purposes has been developed and applied using the EARLINET optical profiles and TROPOMI aerosol products, aiming at the in-depth evaluation of the TROPOMI aerosol layer height (ALH) product for the period 2018 to 2022 over the Mediterranean Basin. Seven EARLINET stations were chosen, taking into consideration their proximity to the sea, which provided 63 coincident aerosol cases for the satellite retrievals. In the following, we present the first validation results for the TROPOMI/S5P ALH using the optimized EARLINET lidar products employing the automated validation chain designed for this purpose. The quantitative validation at pixels over the selected EARLINET stations illustrates that the TROPOMI ALH product is consistent with the EARLINET lidar products, with a high correlation coefficient R=0.82 (R=0.51) and a mean bias of km and km over ocean and land, respectively. Overall, it appears that aerosol layer altitudes retrieved from TROPOMI are systematically lower than altitudes from the lidar retrievals. High-albedo scenes, as well as low-aerosol-load scenes, are the most challenging for the TROPOMI retrieval algorithm, and these results testify to the need to further investigate the underlying cause. This work provides a clear indication that the TROPOMI ALH product can under certain conditions achieve the required threshold accuracy and precision requirements of 1 km, especially when only ocean pixels are included in the comparison analysis. Furthermore, we describe and analyse three case studies in detail, one dust and two smoke episodes, in order to illustrate the strengths and limitations of the TROPOMI ALH product and demonstrate the presented validation methodology. The present analysis provides important additions to the existing validation studies that have been performed so far for the TROPOMI S5P ALH product, which were based only on satellite-to-satellite comparisons.
- Article
(7886 KB) - Full-text XML
- BibTeX
- EndNote


Aerosols play a key role in atmospheric composition, climate, and human health (IPCC, 2021; Ramanathan et al., 2001). Given the broad variety of their natural and anthropogenic sources, their relatively short lifetime, and their different formation mechanisms, aerosols exhibit highly variable spatio-temporal distributions around the globe (Torres et al., 2007). Aerosol properties present one of the leading uncertainties in climate modelling; both natural and anthropogenic aerosols can strongly affect both air quality, as well as the delicate balance in atmospheric chemistry (Bellouin et al., 2020; van Donkelaar et al., 2010). The knowledge of the vertical distribution of aerosols is an important key parameter to reduce uncertainties in our understanding of Earth's climate (Ramanathan and Carmichael, 2008). Accurate and reliable measurements of high spatio-temporal resolution aerosol distributions and their properties, such as the aerosol layer height (ALH), are essential for understanding the impact of aerosols on the climate system.
Both active and passive remote sensing methods have been developed from both ground-based and spaceborne systems in order to estimate the aerosol layer height. Ground-based active remote sensing methods offer high-accuracy results; however, their geographical coverage is spatially limited. Space-based instruments are able to fill this gap, providing products with global coverage. In order to trust and use the space-based products, their validation against known ground truth is required. Lidar profiles from the European Aerosol Research Lidar Network (EARLINET) provide the accurate and reliable detailed vertical structure of the aerosols, and therefore they can be regarded as the benchmark for validating passive ALH remote sensing (Pappalardo et al., 2014). In recent years, many Earth satellite sensors have developed algorithms to extract the ALH information from their ultraviolet/visible (UV/VIS) observations: the MetOp Global Ozone Monitoring Experiment-2 (GOME-2) instruments (Hassinen et al., 2016), the Deep Space Climate Observatory (DSCOVR) mission with its Earth Polychromatic Imaging Camera (EPIC) (Xu et al., 2019), the Multi-angle Imaging SpectroRadiometer (MISR) on board the NASA Terra satellite (Nelson et al., 2013), the Sentinel-5P TROPOspheric Monitoring Instrument (Veefkind et al., 2012), and more recently the Geostationary Environment Monitoring Spectrometer (GEMS; Kim et al., 2019). Over the next few years, upcoming missions such as the Tropospheric Emissions: Monitoring of Pollution mission (TEMPO) (Zoogman et al., 2017) and the Sentinel-4 and Sentinel-5 missions (Ingmann et al., 2012) are expected to continue providing quality-assured aerosol height data sets.
In this work, we focus on the validation of the S5P/TROPOspheric Monitoring Instrument (TROPOMI) aerosol layer height product (Nanda et al., 2020) against independent ground-based lidar measurements in order to enumerate the quality of the TROPOMI retrievals. The EARLINET network of ground-based lidar instruments has been established to provide reference measurements of aerosol properties that can be applied to the validation of the TROPOMI retrievals, providing long-term, quality-assured, and multi-wavelength aerosol vertical profiles. The geographic and temporal coverage of EARLINET stations alongside their quality-assured measurements provides an excellent framework for the intercomparison of TROPOMI/S5P aerosol products under different atmospheric conditions and aerosol concentrations around Europe. The ability of the EARLINET data to successfully assess and validate space-borne ALH observations has already been demonstrated for the GOME2/MetOp aerosol height products (Michailidis et al., 2021).
Nanda et al. (2020) validated the TROPOMI operational ALH retrievals against the Cloud-Aerosol Lidar with Orthogonal Polarization CALIOP-based data, on board the Cloud–Aerosol Lidar and Infrared Pathfinder Satellite Observation (CALIPSO). Their work indicated that the operational algorithm retrieves lower ALH compared to CALIOP, by ∼2 km over land and ∼0.5 km over the ocean. The negative bias is primarily caused by the impact of the high surface reflectance in the O2 A band, which affects aerosol retrievals. A similar comparison for the 2018 biomass burning fires in North America (Griffin et al., 2020) indicates that this bias also strongly depends on the thickness of the smoke plume. They reported a −2.1 km bias of ALH for thin smoke plumes, which is reduced to only km for plumes thicker than 1.5 km. At the time of writing this article, no studies assessing the validation of the TROPOMI aerosol height products with ground-based EARLINET stations have been published. A table at the end of Sect. 4 summarizes the outcomes of this study, including the findings of the previous validation works.
The article is structured as follows: a general description of the region of interest is given in Sect. 1.1. Sections 2.1 and 2.2 contain the description of the satellite and ground-based data sets used in the study. Section 2.3 contains the detailed description of the validation methodology, the quality control and product limitations. In Sect. 3 we provide the main validation results and statistics and also three case studies in order demonstrate the full potential of the presented method. Conclusions and prospects are summarized in Sect. 4.
Study Region: the Mediterranean region
The Mediterranean Basin consists of a region heavily influenced by the Sahara to the south and the highly populated and industrialized European countries to the north. This region has been identified as a crossroad of air masses with many types of aerosols (Lelieveld et al., 2002; Basart et al., 2009; Amiridis et al., 2010; Soupiona et al., 2020). This relatively high aerosol load in the region can have strong effects on the regional radiative budget, climate, and ecosystems (Stohl et al., 2015). Many studies have used satellite observations to derive aerosol properties over the Mediterranean during the last decade (e.g. Gerasopoulos et al., 2011; Mallet et al., 2013; Nabat et al., 2013; Marinou et al., 2017; Papanikolaou et al., 2020) and investigate their effect on radiation, cloud formation, and climate (e.g. Georgoulias et al., 2020.)
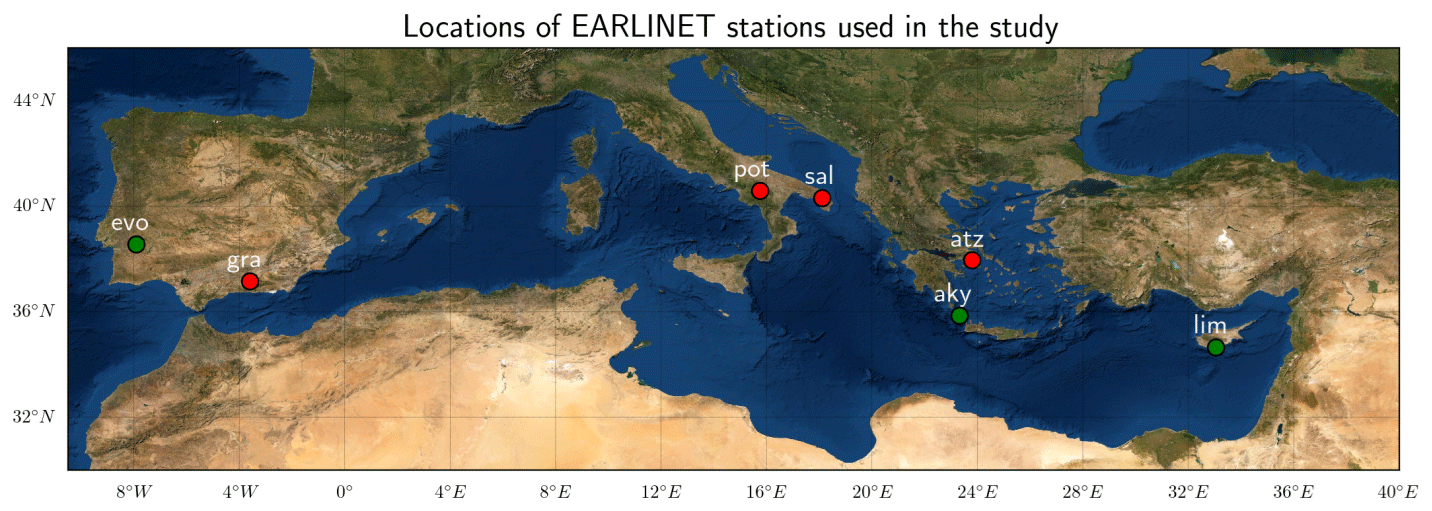
Figure 1Location of the EARLINET lidar stations used in this study. Red circles denote multi-wavelength Raman lidars, and green circles denote the stations with continuous operation capabilities (see Table 1).
Figure 1 shows the geographical distribution of the selected EARLINET stations participating in the TROPOMI–EARLINET intercomparison activity (in alphabetical order: Antikythera-PANGEA, Athens, Évora, Granada, Lecce, Limassol, and Potenza). The list of stations, along with their identification codes, surface elevation, and respective references, considered for the validation of the TROPOMI/S5P ALH product are shown in Table 1. The location of the stations across the Mediterranean basin is an ideal test environment for TROPOMI ALH features due to their proximity to the Sahara and Europe, which feature frequently observed events of mineral dust and smoke particles (Lelieveld et al., 2002). Thence, the TROPOMI aerosol products can be examined under a complete set of different atmospheric conditions. Over land, the TROPOMI ALH product has decreased capabilities compared to over the sea surfaces since the retrieval algorithm becomes increasingly sensitive to errors in the surface albedo features over bright surfaces (Griffin et al., 2020; Sanders et al., 2015). Hence, the choice of the validation stations was performed based on the limitations of the TROPOMI ALH algorithm over land surfaces in providing accurate retrievals. Using these sites further provides an opportunity to study the effect of the albedo parameter on the validation of ALH product. A final aspect that influenced the choice of stations was the availability of suitable EARLINET data during the period examined, which is dictated by the fact that the EARLINET measurements are systematically performed following a standard schedule and not optimized for the validation of the TROPOMI products.
All participating stations operate high-performance multi-wavelength lidar systems. Three of the contributing stations (Antikythera-PANGEA, Évora, and Limassol since October 2021) are also part of the PollyNET sub-network (http://polly.tropos.de, last access: 1 May 2022), operating round-the-clock portable and remote-controlled multiwavelength-polarization Raman lidar systems (PollyXT; Baars et al., 2016; Engelmann et al., 2016).
Table 1Details on the locations and main reference document for the EARLINET lidar stations used in this work.
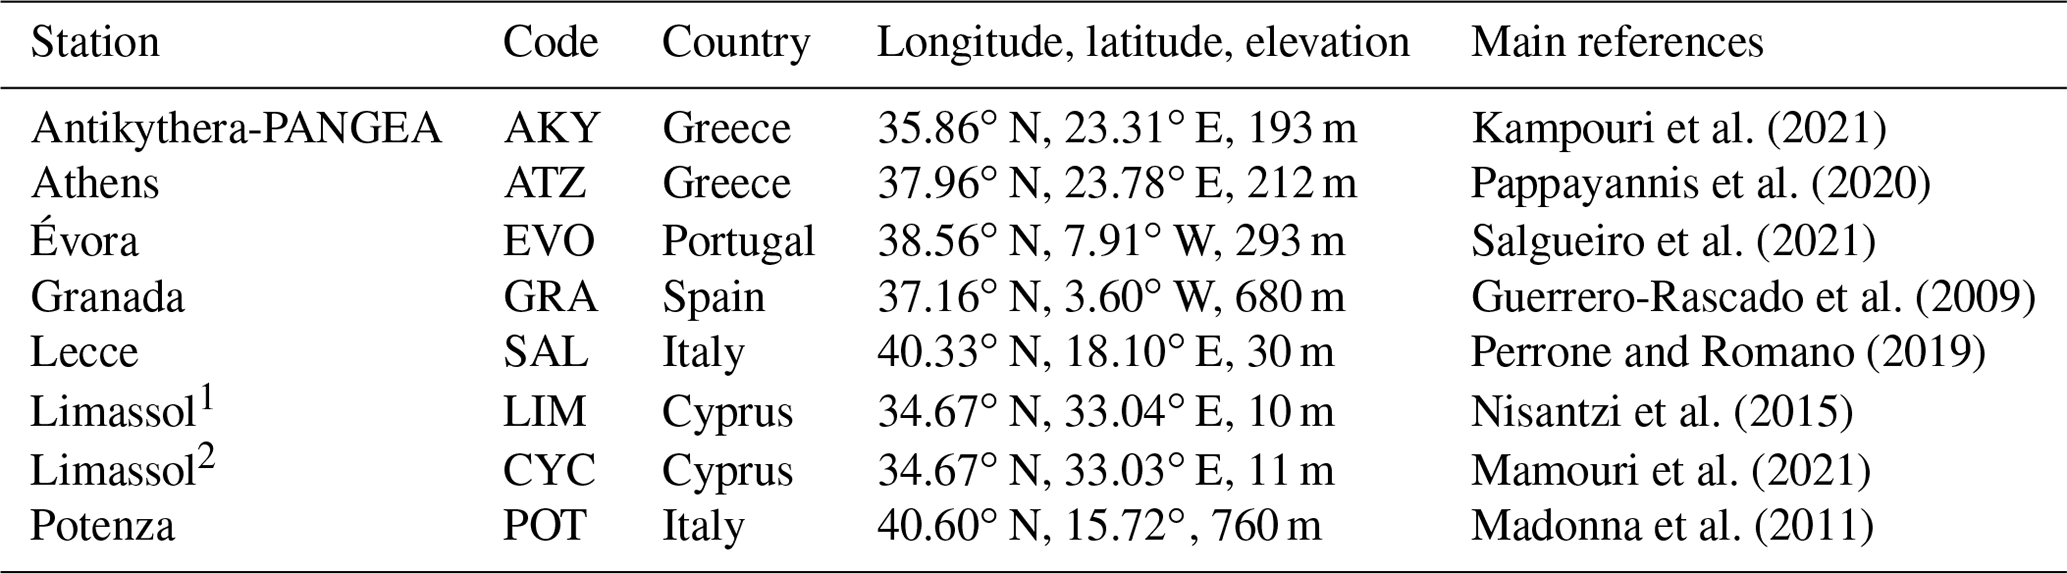
1 Cyprus University of Technology (CUT). 2 Leibniz Institute for Tropospheric Research, Leipzig, and ERATOSTHENES Centre of Excellence (after October 2020).
2.1 The EARLINET products
The lidar technique is the most predominant tool for aerosol profiling and has largely contributed to our knowledge of the vertical distribution of the aerosol optical properties (e.g., Balis et al., 2004; Papayannis et al., 2008; Mona et al., 2012; Granados-Muñoz et al., 2016; Ortiz-Amezcua et al., 2017). The European Aerosol Research Lidar Network (https://www.earlinet.org/, last access: 2 June 2022, Pappalardo et al., 2014), established in 2000, provides a large collection of quality-assured ground-based data of the vertical distribution of the aerosol optical and geometrical properties over Europe.
The EARLINET data have been used extensively for satellite aerosol product validation in recent years, such as for the Cloud-Aerosol Lidar and Infrared Pathfinder Satellite Observations (CALIPSO) (Winker et al., 2009), which is the first satellite focused on monitoring vertically resolved aerosol and cloud optical products (Papagiannopoulos et al., 2016). Furthermore, the evaluation of aerosol optical products from the Cloud-Aerosol Transport System (CATS) on board the International Space Station (ISS) was also performed based on the EARLINET database (Proestakis et al., 2019). Recently, the co-polar particle backscatter coefficient product measured by the Atmospheric LAser Doppler INstrument (ALADIN) on board Aeolus was evaluated in the Iberian Peninsula using EARLINET data (Abril-Gago et al., 2022). With respect to the aerosol layer height reported by UV-VIS satellite sensors, Michailidis et al. (2021) have successfully validated the GOME2/MetOp absorbing aerosol height (AAH) products using aerosol profiles reported by the EARLINET community. The intercomparison showed that the GOME-2 AAH measurements provide a good estimation of the aerosol layer altitudes sensed by the EARLINET ground-based lidars with a mean bias of approximately km. While the TROPOMI ALH has more observations of dust and smoke outflows over the water surfaces, the GOME-2 AAH has improved availability over desert regions and remote oceans as its retrieval has no constraint on surface albedo and cloud fraction.
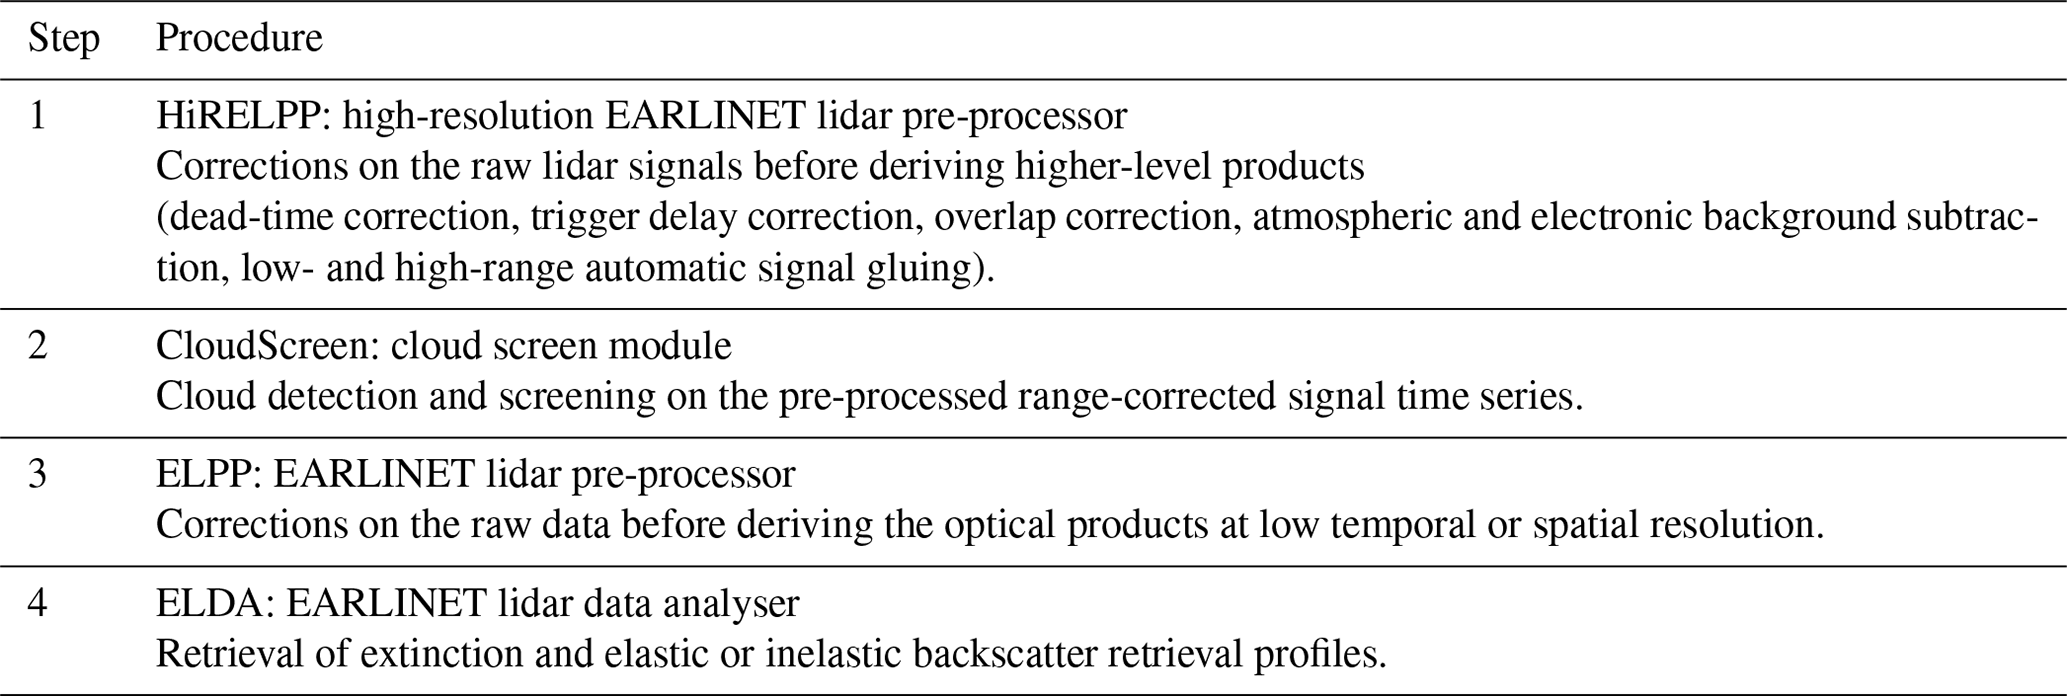
Currently, the network includes 32 active lidar stations distributed around Europe providing information of aerosol vertical distributions on a continental scale. The large majority of the stations involved is based on multi-wavelength Raman lidar systems, which combine detection channels at both elastic and Raman-shifted signals and are equipped with depolarization channels. Observations submitted to the EARLINET database follow absolute accuracy standards to achieve the desired confidence in product calculations. To this end, the lidar measurements are processed by the single calculus chain (SCC) (D'Amico et al., 2015, 2016), the standardized tool that allows a centralized process of the lidar data acquired at each station within EARLINET. The SCC consists of several different modules for handling the pre-processing of raw lidar signals by applying specific corrections and providing the final optical products. In Table 2, the main quality assurance (QA) procedures applied to the EARLINET lidars used in the study are presented. In order to make the lidar products from different systems in EARLINET comparable and to be able to provide quality-assured data sets of network products, specific quality standards have been established (Freudenthaler et al., 2018) and algorithm intercomparison campaigns have been organized (e.g. Amodeo et al., 2018).
The main information provided by the EARLINET database is the vertical distribution of aerosol backscatter and aerosol extinction coefficients alongside their errors at one or more out of the following wavelengths: 355, 532, and 1064 nm. The database also includes volume and particle depolarization ratio profiles at 532 nm (some stations also at 355 nm). During the daytime, the data acquisition is limited to the signals that occur from the elastic scattering of the laser beam by the air molecules and the atmospheric aerosol. The Klett–Fernald (KF) inversion is applied (Klett, 1981; Fernald, 1984), and the backscatter coefficient profiles are produced. In this study, only daytime lidar data from the QA EARLINET database were considered. A common source of uncertainty when dealing with lidar data is the system's overlap function that determines the altitude above which a profile contains trustworthy values. The incomplete overlap between the laser beam and the receiver field of view significantly affects lidar observations of particle optical properties in the near-field range (the first few hundred metres). The impact of the overlap height considered in the validation results is presented in detail in Sect. 2.3.
2.2 The TROPOMI/S5P aerosol layer height
The TROPOspheric Monitoring Instrument (TROPOMI; Veefkind et al., 2012) is a space-borne, nadir-viewing, imaging spectrometer operating in a non-scanning push-broom configuration covering wavelength bands between the ultraviolet and the shortwave infrared. Sentinel-5P is a near-polar sun-synchronous-orbit satellite flying at an altitude of 817 km, with a 2600 km wide swath, providing near-daily global coverage and overpass local time at an ascending node of 13:30 UTC (repeat cycle of 17 d). The spatial resolution at nadir, originally of 3.5×7 km2 (across track × along track), has been refined to 3.5×5.5 km2 on 6 August 2019.
The TROPOMI ALH product focuses on the retrieval of vertically localized aerosol layers in the free troposphere, such as desert dust, biomass burning aerosol, or volcanic ash plumes. It can therefore provide accurate values to the modelling community by improving air quality forecasting and radiative forcing studies. The height of such layers is retrieved for cloud-free conditions and is reported in both altitude and pressure. The aerosol height retrieval is based on the absorption in the Oxygen A band in the near-infrared wavelength range (759–770 nm) and assumes a single aerosol layer of 50 hPa thickness. This is an important simplification to note when comparing with other satellites and ground-based lidar profiles (e.g. from EARLINET), since these lidar profiles have the capability to detect multiple aerosol layers. The Oxygen A band can provide altitude information on scattering layers (clouds or aerosol) from the troposphere up to the stratosphere. The TROPOMI aerosol layer height (AER_LH) algorithm was developed by the Royal Netherlands Meteorological Institute (KNMI; Sanders et al., 2015; Nanda et al., 2018, 2020) and is a part of the TROPOMI operational algorithm suite. We used S5P L2_AER_LH (RPRO and OFFL; algorithm versions from 1 March 2000 to 2 March 2001) data covering the time period from June 2018 till July 2022. In brief, several quality control filters are applied in the TROPOMI L2 data set, following the filtering proposed for ALH product (Nanda et al., 2020; their Table 1). A detailed description of the product and product versions, can be found in the product user manual (PUM; Apituley et al., 2021).
Additionally, we use the operational UV aerosol index (UVAI) TROPOMI product (Stein-Zweers et al., 2021) to qualitatively examine the AER_LH products over the selected domain. The UVAI is an air quality product derived from the top-of-the-atmosphere (TOA) reflectance spectra and is widely used as an indicator for the presence of aerosols in the atmosphere (e.g. Herman et al., 1997). The UVAI is based on spectral contrast in the UV spectral range for a given wavelength pair, where the difference between the observed reflectance and the modelled clear-sky reflectance results in a residual value. Positive values indicate the presence of absorbing aerosols, such as dust, smoke, or volcanic ash. Over the oceans, positive UVAI may also result from non-aerosol sources such as sunglint and ocean colour effects (Torres et al., 2018). Clouds yield near-zero residual values, and negative residual values can be indicative of the presence of non-absorbing aerosols, as shown by sensitivity studies of the UVAI (e.g. de Graaf et al., 2005). Negative UVAI can also result from optically thin clouds and aerosols over both land and oceans, while ocean colour effects associated with chlorophyll absorption yield negative values over the oceans. For the aforementioned reasons, while the UVAI is well accepted as a first indicator of the presence of aerosols, care is required as to its quantitative interpretation. The use of this atmospheric parameter in this work is explained further in Sect. 3.
2.3 Validation methodology and co-location criteria
In this section, we present the basic principles of the validation method of the TROPOMI ALH product in detail. The methodology is demonstrated using a selected number of co-located cases of TROPOMI overpasses over selected EARLINET lidar stations mainly located around the Mediterranean Basin for the period June 2018 to July 2022. The approach followed is based on the previous expertise and methodology that have been developed using EARLINET observations for the GOME2/MetOp validation activities (Michailidis et al., 2021). At present, seven EARLINET stations operating at 1064 nm (or 532 nm) contribute to this study (Fig. 1). To obtain a validation data set with statistical significance, ground-based lidar measurements first need to be collected and co-located with TROPOMI observations. Individual TROPOMI pixels are averaged over a selected radius around the lidar stations. Taking into account the recommendations of the previous comparison studies (Griffin et al., 2020; Nanda et al., 2020; Chen et al., 2021), the selection of data and the comparison between TROPOMI and EARLINET aerosol heights proceed through the following steps for each date.
-
Create a list of TROPOMI overpass swaths that are within the region of interest (EARLINET stations).
-
Identify the closest TROPOMI pixels (within a radius of 150 km) around the EARLINET stations in time and space. A maximum time difference of ±4 h is allowed between co-location pairs. This choice is a compromise to obtain a significant number of coincidences between two data sets. A shorter time and spatial coincidence criterion significantly decrease the numbers of sampled co-located days. In most of cases the time difference between the mean averaged lidar profiles and S5P overpass vary from 1 to 2 h.
-
For each ground-based measurement, select the spatially averaged TROPOMI pixels in a radius of 150 km for the comparison study. Different sensitivity tests have been performed in order to evaluate the robustness of the validation results. We used different radiuses around the EARLINET stations (from 50 to 150 km). At most stations, the bias shows a small dependency on the radius.
-
Use the lidar backscatter coefficient profiles, mainly at 1064 nm (or 532 nm), as reference data input to the validation processing. These profiles are analysed by the SCC (D'Amico et al., 2015, 2016) for quality-assured measurements and TROPOMI level 2 ALH product. The backscatter coefficient profiles at 1064 nm are used for layer identification since the sensitivity to aerosol structures is higher at this wavelength than in the UV or visible
-
Apply the TROPOMI/S5P pixel selection scheme and flags following the recommendations of the product readme file (PRF) based on the quality-assurance (QA) values. In order to avoid misinterpretation of the data quality, we exclude satellite pixels associated with a “qa_value” below 0.5. This removes very cloudy scenes, snow- or ice-covered scenes, and problematic retrievals. In addition, residual cirrus clouds can cause substantial retrieval biases. For our purposes, the “cirrus_reflectance_viirs_filter” flag is the preferred flag for removing possibly cirrus cloudy pixels. Satellite pixels with VIIRS average cirrus reflectance beyond 0.4 are excluded from the analysis. A sun-glint mask is also applied to screen sun-glint regions. Pixels with an associated negative AI are excluded; hence, only desert dust, biomass burning aerosol, and volcanic ash aerosols, i.e. absorbing aerosols, remain in the data set.
The effective aerosol height may be also described in terms of layer boundaries or by the full vertical profile. In this study, we make use of the backscatter-weighted height (ALHbsc), calculated as the centre of mass (ZCOM) on the backscatter (bsc) profile, based on the methodology described in Mona et al. (2006). This height parameter is an important indicator for vertical profiles that gives an indication of the altitude of the aerosol distribution as a single number. For example, in cases where a single aerosol layer is present in the atmosphere, the ALHbsc gives an indication of its mean altitude; in cases of multiple layers, however, the ALHbsc could be located in areas without any considerable aerosol load. In addition, ALHbsc is considered ideal for comparisons with aerosol layer height retrievals from passive remote sensing (e.g. TROPOMI/S5P, GOME-2/MetOp, and the upcoming Sentinel-4 and Sentinel-5 missions). Information about the aerosol layer's centre of mass is useful because the characteristics of the detected layer can be distinguished at this altitude. Under the detection of a homogenous aerosol layer, the Zcom can be estimated as the mean altitude of the identified aerosol layer weighted by the altitude-dependent aerosol backscatter coefficient. In some cases, the aerosol vertical structure is very complicated because aerosol layers are present at different heights. For these cases, a total layer resulting from the multi-layered structure is considered for the calculation of mean optical parameters and integrated values. The weighted-backscatter altitude is estimated by the following equation:
where βaer,i represents the aerosol backscatter coefficient (Mm−1 sr−1) primarily at the 1064 nm channel at level i and Zi is the altitude (km) of level i for the aerosol profile signal. Based on the above equation, the layer height is calculated from backscatter profiles, symbolized as ALHbsc. We found that there is no significant dependence on the choice of wavelength channel ranging between 20 and 80 m in the ALH calculation. The ALHbsc represents an effective ALH weighted by the aerosol backscatter signal at each level and is the best parameter to compare with ALH as defined in the TROPOMI algorithm. In our analysis, we applied Eq. (1) to all lidar backscatter profiles co-located to TROPOMI measurements. The backscatter profiles are used from each station together with the associated error in the vertical profile. After applying the Monte Carlo error propagation using the backscatter profiles and the errors, for all cases we found that the effect on the estimated ALHbsc is small, i.e. of the order of tens of metres, ranging between 10 and 60 m.
A very important and critical issue in lidar-based ALH calculation is the incomplete overlap area between the laser beam and the receiver field of view. This affects the observations of the optical properties of the particles in the first few hundred metres. To overcome this issue, we rely on certain assumptions. To calculate the ALHbsc from the lidar backscatter profiles using Eq. (1), for the height range between the surface and the full overlap height, we assumed a constant backscatter coefficient (height-independent value) equal to the one measured at the full overlap height. This is generally acceptable since the planetary boundary layer (PBL) is characterized by well-mixed aerosol conditions (Siomos et al., 2018). We can conclude that the effect of this assumption shown on the calculation of ALHbsc is of the order of 100–400 m, depending on the technical characteristics of the lidar systems. Furthermore, we also investigated the effect of lidar ratio on the ALHbsc estimates based on lidar backscatter profile retrievals for different lidar ratio values. The findings show that the effect on the weighted height calculation (ALHbsc) is small (lower than 40 m).
Following the work proposed by Michailidis et al. (2021) for automatic layer detection, we also apply the wavelet covariance transform (WCT) approach in order to check whether the TROPOMI-retrieved ALH is sensitive to distinct layers rather than a representative effective layer from the whole profile. In this methodology all possible individual layers identified by the lidar observations are analysed autonomously, providing individual assessments on the height of the aerosol mass and not a mean effective height from all layers as is extracted by Eq. (1). Hence, further below in Sect. 3.2, a comparison is also given using the WCT formalism on the lidar profiles, from which the layer considered most optically significant is compared against TROPOMI ALH retrievals. In the case that more than one layer with a significant contribution to the optical thickness of the profile exists, an average value between these is calculated for the comparison against satellite height retrievals.
Following the methodology summarized in Sect. 2.3, we performed a validation analysis using lidar data from seven ground-based EARLINET sites located across the Mediterranean, spatio-temporally collected with data from the TROPOMI instrument on board the Sentinel-5P satellite. The result of this analysis are presented and discussed in detail in Sect. 3.1. Furthermore, in Sect. 3.2 three selected representative cases are presented in detail; these were taken during extensive dust and smoke events over the Mediterranean Basin in order to illustrate the strengths and limitations of the TROPOMI ALH product.
3.1 Comparison of TROPOMI against EARLINET ALH
Here we present the first comparison between TROPOMI ALH and EARLINET measurements over the Mediterranean. The basic issue in this validation approach was the difficulty in identifying good spatiotemporal co-locations between EARLINET lidar station observations and TROPOMI/S5P overpasses. The TROPOMI AER_ALH retrievals over land surfaces are a challenge and strongly dependent on the surface albedo, with low accuracy over bright surfaces. The first comparison results presented here confirm this feature. Overall, from the selected EARLINET stations across the Mediterranean, 63 coincident cases were found, checked, and flagged for the comparison against TROPOMI retrievals. The co-located aerosol backscatter profiles at 1064 nm from lidar level 2 products are used to calculate a ALHbsc for the validation of TROPOMI ALH. The spatially averaged TROPOMI ALH retrievals in a radius of 150 km around the station and around the overpass time of TROPOMI are used in the validation for each day. The total available data set is on the small side but suitable for the comparison study and general representativeness of the TROPOMI ALH product. For each selected satellite file, TROPOMI UVAI data were used to qualitatively discriminate aerosol plumes from the background. We apply our validation process using satellite retrievals separately over land and water surfaces to further demonstrate the known TROPOMI ALH issues over land. The surface reflectance for each pixel is derived after classifying the land and water surface based on the pixel location. Recall that over land the TROPOMI ALH product has decreased detection capabilities than over the sea surfaces since over bright surfaces the retrieval algorithm becomes increasingly sensitive to errors in the surface albedo features (Sanders et al., 2015).
Figure 2 shows the scatterplot of TROPOMI ALH against EARLINET ALHbsc for all the common cases used for the intercomparison. Ocean-only S5P pixel comparisons are shown in Fig. 2a and only land pixels are shown in Fig. 2b. The error bars represent the corresponding spatial standard deviation of TROPOMI pixels within 150 km of the EARLINET sites. The colour scale indicates the averaged TROPOMI aerosol index values. The agreement between the TROPOMI and EARLINET data sets was quantified by several evaluation metrics, including the number of co-locations (N), the linear correlation coefficient (R), the slope (a) and intercept (b) of the linear regression, the root-mean-square error (RMSE), and the mean of the absolute (absolute bias) and relative (relative bias) for all cases. By defining a weighted height from EARLINET aerosol backscatter profile products (ALHbsc), the quantitative validation at pixels over the selected EARLINET stations illustrates that TROPOMI ALH is consistent with ALHbsc, with a high correlation coefficient R=0.81 and mean bias km over ocean pixels and R=0.51 and km over both land pixels.
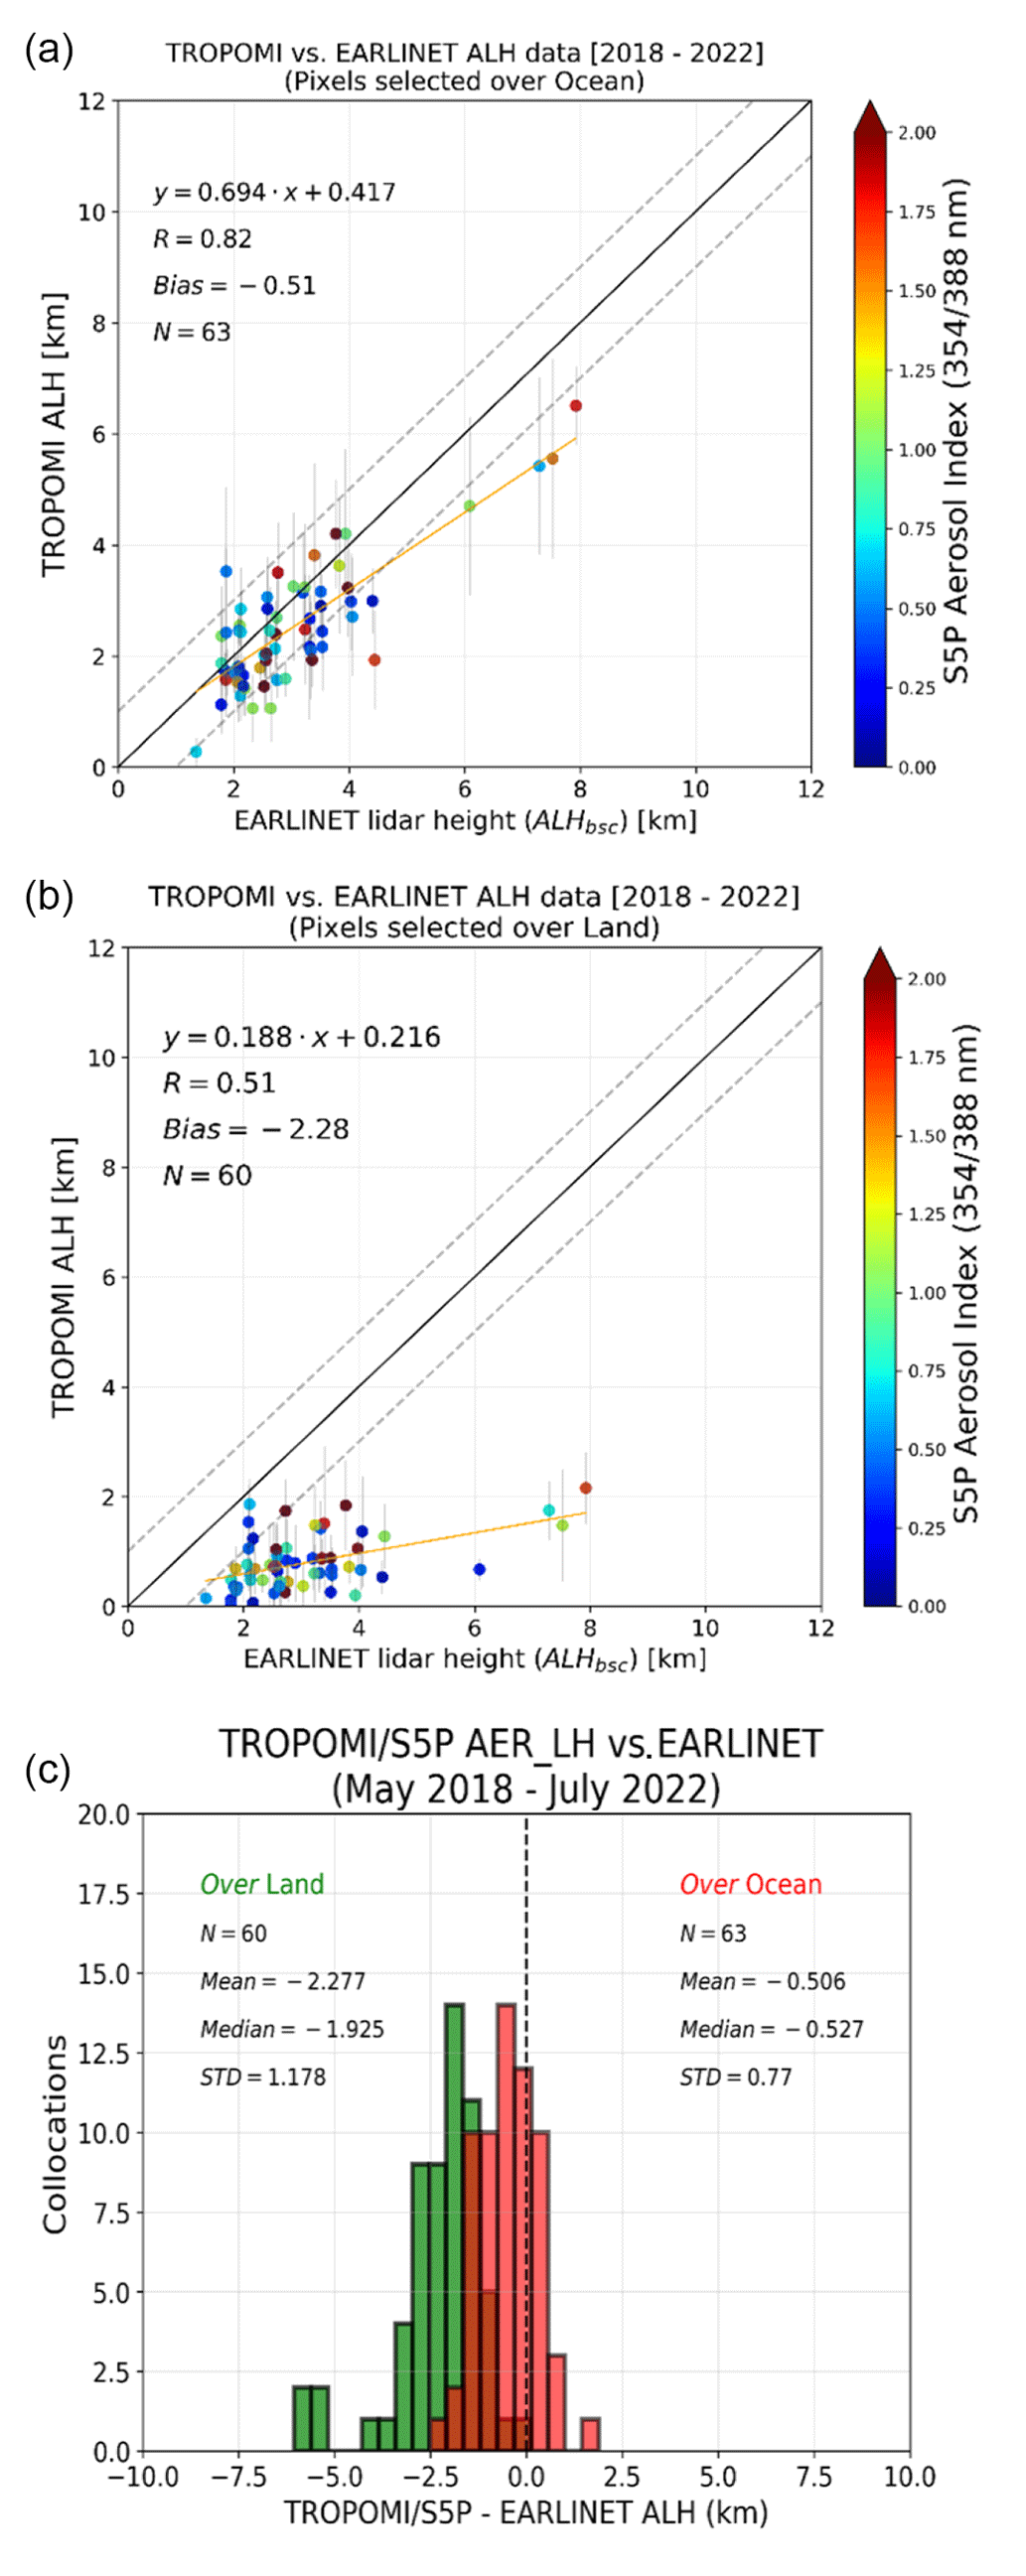
Figure 2Scatterplots of TROPOMI against EARLINET data: (a) TROPOMI pixels over ocean and (b) over land. The colour of each scatter point indicates the TROPOMI-retrieved UVAI values, and the error bars of each scatter indicate the spatial variability of the averaged TROPOMI ALH pixels. (c) Histogram of the differences between TROPOMI and EARLINET data sets, shown in red over the ocean pixels and green for both ocean and land pixels.
From these scatter plots, it can be noted that there are two different point clusters which represent two different aerosol events. The cluster with the low aerosol layer heights represents the dust episodes, while the high aerosol loads represent the four co-located cases associated with smoke events over the western, central and eastern Mediterranean that originated from the California forest fires. These cases have thin and well-defined layer structures, with no significant contribution from lower layers apart from the PBL structure. Overall, the TROPOMI ALH retrievals are systematically lower than the compared lidar height in both clusters. This can also be seen in Fig. 2c, which presents histogram plots of absolute differences. The magnitude of the mean height difference is smallest when only ocean pixels (in red) are included in the comparison with the EARLINET and increases when compared with land pixels (in green). Many factors can play a role in this apparent disagreement between TROPOMI retrievals over land and sea, including that high surface albedos negatively influence the ALH, biassing the ALH towards the surface. The accompanied related statistic metrics are summarized in Table 3. The main reason for the strong underestimation of the aerosol layer height retrieved by the current algorithm from TROPOMI over land is the surface reflectivity climatology used in the forward model, leading to biased or non-convergent retrievals over land. Sensitivity studies showed that the observed large bias over land is reduced when fitting of the surface albedo as estimated from TROPOMI itself was included in the retrieval procedure. This will be further investigated in the near future and is intended to be implemented in future versions of the ALH L2 product.
Table 3Statistics of the comparison between TROPOMI and EARLINET ALH data sets.

a Number of co-locations. b Correlation coefficient. c Slope from linear regression fit. d Y intercept of linear regression fit. e Mean bias. f Relative bias. g Root-mean-square error.
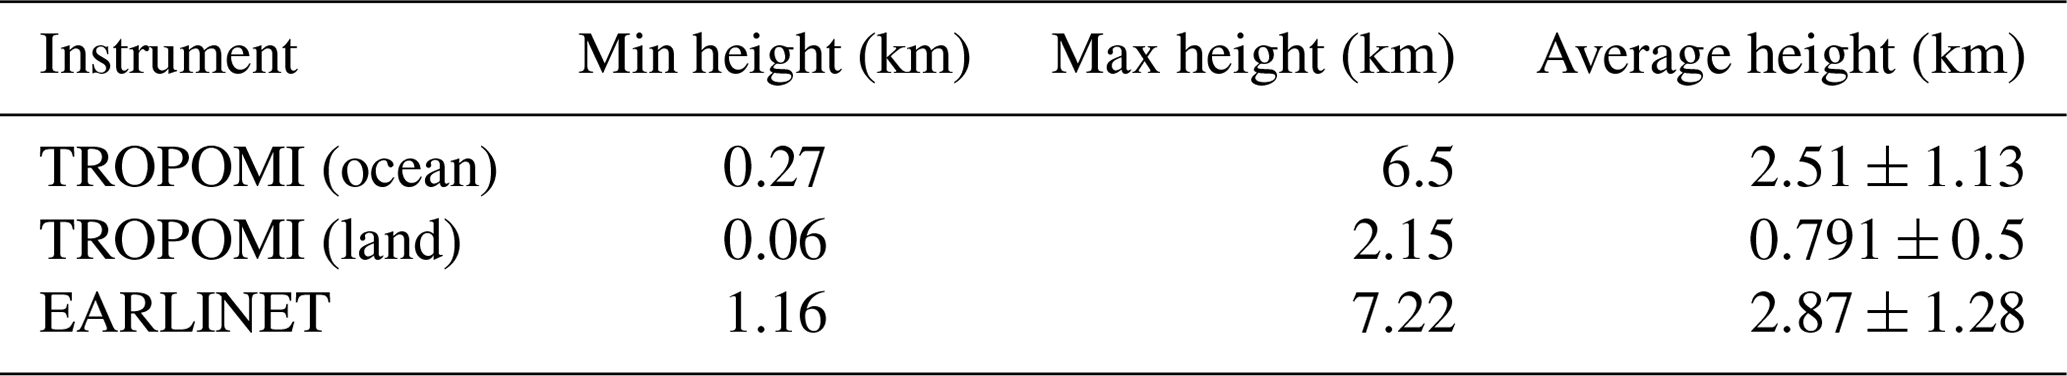
The mean maximum layer heights for all cases are, on average, 2.51±1.13 km (ranging between 0.27 and 6.5 km) and 0.791±0.5 km (ranging between 0.06 and 2.15 km) for TROPOMI ocean and land pixels, respectively. For the case of EARLINET data the mean layer height is 2.87±1.28 km (ranging between 1.16 and 7.22 km). We have to note again that the overlap effect and the station altitude are taken into account for the calculation of the lidar ALH, following the assumptions discussed in Sect. 2. The above-mentioned statistics are summarized in Table 4.
Table 4Layer height retrievals (min, max, and average) of the EARLINET and TROPOMI ALH co-locations.
The possibility of multiple atmospheric aerosol layers is a challenging feature for a passive sensor to retrieve and obviously affects ALH. We hence performed a separate analysis for the cases where only one layer was detected and for the cases where two or more layers were detected by EARLINET. We apply the WCT approach on the backscatter profiles to distinct the aerosol layers in an automatic way for all the cases, as described in Michailidis et al. (2021). Overall, the lidar data reveal the presence of a single aerosol layer in 57.1 % (N=36) of sample cases and a multi-layer structure (two or more layers) the 42.9 % (N=27) of the total sample cases. It was found that the mean bias of the ALH differences does not significantly vary (ocean: km; land: km) when multiple layers exist in the atmospheric scene, but we cannot say with certainty that it is generally true due to the use of the limited validation data set. Overall, among all the cases, the best performance of the TROPOMI ALH is recorded in cases of single well-developed dust layers. However, further research is needed to substantiate the observations and make conclusive quantitative statements. Using the WCT method for analysing the lidar profiles for validation purposes adds value in the case of multi-layer structures, but to refine this automated technique more cases have to be analysed in the future as they become available.
Another factor that can affect the satellite-ground based intercomparison of measurements or products is the topography. Over areas with a complex terrain, vertical inconsistencies between ground-based and satellite retrievals may appear due to orography-induced disturbances in the aerosol layer height. According to the statistics summarized in Table 5, the correlative measurements between the mountainous EARLINET stations (Potenza, Granada, Évora) and the S5P overpasses show similar mean biases to coastal stations (Limassol, Lecce, Antikythera, Athens). The complex topography, in terms of geographical characteristics, and the horizontal distance between the TROPOMI retrieved pixels and the ground-based lidar sites are, however, features that should also be examined when inter-comparing EARLINET and TROPOMI aerosol layer heights.
Table 5Clustering of EARLINET stations with respect to topographical features and the corresponded TROPOMI-EARLINET mean bias. Details about the EARLINET stations are provided in Table 1.
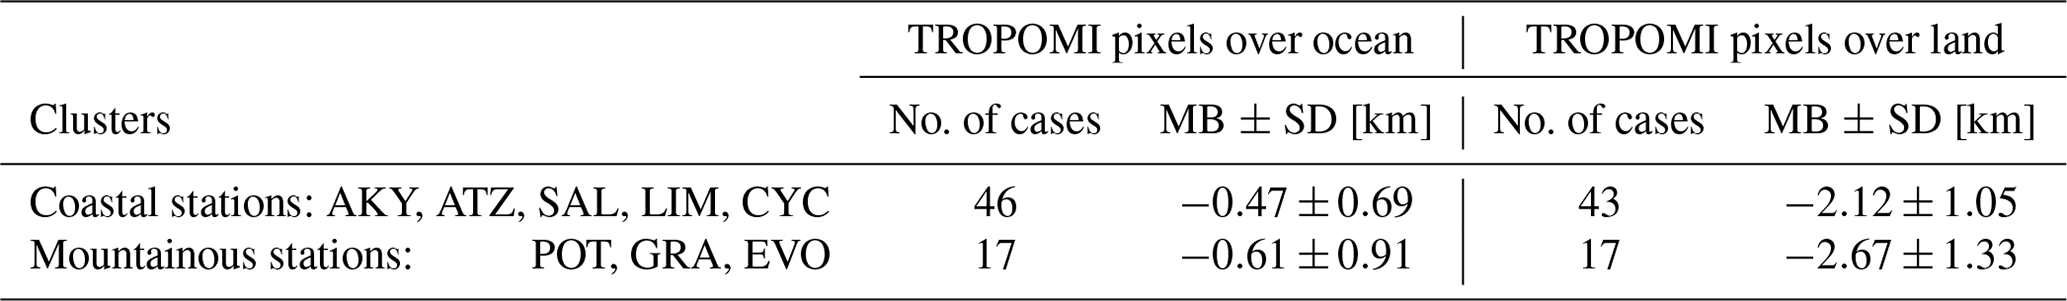
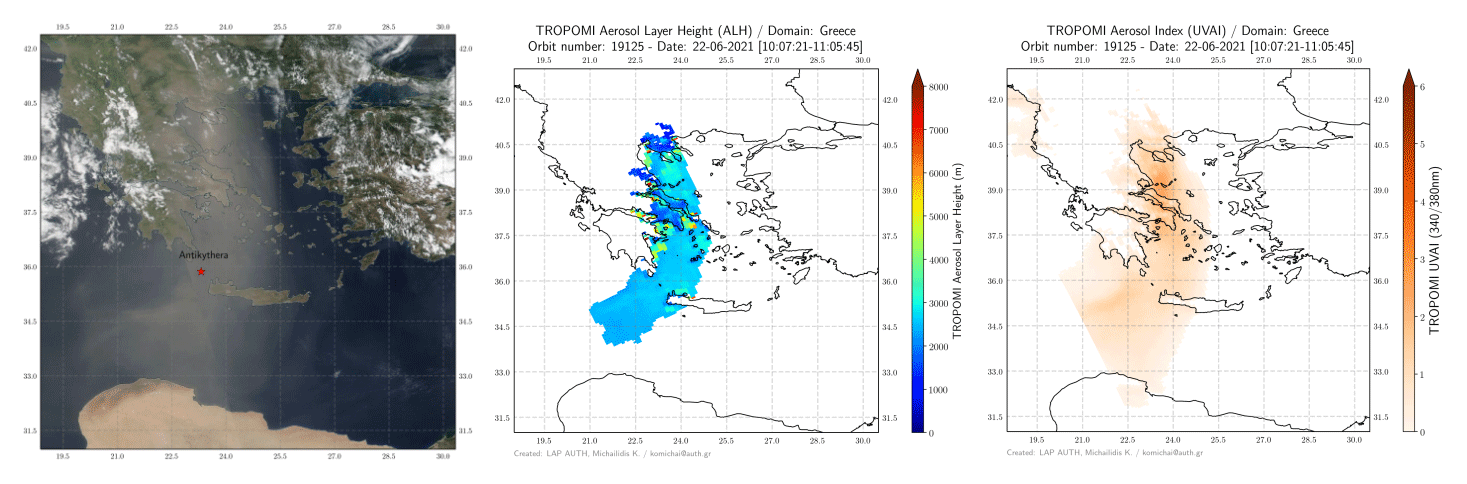
Figure 3Suomi-NPP VIIRS (left) true-colour image on the 22 June 2021. The red star indicates the position of the Antikythera lidar station. TROPOMI ALH (centre) and TROPOMI UVAI (right) over Greece.
3.2 Case studies: analysis and results
A total of 3 typical days with sufficient aerosol load over the Mediterranean were selected to illustrate the performance of the TROPOMI ALH product over scenes with strong aerosol load. These cases refer to Antikythera, Évora, and Potenza lidar observations during extended dust and smoke events. The selected cases include (a) a Saharan dust outbreak over the eastern Mediterranean region on 22 June 2021 and (b) a smoke aerosol plume transported during 4 d between the 24 and the 27 October 2020, originating from the large wildfire episodes in the California region (North America).
3.2.1 Dust case over the eastern Mediterranean: 22 June 2021, PANGEA observatory (Greece)
On 22 June, the eastern Mediterranean was affected by a strong dust episode originating from North Africa. On this day, the TROPOMI overpass over Greece was between ∼10:00 and 11:00 UTC. A lofted layer of dust was also clearly observed by the PollyXT system at PANGEA Antikythera station on the same day. The PANGEA observatory of the National Observatory of Athens (NOA) on the remote island of Antikythera is located across the travel path of different air masses, providing continuous monitoring of essential climate variables in the Eastern Mediterranean (Kampouri et al., 2021). A PollyXT NOA lidar (Engelmann et al., 2016) has been installed for PANGEA observations at Antikythera since August 2018. This multi-wavelength system is part of the EARLINET community, with round-the-clock operational capabilities, providing vertical distributions of aerosol properties at different wavelengths. The dust plume can clearly be seen in Fig. 3 (left) over Greece from the VIIRS/Suomi-NPP true-colour image for this day (VIIRS images are generated from https://wvs.earthdata.nasa.gov/; last access: 1 May 2022). The red star symbol indicates the location of the PANGEA lidar station at Antikythera. Figure 3 shows the TROPOMI ALH and UVAI (centre and right panels, respectively) product retrievals during the investigated dust episode. Comparing the TROPOMI product maps to the VIIRS image, it can be seen that the large positive UVAI pixels and elevated aerosol layers are located at the detected plumes. We note here that a recent publication addresses the treatment of clouds in the UVAI parameterization for OMI/Aura observations (Torres et al., 2018), and such considerations should be made in studies that depend numerically on the UVAI atmospheric parameter.
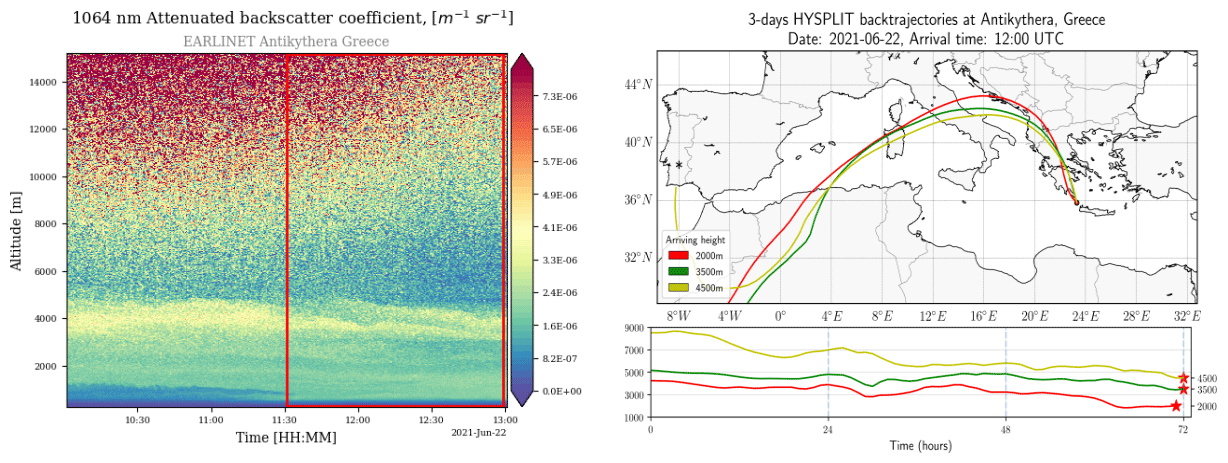
Figure 4Temporal evolution of the total attenuated backscatter signal from the PANGEA PollyXT at 1064 nm (left) and 3 d back trajectories arriving at Antikythera, Greece, on 22 June 2021 at 12:00 UTC (right, HYSPLIT accessible at https://www.ready.noaa.gov, last access: 2 June 2022).
Figure 4 (left) presents the total attenuated backscatter signal time series for the PollyXT at 1064 nm over Antikythera between 10:00–13:00 UTC on 22 June 2021. A homogeneous layer can be identified throughout the day below 5 km (Fig. 5). The aerosol load is mainly between 500 and 4500 m, and the sky above the site is free of cloud during the TROPOMI overpass time (thick red line). In addition, in order to verify the origin of the detected aerosol layers, we calculated back trajectories by using the HYSPLIT model (Hybrid Single-Particle Lagrangian Integrated Trajectory; available online: https://www.ready.noaa.gov/HYSPLIT.php, last access: 1 May 2022; Stein et al., 2015). The temporal evolution of 3 d backward trajectories for 22 June and selected arrival heights (2000 m (red), 3500 m (green), and 5000 m (yellow)) is illustrated in Fig. 4 (right). As can be seen, the air masses that arrived over Antikythera station follow a pattern originating from northwestern Africa.
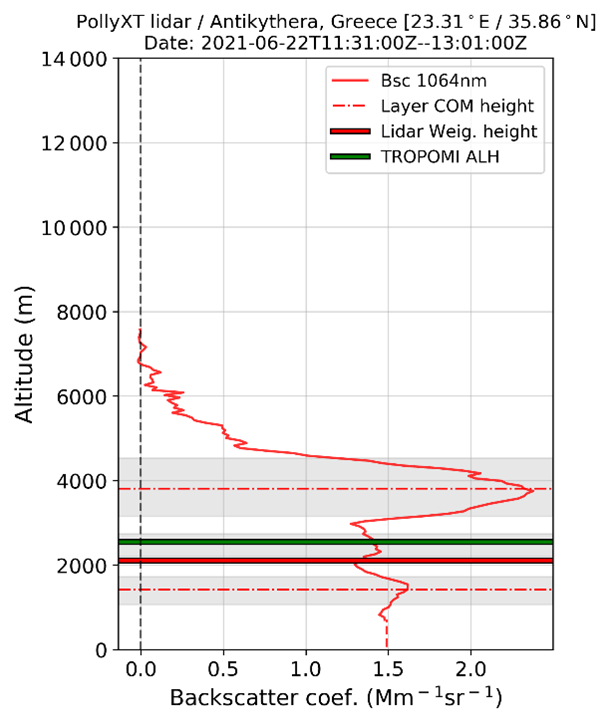
Figure 5Lidar backscatter profile at 1064 nm (ALHbsc, red line) at Antikythera, Greece, on 22 June 2021. The lidar-weighted aerosol height calculated by Eq. (1) is shown as a thick red line. The calculated centre of mass (COM) of the two identified layers is shown as a dashed–dotted red line, and their thickness is shown by the grey areas. The TROPOMI mean ALH is given as a thick green line.
For this event, the TROPOMI ALH spatially averaged values and the EARLINET temporally averaged backscatter coefficient profiles (between 11:30 and 13:00 UTC) are qualitatively compared in Fig. 5. Two optically thin layers with a thickness of less than 300 m were detected, with their centres of mass shown as dashed–dotted red lines and spreads as grey areas. TROPOMI detects this layer at 2550 m, whereas the ALHbsc calculated by applying Eq. (1) to the lidar profiles places it at 2105 m. An agreement within 500 m between the satellite and ground-based lidar systems is hence found for this clear aerosol scene, within the target requirement for the TROPOMI ALH product (ATBD; de Graaf et al., 2022). The presented case study indicates that the mean ALH value retrieved by the TROPOMI is in satisfactory agreement with the calculated ALHbsc from the lidar profile under cloud-free conditions where homogeneous aerosol layers are developed, confirming the findings of Griffin et al. (2020) and Nanda et al. (2020).
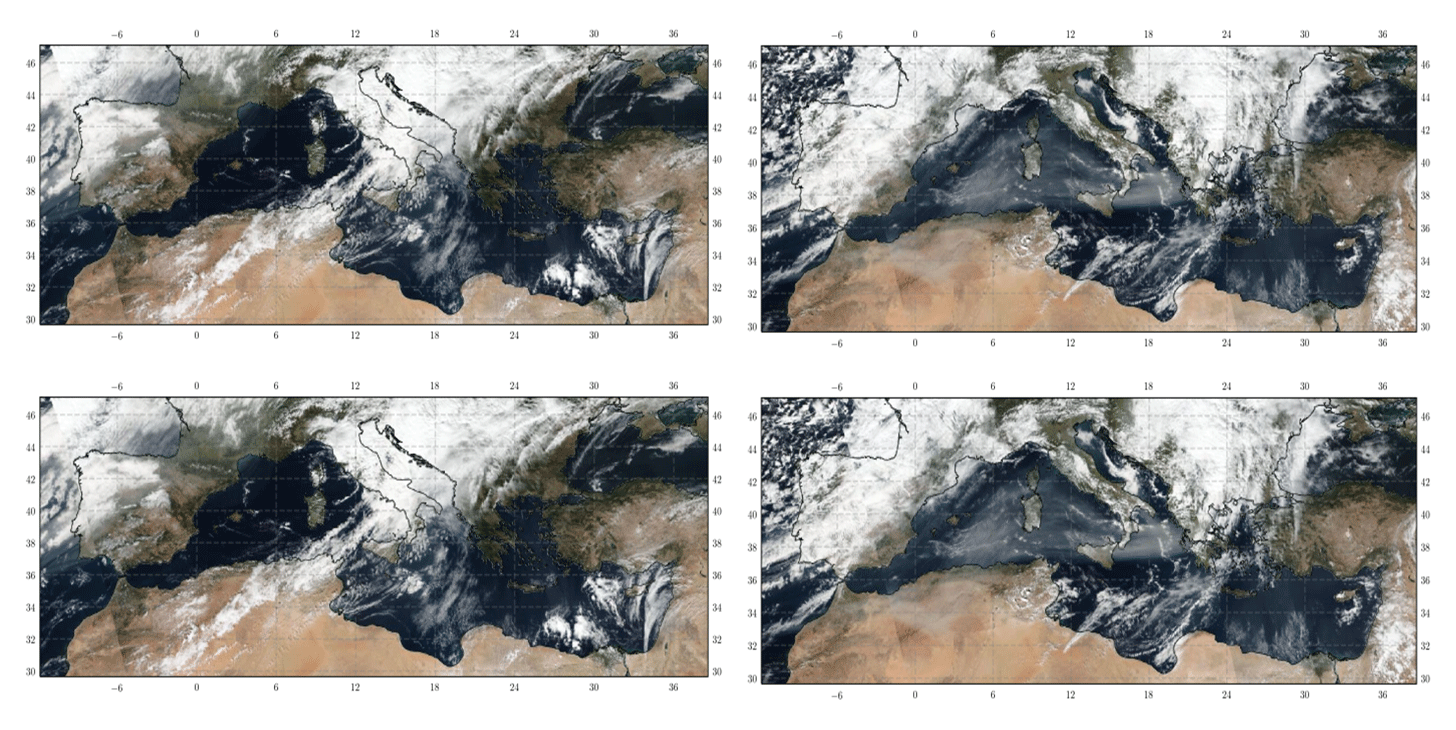
Figure 6VIIRS/Suomi NPP true-colour images for the four smoke scenes on 24–27 October 2020 (maps are generated from NASA Worldview Snapshots: https://wvs.earthdata.nasa.gov/, last access: 2 June 2022).
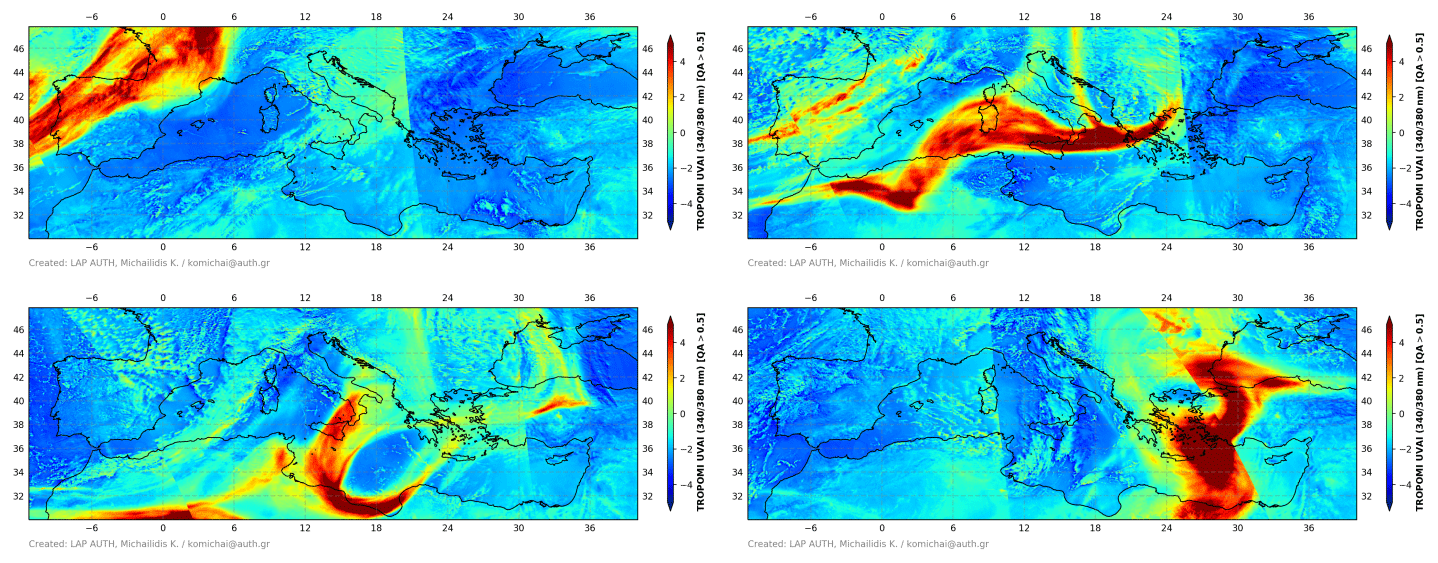
Figure 7TROPOMI UV aerosol index (UVAI) retrievals during the smoke plume transport over the Mediterranean during 24–27 October 2020.
Using the WCT algorithm on the βaer profile at 1064 nm, we can also extract the geometrical properties of detected layers. Once the top and the base of the aerosol layer are identified, the Zcom and optical properties of each aerosol layer can be also estimated. In this way, we can also investigate if there are strong variations in the baer (or bsc), which may lead to an identification of a separate layer. For the predominant thick layer (upper layer shown in Fig. 5), the retrieved geometric properties are layer base (3150 m), layer top (4350 m), layer thickness (2200 m), and layer centre of mass (4000 m). This example amply demonstrates that when using the WCT technique as a reference, in the presence of two layers with different spreads, the best agreement with the satellite estimate is not necessarily found for the optically thickest one. The representativeness of the TROPOMI ALH when multiple layers are present is undoubtedly an issue for further investigation in the future.
3.2.2 Smoke advection over the Mediterranean from Californian fires
In mid-October 2020, a series of wildfires took place in northern California resulting in thousands of square kilometres of boreal forest being burned and causing a huge amount of smoke to enter the atmosphere. The emissions caused extreme air pollution conditions with poor visibility throughout the area for several days. The TROPOMI sensor has been monitoring these wildfires, and tracked the smoke as it travelled all the way across North America and the Atlantic Ocean to arrive in Mediterranean (Baars et al., 2021; Ansmann et al., 2021). These smoke aerosol layers were transported from the US West Coast towards Europe within 4–5 d. The smoke arrived over the Iberian Peninsula in southwestern Europe on 24 October (Fig. 6a), just in time for a regular overpass of TROPOMI over the Iberian Peninsula. As the plume was transported along the Mediterranean, it was detected over southern Italy and Greece, shown in the true-colour images from VIIRS/Suomi-NPP (Fig. 6b to d). The S5P trails behind Suomi-NPP by 3.5 min in local time ascending node, allowing its swath to remain within the scene observed by Suomi-NPP. We have to note here that the ALH can be very sensitive to cloud contamination as aerosols and clouds can be difficult to distinguish. In general, the VIIRS cloud mask has good performance for pixels covered by aerosol plumes, but in many cases where very thick layers are detected the cloud mask can misclassify the retrieval pixels as cloudy pixels with high cloud fraction. The equivalent daily TROPOMI UVAI and ALH product retrievals are presented in Figs. 7 and 8, respectively. The detected smoke plumes are highlighted by large positive values of UVAI, which are in contrast to clouds that typically exhibit a negative UVAI and/or values close to zero (Torres et al., 1998).
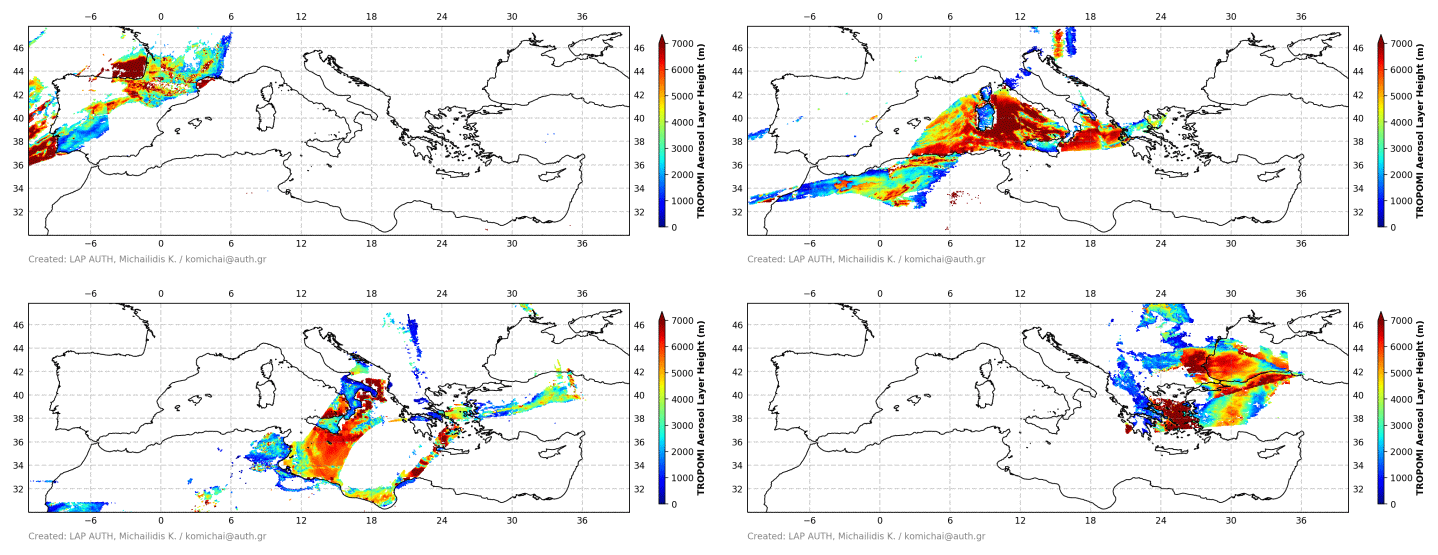
Figure 8TROPOMI aerosol layer height (ALH) retrievals during the smoke plume transport over the Mediterranean during 24–27 October 2020.

Figure 9VIIRS Suomi-NPP true-colour image on 24 October 2020 over the Iberian Peninsula capturing the smoke plume (left). The red star indicates the position of the Potenza lidar station, TROPOMI ALH (middle) and UVAI (right) retrievals at 340 and 380 nm. Missing ALH pixels are flagged by a cloud or have negative AI values.
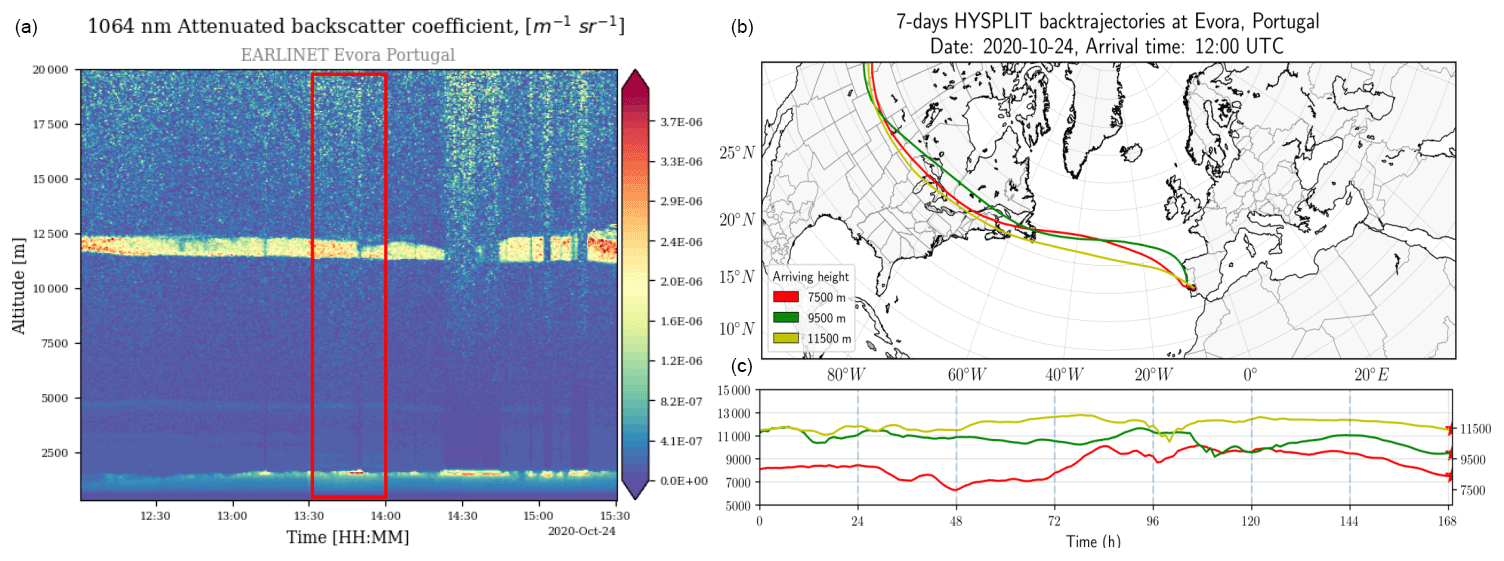
Figure 10(a) Temporal evolution of the total attenuated backscatter signal from the PAOLI PollyXT lidar system at 1064 nm showing the detection of the smoke cloud, and (b) 7 d HYSPLIT back trajectories arriving at Évora, Portugal on 24 October 2020 at 12:00 UTC.
Smoke case over western Mediterranean: 24 October 2020, Évora (Portugal)
On 24 October 2020, during the Suomi-NPP satellite overpass, the VIIRS sensor captured the true-colour image (Fig. 9, left) showing a large amount of smoke plumes in the western half of the Iberian Peninsula , particularly in the northwestern areas facing the Atlantic Ocean. The selected scene is also strongly affected by the presence of clouds. TROPOMI overpassed Évora around 12:30 UTC on this day and recorded very high values related to UVAI values (>5) (Fig. 9, right) and elevated aerosol plumes corresponding to high ALH values (Fig. 9, centre). The maximum altitude in the TROPOMI AER_LH data is about ∼8 km. The white spaces in the TROPOMI product maps indicate no valid TROPOMI retrievals over these areas.
Figure 10a illustrates the temporal evolution of the observed aerosol plume by means of the time–height cross sections of the 1064 nm total attenuated backscatter coefficient for the time period from 12:00 to 17:55 UTC on the 24 October. As observed in the time series obtained from PollyNet (https://polly.tropos.de/, last access: 1 May 2022), a significant particle load is detected after 11:00 UTC at approximately 10–12 km. The dashed red box indicates the temporal averaging of these lidar signals close to the S5P overpass time. The Portable Aerosol and Cloud Lidar (PAOLI) installed at the Évora Atmospheric Sciences Observatory (EVASO) (38.57∘ N, 7.91∘ W; 293 m a.s.l.) is a multiwavelength Raman lidar of the type PollyXT (Baars et al., 2016; Salgueiro et al., 2021), part of the European Aerosol Research Lidar Network (EARLINET). Backward trajectories shown in Fig. 10b, generated with the HYSPLIT model, were used to determine the origin of the air masses carrying aerosol plumes arriving at the Évora site at the relevant heights (7500, 9500, and 11 500 m). They confirmed that the relevant air masses came from areas over Californian forest fires detected by VIIRS.
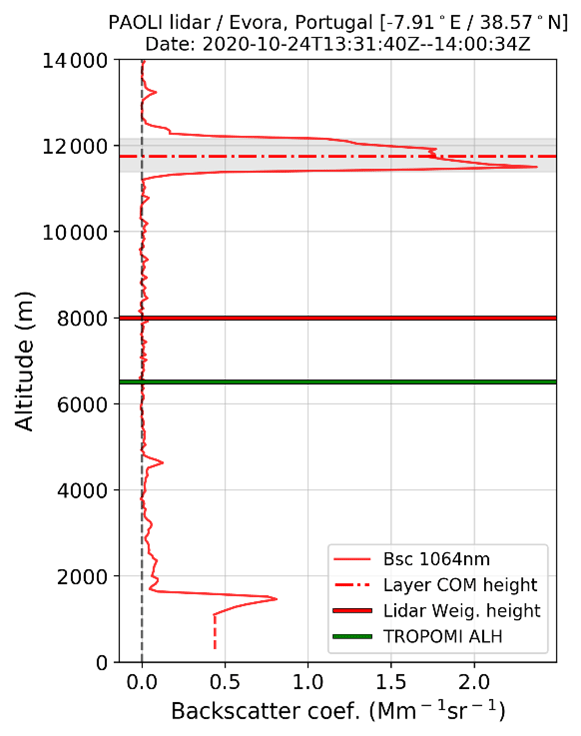
In Fig. 11 the retrieved vertical profile of the observations with the PAOLI PollyXT lidar is presented. The temporally closest backscatter profile is used to extract the ALHbsc and compare against the TROPOMI ALH retrievals. The average backscatter profile at 1064 nm for the time period from 13:30 to 14:00 UTC on 24 October 2020 is shown. The TROPOMI observations report an average layer at 6500 m, while the calculated ALHbsc (following Eq. 1) from the lidar profile places it at 7980 m. As in the analysis presented above in Sect. 3.2.1, we also applied the WCT method on the backscatter vertical profile in order to extract the aerosol boundaries of the detected aerosol layers in an automatic way. The WCT technique also reveals a clear single layer between 11 000 and 12 500 m with maximum backscatter value ∼1.8 Mm−1 sr−1 and centre of layer mass at 11 800 m. For this case, we note the large discrepancy between both lidar layer identification techniques and the TROPOMI ALH, the reasons for which warrant further investigation in the future.
Smoke case over the central Mediterranean: 26 October 2020, Potenza (Italy)
On 26 October, the same smoke plume spread towards the central Mediterranean due to the easterly prevailing winds across Italy and Greece. Here we present a case study within this smoke episode over the Potenza lidar station in Italy on 26 October 2020. A significant aerosol load is observed mainly over the south of Italy. The true-colour image (Fig. 12, left) captured by VIIRS on board Suomi-NPP provides the context for the retrievals shown next. The location of the smoke plume is clearly seen in the TROPOMI ALH and UVAI images (Fig. 12, middle and right) during the Sentinel-5P overpass between 11:20 and 12:20 UTC. The TROPOMI UVAI shows a wide range of values with several patches with no retrievals due to the presence of clouds. This case is also emphasizing the issue related to the limitation of satellite measurements over land areas where the effect of the surface reflectance is dominant. The contrast observed between land and sea regarding the retrieval of the ALH product and the surface albedo values is obvious, as can be seen from the colour scale in ALH retrievals. The ALH retrievals are very clearly biased over land, where the high surface albedo biases ALH low.

Figure 12VIIRS Suomi-NPP true-colour image of 26 October 2020 over the central Mediterranean capturing the smoke plume (left). The red star indicates the position of the Potenza lidar station. TROPOMI ALH (middle) and UVAI (right) retrievals. Missing ALH pixels are flagged by a cloud or have negative AI values.
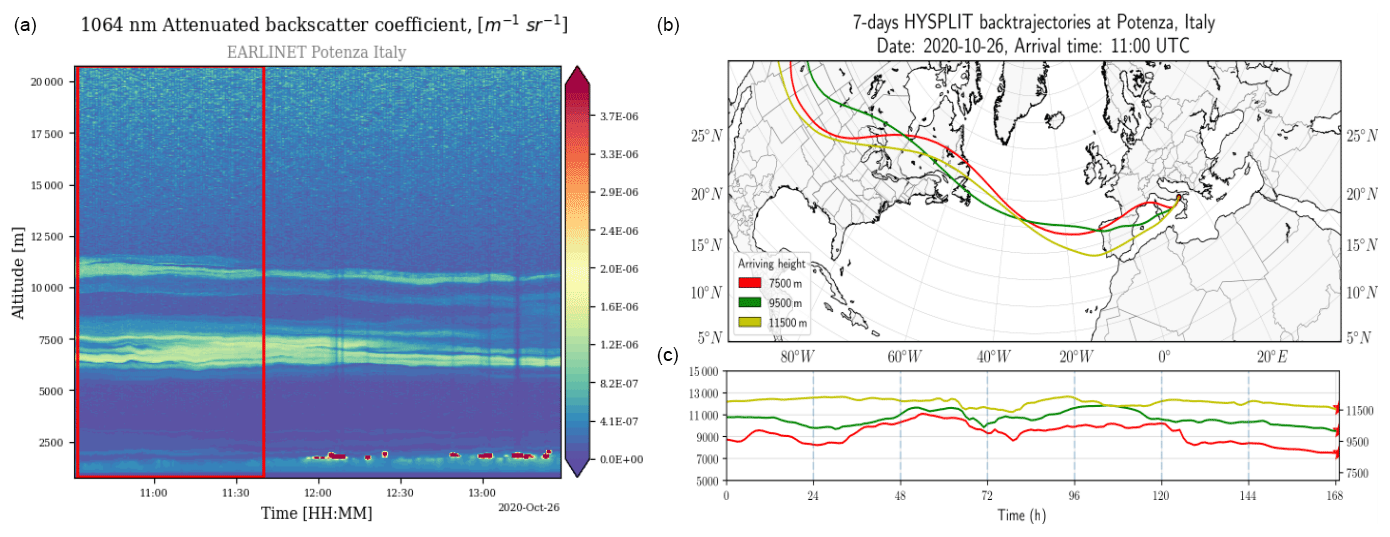
Figure 13(a) Temporal evolution of the total attenuated backscatter signal from the MUSA lidar system at 1064 nm showing the detection of the smoke cloud, and (b) 7 d HYSPLIT back trajectories arriving at Potenza, Italy, on 26 October 2020 at 11:00 UTC.
The event is extensively recorded on 26 October 2020 at the Potenza lidar station. MUSA is the lidar system (Madonna et al., 2011) deployed at CNR-IMAA Atmospheric Observatory (CIAO) in Potenza (40.60∘ N, 15.72∘ E, 760 m a.s.l.). Figure 13a shows the total attenuated backscatter time series at 1064 nm measured by the MUSA system during the smoke event. The lidar observations started on 26 October 2020 at 10:00 UTC and lasted almost continuously until 13:30 UTC. The dashed red box indicates the temporal averaging of the lidar signals (10:00–11:30 UTC) close to the TROPOMI/S5P overpass time. Multi-layer structures were found, and smoke particles appeared in the free troposphere between 6000 and 11 000 km above sea level (a.s.l.). The intense part of the smoke plume is located about 300 km south of the Potenza EARLINET station where the atmospheric conditions are different and show different TROPOMI retrievals from above the station. The temporal evolution of 7 d backward trajectories for this day (arrival heights: 7500 (red), 9500 (green)m and 11 500 m (yellow)) is illustrated in Fig. 13b. As can be seen, the air masses that arrived over Potenza station seem to originate from North America and follow an almost straight route towards Italy.
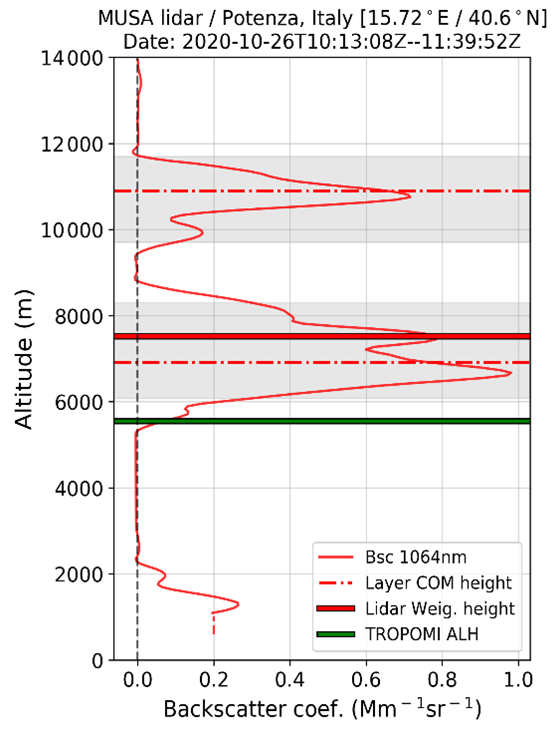
In Fig. 14 the retrieved vertical profile of the observations with MUSA lidar is presented. The backscatter profile that is closest in time is used in order to extract the ALHbsc and compare it against TROPOMI ALH retrievals. The averaged backscatter profile at 1064 nm is shown for the time period from 10:15 to 11:40 UTC on 24 October 2020. Two optical elevated layers with a thickness of ∼2 km were detected, with TROPOMI detecting this layer at 5650 m, whereas the calculated ALHbsc from applying Eq. (1) to the lidar profile places it at 7800 m. For this case, which shows two well-developed layers, the geometric properties retrieved by applying the WCT technique place the first detected layer at 7150 m and the second at 11 070 m, and these also have a thickness of ∼2 km. As with the previous examples, here we also find a discrepancy between both lidar aerosol heights and the satellite estimation of the aerosol height. Clearly the AER_LH is placed much lower than both calculated altitudes of the lidar profile.
This case of smoke at very high altitudes from intense biomass burning in North America in 2020 shows a notable difference with lidar measurements, revealing a source of limitations of the current operational S5P L2_AER_LH product. The current implementation of the algorithm is based on a neural network forward model and an optimal estimation scheme in the retrieval for spectral fitting with various aerosol layer pressures and aerosol optical thicknesses in the O2 A band. The limitation exists due to the fact that the algorithm has not been trained for very high altitudes, and the versions of the algorithm used in our study do not take these altitudes into account, as shown for these two cases of elevated smoke layers. Furthermore, scaling of the assumed pressure thickness must be considered for aerosol plumes at very high altitudes (low pressure) observed mainly for biomass burning plumes and volcanic ash and sulfate aerosols. The ALH neural network is currently trained for ambient pressures between 1000 and 75 hPa, which is about 12 km altitude maximally, and plumes above these heights cannot be resolved.
Table 6Summary of validation statistics for TROPOMI ALH using the O2A algorithm.

The TROPOMI aerosol layer height (ALH) is a new and unique product providing global observations of aerosol height. TROPOMI aerosol layer heights can add value to the modelling communities by improving air quality forecasting and radiative forcing studies. Aerosol plume heights from TROPOMI have the advantage of daily global coverage. This is the first work in which TROPOMI ALH retrievals are validated against EARLINET lidar observations, and the results provide an early evaluation of their applicability for monitoring aerosol height levels in a large area such as Mediterranean and Europe. The choice of the EARLINET stations close to the sea has been performed considering the limitation of the TROPOMI ALH algorithm over land surfaces in providing accurate retrievals. Using these sites presented an opportunity to study the effect of the surface albedo on the validation of ALH product performing separate analyses over land and sea. The data used as reference for the validation were not part of a specifically designed validation campaign, which explains the small number of co-located cases found. This paper presents a cross-comparison analysis between TROPOMI and EARLINET data and provides a simple and well-developed methodology for comparing these different data sets. Lidar instruments retrieve the vertical backscatter coefficient, which is not directly comparable to the TROPOMI ALH product. Thus, the weighted backscatter height (ALHbsc) has to be calculated from the available backscatter profiles in the frame of this study. Coincidences within a 150 km radius from the lidar station are used for direct observations, with a maximum of 4 h time difference. All the input data sets considered in the study have been previously pre-processed at high resolution by using the EARLINET single calculus chain (SCC) tool. Overall, for seven selected EARLINET stations across the Mediterranean, 63 coincident aerosol cases were found during the time period June 2018–July 2022 for the comparison against satellite retrievals. The statistical results demonstrate the potential of the TROPOMI instrument to detect aerosol layers under cloud-free atmospheric conditions with significant aerosol load, such as dust and smoke plumes.
Despite the different measuring concept that the two instruments used for retrievals (passive and active), a good agreement was found between TROPOMI retrievals and ground-based lidar measurements, demonstrating that TROPOMI shows a quite promising potential for the characterization of the aerosol vertical distributions on a global scale. By defining a backscatter-weighted aerosol height from EARLINET aerosol backscatter profile products (ALHbsc), the quantitative validation at pixels over the selected EARLINET stations illustrates that TROPOMI ALH is consistent with ALHbsc, with a high correlation coefficient R=0.82 (R=0.51) and a mean bias about km ( km) over ocean and land pixels, respectively. It appears that aerosol layer altitudes retrieved from TROPOMI are systematically lower than altitudes from the lidar retrievals. The target requirement for the accuracy and precision of the retrieved aerosol layer height is 0.5 km or 50 hPa, while the threshold requirement is 1 km or 100 hPa. Overall, our results show that the TROPOMI product complies (under these conditions) with the S5P mission requirements and that our findings are in a good agreement with other TROPOMI ALH validation studies. The outcomes of this study, including the findings of previous validation work, are summarized in Table 6. Nanda et al. (2020) and Chen et al. (2021) also discuss the challenges associated with the validation of TROPOMI ALH. These challenges arise mainly from the large spatio-temporal variability of aerosols, the dependency of the products on different geophysical parameters (e.g. surface albedo), and different instrument sensitivities. The effect of the surface albedo has been investigated through the sensitivity tests presented in detail in previous studies (Sanders and de Haan, 2015; Dubuisson et al., 2009) covering a large number of surface albedo values, and these studies showed that including the surface albedo in the optimal estimation fit considerably improves the ALH in most cases.
The wavelet covariance transform method was also applied to the ground-based lidar profiles so as to quantify the effect of multi-layer structures on the comparisons between TROPOMI and lidar aerosol layer height. This method provides better insight as to the altitude ranges that the two instruments are sensitive to; however, more case studies need to be analysed in detail to draw conclusions concerning which sensed layer the TROPOMI algorithm is more sensitive to.
This study highlights the importance of the synergistic use of active (ground-based lidars) and passive (satellite) observations and suggests a promising usage of TROPOMI ALH for understanding the details of the presence and transport of aerosol layers. The results presented here encourage the operational usage of the presented methodology approach in validation processes for satellite aerosol height products using lidar data from EARLINET. The increased availability of advanced and high-quality-assured profiling data from EARLINET lidars will form a scientific background to improve performance of passive satellite sensors and lead to a better understanding of the role of the aerosol height regarding air quality and climate. The inclusion of more stations from continental Europe will improve the significance of the results and will allow for the study of the impact of different aerosol types on the comparisons. In addition, it will make it feasible to examine possible geographical dependencies. Lidar measurements within the EARLINET network are continuously performed and can be used in the coming years for the validation of the new satellite generations, such as the Copernicus Sentinel-4 and Sentinel-5 satellites.
The EARLINET data used in this study are available from the authors and upon registration from the EARLINET web page at https://data.earlinet.org/earlinet/login.zul (Pappalardo et al., 2014). The TROPOMI ALH data are publicly available at the Copernicus Open Access Hub (https://scihub.copernicus.eu/, last access: 10 May 2022; https://doi.org/10.5270/S5P-j7aj4gr (Copernicus Sentinel-5P, 2018) for v1, https://doi.org/10.5270/S5P-7g4iapn (Copernicus Sentinel-5P, 2021) for v2). HYSPLIT data as described by Stein et al. (2015) can be found at https://www.ready.noaa.gov/HYSPLIT.php (last access: 1 May 2022).
KM carried out the processing of satellite and lidar measurements, prepared the figures, and wrote the original draft of the manuscript with contributions from all co-authors. MEK and DB were responsible for the methodology and conceptualization of the paper. LM, NP, EM, IT, and AG performed the lidar measurements and ensured the provision of the QA EARLINET data. PV and MdG worked on the development of the TROPOMI AER_LH product and were responsible for providing satellite data and a detailed description of the product. KM contributed to the development of the automatic algorithm for the aerosol layer detection using lidar data. AP, R-EM, MM, LAA, DB, MJC, VS, SR, SRP, and MRP reviewed the case studies of the selected EARLINET stations, as presented in the paper. All authors participated in scientific discussions on this study and reviewed and edited the manuscript during its preparation phase.
The contact author has declared that none of the authors has any competing interests.
Publisher's note: Copernicus Publications remains neutral with regard to jurisdictional claims in published maps and institutional affiliations.
This article is part of the special issue “Dust aerosol measurements, modelling and multidisciplinary effects (AMT/ACP inter-journal SI)”. It is not associated with a conference.
We are grateful to all co-primary investigators of the EARLINET sites used in this study for maintaining their instruments and providing their data to the community. This research was supported by data and services obtained from the PANhellenic Geophysical Observatory of Antikythera (PANGEA) of the National Observatory of Athens (NOA), Greece. We thank the PollyNet group, especially Ronny Engelmann and Holger Baars, for their support during the development and operation of the PollyXT lidar of NOA. The NOA team acknowledges the support of Stavros Niarchos Foundation (SNF). Rodanthi-Elissavet Mamouri and Argyro Nisantzi acknowledge the “EXCELSIOR”: ERATOSTHENES: EXcellence Research Centre for Earth Surveillance and Space-Based Monitoring of the Environment H2020 Widespread Teaming project (https://www.excelsior2020.eu, last access: 31 January 2023). The “EXCELSIOR” project has received funding from the European Union's Horizon 2020 Research and Innovation Programme under grant agreement no. 857510; from the Government of the Republic of Cyprus through the Directorate General for the European Programmes, Coordination, and Development; and from the Cyprus University of Technology. Daniele Bortoli, Maria João Costa, and Vanda Salgueiro are co-funded by national Portuguese funds through the FCT (Fundação para a Ciência e Tecnologia), in the framework of the ICT project with the references UIDB/04683/2020 and UIDP/04683/2020, as well as through the TOMAQAPA (PTDC/CTAMET/29678/2017) and CILIFO (0753_CILIFO_5_E) projects. We acknowledge the use of imagery from the Worldview Snapshots application (https://wvs.earthdata.nasa.gov/, last access: 15 May 2022), part of the Earth Observing System Data and Information System (EOSDIS).
This research has been supported by the “Panhellenic Infrastructure for Atmospheric Composition and Climate Change” project (grant no. MIS 5021516), which is implemented under the action “Reinforcement of the Research and Innovation infrastructure” and co-financed by Greece and the European Union (European Regional Development Fund). The writing and editing of this paper was carried out as part of the ESA-funded Quality Assurance for Earth Observation (IDEAS-QA4EO) framework contract. The authors also acknowledge the financial support of the European Space Agency “Preparation and Operations of the Mission Performance Centre (MPC) for the Copernicus Sentinel-5 Precursor Satellite”. The Limassol, Cyprus, observations have been supported by the SIROCCO project (grant no. EXCELLENCE/1216/0217) and AQ-SERVE project (INTEGRATED/0916/0016) co-funded by the Republic of Cyprus and the structural funds of the European Union for Cyprus through the Research and Innovation Foundation. The PollyXT-CYP lidar is funded by the Federal Ministry of Education and Research (BMBF) via the PoLiCyTa project and its operation is funded by the EU H2020 EXCELSIOR project. Eleni Marinou and Vassilis Amiridis were supported by the European Research Council (ERC) under Community's Horizon 2020 research and innovation framework programme (ERC) grant agreement no. 725698 (D-TECT).
This paper was edited by Stelios Kazadzis and reviewed by three anonymous referees.
Abril-Gago, J., Guerrero-Rascado, J. L., Costa, M. J., Bravo-Aranda, J. A., Sicard, M., Bermejo-Pantaleón, D., Bortoli, D., Granados-Muñoz, M. J., Rodríguez-Gómez, A., Muñoz-Porcar, C., Comerón, A., Ortiz-Amezcua, P., Salgueiro, V., Jiménez-Martín, M. M., and Alados-Arboledas, L.: Statistical validation of Aeolus L2A particle backscatter coefficient retrievals over ACTRIS/EARLINET stations on the Iberian Peninsula, Atmos. Chem. Phys., 22, 1425–1451, https://doi.org/10.5194/acp-22-1425-2022, 2022.
Amiridis, V., Balis, D. S., Giannakaki, E., Stohl, A., Kazadzis, S., Koukouli, M. E., and Zanis, P.: Optical characteristics of biomass burning aerosols over Southeastern Europe determined from UV-Raman lidar measurements, Atmos. Chem. Phys., 9, 2431–2440, https://doi.org/10.5194/acp-9-2431-2009, 2009.
Amodeo, A., D'Amico, G., Giunta, A., Papagiannopoulos, N., Papayannis, A., Argyrouli, A., Mylonaki, M., Tsaknakis, G., Kokkalis, P., Soupiona, R., and Tzanis, C.: ATHLI16: the ATHens lidar intercomparison campaign, in: 28th International laser radar conference, Bucharest, Romania, 25–30 June 2017, 176, 09008, https://doi.org/10.1051/epjconf/201817609008, 2018.
Ansmann, A., Ohneiser, K., Mamouri, R.-E., Knopf, D. A., Veselovskii, I., Baars, H., Engelmann, R., Foth, A., Jimenez, C., Seifert, P., and Barja, B.: Tropospheric and stratospheric wildfire smoke profiling with lidar: mass, surface area, CCN, and INP retrieval, Atmos. Chem. Phys., 21, 9779–9807, https://doi.org/10.5194/acp-21-9779-2021, 2021.
Apituley, A., Pedergnana, M., Sneep, M., Veefkind, J. P., Loyola, D., Sanders, B., and de Graaf, M.: Sentinel-5 precursor/TROPOMI Level 2 Product User Manual Aerosol Layer Height, S5P-KNMI-L2-0022-MA, issue 2.0.1, 2021-11-15, CI-7570-PUM, https://sentinels.copernicus.eu/documents/247904/2474726/Sentinel-5P-Level-2-Product-User-Manual-Aerosol-Layer-Height.pdf, last access: 14 December 2021.
Baars, H., Kanitz, T., Engelmann, R., Althausen, D., Heese, B., Komppula, M., Preißler, J., Tesche, M., Ansmann, A., Wandinger, U., Lim, J.-H., Ahn, J. Y., Stachlewska, I. S., Amiridis, V., Marinou, E., Seifert, P., Hofer, J., Skupin, A., Schneider, F., Bohlmann, S., Foth, A., Bley, S., Pfüller, A., Giannakaki, E., Lihavainen, H., Viisanen, Y., Hooda, R. K., Pereira, S. N., Bortoli, D., Wagner, F., Mattis, I., Janicka, L., Markowicz, K. M., Achtert, P., Artaxo, P., Pauliquevis, T., Souza, R. A. F., Sharma, V. P., van Zyl, P. G., Beukes, J. P., Sun, J., Rohwer, E. G., Deng, R., Mamouri, R.-E., and Zamorano, F.: An overview of the first decade of PollyNET: an emerging network of automated Raman-polarization lidars for continuous aerosol profiling, Atmos. Chem. Phys., 16, 5111–5137, https://doi.org/10.5194/acp-16-5111-2016, 2016.
Baars, H., Radenz, M., Floutsi, A. A., Engelmann, R., Althausen, D., Heese, B., Ansmann, A., Flament, T., Dabas, A., Trapon, D., Reitebuch, O., Bley, S., and Wandinger, U.: Californian Wildfire Smoke Over Europe: A First Example of the Aerosol Observing Capabilities of Aeolus Compared to Ground-Based Lidar, Geophys. Res. Lett., 48, e2020GL092194, https://doi.org/10.1029/2020GL092194, 2021.
Balis, D., Amiridis, V., Nickovic, S., Papayannis, A., and Zerefos, C.: Optical properties of Saharan dust layers as detected by a Raman lidar at Thesaloniki, Greece, Geophys. Res. Lett., 31, L13104, https://doi.org/10.1029/2004GL019881, 2004.
Basart, S., Pérez, C., Cuevas, E., Baldasano, J. M., and Gobbi, G. P.: Aerosol characterization in Northern Africa, Northeastern Atlantic, Mediterranean Basin and Middle East from direct-sun AERONET observations, Atmos. Chem. Phys., 9, 8265–8282, https://doi.org/10.5194/acp-9-8265-2009, 2009.
Bellouin, N., Quaas, J., Gryspeerdt, E., Kinne, S., Stier, P., Watson-Parris, D., Boucher, O., Carslaw, K. S., Christensen, M., Daniau, A.-L., Dufresne, J.-L., Feingold, G., Fiedler, S. Forster, P., Gettelman, A., Haywood, J.M., Lohmann, U., Malavelle, F., Mauritsen, T., McCoy, D.T., Myhre, G., Mülmenstädt, J., Neubauer, D., Possner, A., Rugenstein, Μ., Sato, Y., Schulz, M., Schwartz, S. E., Sourdeval, O., Storelvmo, T., Toll, V., Winker, D., and Stevens, B.: Bounding global aerosol radiative forcing of climate change, Rev. Geophys., 58, e2019RG000660, https://doi.org/10.1029/2019RG000660, 2020.
Chen, X., Wang, J., Xu, X., Zhou, M., Zhang, H., Castro, G. L., Colarco, P. R., Janz, S. J., Yorks, J., McGill, M., Reid, S. J., de Graaf, M., and Kondragunta, S.: First retrieval of absorbing aerosol height over dark target using TROPOMI oxygen B band: Algorithm development and application for surface particulate matter estimates, Remote Sens. Environ., 265, 112674, https://doi.org/10.1016/j.rse.2021.112674, 2021.
Copernicus Sentinel-5P (processed by ESA): TROPOMI Level 2 Aerosol Layer Height products, Version 1, European Space Agency, https://doi.org/10.5270/S5P-j7aj4gr, 2018.
Copernicus Sentinel-5P (processed by ESA): TROPOMI Level 2 Aerosol Layer Height products, Version 2, European Space Agency, https://doi.org/10.5270/S5P-7g4iapn, 2021.
D'Amico, G., Amodeo, A., Baars, H., Binietoglou, I., Freudenthaler, V., Mattis, I., Wandinger, U., and Pappalardo, G.: EARLINET Single Calculus Chain – overview on methodology and strategy, Atmos. Meas. Tech., 8, 4891–4916, https://doi.org/10.5194/amt-8-4891-2015, 2015.
D'Amico, G., Amodeo, A., Mattis, I., Freudenthaler, V., and Pappalardo, G.: EARLINET Single Calculus Chain – technical – Part 1: Pre-processing of raw lidar data, Atmos. Meas. Tech., 9, 491–507, https://doi.org/10.5194/amt-9-491-2016, 2016.
de Graaf, M., Stammes, P., Torres, O., and Koelemeijer, R. B.: Absorbing Aerosol Index: Sensitivity analysis, application to GOME and comparison with TOMS, J. Geophys. Res.-Atmos. 110, 1–19, https://doi.org/10.1029/2004JD005178, 2005.
de Graaf, M., de Haan, J. F., and Sanders, A. F. J.: TROPOMI ATBD Aerosol Layer Height, issue 2.4.0, 2022-04-08, S5P-KNMI-L2-0006-RP, CI-7430-ATBD_Aerosol_Layer_Height, https://sentinel.esa.int/documents/247904/2476257/Sentinel-5P-TROPOMI-ATBD-Aerosol-Height, last access: 1 September 2022.
Dubuisson, P., Frouin, R., Dessailly, D., Duforêt, L., Léon, J.-F., Voss, K., and Antoine, D.: Estimating the altitude of aerosol plumes over the ocean from reflectance ratio measurements in the O2 A-band, Remote Sens. Environ., 113, 1899–1911, https://doi.org/10.1016/j.rse.2009.04.018, 2009.
Engelmann, R., Kanitz, T., Baars, H., Heese, B., Althausen, D., Skupin, A., Wandinger, U., Komppula, M., Stachlewska, I. S., Amiridis, V., Marinou, E., Mattis, I., Linné, H., and Ansmann, A.: The automated multiwavelength Raman polarization and water-vapor lidar PollyXT: the neXT generation, Atmos. Meas. Tech., 9, 1767–1784, https://doi.org/10.5194/amt-9-1767-2016, 2016.
Fernald, F. G.: Analysis of atmospheric lidar observations: some comments, Appl. Opt., 23, 652–653, https://doi.org/10.1364/AO.23.000652, 1984.
Freudenthaler, V., Linné, H., Chaikovski, A., Rabus, D., and Groß, S.: EARLINET lidar quality assurance tools, Atmos. Meas. Tech. Discuss. [preprint], https://doi.org/10.5194/amt-2017-395, in review, 2018.
Georgoulias, A. K., Marinou, E., Tsekeri, A., Proestakis, E., Akritidis, D., Alexandri, G., Zanis, P., Balis, D., Marenco, F., Tesche, M., and Amiridis, V.: A first case study of CCN concentrations from Spaceborne Lidar Observations, Remote Sens., 12, 1557, https://doi.org/10.3390/rs12101557, 2020.
Gerasopoulos, E., Amiridis, V., Kazadzis, S., Kokkalis, P., Eleftheratos, K., Andreae, M. O., Andreae, T. W., El-Askary, H., and Zerefos, C. S.: Three-year ground based measurements of aerosol optical depth over the Eastern Mediterranean: the urban environment of Athens, Atmos. Chem. Phys., 11, 2145–2159, https://doi.org/10.5194/acp-11-2145-2011, 2011.
Granados-Muñoz, M. J., Bravo-Aranda, J. A., Baumgardner, D., Guerrero-Rascado, J. L., Pérez-Ramírez, D., Navas-Guzmán, F., Veselovskii, I., Lyamani, H., Valenzuela, A., Olmo, F. J., Titos, G., Andrey, J., Chaikovsky, A., Dubovik, O., Gil-Ojeda, M., and Alados-Arboledas, L.: A comparative study of aerosol microphysical properties retrieved from ground-based remote sensing and aircraft in situ measurements during a Saharan dust event, Atmos. Meas. Tech., 9, 1113–1133, https://doi.org/10.5194/amt-9-1113-2016, 2016.
Griffin, D., Sioris, C., Chen, J., Dickson, N., Kovachik, A., de Graaf, M., Nanda, S., Veefkind, P., Dammers, E., McLinden, C. A., Makar, P., and Akingunola, A.: The 2018 fire season in North America as seen by TROPOMI: aerosol layer height intercomparisons and evaluation of model-derived plume heights, Atmos. Meas. Tech., 13, 1427–1445, https://doi.org/10.5194/amt-13-1427-2020, 2020.
Guerrero-Rascado, J. L., Olmo, F. J., Avilés-Rodríguez, I., Navas-Guzmán, F., Pérez-Ramírez, D., Lyamani, H., and Alados Arboledas, L.: Extreme Saharan dust event over the southern Iberian Peninsula in september 2007: active and passive remote sensing from surface and satellite, Atmos. Chem. Phys., 9, 8453–8469, https://doi.org/10.5194/acp-9-8453-2009, 2009.
Hassinen, S., Balis, D., Bauer, H., Begoin, M., Delcloo, A., Eleftheratos, K., Gimeno Garcia, S., Granville, J., Grossi, M., Hao, N., Hedelt, P., Hendrick, F., Hess, M., Heue, K.-P., Hovila, J., Jønch-Sørensen, H., Kalakoski, N., Kauppi, A., Kiemle, S., Kins, L., Koukouli, M. E., Kujanpää, J., Lambert, J.-C., Lang, R., Lerot, C., Loyola, D., Pedergnana, M., Pinardi, G., Romahn, F., van Roozendael, M., Lutz, R., De Smedt, I., Stammes, P., Steinbrecht, W., Tamminen, J., Theys, N., Tilstra, L. G., Tuinder, O. N. E., Valks, P., Zerefos, C., Zimmer, W., and Zyrichidou, I.: Overview of the O3M SAF GOME-2 operational atmospheric composition and UV radiation data products and data availability, Atmos. Meas. Tech., 9, 383–407, https://doi.org/10.5194/amt-9-383-2016, 2016.
Herman, J. R., Bhartia, P. K., Torres, O., Hsu, C., Seftor, C., and Celarier, E.: Global distribution of UV-absorbing aerosols from Nimbus 7/TOMS data, J. Geophys. Res., 102, 16911–16922, https://doi.org/10.1029/96JD03680, 1997.
Ingmann, P., Veihelmann, B., Langen, J., Lamarre, D., Stark, H., and Courrèges-Lacoste, G. B.: Requirements for the GMES Atmosphere Service and ESA's implementation concept: Sentinels-4/-5 and -5p, Remote Sens. Environ., 120, 58–69, https://doi.org/10.1016/j.rse.2012.01.023, 2012.
IPCC: Climate Change 2021: The Physical Science Basis. Contribution of Working Group I to the Sixth Assessment Report of the Intergovernmental Panel on Climate Change, edited by: Masson-Delmotte, V., Zhai, P., Pirani, A., Connors, S. L., Péan, C., Berger, S., Caud, N., Chen, Y., Goldfarb, L., Gomis, M. I., Huang, M., Leitzell, K., Lonnoy, E., Matthews, J. B. R., Maycock, T. K., Waterfield, T., Yelekçi, O., Yu, R., and Zhou, B., Cambridge University Press, 2391 pp., https://doi.org/10.1017/9781009157896, 2021.
Kampouri, A., Amiridis, V., Solomos, S., Gialitaki, A., Marinou, E., Spyrou, C., Georgoulias, A. K., Akritidis, D., Papagiannopoulos, N., Mona, L., Scollo, S., Tsichla, M., Tsikoudi, I., Pytharoulis, I., Karacostas, T., and Zanis, P.: Investigation of Volcanic Emissions in the Mediterranean: “The Etna–Antikythera Connection”, Atmosphere, 12, 40, https://doi.org/10.3390/atmos12010040, 2021.
Klett, J. D.: Stable analytical inversion solution for processing lidar returns, Appl. Optics, 20, 211–220, 1981.
Kim, J., Jeong, U., Ahn, M.-H., Kim, J. H., Park, R. J., Lee, H., Song, C. H., Choi, Y.-S., Lee, K.-H., Yoo, J.-M., Jeong, M.-J., Park, S. K., Lee, K.-M., Song, C.-K., Kim, S.-W., Kim, Y. J., Kim, S.-W., Kim, M., Go, S., Liu, X., Chance, K., Chan Miller, C., Al-Saadi, J., Veihelmann, B., Bhartia, P. K., Torres, O., Abad, G. G., Haffner, D. P., Ko, D. H., Lee, S. H., Woo, J.-H., Chong, H., Park, S. S., Nicks, D., Choi, W. J., Moon, K.-J., Cho, A., Yoon, J., Kim, S.-K., Hong, H., Lee, K., Lee, H., Lee, S., Choi, M., Veefkind, P., Levelt, P. F., Edwards, D. P., Kang, M., Eo, M., Bak, J., Baek, K., Kwon, H.-A., Yang, J., Park, J., Han, K. M., Kim, B.-R., Shin, H.-W., Choi, H., Lee, E., Chong, J., Cha, Y., Koo, J.-H., Irie, H., Hayashida, S., Kasai, Y., Kanaya, Y., Liu, C., Lin, J., Crawford, J. H., Carmichael, G. R., Newchurch, M. J., Lefer, B. L., Herman, J. R., Swap, R. J., Lau, A. K. H., Kurosu, T. P., Jaross, G., Ahlers, B., Dobber, M., McElroy, C. T., and Choi, Y.: New Era of Air Quality Monitoring from Space: Geostationary Environment Monitoring Spectrometer (GEMS), B. Am. Meteorol. Soc., 101, E1–E22, https://doi.org/10.1175/BAMS-D-18-0013.1, 2019.
Lelieveld, J., Berresheim, H., Borrmann, S., Crutzen, P. J., Dentener, F. J., Fischer, H., Feichter, J., Flatau, P. J., Heland, J., Holzinger, R., Korrmann, R., Lawrence, M. G., Levin, Z., Markowicz, K. M., Mihalopoulos, N., Minikin, A., Ramanathan, V., De Reus, M., Roelofs, G. J., Scheeren, H. A., Sciare, J., Schlager, H., Schultz, M., Siegmund, P., Steil, B., Stephanou, E. G., Stier, P., Traub, M., Warneke, C., Williams, J., and Ziereis, H.: Global air pollution crossroads over the Mediterranean, Science, 298, 794–799, https://doi.org/10.1126/science.1075457, 2002.
Madonna, F., Amodeo, A., Boselli, A., Cornacchia, C., Cuomo, V., D'Amico, G., Giunta, A., Mona, L., and Pappalardo, G.: CIAO: the CNR-IMAA advanced observatory for atmospheric research, Atmos. Meas. Tech., 4, 1191–1208, https://doi.org/10.5194/amt-4-1191-2011, 2011.
Mallet, M., Dubovik, O., Nabat, P., Dulac, F., Kahn, R., Sciare, J., Paronis, D., and Léon, J. F.: Absorption properties of Mediterranean aerosols obtained from multi-year ground-based remote sensing observations, Atmos. Chem. Phys., 13, 9195–9210, https://doi.org/10.5194/acp-13-9195-2013, 2013.
Mamouri, R.-E., Nisantzi, A., Engelman, R., Bühl, J., Seifert, P., Baars, H., Yin, Z., Hadjimitsis, D., and Ansmann, A.: The ERATOSTHENES CoE in the PollyNET:First observations of the PollyXT-CYP at Limassol, Cyprus, EGU General Assembly 2021, online, 19–30 Apr 2021, EGU21-16279, https://doi.org/10.5194/egusphere-egu21-16279, 2021.
Marinou, E., Amiridis, V., Binietoglou, I., Tsikerdekis, A., Solomos, S., Proestakis, E., Konsta, D., Papagiannopoulos, N., Tsekeri, A., Vlastou, G., Zanis, P., Balis, D., Wandinger, U., and Ansmann, A.: Three-dimensional evolution of Saharan dust transport towards Europe based on a 9-year EARLINET-optimized CALIPSO dataset, Atmos. Chem. Phys., 17, 5893–5919, https://doi.org/10.5194/acp-17-5893-2017, 2017.
Michailidis, K., Koukouli, M.-E., Siomos, N., Balis, D., Tuinder, O., Tilstra, L. G., Mona, L., Pappalardo, G., and Bortoli, D.: First validation of GOME-2/MetOp absorbing aerosol height using EARLINET lidar observations, Atmos. Chem. Phys., 21, 3193–3213, https://doi.org/10.5194/acp-21-3193-2021, 2021.
Mona, L., Amodeo, A., Pandolfi, M., and Pappalardo, G.: Saharan dust intrusions in the Mediterranean area: three years of Raman lidar measurements, J. Geophys. Res.-Atmos., 111, D16203, https://doi.org/10.1029/2005JD006569, 2006.
Mona, L., Liu, Z., Müller, D., Omar, A., Papayannis, A., Pappalardo, G., Sugimoto, N., and Vaughan, M.: Lidar measurements for desert dust characterization: An overview, Adv. Meteorol., 2012, 1–36, https://doi.org/10.1155/2012/356265, 2012.
Nabat, P., Somot, S., Mallet, M., Chiapello, I., Morcrette, J. J., Solmon, F., Szopa, S., Dulac, F., Collins, W., Ghan, S., Horowitz, L. W., Lamarque, J. F., Lee, Y. H., Naik, V., Nagashima, T., Shindell, D., and Skeie, R.: A 4-D climatology (1979–2009) of the monthly tropospheric aerosol optical depth distribution over the Mediterranean region from a comparative evaluation and blending of remote sensing and model products, Atmos. Meas. Tech., 6, 1287–1314, https://doi.org/10.5194/amt-6-1287-2013, 2013.
Nanda, S., de Graaf, M., Sneep, M., de Haan, J. F., Stammes, P., Sanders, A. F. J., Tuinder, O., Veefkind, J. P., and Levelt, P. F.: Error sources in the retrieval of aerosol information over bright surfaces from satellite measurements in the oxygen A band, Atmos. Meas. Tech., 11, 161–175, https://doi.org/10.5194/amt-11-161-2018, 2018.
Nanda, S., de Graaf, M., Veefkind, J. P., Sneep, M., ter Linden, M., Sun, J., and Levelt, P. F.: A first comparison of TROPOMI aerosol layer height (ALH) to CALIOP data, Atmos. Meas. Tech., 13, 3043–3059, https://doi.org/10.5194/amt-13-3043-2020, 2020.
Nelson, D. L., Garay, M. J., Kahn, R. A., and Dunst, B. A.: Stereoscopic height and wind retrievals for aerosol plumes with the MISR INteractive eXplorer (MINX), Remote Sens.-Basel, 5, 4593–4628, https://doi.org/10.3390/rs5094593, 2013.
Nisantzi, A., Mamouri, R. E., Ansmann, A., Schuster, G. L., and Hadjimitsis, D. G.: Middle East versus Saharan dust extinction-to-backscatter ratios, Atmos. Chem. Phys., 15, 7071–7084, https://doi.org/10.5194/acp-15-7071-2015, 2015.
Ortiz-Amezcua, P., Guerrero-Rascado, J. L., Granados-Muñoz, M. J., Benavent-Oltra, J. A., Böckmann, C., Samaras, S., Stachlewska, I. S., Janicka, Ł., Baars, H., Bohlmann, S., and Alados-Arboledas, L.: Microphysical characterization of long-range transported biomass burning particles from North America at three EARLINET stations, Atmos. Chem. Phys., 17, 5931–5946, https://doi.org/10.5194/acp-17-5931-2017, 2017.
Papagiannopoulos, N., Mona, L., Alados-Arboledas, L., Amiridis, V., Baars, H., Binietoglou, I., Bortoli, D., D'Amico, G., Giunta, A., Guerrero-Rascado, J. L., Schwarz, A., Pereira, S., Spinelli, N., Wandinger, U., Wang, X., and Pappalardo, G.: CALIPSO climatological products: evaluation and suggestions from EARLINET, Atmos. Chem. Phys., 16, 2341–2357, https://doi.org/10.5194/acp-16-2341-2016, 2016.
Papanikolaou, C. A., Giannakaki, E., Papayannis, A., Mylonaki, M., and Soupiona, O.: Canadian biomass burning aerosol properties modification during a long-ranged event on August 2018, Sensors, 20, 5442, https://doi.org/10.3390/s20185442, 2020.
Papayannis, A., Amiridis, V., Mona, L., Tsaknakis,G., Balis, D., Bösenberg, J., Chaikovski, A., De Tomasi, F., Grigorov, I., Mattis, I., Mitev, V., Müller, D., Nickovic, S., Pérez, C., Pietruczuk, A., Pisani, L., Ravetta, F., Rizi, V., Sicard, M., Trickl, T., Wiegner, M., Gerding, M., Mamouri, R. E., D'Amico, G., and Pappalardo, G.: Systematic lidar observations of Saharan dust over Europe in the frame of EARLINET (2000–2002), J. Geophys. Res., 113, D10204, https://doi.org/10.1029/2007JD009028, 2008.
Pappalardo, G., Amodeo, A., Apituley, A., Comeron, A., Freudenthaler, V., Linné, H., Ansmann, A., Bösenberg, J., D'Amico, G., Mattis, I., Mona, L., Wandinger, U., Amiridis, V., Alados-Arboledas, L., Nicolae, D., and Wiegner, M.: EARLINET: towards an advanced sustainable European aerosol lidar network, Atmos. Meas. Tech., 7, 2389–2409, https://doi.org/10.5194/amt-7-2389-2014, 2014 (data available at: https://data.earlinet.org/earlinet/login.zul, last access: 2 June 2022).
Perrone, M. R. and Romano, S.: Atmospheric response to the 20 March 2015 solar eclipse along the whole aerosol column by lidar measurements, Atmos. Res., 217, 172–183, https://doi.org/10.1016/j.atmosres.2018.11.004, 2019.
Proestakis, E., Amiridis, V., Marinou, E., Binietoglou, I., Ansmann, A., Wandinger, U., Hofer, J., Yorks, J., Nowottnick, E., Makhmudov, A., Papayannis, A., Pietruczuk, A., Gialitaki, A., Apituley, A., Szkop, A., Muñoz Porcar, C., Bortoli, D., Dionisi, D., Althausen, D., Mamali, D., Balis, D., Nicolae, D., Tetoni, E., Liberti, G. L., Baars, H., Mattis, I., Stachlewska, I. S., Voudouri, K. A., Mona, L., Mylonaki, M., Perrone, M. R., Costa, M. J., Sicard, M., Papagiannopoulos, N., Siomos, N., Burlizzi, P., Pauly, R., Engelmann, R., Abdullaev, S., and Pappalardo, G.: EARLINET evaluation of the CATS Level 2 aerosol backscatter coefficient product, Atmos. Chem. Phys., 19, 11743–11764, https://doi.org/10.5194/acp-19-11743-2019, 2019.
Ramanathan, V. and Carmichael, G.: Global and regional climate changes due to black carbon, Nat. Geosci., 1, 221–227, https://doi.org/10.1038/ngeo156, 2008.
Ramanathan V., Crutzen P. J., Kiehl J. T., and Rosenfeld D.: Aerosols, climate, and the hydrological cycle, Science, 294, 2119, https://doi.org/10.1126/science.1064034, 2001.
Salgueiro, V., Costa, M. J., Guerrero-Rascado, J. L., Couto, F. T., and Bortoli, D.: Characterization of forest fire and Saharan desert dust aerosols over South-western Europe using a multi-wavelength Raman lidar and Sun-photometer, Atmos. Environ., 252, 118346, https://doi.org/10.1016/j.atmosenv.2021.118346, 2021.
Sanders, A. F. J., de Haan, J. F., Sneep, M., Apituley, A., Stammes, P., Vieitez, M. O., Tilstra, L. G., Tuinder, O. N. E., Koning, C. E., and Veefkind, J. P.: Evaluation of the operational Aerosol Layer Height retrieval algorithm for Sentinel-5 Precursor: application to O2 A band observations from GOME-2A, Atmos. Meas. Tech., 8, 4947–4977, https://doi.org/10.5194/amt-8-4947-2015, 2015.
Siomos, N., Balis, D. S., Voudouri, K. A., Giannakaki, E., Filioglou, M., Amiridis, V., Papayannis, A., and Fragkos, K.: Are EARLINET and AERONET climatologies consistent? The case of Thessaloniki, Greece, Atmos. Chem. Phys., 18, 11885–11903, https://doi.org/10.5194/acp-18-11885-2018, 2018.
Soupiona, O., Papayannis, A., Kokkalis, P., Foskinis, R., Sánchez Hernández, G., Ortiz-Amezcua, P., Mylonaki, M., Papanikolaou, C.-A., Papagiannopoulos, N., Samaras, S., Groß, S., Mamouri, R.-E., Alados-Arboledas, L., Amodeo, A., and Psiloglou, B.: EARLINET observations of Saharan dust intrusions over the northern Mediterranean region (2014–2017): properties and impact on radiative forcing, Atmos. Chem. Phys., 20, 15147–15166, https://doi.org/10.5194/acp-20-15147-2020, 2020.
Stein, A. F., Draxler, R. R., Rolph, G. D., Stunder, B. J. B., Cohen, M. D., and Ngan, F.: NOAA's hysplit atmospheric transport and dispersion modeling system, B. Am. Meteorol. Soc., 96, 2059–2077, https://doi.org/10.1175/BAMS-D-14-00110.1, 2015 (data available at: https://www.ready.noaa.gov/HYSPLIT.php, last access: 1 May 2022).
Stein Zweers, D. C.: TROPOMI ATBD of the UV aerosol index, S5P-KNMI-L2-0008-RP, CI-7430-ATBD_UVAI, issue 2.0, 2021-07-05, https://sentinels.copernicus.eu/documents/247904/2476257/Sentinel-5P-TROPOMI-ATBD-UV-Aerosol-Index (last access: 1 May 2022), 2021.
Stohl, A., Aamaas, B., Amann, M., Baker, L. H., Bellouin, N., Berntsen, T. K., Boucher, O., Cherian, R., Collins, W., Daskalakis, N., Dusinska, M., Eckhardt, S., Fuglestvedt, J. S., Harju, M., Heyes, C., Hodnebrog, Ø., Hao, J., Im, U., Kanakidou, M., Klimont, Z., Kupiainen, K., Law, K. S., Lund, M. T., Maas, R., MacIntosh, C. R., Myhre, G., Myriokefalitakis, S., Olivié, D., Quaas, J., Quennehen, B., Raut, J.-C., Rumbold, S. T., Samset, B. H., Schulz, M., Seland, Ø., Shine, K. P., Skeie, R. B., Wang, S., Yttri, K. E., and Zhu, T.: Evaluating the climate and air quality impacts of short-lived pollutants, Atmos. Chem. Phys., 15, 10529–10566, https://doi.org/10.5194/acp-15-10529-2015, 2015.
Torres, O., Bhartia, P. K., Herman, J. R., Ahmad, Z., and Gleason, J.: Derivation of aerosol properties from satellite measurements of backscattered ultraviolet radiation: Theoretical basis, J. Geophys. Res.-Atmos., 103, 17099–17110, https://doi.org/10.1029/98JD00900, 1998.
Torres, O., Tanskanen, A., Veihelmann, B., Ahn, C., Braak, R., Bhartia, P. K., Veefkind, P., and Levelt, P.: Aerosols and surface UV products from Ozone Monitoring Instrument observations: an overview, J. Geophys. Res., 112, D24S47, https://doi.org/10.1029/2007JD008809, 2007.
Torres, O., Bhartia, P. K., Jethva, H., and Ahn, C.: Impact of the ozone monitoring instrument row anomaly on the long-term record of aerosol products, Atmos. Meas. Tech., 11, 2701–2715, https://doi.org/10.5194/amt-11-2701-2018, 2018.
van Donkelaar, A., Martin, R. V., Brauer, M., Kahn, R., Levy, R., Verduzco, C., and Villeneuve, P. J.: Global Estimates of Ambient Fine Particulate Matter Concentrations from Satellite-Based Aerosol Optical Depth: Development and Application, Environ. Health Persp., 118, 847–855, https://doi.org/10.1289/ehp.0901623, 2010.
Veefkind, J. P., Aben, I., McMullan, K., Förster, H., de Vries, J., Otter, G., Claas, J., Eskes, H. J., de Haan, J. F., Kleipool, Q., van Weele, M., Hasekamp, O., Hoogeveen, R., Landgraf, J., Snel, R., Tol, P., Ingmann, P., Voors, R., Kruizinga, B., Vink, R., Visser, H., and Levelt, P. F.: TROPOMI on the ESASentinel-5 Precursor: A GMES mission for global observations of the atmospheric composition for climate, air quality and ozone layer applications, Remote Sens. Environ., 120, 70–83, https://doi.org/10.1016/j.rse.2011.09.027, 2012.
Winker, D. M., Vaughan, M. A., Omar, A., Hu, Y., Powell, K. A., Liu, Z., Hunt, W. H., and Young, S. A.: Overview of the CALIPSO mission and CALIOP data processing algorithms, J. Atmos. Ocean. Tech., 26, 2310–2323, https://doi.org/10.1175/2009JTECHA1281.1, 2009.
Xu, X., Wang, J., Wang, Y., Zeng, J., Torres, O., Reid, J. S., Miller, S. D., Martins, J. V., and Remer, L. A.: Detecting layer height of smoke aerosols over vegetated land and water surfaces via oxygen absorption bands: hourly results from EPIC/DSCOVR in deep space, Atmos. Meas. Tech., 12, 3269–3288, https://doi.org/10.5194/amt-12-3269-2019, 2019.
Zoogman, P., Liu, X., Suleiman, R. M., Pennington, W. F., Flittner, D. E., Al-Saadi, J. A., Hilton, B. B., Nicks, D. K., Newchurch, M. J., Carr, J. L., Janz, S. J., Andraschko, M. R., Arola, A., Baker, B. D., Canova, B. P., Chan Miller, C., Cohen, R. C., Davis, J. E., Dussault, M. E., Edwards, D. P., Fishman, J., Ghulam, A., González Abad, G., Grutter, M., Herman, J. R., Houck, J., Jacob, D. J., Joiner, J., Kerridge, B. J., Kim, J., Krotkov, N. A., Lamsal, L., Li, C., Lindfors, A., Martin, R. V., McElroy, C. T., McLinden, C., Natraj, V., Neil, D. O., Nowlan, C. R., O'Sullivan, E. J., Palmer, P. I., Pierce, R. B., Pippin, M. R., Saiz-Lopez, A., Spurr, R. J. D., Szykman, J. J., Torres, O., Veefkind, J. P., Veihelmann, B., Wang, H., Wang, J., and Chance, K.: Tropospheric emissions: Monitoring of pollution (TEMPO), J. Quant. Spectrosc. Ra., 186, 17–39, https://doi.org/10.1016/j.jqsrt.2016.05.008, 2017.